Embed Size (px)
Citation preview

O’Hara & Mealings: APDQ 1
Developing the Auditory Processing Domains Questionnaire (APDQ):
A differential screening tool for auditory processing disorder
Brian O’Haraa and Kiri Mealingsb
aDevelopmental Behavioural Pediatrician, Honolulu, Hawaii
bNational Acoustic Laboratories, Sydney, Australia
Keywords: auditory processing disorder; screening questionnaire; attention
deficit; language deficit
Acronyms
AAA: American Academy of Audiology
ADHD: Attention deficit hyperactivity disorder
AP: Auditory processing scale
APD: Auditory processing disorder
APDQ: Auditory processing domains questionnaire
APR: Auditory processing scale raw score
ASHA: American Speech-Language-Hearing Association
ATT: Attention scale
CANS: Central auditory nervous system
CHAPPS: Children's Auditory Processing Performance Scale
CHAPS: Children’s Auditory Performance Scale
CHILD: Children’s Home Inventory for Listening Difficulties
O’Hara & Mealings: APDQ 2
DDT: Dichotic digits test
DSM-IV: Diagnostic and Statistical Manual of Mental Disorders, Fourth Edition
EAA: Educational Audiology Association
ECLiPS: Evaluation of Children’s Listening and Processing Skills
Lang: Language scale
LIFE: Listening Inventory for Education
LD: Learning disability
MANOVA: Multivariate analysis of variance
MAPA: Multiple auditory processing assessment
NC: Normal controls
SAB: Scale of Auditory Behaviors
SIFTER: Screening Instrument for Targeting Educational Risk
TLI: The Listening Inventory
Corresponding Author:
Dr Kiri Mealings
National Acoustic Laboratories
Level 5 Australian Hearing Hub
16 University Avenue
Macquarie University, NSW, 2109, Australia
Email: [email protected]

O’Hara & Mealings: APDQ 3

O’Hara & Mealings: APDQ 4
Developing the Auditory Processing Domains Questionnaire (APDQ):
A differential screening tool for auditory processing disorder
Objective: The aim of this study was to develop a screening questionnaire for auditory
processing disorder.
Design: Fifty-two questions were created to enable parent/teacher proxies to rate
students’ listening skills in terms of auditory processing, attention, and language factors.
Study Sample: Parents rated their child’s frequency of competent performance (regularly,
often, sometimes, or rarely) on 52 questions. Scores were calculated for three scales:
auditory processing, attention, and language. Data was collected from 198 normal
controls, 20 students with auditory processing disorder, 40 students with attention deficit
hyperactivity disorder, and 10 students with a learning disability. Subjects were split into
a younger group (7-10 years) and an older group (11-17 years).
Results: Factor analysis revealed substantial internal validity. Analysis of external
validity using a regression model revealed significant differences between normal and
clinical groups for all scales (p < 0.001), and also significantly separated the three clinical
groups. A group differential analysis of scale score results clearly demonstrated inter-
group differences at 89% (on average) sensitivity and specificity levels.
Conclusions: The APDQ appears to be an effective screening questionnaire for APD with
scale score patterns likely to be helpful in making appropriate clinical referrals.
Keywords: auditory processing disorder; screening questionnaire; attention
deficit; language deficit

O’Hara & Mealings: APDQ 5
Introduction
Listening skills are critically important for young students as over 60% of
elementary classroom time is spent ‘learning by listening’ (Hunsaker, 1990). Listening
difficulties are not uncommon and relate to both audiological factors (e.g. hearing
acuity and auditory processing) and non-audiological factors (e.g. attention control and
cognitive-language abilities). Auditory processing disorder (APD) refers to a variety of
dysfunctions whereby a person’s processing of auditory information is impaired in the
central auditory nervous system, despite them having normal hearing thresholds
(American Speech-Language-Hearing Association (ASHA), 2005). APD is thought to
affect around 7% of children (Bamiou, Musiek, & Luxon, 2001), which is comparable
to the estimated 7% incidence of attention deficit hyperactivity disorders (ADHD;
Willcutt, 2012) and the estimated 7% incidence of children with a specific language
impairment (Tomblin et al., 1997).
Screening questionnaires have the advantage of providing behavioural contexts
for auditory deficits. Indeed, the American Academy of Audiology (AAA) APD
Consensus Conference recommended ‘the development and validation of screening
questionnaires for school age children based on accepted psychometric principles with
clearly defined pass/refer criteria’ (Jerger & Musiek, 2000). Bellis and Ferre (1999)
have emphasized multidisciplinary approaches to identify the most important aspects of
a student’s listening problems since they may or may not be in the auditory domain. We
decided that a screening questionnaire which juxtaposes a child’s auditory, attention,
and language performances would highlight behavioural contrasts and best clarify the
true nature of his or her listening difficulty.
With the exception of the Children’s Auditory Performance Scale (CHAPS;
Smoski, Brunt & Tannahill, 1992, also known as the Children's Auditory Processing
Performance Scale (CHAPPS)), APD questionnaires published before the year 2000

O’Hara & Mealings: APDQ 6
were largely designed to rate the educational, social, and communication skills of
children with impaired hearing. When used for APD screening, the Fisher Auditory
Problem Checklist (Fisher, 1976), the Screening Instrument for Targeting Educational
Risk (SIFTER; Anderson, 1989), the Children’s Home Inventory for Listening
Difficulties (CHILD; Anderson and Smaldino, 2000), the Listening Inventory for
Education (LIFE; Anderson and Smaldino, 1999), and CHAPS have all been effective
in differentiating normal listeners from those with listening difficulties. These
questionnaires were favoured by Educational Audiology Association members, with the
Fisher and CHAPS used by 63% and 51% of these audiologists respectively (Emanuel,
2002). Generally, they were not useful in screening for different types of listening
difficulties or correlating questionnaire results with auditory processing test findings
(e.g. CHAPS and SIFTER as reported by Wilson, Jackson, Pender, Rose, Wilson, Heine
& Khan, 2011). However, there were exceptions. In one study, Fisher’s check list scores
did have weak chi square correlations with the dichotic Staggered Spondaic Word test
(Katz, 1998) (χ2(1) = 22.5, p <.05) (Strange, 2009). A more recent non-parametric
psychometric study which involved 96 children aged 11-12-years-old reported some
significant inter-group correlations between CHAPPS subscales and auditory processing
tests (Iliadou & Bamiou, 2012). The clinical APD group in this study performed
significantly lower than normal controls on all six CHAPPS subscales (p < .0001), and
below the clinical non-APD group on the noise, multiple inputs, and attention subscales
(p < .0001)..
Since 2000, several questionnaires have been developed with excellent
psychometric characteristics and the potential to detect at-risk APD candidates from
both normal and clinical groups (although they still have had mixed success in
demonstrating significant correlations with auditory processing tests (Barry, Moore,

O’Hara & Mealings: APDQ 7
Dillon & Tomlin, 2015)). These questionnaires include the Scale of Auditory Behaviors
(SAB; Schow, Seikel, Brockett & Whitaker, 2007), The Listening Inventory (TLI;
Geffner & Ross-Swain, 2009), and the Evaluation of Children’s Listening and
Processing Skills (ECLiPS; Barry & Moore, 2013). The SAB was featured in a
Portuguese study involving 51 children aged 10-13-years-old and showed strong
correlations with Multiple Auditory Processing Assessment (MAPA) Speech In Noise
test (Schow et al., 2007; r = 0.47 p < 0.001), Duration Pattern Test (Musiek et al., 1990;
r = 0.5 p < 0.001, and Gaps-In-Noise test Musiek et al., 2005; r = 0.47 p < 0.001)
(Nunes, Pereira & Carvalho, 2013). These correlations are surprising in that the SAB
only has 12 items, five of which are not auditory in nature.
A break-through adult study of 58 clinical subjects (with difficulty listening and
normal audiograms) and 30 normal controls aged 18 to 60 years old was recently
reported in the JAAA (Bamiou, Iliadou, Zanchetta & Spyridakou, 2015). Three self-
report auditory questionnaires (The Modified Amsterdam Inventory for Auditory
Disability (Meijer, Wit, TenVergert, Albers, Muller Kobold, 2003), the Hyperacusis
Questionnaire, and the Speech, Spatial and Qualities of Hearing Scale (Gatehouse and
Noble, 2004)) had consistent and sometimes strong correlations with most of the
auditory processing tests (Gaps-In-Noise Test (Musiek et al., 2005) p < .001, Dichotic
Digits Test (Musiek, 1983) p < .01, Duration Pattern Test (Musiek et al., 1990) p < .01,
and Frequency Pattern Test (Musiek & Pinheiro, 1987) p < .05). The clinical subjects
with negative AP test results had intermediate questionnaire scores between the normal
controls and the clinical APD group, suggesting a continuum for APD as others have
proposed (Phillips, Comeau & Andrus, 2010). However, none of the post-2000
screening questionnaires were designed for differential screening for ADHD or

O’Hara & Mealings: APDQ 8
language disorders since no clinical groups with these conditions were included in their
normative study populations.
Hence, the goal of our study was to develop a parent/teacher proxy rating
questionnaire called the Auditory Processing Domains Questionnaire (APDQ) to screen
children aged 7 to 17 years old who may have APD due to their listening difficulties.
This paper describes the conceptualization of the APDQ, normative and clinical data
collection, results, analysis, and conclusions.
Method
Questionnaire Development
Questions
Fifty-two behavioural items were selected for the APDQ following a cross-disciplinary
literature search (ASHA, 1996; Chermak, Musiek & Weihing, 2017; Barkley, 2006;
Conners, 1996; Levine, 1990; Bellis and Ferre, 1999). Thirty-one of these questions
related to auditory processing, of which 18 referred to auditory decoding, three to
speech prosody , and five to auditory integration(relating to the auditory processing
profiles of case study children described in the model of Bellis and Ferre, 1999). Only
auditory localization and qualities of sound were missing from the eight APD
perceptual functions listed by ASHA (2005).
Attention control items included six out of nine behaviours required for the
diagnosis of ‘inattentive’ ADHD from the Diagnostic and Statistical Manual of Mental
Disorders, Fourth Edition (DSM-IV, 1994). Language items included expressive and
receptive communication skills as well as such verbal academic skills as reading and
writing.

O’Hara & Mealings: APDQ 9
Originally, the readability of the questionnaire was rated at a tenth grade reading
level (Atcherson, Richburg, Zriack & George, 2013). The items were then revised to
give a fourth to fifth grade, i.e. ‘fairly easy’ reading level (according to the formula of
Kincaid, Aagard, O’Hara & Cottrell, 1981). The questionnaire takes 10 minutes or less
to complete.
Scoring
Parents or teachers are asked to rate a child’s ‘frequency of observed performance’ on
52 items. Scoring is as follows:
4 points if behaviour is performed ‘most times’ (> ¾ of the time)
3 points if behaviour is performed ‘often’ (½-¾ of the time)
1 point if behaviour is performed ‘sometimes’ (¼-½ of the time)
0 points if behaviour is performed ‘rarely’ (< ¼ of the time)
The break in the hierarchical continuity of scoring between three points and one point
represents a gap from competency to incompetency.
Three scales were constructed: Auditory Processing (AP scale) with 31 items;
Attention Control (ATT scale) with 10 items (one overlapping with the AP scale); and
Language (Lang scale) with 11 items (one overlapping with the AP scale). Two
additional questions were not included on a scale but are used for listening in quiet
versus noise comparisons. A fourth scale, Targeted Auditory Processing (TAP) was
formed using 18 auditory decoding items. It has uncomplicated scoring in contrast to
the AP scale which has complicated scoring due to points being subtracted for major
differences between listening in quiet versus noise and auditory versus non-auditory
attention-fatigue. TAP mean scores and standard deviations are within three points of
similar AP scores across all clinical and the normal groups. TAP scale scores are

O’Hara & Mealings: APDQ 10
available as a substitute for the AP scale for research purposes or should manual scoring
of this questionnaire be necessary due to unavailability of the Excel scoring program.
Scale Score Calculations
Scale scores are reported as a ‘percent of perfect score’ so they are comparable across
all conditions. They are calculated as: (sum of item scores in scale) ÷ (4 x the number of
items in scale) x 100. Scale scores are positively distributed, hence higher scores reflect
greater competency. Note that if a question is left unanswered on any scale, the
denominator is adjusted accordingly to reflect the number of questions answered. They
have some face value since scores above 75% suggest skill competency > ¾ of the time,
while scores below 25% suggest skill competency < ¼ the time.
Language Scale. The Lang scale has 44 total possible points and is calculated as:
Total points from 11 questions ÷ (4 x 11) x 100.
For example, if a Lang raw score is 31 then that scale score is 70% (i.e. 31 ÷ 44 x 100 =
70%).
Attention Scale. The ATT scale has 40 possible points and is calculated as:
Total points from 10 questions ÷ (4 x 10) x 100.
However, Question 1 and Question 42 are only included in the scoring if rated
‘sometimes’ or ‘rarely’. This is because these questions do not represent core ADHD
symptoms and are not supported by factor analysis (although item 42 is associated with
hyperactive ADHD in the literature).
Auditory Processing Scale. The AP scale has 124 possible points and is calculated as:
(Total points from 31 questions + minus values from 7 item-pair comparisons
(see below)) ÷ (4 x 31).

O’Hara & Mealings: APDQ 11
Question 49 is only included in the scoring if rated ‘sometimes’ or ‘rarely’
because it does not represent a core APD symptoms and was not supported by factor
analysis.
The AP scale has seven item pairs: five item pairs where listening in quiet is
contrasted with listening in noise, and two item pairs that contrast sustained attention
fatigue on non-listening versus listening tasks. Points are subtracted from the initial raw
AP scale (APR) if a child is exceptionally challenged by ‘listening in noise’ or
‘listening fatigue’. Further details of AP scale scoring are discussed in Appendix A.
Targeted Auditory Processing Scale. The TAP scale has 72 possible points and is
calculated as:
Total points from 18 questions ÷ (4 x 18) x 100.
An Excel spreadsheet is available to calculate all scores. The spreadsheet also generates
a report which graphically summarizes the scale scores and differential risk factors for
APD, ADHD, and language disorders (see Appendix B).
Data Collection
Participants
Research approval was obtained from the Kaiser Hawaii Center Health Research
Institutional Review Board in 2007. Two thousand medical records were reviewed to
select 1,700 candidates for normal control (NC) and clinical groups. Two hundred and
fifty parent informants responded to the mail outs (a 14.7% return rate) and these
comprised the NC, ADHD, and learning disability (LD) groups. An additional 20
subjects were recruited from audiologist colleagues for the APD group. Group
selections were further informed by a medical and education checklist which

O’Hara & Mealings: APDQ 12
accompanied each questionnaire (see Appendix C).
Normal Controls. The NC group included parents of 198 students (101 females and 97
males) without medical record evidence of ADHD or parent evidence of APD, LD, or
special education services. There were 104 students in the younger group (7- to 10-year-
olds) and 94 in the older group (11- to 17-year-olds). The racial distribution was 25%
Caucasian, 33% mixed race, 24% Asian, and 18% Hawaiian/Pacific Islander/other. One
participant did not answer this question. This distribution is representative of Hawaii but
very different from United States census data (US census, 2009). Thirty-five percent of
parents (N = 70) had high school or some college education while 65% (N = 128) were
college graduates or above. This 2:1 high school/college ratio differs from the national
1:2 ratio (US Census, 2009) and the 1:1 ratio present in our ADHD and APD clinical
groups. The effect of gender, race, and parent’s education level on the scores were
assessed using a regression model in the External Discriminate Reliability subsection of
the Results.
Attention Deficit Hyperactivity Disorder Group. The parents of 40 students with ADHD
medical diagnoses (DSM-IV, 1994; American Psychiatric Association) by a psychiatrist
or pediatrician comprised the ADHD group. They were predominantly of the inattentive
subtype. This group numbered 15 female and 25 male students. There were 19 students
in the younger group and 21 in the older group. The racial distribution was 13%
Caucasian, 25% mixed race, 13% Asian, and 35% Hawaiian/Pacific Islander/other. Six
participants did not answer this question. Forty-three percent of parents (N = 17) had
high school or some college education, 43% (N = 17) were college graduates or above,
and 14% did not indicate their education level (N = 6).

O’Hara & Mealings: APDQ 13
Auditory Processing Disorder Group. The parents of 20 students with auditory
processing test evidence of APD recruited from collaborating audiologists comprised
the APD group. These audiologists followed the diagnostic guidelines of the 2000 APD
consensus statement (Jerger and Musiek, 2000). Thus, the test battery used for an APD
diagnosis included tests of dichotic listening, monaural low-redundancy speech, gap
detection, speech in noise, and frequency patterns. Subjects were diagnosed with APD if
they performed at least two standard deviations below the mean on two or more tests of
the above recommended test battery. The APD group had 10 females and nine males
(plus one without gender identified). There were 10 students in the younger group and
10 in the older group. The racial distribution was 5% Caucasian, 20% mixed race, 20%
Asian, and 5% Hawaiian/Pacific Islander/other. Ten participants did not answer this
question. Twenty-five percent of parents (N = 5) had high school or some college
education, 25% (N = 5) were college graduates or above, and 50% did not indicate their
education level (N = 10).
Learning Disability Group. The parents of 10 students attending special education
comprised the LD group. The medical-educational history check list indicated that two
children had dyslexia, three had a language learning disability, and five had learning
disabilities not further specified. None had ADHD or APD checked on the list. There
were four females and six males. Six students were in the younger group and four were
in the older group. The racial distribution was 20% Caucasian, 30% mixed race, 30%
Asian, and 20% Hawaiian/Pacific Islander/other. Seventy percent of parents (N = 7) had
high school or some college education and 30% (N = 3) were college graduates or
above.

O’Hara & Mealings: APDQ 14
Retest Reliability Check
Twenty-six parents from the NC group re-rated their questionnaires after a three-week
interval so retest reliability could be checked.
Data Analysis
An Excel spreadsheet program was developed to calculate the scale scores and report
findings including scale score rank percentiles and patterns indicative of APD, ADHD,
and LD risks. Data were analyzed statistically using SPSS 15 (SPSS 1982) and later
SPSS 23 (SPSS 2015), Statistica version 10, and R version 3.3.1. NC scale scores were
not normally distributed and not appropriate for standard scoring. As is typical for
behavioural rating scales, ceiling effects created negative skews and a positive kurtosis
(Pallant 2005).
Results
Questionnaire Psychometrics
Internal Reliability. Cronbach’s alpha measures how closely related a set of scale items
are as a group. Cronbach’s alpha was 0.96 for the AP scale indicating excellent
consistency between the items on that scale. Cronbach’s alpha was 0.88 for the ATT
and Lang scales, indicating good consistency between the items on each of these scales.
External Reliability. Twenty-six parents from the NC group re-rated their questionnaires
after a three week interval. Test-retest Pearson R correlation was strong (R = 0.88, p ≤
0.00001) indicating good test-retest reliability.
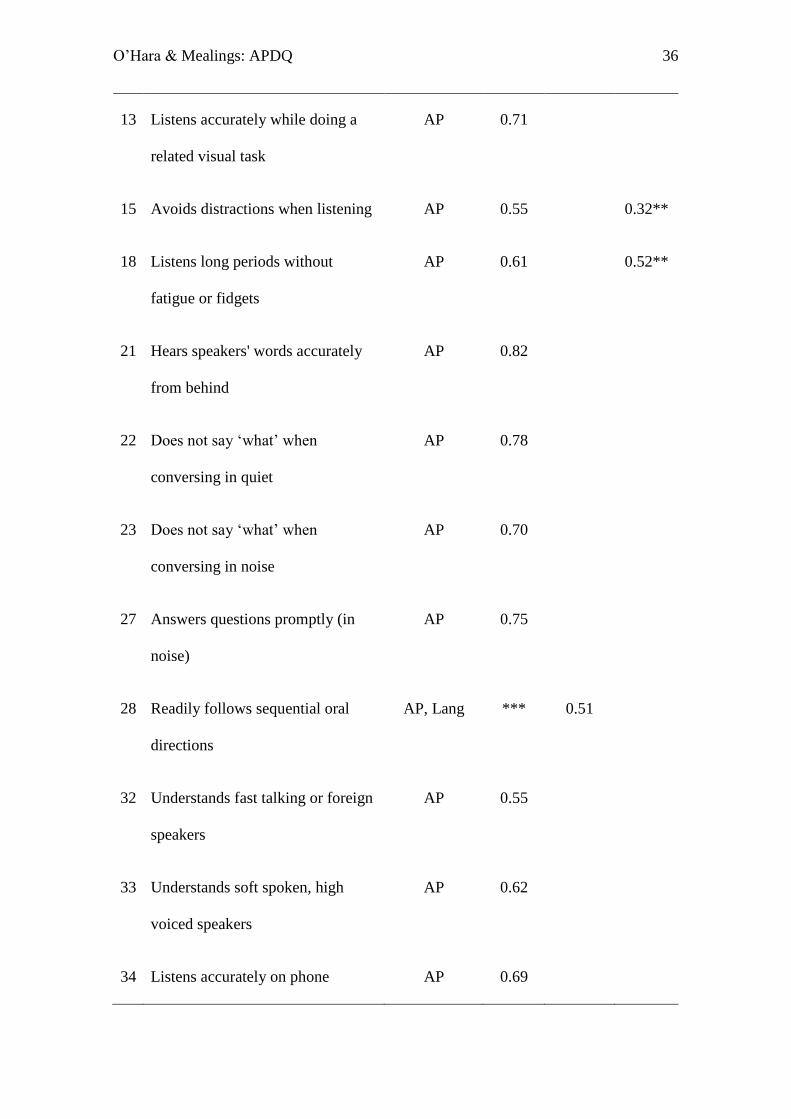
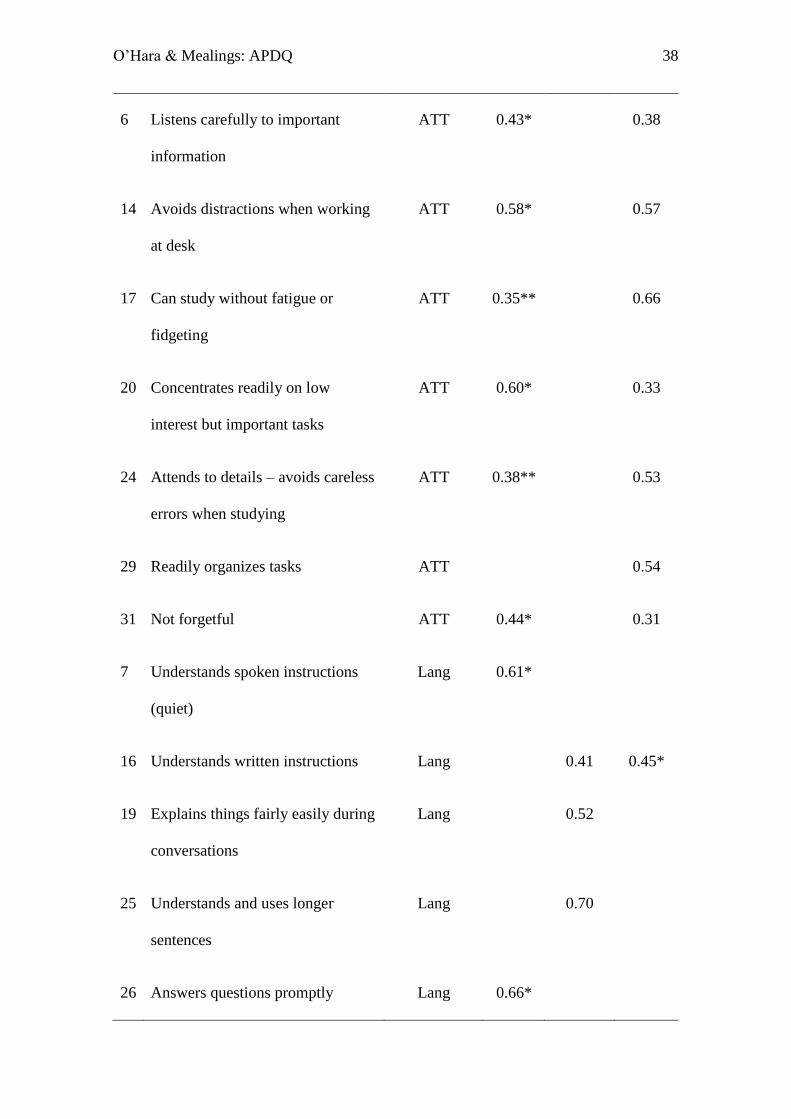
Internal Validity. A principal component factor analysis (with oblimin rotation and
Kaiser normalization) was conducted using the data from the NC group to assess the
internal validity of the questionnaire. Only forty-nine of the 52 questions were examined

O’Hara & Mealings: APDQ 15
as Q1, Q42, and Q49 could not be included in the factor analyses since by design these
questions were only recorded if scored ‘sometimes’ or ‘rarely’. The Kaiser-Meyer-Olkin
measure of sampling adequacy was 0.915, which is well above the commonly
recommended value of 0.6. Bartlett’s test of sphericity was significant (χ2 (1176) = 6757.54,
p < .001). Initial eigenvalues of 19.3, 2.7, and 2.6 indicated that the first three factors
explained 39.5%, 5.5%, and 5.4% of the variance respectively. Subsequent eigenvalues
each explained less than 4% of the variance and showed levelling-off on the scree plot.
Therefore, a three-factor solution representing the three scoring scales was used for the
analysis. These three factors explained 50.3% of the variance. Factor items matched AP,
ATT and Lang scales 33 out of 49 times when taking into account the highest factor
loadings above 0.3. (Note, the score is out of 49 as Q3 and Q28 are assigned to two
scales and Q2 and Q8 are not assigned to a scale). Factor items matched AP, ATT and
Lang scales 40 out of 49 times when matching any factor loadings above .3. The factor
loadings for the questions (in abbreviated form) are shown in Table 1.
[Insert Table 1 here]
External Discriminate Validity. Table 2 shows the mean score and standard deviation
for each group on each scale (using the original scale allocations for the questions).
[Insert Table 2 here]
A regression model was fitted to the data using R version 3.3.1 rms package
version 4.5-0 to assess what factors affected children’s scores on each scale, and
compare scores across the normal and clinical groups. The AP, ATT, and Lang scores
were transformed using the multcomp package version 1.4-5 (which uses the method
described in Hothorn, Bretz, and Westfall (2008)) so that the assumptions of linear
regression would be better satisfied. The transformation is shown by equation (1)
y = log{[(x/100) +0.01]/[1 - (x/100) + 0.01]} (1)

O’Hara & Mealings: APDQ 16
where x is the original score, y is the transformed score, and ‘log’ is the natural
logarithm. Transformations of this type are suggested by Warton and Hui (2011).
For each of the three scores, a regression model was fitted with the transformed
score as the response variable and group (four categories), age (continuous), gender
(two categories), race (four categories), and rater’s education level (two categories) as
the explanatory variables. Missing data was handled using multiple imputation with the
Amelia package version 1.7.4. This involved generating 50 completed data sets, fitting
the models on each completed data set, and combining the results across the 50 data
sets.
Table 3 gives the p-value for the test of the null hypothesis of no effect of each
explanatory variable on each score. The df column shows the number of degrees of
freedom for the tests. Since group and race each have four categories, they were each
represented by three binary variables, and the test is of the null hypothesis that the
coefficients of the three binary variables are all zero. Normal/clinical group differences
as well as age group differences for the younger (7- to 10-year-olds) and older (11- to
17-year-olds) groups were significant for each scale. Gender and race did not have
statistically significant effects on any scale scores. Parent educational levels had a
significant effect on only the Lang scale (though note that the APD group was
underrepresented in this analysis as only 50% (i.e. N =10) of the parents indicated their
education level).
[Insert Table 3 here]
Differences in scores between pairs of normal/clinical groups for each scale
when the values of the other explanatory variables were held constant are shown in
Table 4. The predicted difference in score for Group 2 (g2) relative to Group 1 (g1) on
the original 0 to 100 scale is shown in each row. A negative value indicates that the

O’Hara & Mealings: APDQ 17
predicted score for g2 is lower than the predicted score for g1. The estimates are based
on the g1 score being the median score for that group (the predicted difference depends
on this score because of the non-linear transformation). The table also shows a 95%
confidence interval for the difference and a p-value for the test of the null hypothesis
that the true difference is zero. The p-values and confidence intervals have been
adjusted for the six comparisons within each score (but not for comparisons across
scores).
Significant differences were found between the normal and clinical groups for
all scales. Poorer performance on the ATT scale differentiated the ADHD and APD
groups. Poorer performance on the Lang and AP scales differentiated the LD and APD
groups. Poorer performance on the Lang and ATT scales differentiated the LD and
ADHD groups.
[Insert Table 4 here]
Age Group Scale Score Percentile Ranks
Rank percentile scoring was chosen since the data did not fit a standard distribution
curve. Percentile ranks for the younger and older age groups are shown in Table 5.
Moderate ‘at risk’ levels were set at < 1 standard deviation from the mean,
which, due to the distribution not being normal, corresponds to a student being below
the 15th percentile rank for AP and Lang scales and 20th rank percentile for the ATT
scale. These levels clearly separated the normal controls from the clinical groups.
However, there was much overlap between the clinical groups. Seventy percent of the
APD subjects were at risk for ADHD on the ATT scale while 80% of the ADHD group
was at risk for APD on the AP scale. All LD children were at risk for APD and ADHD
on the AP and ATT scales. However, different deficit patterns, including the difference

O’Hara & Mealings: APDQ 18
between ATT and AP scores, clearly separated the three groups (see next section).
[Insert Table 5 here]
Differentiating Between Groups
The individual scores on each scale for the subjects in the normal and clinical groups
were plotted against each other for younger and older groups. Examination of this data
and receiver operator curves enabled the scale score cut-offs to be determined for each
group on each scale. The AP, ATT, and Lang scale scores along with scale score
differences (ATT minus AP) clearly differentiated the APD, ADHD, and LD clinical
groups. Cut-off values for both sensitivity and specificity were mostly above the 80%
level. High ‘at risk’ cut-off levels for APD, ADHD, and LD are summarized below and
plotted graphically in Figure 1, along with the moderate risk cut-offs described in the
previous section. Scale scores are expressed as a percent (of the maximum or perfect
scale score). Percentiles refer to percentile rank scale scores and are italicized.
Sensitivity/specificity levels for each clinical group relative to the normal controls are
noted by % / %.
APD Group
o Younger Group
AP scale ≤ 45 (~5th percentile) (90%/90%)
Lang > 45 (3rd percentile)
ATT-AP ≥ 0
o Older Group
AP scale ≤ 55 (~5th percentile) (80%/91%)
Lang > 44 (3rd percentile)
ATT-AP ≥ 0
ADHD Group

O’Hara & Mealings: APDQ 19
o Younger Group
ATT scale ≤ 37 (~10th percentile) (89%/90%)
Lang > 45 (3rd percentile)
ATT-AP ≤ -10
o Older Group
ATT scale ≤ 50 (~5th percentile) (86%/91%)
Lang > 44 (3rd percentile)
ATT-AP ≤ -10
LD Group
o Younger Group
Lang Scale ≤ 45 (3rd percentile) (100%/99%)
AP scale ≤ 54 (10th percentile)
ATT scale ≤ 42 (10th percentile)
o Older Group
Lang Scale ≤ 44 (3rd percentile) (75%/99%)
AP scale ≤ 62 (10th percentile)
ATT scale ≤ 53 (10th percentile)
We also assigned a criteria for a child who may have an unclear profile or mixed
APD/ADHD due to equally poor scores on both the AP and ATT scales.
Unclear or Mixed APD/ADHD
o Younger Group
AP scale ≤ 45 (~5th percentile)
ATT scale ≤ 37 (~10th percentile)
Lang > 45 (3rd percentile)

O’Hara & Mealings: APDQ 20
ATT-AP between -10 and 0
o Older Group
AP scale ≤ 55 (~5th percentile)
ATT scale ≤ 50 (~5th percentile)
Lang > 44 (3rd percentile)
ATT-AP between -10 and 0
[Insert Figure 1 here]
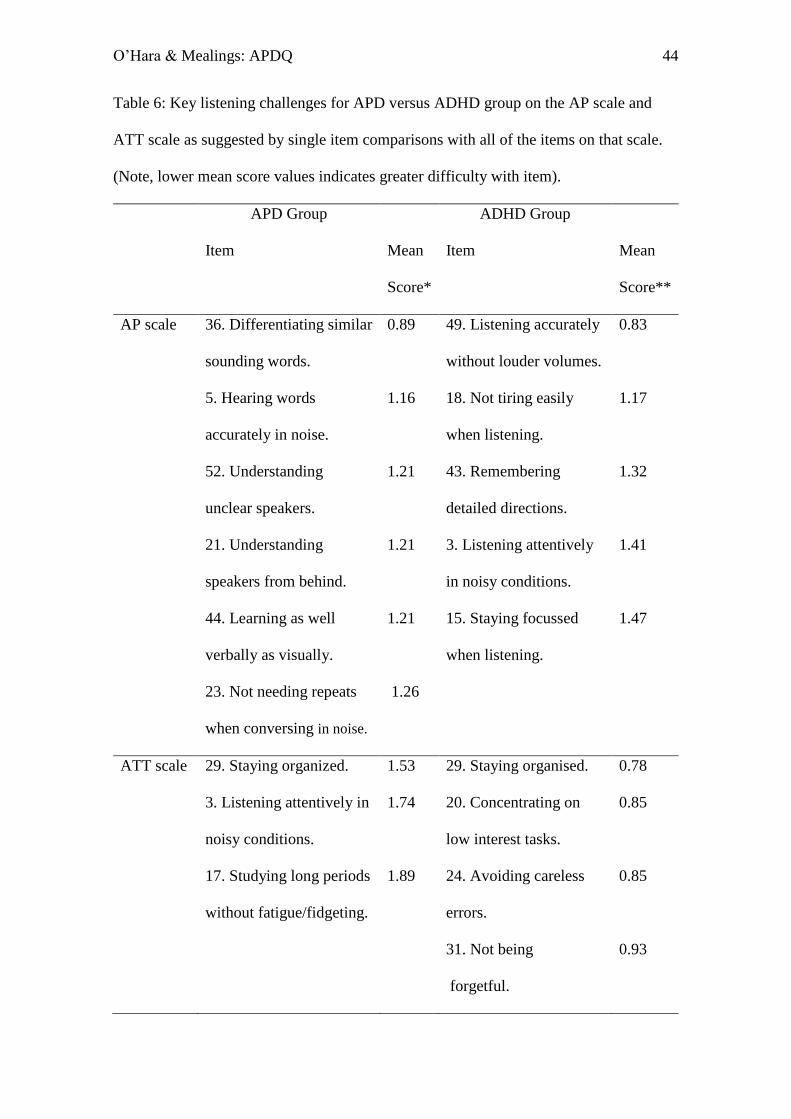
Key APD Listening Skills
AP scale items of greatest difficulty (i.e. lowest mean score) for students with
APD are listed in Table 6. These APD core symptoms all relate to difficulty listening in
noise, multi-task listening, and listening to unclear speakers. They did not relate to
difficulty decoding and encoding words phonetically, using prosodic language cues,
following oral instructions in quiet, or being more attentive in non-listening versus
listening situations.
Table 6 also reflects the contrasting types of difficulties students with APD and
ADHD have on the AP and ATT scales. On the AP scale subjects with ADHD had
maximum difficulty with auditory attention, auditory memory, and noise distractions,
which are not core APD symptoms. This could be interpreted as a qualitative difference
versus the APD group on this scale. On the ATT scale APD students had less difficulty
with all the core ADHD issues of sustained attention, working memory, motivation and
impulse control and most difficulty with organization, attentive listening, and listening
fatigue. This could be interpreted as a qualitative difference from the ADHD group on
this scale.
Such core symptom differences supports the conclusions of Chermak, Tucker,
O’Hara & Mealings: APDQ 21
and Seikel (2002) and Riccio, Hynd, Cohen, Hall, and Molt (1994) that despite
behavioural overlaps and frequent co-morbidity, APD and ADHD are clinically distinct
entities which require different management strategies.
[Insert Table 6 here]
Discussion
The purpose of this questionnaire was to differentiate children at risk primarily for
APD, from those more likely to have ADHD or a language disorder. The psychometric
characteristics of the APDQ largely met the criteria of McCauley and Swisher as
outlined by Friberg and McNamara (2010) for judging the diagnostic accuracy of
language and hearing tests, namely: normative sample size > 100; clearly defined
demographics; Pearson r test-retest reliability > 0.9 (0.88); and most pass-fail cut off
values > 80% sensitivity and specificity. The AP, ATT, and Lang scale scores along
with the ATT minus AP values correctly classified over 80% of subjects in the four NC,
APD, ADHD, and LD diagnostic categories. Unmet criteria included not having
nationally representative demographics and inter-rater reliability or concurrent validity
measures.
APDQ data has the potential to serve a bell-weather function in the controversy
between bottom up and top down APD constructs since both approaches support their
viewpoint by having significant behavioural correlations with cognitive/language versus
central auditory test factors (or both). The APD Position Statement and Practice
Guidance by the British Society of Audiology (BSA, 2011) favors a more top down,
cognitive-sensory construct of APD due to their research evidence of cognitive-working
memory factors impacting performance on central AP tests. Furthermore, they propose
a new diagnostic category of ‘children with listening difficulties’ for those listeners who
pass (rather than fail) AP test batteries. Such children with listening difficulties are then

O’Hara & Mealings: APDQ 22
to be afforded such non-specific APD help as listening strategy information, preferential
classroom seating, remote FM microphone technology, as well as more function
specific testing and careful monitoring (Dillon, Cameron, Glyde, Wilson & Tomlin,
2012). It also is possible that many of these children with listening difficulties could
meet diagnostic criteria and treatments for ADHD or LD. APDQ screening data can
suggest whether assessments should be carried out for these alternative disorders.
The more traditional APD model outlined by consensus reports from The
American Academy of Audiology (AAA, 2010) and The American Speech-Language-
Hearing Association (ASHA, 2005) favors a bottom-up central auditory nervous system
(CANS) approach where a battery of audiological tests useful in detecting CANS
lesions are the designated diagnostic instruments along with multidisciplinary clinical
input. Chermak (2017) and others have pointed out that auditory test correlations with
cognitive and language measures increase significantly when the APD group has lower
cognitive capacities. This was the case in Barry’s report on the ECLiPS questionnaire
where the 12 subjects with positive AP test results were significantly more cognitively
limited than the 23 subjects with negative AP test results (Barry et al., 2015). Our own
data showed that LD subjects receiving special education who were below the third
percentile on the Lang scale had the lowest mean scale scores on both the AP and ATT
scales. The Lang scale played a very useful function throughout in recognizing children
with listening difficulties who appeared to have more than straight forward auditory
processing deficits with very poor performance on all three scales.
As mentioned in the introduction, pre-2000 APD screening questionnaires were
not able to correlate results with auditory processing test findings (with one exception
where two groups of 11- and 12-year-old students with listening difficulties who passed
or failed APD tests were well differentiated by the CHAPPSquestionnaire (Iliadou and

O’Hara & Mealings: APDQ 23
Bamiou, 2012)). Post-2000 screening questionnaires have reported psychometric
evidence of reliability and validity but have had mixed success in demonstrating
significant correlations with auditory processing tests (Barry et al., 2015). Given the
promising results of this study, we are hoping that future studies with the APDQ will
demonstrate significant correlations between the questionnaire scale scores and auditory
processing test results.
Study Limitations
This study was able to use the resources of the Hawaii Kaiser Medical Center
and collaborating audiologists to recruit research subjects where medical records could
guide selection of normal controls versus clinical groups. This method, however, had its
limitations. Although the children in the APD and ADHD groups had a formal clinical
diagnosis of their disorder (following the guidelines of the APD consensus statement
(Jerger & Musiek, 2000) or the DSM-IV (1994)), detailed information about their
specific test results and other clinical data were often lacking. Furthermore, the LD
group, which had the smallest number of subjects, only had parent data regarding
special education services and/or learning disability diagnoses. Therefore, it would be
beneficial to include a larger, more specific language disorder group in future research
and correlate the APDQ scores with the scores children receive on specific clinical
APD, ADHD, or language tests to help us better understand what tests particular APDQ
questions are sensitive to. While the number of subjects recruited with APD and in
particular LD was not sufficient to draw definitive conclusions, there were some
promising trends as reported. Therefore, it would be worthwhile to use and monitor the
results of the APDQ in a broad range of clinical settings and foremost, do a prospective
study with a large number of children with listening difficulties including those with
detailed documentation of their auditory, attention, and language status.
O’Hara & Mealings: APDQ 24
In reviewing the data collected from the current experiment and feedback we
have received on the questions, we have now revised the APDQ to a 50-item
questionnaire. This revision includes the removal of redundant questions, minor
rewording of questions to make them clearer, and some scoring and scale assignment
adjustments given the results of the factor analysis and differential analysis. Plans are
currently underway to conduct a study that addresses the above limitations and provide
normative and clinical data for this new version.
Conclusions
The APDQ demonstrates psychometric evidence of the internal and external reliability
and validity required for it to be an effective screening tool for auditory processing
difficulties in children aged 7 to 17 years old. Children with listening difficulties are
readily identified when they are rated below the 15th to 20th percentile on different
scales. Our data supports the ability of the questionnaire to be sensitive and specific to
individuals with APD and ADHD. At-risk factors for APD include an AP scale score
less than the 15th percentile and an ATT-AP difference ≥ 0. At-risk factors for ADHD
include an ATT scale less than the 20th percentile and ATT-AP ≤ -10. Typically,
children with APD and ADHD will be rated above the third percentile on the Lang
scale. A very low language rating, in addition to low scores on the AP and ATT scales
is most likely related to cognitive-language factors. Future research is needed to
evaluate the sensitivity and specificity of the questionnaire for individuals with
language issues.
The APDQ is readily scored by an Excel spreadsheet program and will be
published as a slightly revised 50-item questionnaire by the Educational Audiology
Association in the United States in 2018. This 50-item version is now available online

O’Hara & Mealings: APDQ 25
(apdq.nal.gov.au). An online report with the child’s results and suggested further steps
is available for the parent upon completion of the questionnaire. A 32-item version for
4.5- to 7-year-olds is also under development.
Acknowledgements
We would like to thank the Kaiser Hawaii Center for Health Research for enabling the
collection of the subject data, Tim Holmes for developing the Excel scoring sheet, and
Mark Seeto for statistical advice. We also thank Harvey Dillon and Sharon Cameron for
their helpful assistance.
Professional meeting and online report details
O’Hara, B. (2003, July). Concepts and Goals Regarding the APDQ: Novel differential
screening for APD. Oral presentation at the Educational Audiology Association
Conference, St. Louis, Missouri.
O’Hara, B. (2007, April). The Listening Questionnaire: Effective screening for APD?
Poster presentation at the American Academy of Audiology Conference,
Denver, Colorado.
O’Hara, B. (2007, July). The Listening Questionnaire. Poster presentation at the
Educational Audiology Association Conference, Phoenix, Arizona.
O’Hara, B. (2009, November). The Listening Questionnaire Update. Oral presentation
at the American Speech-Language-Hearing Association Conference, Boston,
Massachusetts.
O’Hara, B. (2012, March). The APDQ: Novel differential screening for APD. Poster
presentation at the American Academy of Audiology Conference, Boston,
Massachusetts.

O’Hara & Mealings: APDQ 26
O’Hara, B.A. (2016). Overview of the Auditory Processing Domains Questionnaire
http://hearinghealthmatters.org/pathways/2016/auditory-processing-
questionnaire-differential-screening-apd-overview.
Disclosure statement. The authors report no conflicts of interest.
References
American Academy of Audiology (AAA). (2010). Diagnosis, treatment and management
of children and adults with central auditory processing disorder. pp. 1-53.
http://www.audiology.org/resources/documentlibrary/
American Speech-Language-Hearing Association. (2005). (Central) auditory processing
disorders [Technical report]. Rockville, MD: J.Ferre/working group. Available at
http://www.asha.org/members/deskref-journals/deskref/default.
Anderson, K.L., and Smaldino, J.J. (1999). Listening Inventories For Education: A
classroom measurement tool. Hear. J. 52(10), pp.74-76.
Anderson, K.L., and Smaldino, J.J. (2000). Children’s Home Inventory of Listening
Difficulties (CHILD). Tampa, FL: Educational Audiology Association.
Anderson, K.L., 1989. Screening identification for targeting educational risk. Tampa, FL:
Educational Audiology Association.
Atcherson, S.R., Richburg, C.M., Zriack, R.I. and George, C.M. (2013). Readability of
questionnaires assessing listening difficulties associated with (central) auditory
processing disorders. Lang Speech Hearing Serv Sch, 44(1), pp. 48-60.

O’Hara & Mealings: APDQ 27
Bamiou, D.E., Iliadou, V.V., Zanchetta, S. and Spyridakou, C. (2015). What can we learn
about auditory processing from adult hearing questionnaires? J Am Acad Audiol,
26(10), pp. 824-837. doi:10.3766/jaaa.15009.
Bamiou, D.E., Musiek, F.E., and Luxon, L.M. (2001). Aetiology and clinical
presentations of auditory processing disorders – a review. Arch Dis Child, 85, pp.
361-365.
Barkley, R. (2006). Attention Deficit Hyperactivity Disorder: A Handbook for Diagnosis
and Treatment. New York: The Guilford Press.
Barry, J., Moore, D., Dillon, H. and Tomlin, D. (2015). Use of questionnaire-based
measures in the assessment of listening difficulties in school-aged children. Ear
Hear, 36(6), pp. 1-14. doi:10.1097/AUD.0000000000000180.
Barry, J.G. and Moore, D.R. (2013). Evaluation of Children’s Listening and Processing
Skills (E.C.L.I.P.S.). Medical Research Council: United Kingdom.
https://www.nottingham.ac.uk/mrcihr/documents/eclips-faw03.pdf
Bellis, T.J. and Ferre, J.M. (1999). Multidimensional Approach to the Differential
Diagnosis of Central Auditory Processing Disorders in Children. J Am Acad
Audiol, 10, pp. 319-328.
Chermak, G.D., Musiek, F.E. and Weihing, J. (2017). Beyond controversies: The science
behind central auditory processing disorder. The Hearing Review.
http://www.hearingreview.com/2017/05/beyond-controversies-science-behind-
central-auditory-processing-disorder/
Chermak, G.D., Tucker, E. and Seikel, J.A. (2002). Behavioral characteristics of auditory
processing disorders and attention deficit hyperactivity disorder predominantly
inattentive type. J Am Acad Audiol. 13, pp. 332-338.

O’Hara & Mealings: APDQ 28
Conners C.K. (1996). Conners Rating Scales-Revised (CRS-R). Pearson Assessment: The
Psychological Corporation.
Diagnostic and Statistical Manual of Mental Disorders, Fourth Edition (DSM-IV).
(1994). American Psychiatric Association.
Dillon, H., Cameron, S., Glyde, H., Wilson, W. and Tomlin, D. (2012). An opinion on the
assessment of people who may have an auditory processing disorder. J Am Acad
Audiol, 23(2), pp. 97-105. DOI: 10.3766/jaaa.23.2.4 23:97–105
Emanuel, D. (2002). The auditory processing battery: Survey of common practices. J Am
Acad Audiol, 13, pp. 93-117.
Fisher, L.I. (1976). Fisher’s auditory problems checklist. Bemidji: Life Products
Friberg, J.C. and McNamara, T.L. (2010). Evaluating the reliability and validity of
(central) auditory processing tests: A preliminary investigation. J Educ Audiol, 16,
pp. 4-17.
Gatehouse, S. and Noble, W. (2004). The Speech, Spatial and Qualities of Hearing Scale
(SSQ). Int J Audiol. 43(2), pp. 85-99.
Geffner, D. and Ross-Swain, D. (2006). The Listening Inventory. United States: Academic
Therapy Publications.
Hothorn, T., Bretz, F., and Westfall, P. (2008). Simultaneous inference in general
parametric models. Biometrical Journal, 50(3), pp. 346-363.
Hunsaker, R. (1990). Understanding and Developing the Skills of Oral Communication:
Speaking and Listening. Englewood Colorado: Morton Press.
Iliadou, V. and Bamiou, D.E. (2012). Psychometric evaluation of children with auditory
processing disorder (APD): Comparison with normal-hearing and clinical non-
APD groups. J Speech Lang Hear Res, 55, pp. 791-799.

O’Hara & Mealings: APDQ 29
Jerger, J. and Musiek, F. (2000). Report of the consensus conference on the diagnosis of
auditory processing disorders in school-aged children. J Am Acad Audiol, 11, pp.
467-474.
Katz, J. (1998). The SSW test manual. Vancouver, WA: Precision Acoustics.
Kincaid, J.P., Aagard, J.A., O'Hara, J.W, and Cottrell, L.K. (1981). Computer Readability
Editing System. IEEE Transactions on Professional Communications, 24(1), pp.
38–42. Tests available at http://www.readabilityformulas.com/flesch-grade-level-
readability-formula.php
Levine, M.D. (1990). Keeping a Head in School. Educators Publishing Service, Inc:
Cambridge, MA.
Meijer, A.G., Wit, H.P., TenVergert, E.M., Albers, F.W., and Muller Kobold J.E. (2003).
Reliability and validity of the (modified) Amsterdam inventory for auditory
disability and handicap. Int J Audiol, 42(4), pp. 220-226.
Musiek, F.E. (1983). Assessment of central auditory dysfunction: the dichotic digit test
revisited. Ear Hear, 4(2), pp. 79-83.
Musiek, F.E., Baran, J.A., and Pinheiro, M.L. (1990) Duration pattern recognition in
normal subjects and patients with cerebral and cochlear lesions. Audiology, 29(61),
304-313.
Musiek, F.E. and Pinheiro, M.L. (1987). Frequency patterns in cochlear, brainstem, and
cerebral lesions. Audiology, 26(2), pp. 79-88.
Musiek, F.E., Shinn, J.B., Jirsa, R., Bamiou, D.E., Baran, J.A., and Zaida, E. (2005). GIN
(Gaps-In-Noise) test performance in subjects with confirmed central auditory
nervous system involvement. Ear Hear, 26(6), pp. 608-618.

O’Hara & Mealings: APDQ 30
Nunes, C.L., Pereira, L.D. and Carvalho, G.S.D. (2013). Scale of Auditory Behaviors and
auditory behavior tests for auditory processing assessment in Portuguese children.
CoDAS, 25(3), pp. 209-215.
Pallant, J. (2005). SPSS Survival Guide: A Step by Step Guide to Data Analysis Using
SPSS for Windows. 3rd Edition. Open University Press: New York.
Phillips, D.P., Comeau, M. and Andrus, J.N. (2010). Auditory temporal gap detection in
children with and without auditory processing disorder. J Am Acad Audiol, 21(6),
pp. 404-408.
R Core Team (2016). R: A language and environment for statistical computing (version
3.3.1). http://www.r-project.org.
Riccio, C.A., Hynd, G.W., Cohen, M.J., Hall, J. and Molt, L. (1994). Comorbidity of
central auditory processing disorder and attention-deficit hyperactivity disorder. J
Am Acad Child Adolesc Psychiatry, 33, pp. 849–857.
Schow, R.L., Seikel, A., Brockett, J.E., and Whitaker, M.M. (2007). Multiple auditory
processing assessment. St. Louis: Auditec.
Smoski, W.J., Brunt, M.A., and Tannahill, J.C. (1992). Listening characteristics of
children with central auditory processing disorders. Lang Speech Hear Serv Sch,
23, pp. 145-152.
Strange, A.K., Zalewski, T.R. and Waibel-Duncan, M.K.W. (2009). Exploring the
usefulness of Fisher’s auditory problems checklist as a screening tool in
relationship to the Buffalo model diagnostic central auditory processing test
battery. J Educ Aud, 15, pp. 44-52.
The British Society of Audiology. (2011). An overview of current management of auditory
processing disorder (APD). Retrieved March 31, 2011, from
http://www.thebsa.org.uk/

O’Hara & Mealings: APDQ 31
Tomblin, J. B., Records, N. L., Buckwalter, P., Zhang, X., Smith, E., and O’Brien, M.
(1997). Prevalence of Specific Language Impairment in Kindergarten Children. J
Speech Lang Hear Res, 40(6), pp. 1245-1260. doi: 10.1044/jslhr.4006.1245.
U.S. Census Bureau (2009). Research Report: Center for Economic Studies and Research
Data Centers. U.S. Government Printing Office: Washington, DC.
Warton, D.I. and Hui, F.K.C. (2011). The arcsine is asinine: The analysis of proportions in
ecology. Ecology, 92(1), pp. 3-10.
Willcutt E.G. (2012). The prevalence of DSM-IV attention-deficit/hyperactivity disorder:
a meta-analytic review. Neurotherapeutics, 9, pp. 490-499.
Wilson, W.J., Jackson, A., Pender, A., Rose, C., Wilson, J., Heine, C. and Khan, A.
(2011). The CHAPS, SIFTER, and TAPS–R as predictors of (C)AP skills and
(C)APD. J Speech Lang Hear Res, 54(1), pp. 278-291.
O’Hara & Mealings: APDQ 32
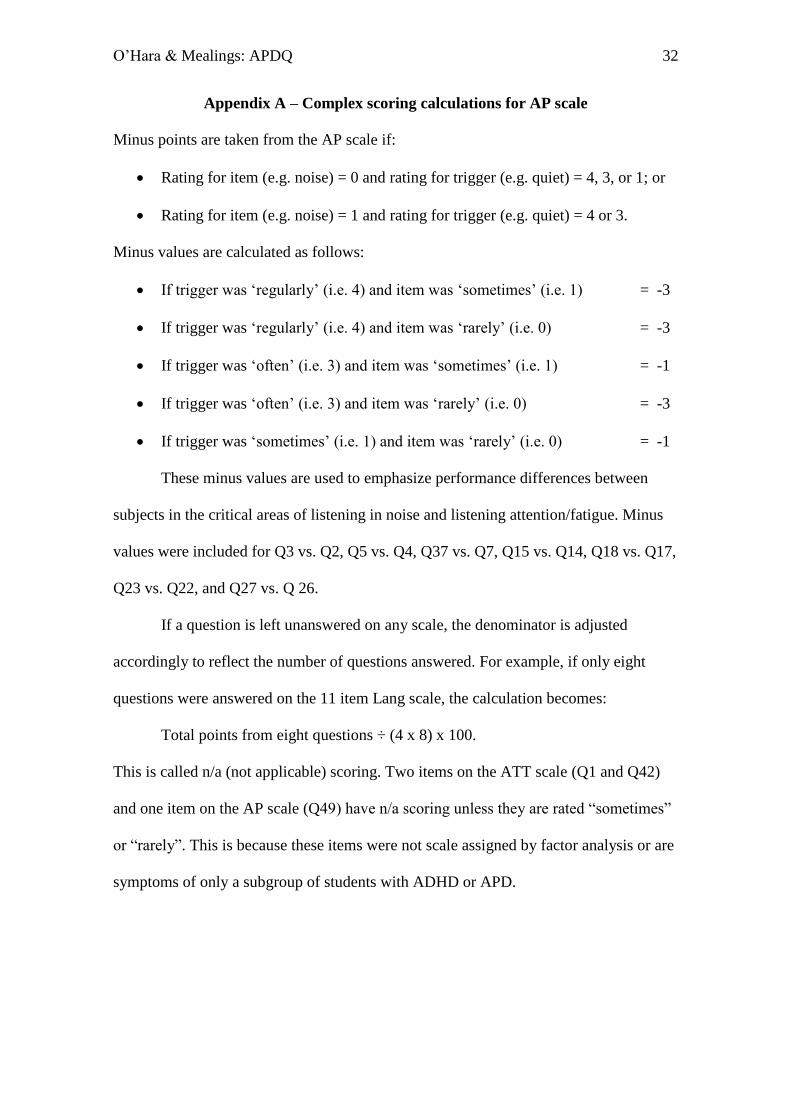
Appendix A – Complex scoring calculations for AP scale
Minus points are taken from the AP scale if:
Rating for item (e.g. noise) = 0 and rating for trigger (e.g. quiet) = 4, 3, or 1; or
Rating for item (e.g. noise) = 1 and rating for trigger (e.g. quiet) = 4 or 3.
Minus values are calculated as follows:
If trigger was ‘regularly’ (i.e. 4) and item was ‘sometimes’ (i.e. 1) = -3
If trigger was ‘regularly’ (i.e. 4) and item was ‘rarely’ (i.e. 0) = -3
If trigger was ‘often’ (i.e. 3) and item was ‘sometimes’ (i.e. 1) = -1
If trigger was ‘often’ (i.e. 3) and item was ‘rarely’ (i.e. 0) = -3
If trigger was ‘sometimes’ (i.e. 1) and item was ‘rarely’ (i.e. 0) = -1
These minus values are used to emphasize performance differences between
subjects in the critical areas of listening in noise and listening attention/fatigue. Minus
values were included for Q3 vs. Q2, Q5 vs. Q4, Q37 vs. Q7, Q15 vs. Q14, Q18 vs. Q17,
Q23 vs. Q22, and Q27 vs. Q 26.
If a question is left unanswered on any scale, the denominator is adjusted
accordingly to reflect the number of questions answered. For example, if only eight
questions were answered on the 11 item Lang scale, the calculation becomes:
Total points from eight questions ÷ (4 x 8) x 100.
This is called n/a (not applicable) scoring. Two items on the ATT scale (Q1 and Q42)
and one item on the AP scale (Q49) have n/a scoring unless they are rated “sometimes”
or “rarely”. This is because these items were not scale assigned by factor analysis or are
symptoms of only a subgroup of students with ADHD or APD.

O’Hara & Mealings: APDQ 33
Appendix B – Sample of Excel report form

O’Hara & Mealings: APDQ 34
Appendix C – Demographic and medical checklist for parents
PERSONAL INFORMATION Student’s Name_______________________
Case Number_____________
1. Today’s Date________ 2. Student’s Age in years____ months____ 3. Sex ___
4. Grade___
5. Person completing questionnaire: a. father___ b. mother ___ c. teacher____ d. other ____
6. Student’s Ethnicity (can check more than one but circle main racial identity if possible)
a. White ___ d. Asian (including Philippine Islanders ___
b. Black/African American __ e. Hawaiian or other Pacific Islander___
c. Native American/Eskimo___ f. Hispanic/Latino___ g. Other ____ 7. Father’s years of school completed __ 8. Mother’s years of school completed ___
9. Please √ your concern level about student’s listening skills: (a) none ___
(b) mild__(c) moderate___ (d) high____
10. Please √ where any of the following conditions or services have occurred for student:
a.____ Special Education m.____ NONE OF THESE
b.____ Learning Disability
c.____ Dyslexia (or Language Learning Disability____ )
d.____ History of Speech-Language delay or therapy
e.____ Permanent Hearing Loss (aided___ unaided___ mild ___ mod___ severe __
one sided___ )
f.____ Learning English as a 2nd Language after age 5
g.____ Attention Deficit Disorder/ADHD (taking medication__ no meds.__)
h.____ Frequent middle ear infections____ middle ear fluid____ surgery____
i.____ Jaundice Problem as newborn (mild__ mod.__ severe__)
j.____ Auditory Processing Disorder (C)APD)
k.____ Autism/Asperger Syndrome (PDD)
l.____ Developmental Delay (MR)

O’Hara & Mealings: APDQ 35
Tables
Table 1: Factor analysis loadings with oblimin rotation and Kaiser normalization.
Values are shown only for loadings greater than 0.30.
Question (Abbreviated) Original
Scale
Allocation
Factor Analysis Results
AP Lang ATT
3 Listens attentively in noisy group
or classroom
AP, ATT 0.84 ***
4 Hears your words accurately when
attentive (quiet)
AP 0.50*
5 Hears your words accurately when
attentive (noise)
AP 0.86
9 Understands speakers in echo
noise
AP 0.68
10 Listens accurately to competing
speakers
AP 0.78
11 Listens accurately while doing
something else
AP 0.62
12 Listens accurately without visual
cues
AP 0.87
O’Hara & Mealings: APDQ 36
13 Listens accurately while doing a
related visual task
AP 0.71
15 Avoids distractions when listening AP 0.55 0.32**
18 Listens long periods without
fatigue or fidgets
AP 0.61 0.52**
21 Hears speakers' words accurately
from behind
AP 0.82
22 Does not say ‘what’ when
conversing in quiet
AP 0.78
23 Does not say ‘what’ when
conversing in noise
AP 0.70
27 Answers questions promptly (in
noise)
AP 0.75
28 Readily follows sequential oral
directions
AP, Lang *** 0.51
32 Understands fast talking or foreign
speakers
AP 0.55
33 Understands soft spoken, high
voiced speakers
AP 0.62
34 Listens accurately on phone AP 0.69

O’Hara & Mealings: APDQ 37
35 Hears speakers words accurately
when 8 ft. away
AP 0.49
36 Discriminates accurately between
similar sounding words
AP 0.60
37 Understands instructions ok when
attentive (noise)
AP 0.84
39 Can spell correctly with phonics AP -0.30 0.90*
40 Can read new words phonetically AP -0.31 0.83* 0.32*
43 Remembers spoken directions. AP 0.62
44 Can learn as well through auditory
as through visual channel
AP 0.40 0.33**
45 Readily follows musical pitch and
rhythm patterns
AP 0.61*
46 Varies speaking voice expressively AP 0.64*
47 Notes speakers’ keyword
emphases and other voice cues
AP 0.67*
51 Does not need ‘extra' noise
controls at school and home
AP 0.38
52 Does not need speakers to talk
more distinctly
AP 0.63* -0.31*
O’Hara & Mealings: APDQ 38
6 Listens carefully to important
information
ATT 0.43* 0.38
14 Avoids distractions when working
at desk
ATT 0.58* 0.57
17 Can study without fatigue or
fidgeting
ATT 0.35** 0.66
20 Concentrates readily on low
interest but important tasks
ATT 0.60* 0.33
24 Attends to details – avoids careless
errors when studying
ATT 0.38** 0.53
29 Readily organizes tasks ATT 0.54
31 Not forgetful ATT 0.44* 0.31
7 Understands spoken instructions
(quiet)
Lang 0.61*
16 Understands written instructions Lang 0.41 0.45*
19 Explains things fairly easily during
conversations
Lang 0.52
25 Understands and uses longer
sentences
Lang 0.70
26 Answers questions promptly Lang 0.66*

O’Hara & Mealings: APDQ 39
(quiet)
30 Understands slang expressions Lang 0.51
38 Uses new words correctly Lang 0.71
41 Reads stories at an ok rate (for age) Lang 0.89
48 Understands speakers without
needing simpler words
Lang 0.87
50 Speaks fluently, without many
pauses or ‘ahs’
Lang 0.60 -
0.33**
2 Pays attention to speakers in quiet
classrooms
Off Scale
Comparisons
0.56
8 Understands spoken instruction
(noise)
Off Scale
Comparisons
0.89
Note: * indicates the scale a factor is assigned to instead of the original scale.
** indicates the scale a factor is assigned to in addition to the original scale.
*** indicates the scale a factor was originally assigned to but was not assigned
to by the factor analysis.
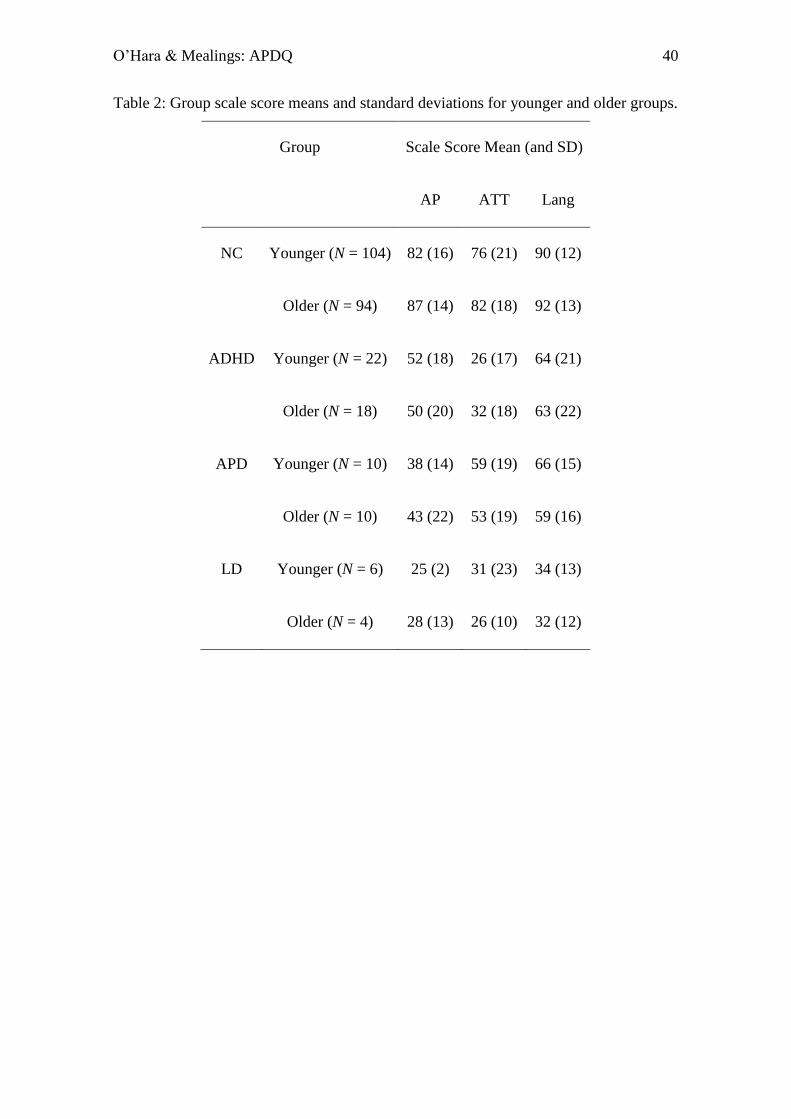
O’Hara & Mealings: APDQ 40
Table 2: Group scale score means and standard deviations for younger and older groups.
Group Scale Score Mean (and SD)
AP ATT Lang
NC Younger (N = 104) 82 (16) 76 (21) 90 (12)
Older (N = 94) 87 (14) 82 (18) 92 (13)
ADHD Younger (N = 22) 52 (18) 26 (17) 64 (21)
Older (N = 18) 50 (20) 32 (18) 63 (22)
APD Younger (N = 10) 38 (14) 59 (19) 66 (15)
Older (N = 10) 43 (22) 53 (19) 59 (16)
LD Younger (N = 6) 25 (2) 31 (23) 34 (13)
Older (N = 4) 28 (13) 26 (10) 32 (12)

O’Hara & Mealings: APDQ 41
Table 3: Regression model p-values assessing the effect of each explanatory variable on
each scoring scale.
Variable p-value
df AP ATT Lang
Group 3 < 0.001* < 0.001* < 0.001*
Age 1 0.007* 0.004* 0.01*
Gender 1 0.71 0.25 0.95
Race 3 0.18 0.21 0.39
Rater Education Level 1 0.13 0.05 0.002*
Note: * indicates significance at the p < 0.05 level.
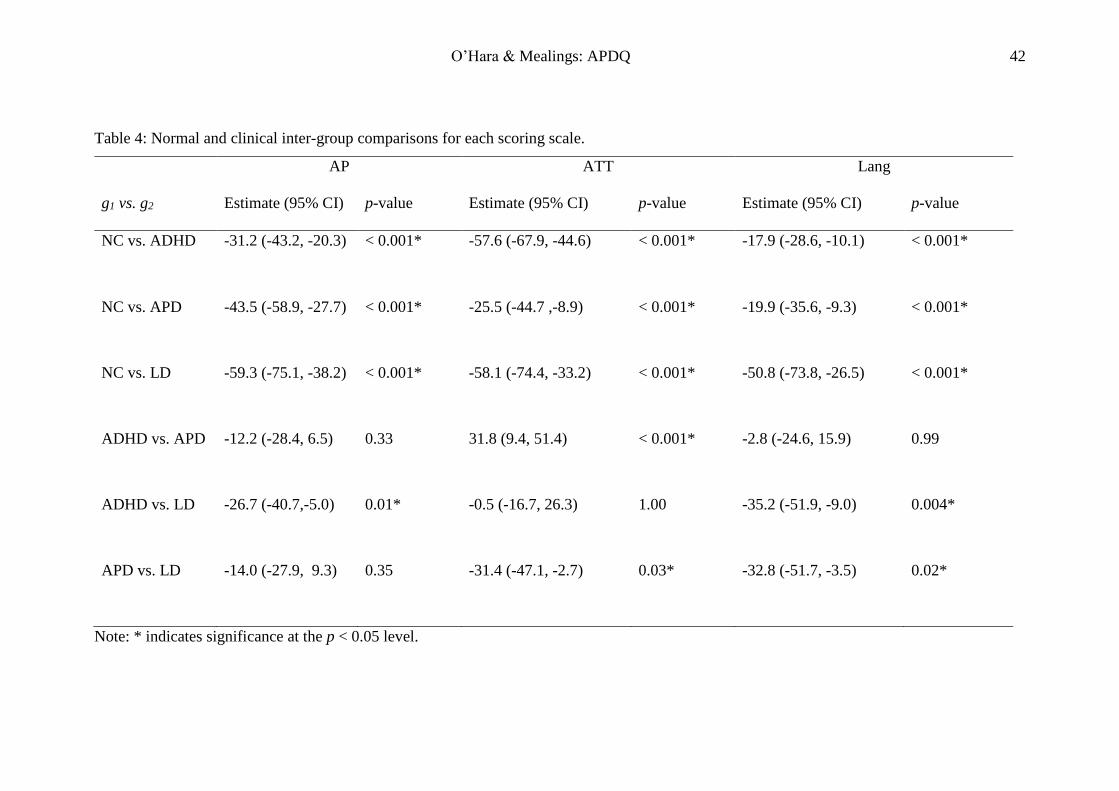
O’Hara & Mealings: APDQ 42
Table 4: Normal and clinical inter-group comparisons for each scoring scale.
AP ATT Lang
g1 vs. g2 Estimate (95% CI) p-value Estimate (95% CI) p-value Estimate (95% CI) p-value
NC vs. ADHD -31.2 (-43.2, -20.3) < 0.001* -57.6 (-67.9, -44.6) < 0.001* -17.9 (-28.6, -10.1) < 0.001*
NC vs. APD -43.5 (-58.9, -27.7) < 0.001* -25.5 (-44.7 ,-8.9) < 0.001* -19.9 (-35.6, -9.3) < 0.001*
NC vs. LD -59.3 (-75.1, -38.2) < 0.001* -58.1 (-74.4, -33.2) < 0.001* -50.8 (-73.8, -26.5) < 0.001*
ADHD vs. APD -12.2 (-28.4, 6.5) 0.33 31.8 (9.4, 51.4) < 0.001* -2.8 (-24.6, 15.9) 0.99
ADHD vs. LD -26.7 (-40.7,-5.0) 0.01* -0.5 (-16.7, 26.3) 1.00 -35.2 (-51.9, -9.0) 0.004*
APD vs. LD -14.0 (-27.9, 9.3) 0.35 -31.4 (-47.1, -2.7) 0.03* -32.8 (-51.7, -3.5) 0.02*
Note: * indicates significance at the p < 0.05 level.
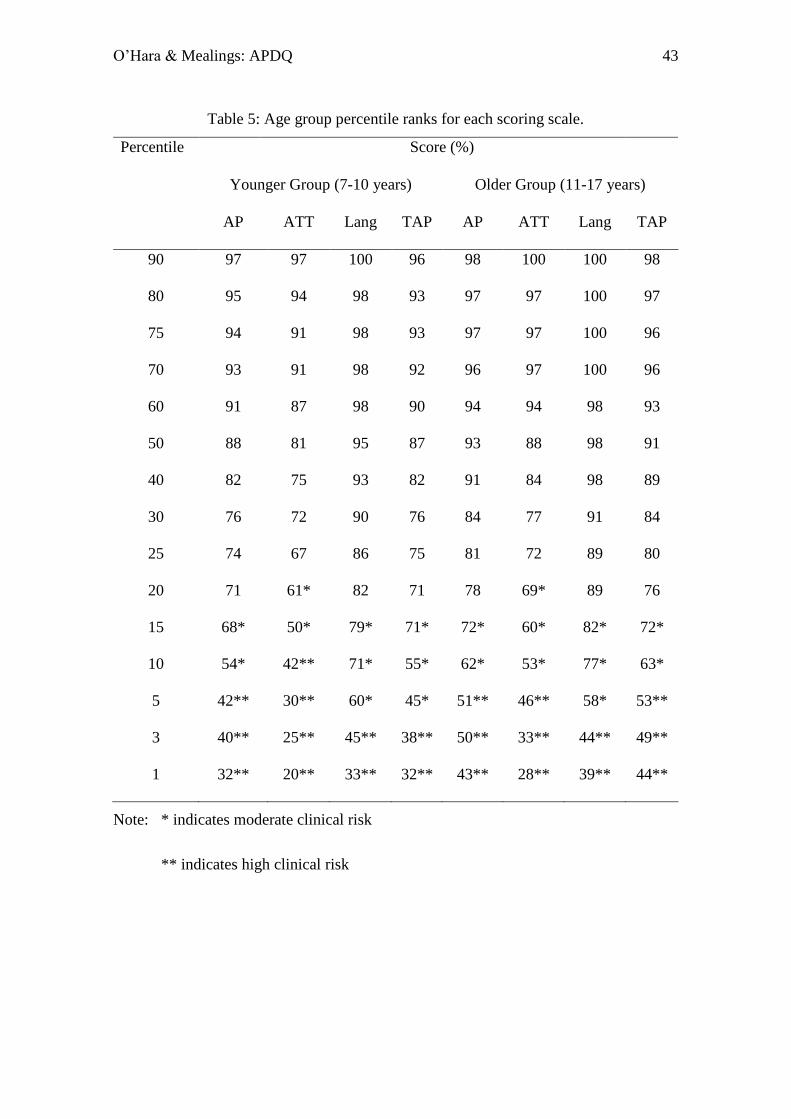
O’Hara & Mealings: APDQ 43
Table 5: Age group percentile ranks for each scoring scale.
Percentile Score (%)
Younger Group (7-10 years) Older Group (11-17 years)
AP ATT Lang TAP AP ATT Lang TAP
90 97 97 100 96 98 100 100 98
80 95 94 98 93 97 97 100 97
75 94 91 98 93 97 97 100 96
70 93 91 98 92 96 97 100 96
60 91 87 98 90 94 94 98 93
50 88 81 95 87 93 88 98 91
40 82 75 93 82 91 84 98 89
30 76 72 90 76 84 77 91 84
25 74 67 86 75 81 72 89 80
20 71 61* 82 71 78 69* 89 76
15 68* 50* 79* 71* 72* 60* 82* 72*
10 54* 42** 71* 55* 62* 53* 77* 63*
5 42** 30** 60* 45* 51** 46** 58* 53**
3 40** 25** 45** 38** 50** 33** 44** 49**
1 32** 20** 33** 32** 43** 28** 39** 44**
Note: * indicates moderate clinical risk
** indicates high clinical risk
O’Hara & Mealings: APDQ 44
Table 6: Key listening challenges for APD versus ADHD group on the AP scale and
ATT scale as suggested by single item comparisons with all of the items on that scale.
(Note, lower mean score values indicates greater difficulty with item).
APD Group ADHD Group
Item Mean
Score*
Item Mean
Score**
AP scale 36. Differentiating similar
sounding words.
0.89 49. Listening accurately
without louder volumes.
0.83
5. Hearing words
accurately in noise.
1.16 18. Not tiring easily
when listening.
1.17
52. Understanding
unclear speakers.
1.21 43. Remembering
detailed directions.
1.32
21. Understanding
speakers from behind.
1.21 3. Listening attentively
in noisy conditions.
1.41
44. Learning as well
verbally as visually.
1.21 15. Staying focussed
when listening.
1.47
23. Not needing repeats
when conversing in noise.
1.26
ATT scale 29. Staying organized. 1.53 29. Staying organised. 0.78
3. Listening attentively in
noisy conditions.
1.74 20. Concentrating on
low interest tasks.
0.85
17. Studying long periods
without fatigue/fidgeting.
1.89 24. Avoiding careless
errors.
0.85
31. Not being
forgetful.
0.93

O’Hara & Mealings: APDQ 45
Note: * APD Group scores for all AP scale items: Mean = 1.8; SD = 1.4
APD Group scores for all ATT scale items: Mean = 2.1; SD = 1.5
** ADHD Group scores for all AP scale items: Mean = 2.1; SD = 1.4
ADHD Group scores for all ATT scale items: Mean = 1.2; SD = 1.3

O’Hara & Mealings: APDQ 46
Figure 1

O’Hara & Mealings: APDQ 47
Figures Captions
Figure 1: Attention scale scores as a function of auditory processing scale scores for
younger and older age groups who have language scores above the third percentile
(graphs (a) and (c)) and who have language scores below the third percentile (graphs (b)
and (d)). Shading differentiates the regions for which each of APD, ADHD, LD,
unclear/mixed, and normal would be considered the most likely condition (colours
shown on online version).