Embed Size (px)
Citation preview

Manuscript Received:20-Nov-2019 & Revised: 28-Jan-2020 & Accepted: 24-March-2020
ISSN: 2423-3781
DOI: 10.22070/JQEPO.2020.4514.1112
Developing Statistical Process Control to Monitor the Values Education Process
Ali Akbar Daneshmandi *1 , Rassoul Noorossana 2 , Kiumars Farahbakhsh 3
1Payame Noor University, Tehran, Iran
2Faculty of Industrial Engineering, University of Science and Technology Tehran, Iran
3Faculty of Psychology & Educational Sciences – Allameh Tabataba'i University, Tehran, Iran
* Corresponding Author: Ali Akbar Daneshmandi (Email:[email protected] )
Abstract – Statistical process control (SPC) is a leading method in monitoring process performance and
detecting process deviations from goals, and measure progress in improving programs. Despite the
widespread use of SPC in various processes, its capability has not yet been well studied in the values
education process (VEP). Some challenges in using this method were: the lack of appropriate quantitative
data for using in the SPC, invalid and untrusted data, the presence of different values that make it difficult to
focus on values education, and choosing the proper process characteristic and control charts associated with
it. In this paper, a framework is presented to resolve these challenges includes: extracting the quantitative
data related to the values using event count items and check sheet, removing invalid data and its sources from
the research process through statistical tests, prioritizing values based on four attributes related to values,
and finally, measuring the value changes in students as Process characteristic. We used a modified deviation
from the nominal (DNOM ) control chart to identify and analyze the VEP changes. The results of a case study
at a school were quite promising. It increased team knowledge, helped decision-makers design and improved
the VEP, and developed the SPC method capability in a new area.
Keywords– DNOM Control Chart, Statistical Process Control, Values education Process, Value.
I. INTRODUCTION
The statistical process control or SPC, as one of the most outstanding technical achievements of the twentieth
century, includes a robust set of process monitoring tools that use statistical methods to solve a problem (Montgomery,
2009). The emphasis of SPC is on process improvement and early detection of deviations from goals (rather than
inspections), and reduction of failure costs.
Broad research has been done recently in the general area of statistical process control and statistical process
monitoring (SPM) in manufacturing and service processes (Fris'en, 2009; Woodall and Montgomery, 2014; Haridy et
a., 2014). Including some nontraditional applications in the monitoring of financial data (Fris'en, 2008) and duration and
cost data in project management (Aliverdi et al., 2013; Colin, and Vanhoucke, 2015).
SPC has not still been used in many educational processes like the VEP, despite its extensive use. Undoubtedly, the
goal of education in schools is not merely acquiring scientific knowledge and life skills, but also the moral education of

34 Daneshmandi, A.A. et.al. / Developing Statistical Process Control to Monitor the Values Education Process ...
students (Carr, 2011; Colnerud, 2006). An education without the elements of value and ethics is incomplete and
inappropriate, and its negative consequences, even if it does not destroy the community, will impose much cost on the
community (Gholami et al., 2011).
The SPC has been a useful tool in educational institutions and analyzes a large amount of data, such as grades,
registration process, graduation rate, and maintenance rates. One of the first applications of SPC in educational systems
was performed by Melvin (1993). The study used control charts in five structural and non-structural areas for the aim of
continuous improvement of school processes. He believed that the errors could be found in public education using the
Deming quality improvement philosophy and consistently improve the quality of school-related processes, leading to
improvement in the quality of classroom and school, district, and community output. Perry (2004) used the SPC
approach to improve the educational process in various courses and proposed that the process and characteristic of
quality associated with it should be adequately identified before applying the SPC. An appropriate control chart is then
selected based on the data type, sample size, and frequency.
Marks and Connell (2003) analyzed the data related to students' evaluation of teachers using the SPC. They used the
Shewhart Control Chart for individual measurements in order to monitor the performance of teachers. They were treated
with the mean of each course as individual observations. However, they did not use the class size in the control chart
and excluded important information related to it from the analysis. Moreover, they ignored the assumption of the
normality of data in the individual control charts, while their data are categorical and abnormal.
Ding et al. (2006) monitored the grades of students using the SPC to improve teachers' performance and obtain the
satisfaction of students. In a study conducted by Knight et al. (2010) at two different weeks, the professors were asked
to score unanimously to observe differences in obtained scores. An average range was obtained for each professor with
the obtained measures. It was used to find a control limit so that in the future if the scores were more than this range, the
assignment of scores would be re-evaluated. Mazumder (2014) has recently used the combination of SPC and six sigma
to identify and analyze the defects and improve and control university educational processes.
The applications mentioned above concentrate on educational institutions' general issues and the monitoring of the
students' educational status and do not focus on the VEP. For this reason, the capability of the SPC to monitor the VEP
is introduced in this research. In Section 2, the research challenges are introduced after describing the concepts and
literature. Section 3 presents research methodology along with solutions to cope with research challenges. In Section 4,
the performance of the control chart is examined in a case study, and the general conclusion is presented in Section 5.
II. EDUCATIONAL PROCESS OF VALUES; CONCEPTS AND CHALLENGES
Value as a social phenomenon has played a significant role in human life since the formation of early communities.
Values are beliefs and frameworks that define the appropriate behavior of individuals and direct them (Rokeach, 1973;
Allport et al., 1960). They are also the principles of a person's life guide in all situations, including the working
environments (Schwartz, 1992, 2005).
Values education can be defined as the aspect of educational practice in which moral or political values, as well as
norms, dispositions, and skills grounded in those values, are learned by students (Taylor,1994, 2000; Aspin, 2000;
Jones, 2009; Thornberg, 2008). Although concepts of value education and moral education are used interchangeably, in
this study, we use the term values education in line with Taylor (1994) that includes concepts such as moral education,
character education, and civic education.
Education of values can be divided into two distinct classes, including explicit and implicit education. The explicit
education of values is the formal school curriculum concerning values, while implicit education of values is an informal
and implicit curriculum of values, in which values are presented indirectly in school and classroom (Torenberg, 2008).
education of values could be the community meeting for democratic decision-making, the discipline committee for

Journal of Quality Engineering and Production Optimization / Vol. 5, No. 1, Winter & Spring 2020, PP. 33-54 35
confronting individuals with their misbehavior and punishing and forgiving them, and moral dilemma discussions in the
classroom to enhance the level of moral reasoning (Oser et al., 2008).
Based on the ISO 10015 standard, the training cycle in educational processes includes four stages, which should be
carefully monitored. As shown in figure 1, these stages include: (1) Define training needs; (2) Design and plan training;
(3) Provide for training, and (4) Evaluate training outcomes. Each VEP can begin with the determination of educational
needs, in which the more important values that should be enhanced are selected. In the next step, the explicit and
implicit educational program is designed and implemented. Teachers usually provide education because they spend the
most time with students. However, it is supported by a favorable school climate and other employees. The final stage is
the evaluation of the training outcomes that determine the effectiveness of the previous stages.
Performance data have gained importance as a means of summarising complex phenomena and dimensions across
different locations and overtime to identify and compare effective educational practices (Hacking 1983). These data are
used to inform and improve teaching quality and hold individuals, organizations, and systems to account for and as a
basis for improvement (Verger et al., 2019; Prøitz et al., 2017; Skedsmo and Huber, 2019).
Different approaches to evaluating and measuring moral values within personality psychology are best read as
beginning with Allport (1921), which led to the development of the Study of Values (SOV). SOV served as the primary
psychological measure of values or morality. Braithwaite and Scott (1991) reviewed the SOV and several subsequent
generations of personality and social psychological measures of morality. They focused their review on the Rokeach
Value Survey (Rokeach, 1973), which had become the dominant measure of individual value orientations. In the 23
years since that review, a new generation of researchers has introduced alternative models and moral personality
measures. In particular, Schwartz Value Survey (Schwartz, 1992), which was derived in part from the Rokeach
measure, has become the dominant, broadband measure of what we will term the moral personality. In recent years, two
other scales have been introduced that may replace the SVS, as they expand the scope of moral domains being assessed
and measures of moral personality that may benefit from the higher psychometric evaluation (Campbell et al., 2015).
These two scales are Moral Foundations Questionnaire, or MFQ (Graham et al., 2009) and Values in Action
Questionnaire, or VIA (Peterson, and Seligman, 2004).
Fig. 1. The training cycle diagram
Define training
needs
Evaluate training
outcomes Design and plan
training
Provide for
training
Monitor

36 Daneshmandi, A.A. et.al. / Developing Statistical Process Control to Monitor the Values Education Process ...
Generally, measurement instruments of the values can support VEP as powerful tools. However, in these methods,
some critical information is ignored, such as the variability of process performance and their causes and effects. In other
words, these tools rarely measure values more than twice, which does not provide enough data to be used in the SPC.
Therefore, it seems that any attempt to apply the SPC in monitoring the educational process of values should overcome
the following challenges:
The lack of quantitative data related to values that are appropriate for use in the SPC
Invalid and unverified data
Presence of different values that make it hard to focus on the value of education
Correct selection of process characteristic and associated control charts
In order to overcome the above challenges, there is a need for an integrated framework in which the SPC approach
is used to monitor the educational process of values. In Section 3, we propose such a framework based on the following
four characteristics:
Focus on the behavioral layer of value and extract quantitative data related to the values using the event count items
and check sheet
Delete invalid data and its sources from the research process
Prioritization of values based on the attributes of each value
Measure value changes in students and use modified DNOM control charts
III. METHODOLOGY
In this section, a framework is presented for applying the SPC in the educational process of values. For this purpose,
an approach is first introduced to extract the appropriate quantitative data to be used in the SPC. Then, the data
validation method and its resources are described, and an approach is proposed to prioritize the values to focus on the
educational process. Then, the control chart used in this research is introduced after describing common cause
variability from assignable cause variability in the VEP. Finally, the graphic representation of the proposed approach is
depicted.
A. The proposed method to extract necessary quantitative data for use in the SPC
Event count items can offer a partial solution for response style bias, and to some extent, eliminate the problem of
the lack of quantitative data that is appropriate for use in the SPC. Rather than asking a respondent to choose an answer
on a Likert scale, the survey question can inquire about a specific number of incidents or the percentage of time the
respondent behaves a certain way. For example, responses to the item "I would rather struggle through a personal
problem by myself than discuss it with my friends" (Earley, 1993) could be rephrased as "Out of the last five instances
you have had a personal problem, how many times have you discussed the problems with your friends?" to minimize
the response style and scale anchor interpretation bias. Similarly, consider the item" It is important to him to be polite to
other people all the time?" (Schwartz, 2006) in which response categories ranged from 1 to 6: "not like me at all (1)" to
"very much like me (6) ". This item could be rephrased as "In the past two days, how many times have you been
polite?". In general, according to Taras et al. (2009), to improve the validity of the findings and decrease the bias, it is
strongly recommended to consider event count items (behavior frequency data) as an alternative to self-response
questionnaires (Taras et al., 2009).
In this study, we focus on the behavioral layer of the values due to the lack of quantitative data related to values and
use the event count items to collect the SPC appropriate data. Furthermore, the check sheet is used as one of the seven
tools of the SPC for accurately recording the data to be used in the SPC. Since the check sheet is the base of the next
calculation and is used to enter data into the computer, its structure needs to be verified. In order to verify the check
sheet, it is used experimentally at the beginning, and the views of students, teachers, and parents are taken into

Journal of Quality Engineering and Production Optimization / Vol. 5, No. 1, Winter & Spring 2020, PP. 33-54 37
consideration. Moreover, the validity of the control sheet data is examined and verified through a statistical test that will
be described in the next section.
B. Validation of check sheet data
A 10-item questionnaire on a Likert scale was used to evaluate the validity of the student's answers. Questionnaire
items elicited parental and student opinions on how the student behaved for each value. They were provided separately
to parents and students to meet the independence condition as far as possible. As the normal distribution was not met in
the questionnaire, Mann – Whitney U test was used to compare the answers (Mann – Whitney, 1947). This test is used
to compare differences between two independent groups when the dependent variable is either ordinal or continuous but
not normally distributed. This is a nonparametric equivalent of the t-student test but examines the equality of medians
rather than equality of means. If the answers of the two groups are very different, it is concluded that the data provided
by the student or parents are probably invalid. For this reason, the students are excluded from the analysis process, and
the research continues with other students.
It should be noted that the test is performed in a double-blind way so that the process is not tensioned after
excluding students. In this method, no student, parent, or teacher know which student is in the research process and
which student is excluded from the analysis process. Moreover, this method helps to eliminate the chance of any
conscious bias and distorted information and increase the credibility of the test.
C. Prioritization of values
The concept of value priority (VP) is defined in order to identify and prioritize the values which should be trained in
the educational process. The general idea of VP is derived from the concept of risk priority number (RPN) in Failure
Mode and Effects Analysis (FMEA). FMEA is considered a TQM tool whose primary function is to prioritize and
prevent errors (Ashley et al., 2010). Four value-related characteristics are evaluated by parents and the education team
(including teachers, support team, and process engineer) in determining VP. Then, VP is calculated using equation 1.
Value-related characteristics are defined as follows:
Occurrence rate (O): Estimate of the frequency of students' errors
Effect severity (S): the level of seriousness of the students' errors
Detection capability (D): the probability that current controls can detect the student's error
Teaching capability (T): The rate of the effect of educational methods in enhancing the value
(1)
The occurrence rate is identified by the parent who has the most contact and knowledge of the students. The parent
and the education team identify effect severity. The education team determines the detection capability and teaching
capability. The value with the highest VP is considered to be more critical, and the focus of the educational process will
be on that.
D. Control chart in the values education process
After the development of the SPC by Walter Shewhart at Bell Lab in the early 1920s, seven major tools were
introduced to improve the process and reduce the variability, which the most important of them is probably a control
chart. Control charts have two phases. In phase I, a set of process data are collected and analyzed in the form of a
retrospective analysis, and control charts are plotted. In a Phase I analysis, the concern is distinguishing between in-
control conditions and the presence of assignable causes so that in-control parameters may be estimated for further
process monitoring in Phase II analysis (Gomaa and Birch, 2019).

38 Daneshmandi, A.A. et.al. / Developing Statistical Process Control to Monitor the Values Education Process ...
In Phase II, by comparing the statistics of consecutive samples selected from the control limit, the process
performance is monitored, and corrective action is undertaken if there is an assignable cause variability. Control charts
differentiate between common cause variability and assignable cause variability through rules such as Western Electric
rules and help management eliminate the latter from the process (Montgomery, 2009).
In any process, a certain amount of inherent or natural variability will always exist that is the cumulative effect of
unavoidable causes. These sources of variability are often called "chance causes of variation" (Montgomery, 2009). In a
VEP, it can be physical or mental diseases of student, genetic and cultural and financial background, psychological
pressure, and, finally, inappropriate education of environment (family, friends, media, and so on.).
Another kind of sources of variability in the output of a process is called "assignable causes of variation." Unlike
previous ones, these causes are avoidable and can be eliminated by operational, managerial, and engineering activities.
In a VEP, this variability may arise from three sources: inappropriate educational resources, ineffective curriculum
(excessive training or training in an unpleasant time), teacher's inability to teach appropriately (for example,
communicating with the students and creating interest in values).
Usually, everyone is exposed to education from family, community, friends, and years of schooling. So, it can be
said that the VEP is a multi-stage process. The dependence between stages of a multi-stage process is an important
property that must be considered in monitoring process. In other words, the quality of each stage of the process affects
the performance of the next stage directly. This property of a multi-stage process is referred to as the cascade property.
The cascade property provides a complex condition in comparison to a single process (Kalaei et al., 2018).
Most studies in statistical process monitoring are provided under the assumption that the measurements are precise.
However, exact measurement is a rare phenomenon in any environment where human involvement is evident (Riaz,
2014). In other words, errors due to instruments and operators commonly exist in practice even with highly
sophisticated advanced measuring instruments. Recently the effect of measurement errors on the performances of
various schemes proposed to monitor and design different processes has been addressed by several researchers such as
Hu et al., 2015 and 2016; Noorossana and Zerehsaz, 2015; Amiri et al., 2018; Salmasnia et al., 2018; Ashuri et al.,
2018.
Only a few remedial measures have been recommended in the literature to compensate for the effect of
measurement errors on detecting capability of Shewhart charts (Yang and Yang, 2005; Riaz, 2014; Khurshid and
Chakraborty, 2014). Detailed information concerning the effect of measurement errors on the performance of control
charts refers to the review paper presented by (Maleki et al., 2015).
An essential quality characteristic in the VEP is the rate of change in a student's value behavior. The educational
process is effective only when the student behavioral performance becomes better in comparison to the past. Therefore,
we decided to compare the student's performance with his past behavior.
In the SPC literature, the deviation from the nominal (DNOM) control chart is probably the most appropriate
technique for monitoring the rate of student behavior changes. In this technique, a or chart is used to
monitor the deviations from students' nominal measures in a classroom. Each student's nominal measure is expectable
in a value obtained based on student behavioral past.
A similar situation in the manufacturing sector is a drilling operation in a job-shop environment. The operator drills
holes of various sizes in each part, passing through the machining center. It is almost impossible to construct a control
chart on hole diameter since each part is potentially different. The correct approach is to focus on the characteristic of
interest in the process. It may be accomplished by controlling the deviation of the actual hole diameter from the nominal
diameter (Montgomery, 2009).

Journal of Quality Engineering and Production Optimization / Vol. 5, No. 1, Winter & Spring 2020, PP. 33-54 39
The control chart and chart can be used in the DNOM control chart but is recommended when
the sample size n is higher than 10 or 12. Suppose that m samples are available, each containing n observations on the
quality characteristic. If x1, x2, . . . , xn is a sample of size n, then the average and standard deviation of this sample are
obtained by the following equations:
∑
(2)
S=√∑
(3)
The best estimator of the process average and standard deviation are:
∑
(4)
S =
∑
(5)
The control limits on the chart are obtained by equations 6 to 8, and S chart are obtained by equations 9 to 11, in
which the constants A3, B3, and B4 are determined based on the sample size (Montgomery, 2009, p 254).
(6)
(7)
(8)
(9)
(10)
(11)
In order to illustrate the proposed procedure, consider the data in Table I. This table represents the number of
situations (N) and reported errors (O) in a classroom with two students. We assume that the error percentage (EP)
reported of the two students' behavioral is 0.46 and 0.20, respectively. If EE represents the expected error rate (nominal
measure) and X represents the deviation from EE then
EE =
(12)
X = O - EE (13)
40 Daneshmandi, A.A. et.al. / Developing Statistical Process Control to Monitor the Values Education Process ...
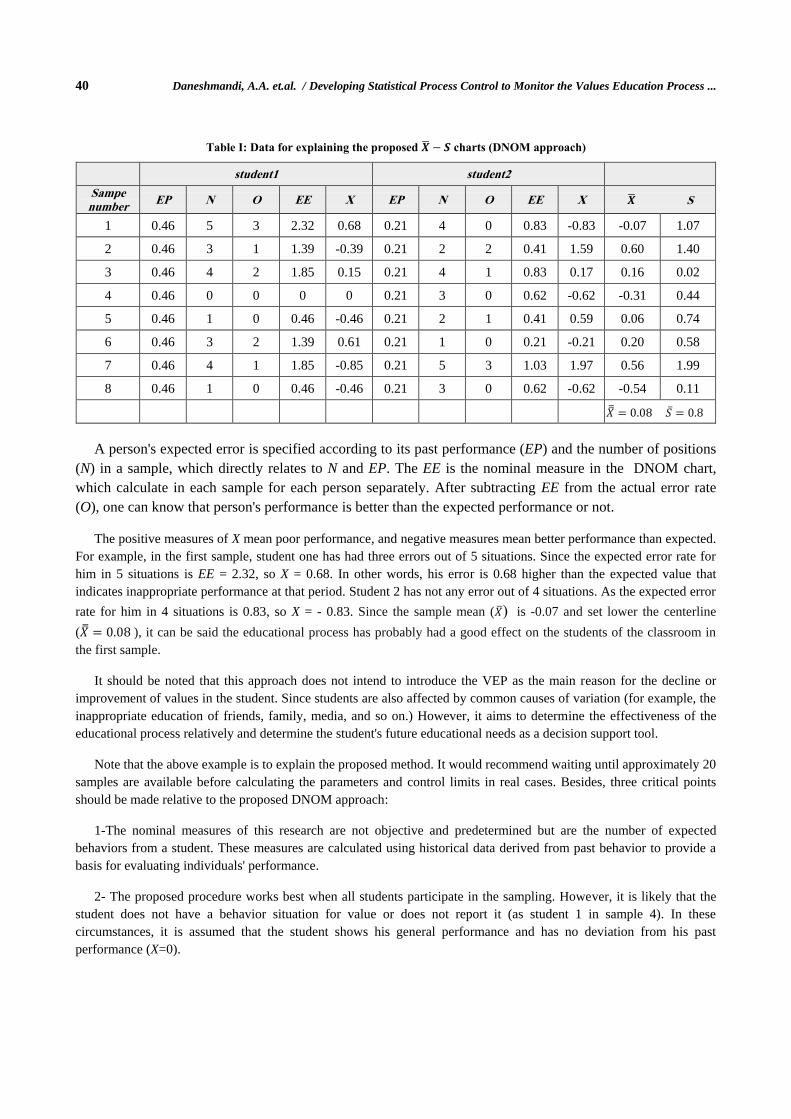
Table I: Data for explaining the proposed charts (DNOM approach)
student1 student2
Sampe
number EP N O EE X EP N O EE X S
1 0.46 5 3 2.32 0.68 0.21 4 0 0.83 -0.83 -0.07 1.07
2 0.46 3 1 1.39 -0.39 0.21 2 2 0.41 1.59 0.60 1.40
3 0.46 4 2 1.85 0.15 0.21 4 1 0.83 0.17 0.16 0.02
4 0.46 0 0 0 0 0.21 3 0 0.62 -0.62 -0.31 0.44
5 0.46 1 0 0.46 -0.46 0.21 2 1 0.41 0.59 0.06 0.74
6 0.46 3 2 1.39 0.61 0.21 1 0 0.21 -0.21 0.20 0.58
7 0.46 4 1 1.85 -0.85 0.21 5 3 1.03 1.97 0.56 1.99
8 0.46 1 0 0.46 -0.46 0.21 3 0 0.62 -0.62 -0.54 0.11
A person's expected error is specified according to its past performance (EP) and the number of positions
(N) in a sample, which directly relates to N and EP. The EE is the nominal measure in the DNOM chart,
which calculate in each sample for each person separately. After subtracting EE from the actual error rate
(O), one can know that person's performance is better than the expected performance or not.
The positive measures of X mean poor performance, and negative measures mean better performance than expected.
For example, in the first sample, student one has had three errors out of 5 situations. Since the expected error rate for
him in 5 situations is EE = 2.32, so X = 0.68. In other words, his error is 0.68 higher than the expected value that
indicates inappropriate performance at that period. Student 2 has not any error out of 4 situations. As the expected error
rate for him in 4 situations is 0.83, so X = - 0.83. Since the sample mean ( ( is -0.07 and set lower the centerline
( ), it can be said the educational process has probably had a good effect on the students of the classroom in
the first sample.
It should be noted that this approach does not intend to introduce the VEP as the main reason for the decline or
improvement of values in the student. Since students are also affected by common causes of variation (for example, the
inappropriate education of friends, family, media, and so on.) However, it aims to determine the effectiveness of the
educational process relatively and determine the student's future educational needs as a decision support tool.
Note that the above example is to explain the proposed method. It would recommend waiting until approximately 20
samples are available before calculating the parameters and control limits in real cases. Besides, three critical points
should be made relative to the proposed DNOM approach:
1-The nominal measures of this research are not objective and predetermined but are the number of expected
behaviors from a student. These measures are calculated using historical data derived from past behavior to provide a
basis for evaluating individuals' performance.
2- The proposed procedure works best when all students participate in the sampling. However, it is likely that the
student does not have a behavior situation for value or does not report it (as student 1 in sample 4). In these
circumstances, it is assumed that the student shows his general performance and has no deviation from his past
performance (X=0).
Journal of Quality Engineering and Production Optimization / Vol. 5, No. 1, Winter & Spring 2020, PP. 33-54 41
3-Due to the presence of variability among classrooms, they should not be integrated since each classroom usually
has a different teacher and students and probably curriculum. Thus, it is necessary to plot a distinct control chart for
each classroom.
Despite the widespread use of variable control charts in the non-manufacturing sector, it should be argued why
attribute control charts have not been used. According to Montgomery (2009), a fairly widespread but erroneous notion
about variable charts is that they do not apply to the non-manufacturing environment because the "product is different".
Nevertheless, if we can make measurements on the product that reflect quality, function, or performance, then the
nature of the product has no bearing on the general applicability of control charts. In this study, the rate of behavioral
changes in students is measured as the characteristic of the process. Therefore, using the variable control chart cannot
be problematic, provided that the needed assumptions are met.
Perhaps the most crucial strength of the proposed approach compared to the attribute charts is the ability to
neutralize the impact of different students' presence. In other words, since each student is compared with herself, one
can compare the performance of the educational process in different classrooms. Similar to this situation is seen in the
healthcare sector, in which there is a diverse mix of patients and physicians. In many healthcare applications, the data
are risk-adjusted before taking any action so that the conditions for comparing the output of physicians to be provided
(Woodall, 2006). Without risk adjustment, a low-experienced physician's performance may be shown better than a well-
experienced physician's since the patients' initial conditions have been ignored. Woodall et al. (2010) presented a
general overview of health-related surveillance, including risk-adjusted monitoring. Here, the differential of behavioral
values from the expected mean of each person is, in fact, a kind of risk adjustment, makes the data to be purified before
using them. Without this, an inappropriate educational process in a classroom with moral students might be shown
better than an appropriate educational process in the regular classroom.
For further explanation, consider the data for N = 4 and O = 1 for both students. In the proposed control chart, this
amount is regarded as a progression for the first student (X = -0.85), while for the second student, it is considered a
degradation (X = 0.17). However, in an attribute chart, the ratio of mistakes is the same for both students (P = 0.25)
since students' initial conditions have been ignored.
E. Schematic representation of the proposed framework
Figure (2) presents the framework of applying SPC in monitoring the VEP. The left side of the figure includes
validation, prioritization of values, and calculation of parameters and control limits in phase I of the control chart. The
right side of the schema is related to Phase II of the control chart, in which the control chart obtained in phase I is used
to monitoring the process by comparing the sample statistic for each successive sample.
IV. CASE STUDY, RESULTS, AND DISCUSSION
In this section, we present a case study using the framework presented in the previous section. In Section A, the
collected data and initial analyses on them are described to validate the data and prioritize the values. Then, the
underlying assumptions of the control chart are examined. Phase I of the control chart is discussed in Section B, and
Phase II is discussed in Sections C. The capability of the education process is discussed in Section D, and finally,
Section E provides discussion.
A. Collected data and initial analyses
The data were collected at a middle school in Pakdasht city, Tehran province, between November and January 2018
to determine the capability of the proposed method in the real world. In this case, ten values were selected for further
study by the education team through the 57 SVS items. These values included obedience, politeness, self-discipline,
wisdom, help, forgiving, social justice (care for the weak), prosperity, devoutness, and cleanness. One of the
classrooms, including 32 students, was selected to monitor the educational process. Among the parents and students,

42 Daneshmandi, A.A. et.al. / Developing Statistical Process Control to Monitor the Values Education Process ...
eight people were unwilling to collaborate to improve the education process due to personal problems, so the research
continued with other students.
Fig. 2. Schematic representation of the proposed framework for applying the SPC in monitoring the VEP
To collect and validate data, a questionnaire on the Likert scale was used in which students and parents gave weight
to questions related to observing values by each student. In the parents-related questionnaire, the effect severity was
also determined by parents. The obtained data allowed us to compare and validate the students' answers, which led to
denying the validity of 10 students' data. Hence, they were excluded from the analysis process and, the research
continued with 14 students.
After collecting data, the education team determined the priority of values using equation 1. The prioritization
results indicated that the two values of self-discipline (SD) and helpfulness (HF) have the highest priority, and the focus
should be on their improvement. For this purpose, the behavioral data of the remaining students were collected for these
two values. The question asked about the SD was, "How many times have you had the self-discipline today?" Similarly,

Journal of Quality Engineering and Production Optimization / Vol. 5, No. 1, Winter & Spring 2020, PP. 33-54 43
the question related to helpfulness was, "How many times were you helpful today?" The number of errors (O) and the
number of situations (N) were collected for each value using these questions. During 25 daily samplings, the data were
derived from the 14 students, and the error percentage (EP) of each student were obtained in two values of HF and SD.
Then, as described in the previous section, the expected error rate (EE) and behavioral deviations of each student from
EE (X) were calculated to be used for future analyses.
The underlying assumptions of the x and S Shewhart control charts are the normal distribution of samples
(measurements) and the independence of samples from each other. It is necessary to examine these two assumptions
before applying the data in Phase I. In order to examine the normal distribution of samples, three tests of Anderson-
Darling, Kolmogorov-Smirnov, and Chi-square tests were used in the Minitab 18 software. Figure 3 displays the
Anderson-Darling test results for HF and SD values. The P-values indicate that there is no evidence to reject the null
hypothesis. However, it is rejected for the value of HF. Similarly, the two tests of Kolmogorov-Smirnov and Chi-square
statistical tests yielded the same results.
Fig. 3. The Anderson–Darling statistical test for the hypothesis test of normally distributed HF and SD samples
Although there are methods for samples with non-normal distribution, they are not recommended. Instead, the
transformation of non-normally distributed data to normal distribution is proposed (Montgomery, 2009). Figure 4
illustrates the Johnson transformation on the SD value data, obtained through Minitab software. This figure shows that
Johnson transformation is entirely appropriate for the transformation of samples to normal distribution.
Now that the samples of the two values, directly and indirectly, follow the normal distribution, the first condition of
applying the X-R control chart is met. However, the second condition still should be verified, i.e., independent samples.
Independence of samples means that an observed measurement should not affect other measurements. This condition
can easily be examined in the Minitab software by analyzing auto-correlation between samples. Figure 5 shows that
samples of HF value are independent of each other. However, the SD value has a slight auto-correlation in the sixth
period. As this auto-correlation is small and has not been repeated in other periods, it can be ignored in the results
interpreting with a little caution. In other words, there is no need for alternative approaches, such as the control charts of
residuals (Montgomery, 2009). Here, it should be noted that the type of auto-correlation is not a general rule, and it
cannot be concluded that the behavioral data related to these two values always behave like this. However, it is verified
for the present study.

44 Daneshmandi, A.A. et.al. / Developing Statistical Process Control to Monitor the Values Education Process ...
Fig. 4. The summary of Johnson transformation on HF samples
Fig. 5. Autocorrelation graphs of HF and SD samples
B. Calculating control limits
Having in hand customarily distributed and independent samples, we proceeded to calculate the control limits of the
DNOM control chart. For this purpose, after plotting the control chart, we removed out-of-control samples with an
assignable cause and re-calculate the control limit until no sample was required to be removed. Figure 6 illustrates the
control chart for HF and SD samples in which the SD process is in control, but the two samples 9 and 11 in the HF
process are out of control. By carefully examining these two points, it was found that students were not helpful in days

Journal of Quality Engineering and Production Optimization / Vol. 5, No. 1, Winter & Spring 2020, PP. 33-54 45
since they were studying for two challenging exams.
The education team decided to provide strategies for coping with high-pressure conditions for students in the
educational content in order to prevent the re-occurrence of this problem. By excluding these two samples, the control
limits were re-calculated. This time, all HF samples were within the control limit, and none of the western electric rules
showed a non-random pattern, as shown in figure 7. Table II shows the final control limit at the end of Phase I that will
be used to monitor students' values deviations in phase II.
Fig. 6. -S control charts for monitoring HF and SD values over a 25-day period
Table II: Control limits of and S charts
HF transposed SD
chart UCL 0.72 0.694
CL -0.066 0
LCL -0.853 -0.694
S chart UCL 1.533 1.353
CL 0.962 0.849
LCL 0.391 0.345
252321191715131197531
1.0
0.5
0.0
-0.5
-1.0
Sample
Sa
mp
le M
ea
n
__X=-0.066
UCL=0.720
LCL=-0.853
252321191715131197531
1.50
1.25
1.00
0.75
0.50
Sample
Sa
mp
le S
tDe
v
_S=0.962
UCL=1.533
LCL=0.391
11
Xbar-S Chart of HF transposed
Subgroups omitted from the calculations: 9; 11
252321191715131197531
0.8
0.4
0.0
-0.4
-0.8
Sample
Sa
mp
le M
ea
n
__
X=-0.000
UCL=0.694
LCL=-0.694
252321191715131197531
1.50
1.25
1.00
0.75
0.50
Sample
Sa
mp
le S
tDe
v
_S=0.849
UCL=1.353
LCL=0.345
2
Xbar-S Chart of SD

46 Daneshmandi, A.A. et.al. / Developing Statistical Process Control to Monitor the Values Education Process ...
Fig. 7. -S control charts for monitoring HF value after excluding two samples 9 and 11
C. Control Chart in Phase II
After the process parameters and control limit were identified, a new educational process began for the SD and HF
values. In this process, the implicit and explicit curriculum was presented to the students by movies, lectures, books,
and other methods like moral dilemma discussions in the classroom. Two teachers were selected for this purpose, and
each teacher was responsible for teaching a value.
During these educations, 25 daily samples were taken from students to identify the individual and cumulative effects
of education on students in each period. Similar to phase I for each student, EE and X were calculated firstly. Then, x
and S were calculated and plotted on the phase I control chart for each sample to determine the level of reduction or
improvement in students' behavioral performance.
Figure 8 illustrates the DNOM control charts to monitor the educational process of SD and HF in phase II. The
phase I samples are also plotted for better examining the trend of changes in both charts. These charts show that both xand S charts are in control since samples are within the control limits and, the non-random pattern is not seen at the top
of the control chart. Despite this similarity, the type of the effect of the educational process on students is entirely
different. The chart related to HF value follows the decreasing trend that indicates the students' behavior improvement
and the probable effectiveness of the educational process. It should be noted that the points below the centerline or the
aggressive measures show the student's progress and the probable effectiveness of the VEP.
Unlike the HF, no significant change is seen in the SD control chart compared to phase I. For this reason, the
education team decided to examine the causes of the ineffectiveness of this process. The result of the examination
determined the need for changes in the content of the VEP.
252321191715131197531
1.0
0.5
0.0
-0.5
-1.0
Sample
Sa
mp
le M
ea
n
__X=-0.066
UCL=0.720
LCL=-0.853
252321191715131197531
1.50
1.25
1.00
0.75
0.50
Sample
Sa
mp
le S
tDe
v
_S=0.962
UCL=1.533
LCL=0.391
11
Xbar-S Chart of HF transposed
Subgroups omitted from the calculations: 9; 11

Journal of Quality Engineering and Production Optimization / Vol. 5, No. 1, Winter & Spring 2020, PP. 33-54 47
Fig. 8. -S control charts for monitoring HF and SD values in phase II
D. The capability of the education process
Now that there is enough information on the process and its parameters, process capability can be determined to
identify the effectiveness of the VEP. Table III shows the process capability in phase I (before training) and phase II
(after training) for each of the values. This table shows that the new educational process has been useful only for the HF
value since it could reduce the ratio of total error from 0.32 to 0.23. As both processes are under control, Cpk and Cpu
ratios can be used to accurately examine the process capability. We assumed the upper specification limit (USL) is 0.5;
that means up to 0.5 increase in EE is not a problem. In both values, measurements smaller than one in the Cpk and Cpu
ratios represent a low education process capability that caused more than 188,000 defects per million (PPM).
464136312621161161
0.8
0.4
0.0
-0.4
-0.8
Sample
Sa
mp
le M
ea
n
__X=0
UCL=0.681
LCL=-0.681
464136312621161161
1.2
1.0
0.8
0.6
0.4
Sample
Sa
mp
le S
tDe
v
_S=0.833
UCL=1.327
LCL=0.338
2
Xbar-S Chart of SD TOTAL
At least one estimated historical parameter is used in the calculations.
464136312621161161
1.0
0.5
0.0
-0.5
-1.0
Sample
Sa
mp
le M
ea
n
__X=-0.066
UCL=0.705
LCL=-0.837
464136312621161161
1.50
1.25
1.00
0.75
0.50
Sample
Sa
mp
le S
tDe
v
_S=0.944
UCL=1.504
LB=0.391
6
5
55
11
Xbar-S Chart of HF transposed total
At least one estimated historical parameter is used in the calculations.
Subgroups omitted from the calculations: 9; 11

48 Daneshmandi, A.A. et.al. / Developing Statistical Process Control to Monitor the Values Education Process ...
Table III: The capability of the education process in phase I and phase II
value phase the ratio of total error Cpu Cpk PPM
HF 1 0.321 0.19 0.19 280000
HF 2 0.231 0.29 0.29 188571
SD 1 0.335 0.19 0.19 285000
SD 2 0.343 0.18 0.18 337142
E. Discussion
In this research, SPC was employed to improve the effectiveness and quality of the VEP. For this purpose,
quantitative data related to values were extracted initially. The event count items are not the complete criterion. Still, in
the absence of definitive measures, it can provide a decision support system that helps a manager make a better
decision. Then, invalid data and sources were excluded from the research process, and the values were prioritized.
Prioritization does not mean abandoning other values, but with the goal of a better focus on education. In the future, it is
possible to monitor different values, especially those that are less tangible, by engaging with people who provide valid
data.
In this research, the DNOM chart for the attribute data was customized to monitor changes from the nominal value
(expected value of each student). The most important feature of this chart is a type of risk adjustment for better
exposure to human data.
In addition to increasing team knowledge, the proposed approach can indicate the individual and cumulative impact
of different training through daily sampling. As shown in Figure 8, students' behavior in the HF value is improved,
which indicates the probable effectiveness of the educational process. Mainly from the twentieth day onwards (point 45
on the chart), the degree of improvement has increased, which may be the cumulative effect of the recent training or the
personal impact of a curriculum that is presented to students on this day. A careful study of this subject requires more
specific analytical techniques, such as the design of experiments (DOE).
In the SD control chart, unlike the HF, there were no significant changes in phase two. For this reason, the education
team decided to investigate the causes of the ineffectiveness of the process. The result of the study indicated the need
for change in the content of the course and the promotion of teachers' knowledge to more effective teaching. Similarly,
the low process capability of the educational process confirmed this and indicated that changes to the training of values
(especially SD value) were needed. The changes were not possible without management intervention. To this end,
specialized training was provided to teachers and parents so that each of them can enhance the values of students more
effectively.
In monitoring the educational processes, we should not forget that the teacher and educational process are only one
of the factors that influence a student's value behavior. It is always possible that the deviations associated with common
cause variability affect student value behavior. Therefore, even when there is a possibility of a teacher's disability, the
process of monitoring should not lead to condemnation or abandonment of the teacher. Instead, teachers should feel
secure and support as much as possible, especially when the teacher is involved in the VEP and is looking for
continuous improvement. However, the teacher and other school staff's legitimate expectation is that they do not behave
in such a way as to weaken the students' values (even if they are reluctant to participate in the process) because they
affect students. In the following section, the validity of the control chart is first checked, and then discussed the
limitations of the research.
E.A. Assessment of the effect of measurement errors
The education team decided to evaluate the validity of the control chart using the parent's data. In order to compare

Journal of Quality Engineering and Production Optimization / Vol. 5, No. 1, Winter & Spring 2020, PP. 33-54 49
with previous data, parents were asked to determine student adherence to SD and HF values. Two Statistical tests were
taken to determine whether an educational process is appropriate from the parents' viewpoint. Tables IV and V present
the results of the Sign Test and Wilcoxon Signed Ranks Test, respectively in comparing the parent's data before and
after the VEP. These tables verified the results of the control chart and illustrate that the new educational process has
been useful only for the HF value.
Table IV: Sign Test results
HF SD
N N
Negative Differences 2 7
Positive Differences 11 5
Ties 1 2
Total 14 14
P value 0.022 0.774
E.B. Research limitations
A critical limitation of this SPC methodology involves collecting historical data to calculate the sample statistics,
centerline, and control limits. For a useable chart to be developed, appropriate and valid historical data must already be
in existence. Therefore, the school administrators must be willing to delay the operational use of the method until
necessary historical data is collected. The lack of valid historical data could not be a severe problem since most training
programs take weeks to complete.
Table V: Wilcoxon Signed Ranks Test results
HF
SD
N Mean rank Sum of ranks N Mean rank Sum of ranks
Negative Ranks 2 7.00 14.00 7 6.07 42.50
Positive Ranks 11 7.00 77.00 5 7.10 35.50
Ties 1
2 21.3 0.20
Total 14
14 24.0 1.40
P value 0.024
0.776
Z -2.254
-0.284
A second potentially serious limitation to the SPC methodology may arise as a result of some value definitions.
Hofstede (1991) defined cultural values as fixed features and "hardwired mental programs," not a secular state. Thus, by
definition, it is almost impossible to change values in the education process at school. However, some studies have
found that national cultures and cultural values have been changing quite rapidly (e.g., Fernandez et al., 1997; Inglehart
and Welzel, 2005; Taras and Steel, 2006b).
On the other hand, because of the younger age of students, it is entirely possible to shape and change their values.
Therefore, it should not be ignored the role of schools and educational processes in strengthening students' values on the

50 Daneshmandi, A.A. et.al. / Developing Statistical Process Control to Monitor the Values Education Process ...
pretext of unchangeable values. Instead, it should increase the effectiveness of the VEP by improving the process and
applying the right methods.
Students and parents participating in the research are valuable resources that can be used for monitoring less
tangible values in later stages. However, the lack of cooperation of others in the study can still be a limitation. Due to
the absence of some students in the research, these research results are valid only for students and parents who are
willing to cooperate to improve the educational process and give honest answers. Since there is no credible information
from other students, it is impossible to determine how the educational process affects them.
Since this study focuses on the behavioral layers of values, it is possible to monitor various cultural, public, and
moral values. Nevertheless, event count items are not a perfect solution as such items typically refer to behaviors. It
may be difficult to phrase an attitude or value question in such a way that it can be answered in terms of an amount or
percentage of instances of specific observations. Therefore, the use of this approach is limited to values that can be
converted into a numerical quantity.
V. CONCLUSIONS AND FURTHER DIRECTIONS
The significance and complexity of the VEP indicate the need for a well-organized educational evaluation. In this
paper, an application of the DNOM chart was explained for monitoring the output of this process. We revealed that this
chart could be beneficial for VEP monitoring because it supports effective and exhaustive educational evaluation and
further cause-and-effect analysis. This chart provides useful information to managers responsible for monitoring and
evaluating performance. This approach has several advantages. First, the goal of proactive performance management is
achieved by integrating VEP with SPC control chart techniques. The SPC-based VEP helps decision-makers in
designing and improving the process as a decision support tool. Second, causes for output variations can be
systematically analyzed and, additional measures can be taken to strengthen positive trends, stabilize performance, or
correct for adverse trends.
Applying SPC control chart principles to VEP opens up many areas of research. Future research can examine and
compare various types of SPC control charts in terms of different values. It can be useful to determine the
appropriateness of applying SPC to VEP. Additionally, a better understanding of cause and effect relationships on
diverse curriculum and an appropriate prediction model can be studied, such as the DOE. The DOE can determine the
individual or cumulative effect (or interaction) of different training on students' value behavior. The writers hope that
this paper will motivate some of this work.
ACKNOWLEDGEMENT
The authors are grateful to anonymous referees for their valuable comments and the education team for sincere
cooperation. Any errors and omissions, however, remain the responsibility of the authors.
REFERENCES
Aliverdi, R., Moslemi Naeni, L., Salehipour, A., (2013). Monitoring project duration and cost in a construction project by applying
statistical quality control charts. Int. J. Proj. Manag. 31 (3), 411–423.
Allport, G. W. (1921). Personality and character. Psychological Bulletin, 18, 441-455. Available from
http://dx.doi.org/doi:10.1037/h0066265.
Allport.G., Vernon, P., & Lindsey, G. (1960). Study of values. Boston: Houghton Mifflin.

Journal of Quality Engineering and Production Optimization / Vol. 5, No. 1, Winter & Spring 2020, PP. 33-54 51
Amiri, A., Ghashghaei, R., & Maleki, M. R. (2018). On the effect of measurement errors in simultaneous monitoring of mean vector
and covariance matrix of multivariate processes. Transactions of the Institute of Measurement and Control, 40(1), 318-330.
Ashley L, Armitage G, Neary M, Hollingsworth G. A. (2010). Practical guide to Failure Mode and Effects Analysis in health care:
Making the most of the team and its meetings. Joint Commission Journal on Quality and Patient Safety; 36 (8):351-8.
Ashuri, A., Bashiri, M., & Amiri, A. (2018). Preferred Robust Response Surface Design with Missing Observations Based on
Integrated TOPSIS-AHP Method. Journal of Quality Engineering and Production Optimization, 3, 1, 81-91.
Aspin, D. (2000). A clarification of some key terms in values discussions. Moral education and pluralism: Education, culture and
values, 37, 171-180.
Campbell, J., Jayawickreme, F., Hanson, E., (2015). Measures of Values and Moral Personality. Measures of Personality and Social
Psychological Constructs. 505-529.
Carr, L.(1992). Applying cost of quality to a service business, Sloan Manage. Rev, 33, 72–77.
Colin, J., Vanhoucke, M.(2015). Developing a framework for statistical process control approaches in project management,
International Journal of Project Management, 33, 6, 1193-1416.
Colnerud, G. (2006).Teacher ethics as a research problems: Syntheses achieved and new issues. Teachers and Teaching: Theory and
Practice, 12,365–385.
Ding, Xin., Wardell, Don., Verma, Rohit. (2006). An Assessment of Statistical Process Control-Based Approaches for Charting
Student Evaluation Scores. Cornell University School of Hotel Administration. http://scholarship.sha.cornell.edu/articles/532.
Earley, P.C. (1993). East meetsWest meets Mideast: further explorations of collectivistic and individualistic work groups. Academy
of Management Journal 36 (2), 319–348.
Fernandez, D.R., Carlson, D.S., Stepina, L.P., et al., (1997). Hofstede's country classification 25 years later. Journal of Social
Psychology 137 (1), 43–54.
Fris'en, M., ed. (2008). Financial Surveillance. Hoboken, NJ: John Wiley & Sons, Inc.
Fris'en, M. (2009). "Optimal Sequential Surveillance for Finance, Public Health, and Other Areas (with Discussion)". Sequential
Analysis 28, pp. 310–337.
Gholami, A., Maleki,H., Emami,C. (2011). Studying the effectiveness degree of active teaching methods on religious and moral
education of students at fifth grade of primary school in Shiraz from teachers' point of view. Procedia Social and Behavioral
Sciences, 15, 2132-2136.
Gomaa, A. S., & Birch, J. B. (2019). A semiparametric nonlinear mixed model approach to phase I profile monitoring.
Communications in Statistics-Simulation and Computation, 48(6), 1677-1693.
Graham, J., Haidt, J., & Nosek, B. A. (2009). Liberals and conservatives rely on different sets of moral foundations. Journal of
Personality and Social Psychology, 96, 10291046. Available from http://dx.doi.org/doi:10.1037/a0015141.
Hacking, I. (1983). Representing and intervening: Introductory topics in the philosophy of natural science. Cambridge: Cambridge
University Press.

52 Daneshmandi, A.A. et.al. / Developing Statistical Process Control to Monitor the Values Education Process ...
Hofstede, G. (1991). Cultures and Organizations: Software of Mind. McGraw Hill, London.
Hu, X.; Castagliola, P.; Sun, J.; Khoo, M.B.: The effect of measurement errors on the synthetic chart. Qual. Reliab. Eng. Int.
31(8), 1769–1778 (2015)
Hu, X.; Castagliola, P.; Sun, J.; Khoo, M.B. (2016). The performance of variable sample size chart with measurement errors. Qual.
Reliab. Eng. Int. 32(3), 969–983.
Kalaei, M., Atashgar, K., Niaki, S. T. A., & Soleimani, P. (2018). Phase I monitoring of simple linear profiles in multistage processes
with cascade property. The International Journal of Advanced Manufacturing Technology, 94(5-8), 1745-1757.
Khurshid, A.; Chakraborty, A.B. (2014). Measurement error effect on the power of the control chart for zero-truncated binomial
distribution under standardization procedure. Int. J. Qual. Res. 8(4), 495–504.
Inglehart, R., Welzel, C. (2005). Modernization, Cultural Change and Democracy: The Human Development Sequence. Cambridge
University Press, New York.
Jones, T. M. (2009). Framing the framework: discourses in Australia's national values education policy. Educational Research for
Policy and Practice, 8,35 57.
Knight, J. E., Allen, S., & Tracy, D. L. (2010). Using six sigma methods to evaluate the reliability of a teaching assessment rubric.
The Journal for American Academy of Research Cambridge, 15(1), 1-6.
Maleki, M.R.; Amiri, A.; Castagliola, P. (2017). Measurement errors in statistical process monitoring: a literature review. Comput.
Ind. Eng. 103, 316–329.
Mann, Henry B.; Whitney, Donald R. (1947). "On a Test of Whether one of Two Random Variables is Stochastically Larger than the
Other". Annals of Mathematical Statistics. 18 (1): 50–60.
Marks, N., & Connell, R. (2003). Using statistical control charts to analyze data from student evaluations of teaching. Decision
Sciences Journal of Innovative Education, 1(2), 259– 272.
Mazumder, Q.H. (2014) 'Applying Six Sigma in higher education quality improvement', ASEE Annual Conference and Exposition,
15–18 June, 2014, Indianapolis, IN.
Melvin,C. (1993). Application of Control Charts to an Educational System, Performance Improvement Quarterly, 6(3) pp. 74-85.
Montgomery, D. C. (2009). Introduction to Statistical Quality Control. (7th Ed.). New York: Wiley.
Noorossana,R.;Zerehsaz,Y.:Effect ofmeasurement error on phase IImonitoring of simple linear profiles. Int. J. Adv.Manuf. Technol.
79(9), 2031–2040 (2015).
Oser, F. K., Althof, W., & Higgins-D’Allessandro, A. (2008). The Just Community approach to moral education: System change or
individual change? Journal of Moral Education, 37, 395–415.
Perry, L. (2004). Instructional effectiveness: A real-time feedback approach using statistical process control (spc). Proceedings of the
2004 American society for engineering education annual conference & exposition, Utah, USA.

Journal of Quality Engineering and Production Optimization / Vol. 5, No. 1, Winter & Spring 2020, PP. 33-54 53
Peterson, C., & Seligman, M. E. P. (2004). Character strengths and virtues: A handbook and classification. Washington, DC:
American Psychological Association.
Prøitz, T. S., Mausethagen, S., & Skedsmo, G. (2017). Investigative modes in research on data use in education. Nordic Journal of
Studies in Educational Policy, 3(1), 42–55. https://doi.org/10.1080/20020317.2017.1326280.
Riaz, M.: Monitoring of process parameters under measurement errors. J. Test. Eval. 42(4), 980–988 (2014).
Rokeach, M. The Nature of Human Values, The Free Press, New York, 1973.
Haridy, Salah, Zhang Wu, Ka Man Lee & M. Abdur Rahim (2014) An attribute chart for monitoring the process mean and variance,
International Journal of Production Research, 52:11, 3366-3380, DOI:10.1080/00207543.2013.875234.
Salmasnia, A., Maleki, M. R., & Niaki, S. T. A. (2018). Remedial measures to lessen the effect of imprecise measurement with
linearly increasing variance on the performance of the MAX-EWMAMS scheme. Arabian Journal for Science and Engineering,
43(6), 3151-3162.
Schwartz, S. H. (1992). Universals in the content and structure of values: Theoretical advances and empirical tests in 20 countries. In
M. Zanna (Ed.), Advances in experimental social psychology (pp. 165). San Diego, CA: Academic Press.
Schwartz, S. H. (2005). Robustness and fruitfulness of a theory of universals in individual values. In A. Tamayo, & J. B. Porto
(Eds.), Valores ecomportamento nas organizacoes., Values and behavior in organizations, (pp. 5695). Petropolis, Brazil: Vozes.
Schwartz, S. H. (2006). Value orientations: Measurement, antecedents and consequences across nations. In R. Jowell, C. Roberts, R.
Fitzgerald, & G. Eva (Eds.), Measuring attitudes cross-nationally: Lessons from the European Social Survey (pp. 169-204).
London: Sage.
Skedsmo, G., Huber, S.G.(2019). Measuring teaching quality some key issues, Educational Assessment, Evaluation and
Accountability volume 31, pages151–153.
Taylor, M.(1994). Overview of values education in 26 European countries. InM.Taylor (Ed.), Values education in Europe: A
comparative overview of a survey of 26 countries in 1993(pp. 1–66). Dundee:Scottish Consultative Council on the Curriculum.
Taras, V., Steel, P., 2006b. Culture as a consequence: amultilevelmultivariatemeta-analysis of the effects of individual and country
characteristics on work-related cultural values. Best Papers Proceedings, the Academy of Management Annual Meeting, Atlanta,
GA.
Taras, v., Rowney,j., steel,p.,2009. Half a century of measuring culture: Review of approaches, challenges, and limitations based on
the analysis of 121 instruments for quantifying culture. Journal of International Management 15, 357–373.
Thornberg, R. (2008). The lack of professional knowledge in values education. Teaching and Teacher Education, 24, 1791-1798.
Verger, A., Fontdevila, C., & Parcerisa, L. (2019). Reforming governance through policy instruments: How and to what extent
standards, tests and accountability in education spread worldwide. Discourse: Studies in the Cultural Politics of Education.
https://doi.org/10.1080/01596306.2019.1569882.
Woodall, W. H. (2006). The Use of Control Charts in Health-Care and Public-Health Surveillance. Journal of Quality Technology,
Vol. 38, No. 2, April 2006.

54 Daneshmandi, A.A. et.al. / Developing Statistical Process Control to Monitor the Values Education Process ...
Woodall, W. H., and D. C. Montgomery. 2014. Some current directions in the theory and application of statistical process
monitoring. Journal of Quality Technology 17:78–94.
Woodall, W. H.; Grigg, O. A.; and Burkom, H. S. (2010). "Research Issues and Ideas on Health-Related Monitoring". In Frontiers in
Statistical Quality Control, Lenz, H.-J.; Wilrich, P.-Th.; and Schmid, W. (eds.), vol. 9, 145–155. Heidelberg, Germany: Physica-
Verlag.
Yang, S.F.; Yang, C.M., (2005). Effects of imprecise measurement on the two dependent processes control for the autocorrelated
observations. Int. J. Adv. Manuf. Technol. 26(5–6), 623–630.