Embed Size (px)
Citation preview

Developing sensory evaluation methods for consumers with low-literacy levels
applicable in developing countries
by
Kamdem Mademgne Joseph D
Submitted in partial fulfilment of the requirements for the degree
MSc Food Science
In the
Department of Food Science
Faculty of Natural and Agricultural Sciences
University of Pretoria
South Africa
© University of Pretoria

i
DECLARATION
I declare that the dissertation here with submitted for the degree MSc Food Science at the
University of Pretoria, has not previously been submitted by me for a degree at any other
university or institution of higher education.
Joseph D Kamdem Mademgne
Date: 26/04/2016
© University of Pretoria

ii
DEDICATION
This dissertation is dedicated to God for the gift of life and making this possible. It is also
dedicated to my family for their unfailing love, support and encouragements.
© University of Pretoria
iii
ACKNOWLEDGEMENTS
I would like to express my sincere gratitude and acknowledgements to the following people
and institutions for their support and assistance with this research:
My supervisor Prof H. L. de Kock, for her time and willingness to guide me as well as for her
efforts, enthusiastic guidance, encouragement and contribution to this project.
My co-supervisor Prof Shakila Dada for her advice, guidance, positive criticism and support.
I wish to thank Prof E. Buys, Prof J. R. N. Taylor, Prof K. G. Duodu, Prof M. N.
Emmambux, Dr Johanita Kruger and our late Prof A. Minnaar for their useful advice at
different stages of this research.
I am grateful to Marise Kinnear for her help and advice at different stages of my sensory
research work.
My special thanks go to the other academic staff and non-academic staff and fellow
postgraduate students of the Department of Food Science, University of Pretoria for their
support in fulfilling this research.
My family and friends for their encouragements, prayers and support in various ways.
Above all, to God who made all possible.
© University of Pretoria

iv
ABSTRACT
DEVELOPING SENSORY EVALUATION METHODS FOR CONSUMERS WITH
LOW LITERACY LEVELS APPLICABLE IN A DEVELOPING COUNTRIES
Joseph D Kamdem Mademgne
Supervisor: Prof Henriëtta. L. de Kock
Co-supervisor: Prof Shakila Dada
Conventional consumer sensory methods take literacy and language capabilities for granted.
Consumers with low-literacy levels are considered as people lacking reading proficiency to
fill out basic forms or read simple instructions. The conventional format of the paired
preference test requires participants to read instructions and indicate which one of two
samples is preferred.
The first objective of the project was to develop formulations for two ginger biscuits that
differed perceptibly but subtly in salt content only to use as test materials for paired
preference test trials using consumers with low-literacy levels. The signal biscuit contained
0.65% salt on a flour basis and the high salt biscuit contained 4.54%.
Physicochemical analysis showed that the two biscuits were significantly different in total
carbohydrate, moisture, ash, protein, fat and Na+ contents as well as texture by instrumental
analysis. However, biscuits weren’t different in terms of their colour values. Sensory analysis
revealed that the high salt biscuit was perceptibly more salty compared to the signal biscuit,
but not different in hardness in contrast to the instrumental analysis. An untrained panel of
literate student participants preferred the signal biscuit over the high salt biscuit.
The second objective was to develop variations of the conventional paired preference method
and to determine the effects of variations of the basic elements of the method on task
performance by low-literate consumers. Seven individual paired preference tests were carried
out at seven different test stations using 50 participants per method.
The conventional method was less efficient and time-consuming with a mean time of 5.6 min
taken per participant. The efficiency of the paired preference method was improved to an
extent that almost no assistance was needed and the mean time to complete the test was 4.2
min with the modify methods.
© University of Pretoria

v
Participants performing the test claimed that, combination of audio and picture instructions
positively influence their performance and improved understanding of test instructions. For
the conventional paired preference test, 34% of participants struggled to follow the test
instructions and only 52% of participants appeared confident with the procedure. For the
method with limited reading and writing requirements, only 16% of participants struggled to
follow the instructions and 84% appeared confident with the procedure.
Basic elements developed associated to instruction to pull the coding sticker from the sample
chosen to stick it on a positive smiling face was identified as the best paired preference
method for independent completion by low-literate consumers.
© University of Pretoria

vi
TABLE OF CONTENTS
DECLARATION ........................................................................................................................ i
DEDICATION ........................................................................................................................... ii
ACKNOWLEDGEMENTS ..................................................................................................... iii
ABSTRACT .............................................................................................................................. iv
TABLE OF CONTENTS .......................................................................................................... vi
1 INTRODUCTION .............................................................................................................. 1
2 LITERATURE REVIEW ................................................................................................... 3
2.1 Introduction ................................................................................................................. 3
2.2 Literacy........................................................................................................................ 3
2.2.1 Definition and description of literate consumers ................................................. 4
2.2.2 Definition and description of consumers with low-literacy levels ...................... 4
2.3 Overviews of consumer sensory test methods ............................................................ 6
2.3.1 Preference test ...................................................................................................... 6
2.3.2 Paired preference ................................................................................................. 6
2.3.3 Paired preference test sensitivity ......................................................................... 7
2.3.4 Preference Ranking ............................................................................................ 14
2.4 Hedonic rating ........................................................................................................... 16
2.4.1 Facial reading techniques ................................................................................... 18
2.5 Qualitative analysis research using consumers with low literacy levels ................... 25
2.6 Conclusions ............................................................................................................... 28
3 HYPOTHESES AND OBJECTIVES .............................................................................. 29
3.1 Hypotheses ................................................................................................................ 29
3.2 General objective (AIM) ........................................................................................... 30
3.2.1 Objective 1 ......................................................................................................... 30
3.2.2 Objective 1 ......................................................................................................... 30
3.2.3 Objective 2 ......................................................................................................... 31
4 FORMULATION OF GINGER BISCUITS TO USE AS TEST MATERIAL FOR
SENSORY METHOD DEVELOPMENT ............................................................................... 32
4.1 Introduction ............................................................................................................... 33
4.2 Objectives .................................................................................................................. 33
4.3 Material and methods ................................................................................................ 33
© University of Pretoria
vii
4.3.1 Biscuit formulations ........................................................................................... 33
4.3.2 Biscuit preparation ............................................................................................. 34
4.3.3 Proximate analysis ............................................................................................. 35
4.3.4 Sodium content .................................................................................................. 36
4.3.5 Texture analysis of biscuits ................................................................................ 36
4.3.6 Colour analysis................................................................................................... 36
4.3.7 Paired comparison tests for the saltiness, hardness and preference of biscuits . 36
4.3.8 Statistical analysis .............................................................................................. 37
4.4 Results ....................................................................................................................... 37
4.5 Discussion ................................................................................................................. 38
4.6 Conclusions ............................................................................................................... 40
5 THE EFFECTS OF VARIATION OF THE BASIC ELEMENTS OF THE PAIRED
PREFERENCE SENSORY TEST METHOD ON TASK PERFORMANCE BY
CONSUMERS WITH LOW-LEVELS OF LITERACY. ....................................................... 41
5.1 Introduction ............................................................................................................... 42
5.2 Objectives .................................................................................................................. 43
5.3 Materials and Methods .............................................................................................. 43
5.4 Test materials ............................................................................................................ 45
5.5 Methods ..................................................................................................................... 45
5.6 Test procedure ........................................................................................................... 47
5.7 Statistical analysis of qualitative and quantitative data ............................................. 48
5.8 Results ....................................................................................................................... 51
5.8.1 Demographic results .......................................................................................... 51
5.8.2 Quantitative analyses results .............................................................................. 54
5.8.3 Qualitative analyses ........................................................................................... 56
5.9 Discussion ................................................................................................................. 61
5.9.1 Language of communication.............................................................................. 61
5.9.2 Which biscuit was preferred, and why? ............................................................. 61
5.9.3 Time to complete the test ................................................................................... 64
5.9.4 Anxiety ............................................................................................................... 67
5.9.5 Effect of the combination of the different basic elements ................................. 68
5.10 Conclusions ............................................................................................................... 69
6 General Discussion ........................................................................................................... 70
6.1 Critical review of the experimental design and methodologies ................................ 70
© University of Pretoria

viii
6.2 Guideline for the Kamdem paired preference test to use with consumers with a low
literacy level. ........................................................................................................................ 74
6.2.1 Definition of test sensitivity (α-risk, β-risk, Pmax) ........................................... 74
6.2.2 Determine number of participants (N): .............................................................. 75
6.2.3 Test materials ..................................................................................................... 75
6.2.4 Analysis and interpretation of Kamdem paired preference results .................... 77
6.3 Example of paired preference test: example of a one side test will be demonstrated
77
6.3.1 Background ........................................................................................................ 77
7 Conclusions and recommendations .................................................................................. 85
8 References ........................................................................................................................ 86
9 Appendix A, B, C ............................................................................................................. 95
LIST OF FIGURES
Figure 2.1: Example of a scorecard for the paired-preference test, showing option A, which
limits the subjects to two choices (Lawless and Heymann, 2010). ........................................... 9
Figure 2.2: Example of scorecard for the paired-preference test, showing option B, which
includes a No preference choice to the subject (Lawless and Heymann, 2010). ..................... 10
Figure 2.3: Set of first solid paired symbols test developed and adapted for paired comparison
test with illiterate and semi-illiterate consumers (Coetzee and Taylor, 1996) ........................ 11
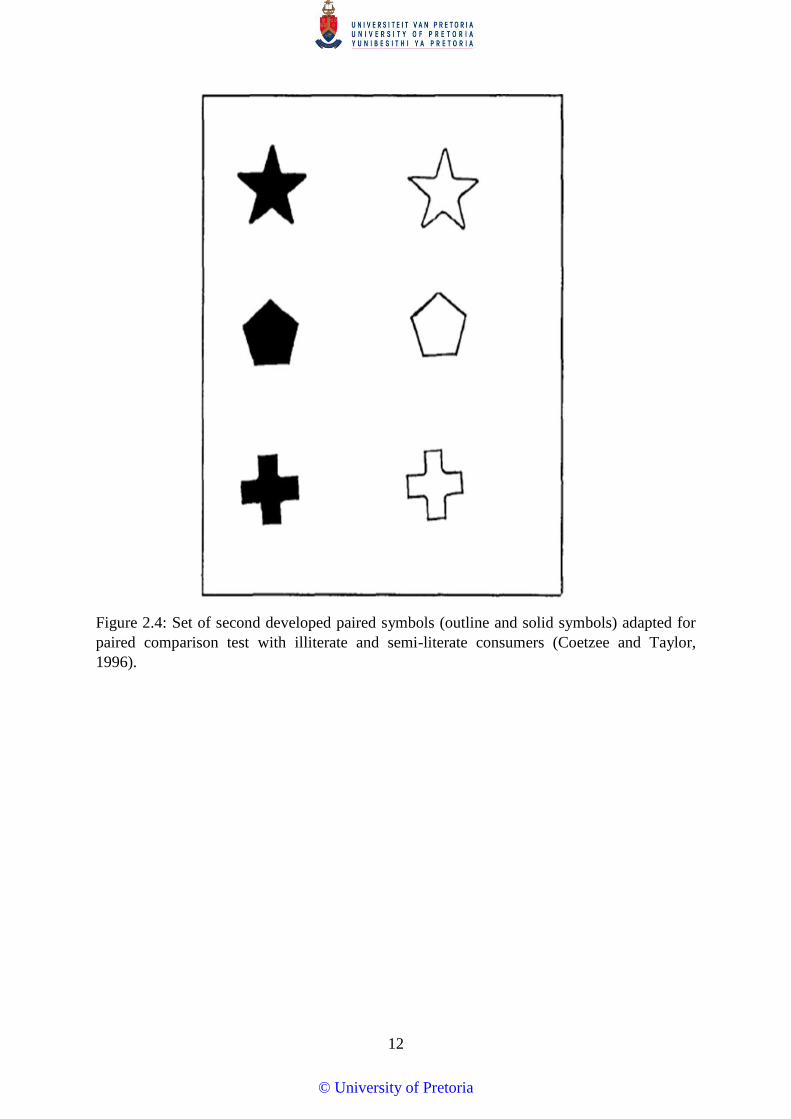
Figure 2.4: Set of second developed paired symbols (outline and solid symbols) adapted for
paired comparison test with illiterate and semi- illiterate consumers (Coetzee and Taylor,
1996). ....................................................................................................................................... 12
Figure 2.5: Set of third developed separated paired symbols (outline and solid symbols)
adapted for paired comparison test with illiterate and semi- illiterate consumers (Coetzee and
Taylor, 1996)............................................................................................................................ 13
Figure 2.6: Adapted paired preference method proposed by Coetzee (2001) ......................... 13
Figure 2-7: Example of preference ranking score sheet proposed by Lawless and Heymann,
(2010). ...................................................................................................................................... 15
Figure 2.8: Examples of the 9-point hedonic scale designed by Peryam and Girardot, 1952,
for studying US soldier’s preferences in the field (Lim, 2011). .............................................. 20
Figure 2.9: The 9-point category scale used by Yeu et al., (2008). ......................................... 20
Figure 2.10: The 9-point empty boxes scale used by Chung, (2010). ..................................... 20
Figure 2.11: The label affective magnitude scale (LAM) (Hein, et al., 2008) ........................ 21
© University of Pretoria

ix
Figure 2.12: Acceptability scales (a) number scale (b) box scale used by Sosa et al., (2008) 22
Figure 2.13: Hedonic score sheet adapted for illiterate consumers by Coetzee (2001). .......... 23
Figure 2.14: Example of Facial Hedonic scales used for hedonic rating by children (Guinard
2001) ........................................................................................................................................ 24
Figure 5.1: Design of experiment to measure the effects of variations of the basic elements of
the paired preference sensory test method on the task performance by consumers with low-
literacy levels. Pictures of audio, listening, reading instructions were accessed from Mayer-
Johnson, (1985). ....................................................................................................................... 44
Figure 5.2: Pictorial instructions used to describe different steps for completing the paired
preference test. Pictures were presented vertically on a poster in order of test evolution from 1
to 8 (Methods 6 and 7). ............................................................................................................ 49
Figure 5.3: Pairs of geometrical symbols used as coding symbols for methods 3, 4, 5, 6, 7. . 50
Figure 5.4: Distribution of % participants that speak a specific home language (n=350). ...... 52
Figure 5.5: Distribution of home languages spoken by participants of the different methods 53
Figure 6.1: Tray presented to participants. Image of cup and spoon was accessed from ........ 79
LIST OF TABLES
Table 2-1: Summary of some important practical difficulties of doing sensory testing with
illiterate or semi-literate consumers. ........................................................................................ 27
Table 4-1: Different expressions of the formulations for ginger biscuits that differ in salty
taste used as test material during this study. ............................................................................ 34
Table 4-2:Physicochemical analyses and sensory evaluation of the biscuits .......................... 38
Table 5-1: Gender distribution and average age of participants per test method (n=50 per test
method) .................................................................................................................................... 54
Table 5-2: Paired preference test results analysed separately for participants that completed
the test independently (not assisted) and those that completed the task with some assistance,
anxieties level of participants and time taken to complete the test. ......................................... 55
Table 5-3: Grouping (expressed as percentage of participants per test method) of
observations, from assistants regarding the reasons why participants struggled with a test
method...................................................................................................................................... 57
Table 5-4: Cross tabulation table (Task * methods) of participants’ perceptions of the ease of
performing the different test methods. (How did you perceive the task?) n=50 ..................... 58
© University of Pretoria
x
Table 5-5: Grouping of comments mentioned by participants’ (expressed as a percentage of
total number of participants per method) after rating the ease of performing a test method.
You said it was (easy, okay or difficult), why? And percentage of in consisted responses from
participants ............................................................................................................................... 59
Table 5-6: Qualitative information related to task performance by participants completing the
different test methods based on comments of respondents and observations by assistants ..... 60
Table 6-1: Number of participants needed for a paired preference test one-sided alternativeA
(ASTM E2263, 2013) .............................................................................................................. 81
Table 6-2: Number of common responses needed for significance in paired preference test,
Two-Sided AlternativeA (ASTM E2263, 2013) ...................................................................... 82
Table 6-3: Number of Common Responses Needed for Significance in a Paired Preference
Test, One-Sided alternative hypothesis a (ASTM E2263, 2013) ............................................. 83
Table 6-4: Number of Common Responses Needed for Significance in a Paired Preference
Test, Two-Sided alternative hypothesis a ................................................................................. 84
© University of Pretoria

1
1 INTRODUCTION
Literacy is defined as the “ability to read and write” and the inability to do so is called
illiteracy (Stevenson, 2010). According to the UNESCO Institute of Statistics (USI)
September 2014 review, there are still 781 million adults and 126 million youths in the world
that cannot read or write a short simple sentence about their everyday life, despite significant
improvements in literacy rates globally (UNESCO, 2014). Twenty four per cent of illiterate
consumers live in sub-Saharan Africa. In South Africa it is estimated that between 7.4 and 8.5
million adults are functionally illiterate and that between 2.9 and 4.2 million people have
never attended school (International literacy day, 2015). This represents a substantial
percentage of the population in the region and also an important group of food consumers.
Literacy seems to be a term that everyone understands but as a concept it has proved to be
both complex and dynamic. It is difficult to arrive at a concise definition of literacy because
the concept changes with societal demands (Mhlanga, 2011). According to Adkins and
Ozanne (2005a), low-literate people lack reading proficiency to fill out basic forms or read
simple instructions.
Food choice and acceptability are primarily based on whether the sensory properties of food
products are liked or disliked. Nutritional or health benefits come as an aftermath, thus
researchers should pay special attention when measuring food products’ acceptance (Sosa et
al., 2008). Sensory evaluation with consumers is easy in its principle but its implementation
in the field is often complicated especially in rural areas where consumers are generally
characterised with low levels of education or low income (Muhimbula et al., 2011).
Food industries all over the world have the challenge of supplying food products to a diverse
group of people from the most affluent to the poorest consumers (Coetzee, 2001).
Conventional consumer sensory methods take literacy and language capabilities for granted
(Coetzee and Taylor, 1996). One of the reasons why food products often fail might be
because consumers’ preferences regarding the food products are not clearly understood
(Coetzee and Taylor, 1996). Illiterate consumers are often unable to read instructions and
complete evaluation sheets, or make a choice on a scale to indicate their preference (Coetzee
and Taylor, 1996). Consumers with low-literacy levels represent a marginalised or worse
ignored group, and are underrepresented in market research (Viswanathan, Gajendiran and
Venkatesan, 2008). Development of suitable sensory test methods (e.g. paired preference or
hedonic tests), modified from conventional methods for consumers with low-literacy levels,
© University of Pretoria

2
might contribute to ameliorate consumers’ performance during such tests and could improve
understanding of consumers’ attitudes when it comes to making choices during sensory
research. More intuitive methods that limit reading and writing tasks may also be useful to
allow independent completion of the task by illiterate or low-literate consumers. The
structure of the dissertation is as follows: a review of literature is presented in chapter 2.
From the literature review, hypotheses were formulated leading to objectives to be tested in
an experiment. The methodology for the experiment and results are presented in two research
chapters (chapter 4 and 5) that form the basis for two researcher publications. A general
discussion to critically review the experimental design and methodologies is presented in
chapter 6. This chapter concludes with a guideline for using the new method developed
through this research. Chapter 7 presents conclusions from the researcher and
recommendations for future studies.
© University of Pretoria

3
2 LITERATURE REVIEW
2.1 Introduction
This review presents the attributes of consumers with low levels of literacy when it comes to
making a choice of one product among others in the market place and during sensory food
research. It reviews quantitative and qualitative sensory methods using low-literate
consumers. An overview of one-on-one qualitative data collection with consumers with low
literacy levels is given. Studies of various adapted sensory paired preference, preference
ranking and hedonic rating test are also reviewed. Researchers’ difficulties when carrying out
sensory testing using consumers with low-literacy levels are reviewed and presented.
2.2 Literacy
The way literacy has been defined has changed over the last few decades; it is therefore a
dynamic concept. It is changing to embrace multiple approaches to societal demands
(Mhlanga, 2011). The Oxford English dictionary defines literacy as “the ability to read and
write” and the inability to do so is called illiteracy (Stevenson, 2010). However, this
definition is simplistic and fails to include the process of understanding and applying
information that was read. Literacy is an important concept in many areas of social life, it
refers not merely to the act of reading and writing printed language, but also to the ability to
extract and process complex meanings in a socio cultural context (Bengtsson and Firat,
2006). Viswanathan et al., (2009), affirmed that literacy is the ability to respond properly to
all possible reading tasks. De Bruin and Minnaar (1994), viewed literacy as the ability to
think and reason like a literate person. A person identified as functionally literate can engage
effectively in all those activities in which literacy is required; read, write and do calculations
on his own (Keefe and Copeland, 2011). Literacy is a key ability that should influence
whether a consumer is persuaded by peripheral cues (external aspects of a product or
packaging e.g. colour, shape, size, images), in a market place rather than written message
claims. Thus the choice process for consumers with low-literacy level focuses on peripheral
cues rather than attribute claims (written messages). Literate consumers will focus more on
the strength of message claims (Jae and Delvecchio, 2004).
© University of Pretoria

4
2.2.1 Definition and description of literate consumers
Literacy involves a set of decoding and encoding skills (Adkins and Ozanne, 2005a). A
literate person has a set of skills that work in any context, whether it is reading a financial or
scientific statement or the ability to complete a specific task (Adkins and Ozanne, 2005a). A
literate person can fill out any form, and filling out a form at the doctor’s office is the same as
filling out a form at home (Adkins and Ozanne, 2005b). Thus a literate person is able to act as
other literate people would act in the same situation, which requires more than decoding
skills and the ability to complete reading tasks, but also entails social and cultural practices
(Adkins and Ozanne, 2005b). According to Carstens (2004), literate consumers possessed
skills that help them to understand written instructions: perception skills (ability to
discriminate between letters, words, number, pictures or whatever is on a page), decoding
skills (ability to recognise words), encoding skills (ability to comprehend information),
feedback skills (ability to think about information) and memory skills. Thus, consumers with
excellent literacy levels have the ability to find and manipulate text and numbers to
accomplish complicated related tasks e.g. associate price, weight, description of the product
etc. within a specific market context in which other skills and knowledge are also employed
(Adkins and Ozanne, 2005a). Literate consumers usually experience satisfaction by selecting
the right product at the right time because they combine all peripheral cues of products
including written information when making purchasing decisions (Fingeret and Drennon,
1997).
2.2.2 Definition and description of consumers with low-literacy levels
Adkins and Ozanne (2005a), defined consumers with low-literacy levels, as people that lack
reading proficiency to fill out basic forms or read simple instructions. People who can read
enough to enter background information on a simple form, that can locate identifiable
information in text, but otherwise possess only marginal literacy skills. Carstens (2004),
presented consumers with low-literacy levels as persons that lacked strategies to recognise
words and decode them. Adkins and Ozanne, (2005a), affirmed that consumers with low-
literacy levels may for example choose a wrong product in a store due to misunderstanding of
the written price information. They also experience substandard product choices because of
overdependence on peripheral cues (e.g. image on a packaging of the product, price, weight),
in product advertising and packaging (Jae and Delvecchio, 2004). Viswanathan, et al., (2009),
used the term pictographic thinking to express the idea developed by Jae and Delvecchio
(2004), concerning low-literate consumers ways of thinking, and said they depended on
perceptual, rather than conceptual processes, in acquiring, retaining and using information
© University of Pretoria

5
(they enjoyed physical representation of any object rather than written representation). For
example, consumers with low-literacy levels have a tendency to visualize quantity of
products to buy by picturing them, rather than using available symbolic information, such as
weight or volume or units of measurement (Adkins and Ozanne, 2005a). According to
Carstens (2004), people with low-literacy levels are able to process visual information despite
some limitations such as quality of the object representation (unrealistic reproduction of the
colour, dimensional objects representation etc.). Pictures are attracting, it increases speed of
message transfer, stimulate, motivate and enhance the memories of consumers with low-
literacy levels and is an important vehicle of information in the health sector.
Malhotra (1988), stated that visual processing particularly, mental imagery, is a strong
facilitator of learning that characterises consumers with low-literacy levels. Information
acquisition and unique sensory features of pictures allow them to be encoded more
distinctively. Viswanathan, et al., (2009), characterised consumers with low-literacy levels as
persons with a lack of or limited ability to think abstractly. They explained that when adults
with low-literacy levels were shown sets of objects (e.g. hammer, saw, log, and hatchet), and
were asked to select the three that were most similar, they could not identify hammer, saw
and hatchet as tools and derived ad-hoc categories even when prompted that hammer-saw-
hatchet were tools “Yes, but even if we have tools, we still need wood-otherwise, we can't
build anything”. In this regard, Villanueva and Da Silva (2009) affirmed that consumers with
low-literacy levels primarily function in the visual (pictorial thinking), concrete realm, rather
than the symbolic abstract realm. Similarly, children with disabilities and low-literacy levels
also have difficulties understanding what pictures mean. This has been attributed to the
iconicity of the picture which is a perceive relationship between a symbol and its referent
(Mizuko, 1987; Fristoe and Lloyd, 1980; Lloyd and Fuller, 1990; Blischack, Lloyd and
Fuller, 1997; Schlosser and Sigafoos, 2002).
© University of Pretoria
6
2.3 Overviews of consumer sensory test methods
Two general classes of consumer testing methods exist. Acceptance testing presents
consumers with products individually, for which a hedonic response is elicited without direct
comparison to other products, typically using a type of scale to quantify overall acceptability
(Hein et al., 2008). Preference test methods require the selection of one product that is
preferred over another (Lawless and Heymann, 1999). Acceptance methods measure the
degree to which a product is liked or disliked and give interval or ratio data (Courcoux and
Semenou, 1997). Preference methods produce ordinal data that permits identification of
sample preference within the test set (Lawless and Heymann, 1999).
2.3.1 Preference test
Preference test methods involve comparisons between two products or among several
products. If two products are compared it is called a paired preference test and if more than
two, it is called preference ranking test. In the latter case the consumer orders the product
from best liked to least liked (Lawless and Heymann, 1999). It is the simplest type of sensory
test method.
2.3.2 Paired preference
The paired preference test can be considered as the first sensory test method developed to
assess preferences (Stone, Bleibaum and Thomas, 2012). Thus it should not be surprising that
there is extensive literature about the method and especially on the topics of test design,
statistical analysis, and mathematical methods to help explain choice behaviour in a pair
comparison situation (Stone et al., 2012). The method requires the subject to indicate which
one of two coded products, is preferred (Figure 2.1). Sometimes the inclusion of “no
preference” as a third choice is included (Figure 2.2). The orders of presentation are A-B and
B-A, the test usually evaluates only one pair of products in a test with no replication. It is
usually a two-tailed test because we do not have any knowledge regarding which product is
preferred (Stone et al., 2012). The appeal of the test method is quite strong because of the
unambiguous design. However, it is not very informative because the responses provide no
direct measure of magnitude of acceptability of the products, both products may be disliked.
The method is less efficient compared to some other methods because there is only one
response for each pair of products. However, it typically mimics what consumers do when
purchasing products (choosing among alternatives) (Stone et al., 2012). Conventional
wisdom is that consumers make choices by implicitly comparing products to each other.
© University of Pretoria

7
Depending on the groups of participants (children or adults) and demand of some food
companies, conventional sensory paired preference test methods underwent some
modification. Coetzee and Taylor (1996), develop a paired comparison method for illiterate
and semi-literate consumers where the usual three digit code numbers were replaced with
graphic symbols (outlined and solids) (Figures 2.3, 2.4, 2.5). They concluded that many of
the consumers who could not read or write could reliably perform this type of paired
comparison test when verbal instructions were given. They observed that consumers were
able to perform or complete the test without any assistance when using the adapted score
sheets. Only occasional direction was needed to explain to participants how to perform the
test. Paired comparison symbols proved to be successful because no time wasting was noted
and efficiency of the test improved compared to the conventional method with usual code
number system which proved to be ineffective (Coetzee and Taylor, 1996).
Coetzee (2001), proposed an adapted paired preference test method (Figure 2.6) for illiterate
and semi-literate consumers. The method was designed to clearly understand the opinions of
illiterate consumers. Consumers were given two food samples and asked to make a choice
based on some specified criteria or characteristic; consumers were given a blank score sheet
and two stickers (different colours). After tasting the products they were asked to stick the
corresponding sticker of the sample they preferred on a blank score sheet to indicate their
preference. The conventional 3-digit number code to mark was also removed and the usual
pen for filling forms avoided. She mentioned some observations relevant to the illiterate
consumers’ behaviour during the test. Illiterate consumers often were not able to interpret
three-digit numbers on the score sheet; participants were not able to evaluate more than two
samples at the same time. She concluded that illiterate and semi-literate consumers performed
better with the adapted method compared to the conventional method.
2.3.3 Paired preference test sensitivity
Generally for the paired preference test the approach to the statistical analysis requires the use
of a two-tailed test over a one-tailed test. A good argument can sometimes be made for
applying a one-tailed test, for example, consider paired comparisons between samples of a
food with and without an extra ingredient, say sugar. When asked to identify the preferred
sample, it is reasonable to expect that if the judges could distinguish between the samples,
then participants would choose the sample with added sugar. Since we can predict the
direction of the outcome: it is a one-tailed test (O’Mahony, 1985). According to the ASTM
E2263 (2013), the paired preference test is a test in which the researcher might have an a
© University of Pretoria

8
priori assumption concerning the direction of the preference. In this case the alternative
hypothesis will express that a specific product is preferred over the other product (that is only
A > B or A < B) depending on the a priori belief. If the researcher does not have any a priori
assumption concerning direction of the preference, the test is a two-tailed or two sided test. In
this case the alternatives hypothesis is that the products are not equally preferred (that is
A≠B). The test sensitivity of the paired preference depends on important statistical concepts
i.e. α-risk, the probability of concluding that a preference exists when, in reality, one does
not, and β- risk, the probability of concluding that no preference exists when, in reality, one
does as well as Pmax the proportion of common responses that the researcher wants the test
to be able to detect with a probability of 1-β. For example, if a researcher wants to have a 90
% confidence level of detecting a 60:40 split in preference, then Pmax = 60 % and β = 0.10.
Smaller values of α, β and Pmax indicate a more sensitive test. The test sensitivity parameters
are established prior to testing and are used to determine the number of participants needed in
a study (ASTM E2263, 2013).
© University of Pretoria

9
Figure 2.1: Example of a scorecard for the paired-preference test, showing option A, which
limits the subjects to two choices (Lawless and Heymann, 2010).
© University of Pretoria

10
Paired preference test
Orange Beverage
Name: Date:
Tester number: session code:
Please rinse your mouth with water before starting. Please taste
the two samples in the order presented, from left to right. You may
drink as much as you would like, but you must consume at least
half the sample provided.
If you have any questions, please ask the server now.
Please indicate your preference by circling one of the following
three answers.
387 456
No preference
Thank you for your participation.
Please return your ballot through the
Window to the server
Figure 2.2: Example of scorecard for the paired-preference test, showing option B, which includes a
No preference choice to the subject (Lawless and Heymann, 2010).
© University of Pretoria

11
Figure 2.3: Set of first solid paired symbols test developed and adapted for paired comparison test with
illiterate and semi-literate consumers (Coetzee and Taylor, 1996)
© University of Pretoria
12
Figure 2.4: Set of second developed paired symbols (outline and solid symbols) adapted for
paired comparison test with illiterate and semi-literate consumers (Coetzee and Taylor,
1996).
© University of Pretoria

13
Figure 2.5: Set of third developed separated paired symbols (outline and solid symbols)
adapted for paired comparison test with illiterate and semi-literate consumers (Coetzee and
Taylor, 1996).
In this adapted method consumers were given a blank button and two stickers corresponding
to the sticker codes for the samples to indicate preference. Instruction was orally given.
Which of these samples do you like the most?
Thank you!!!!
Stickers
Figure 2.6: Adapted paired preference method proposed by Coetzee (2001)
© University of Pretoria

14
2.3.4 Preference Ranking
The objective of most quantitative consumer research conducted in support of product
development is to determine consumers’ affective reactions to new or revised products
(Popper et al., 2004). For preference ranking, consumers are presented with more than two
samples and instructed to order them from least preferred to most preferred (Figure 2.7)
(Kempt et al., 2009). Preference ranking is an excellent sensory technique to apply when
participants have to make decisions about different product samples that are all fairly well
liked (Stone et al., 2012). The participants are usually not allowed to have ties in the ranking.
Ranking do not give a direct estimate of the size of any difference in preference. The method
is generally considered intuitively simple and can be done quickly with relatively little bias. It
is considered as a force choice method (Lawless and Heymann, 2010).
Few studies applying the sensory ranking method using illiterate consumers was found. A
method was developed by Brich in 1979 named ranking by elimination and applied by Leon,
Couronne, Marcuz and Köster, (1999) using young children as participants. They found good
repeatability for children above 5 years. The test method was quite easy thus during the test
verbal instructions were given. Children tasted five types of biscuits following this
instruction: I want you to taste the five biscuits in front of you and to show me the one you
like the most”. The child was invited to finish the favourite biscuit. After that, they tasted
again the four remaining biscuits and showed the one they preferred. This favourite biscuit
was then also eaten or if the child did not want to eat it, eliminated from the choice set. The
process was repeated until all biscuits were ranked. The method was found to be successful
and good repeatability was observed. The method could potentially be applied with low-
literate and semi-literate adult consumers.
© University of Pretoria

15
Preference test - Ranking
Fruit Yogurt
Name:--------------------------------- Date:----------
Tester Number:---------------------------- Session code:---------
Please rinse your mouth with water before starting.
You may rinse again at any time during the test if you need to.
Please taste the five samples in the order presented, from left to right.
You may re-taste the samples once you have tried all of them.
Rank the samples from most preferred to least preferred
Using the following numbers:
1 = most preferred, 5 = least preferred
(if you have any questions, please ask the server now)
Sample Rank (1 to 5)
(ties are NOT allowed)
387 ---
589 ---
233 ---
694 ---
521 ---
Thank you for your participation,
Please return your ballot through the window to the server.
Figure 2.7: Example of preference ranking score sheet proposed by Lawless and Heymann,
(2010).
© University of Pretoria

16
2.4 Hedonic rating
The hedonic rating task represents one of the most important sensory methods used in the
food industry during product development and launching of new products in the market due
to the fact that it informs some measure of whether products are liked or not (Nicolas et al.,
2010). Over time, various measures of liking have been developed and reviewed. However,
one of the best-known measures of liking is the 9-point hedonic scale developed by Peryam
and Girardot in 1952 and introduced as an aid to menu planning for US soldiers in their
canteens (Figure 2.8) (Villanueva and Da Silva, 2009). The scale comprises a series of nine
verbal categories ranging from ‘dislike extremely’ to ‘like extremely’. The method permits
consumers to categorize foods according to how much they liked it or not (Nicolas et al.,
2010). The 9-point hedonic scale has been modified over time. Yeu et al., (2008), developed
a 9-point category scale labelled with numbers ranging from 1 to 9 and anchored only at the
left and right ends with “extremely dislike” and “extremely like,” respectively. The ends were
anchored with words to provide the direction of overall liking (Figure 2.9). Chung (2010),
presented a 9-point scale with nine empty category boxes (no numbers) labeled at appropriate
ends with ‘dislike extremely’ and ‘like extremely’ (Figure 2.10). The labeled affective
magnitude scale (LAM) (Figure 2.11) was developed to measure absolute liking. It is reliably
sensitive to difference and is as easy to use as the 9-point hedonic scale. The scale range from
“greatest imaginable dislike” to “greatest imaginable like” (Hein, et al., 2008).
Curia et al., (2001), found that the 9-point hedonic scale anchored with Spanish phrases
translated from English were not appropriate for consumers from rural areas with low income
in Argentina. The research demonstrated that 30% of the subjects ranked the translated
phrases differently in relation to the English version. They recommended the use of
numbered or unstructured scales for low income consumers in Argentina and warned that use
of the 9-point hedonic scale in languages different to English should be done with caution,
and researchers had to make sure that the general population understood the phrases in a
similar manner.
Abede, Stoecker, Hinds, and Gates, (2006), working with mothers from Southern Ethiopia,
used a five point hedonic scales from “5”= like very much, to “1” = dislike very much. To
facilitate data collection, the sensory evaluation instruments were translated from English to
Amharic, which was commonly understood by the technical team and the participants. They
also emphasized that during sensory research caution needs to be taken with language when
using adults from rural areas where literacy may be limited. The researchers recommended
© University of Pretoria

17
the use of focus group discussion during data collection as very useful and important in rural
areas.
Sosa et al., (2008), presented a 10-point scale from 1 = ‘I dislike’ to 10 =’ I like’ which they
compared with a 9-point semi-structured hedonic scale using low income, low educated
participants in Buenos Ares (Figure 2.12a). The tests were done in two different test locations
with home usage tests (HUT) and central location tests (CLT). They found that results with
the two scales were not statistically different, nevertheless some difficulties of understanding
of the box scale (Figure 2.12b) were noted. A general survey showed that the consumers
preferred the number scale (Figure 2.12b). The researchers recommended that when choosing
the most adequate scale it is important to consider not only the statistical outcome, but also
consumers’ comments and expressed choice of scale.
Another modification of the original 9-point hedonic scale used successfully with children
and illiterate consumers is facial hedonic scales (Figure 2.14), where conventional words are
replaced with faces (Lawless and Heymann, 1999). Hedonic facial scales are simple smiley
faces, but they may also be more representational involving animal cartoons or more realistic
pictures of adults (Lawless and Heymann, 1999). According to Lawless, Popper and Kroll,
(2010), hedonic facial scales may introduce unintended bias or confusion especially in
younger children. This is because a face which is intended to represent a level of dislike can
also be interpreted as conveying anger. Other difficulties with children are their shorter
attention span and their cognitive capacities which are potentially not fully developed,
consequently leading to extreme answers or random answers with low reliability (Zeinstra et
al., 2009). The same observations could possibly be observed with low -literate adults.
Coetzee (2001), proposed an adapted five faces hedonic test where the conventional verbal
scale was removed and replaced by a five point facial scale corresponding to how much the
product is liked or disliked (Figure 2.13). Consumers used stickers to stick on the
corresponding image with no assistance given. After trying several adapted methods, she
concluded that low-literate consumers reacted positively to the adapted method. However,
she emphasized that not more than two samples were evaluated by consumers during a
session. De Bruin and Minnaar, (1994), proposed a combination of a five-point facial hedonic
scale with five digital numbers 1-5. With this test method, low-literate participants received
coded samples, tasted them and then pointed to or selected on the scale the image that best
represented how much each sample was liked or disliked. They concluded that the specific
© University of Pretoria

18
test method used, together with the assistance given to assessors during evaluation, lead to a
successful completion of evaluation forms and credible results.
Bwambale et al., (2013), working with illiterate women in a rural area of Uganda (Karamoja),
implemented a novel survey technique using 10 local beads as tools of measurement. The
surveys required participants to estimate their households’ expenditures on foods, health,
education and other items using the beads. The objects of measurement could be bean seeds,
stones or beads used by local artisans, but the team used only one form of beads throughout
the survey. The field teams asked participants to think about their annual household income
and how that income was spent. Then interviewers asked participants to use the beads to
create piles that represented expenditure on different items. They found that women could
readily create piles of beads to indicate quantification of expenditure behaviour. In this case,
the field researcher can then easily convert the pile of beads into the equivalent of a 5-point
Likert scale or other scale range. For example, on a 5-point Likert scale, two beads would
equal a score of 1 while an odd number of beads would be treated as a half step between the
standard scores. They concluded that used of local beads was a feasible approach. The
technique provides an example of how locally-adapted social research methods might be
useful when illiterate participants are asked to quantify responses and the researchers believe
it can be useful in community or household surveys with illiterate or low-literate participants.
2.4.1 Facial reading techniques
If a consumer with low-literacy levels does not understand the instructions and what is
expected of them in a sensory evaluation test, how would they be able to give responses that
would accurately rate a product? Such considerations explain why the use of implicit
measures such as facial reading or instrumental facial reading could be regarded as beneficial
for understanding illiterate consumer or consumers with a low-literacy level.
Steiner (1973), studying gusto facial responses (indirect sensory test method) of infants
demonstrated that facial expressions of infants during preference tests expressed their
choices. For sour and bitter tastes, infants rejected the product by grimacing but for sweet
taste elicited positive facial responses. The method found a great interest when developing
babies’ medicine, because reading the babies facial expressions when tasting a particular
product explained the choice made by them. The same facial expression technique can also
possibly be applied with adults with low-literacy levels. Erickson et al., (2003), underlined
that facial expression is a fundamental example of illiterate behaviour, and is important to
© University of Pretoria

19
understand their emotion and social interaction. However, no research on facial expression of
adult consumers with low-literacy levels could be found.
Danner et al., (2013), presented an approach of facial reading using an instrument,
FaceReader4 (Noldus Information Technology, Wageningen, The Netherlands) which was
capable of analysing facial expression patterns from video data online and offline. The
instrument was used to test whether facial reactions measured with FaceReader4 was a
sufficiently accurate measure for differentiating between six different orange juice samples in
the Austrian market. Participants were asked to taste an orange juice sample (30 ml), take
twenty seconds to reflect on the taste impression, then give a signal with their right hand and
visualize the taste experience of the sample with a facial expression best representing their
liking of the sample. No timer was used to allow natural facial expressions and to keep the
experiment as unobtrusive as possible. Afterwards, they rated their liking or disliking of the
orange juice on a 9-point hedonic scale, ranging from 1 (like extremely) to 9 (dislike
extremely). The whole procedure was filmed with a Logitech C600 webcam, mounted on a
laptop facing the participants, using Media Recorder software (Noldus Information
Technology, Wageningen, Netherlands). They concluded that the technology is sufficiently
accurate to detect significant differences in facial expressions elicited by different orange
juice samples and can deliver additional information to conventional acceptance tests.
However, the method also presented some limitations e.g., it is difficult to use with very
young children (below the age of three years). Participants have to face the camera and the
face must not be obscured by hair. The methods will also not be appropriate with participants
that have natural “poker faces” i.e. they do not show much emotion on their faces. The test
can also be not appropriate when the tasting conditions are more complex like evaluating a
full meal.
© University of Pretoria

20
Figure 2.8: Examples of the 9-point hedonic scale designed by Peryam and Girardot, 1952,
for studying US soldier’s preferences in the field (Lim, 2011).
Figure 2-9: The 9-point category scale used by Yeu et al., (2008).
Dislike extremely
Like extremely
Figure 2.10: The 9.point empty boxes scale used by Chung, (2010).
© University of Pretoria

21
Figure 2.11: The label affective magnitude scale (LAM) (Hein, et al., 2008)
© University of Pretoria

22
Figure 2.12: Acceptability scales (a) number scale (b) box scale used by Sosa et al., (2008)
© University of Pretoria

23
Figure 2.13: Hedonic score sheet adapted for illiterate consumers by Coetzee (2001).
© University of Pretoria

24
Figure 2.14: Example of Facial Hedonic scales used for hedonic rating by children (Guinard,
2001)
© University of Pretoria

25
2.5 Qualitative analysis research using consumers with low literacy levels
While most consumer sensory test methods traditionally focus on gathering quantitative data
it may be important to also gather qualitative information when working with illiterate or
low-literate adult consumers.
Qualitative research is an umbrella concept encompassing several forms of inquiry that
facilitate understanding and explanation of the meaning of phenomena with as little
disruption as possible (Merriam, 1998). It is an investigative process where the researcher
gradually makes sense of social phenomena by entering the participants’ words through
ongoing interaction to seek the participants’ perspectives and meanings (Creswell, 2003).
Compared to quantitative research, qualitative does not depend on numerical data.
Quantitative research attempts precise measurement of something by answering questions
related to how much, how often, how many, when and who in numeric terms (Cooper and
Schindler, 2006). Qualitative research techniques seek to describe and come to terms with the
meaning and not the frequency of certain phenomena. It is typically used to answer questions
about the complex nature of a phenomenon, often focussing on describing and understanding
the phenomenon from the point of view of participants (Leedy and Ormrod, 2005).
According to Rubin and Rubin (1995), collecting data is only the beginning of the research
process. Once collected, the information has to be organised and interpreted. Qualitative
analysis of consumers’ comments can provide answers which can be numerically
summarized. The process involves coding techniques for finding and marking the underlying
ideas in the data, e.g. consumers comments, by grouping similar kinds of information
together in categories; relating different ideas and themes to one another; organising the data;
finding ideas and concepts; build overarching themes from the data; ensuring reliability and
validity in the data analysis and in the findings; and finally find possible and plausible
explanations for findings. According to Saunder et al., (2007), collecting data in qualitative
research involved two types of in-depth questions, namely unstructured and semi-structured.
With semi-structured interviews, the researcher has a list of themes and questions to be
covered. The data is recorded by either note taking of the conversation or perhaps audio-
recording or both. The order of questions may vary from one interview to the next depending
on the flow of the conversation, the interviewer or researcher guides the conversation
(Mhlanga, 2011).
© University of Pretoria

26
However, in unstructured interviews, questions are asked informally. There is no
predetermined list of questions. The participant is allowed to talk freely in relation to the
topic being explored. The conversation is guided by the interviewee (Mhlanga, 2011).
According to Ritchie (2003), a semi-structured interview provides undiluted focus on the
individual and also provides the opportunity for detailed investigation, in-depth
understanding of the personal context within which the research phenomena are located
providing the necessary personal privacy during discussion. In food sensory research, a semi-
structured interview also called one-to-one interview, is suitable for clarification of research
problems and consumers’ perspectives, identifying opportunities and generating ideal
hypotheses (Lawless and Heymann, 2010). The main interest is that the activity generate the
most variable and possible ideas and reaction about a given food prototype or variable.
Participants verbalise their opinions and expectations about the task they performed (Lawless
and Heymann, 2010).
Creswell (2003) and Kumar (2005), revealed some limitations of semi-structured interviews
such as difficulty of standardising qualitative data as it depends on the quality of interaction
between the interviewer and the interviewee. People are not equally articulated, the
interviewer might introduce bias when forming questions and interpretation of responses. It is
possible that the presence of an interviewer may affect the participant’s perceptions of the test
and interviews might provide “indirect” information through the views of the interviewees.
Practical difficulties of doing sensory testing with illiterate or consumers with low-literacy
levels
Consumers with low-literacy levels have developed some special techniques to face their
challenges such as the ability to cope (asking for immediate assistance), to cheat (trying to get
any answer from a neighbours work) thereby avoiding exposing in public their lack of
literacy. These consumers relied more on concrete thinking than abstract thinking. These
aspects might explain difficulties that researchers encounter when performing sensory
analysis tasks with this particular group of participants. In Table 2.1, we presented some
important practical difficulties that researchers might face.
© University of Pretoria

27
Table 2-1: Summary of some important practical difficulties of doing sensory testing with
illiterate or semi-literate consumers.
Difficulties Reasons or importance
Need for numerous helpers or
assistants
To describe, translate and explain correctly different
tasks to participants to ensure reliability and validity of
responses from each participant e.g. consumers cannot
read instructions on how to perform the task (Gau, et
al., 2012). Instructions need to be verbally explained.
Limitation on the number of
questions per task
Consumers struggle to read multiple questions and need
to focus on a simple task. The reading tasks have to be
limited (Gau, et al., 2012). Consumers may take a long
time to perform tasks. The time and effort for tasks may
lead to fatigue. Low-literate consumers have a short
attention span (Stone et al., 2012).
Simplification of terminology
and instructions.
The vocabulary used needs to be at the level of literacy
of participants, the questions chosen have to be clear
and simple (Gau et al., 2012).
Need for appropriate test
environment.
The environment where the consumer test is conducted
could easily influence the level of anxiety related to the
performance of the task, e.g. if the participants feel that
they are judged during the test they will feel
uncomfortable. This may affect their ability to focus on
the task. Home or an open familiar venue with less
entertainment and distractions will be favorable for
them.
Grouping of participants during
test session.
To avoid anxiety during the consumer method, it is best
to group consumers of the same educational level or
literacy level together. Individual consumers may feel
very anxious if they notice that others are coping well
while they are struggling to comprehend what is
required.
© University of Pretoria

28
2.6 Conclusions
Literacy was presented as the ability to use reading, writing and numeracy skills in order to
successfully complete any specific life task. Consumers with low-literacy levels do not make
decisions in the same way as their literate counterparts, and usually face a number of
challenges when making decisions in the marketplace or during sensory research. For
example, the individuals may be less able or unable to combine different external descriptive
cues of a particular product (pictures, symbols with written instruction) to motivate their
choices or decisions and unable to understand written messages or instructions. There is
therefore a need to develop appropriate sensory methods including a combination of non-
verbal (use of pictures, symbols) and oral modes of communication where low-literate adult
consumers will clearly understand the test instructions, and be able to perform a task without
any external assistance while giving accurate and honest responses.
© University of Pretoria

29
3 HYPOTHESES AND OBJECTIVES
3.1 Hypotheses
Adult consumers with a low level of literacy will struggle to independently complete the
conventional paired preference test (ASTM E2263, 2013) involving two food samples. This
is because such consumers do not possess the necessary reading and writing skills required.
The ability of the consumers to independently complete the test will be improved if the
requirements to read test instructions and to write responses were eliminated. Participants’
ability to correctly choose a signal sample as the preferred choice will depend on the format
by which instructions are provided.
The use of oral instructions will eliminate the requirement to read.
The use of paired symbols as sample identifiers requiring only visual interpretation
rather than three digit codes, as conventionally used in sensory studies, will eliminate
the requirement to read numbers.
The printing of the sample identifiers (symbols) on stickers that can be removed from
the food sample selected and pasted on a score sheet, will eliminate the need for any
writing involving a writing instrument.
The use of both oral and pictorial instructions will improve understanding of
instructions even more.
The addition of a positive facial image (“happy face”) on the score sheet will improve
the understanding of the requirement to make a choice based on preference.
In addition, the introduction of the proposed test elements will shorten the time taken
to complete a paired preference test, will reduce the level of anxiety of the
participants and will improve participants’ perceptions of their abilities to handle and
understand the task.
Adults with low-literacy levels possess pictorial thinking skills. For this reason instructions in
the form of pictures or photographs is a better way to give information to low-literate
consumers (Goetze and Strothotte, 2001; Sieber, 2001; Viswanathan et al., 2009). Pictorial
instructions will provide important information (e.g. it first draw low-literate participants’
attention, accentuate, reinforce, demonstrate and complement a verbal or written message),
that written instructions and even oral instructions cannot give. Adults with low-literacy
levels showed skills to listen and capture verbal data or instructions and for decision making
© University of Pretoria

30
relied strictly on verbal information e.g. radio advertising or advice or recommendations from
a friend (Riecks et al., 2003; Jae and Delvecchio, 2004).
Additionally adults with a low-literacy level interpreted with more difficulty conventional
three-digit number codes in sensory evaluation studies compared to paired symbols (Coetzee
and Taylor, 1996). The use of number codes lead to more time consumption when performing
a consumer sensory test. Participants with a low-literacy level experienced difficulty when
reading and understanding written instructions, and took more time to follow instructions,
and required more assistance from helpers (Bloomfield, 1927, Coetzee and Taylor, 1996
Goetze and Strothotte, 2001). Association of audio with pictorial instructions will provide a
better guideline and explanation of test instructions. The procedure will avoid the need to
read written instructions which is a difficult task for consumers with low literacy (Adkins and
Ozanne 2005a). Generally, written instructions enhance feelings of anxiety in low-literate
consumers. Additionally, use of sticker code symbols to indicate their choice instead of using
a pen will also reduce their level of anxiety. This is because when seeing the pen, they will
probably think of writing, which is a difficult or impossible task for these consumers.
According to Gau et al., (2012), low-literate consumers encountered this challenge when they
are forced into situations where they are expected to write.
3.2 General objective (AIM)
To develop sensory methods adequate for low-literate consumers and applicable in
developing countries.
Phase one: development of test materials
3.2.1 Objective 1
To develop formulations for two ginger biscuits that differ perceptibly but subtly in salt
content. The purpose of the biscuits was to use as test material for the paired preference test
trials with low-literate consumers.
Phase two: development of paired preference test methods
3.2.2 Objective 1
To developed variations of the conventional paired preference method (ASTM E2263, 2013)
to systematically limit reading and writing requirements.
© University of Pretoria

31
3.2.3 Objective 2
To determine the effects of variations of the basic elements to limit reading and writing and
used of a pen to indicate choice when conducting a paired preference test on task
performance by low-literate consumers.
© University of Pretoria

32
4 FORMULATION OF GINGER BISCUITS TO USE AS TEST MATERIAL FOR
SENSORY METHOD DEVELOPMENT
ABSTRACT
The aim of this part of the research was to develop formulations for two ginger biscuits that
differed perceptibly, but subtly in salt content to use as test materials for the paired
preference test trials using consumers with low-literacy levels. The two types of biscuits were
made with wheat flour. The proportions of different ingredients used were similar in both
biscuit formulations, except for salt content. The signal biscuit, which was expected to be the
more preferred option, contained 0.65% salt on a flour basic and high salt (HS) biscuit
contained 4.54%. Proximate analysis, texture analysis, Na+ content and colour analysis on
the biscuits were carried out to verify similarities and dissimilarities. A statistically
significant difference (p ˂ 0.05) was observed in moisture content, ash content, protein
content, fat content, total carbohydrate, Na+ content and texture (by instrument) of the two
biscuits. However, the biscuit did not differ significantly (p ˂ 0.05) in terms of L,* a*, b*
colour values. A panel of university students (n = 50) significantly preferred (p = 0.001) the
signal biscuit over the HS biscuit. They observed no difference in hardness between the two
biscuits (p˃0.05) in contrast to the instrumental analysis. The HS biscuit was perceptibly
more salty compared to the signal biscuit.
Key words: biscuit, low-literacy, paired preference, proximate analysis, salt
© University of Pretoria

33
4.1 Introduction
The purpose of this part of the study was to develop test materials suitable for the sensory
method development phase. The research focused on the paired preference method (ASTM
E2263, 2013) and the aim was to adapt the method in such a way that low-literate or illiterate
consumers would be able to complete the required task independently. For the paired
preference method only two food samples are compared. Biscuits were selected as test
material because it has a long shelf life, is a relatively low cost food product and it is
generally and widely accepted by all age groups and socio economic consumer groups
(Hossain et al., 2013). Ginger biscuits is a popular type of biscuit in South Africa (F2M Food
Multimedias, 2007).
The requirements for the test material were decided a priory. The main requirements for such
test materials is that the products should only differ in one attribute, in this case salty taste.
The different units (biscuits) should be homogenous and prepared in a standardised way with
no visual or texture differences. The development of test materials such as biscuits that differ
perceptibly but subtly in salt content was selected as test material to create a signal
(preferred) sample and a distractor or noise sample. The ease of varying the salt content of
biscuits, and a generally expected dislike of a noticeable ‘salty’ taste in a sweet ginger
biscuit, motivated the decision.
4.2 Objectives
The objective of this part of the project was to develop formulations for two ginger biscuits
that differed perceptibly but subtly in salt content to use as test materials for paired
preference test trials with consumers with low-literacy levels.
4.3 Material and methods
4.3.1 Biscuit formulations
Two ginger biscuit formulations (Table 4-1) were developed according to a recipe described
on a web page (http://www.hulettssugar.co.za) of Huletts sugar® (Tongaat Huletts sugar
Durban South Africa).
© University of Pretoria

34
Table 4-1: Different expressions of the formulations for ginger biscuits that differ in salty
taste used as test material during this study.
Baker’s percentage= (mass ingredient (g) /mass flour (g))*100 (Marcotte and Ramaswamy,
2005); (-) not applicable
4.3.2 Biscuit preparation
Dry ingredients (cake flour, cream of tartar, ground ginger, salt, sweet brown sugar) were
weighed, mixed together in a bowl with a Kenwood Chef Excel mixer (Kenwood,
Maraisburg, South Africa) starting at the minimum speed and gradually increasing the speed
to speed two for three minutes. Margarine was added to the dry ingredients then rubbed with
hand, until the mixture resembled fine breadcrumbs. The mixture of beaten eggs, golden
syrup and bicarbonate of soda dissolved in milk, was added to the dry ingredients and mixed
starting at the minimum speed and gradually increasing to speed two for four minutes. After
the dough was chilled for 1h at 6 0C, it was sheeted on a rectangular baking tray (295 x
197mm) to 5mm thickness, using a plastic dough rolling pin. The rolling action was stopped
when the dough was well flat and with a cylinder steel cutter (diameter 4cm), the dough was
cut to approximately 9 g biscuits. The biscuits were put on a greased oven tray. The biscuits
© University of Pretoria

35
were baked using a pre-heated convection oven (Unox model XV30G oven Padova, Italy,) at
180 0C for 11min at 75% dryness until cooked and brown. Then biscuits were cooled for 30
min at room temperature (27 0C) and finally transferred to a dry clean plastic container for
storage. Approximately 800 biscuits were baked for the two treatments.
4.3.3 Proximate analysis
4.3.3.1 Moisture content
Moisture content of the biscuits was determined by the AACC International (2000) method
44-15A. In triplicate, ground biscuit samples of 2 g was dried at 105 0C for 4 h. Moisture
content was obtained by calculating loss in moisture as percentage of the original wet weight
of the sample.
4.3.3.2 Ash content
Ash content was determined using the AACC International (2000) method 08-01. A 2 g
sample of ground biscuits was heated in a silica crucible at 550 0C for 5 h using a muffle
furnace oven. Ash content was obtained by calculating the weight of the residue as a
percentage of the original sample weight. The analysis was done in triplicate.
4.3.3.3 Fat content
Fat content was determined by the Soxhlet extraction method 30-25 (AACC International,
2000). Biscuit samples of 3 g were weighed into an extraction thimble and fat extracted for 1
h using petroleum ether (40- 60 0C). The petroleum ether extract was dried in an oven at 103
0C for 30 min. Total fat content was obtained by calculating weight of extract as a percentage
of original sample weight. The analysis was done in triplicate.
4.3.3.4 Protein content
Protein content was determined by Dumas combustion method 46-30 (AACC International,
2000). It is based on combustion of the whole sample in an oxygen-enriched atmosphere at a
high temperature (950 0C) in order to ensure complete combustion. The gases are then passed
over special columns (such as potassium hydroxide aqueous solution) that absorb the carbon
dioxide and water. A column containing a thermal conductivity detector at the end is then
used to separate the nitrogen from any residual carbon dioxide and water and the remaining
nitrogen content is then measured. The nitrogen content measured was then multiplied with a
factor 5.70 (protein = N x 5.70) to convert nitrogen content into protein content. The analysis
was done in triplicate.
© University of Pretoria

36
4.3.3.5 Carbohydrate content
Carbohydrate content of the biscuits was calculated by difference. Percentage Carbohydrate =
[100 - (moisture%+ protein%+ fat% +ash %)] (Food and Agriculture Organisation, 2003).
4.3.4 Sodium content
Sodium content of the two biscuit formulations was determined using AOAC method 935.13
(AOAC, 2000). The analysis was done at Nutrilab University of Pretoria. The analysis was
done in triplicate.
4.3.5 Texture analysis of biscuits
For texture analysis of the biscuits the EZ-Test analyser (Model EZ-L, Shimadzu Tokyo
Japan) was used for analysing the breaking force. The test speed was 30 mm/min, and the
grip was a 3-point bend rig. The distance between the two steel bars supporting a biscuit was
30mm. The data were recorded as breaking force in Newton. The analysis was performed in
triplicate.
4.3.6 Colour analysis
The colour values L*, a*, b* of the top of each biscuit type was determined using a Chroma
meter (CR-400/410 from Konica Minolta, Okasa, Japan). The measurement was done in
triplicate and three biscuits were randomly chosen in each batch of biscuits. The L* value
gives a measure of lightness of the product from 100 for perfect white and zero for black. The
a* value accounted for redness (+) and greenness (-) while b* value accounted for yellowness
(-), and blueness (+) respectively. A white tile (L*= 96.76, a*= 0.12 and b*= 1.80) was used to
calibrate the Chroma meter before used. The measurement was taken at the middle upper side
of selected biscuits.
4.3.7 Paired comparison tests for the saltiness, hardness and preference of biscuits
Three different sets of paired comparison tests were conducted respectively to confirm that
the HS biscuit was noticeably more salty (n = 49), to compare the hardness (n = 51) of the
two biscuits and measure the preference for the biscuits. Two blind coded ginger biscuits
were served to consumers (university students) who participated in the different tests. The
test conditions were select based on the paired comparison method (ASTM E2263, 2013).
The test was conducted in the sensory laboratory of University of Pretoria. During the test,
participants tasted two blind coded biscuits (signal and HS biscuit). They had to take a sip of
water to rinse out their palate before and in between samples and were asked to select the
more salty/harder/more preferred biscuit depending on the objective of the test. The test
© University of Pretoria

37
instruction was displayed on computer screen and data collected using Compusense Five ®
release 5.4 (Compusense Inc, Guelp Canada).
4.3.8 Statistical analysis
Paired sample t-tests were conducted to determine whether there were significant differences
(p < 0.05) in the chemical analyses, texture and colour measurements between the two types
of biscuit using Statistica Version 11 (Statsoft, Tulsa, OK, USA). All the paired comparison
results were analysed using the Binomial distribution test (Excel Microsoft Office version
2010, Microsoft Corporation Santa Rosa California USA).
4.4 Results
Table 4.2 compares results of proximate analysis, sodium content, texture analysis, colour
analysis and sensory evaluation of the two biscuits. It revealed that there were significant
difference between the two biscuits in their proximate analysis, sodium content, and texture
analysis at (p < 0.05). No significant difference was observed between the two biscuits on
colour analysis. Paired preference analysis results revealed that no significant difference in
hardness was observed between the two biscuits). The HS biscuit was perceived as more salty
than the signal biscuit (p < 0.05) and the signal biscuit was preferred by more participants (p
< 0.05).
© University of Pretoria

38
Table 4-2: Physicochemical analyses and sensory evaluation of the biscuits
Except for the paired comparison analyses, values are expressed as Mean ± SD (Mean ±
standard deviation); Values in the same row followed by a different superscript letter differ
significantly at (p < 0.05).
4.5 Discussion
During dough formation and baking of the biscuits very complex reactions occurs such as
ionic and disulfide bonds formation, protein hydration, water evaporation and browning of
the biscuits (Wieser, 2007). The result showed that the amount of salt used as an ingredient
(0.64% or 4.48%) in the biscuits affected the final moisture content of the biscuits. The same
quantity of milk (source of moisture) was used for the two types of biscuits. When more salt
was added, the moisture content was significantly lower. This could be linked to the capacity
of salt to bind water molecules from the surrounding environment (e.g. from milk), during
dough formation and thus reduce the free moisture content of biscuit (Fu, Sapirstein and
Bushuk, 1996). Indrani and Rao (2007) reported similar results in a study to determine the
effect of salt on rheological characteristics of wheat flour dough. They concluded that when
salt concentration in the dough increased the toughness of the dough increased and the
moisture content of the final product was reduced. The values for moisture content of the two
© University of Pretoria

39
biscuits were acceptable considering the recommended value for ginger biscuit which is
below 7% as proposed by Filipcev et al., (2011).
Measurement of ash content determines the inorganic matter in the biscuit. The higher ash
content of the HS biscuit confirmed the higher salt proportion initially added as an ingredient.
In this study, both biscuits types (signal and HS) had higher ash content compared to the
general biscuit ash content of 1.0% (Hossain et al., 2013).
The fat and protein content of the two types of biscuits were significantly different (p = 0.01).
These differences are related to the initial proportion of fat or protein contributing sources in
the two biscuits as a result of the difference in salt content. The fat content of the two biscuits
were less than what is generally reported for biscuits (18.5%), while protein content of the
two biscuits were similar to values reported for biscuits (7.1%) by Hossain et al., ( 2013).
The carbohydrate content differed significant (p = 0.02) between the two biscuits. The
difference could be related to the different proportions of dry ingredients per biscuit initially
used. The value of total carbohydrate content for the two biscuit were slightly lower than the
values reported for wheat biscuit (78.23%) by Hossain et al., (2013).
The breaking force of the two biscuits was significantly different (p = 0.01). The salty biscuit
(HS) required more force to break. Indrani and Rao (2007), found when studying the
rheological characteristics of wheat flour dough, that as the concentration of salt increased the
toughness of the wheat dough (tightness of the gluten network) increased (measured as
resistance to extension). They related this to the action of bonds formed during biscuit
making such as hydrogen bonds, disulfide bonds and ionic bonds established between
protein-protein and protein-salt molecules. In addition, the capability of salt to cause
electrostatic shielding of charged amino acids on the surface of gluten proteins resulted in
increased inter-protein hydrophobic and hydrophilic interactions (Indrani and Rao, 2007).
The result for the paired comparison test for salty taste between the two biscuits revealed that
the HS biscuit was clearly perceived as more salty compared to the signal biscuit (p = 0.001).
They was no difference in the hardness of the two biscuits by the sensory panel result (p =
0.168) which was contrary to the difference in breaking force differed detected using
instrumental analysis. According to Hegenbart, (1998), it is difficult to compare human
perception of bite or mouth feel to the values obtained from an instrumental texture analysis.
The instrumental measurement measured the equivalent of only one bite, while the human
panel bite and chew, and combine with saliva interaction. It is limitation to describe and
© University of Pretoria

40
compare texture or mouthfeel by a single value obtained from an instrument. Furthermore,
perceived texture involves a food's entire physical and chemical interaction in the mouth from
initial perception on the palate, to first bite, through mastication. The result for comparison
test for biscuit preference revealed that the signal biscuit was more preferred than the salty
biscuit (HS).
4.6 Conclusions
The purpose of this phase of the research was to develop test materials to use for the next
phase of comparing different methods of presenting the paired preference test method to low-
literate consumers. It can be concluded that the high salt biscuit was perceptibly more salty
compared to the signal biscuit. Slight differences in moisture, protein, fat, total carbohydrate
and ash content were observed. It took greater force to break the high salt biscuit using the
instrumental method; however, consumers did not perceive a significant difference in
hardness between the signal and salty biscuit. The signal biscuit was more preferred than the
HS biscuit. The test material was therefore considered appropriate for the next phase.
© University of Pretoria

41
5 THE EFFECTS OF VARIATION OF THE BASIC ELEMENTS OF THE PAIRED
PREFERENCE SENSORY TEST METHOD ON TASK PERFORMANCE BY
CONSUMERS WITH LOW-LEVELS OF LITERACY.
ABSTRACT
Consumers with low-literacy levels represent a substantial percentage of consumers in
emerging markets. Sensory science has not focussed much on developing test methods for this
consumer segment. Incorrect decisions about products may be made because conventional
consumer sensory methods take literacy and language capabilities of participants for
granted. Preference tests are widely applied in consumer sensory research. Consumers with
low-literacy levels are often unable to read instructions and complete evaluation sheets. The
aim of this research was to develop variations of the conventional paired preference method
(to limit reading and writing requirements) and to determine the effects of variations of the
basic elements of the method (instructions, sample coding, and method of indicating choice)
on task performance by low-literate consumers. Participants (n = 350) were randomly
assigned to seven groups of 50 each. For consumers with low-literacy levels the conventional
method was inefficient (48% of participants were unable to perform the task independently)
and time-consuming with a mean time of 5.6 min taken per participant. The efficiency of the
paired preference method was improved (only 18% of participants were unable to perform
the task independently) and the time to complete the test was reduced to 4.2 min per
participant. The use of a combination of picture and audio instructions, the use of symbols
rather than 3-digit number codes for sample identification and the instruction to pull the
coding sticker from the sample chosen and to stick it on a positive smiling face (rather than
any writing task) was identified as the most promising paired preference method for
independent completion by low-literate consumers.
Key words: low-literate, paired preference, symbols codes, coding sticker, 3-digit number,
positive smiling face, picture instructions, audio instructions.
© University of Pretoria

42
5.1 Introduction
The UNESCO Institute of Statistics (USI), in their September 2014 review on literacy
revealed that 24% of all illiterate adults live in sub-Saharan Africa (USI, 2014). In South
Africa it is estimated that between 7.4 and 8.5 million adults are functionally illiterate and
that between 2.9 and 4.2 million people have never attended school (International literacy
day, 2015).This represents a substantial percentage of the population and an important group
of food consumers in that region.
Literacy is a dynamic concept and is changing to embrace multiple approaches. Fingeret
(1994) defined literacy as “the ability to respond appropriately to written language”. The
Oxford English Dictionary defines it as “the ability to read and write” and the inability to do
so is called illiteracy. Adkins and Ozanne (2005a), defined consumers with low-literacy
levels, as people that lack reading proficiency to fill out basic forms or read simple
instructions. These consumers rely heavily on nonverbal communication (gestures, facial
expression, and tone of voice).
In sensory research, conventional consumer test methods take literacy and language
capabilities of consumers mostly for granted (Coetzee and Taylor, 1996). The conventional
paired preference test (ASTM E2263, 2013) requires participants to read instructions and
then indicate which one of two samples is preferred. The choice is usually indicated by
marking (with a writing instrument e.g. pen), the code, a randomly selected three digit code
number, of the sample chosen. The tests may also be administered on a computer or mobile
device screen which would require reading and basic computer operation skills. The test may
also be administered by a trained interviewer on a one-to-one basis, a strategy often also used
with young children. One of the reasons why some food products fail in the market might be
because consumers do not clearly understand instructions during product acceptance or
preference tests, which may lead to wrong conclusions and product decisions by researchers
(Coetzee and Taylor, 1996). Consumers with a low-literacy level are often unable to read
instructions and complete evaluation sheets, or make a choice on a scale to indicate their
preference (Coetzee and Taylor, 1996).
Consumers with low-literacy levels represent a marginalized or worse, ignored group in
sensory testing, and are under-represented in market research (Curia et al., 2001).
Administering a consumer sensory test on an interview basis is time consuming and labour
intensive. There is also a risk that the interviewer / test administrator may consciously or
© University of Pretoria

43
unconsciously influence the choices of participants. Development of suitable modified
sensory test strategies to determine preference or hedonic ratings from consumers with a low
level of literacy might contribute to ameliorate consumers’ performance during such tests and
increase the reliability and validity of responses. It could improve understanding of
consumers’ attitudes when it comes to making choices during sensory research. More
intuitive methods that limit reading and writing tasks may also be useful to allow independent
completion of the task by consumers with low-literacy levels.
5.2 Objectives
The objective of this research was to develop variations of the conventional paired preference
method to limit reading and writing requirements and to determine the effects of variations of
the basic elements of the paired preference sensory test method on task performance by
consumers with low-literacy levels.
5.3 Materials and Methods
Figure 5.1 shows the experiment design of this study. The graphic symbols used were
obtained using commercially available online software BoardMaker (Pittsburgh, PA. USA)
© University of Pretoria

44
Figure 5.1: Design of experiment to measure the effects of variations of the basic elements of the paired preference sensory test method on the
task performance by consumers with low-literacy levels. Pictures of audio, listening, reading instructions were accessed from Mayer-Johnson,
(1985).
© University of Pretoria

45
5.4 Test materials
Two biscuits (described in Chapter 4), a signal (higher probability of being preferred) and a
high salt variant were used as test materials for the study. Each consumer received, in random
order, one biscuit of each type packed in a zip lock plastic bag (30mm x 25mm).
5.4.1.1 Participants and test location
A recruitment agent familiar with the literacy level of the target community surrounding the
test location on the University of Pretoria Mamelodi campus (located northeast of Pretoria,
South Africa), was hired to recruit 350 participants from the area according to a recruitment
screener questionnaire.
5.4.1.2 Audio instructions, picture instructions and coding
Sound recordings of a female voice reading instructions in English for the various paired
preference test variations were recorded using a Blackberry 9300 cell phone. For picture
instructions, a series of 8 photos were taken using a Canon E50 camera demonstrating the
different steps of the paired preference test. The photographs were printed on a poster (1088
mm X 840 mm) in order of the test evolution from top to bottom (Figure 2). Five series of
paired symbols were developed for non-numeric sample coding purposes (Figure 3) and
printed on white stickers. A series of randomly selected three digits number codes was
generated using Compusense Five ® release 5.4 software (Compusense Inc, Guelph, Ontario,
Canada) and printed on white stickers.
5.5 Methods
5.5.1.1 Method 1: Conventional paired preference test (ASTM E2263, 2013).
Each participant received the two biscuits coded with randomly selected three digit numbers,
a pen, a score sheet, serviette and a glass of water on a white tray. Participants were asked to
perform the test following the written instructions on the score sheet (Appendix A1). No
further assistance was given.
5.5.1.2 Method 2: Paired preference test with audio instructions
Each participant received the two biscuits coded with randomly selected three digit numbers,
a pen, and a score sheet with no written instructions, a serviette and a glass of water on a
white tray. The participants were asked to listen to audio instructions (Audio 1) for the test,
which were played using a computer (Appendix A2). No further assistance was given.
© University of Pretoria

46
5.5.1.3 Method 3: Paired preference test with audio instructions and non-numeric
symbol codes
Each participant received the two biscuits coded with paired symbols (Figure 5.3), a pen to
indicate which symbol was chosen, a score sheet with no written instructions, a serviette and
a glass of water on a white tray. The participants were asked to listen to the audio instructions
(Audio 2) for the test which were played using a computer. (Appendix A3). No further
assistance was given.
5.5.1.4 Method 4: Paired preference test with audio instructions, non-numeric symbol
codes and no writing task
Each participant received the two biscuits coded with paired symbols (Figure 5.3), a score
sheet with no written instructions, but an open box for sticking the selected symbol sticker, a
serviette and a glass of water on a white tray. The participants were asked to listen to audio
instructions (Audio 3) for the test, which were played using a computer (Appendix A4). No
further assistance was given.
5.5.1.5 Method 5: Paired preference test with audio instructions, non-numeric symbol
codes, no writing task, positive hedonic face as motivation
Each participant received the two biscuits coded with paired symbols (Figure 5.3), a score
sheet with no written instructions, only a box with a happy face in the middle for sticking the
selected symbol sticker, a serviette and a glass of water on a white tray. The participants were
asked to listen to audio instructions (Audio 4) for the test, which were played using a
computer (Appendix A5). No further assistance was given.
5.5.1.6 Method 6: Paired preference test with photograph instructions, non-numeric
symbol codes, no writing task, positive hedonic face as motivation
Each participant received the two biscuits coded with paired symbols (Figure 5.3), a score
sheet with no written instructions, only a box with the happy face in the middle for sticking
the selected symbol sticker, a serviette and a glass of water on a white tray. A poster with a
series of pictorial instructions (Figure 2), were available on the wall. Participants were asked
to perform the test following the pictorial instructions (Appendix A6). No further assistance
was given.
5.5.1.7 Method 7: Paired preference test with audio and photograph instructions, non-
numeric symbol codes, no writing task, positive hedonic face as motivation
Each participant received the two biscuits coded with paired symbols (Figure 5.3), a score
sheet with no written instructions, only a box with a happy face in the middle for sticking the
selected symbol sticker, a serviette and a glass of water on a white tray. A poster with a series
© University of Pretoria
47
of pictorial instructions (Figure 5.2), were available on the wall. The participants were asked
to listen to audio instructions (Audio 5) for the test played using a computer. The audio also
instructed the participants to follow the pictorial instructions. (Appendix A7). No further
assistance was given.
5.6 Test procedure
The consumer testing was done during two days. Participants were allocated with an
individual identification number (UpXi) where X represents the test method number 1 – 7 and
i the number of the participant per test method (1-50). Nine student assistants from University
of Pretoria were trained (using role playing exercises) to administer the tests and collect the
data, this with the aid of a specialist from the Center for Augmentative and Alternative
Communication (CAAC). The assistants were aware of the overall purpose and specific
objective of the study. All the participants were trained to handle correctly all the seven
methods. Seven participants, one per method participated simultaneously at a time.
Participants were greeted and directed to one of the seven test stations, where the assistant in
charge of the station presented himself and briefly directed the participants to proceed with
the test. During the test, the participants were individually seated at tables. Assistants
completed the first part of the qualitative interview {observation of participant’s gender,
rating of anxiety level of different participants while performing the test using a facial
affective scale (FAS) [1= no anxiety to 6= very anxious] (Goodenough et al., 1999) and
recorded the time taken to complete the task (the starting time was taken immediately after
the participant received the tray and the end time after he/she confirmed to the assistant that
he/she was done)}. Assistants also observed and wrote comments about the attitude and
actions of participants from receiving the tray with samples until the end of the task. Only
when a participant confirmed that they completed the test, assistants carried on with the
second part of the questionnaire to obtain information through a semi structured face to face
interview. Assistants asked the home language of each of the participants, highest school
level, participants’ age and the general perceptions and opinion about the test they performed.
At the end of the interview assistants asked participants whether or not the responses that
they gave could be included in the data set for analysis and reporting thus obtaining verbal
consent to use the data. During the interview, a person was available to assist with translation
of English to the home language of participants, when necessary. After the interview,
assistants directed participants to the exit to receive a store voucher (R50) to thank them for
© University of Pretoria

48
participating. The study was approved by the Ethics committee of the Faculty of Natural
Sciences, University of Pretoria (EC141125-095).
5.7 Statistical analysis of qualitative and quantitative data
The numbers of consumers speaking specific languages as home language were analysed
using descriptive statistics. One-way analysis of variance (ANOVA) using SPSS version
22.00, IBM New York, United States was used to determine whether there were significant
differences (p < 0.05) among the test methods for age of participants, anxiety level and time
taken to complete the test. If significant differences were found, then means were separated
using Fisher's Least Significant Difference (LSD) test at p < 0.05. Paired preference test
result were analysed according to the ASTM E2263, (2013) applying a one sided test. When
n=50 participants, significant preference for one of the biscuits was observed with a
minimum of n=28 participants selecting one of the biscuits. Participants’ comments regarding
the ease of completing the task and assistants comments were first coded (using appropriated
words, which expressed their comments e.g. a sentence from participant “I didn’t know what
to do with all this” was coded as “instruction difficulty”), then analyse using Atlas.ti version
6.1.1 software (ATLAS.ti, GmbH, Berlin). Coded concepts were expressed as percentages of
the total number of participants per method. The Chi-square test using XLSTAT Software
version 8.0 (Addinsoft, New York City, USA) was used to compare, gender groupings per
method, percentage of participants that did not struggle to follow the test instruction per
method, percentage of participants that regarded the task as difficult to understand. Chi-
square test using XLSTAT software 8.0 (Addinsoft, New York City, USA) was used to look
at the association between participants’ perception of different task performed and the
specific method.
© University of Pretoria

49
Figure 5.2: Pictorial instructions used to describe different steps for completing the paired preference test. Pictures were presented vertically on a
poster in order of test evolution from 1 to 8 (Methods 6 and 7).
© University of Pretoria

50
*Note that the symbols used for the instructions were different from those used by
participants
Figure 5.3: Pairs of geometrical symbols used as coding symbols for methods 3, 4, 5, 6, 7.
© University of Pretoria

51
5.8 Results
5.8.1 Demographic results
Figure 5.4 shows the general percentage distribution of participants indicating one of the SA
(South Africa) official languages as home language. Sepedi was the home language of at least
38% of participants, followed by Sesotho (17 %) and Isizulu (17 %). Less than 1 % of the
participants indicated English as home language. Figure 5.5 presents the distribution of
participants by method that speaks a specific home language.
Results in Table 5-1 provide information on gender and age distribution of participants per
method. There was a significant difference in gender distribution of participants over the
methods. Method 3 was the only test method where males were more represented compared
to other methods where more females participated. A total of 62% participants were females
and 38% males. The group of participants consisted of 89% participants who indicated that
they attended grade 7 or higher education level and 11% indicated that they never attended
school or attended school up to grade 6. They were all South African, 99% indicated
speaking one of the eleven South African official languages as mother tongue and 1%
indicated speaking another language. Participants’ ages ranged between 18 and 55 years. The
average age of participants for test method 6 was significantly lower than those completing
test methods 2 and 4.
© University of Pretoria

52
Figure 5.4: Distribution of % participants that speak a specific home language (n=350).
37.7
16.57 16.51
6.28 6.28 6
3.14 2.571.71 1.71 1.14
0.280
5
10
15
20
25
30
35
40%
of
par
tici
pan
ts
Home language
© University of Pretoria
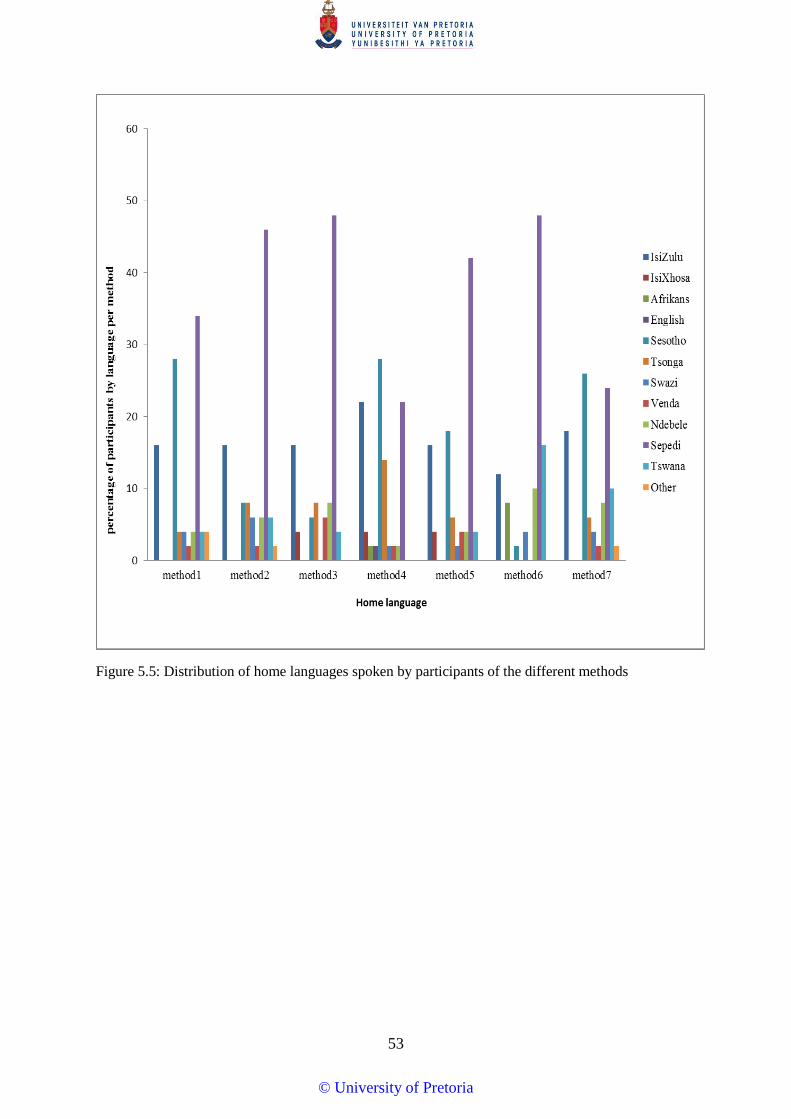
53
Figure 5.5: Distribution of home languages spoken by participants of the different methods
© University of Pretoria

54
Table 5-1: Gender distribution and average age of participants per test method (n=50 per test
method)
Age values in a row with different superscript letters (a, b, c, d) are significantly different at
(p<0.05).
5.8.2 Quantitative analyses results
5.8.2.1 Paired preference analyses
Table 5-2 provides a summary of participants’ results for the different variations of the paired
preference method analysed separately for participants that completed the test method
independently (not assisted) and those that completed the task with some assistance, average
time taken for the task and indication of anxiety level of participants per method. Results
indicated method 6 as the test method where no significant preference was found between the
two biscuits. Methods 1, 2, 3, 4, 5 and 7 concluded a significant preference (p ˂ 0.05) for the
signal biscuit. Test method 5 was the test where a large number of participants (n = 12)
selected both biscuits. However, test method 7 was the test where a large number of
participants were able to perform the test independently.
A significant difference (p ˂ 0.05) was observed in the time taken to complete the test
methods. The time taken to complete the test increased significantly in the following order:
Method 5 took the least time, and then methods 3 and 4 followed by methods 2 and 7, and
methods 1 and 6 required the most time. The anxiety levels of participants’ participating in
the different method where significant different (p ˂ 0.05). Participants in test method 1
appeared less anxious compared to those completing methods 2, 3, 4, 5, 6 and 7.
© University of Pretoria

55
Table 5-2: Paired preference test results analysed separately for participants that completed the test independently (not assisted) and those that
completed the task with some assistance, anxieties level of participants and time taken to complete the test.
A: Assisted; NA: Not assisted; S: signal biscuit; NP: no preference; (0*): no assistance given. For time and anxiety level, values in a row with
different superscript (a, b, c, d) letter significantly differ at (p<0.05).
© University of Pretoria

56
5.8.3 Qualitative analyses
Table 5-3 presents the analyses of the assistants’ observations, comments on participants’
attitudes and generals’ skills (capability of understanding the test instruction and participants’
ability to us the test tools) while performing the different test methods. The results revealed
that more participants had difficulties to follow the test instructions of test method 6. While a
significantly higher number of participants were able to easily follow the instruction for test
method 7. Significantly, more participants did not appear confident while performing test
method 6 compared to test method 7. Some difficulties of using test material such as opening
a zip log bag with methods 1 and 3, difficulties of writing (use of pen) and reading, as well as
medical reasons (e.g. visual impaired), were noted. However, the frequencies of these
observations were quite low.
Analyses of participants’ perception of the tasks (Table 5-4) revealed that participants’
perception of the different test methods was significantly different and depending on the task
they performed. Significantly more participants rated test method 6 as difficult, while very
few consumers rated methods 3 and 7 as difficult. Significantly, fewer participants
commented that methods 4 and 6 were easy compared to the other methods.
Participants’ responses to the question about how they perceived the task (Table 5-5)
revealed that a larger number of participants (90%) indicated that instructions for test method
7 compared to the other methods positively reinforced their performance. Comparatively
more participants perceived the test instructions of test method 6 as difficult to understand
e.g. 38% compare to 8% for method 7. For test method 1 comparatively more participants
(28%) claimed that the taste of the biscuits positively contributed to their perception of the
ease of performing the task compared to 2% for test method 7. Cases of failure to perform
the task by some participants after they received assistance was recorded for test method 1
and 5, respectively 2% and 6% of participants; also inconsistent verbal response (incoherence
between what participants said about the test they performed compared to what was observed
in terms of their performance) was noted for methods 1, 3, 5, and 6, with an exceptionally
high percentage (30%) for test method 3.
Table 5-6 is a summary of observations of action of participants as reported by assistants
while performing the different test methods and assistants’ comments on observation of
participants during each test method.
© University of Pretoria

57
Table 5-3: Grouping (expressed as percentage of participants per test method) of observations, from assistants regarding the reasons why
participants struggled with a test method.
(-) Not cited as a reason by assistants; 0*: no assistance given
Description coded words:
Difficulty to follow the instructions:
Method1: represented difficulty with reading and understanding of test instruction
Methods 2, 3, 4, and 5: represented difficulty to understand audio instruction combined with assistance (e.g. requested that audio instructions be replayed),
Method 6: (-) no assistance given
Method 7: represented difficulty of understanding pictorial instructions and/or audio instructions
© University of Pretoria

58
Table 5-4: Cross tabulation table (Task * methods) of participants’ perceptions of the ease of performing the different test methods in response to
the question “How did you perceive the task?” (n=50 participants per test method)
© University of Pretoria

59
Table 5-5: Grouping of comments mentioned by participants’ (expressed as a percentage of total number of participants per method) after rating
the ease of performing a test method and responding to the question “You said it was (easy, okay or difficult), why?”
(-): Not noted
Instruction difficulty:
Method 1: described the difficulty of reading.
Methods 3, 4, 5: described the difficulty of understanding audio instructions (language, sound, speed of instructions)
Method 6: described the difficulty of understanding picture instructions
Method 7: described the difficulty of both picture and audio instructions
© University of Pretoria
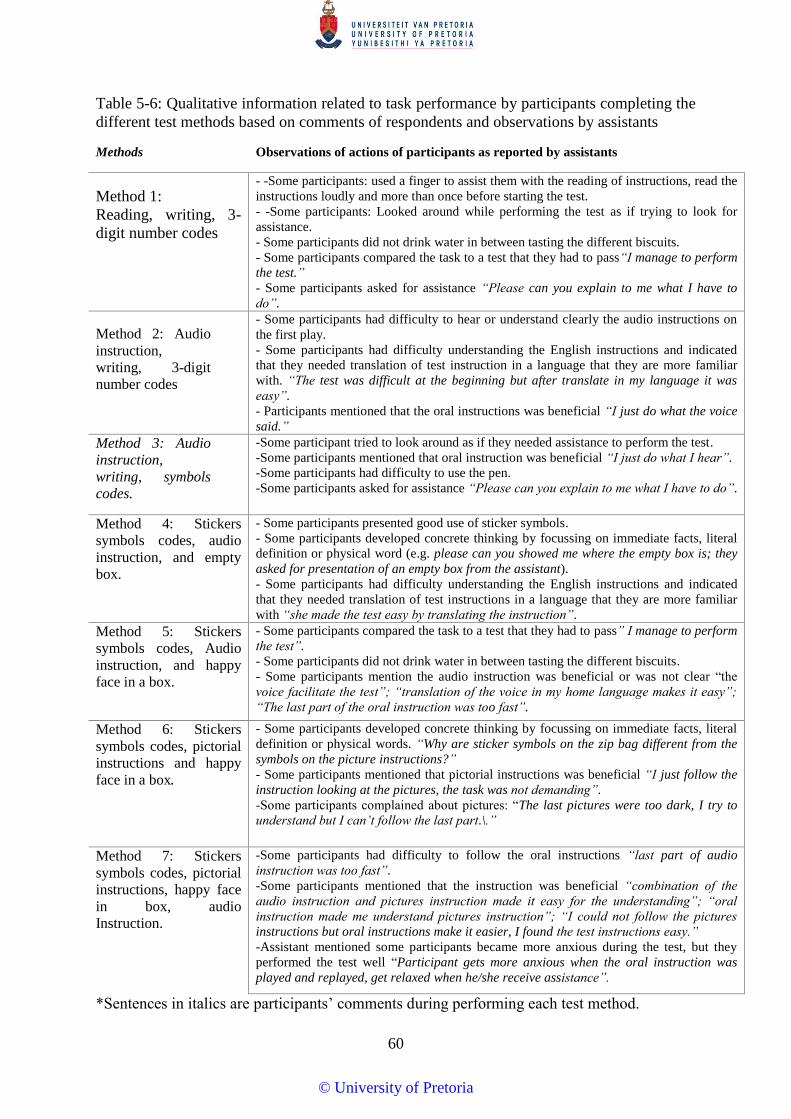
60
Table 5-6: Qualitative information related to task performance by participants completing the
different test methods based on comments of respondents and observations by assistants
Methods Observations of actions of participants as reported by assistants
Method 1:
Reading, writing, 3-
digit number codes
- -Some participants: used a finger to assist them with the reading of instructions, read the
instructions loudly and more than once before starting the test.
- -Some participants: Looked around while performing the test as if trying to look for
assistance.
- Some participants did not drink water in between tasting the different biscuits.
- Some participants compared the task to a test that they had to pass“I manage to perform
the test.”
- Some participants asked for assistance “Please can you explain to me what I have to
do”.
Method 2: Audio
instruction,
writing, 3-digit
number codes
- Some participants had difficulty to hear or understand clearly the audio instructions on
the first play.
- Some participants had difficulty understanding the English instructions and indicated
that they needed translation of test instruction in a language that they are more familiar
with. “The test was difficult at the beginning but after translate in my language it was
easy”.
- Participants mentioned that the oral instructions was beneficial “I just do what the voice
said.”
Method 3: Audio
instruction,
writing, symbols
codes.
-Some participant tried to look around as if they needed assistance to perform the test.
-Some participants mentioned that oral instruction was beneficial “I just do what I hear”.
-Some participants had difficulty to use the pen.
-Some participants asked for assistance “Please can you explain to me what I have to do”.
Method 4: Stickers
symbols codes, audio
instruction, and empty
box.
- Some participants presented good use of sticker symbols.
- Some participants developed concrete thinking by focussing on immediate facts, literal
definition or physical word (e.g. please can you showed me where the empty box is; they
asked for presentation of an empty box from the assistant).
- Some participants had difficulty understanding the English instructions and indicated
that they needed translation of test instructions in a language that they are more familiar
with “she made the test easy by translating the instruction”.
Method 5: Stickers
symbols codes, Audio
instruction, and happy
face in a box.
- Some participants compared the task to a test that they had to pass” I manage to perform
the test”.
- Some participants did not drink water in between tasting the different biscuits.
- Some participants mention the audio instruction was beneficial or was not clear “the
voice facilitate the test”; “translation of the voice in my home language makes it easy”;
“The last part of the oral instruction was too fast”.
Method 6: Stickers
symbols codes, pictorial
instructions and happy
face in a box.
- Some participants developed concrete thinking by focussing on immediate facts, literal
definition or physical words. “Why are sticker symbols on the zip bag different from the
symbols on the picture instructions?”
- Some participants mentioned that pictorial instructions was beneficial “I just follow the
instruction looking at the pictures, the task was not demanding”.
-Some participants complained about pictures: “The last pictures were too dark, I try to
understand but I can’t follow the last part.\.”
Method 7: Stickers
symbols codes, pictorial
instructions, happy face
in box, audio
Instruction.
-Some participants had difficulty to follow the oral instructions “last part of audio
instruction was too fast”.
-Some participants mentioned that the instruction was beneficial “combination of the
audio instruction and pictures instruction made it easy for the understanding”; “oral
instruction made me understand pictures instruction”; “I could not follow the pictures
instructions but oral instructions make it easier, I found the test instructions easy.”
-Assistant mentioned some participants became more anxious during the test, but they
performed the test well “Participant gets more anxious when the oral instruction was
played and replayed, get relaxed when he/she receive assistance”.
*Sentences in italics are participants’ comments during performing each test method.
© University of Pretoria

61
5.9 Discussion
5.9.1 Language of communication
English was used as the primary language of communication for this experiment. It should be
noted that only one person (1/350) indicated English as his/her home language. Although no
clear assessment was made of the English literacy level of the participants, it can be safely
assumed that a relatively large percentage of consumers may have had a low to very low level
of English literacy. Lombard et al., (2012) reported that a very large group of the Mamelodi
population is low educated, and struggled more with English than their home language. A
relatively large proportion of the population in the area dropped out of school before matric
(Grade 12), they are often unemployed and many rely on social grants. Mamelodi residents
considered English as the second spoken language in the area. Van der Berg et al., (2011),
reported that adult readers who speak English as a second language would perform worse
when performing the same test in English compared to in their native language.
5.9.2 Which biscuit was preferred, and why?
The results of the paired preference tests revealed that all methods where oral instructions
(method 2, 3, 5, 7) were applied gave the same result (participants significantly preferred the
‘signal biscuit' over the salty biscuit) at the same statistical significance (p < 0.05) as the
control test method (Method 1). However, method 6 where only picture instructions were
applied, a different result was obtained (p ˃ 0.05), no preference between the two biscuits).
This difference was probably due to the complexity of understanding the test instructions for
test method 6. The highest number of participants rated method 6 as difficult, with many
commenting on the difficulty to understand the test instructions. The assistant observed that
64% of the participants struggled to perform the test while 38% of participants, reported that
the instructions were difficult for them to follow. This finding might suggest a lack or
limitation of visual literacy by the participants. Hattwig et al., (2013), defined visual literacy
as the ability to interpret, evaluate, negotiate, and make meaning from information presented
in the form of images or the ability to find meaning in imagery. Jae and Viswanathan (2012),
stated that participants with low-literacy levels might display lower comprehension levels and
may make more errors when they view pictures that they do not perceive as congruent. Some
participants in this study were perhaps less familiar with following a sequence of picture
instructions and this might explain their attitudes when they were faced with the pictures;
they did not really know what to do with the tools that they received for the test. Beukelman
and Mirenda, (2005) mentioned that photographs are highly iconic, they usually described
© University of Pretoria

62
exactly the specific activities or routines presented. However, Linney (1995), speaking about
visual literacy and people that are illiterate, specified that for illiterate adults who are not
regularly in contact with pictures or not involved in any picture training, it would be difficult
to understand and interpret pictures and they do not easily developed visual literacy. Dada et
al., (2013), working with disabled participants, related this difficulty to understand pictorial
instructions to a lack of apprehending picture iconicity. This reasoning might also be used to
justify illiterate consumers’ difficulties to comprehend the instructions.
The quality and small size of the pictures used might have also been one of the reasons why
participants had difficulties to understand the picture instructions. Comments such as “The
last three pictures were too dark, I try to understand but I can’t follow” mentioned during the
post-test interview with participants' supports this conclusion. This participants’ responses or
performances to picture instructions (effect of picture understanding) were contrary to initial
expectation because Jae and Delvecchio (2004), stated that when people with low levels of
literacy had to make decisions in a marketplace, they depended more on perceptual rather
than conceptual processes in acquiring, retaining and using information. Viswanathan et al.,
(2005), characterised consumers with low-literacy levels as individuals that possessed good
pictorial thinking. However, Knickman and Gaus, (1999), discussing the understanding of
pictures by consumers with low-literacy levels, stated that pictures had to be made simple
with good image quality. The authors explained that to understand any picture such
consumers begin with a visual interpretation, discerning light and dark contrast of the picture
quality, shapes perception and finally decoding the picture instruction. This might also
reinforce the thought that the picture quality presented to participants would have affected
participants understanding (decoding) of the picture instructions and time taken for the task.
Results showed that the percentage of participants that required assistance for the different
methods was associated with the level of understanding of the test instructions. Test method
1, compared to the other methods, was the method where most participants required
assistance (34%) while for method 7 the lowest number of participants needed assistance
(16%). Even though the results reflect that no assistance was given to participants for method
6, this does not necessarily mean that participants did not require assistance. Note that no
assistance was given to participants by the assistant tasked with test method 6. For test
method 6, the assistant assigned followed the procedure exactly and did not offer assistance
or indicated (verbally or with body language) that such option was possible. Difficulties in
decoding and understanding written instructions by participants in method 1 probably
© University of Pretoria

63
justified the level of assistance given. Coetzee and Taylor (1996), experienced similar
participant difficulties when illiterate consumers were asked to read and understand written
instructions. These researchers indicated that for people with low-literacy levels to be able to
perform a conventional paired preference test, they had to be assisted to understand the test
instructions. Hoover and Gough (1990), characterised the writing task as a complex
organization of patterns of high mental processing that can embrace all types of thinking
(word decoding and reading comprehension), judging, imagining, reasoning and problem
solving for people that are illiterate or low-literate. Rue (1990), said to be able to understand
written instructions, a reader has to be able to read the written instruction first. Therefore, to
be able to fully decode written instructions, a proper reading level from participants is
required.
For the modified test methods 2, 3, 4, 5 and 7 the most common type of assistance given to
participants were either translation of audio instructions from English to the home language,
replaying of the audio instructions and explanation of what or where is the empty box.
Language understanding (level of English terminology used), the speed at which the audio
instructions were spoken, the tendency for concrete thinking i.e. literal thinking, relying
almost exclusively on images, and the low-literacy levels explain the main reasons for
needing assistance with the test methods. The type of assistance given to the participants was
based on the comments and inquiries of participants such as “the last part of the oral
instruction was fast”; “where is the empty box?”; “I don’t understand English, please explain
to me”. This justified the need for a repetition of audio instructions, assistance to explain the
terminology, showing the empty box to participants (method 4 "empty box") and translation
of English audio instruction to their home language (methods 2, 3, 5, 7). Viswanathan and
Da Silva (2009), identified the behaviour observed in test method 4 as being due to the
tendency for concrete thinking because consumers with low-literacy levels primarily function
in the visual, concrete realm, rather than the symbolic, abstract. The test method 4 instruction
stated that the participants had to remove the sticker for the code-selected sample and paste it
on the empty box (a geometrical figure represented on the score sheet ). Participants who
asked the assistant to identify the empty box expected / visualised an empty carton box in the
room where they had to paste the sticker selected, which emphasizes concrete thinking
attitude from some participants.
Of interest is the evaluation of participants' ability to select one of the biscuits as the
preferred one (performance) separately for those participants that completed the test
© University of Pretoria

64
independently and those that completed with some assistance. The difference in performance
assisted and independent completion were for methods 1 (86 % versus 52 %), 2 (100 %
versus 78 %), 3 (70 % versus 50 %), 4 (96 % versus 74 %), 5 (74 % versus 54 %) and 7 (98
% versus 82 %). This explains the role and influence that assistants had on the ability of the
participants to complete the task independently and on the sensory results. It revealed also
that if no assistances were given, method 7 was the method with the best potential for
independent completion by consumers with low-literacy levels. Important observations were
made with methods 1 and 5 where 2% and 6% of participants, respectively were unable to
perform the test correctly although they received assistance. A similar observation was noted
by Coetzee and Taylor (1996), who found that even after given a clear explanation to
consumers with low-literacy levels, they were still subjected to make errors. Some
participants claimed that the test they did was easy but when observing how they performed
the paired preference test method, their comments and actions were inconsistent, (most said
that the test was easy however, they found it difficult or needed assistance). Knickman and
Gaus (1999), revealed that when it came to ask an adult with low-literacy level if the survey
item he performed was understood he/she will always answer "yes" or give positive feedback
even if she found it difficult.
5.9.3 Time to complete the test
Comparing the average time taken to complete the task, test method 1 where participants had
to read and write took a lot longer than the rest of the methods involving listening to audio
instructions, decoding picture instructions only or a combination of picture and audio
instructions. Participants' reading and writing difficulties associated with a lack of clear
understanding of language instruction might explain the longer time compared to the methods
involving the action of listening to audio instruction in association with the new elements
such as use of sticker symbols, pictures instructions and sticking symbols rather than writing
and use of numbers as codes. Participants took more time to read and interpret test
instructions before starting to perform the test. Goetze and Strothotte (2001) and Bloomfield
(1927), during their research on literacy, made similar observations and said that consumers
with low-literacy levels take more time to read when trying to understand a simple sentence.
They experienced less interest during reading, (are susceptible to interference) and they read
a sentence more than once to get the real meaning. Thompkins and Binder (2003), explained
the use of time by illiterates during reading by the fact that they applied a phonological
strategy to decode words and try to understand the meaning (e.g. to pronounce the word
© University of Pretoria

65
biscuits they would start by pronouncing bis and then cuits, followed by the reading of the
complete word). Jae and Viswanathan (2012), said poor readers are deficient in selective
attention, they are therefore more susceptible to disturbances, then might read a text more
than once to get the meaning. Asking for assistance during the test can also explain why the
time taken for method 1 was longer. Coetzee and Taylor (1996), noted a similar observation.
The need for providing assistance is time consuming during performing sensory tests with
consumers with low-literacy levels. Mhlanga (2011) identified the spontaneous need for
assistance by consumers with low literacy levels while performing a task as a confrontative
mechanism. A technique used by with low-literate consumers to quickly cope with
complicated tasks are to ask for help e.g. from family and friends, even a stranger. However,
the lesser time taken for methods where audio instructions were played can be explained by
the impact that audio instructions have on participants' ability to understand the test
instruction. Jae and Delvecchio (2004), revealed that consumers with low-literacy levels
relied strictly on verbal information, radio advertising, advice or recommendation from a
friend when they have to make a decision, and concluded that audio instructions are a
necessary strategy to provide information to adults with low-literacy level. Goetze and
Strothotte (2001), added that illiterate adults feel comfortable when they are listening to
somebody reading their letters. Rue (1990), said adult illiterates never like reading and do not
think they are missing anything they want to know because they can get it from radio,
television or friends by listening and watching.
When comparing the time taken for method 1 (reading written instructions) and method 6
(pictorial instructions), no significant difference was observed. Participants took more time to
perform both methods compared to the others. As discussed earlier participants' difficulty to
decode written instructions and picture instructions might justify the longer time taken. This
statements from some participants: “The last three pictures are too dark, I try to understand
but I can’t follow” or “Please can you explain to me what I have to do”, might explain why
some participants took a longer time in those two specific test methods (1 and 6). The fact
that they were unfamiliar with sensory testing, led them to take more time to decode picture
instructions (iconicity). According to Rue (1990) and Mhlanga (2011), consumers with low-
literacy levels believe that as long as they can use their hands they can perform every task
proposed to them. When the task seemed to be complicated they avoided to ask for assistance
or help, then struggled to understand and finally abandon which generally coupled with
inefficient used of time. When comparing time taken for test method 7 (combination of
© University of Pretoria

66
pictorial instruction with audio instruction) with test method 6 (only pictorial instructions),
participants took more time in method 6 than method 7 and the difference on average was 1.3
min. The gain in time presents the impact of the audio instructions on participants' ability to
perform the task. Audio instructions clearly enhanced the participants' abilities to understand
the pictorial instructions. Drager et al., (2006), characterise this dual action as aided
augmented input. Aided augmented input requires using ongoing natural speech while
pointing to and labelling key graphic symbols. These comments support the impact of audio
instruction on participants: "I could not follow the picture instructions but oral instructions
make it easier, I found the test instructions easy"; "combination of the audio instruction and
picture instructions made it easy for the understanding". When comparing method 7 with the
control method (Method 1), participants took a longer period of time to perform test method 1
and the difference on average was 1.4 min. As explained earlier, difficulties to understand
written instructions and spontaneous requirement of assistance may explain why more time
was needed for method 1 compared to the association of audio instructions with pictorial
instructions in combination with new basic elements, which contributed to the better
understanding of the test instruction (method 7). Benitez et al., (2002), concluded about
understanding of written instruction by consumers with low-literacy levels that reading of
written instructions is an inappropriate task for them based on their education background
which limited their capabilities to read and understand any written instruction quickly. Sieber
(2001), in her book “Teaching with objects and photographs” revealed that photographs aid
human memory by creating a direct sensory connection between learners and the subjects that
succeed interest and attention. Photographs can be used to reinforce material covered in other
media, which is a benefit to a learner who do not always respond to written material. She
concluded that using objects and photographs are excellent means to enhance learning. This
observation may also explain the reason why participants took shorter time to complete test
method 7.
Completion of test method 5 was faster compared to other test methods with an average time
1.4 min. This made it the fastest test method. However, when comparing test method 5 results
with other test methods, based on difference in performance, assistants' comments,
participants' perception of the ease of performing the task and participants comments, test
method 5 was not the perfect test method. The assistants identified that at least 31% of
participants had difficulties to follow the test instructions compared to other methods
(methods 7 and 4 respectively 18% and 28%); 20% of participants required assistance to
© University of Pretoria

67
complete method 5 compare to method 7 where only 16% needed assistance. Faster execution
of the test method after receiving assistance with language translation and very good
understanding of the test instruction by some participants might justify the shorter time taken
for test method 5.
5.9.4 Anxiety
The anxiety measurement method used revealed that for methods where audio instructions
were applied (methods 2, 3, 4, 5, 7) and only picture instructions provided (method 6),
anxiety rates were greater than for the control method (method 1). This conveys that
participants appeared less anxious while performing test method 1 than methods where the
basic conventional elements were changed. This was contrary to expectation. It was expected
that participants would be more anxious when they were exposed to reading and writing
tasks. Gau et al., (2012), demonstrated that consumers with low-literacy levels experience a
challenge when they are forced to read and write and they become more anxious. While Jae
and Delvecchio (2004), explained that consumers with low-literacy levels feel more
comfortable with oral instructions because they rely strictly on verbally conveyed
information, when they have to make a decision at the marketplace. The observations about
anxiety rates might possibly be related to misinterpretation of participants’ facial expressions
by assistants. Tourangeau and Ellsworth (1979), mentioned that understanding facial
expressions need more attention from researchers when collecting data and observers needed
intensive training. In this study, the assistants were not trained extensively to read facial
expressions and body language. Facial expressions are linked to participants’ ' emotions or
feelings. It is also difficult to rate facial expressions of someone who externally show little
emotion (Tourangeau and Ellsworth, 1979). Participants' behaviour, body language and facial
expressions, while reading written instructions and listening to audio instructions (non-verbal
communication), might also justify why assistants had difficulties on rating facial
expressions. When reading, participants looked down at the paper with instructions, this may
have made it difficult for an assistant to easily "read/rate" his/her facial expressions (eyes,
frown etc.). However, while listening to the audio instructions participants probably did not
look down, they probably faced assistants and concentrated to pay attention to the sound. In
fact by paying attention (listening) and concentrating on the audio instruction playing via a
speaker, they use facial expressions that demonstrate listening skills (e.g. frown or pucker
their face which may result in contraction of their facial muscles). Thus, it was not easy to
read and compare facial expressions of participants performing the test and to rate whether
© University of Pretoria

68
they were anxious or not. Wendin, Allesens-Holm and Bredie (2011), revealed that some men
and woman have naturally a "pucker face" while other have a “poker face” (showing very
little emotion) appearance, which makes rating of their facial expression difficult. The fact
that the audio instructions were played via an instrument (speakers) would have affected their
facial expression as well. They probably had to give more attention to the instruction played
compared to those that were required to read written instructions where they can directly ask
for assistance or explanation. The speed with which the information was provided and also
the quality of the voice as recorded and played also might have had an influence on the
participants' level of anxiety. Coping with following test instructions, the speed of the
information and at the same time the quality of the voice (pitch, tone, accent, pronunciation
etc.) potentially made participants to pucker their faces. Listening to the instructions with
attention seem to have increased the perception of anxiety. However, participants and
assistants comments, for method 6, show that participants struggled with the method. In this
case, the anxiety levels of participants as rated by the assistant in method 6 reflected the
facial expressions of participants while struggling to understand picture instructions.
5.9.5 Effect of the combination of the different basic elements
Audio instructions in association with picture instructions only did not contribute positively
or influenced participants’ performance. Basic elements such as use of symbols as codes,
symbols to stick rather than writing, a positive smile face to motivate and indicate preference,
have also influenced participants' behaviours and performance while performing the test.
Differences in participants' comments on methods; level of confidence; need for assistance
might support the idea that the new basic elements really influenced participants behaviours
and performance. Finding of other authors may reinforce this conclusion. Coetzee and Taylor
(1996), reported that used of traditional number codes proved to be ineffective and time
consuming with consumers with low-literacy levels, but use of paired symbols was shown to
be more successful. Consumers with low-literacy levels feel more comfortable to use symbol
stickers to show their choice than to use a pencil to write or make a choice (Coetzee, 2001).
Illiterate consumers relied more on verbal instructions than written instructions (Reicks et al.,
2003). Photographs can be used to reinforce understanding (Sieber, 2001).
The test venue (university campus), may also have affected participants’ ability to master the
test. For some it was their first time to walk on university soil and perform such experiment.
That may be why certain participants compared the task to a test that they had to pass because
they perceive a university as a centre of higher learning. They might have assumed that the
© University of Pretoria

69
researcher or interviewer might expect them to perform the task easily and therefor they said
the task was “easy or okay” not difficult. That might be why some hide their difficulties by
giving answer that they thought will please the assistants.
5.10 Conclusions
This study shows that the mode by which instructions are given has to be taken into
consideration when asking consumers with a low-literacy level to take part in a sensory test.
Consumers with low-literacy levels, generally have difficulties to understand written
instructions. Using interviewers to eliminate reading and writing by consumers requires
effort, resources and is time consuming. New basic elements (pictorial and audio instructions,
sticker symbols, positive smile face) improved individual consumers' performance in such a
way that the efficiency of the paired preference method was much improved, to an extent that
almost no assistance was given to consumers and the time taken to complete the task
independently was optimised.
From this study, it is concluded that the test method with dual action of audio and pictorial
instructions in combination with sticker code symbols to stick rather than write and a positive
smile face to indicate preference (i.e. method 7) is the most effective paired preference
method for independent completion by consumers with low-literacy levels: This method is
now called the Kamdem paired preference method. However, further research is needed to
establish whether any further improvements can be made to the test and to evaluate the
suitability of the new method in practical product test situations as well as with other groups
of consumers. In addition, it is important that this study should be replicated among low-
literate individuals whose literacy status has been verified.
© University of Pretoria

70
6 General Discussion
This chapter is divided into two sections, the first section will critically review the
experimental design and methodologies used and suggest ways for future research. The
second section presents a sensory paired preference guide line when using the Kamdem
paired preference method. This guideline was based on the ASTM standard test method for
paired preference tests (ASTM E2263, 2013).
6.1 Critical review of the experimental design and methodologies
Developing suitable test material (formulation of two ginger biscuits) for the paired
preference test was the initial important step of this work. Using human judges, the two
biscuits were verified as different in salty taste. Instrumental analysis of the breaking force of
the two biscuits revealed that they were different in hardness, while the human panel did not
noticed a difference. Possible reasons for this difference might be related to the number of
biscuits used for texture analyses. For each batch of approximately 80 biscuits baked from
different treatments, three biscuits were randomly selected per treatment, i.e. a total of 12
biscuits per treatment were analysed. This was probably too few biscuits to represent a batch.
The test method used and measurement parameters also was not necessarily reliable to
measure human perception of the hardness of biscuits. However, the difference noted by
texture analysis did not influence the outcome of the work. For future research, it will be
beneficial to improve the production of the test biscuits by using industrial equipment. This
would result in production of biscuit pieces with exactly the same weight, size and shape
resulting in a generally improved biscuit quality.
Consumer sensory evaluation of the seven variations of the paired preference task was carried
out at the Mamelodi Campus, University of Pretoria. The venue was chosen based on the
representation of residents of Mamelodi as discussed by Lombard et al., (2012). The authors
mentioned that Mamelodi was characterised by a large group of adults with low-literacy
levels. The location of the venue provided practical proximity to potential low-literate
consumers. Participants' age range was between 18 and 55 years with a proportionally larger
representation of females in the group. This age group was chosen because it represents the
socio-economic group of participants that are usually used in sensory research. Adults do not
require parental consent, such as required for children. The drawback with the group was that
participants recruited were not all identified as having low-literacy levels even if they were
from the same location (living area). This problem probably did not affect the overall finding
because of the relatively large number of participants included. However, for future analyses
© University of Pretoria

71
with the same target group of participants' attention has to be put on verifying the literacy
level of different participant during recruitment. Selected candidates might go through a
series of tests before being selected as qualified for the test e.g. pictogram question (picture
identification), demographic question (gender, age, educational levels), reading of time, and
reading a short sentence, a method usually practised in medical fields (Hoogwegt, 2007;
Dowse, and Ehlers,. 2008).
The number of participants per method was determined based on test sensitivity parameters
initially fixed by the researcher [probability of concluding that no preference exists when, in
reality, one does (β- risk= 0.05%), probability of concluding that a preference exists when, in
reality, one does not (α- risk = 0.05%), proportion of common responses that researcher
wants the test to be able to detect with a probability of 1-β (Pmax=75%)]. ASTM E2263
(2013), recommends a minimum number of n=42 participants for this condition and a
significant difference was observed between the two biscuits if the total proportion of
common responses from participants per method was equal to or superior to 28. The number
n=50 participants was selected to maximise the chance to have enough participants, at least,
42 per method.
The sensory tests were carried out in an open space either outside on the lawn or under roof
on the Mamelodi campus. The tests were carried out at seven different stations. The close
distance between the different stations was a drawback of the test venue. The stations were
not separated far enough; some participants were able to look at the next station trying to find
any element or clue that might help them to perform the task. The movement of assistants
between stations to collect or deposit trays at the samples preparation area, and noise
produced while assistance was given (translation of audio instruction or reading of the written
instruction) could have affected participant's attention during the test. According to Jae and
Viswanathan (2012), consumers with low-literacy levels are more susceptible to interference.
These might have affected the final results. However, the fact that attitudes were recorded by
assistants were useful. This, helped with understanding of the coping mechanisms developed
by the participants as was previously described by Mhlanga (2011). Coping attitude was
noted for participants in a few test methods. To avoid such problems in future research,
distances between stations have to be considerable in such a way that no possible nuisance
factors (e.g. noise), might captivate participants' attention or give them a simple chance to
look around. It is recommended to use isolated cubicle rooms for each station.
© University of Pretoria

72
The new basic elements developed for the paired preference test method influenced
participants’ performances. Audio instructions, pictures or photographs instructions, sticker
symbol codes, a positive hedonic face to motivate participant’s recognition that they should
select the preferred sample, and an empty box drawn on a score sheet to direct participants
where to paste a selected sticker symbol code, contributed to a better understanding of the test
instructions for consumers with low-literacy levels. However some participants indicated that
they experienced some difficulties to follow the audio instructions, photographs instructions
and to understand the empty box concept. Those difficulties encountered by participants did
affect the final outcome of the work, however through their comments and observations; they
contributed to a better understanding of how low-literate consumers behave in tasks such as
these.
Regarding pictorial instructions, some participants informed that images were small with
poor quality presentation (too dark; difficult to follow) and for others they did not understand
at all the message transmitted by the photographs. The inability to decode the photograph
may be related to the perceived relationship between the symbol and its referent or iconicity.
Iconicity was defined as a perceived relationship between a symbol and its referent, which is
often described as a visual similarity (Miuko, 1987; Fristoe and Lloyd, 1980; Lloyd and
Fuller, 1990; Blischack, Lloyd and Fuller, 1997; Schlosser and Sigafoos, 2002). Linney
(1995), related this failure to decode picture instructions to a lack of visual literacy.
Knickman and Gaus (1999), mentioned that picture quality (brightness, colour, the size of the
photograph) is a key element for low-literate consumers to understand the message carried by
a picture or photograph. Sieber, (2001) revealed that pictures or photographs aid human
memory by creating a direct sensory connection between learners and the subjects that
succeed interest and attention. For future research, it is suggested that photographs have to be
taken by an expert with an appropriate and professional camera to ensure the clarity and
precision of the images. The size of the photographs must be considerably large at least (27.9
cm x 35.6 cm) not (10.2 cm x 15.2 cm) to facilitate visual interpretation. Audio instructions
played to participants should match exactly step by step with the photographs presented. The
gender of the person whose voice was recorded should also match the gender of the person
demonstrating all the steps on the picture instructions (if it is a female voice recorded and
played, the gender of the person demonstrating different steps must be a female on the picture
instructions).
© University of Pretoria

73
Regarding audio instructions, for participants who understood the language instructions in
English, some indicated that the speed of the audio instruction was too fast, and requested
that the instructions be repeated. For future research, attention has to be put on the speed of
voice and sound recording, use of a recording studio with adequate equipment and preferably
not a rudimentary instrument such as a cell phone, might contributed to give better sound
quality.
Some participants claimed that the audio instructions helped them to understand the picture
instructions and vice versa while some were confused and either needed assistance to be able
to perform the task. This complementarity between audio and picture instructions for a good
understanding of the test instruction might be explaining via a dual Pavio coding model
(simultaneous use of pictures and spoken input) which the model attempt to bridge the
imagery tradition and the verbal tradition (Sadoski and Paivio 2004). Photographs (iconic
symbols) simultaneously paired with spoken input which assisted them to understand the task
and complete easily. So participants had visual (photographs) and auditory (spoken words)
input which together helped them to process what they needed to do. For furthers research-
using video modelling not picture might be benefit for consumers with low-literacy levels.
Video is a multimedia source that combines a sequence of image to form a moving picture,
process the order in which the scene captures should be shown, has usually audio components
that correspond with pictures been shown on the screen instruction which is highly iconic will
be interesting.
Some participants had difficulties to understand the concept of the empty box which was
drawn on the score sheet to direct them where to stick the selected sticker symbol. The last
section of the test instruction (Remove the sticker of the biscuit you prefer and paste it on the
empty box) was a bit complex for the participants and some thought they had to stick the
sticker on an empty carton box. Viswanathan and Da Silva (2009), identified this type of
reaction as due to concrete thinking, rather than symbolic abstract thinking. It is
recommended that for future research the concept of the empty box has to be removed and
the instructions need to be reformulated in a simple way such as "Remove the sticker of the
biscuit you prefer and paste it on the paper" to avoid the mentioning of a box.
In food sensory research, assistants always played important roles in data collection. They
might unintentionally influence results during their duties by giving assistance to participants
during the test. A limitation was that the not randomly allocated to the experimental
© University of Pretoria

74
treatments or rotated among the stations. Since the assistants were fully aware of the purpose
of the study, they did not deliberately or intentionally bias the data collected and operated in a
systematic manner. However, this was not actively monitored and can therefore not be
validated. During this work, no assistance was initially recommended to be given to
participants but assistants were forced or felt obliged to give assistance to participants during
the evolution of some test methods. The assistance given was considered as a drawback for
this work. However, it helps to evaluate and understand how difficult or easy participants
perceived the test methods. According to Mhlanga (2011), consumers with low-literacy levels
developed confrontative mechanisms (making use of or demanding immediate assistance)
when facing a difficult task which might justify the reason why assistance was given. In a
semi-structured one-to-one interview (as was performed during the test), consumers with low
literacy levels felt free and relaxed to ask any question to the interviewers (Mhlanga, 2011).
Assistance given by different assistants were identified and noted. These contributed to
understanding and evaluation of the suitability of all methods. For further research as
recommendation it will be important to remind helpers or assistants to always stick to the task
rules.
6.2 Guideline for the Kamdem paired preference test to use with consumers with a
low literacy level.
The guideline developed was inspired by the ASTM E2263, (2013) test procedure for the
paired preference test.
This guideline is an attempt to ensure excellent setup of the Kamdem paired preference
method, including statistical analysis of results. It presents different steps and instructions to
follow by researchers. The paired preference test is used to compare or to determine whether
an overall preference exist for one of two samples. A set of two samples is presented
simultaneously to each participant and one sample is to be selected.
Step one: Definition of test conditions
6.2.1 Definition of test sensitivity (α-risk, β-risk, Pmax)
-α (alpha) risk: probability of concluding that a preference exist when, in reality, one does
not.
-β (beta) risk: probability of concluding that no preference exists when, in reality, one does.
-Pmax: proportion of common responses that the researcher wants the test to be able to detect
with the probability of 1-β.
© University of Pretoria

75
Example: if a researcher wants to have 95% confidence of detecting a 60:40 split in
preference, then Pmax=75% α= 0.05 and β=0.05
6.2.2 Determine number of participants (N):
6.2.2.1 The number of participants required for the test depends on two factors:
Firstly the test hypothesis and the objective of the test.
If the researcher’s a priori interest is in only one of the samples being preferred, the test is
identified as a one-sided test. The alternative hypothesis will express that a specific product is
preferred over the other product, A > B or A < B. If the researcher has no a priori assumption
in a particular sample being preferred, the test is identified as a two-sided test (in this case,
the alternative hypothesis is that the two products are not equally preferred, A ≠ B).
Secondly, the test sensitivity Pmax, α-risk, β-risk.
These two conditions direct the researcher on how to determine the minimum number of
participants required for his test using Table: 6-1 and Table: 6-2 respectively for one sided
test and two sided tests. To avoid situation where the number of participants required for the
test is less than the minimum required by the test condition, it is important to make provision
by recruiting 10% more participants.
Step two: Test procedure
6.2.3 Test materials
Samples of food should be representative of the problem or question that has to be
investigated, it should be uniform in size and presentation (comparable) and no
external variable or factor must be introduced.
Selection of test venue, development of master sheet, audio instructions, picture
instructions and sample presentation
The test venue preferably has to be familiar to the target consumers and preferably be
neutral, basic and clean (avoid any pictures or posters, colour that might distract
participants). Low-literate consumers are easily distracted or their attention diverted
(loss of concentration) by images and visual objects in an environment. Distance
between test stations must be considerable large to avoid any interference or copying.
Prepare a master sheet in a spreadsheet program e.g. Microsoft Excel to generate
numerical digital code number to ensure a balanced order of presentation of the two
samples. The master sheet should include date of the test, complete sample
identification either by product name, test objective, number of participants.
© University of Pretoria

76
NB: The Kamdem paired preference test uses symbols for coding of samples. It is important
then to developed pairs of symbols using arithmetical figures such as triangle, square,
rectangle (for examples see Figure: 5.3). The pairs of symbols developed will be randomly
attributed to the different samples numerical digit code sets on the master sheet and printed
on stickers to use as sample codes.
Audio instructions for participants explaining what should be done during the test. It
should be recorded using adequate instruments. The instructions will be played to
participants during the task in place of written instructions. Ensure that the sound
quality is excellent, and that the speed of the audio instructions is not too fast (it might
be played more than once to the participant).
Develop picture instructions through a series of photographs intended to describe
exactly all the different stages of the task. This will then guide participants to
understand clearly the audio instructions. The series of photographs have to be
placed/printed in order of the test evolution (from receiving the tray to completion
total of the test (e.g. see Figure: 5.2) from left to right or top to bottom. The
photographs should be in good quality and printed large enough for participants to see
clearly. The photographs can be positioned on a board or screen not too far from the
participants.
The picture and audio instructions should be in sync and explain exactly the same
procedure. If the audio is e.g. of a female voice, then the model on the photographs
should preferably be a female that represent the voice in terms of ethnicity, culture,
character and age.
Prepare samples out of sight of participants and in an identical manner, code the vessels or
bags containing the samples in a uniform manner with the symbols printed on stickers: e.g.
same portion size, temperature, apparatus, and same vessels. Present the two samples in a set
simultaneously on a tray, a score sheet (See appendix: A5), a palate cleaner e.g. glass of
water. Follow the same spatial arrangement for each participant, respect with attention each
set number to avoid any confusion with the code presented and selected. Limit movement and
intervention of assistants’ among participants.
© University of Pretoria

77
6.2.4 Analysis and interpretation of Kamdem paired preference results
First, count the total numbers of score sheets collected representing the total number of
participants that attended the test.
Use the master sheet to record which sample was selected by each participant.
For statistical analysis two approaches might be used to evaluate if there is a significant
difference between the two samples: BINOMDIST test using Microsoft Excel or by directly
identifying the number of common responses needed for significance difference using Table:
6-3 in case of one side test or Table: 6-4 in case of two sided test.
Finally write down your conclusion depending on the initial fixed test conditions (α, β, and
Pmax).
6.3 Example of paired preference test: example of a one side test will be
demonstrated
6.3.1 Background
Low-literate consumers represent a significant percentage of consumers of mageu (a
traditional African fermented cereal beverage). A local company in South Africa decided to
develop and launch a low cost mageu designed especially for the target group. Consumers
found it too sour and rejected the product. They reformulated the product to reduce the
sourness. The company decided to conduct a paired preference test with low-literate
consumers from a township in the Pretoria area to find out if the new reformulated mageu is
preferable to the initial sourer mageu.
6.3.1.1 Test objective and hypothesis
* To determine if the new reformulated sour mageu “B” is preferred over “A” the initial
more sour mageu.
* Hypotheses: H0: A=B
HAB: B>A.
6.3.1.2 Number of participants
The test sensitivity conditions were defined, as follow α-risk = 0.05, and a Pmax of 75 %
with β-risk = 0.01. Refer to the Table: 6-1 to determine the number of participant required,
read the section corresponding to Pmax = 75 % and the column corresponding to β = 0.01,
then read the row corresponding to α = 0.05, it indicates that a minimum of 58 participants
© University of Pretoria

78
will be needed for the test. The recruitment agent recruited 60 participants identified as
mageu consumers.
6.3.1.3 Conducting the test
The sensory test was done in an open space at a primary school located in the township. Four
stations were arranged: a class room where participants were welcomed before the test and
received each their individual identification number; two cubicle rooms separated with a
samples preparation station at equal distance from each cubicle. In each cubicle room were
respectively disposed a table with one chair for a participant, a board where picture
instructions were pasted and a device to play the audio instruction.
A total of sixty glass ramekins (90 ml) with plastic lids containing mageu “A” and sixty glass
ramekins of “B” was prepared at the sampling station, coded with the symbol stickers. Each
sequence AB and BA was presented 30 times so as to cover 60 participants in a balanced
random order. Each participant was serve with a tray (Figure 6.1) containing samples to
taste, cup of water, spoon, and score sheet. The instructions were played using the audio
device.
© University of Pretoria

79
Figure 6.1: Tray presented to participants. Image of cup and spoon was accessed from
© University of Pretoria

80
6.3.1.4 Analysis and interpretation of Results
Fifty six participants selected the sample “B” as preferred, and 4 selected sample “A”. In
Table 6-3, the row corresponding to 60 participants and the column corresponding to α =
0.05, revealed that 37 common responses were needed in order to conclude that there is a
preference for a specific product.
6.3.1.5 Conclusions
The manufacturer reports that there was a significant preference for the reformulated mageu
“B” (p < 0.001). The manufacturer concludes that product “A” could be replaced with the
reformulated yogurt to enhance consumer acceptance of the brand.
© University of Pretoria

81
Table 6-1: Number of participants needed for a paired preference test one-sided alternative
hypothesis a (ASTM E2263, 2013)
aThe values recorded in this table have been rounded to the nearest whole number evenly
divisible by two to allow for equal presentation of both paired combination (AB and BA).
© University of Pretoria

82
Table 6.2: Number of common responses needed for significance in paired preference test,
two-sided alternative hypothesis a (ASTM E2263, 2013)
aThe values recorded in this table have been rounded to the nearest whole number evenly
divisible by two to allow for equal presentation of both paired combination (AB and BA).
© University of Pretoria

83
Table 6-3: Number of Common Responses Needed for Significance in a Paired Preference
Test, One-Sided Alternative (ASTM E2263, 2013)
NOTE: 1-Entries are the minimum number of common responses required for significance at
the stated significance level (that is, column) for the corresponding number of participants
“n” (that is, row). Reject the assumption of “no preference” if the number of correct
responses is greater than or equal to the tabled value.
aAdapted from Meilgaard, M., Civille, G. V., and Carr, B. T., Sensory Evaluation
Techniques, 2nd Edition, CRC Press, Inc., Boca Raton, FL, 1991, p. 339.
NOTE 1- For values of n not in the table, compute the missing entry as follows: Minimum
number of responses (x) = nearest whole number greater than x = (n/2) + z√n/4, where z
varies with the significance level as follows: 0.84 for α = 0.20; 1.28 for α = 0.10; 1.64 for α =
0.05; 2.33 for α = 0.01; 3.10 for α = 0.001. This calculation is an approximation. The value
obtained may differ from the exact value as presented in the table, but the difference never
exceeds one response. Exact values can be obtained from binomial distribution functions
widely available in statistical computer packages.
© University of Pretoria

84
Table 6-4: Number of Common Responses Needed for Significance in a Paired Preference
Test, Two-Sided AlternativeA
NOTE 1- Entries are the minimum number of common responses required for significance at
the stated significance level (that is, column) for the corresponding number of participants
“n” (that is, row). Reject the assumption of “no preference” if the number of correct
responses is greater than or equal to the tabled value.
A Adapted from Meilgaard, M., Civille, G. V., and Carr, B. T., Sensory Evaluation
Techniques, 2nd Edition, CRC Press, Inc., Boca Raton, FL, 1991, p. 340.
NOTE 1—For values of n not in the table, compute the missing entry as follows: Minimum
number of responses (x) = nearest whole number greater than x = (n/2) + z=n/4 , where z
varies with the significance level as follows: 1.28 for α = 0.20; 1.64 for α = 0.10; 1.96 for α =
0.05; 2.58 for α = 0.01; 3.29 for α = 0.001. This calculation is an approximation. The value
obtained may differ from the exact value as presented in the table, but the difference never
exceeds one response. Exact values can be obtained from binomial distribution functions
widely available in statistical computer packages.
© University of Pretoria

85
7 Conclusions and recommendations
This research was to study variations of basic elements to limit reading and writing
commonly used when conducting conventional paired preference tests on task performance
by consumers with low-literacy levels. It was found that the combination of new basic paired
preference elements developed improved understanding the test by low-literate consumers.
This to an extent that no assistance was required, less time was need and independent
completion of the test by low-literate consumers.
Picture instructions guide participants understanding of audio instructions and vice versa.
Coding symbols developed and printed on stickers in place of three-digit number codes
limited reading and writing numbers, therefore eliminated utilisation of pen to write down the
three-digit code for the preferred selected sample. An image of a happy face in a box
motivated participants choice (preference) and where to paste the prefer sticker code symbol.
However, participants found difficult to decode picture instructions when presented alone.
Consumers with low-literacy levels were more comfortable (appearances, comments) when
all the new developed basics elements were associated together as part of the method.
However some attentions has to be paid on picture instructions (quality and size of images),
audio instructions (sound of the voice record and speed at which it plays) and grammatical
terminology use (phrase formulation has to be simple as possible).
Therefore the appropriate paired preference test method for consumers with low-literacy level
was developed and suitable to low-literate understanding: it is now called the Kamdem paired
preference method. Further studies should be conducted to establish whether further
enhancements can be made to ameliorate the method such as use of video instructions rather
than photograph instruction, validation of coding symbols developed, ensure the repeatability
of the method via a series of sensory tests using different test venues, different food products
and using different groups of participants.
© University of Pretoria

86
8 References
AACC International (2000). Approved Methods of the American Association of Cereal
chemists, 10th edition. St. Paul, Minnesota, USA: American Association of Cereal
Chemists, Inc.
ABEDE, Y., STOECKER, B.J., HINDS, M.J., GATES, G.E. (2006). Nutritive value and
sensory acceptability of corn- and kocho-based foods supplemented with legumes for
infant feeding in Southern Ethiopia. African Journal of Food Agriculture, Nutrition
and Development, 6, 1-19.
ADKINS, N. R. and OZANNE, J. L. (2005a). Critical consumer education: Empowering the
low-literate consumer. Journal of Macro Marketing, 25, 153-162.
ADKINS, N. R. and OZANNE, J. L. (2005b). The low-literate consumer. Journal of
Consumer Research, 32, 93-105.
AOAC (2000). Official method of analysis Volume I. 17th edition. Association of Official
Analytical Chemists, Inc., Maryland, USA.
ASTM E2263, (2013). Standard test method for paired preference test. Designation E: 2263-
12. ASTM International. West Conshohocken, PA United States.
BALTSAVIAS, A., JURGENS, A., and VAN VLIET, T. (1999). Fracture properties of short-
dough biscuits: effect of composition. Journal of Cereal Science, 29, 235-244.
BENITEZ, O., DEVAUX, D. and DAUSSET, J. (2002). Audio-visual documentation of oral
consent: a new method of informed consent for illiterate populations. The Lancet,
359, 1406-1407.
BENTSON, A., and FIRAT, A.F. (2006). Brand Literacy: consumers’ sense-making of brand
management. Advances in Consumer Research, 33, 375-350.
BEUKELMAN, D., and MIRENDA, P. (2005). Augmentative and alternative communication
4th edition. Maryland, United State of America.
BLISCHAK, D. M., LLOYD, L. L., and FULLER, D. R. (1997). Terminology issues. In L.
L. Lloyd , D. R. Fuller , & H. H. Arvidson (Eds.) , Augmentative and alternative
communication: A handbook of principles and practices. Boston, MA: Allyn and
Bacon.
BLOOMFIELD, L. (1927). Literate and Illiterate Speech. American Speech, 2, 432-439.
© University of Pretoria

87
BWAMBALE, F.M., MAYER, C.A and KOMAKECH, I. (2013). The ten beads method, a
novel way to collect quantitative data in rural Uganda. Journal of Public Health, 2,
29-31.
CARSTENS, A. (2004). Tailoring printing materials to match literacy levels: A challenge for
document designers and practitioners in adult literacy. Language mater, 34, 459-484.
CHUNG, S. J. (2010). Effects of milk type and consumer factors on the acceptance of milk
among Korean female consumers. Food Science, 74, 286–295.
COETZEE, H. (2001). Market testing new food products with illiterate and semi-literate
consumers. ITDG Food Chain, 29, 19-21.
COETZEE, H. and TAYLOR, J. R. N. (1996). The use and adaptation of the paired-
comparison method in the sensory evaluation of hamburger-type patties by
illiterate/semi-literate consumers. Food Quality and Preference, 7, 81-85.
COOPER, D.R. and SCHINDLER, P.S. (2006). Business research methods. 9th edition. New
York, NY: McGraw-Hill.
COURCOUX, P. and SEMENOU, M. (1997). Preference data analysis using a paired
comparison model. Food Quality and Preference, 8, 353-358.
CRESWELL, J.W. (2003). Research design: qualitative, quantitative and mixed methods
approach. 2nd edition. Thousand Oaks. C A: Sage. California 91320.
CURIA, A., HOUGH, G., MARTÍNEZ, C. and MARGALEF, M. 2001. How Argentine
consumers understand the Spanish translation of the 9-point hedonic scale. Food
Quality and Preference, 12, 217–221.
DADA, S., HUGUET, A. and BORMAN, J. (2013). The iconicity of picture communication
symbols for children with English additional language and mild intellectual disability.
Augmentative and Alternative Communication, 29, 360-373.
DANNER, L., SIDORKINA, L., JOECHL, M., and DUERRSCHMID, K. (2013). Make a
face! Implicit and explicit measurement of facial expressions elicited by orange juices
using face reading technology. Food Quality and Preference, 32, 167-172.
© University of Pretoria
88
DE BRUIN, C. and MINAAR, A. (1994). Experience with a single acceptance sensory test
method to determine the acceptability of soya products using consumers with a low
level of literacy. The South African Journal of Food Science and Nutrition, 6, 24-25.
DOWSE, R and EHLERS, M.S. (2008). The evaluation of pharmaceutical pictograms in a
low-literate South African population. Patient Education and Counselling, 45, 87-99.
DRAGER, K. D. R., POSTAL, V. J., CARROLUS, L., CASTELLANO, M., GAGLIANO,
C., and GLYNN, J. (2006). The effect of aided language modelling on symbol
comprehension and production in two preschoolers with autism. American Journal of
Speech-Language Pathology, 15, 112–125.
ERICKSON, K., DREVETS, W. and SCHULKIN, J. 2003. Glucocorticoid regulation of
diverse cognitive functions in normal and pathological emotional states. Neuroscience
and Biobehavioral Reviews, 27, 233-246.
F2M FOOD MULTIMEDIAS (2007). Bread market in South Africa. Online http:
www.google.co.za/F2M+FOOD+MULTIMEDIAS/. Accessed 02/09/2014.
FILIPCEV, B., SIMURINA, O., SAKAC, M., SEDEJ, I., JOVANOV, P., PESTORI, M., and
BONDROZA-SOLARO, M. (2011). Feasibility of buckwheat flour as an ingredient
in ginger nut biscuit formulation. Journal of Food Chemistry, 125, 164-170.
FINGERET, H. A. (1994). Adult literacy education: Current & future directions. DIANE
Publishing. Washington. USA.
FINGERET, H. A. and DRENNON, C. (1997). Literacy for life: Adult learners, new
practices. Teacher College Press. New York; United States of America.
FOOD AND AGRICULTURE ORGANISATION. (2003). Food energy: Methods of analysis
and conversion factors. FAO Food and paper Nutrition 77, 18-37. Rome FAO.
FRISTOE, M., and LLOYD, L. L. (1980). Planning an initial expressive sign lexicon for
persons with severe communication impairment. Journal of Speech and Hearing
Disorders, 45, 170 – 180.
FU, B.X., SAPIRSTEIN, H.D., BUSHUK, W. (1996). Salt-induced disaggregation /
solubilisation of gliadin and gluten proteins in water. Journal of Cereal Science, 24,
241-246.
© University of Pretoria

89
GAU, R., JAE, H. and VISWANATHAN, M. (2012). Studying low-literate consumers
through experimental methods: Implications for subsistence marketplaces. Journal of
Business Research, 65, 1683-1691.
GOETZE, M. and STROTHOTTE, T. (2001). An approach to help functionally illiterate
people with graphical reading aids. Smart Graphics Symposium UK. Citeseer, 21-23.
GOODENOUGH, B., DONGEN, K., BROUWER, N., ABU‐SAAD, H. H., and
CHAMPION, G. D. (1999). A comparison of the Faces Pain Scale and the Facial
Affective Scale for children's estimates of the intensity and unpleasantness of needle
pain during blood sampling. European Journal of Pain, 3, 301-315.
GUINARD, J.X (2001). Sensory and consumer testing with children. Trends in Food Science
and Technology, 11, 273-283.
HATTWIG, D., BUSSERT, K., MEDAILLE, A., and BURGESS, J. (2013). Visual literacy
standards in higher education: New opportunities for libraries and student learning
Portal: Libraries and the Academy, 13, 61-89.
HEGENBART, S. L. (1998). Alternative enhancers. Food Product Design, 2, 60-71.
HEIN, K. A., JAEGER, S. R., CARR, B. T and DELAHUNTY, C. M. (2008). Comparison of
five common acceptance and preference methods. Food Quality and Preference, 19,
651-661.
HOOGWEGT, H. (2007). How do low educated audiences understand motion in static
visuals? Two explorative studies into low educated South Africans’ comprehension of
motion suggestion in static visuals (Doctoral dissertation).Tillburg University:
Netherlands.
HOOVER, W. A. and GOUGH, P. B. (1990). The simple view of reading. Reading and
Writing, 2, 127-160.
HOSSAIN, A., KUMAR SARKER, A. and PARVEEN, S. (2013). Physicochemical and
Microbiological quality of fortified high-energy biscuits served in school of poverty
prone areas in Bangladesh. Journal of Pharmaceutical and Biological Sciences, 1, 16-
20.
ILD, (2015). International literacy day-2015. Online http://www.gov.za/international-
literacy-day-2015 accessed 15/10/2015.
© University of Pretoria

90
INDRANI, D., and RAO, W.G. (2007). Rheological characteristics of wheat flour dough as
influenced by ingredients of parotta. Journal of Food Engineering, 79, 100-105.
JAE, H. and DELVECCHIO, D. (2004). Decision making by low‐ literate consumers in the
presence of point‐of‐purchase information. Journal of Consumer Affairs, 38, 342-354.
JAE, H. and VISWANATHAN, M. (2012). Effects of pictorial product-warnings on low-
literate consumers. Journal of Business Research, 65, 1674-1682.
KEEFE, E. B. and COPELAND, S. R. (2011). What is literacy? The power of a definition.
Research and Practice for Persons with Severe Disabilities, 36, 92-99.
KEMPT, S. E., HOLLOWOOD, T., Hort, J. (2009). Sensory evaluation: A practical
handbook. John Wiley & Sons, Ltd. Oxford, UK.
KNICKMAN, J.R and GAUS, C.R. (1999). Consumer survey information in a reforming
health care system. DIANE publishing. Vienna, Virginia.
KUMAR, R. (2005). Research methodology: a step by step guide for beginners. 2nd edition.
London: Sage.
LAWLESS, H. T. and HEYMANN, H. (1999). Sensory Evaluation of Food. Springer. New
York.
LAWLESS, H.T., POPPER, R., KROLL, B.J. (2010).A comparison of labelled magnitude
(LAM) scale, an 11-point category scale and traditional 9-point hedonic scale. Food
Quality and Preference, 21, 4-12.
LEEDY, P.D. and ORMROD, J.E. (2005). Practical research: planning and design. 8th
edition. New Jersey: Pearson.
LEON, F., COURONNE, T., MARCUZ, M.C., KOSTER, E.P. (1999). Measuring food
liking in children: a comparison of nonverbal methods. Food Quality and Preference,
10, 93-100.
LIM, J. (2011). Hedonic scaling: A review of methods and theory. Food Quality and
Preference, 22,733-747.
LINNEY, B. (1995). Pictures, people and power: people-centred visual aids for
development. Macmillan Press Ltd. UK.
© University of Pretoria

91
LLOYD, L. L., and FULLER, D. R. (1990). The role of iconicity in augmentative and
alternative communication symbol learning. In W. I. Fraser (Ed.), Key issues in
mental retardation issues. London: Routledge.
LOMBARD, A., KEMP, M., VILJOEN-TOET, N., and BOOYZEN, M. (2012). An
integrated developmental model for poverty reduction in South Africa: An NGO'S
perspective. Journal of Community Practice, 20, 178-195.
MALHOTRA, N.K. (1988). A methodology of measuring consumer preferences in
developing countries. International Marketing Review, 5, 52-66.
MARCOTTE, M., and RAMASWAMY, H. (2005). Food processing: Principles and
Application. Boca Raton. CRC Press.
MAYER-JOHNSON, R. (1985). The Picture Communication Symbols. Solana Beach, CA:
Mayer-Johnson.
MERRIAM, S. B. (1998). Qualitative research and case study applications in education.
Revised and expanded from" Case Study Research in Education." Jossey-Bass
Publishers, 350 Sansome St, San Francisco, CA 94104.
MHLANGA, S. (2011). An exploration of the decision making processes and coping
mechanism of functionally illiterate South African consumers. Marketing
Management Dissertation. University of Pretoria.
MIZUKO, M. (1987). Transparency and ease of learning of symbols represented by
Blissymbols, PCS, and Picsyms. Augmentative and Alternative Communication, 3,
129 – 136.
MUHIMBULA, H.S., ISSA-ZACHARIA, A and KINABO, J. (2011). Formulation and
sensory evaluation of complementary foods from local, cheap and readily available
cereals and legumes in Iringa, Tanzania. African Journal of Food Science. 5, 26-31
NICOLAS, L., MARQUILLY, C. and O’MAHONY, M. (2010). The 9-point hedonic scale:
Are words and numbers compatible? Food Quality and Preference, 21, 1008-1015.
O’MAHONY, M. (1985). Sensory evaluation of food (statistical methods and procedures).
Pub. Marcel Dekker Inc. New York and Basel.
© University of Pretoria

92
PEREIRA, D., CORREIA, P. M., and GUINE, R. P. (2013). Analysis of the physical-
chemical and sensorial properties of Maria type cookies. Acta Chimica Slovaca, 6,
269-280.
POPPER, R., ROSENSTOCT, W., SCHRAIDIT, M., KROLL, B.J. (2004). The effect of
attribute questions on overall liking rating. Food Quality and Preference, 12, 853-
858.
REICKS, M., SMITH, C., HENRY, H., REIMER, K., ATWELL, J. and THOMAS, R.
(2003). Use of the think aloud method to examine fruit and vegetable purchasing
behaviours among low-income African American women. Journal of Nutrition
Education and Behaviour, 35, 154-160.
RITCHIE, J., LEWIS, J., NICHOLLS, C. M., and ORMSTON, R. (Eds.). (2003). Qualitative
research practice: A guide for social science students and researchers. Thousand
Oaks. California. Sage.
RUBIN, H.J. and RUBIN, I.S. (2005). Qualitative interviewing: the art of hearing data. 2nd
edition. Thousand Oaks. California: Sage.
RUE, N. N. (1990). Coping with an Illiterate Parent. The Rosen Publishing Group Inc. New
York.
SADOSKI, M., and PAIVIO, A. (2004). A dual coding theoretical model of reading. In R. R.
Ruddell and N. J. Unrau, (Eds.), Theoretical models and processes of reading (5th
edition.), pp. 1329–1362. Newark, DE: International Reading Association.
SAUNDERS, M., LEWIS, P. and THORNHILL, A. (2007). Research methods for business
students 4th edition. Harlow: Financial Times / Prentice Hall.
SCHLOSSER, R. W., and SIGAFOOS, J. (2002). Selecting graphic symbols for an initial
request lexicon: Integrative view. Augmentative and Alternative Communication, 18,
102 – 123.
SIEBER, E. (2001).Teaching with object and photographs: Supporting and enhancing your
curriculum. A Guide for teachers. ERIC. Bloomington. India.
SOSA, M., MARTINEZ, C., MARQUEZ, F. and HOUGH, G. (2008). Location and scale
influence on sensory acceptability measurements among low income consumers.
Journal of Sensory Studies, 23, 707- 719.
© University of Pretoria

93
STEINER, J. E. (1973). The gusto facial response: observation on normal and anencephalic
new born infants. Symp Oral Sens Percept, 4, 254-278.
STEVENSON, A. (Ed.). (2010). Oxford dictionary of English. Oxford University Press.
Auckland Cape Town.
STONE, H., BLEIBAUM, R. and THOMAS, H. A. (2012). Sensory evaluation practices. 4th
edition. Academic press. Waltham. United States of America.
THOMPKINS, A. C. and BINDER, K. S. (2003). A comparison of the factors affecting
reading performance of functionally illiterate adults and children matched by reading
level. Reading Research Quarterly, 38, 236-258.
TOURANGEAU, R. and ELLSWORTH, P. C. (1979). The role of facial response in the
experience of emotion. Journal of Personality and Social Psychology, 37, 15-19.
UNESCO (2014). Literacy data show persistent gender gap. Online
http://www.uis.unesco.org/literacy/Pages/literacy-day-2014.aspx. Access 10/03/2015.
USI (2014). UNESCO Institute of Statistics. Online: http://www.uis.unesco.org (access
10/05/2015).
VAN DER BERG, S., TAYLOR, S., GUSTAFSSON, M., SPAULL, N., and ARMSTRONG,
P. (2011). Improving education quality in South Africa. Rapport for the national
planning commission. University of Stellenbosch Cape Town. (Internet document)
URL http://resep.sun.ac.za/wp-content/uploads/2012/10/2011-Report-for-NPC. Pdf.
Access 12/05/2015.
VILLANUEVA, N. D. M., and DA SILVA, M. A. A. P. (2009). Comparative performance of
the nine-point hedonic, hybrid and self-adjusting scales in the generation of internal
preference maps. Food Quality and Preference, 20, 1–12.
VISWANATHAN, M., ROSA, J. A. and HARRIS, J. E. (2005). Decision making and coping
of functionally illiterate consumers and some implications for marketing management.
Journal of Marketing, 69, 15-31.
VISWANATHAN, M., GAJENDIRAN, S. and VENKATESAN, R. (2008). Enabling
consumer and entrepreneurial literacy in subsistence marketplaces: A research-based
approach to educational programs. Springer, New York.
© University of Pretoria

94
VISWANATHAN, M., TORELLI, C. J., XIA, L. and GAU, R. (2009). Understanding the
influence of literacy on consumer memory: The role of pictorial elements. Journal of
Consumer Psychology, 19, 389-402.
WENDIN, K., ALLENSENS-HOLM, B., and BREDIE, L. P. W. (2011). Do facia l reactions
add new dimension to meaning sensory responses to basic taste? Food Quality and
Preference, 22, 346-354.
WIESER, H. (2007). Chemistry of gluten protein. Journal of Food Microbiology, 25, 115-
119.
YEU, K., LEE, Y., and LEE, S. Y. (2008). Consumer acceptance of an extruded soy-based
high-protein breakfast cereal. Journal of Food Science, 73, 20–25.
ZEINSTRA, G.G., KOELEN, M.A., COLINDRES, D., KOK, F.J and GRAAF, C. (2009).
Facial expressions in school–age children are good indicator of dislikes but not for
likes. Food Quality and Preference, 20, 620- 624.
© University of Pretoria

95
9 Appendix A, B, C
© University of Pretoria

96
Appendix A1 Date:
Method 1 No:
You have been given two biscuits. First eat one of the biscuit, drink water then eat the second biscuit. Use the pen to make a mark in the box of
the biscuit you prefer.
456 569
© University of Pretoria

97
AppendixA2 Date:
Method 2 No:
456 569
© University of Pretoria

98
Appendix A3 Date:
Method 3 No:
© University of Pretoria

99
Appendix A4 Date:
Method 4 No:
© University of Pretoria

100
Appendix A5, A6, A7 Date:
Method 5-6-7 No:
© University of Pretoria

101
Appendix B
Qualitative questionnaire
Date:
No:
1-Test method
1 2 3 4 5 6 7
2- Time:
3- Consumer Attitude during test evolution:
3-1-Comments
Gender
3-2 Age (In what year were you born?):
4- What is your home language?
5- School level: (what is your highest level of education?)
6-How did you think the task was? (If no answer from consumer assistant must propose to
them the three alternatives choice below and tick the correct choice) mark one option
Did not attend school Up to grade 7- some primary
school
Male
Female
Start: End: Total:
min mmmmmmm
Ndebele
IsiZulu IsiXhosa Afrikaan
s s Venda Swazi Tsonga
English Sepedi SeSoth
o Tswana Others (specify)
© University of Pretoria

102
Difficult Okay Easy
7-1. you said it was what could be your reason?
Thank the consumer for participating
Can we include the answers that you gave us in our data set?
Hereby, I declare that the information collected during this interview was provided by the
consumer or base on my observation.
Helpers Name and Surname Signature
Yes no
© University of Pretoria

103
Appendix C: Audio Instruction
-Audio 1 (Method 2)
Please listen carefully. You have been given two biscuits. First eat one of the biscuit, drink
water, then eat the second biscuit. Use the pen and make a mark in the box of the biscuit you
prefer
-Audio 2 (Method 3)
Please listen carefully you have been given two biscuits. First eat one of the biscuit, drink
water then eat the second biscuit. Use the pen and make a mark in the box with the symbol of
the biscuit you prefer
-Audio 3 (method 4)
Please listen carefully. You have been given two biscuits. First eat one of the biscuit, drink
water, then eat the second biscuit. Remove the sticker of the biscuit you prefer and paste it on
the empty box.
-Audio 4 (method 5 and 7)
Please listen carefully. You have been given two biscuits. First eat one of the biscuit, drink
water, then eat the second biscuit. Remove the sticker of the biscuit you prefer and paste it on
the smiley face box.
© University of Pretoria