Embed Size (px)
Citation preview

Campbell et al. BMC Medical Informatics and Decision Making 2012, 12:99http://www.biomedcentral.com/1472-6947/12/99
TECHNICAL ADVANCE Open Access
Developing open source, self-contained diseasesurveillance software applications for use inresource-limited settingsTimothy C Campbell1, Charles J Hodanics1, Steven M Babin1*, Adjoa M Poku1, Richard A Wojcik1, Joseph F Skora2,Jacqueline S Coberly1, Zarna S Mistry1 and Sheri H Lewis1
Abstract
Background: Emerging public health threats often originate in resource-limited countries. In recognition of thisfact, the World Health Organization issued revised International Health Regulations in 2005, which call forsignificantly increased reporting and response capabilities for all signatory nations. Electronic biosurveillancesystems can improve the timeliness of public health data collection, aid in the early detection of and response todisease outbreaks, and enhance situational awareness.
Methods: As components of its Suite for Automated Global bioSurveillance (SAGES) program, The Johns HopkinsUniversity Applied Physics Laboratory developed two open-source, electronic biosurveillance systems for use inresource-limited settings. OpenESSENCE provides web-based data entry, analysis, and reporting. ESSENCE DesktopEdition provides similar capabilities for settings without internet access. Both systems may be configured to collectdata using locally available cell phone technologies.
Results: ESSENCE Desktop Edition has been deployed for two years in the Republic of the Philippines. Local healthclinics have rapidly adopted the new technology to provide daily reporting, thus eliminating the two-to-three weekdata lag of the previous paper-based system.
Conclusions: OpenESSENCE and ESSENCE Desktop Edition are two open-source software products with thecapability of significantly improving disease surveillance in a wide range of resource-limited settings. Theseproducts, and other emerging surveillance technologies, can assist resource-limited countries compliance with therevised International Health Regulations.
Keywords: Electronic biosurveillance, Software development, Public health, Disease outbreak, Resource-limitedsettings
BackgroundEmerging public health threats often originate in coun-tries that lack many public health resources and infra-structure [1]. Because of the rapidity with which thesediseases can spread, particularly with international airtravel, early detection of disease outbreaks is extraordin-arily important because it can provide for a quicker re-sponse and potentially limit morbidity, mortality, andthe spread of the outbreak. In recognition of this fact,
* Correspondence: [email protected] Hopkins University Applied Physics Laboratory, 11100 Johns HopkinsRoad, Laurel, MD 20723, USAFull list of author information is available at the end of the article
© 2012 Campbell et al.; licensee BioMed CentCommons Attribution License (http://creativecreproduction in any medium, provided the or
the World Health Organization issued revised Inter-national Health Regulations in 2005 (IHR 2005) thattook effect in 2007. The purpose of IHR 2005 is to en-hance global cooperation and protect populations fromemerging health threats [2] by requiring participatingcountries to “develop core capacities for surveillance,detection, reporting and response.” These core capacitiesinclude legislation and financing, national andinternational communication, preparedness, humanresources, and laboratory resources. The 195 membernations of the World Health Organization had until thesummer of 2012 to comply with IHR 2005, whichrequires establishing capabilities for detecting, reporting,
ral Ltd. This is an Open Access article distributed under the terms of the Creativeommons.org/licenses/by/2.0), which permits unrestricted use, distribution, andiginal work is properly cited.
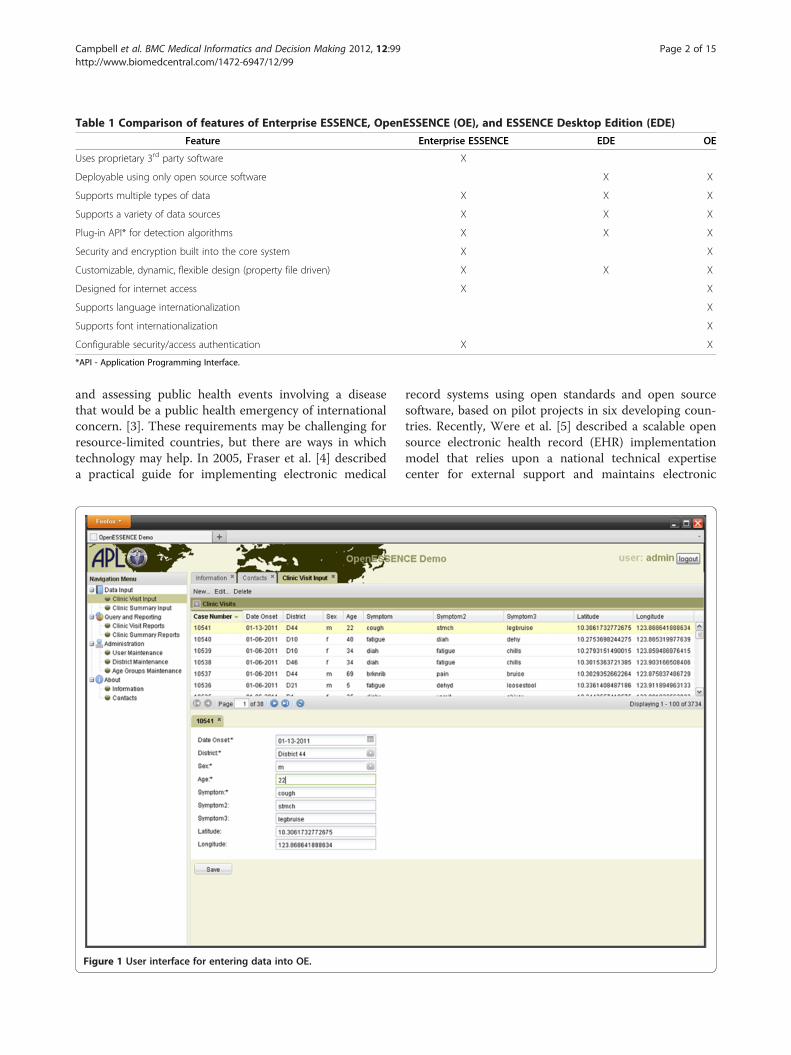
Table 1 Comparison of features of Enterprise ESSENCE, OpenESSENCE (OE), and ESSENCE Desktop Edition (EDE)
Feature Enterprise ESSENCE EDE OE
Uses proprietary 3rd party software X
Deployable using only open source software X X
Supports multiple types of data X X X
Supports a variety of data sources X X X
Plug-in API* for detection algorithms X X X
Security and encryption built into the core system X X
Customizable, dynamic, flexible design (property file driven) X X X
Designed for internet access X X
Supports language internationalization X
Supports font internationalization X
Configurable security/access authentication X X
*API - Application Programming Interface.
Campbell et al. BMC Medical Informatics and Decision Making 2012, 12:99 Page 2 of 15http://www.biomedcentral.com/1472-6947/12/99
and assessing public health events involving a diseasethat would be a public health emergency of internationalconcern. [3]. These requirements may be challenging forresource-limited countries, but there are ways in whichtechnology may help. In 2005, Fraser et al. [4] describeda practical guide for implementing electronic medical
Figure 1 User interface for entering data into OE.
record systems using open standards and open sourcesoftware, based on pilot projects in six developing coun-tries. Recently, Were et al. [5] described a scalable opensource electronic health record (EHR) implementationmodel that relies upon a national technical expertisecenter for external support and maintains electronic
Campbell et al. BMC Medical Informatics and Decision Making 2012, 12:99 Page 3 of 15http://www.biomedcentral.com/1472-6947/12/99
health records at multiple sites in resource-limited set-tings. Dennehy et al. [6] described a partnership modelfor electronic health records in resource limited primarycare settings. Ashar et al. [7] described a variety of infor-mation and communications technologies that can beused for electronic health data capture and assessedtheir use in resource-limited settings. In 2010, Hartleyet al. [8] described the Global Health Security Initiativeand discussed how electronic biosurveillance systemscomplement traditional public health surveillance toprovide early warning and international awareness ofdisease outbreaks.Syndromic surveillance systems typically use elec-
tronic, non-traditional, pre-diagnostic health indicatorsas surrogates for disease incidence to detect potentialoutbreaks in populations [9]. These indicators may in-clude a wide variety of data sources [10], such as over-the-counter and prescription drug sales data, emergencydepartment visit chief complaint data, physician officevisit insurance claims data, nurse hotline data, etc. Syn-dromic surveillance systems complement traditionalpublic health surveillance by providing non-specific yetearly pre-diagnostic indications of potential disease out-breaks [11]. The Electronic Surveillance System for theEarly Notification of Community-based Epidemics (ES-SENCE) is one example of an automated syndromic sur-veillance system. ESSENCE is a Java-based applicationused to monitor the health of populations and to detectdisease outbreaks early and help prevent their spread
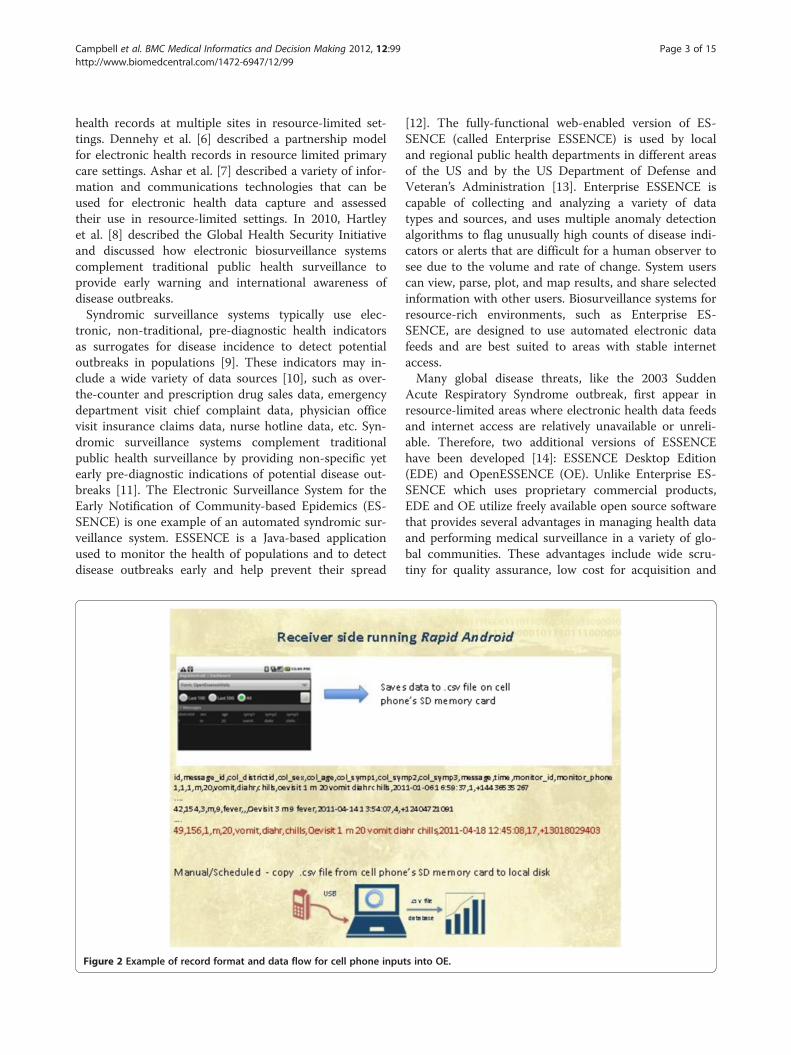
Figure 2 Example of record format and data flow for cell phone inpu
[12]. The fully-functional web-enabled version of ES-SENCE (called Enterprise ESSENCE) is used by localand regional public health departments in different areasof the US and by the US Department of Defense andVeteran’s Administration [13]. Enterprise ESSENCE iscapable of collecting and analyzing a variety of datatypes and sources, and uses multiple anomaly detectionalgorithms to flag unusually high counts of disease indi-cators or alerts that are difficult for a human observer tosee due to the volume and rate of change. System userscan view, parse, plot, and map results, and share selectedinformation with other users. Biosurveillance systems forresource-rich environments, such as Enterprise ES-SENCE, are designed to use automated electronic datafeeds and are best suited to areas with stable internetaccess.Many global disease threats, like the 2003 Sudden
Acute Respiratory Syndrome outbreak, first appear inresource-limited areas where electronic health data feedsand internet access are relatively unavailable or unreli-able. Therefore, two additional versions of ESSENCEhave been developed [14]: ESSENCE Desktop Edition(EDE) and OpenESSENCE (OE). Unlike Enterprise ES-SENCE which uses proprietary commercial products,EDE and OE utilize freely available open source softwarethat provides several advantages in managing health dataand performing medical surveillance in a variety of glo-bal communities. These advantages include wide scru-tiny for quality assurance, low cost for acquisition and
ts into OE.
Campbell et al. BMC Medical Informatics and Decision Making 2012, 12:99 Page 4 of 15http://www.biomedcentral.com/1472-6947/12/99
maintenance, and extensive user input on requirements,usage, and adaptability [15]. Examples of the utility ofopen source software in health records and biosurveil-lance include: the public health data and information ex-change methodology developed by the US Centers forDisease Control and Prevention (CDC) [16]; an opensource electronic medical record for implementation indeveloping countries described by Mamlin et al. [17];implementation of the Shibboleth information exchangefor biosurveillance described by Lambert and Leonhardt[18]; and an open source cyber-environment especiallyfor disease surveillance described by Edwards et al. [19].Working closely with local public health departments,
as well as the US military in their role of collaboratingwith host country military partners participating in sup-port of IHR 2005 [20] in resource-limited countries inAsia, Africa, and elsewhere, the Johns Hopkins Univer-sity Applied Physics Laboratory (JHU/APL) obtained po-tential user input to determine a set of requirements forOE and EDE. These health departments desire an opensource software system that would place a minimumburden on data providers, easily allow the user to tailorthe system to their needs, and provide sustainability by
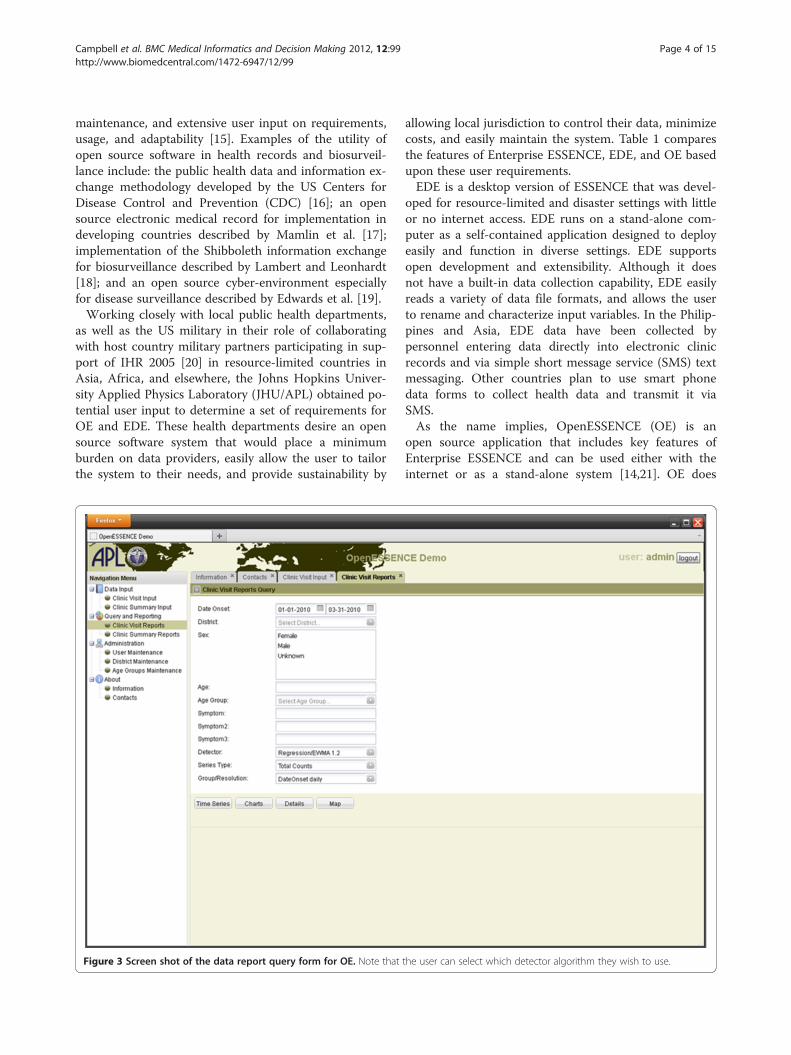
Figure 3 Screen shot of the data report query form for OE. Note that
allowing local jurisdiction to control their data, minimizecosts, and easily maintain the system. Table 1 comparesthe features of Enterprise ESSENCE, EDE, and OE basedupon these user requirements.EDE is a desktop version of ESSENCE that was devel-
oped for resource-limited and disaster settings with littleor no internet access. EDE runs on a stand-alone com-puter as a self-contained application designed to deployeasily and function in diverse settings. EDE supportsopen development and extensibility. Although it doesnot have a built-in data collection capability, EDE easilyreads a variety of data file formats, and allows the userto rename and characterize input variables. In the Philip-pines and Asia, EDE data have been collected bypersonnel entering data directly into electronic clinicrecords and via simple short message service (SMS) textmessaging. Other countries plan to use smart phonedata forms to collect health data and transmit it viaSMS.As the name implies, OpenESSENCE (OE) is an
open source application that includes key features ofEnterprise ESSENCE and can be used either with theinternet or as a stand-alone system [14,21]. OE does
the user can select which detector algorithm they wish to use.

Campbell et al. BMC Medical Informatics and Decision Making 2012, 12:99 Page 5 of 15http://www.biomedcentral.com/1472-6947/12/99
not require the automatic secure internet data feedsthat are used in Enterprise ESSENCE. Because of thedistinct differences in Enterprise ESSENCE and its usercommunity, converting all instances of Enterprise ES-SENCE to OE is not planned at this time. Like EDE,OE provides for open development and extensibility,however, unlike EDE, it also contains a built-in dataentry module. Data can be entered directly into theOE server, or via the web by multiple, geographicallydistributed users.It should be emphasized that the primary goal of
these efforts is to build capacity by giving resource-limited countries the independent ability to collect andanalyze their own data. Because of this, JHU/APL doesnot have access to their data nor is that a goal. Basedon more than a decade of experience working withlocal public health officials within the US, JHU/APLinteracts closely with local public health officials inthese countries in order to address quickly their con-cerns about best utilizing and maintaining their newsystem. The emphasis is on rapidly providing value asrecognized by the user so that they begin using thesesystems as much as possible.
Figure 4 OE screen shot illustrating configurable charting, pie/bar ov
MethodsOE and EDE were developed to support a wide varietyof user needs ‘out of the box,’ including configuration fordifferent data sources and for user-performed queries onthat data. EDE can be downloaded from the web andloaded onto most Windows-based laptop or desktopcomputers. Development is not yet complete on OE, sofor the moment it requires active installation by JHU/APL developers. Eventually, we intend to offer the OEversion as a downloadable product. The biosurveillancesystem results are provided in a format similar to Enter-prise ESSENCE [12,13] and include graphs, charts, anddetailed data on case reports, as well as geographic mapsof individual illness reports.
OpenESSENCE (OE)Overview of software frameworkSecurity, encryption, and user-interface languageinternationalization support are built into the core OEsystem. OE uses open source software and industrystandard technologies (e.g., Java EE, Apache Tomcat,Spring, MySQL, PostgreSQL, PostGIS, GeoServer,GeoExt, Openlayers). The overall design is modular with
er configured groupings.

Campbell et al. BMC Medical Informatics and Decision Making 2012, 12:99 Page 6 of 15http://www.biomedcentral.com/1472-6947/12/99
component-based applications and a data-driven systemstructure. OE utilizes a Java development open sourceframework called Spring [22,23]. Spring contains modu-lar features for developing web applications in Java.These features include aspect-oriented programming,transaction application programming interface (API),configurable security processes for authentication andauthorization, the use of XML schema, and data accessfor working with relational databases. OE also usesGroovy [24,25], an object-oriented programming lan-guage that enhances and interoperates with the featuresof Java. Groovy is used to implement the interface layerfor the data sources, allowing dynamic table and fielddefinitions. Spring provides comprehensive support forusing classes and objects defined by Groovy. This OEdesign allows for dynamic extension and reconfiguration,and eliminates the need to re-develop or rebuild an ap-plication in order to incorporate adjustments orenhancements. Plug-in APIs are used for the detectionalgorithms. Various libraries and server applications arestable.
Figure 5 OE screen shot of time series analysis. Below the plot are detaalerts can be shown by the red peaks in the plot.
Initial user interface and data inputHealth indicator data reflect determinants of health andhealth outcomes and may come in a wide variety of for-mats that include numeric and text data. OE is designedto accept a variety of types of data input [26]. Onemethod of data input is through the web data entry userinterface. Figure 1 illustrates the user interface for enter-ing various types of data. Note that OE supports languageinternationalization of all user interface components. Thedata can be input by typing free text, including numericdata, as well as the different selections from the pull-down list. The free text data can be validated with config-urable data parameters, such as maximum/minimumranges, decimals, etc. The software is configurable to ad-just for different databases and data sources, and canaccept combinations of different data sources (e.g., joinsof multiple tables). For data input through a databaseconnection, standard extract, transform, and load (ETL)synchronization processes can be used to load surveil-lance data from any Java Database Connectivity (JDBC)compatible database.
ils of the detection algorithm output. Note that detection algorithm

Campbell et al. BMC Medical Informatics and Decision Making 2012, 12:99 Page 7 of 15http://www.biomedcentral.com/1472-6947/12/99
In many resource-limited countries, cellular telephoneusage is already or is rapidly becoming very common[27]. These services often include the ability to transmittext messages or SMS. Therefore, SMS messages can beused as a way of collecting health data and entering itinto an electronic surveillance system [7,28]. JHU/APLis piloting such systems in Asia and Central America.In addition, interactive voice response (IVR) has been
used as a method of electronic collection of health data[7]. IVR can be used with both cellular and land tele-phone lines. Figure 2 shows an example of how healthdata may be electronically collected by OE using cellulartelephones. In this example, the user enters data usingIVR at the time of the encounter and these data are thenstored securely on the device until they can be transmit-ted to the central system. JHU/APL has developed and ispiloting these data entry systems in Peru.
Analysis and visualizationTools to analyze and visualize data and derived data pro-ducts are important ways in which biosurveillance sys-tems can enhance public health decision making. It isimportant to note that OE provides the ability for
Figure 6 Screen shot of an example of data details analysis available
multiple users to share information derived from datawithout having to share sensitive private health data.Such ability enhances the sharing of information acrossjurisdictional boundaries.Queries are used to sort and filter the data for analysis.
The query form, including a selection for detector algo-rithms, is shown in Figure 3. Stock filter fields includedate range, selection from list, multi selection, free formtext/number, etc. The free form text input fields supportdatabase wildcards. Combinations of logical “AND” and“OR” operators can be used in the query. As in Enter-prise ESSENCE, queries can be built using a graphicaluser interface so that a detailed knowledge of structuredquery language (SQL) is not needed. This query builderapproach focuses all database access logic into one partof the code base, thereby making it easier to manage.Because these queries may be saved and bookmarked,they can be used to establish case definitions so thatmultiple users may analyze their data in a similar fashionand share results for comparison.Figure 4 is a screen shot showing how data can be ana-
lyzed by examining different categorizations of data rela-tionship. In this example, the data groups are: Sex, Age
in OE.

Campbell et al. BMC Medical Informatics and Decision Making 2012, 12:99 Page 8 of 15http://www.biomedcentral.com/1472-6947/12/99
Group, District and Symptom. Such features may allow theuser to determine if the disease outbreak is more prevalentwithin or among different data groups. Data sources aremore sensitive to outbreak detection if they carry informa-tion that can be used to group persons potentially affectedby an event and to exclude those unaffected.Figure 5 is a screen shot of a time series showing de-
tection analysis. Clicking on the points on the timeseries plot shows the user a detailed view of the records.OE uses a plug-in API for detection algorithms andincludes a selection of “none” to disable use of a detec-tion algorithm. Currently provided algorithms includeExponentially-weighted Moving Average (EWMA), lin-ear regression, Poisson regression, and the US Centersfor Disease Control and Prevention (CDC) Early Aberra-tion Reporting System (EARS versions 1, 2, and 3). Add-itional detection algorithms can be implemented usingthe plug-in API. Time series visualization includesanomaly detection and image customization and export.These features assist users in sharing information whileinvestigating a possible outbreak.
Figure 7 OE screen shot of geographic information system (GIS) map
Figure 6 is a screen shot of a data details analysis. Byallowing the user to “drill down” into the data, users canexamine the specific health information that is resultingin an algorithm-derived alert. Data details, including col-umn ordering and sorting, can be exported to MicrosoftExcel and/or comma-separated variable (CSV) files forfurther analysis using other tools.Figure 7 is a screen shot showing analysis of data by
geographic region. The output of different data queriesand detection algorithms may be used to create mapsof specific types of information. For example, there aredetection algorithms that can be used specifically forgeographic data, such as SatScan that analyzes space-time data [29-31]. Therefore, a user can determinewhether a disease is occurring in clusters or is ran-domly distributed. This allows the user to determinequickly which geographic regions are primarily impactedand to look for geographic outbreak patterns. The abil-ity of OE to export such geographic images may assistusers in sharing information while investigating a pos-sible outbreak.
of data results.

Campbell et al. BMC Medical Informatics and Decision Making 2012, 12:99 Page 9 of 15http://www.biomedcentral.com/1472-6947/12/99
ESSENCE desktop edition (EDE)Overview of software frameworkEDE utilizes the Eclipse Rich Client Platform (RCP), anindustry standard open tools platform used for a varietyof information technology applications [e.g., 32]. This isa customizable platform built with software units called‘plug-ins’ that support modular development. Pluginsare designed to add specific capabilities to an existingsoftware application in a convenient and user-friendlyway. The plug-ins register themselves with and utilizethe services of the existing application and allow develo-pers to add functionality, upgrade features, and deploybug fixes. EDE consists of three primary plug-ins:
1) desktop core, which provides the main userinterfaces;
2) desktop data core, which provides the underlyingdata query mechanism;
3) detector temporal core, which provides detectionalgorithm interfaces.
User interface and data inputThe EDE configuration wizard allows the user to config-ure EDE to support their data, rather than vice versa,thereby minimizing difficulties encountered when ma-nipulating a dataset to enable ingestion by an analysisprogram. Figure 8 shows the data source creation wizardwhere users configure EDE to match their dataset. Thedata source configuration in EDE supports multipledatabase systems, including Microsoft Access, Apache
Figure 8 Configuration wizard for adapting EDE data input totype of data.
Derby, Microsoft SQL Server, Microsoft Excel, Post-greSQL and delimited text files.
Analysis and visualizationAs with OE, the analysis and visualization tools in EDEare data agnostic, meaning that they can be syndromichealth data, diagnostic data, sensor input, EHR, or evennon-medical data. EDE data queries can be created bythe user, performed and saved for future use. Thesequeries are built graphically using a dynamic interface.This interface allows the user to perform groupingqueries using “AND” and “OR” conditions allowing com-plex logic such as “(a AND b) OR (c AND d),” which isdifficult or impossible with some graphical query tools.Figure 9 illustrates the user interface for query creation.When executed, the query created in Figure 9 pro-
duces a time series plot, data details, graphics, and mapsthat can be used to examine the population subsetdescribed by the query. Figure 10 shows an example ofhow different slices of the data can be visualized. Inaddition, different types of detection algorithms can beselected for a query. Currently provided algorithms in-clude Exponentially-weighted Moving Average (EWMA),Gstat (an open source computer code for multivariablegeostatistical modelling, prediction and simulation), lin-ear regression, Poisson regression, and the US Centersfor Disease Control and Prevention (CDC) Early Aberra-tion Reporting System (EARS versions 1, 2, and 3). Inaddition, EDE allows developers to add other algorithmsthrough the use of RCP plug-ins. Using the Eclipse RCPplug-in framework, these added algorithms integrateseamlessly into the EDE application.Figure 11 shows an example of a time series plot gener-
ated by EDE. The red and yellow markers correspond tored and yellow alerts as determined by the detection algo-rithm selected by the user. The user can hover over themarker to get tooltip information regarding the detectionalert. The user can also click on a marker to highlight thatdata point, which then updates data detail views allowingthe user to investigate further the data point.EDE allows the user to configure the look and feel of
the application to suit their perspective and analyticalstyle. This includes having multiple queries displayedconcurrently. Figure 12 illustrates how the user can dragand arrange windows as they choose.EDE also provides a plug-in framework for mapping
geospatial data. This framework includes mapping withEpi Info Epi Map [33] as shown in Figure 13. The USCDC developed Epi Info for use by physicians, nurses,and epidemiologists to collect public health data for stat-istical analyses. Epi Info includes the Epi Map module todisplay geographic maps of data utilizing the Environ-mental Systems Research Institute (ESRI) MapObjects

Figure 9 Example of the user interface for creating a query in EDE.
Campbell et al. BMC Medical Informatics and Decision Making 2012, 12:99 Page 10 of 15http://www.biomedcentral.com/1472-6947/12/99
software. EDE will launch Epi Map for a specific queryand allow the user to customize the map.In addition, EDE supports the Desktop Internet Geo-
graphic Information System (uDig) mapping application,which is an open source Java-based geospatial dataviewer/editor toolkit [34] built with Eclipse RCP. As withEpiMap, uDig can be launched for a specific query andthe map appearance customized by the user. uDig alsoallows developers to customize and integrate geographicinformation systems (GIS) applications, including ESRIshape files, PostGIS, and geospatial web services.
ResultsThe OE system was only recently deployed in 2011and results are not yet available, but the EDE systemhas been in use long enough for preliminary results tobe presented. The initial deployment of EDE was as anadd-in module attached to the national disease surveil-lance system in the Philippines called the PhilippinesIntegrated Disease Surveillance and Response (PIDSR)program. The goal of PIDSR is to reduce morbidityand mortality through a nationwide system that inte-grates facility-based information systems. EDE is nowintegrated with PIDSR and is used to monitor the
temporal trends of diseases that are officially notifiablein the Philippines. Epidemiologists and computerscientists from JHU/APL visited the Philippines to so-licit input from the stakeholders about the systemarchitecture, types of usage, means of inputting data,and training. In 2009, a pilot study was begun toevaluate a simple fever surveillance protocol usingSMS text messages to send daily, patient-level datafrom several local health clinics to the city healthoffice in Cebu City [28]. These data were included ina single SMS text message for each patient who pre-sented with fever at the local clinics. Family and ad-dress codes, age, sex, date of onset, and presentingsigns and symptoms were recorded for each patient asper the usual protocol. A formatted SMS text messageabout each eligible patient was sent each day to a re-ceiver phone connected to a computer at the cityhealth office. Standardized abbreviations were adoptedfor specific signs and symptoms (e.g., ha = headache).An SQL application was used to download the SMSdata from the phone to an Epi Info database, whichwas analyzed using EDE by the city epidemiologist. Re-cently, the local health department has expanded SMSdata inputs to all of Cebu City.
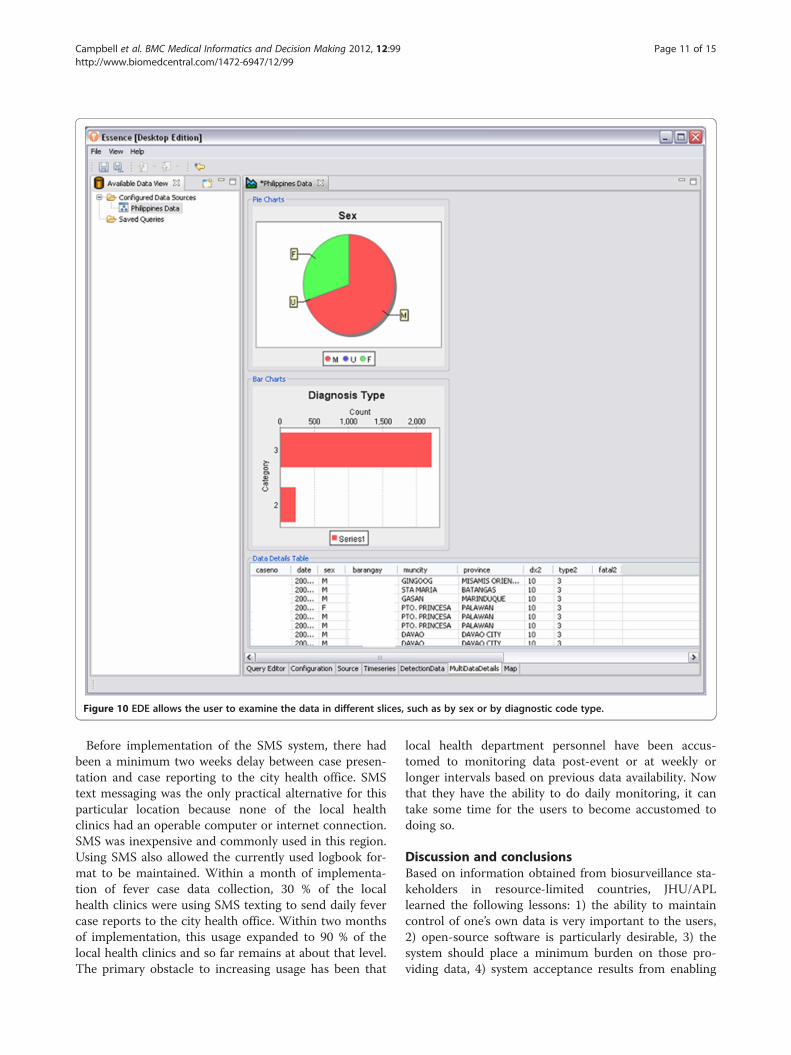
Figure 10 EDE allows the user to examine the data in different slices, such as by sex or by diagnostic code type.
Campbell et al. BMC Medical Informatics and Decision Making 2012, 12:99 Page 11 of 15http://www.biomedcentral.com/1472-6947/12/99
Before implementation of the SMS system, there hadbeen a minimum two weeks delay between case presen-tation and case reporting to the city health office. SMStext messaging was the only practical alternative for thisparticular location because none of the local healthclinics had an operable computer or internet connection.SMS was inexpensive and commonly used in this region.Using SMS also allowed the currently used logbook for-mat to be maintained. Within a month of implementa-tion of fever case data collection, 30 % of the localhealth clinics were using SMS texting to send daily fevercase reports to the city health office. Within two monthsof implementation, this usage expanded to 90 % of thelocal health clinics and so far remains at about that level.The primary obstacle to increasing usage has been that
local health department personnel have been accus-tomed to monitoring data post-event or at weekly orlonger intervals based on previous data availability. Nowthat they have the ability to do daily monitoring, it cantake some time for the users to become accustomed todoing so.
Discussion and conclusionsBased on information obtained from biosurveillance sta-keholders in resource-limited countries, JHU/APLlearned the following lessons: 1) the ability to maintaincontrol of one’s own data is very important to the users,2) open-source software is particularly desirable, 3) thesystem should place a minimum burden on those pro-viding data, 4) system acceptance results from enabling

Figure 11 An example of a time series plot generated by EDE Note the red and yellow dots indicating different types of user-definedalerts.
Campbell et al. BMC Medical Informatics and Decision Making 2012, 12:99 Page 12 of 15http://www.biomedcentral.com/1472-6947/12/99
the user to easily tailor the system to local needs, and 5)sustainability results from local ownership and workingwithin existing needs and capabilities. This list of pointsis based upon informal qualitative discussions with localusers regarding their needs, as our primary focus hasbeen on rapid technology insertion, refinement, and in-creasing usage capacity. In addition to these lessons, ourexperience has revealed the importance of interactionwith the appropriate levels of the local and national gov-ernments and the identification of key individuals whocan serve as champions of the project, including thoseinvolved in local policy and financial matters as well asthe actual users.Therefore, the OE and EDE systems were created by
JHU/APL to offer self-contained disease surveillancetools that can be deployed efficiently at a variety ofresource-limited locations, as well as disaster locations.Both these systems are easily upgradeable and extend-able. While skilled information technology professionalsmay be difficult for public health departments to findand retain, the OE and EDE systems have been simpleenough to operate that this has not been a significant
limitation. EDE was designed as a stand-alone desktopapplication, and OE can be used as a desktop or web-based application. Each provides similar functionality tothe current web deployment of Enterprise ESSENCE[12]. Both systems are based on a modular, component-based application design. This design allows forimproved testability of components and isolation of pro-blems. Repurposing and reuse is also easier and morelikely with a modular design because it mitigates theneed to redevelop or rebuild an application to incorpor-ate adjustments or enhancements. The system structureis data driven to allow for dynamic extension andreconfiguration.These biosurveillance systems were developed to sup-
port a wide variety of user needs in different settings.Both systems will provide user-defined preferences andmechanisms for data input from several types of data-bases. Users can configure the system specifically for thevariables included in their database, thereby easing com-mon data ingestion problems, especially the difficultiesin trying to get disparate data formats to fit a specifictype of data ingestion. Users can design their own

Figure 12 EDE screen shot illustrating the results of multiple data queries and how comparisons may be made.
Campbell et al. BMC Medical Informatics and Decision Making 2012, 12:99 Page 13 of 15http://www.biomedcentral.com/1472-6947/12/99
queries and use different detection algorithms to analyzetheir data, including temporal and spatial analysis.EDE utilizes an Eclipse RCP framework, while OE uses
the Spring framework and Groovy Java language exten-sions. While both systems can operate on a single com-puter without a network connection, the OE system isdesigned to utilize the benefits of network connectivity.
The OE system can also be used to share actionable in-formation via the internet among multiple users andacross different jurisdictions. Both systems provideresults in a format similar to Enterprise ESSENCE [12],including graphs, charts, detailed data on individual ill-ness reports, and geographic maps of locations of indi-vidual illness reports. As open source stand-alone

Figure 13 EDE can be used with Epi Info’s Epi Map for geographical display of data.
Campbell et al. BMC Medical Informatics and Decision Making 2012, 12:99 Page 14 of 15http://www.biomedcentral.com/1472-6947/12/99
desktop applications, they are easily deployable,upgradeable and extendable. These features make EDEand OE ideal for rapid deployment in resource-limitedenvironments where the infrastructure for a full-scaleweb-based biosurveillance system is not immediatelyfeasible. Future efforts are to continue to improve thesoftware features available to the user, while keeping theinterfaces and components as simple as possible so thatmaintenance and sustainability do not require someonewith a high level of information technology expertise.Such biosurveillance systems may then improve thetimeliness of data collection and enhance the early de-tection of disease outbreaks, thereby allowing time formitigation of the effects of these outbreaks.
Competing interestsThe authors declare that they have no competing interests.
Authors’ contributionsTCC was the technical lead and developer for the OE application, andhelped develop EDE. CJH was the technical lead and developer for the EDEapplication and helped develop later versions of OE. SMB wrote themanuscript, selected figures, and obtained references, based on his work on
the ESSENCE project. AMP was the technical lead for telephone and SMSdata ingestion design and development and was a software developer forOE. RAW was the chief software engineer for all versions of ESSENCE. JFSwas the original software technical lead and software developer for OE. JSCwas the chief epidemiologist on the project and obtained user input andusage data on the application. ZM developed several key components onthe EDE project. CJH, TCC, RAW, JSF, JSC, and SHL helped develop userrequirements for these applications. All authors read and approved the finalmanuscript.
DisclaimerThe views expressed here are the opinions of the authors and are not to beconstrued as official or as representing the views of the US Department ofthe Navy or the US Department of Defense.
AcknowledgementsWe would like to acknowledge the collaboration with and financial supportof the U.S. Armed Forces Health Surveillance Center, Division of GEISOperations and the invaluable assistance from our colleagues, including: CDRDavid L. Blazes, AFHSC-GEIS; Dr. InKyu Yoon from the US Armed ForcesResearch Institute of Medical Sciences in Bangkok, Thailand; Dr. John Mark S.Velasco, Ms. Agnes D. Tomayano, Mr. Danny C. Obidas, Mr. Jewernest C.Casquejo, and Dr. Maria Theresa P. Alera from the US Armed Forces ResearchInstitute of Medical Sciences Virology Research Unit, Republic of thePhilippines; Dr. Fe A. Cabugao, Dr. Ilya A. Tac-an, and Ms. Durinda R.Macasocol from the Cebu City Health Office, Republic of the Philippines; andDr. Joan M. Neyra, Dr. Delphis M. Vera, Dr. Ricardo A. Hora, and Dr. Joel

Campbell et al. BMC Medical Informatics and Decision Making 2012, 12:99 Page 15 of 15http://www.biomedcentral.com/1472-6947/12/99
Montgomery at the US Naval Medical Research Center Detachment in Lima,Peru. We thank Ms. Shradda Patel and Dr. Brian Feighner for their assistanceon this manuscript. We are deeply indebted to Mr. Wayne A. Loschen, thedeveloper of the Enterprise ESSENCE system, for his sage guidance on theseprojects.
Author details1Johns Hopkins University Applied Physics Laboratory, 11100 Johns HopkinsRoad, Laurel, MD 20723, USA. 2Sotera Defense Solutions, Inc., 7230 Lee ForestDrive, Columbia, MD 21046, USA.
Received: 22 May 2012 Accepted: 31 August 2012Published: 6 September 2012
References1. Jones K, Patel N, Levy M, Storeygard A, Balk D, Gittleman J, Daszak P: Global
trends in emerging infectious diseases. Nature 2007, 451:990–993.doi:10.1038/nature06536.
2. Katz RL, Gornto SE, Chretien JP: Expert opinion on implementationstrategies for the International Health Regulations (2005). World MedHealth Policy 2011, 3(3). doi:10.2202/1948-4682.1178.
3. World Health Organization (WHO): International Health Regulations. 2ndedition.; 2005. http://whqlibdoc.who.int/publications/2008/9789241580410_eng.pdf Accessed 25 April 2012.
4. Fraser H, Biondich P, Moodley D, Choi S, Mamlin B, Szolovits P:Implementing electronic medical record systems in developingcountries. Inform Prim Care 2005, 1383–95.
5. Were M, Emenyonu N, Achieng M, Shen C, Ssali J, Masaba J, Tierney W:Evaluating a scalable model for implementing electronic health recordsin resource-limited settings. J Am Med Inform Assoc 2010, 17:237–244.
6. Dennehy P, White M, Hamilton A, Pohl J, Tanner C, Onifade T, Zheng K: Apartnership model for implementing electronic health records inresource-limited primary care settings: experiences from two nurse-managed health centers. J Am Med Inform Assoc 2011, 18:820–826.
7. Ashar R, Lewis S, Blazes D, Chretien J: Applying information andcommunications technologies to collect health data from remotesettings: a systematic assessment of current technologies. J BiomedInform 2010, 43:332–341.
8. Hartley DM, Nelson N, Walters R, Arthur R, Yangarber R, Madoff L, Linge J,Mawudeku A, Collier N, Brownstein J, Thinus G, Lightfoot N: Landscape ofinternational event-based biosurveillance. Emerg Health Threats 2010, 3:e3.doi:10.3134/ehtj.10.003.
9. Chretien JP, Burkom H, Sedyaningsih ER, Lasratit RP, Lescano AG, MundacaCC, Blazes DL, Munayco CV, Coberly JS, Ashar RJ, Lewis SH: Syndromicsurveillance: adapting innovations to developing settings. PLoS Med 2008,5(3):e72. doi:10.1371/journal.pmed.0050072.
10. Babin S, Magruder S, Hakre S, Coberly J, Lombardo J: Understanding thedata: health indicators in disease surveillance. In Disease Surveillance: APublic Health Informatics Approach. Edited by Lombardo J, Buckeridge D.Hoboken, New Jersey: John Wiley and Sons; 2007:43–90.
11. Lazarus R, Kleinman K, Dashevsky I, DeMaria A, Platt R: Using automatedmedical records for rapid identification of illness syndromes (syndromicsurveillance): the example of lower respiratory infection. BMC Publ Health2001, 1:9.
12. Lombardo J, Burkom H, Elbert E, Magruder S, Happel Lewis S, Loschen W,Sari J, Sniegoski C, Wojcik R, Pavlin J: A systems overview of the ElectronicSurveillance System for the Early Notification of Community-BasedEpidemics (ESSENCE II). J Urban Health 2003, 80(2, Supplement 1):i31–i41.
13. Lucero C, Oda G, Cox K, Maldonado F, Lombardo J, Wojcik R, Holodny M:Enhanced health event detection and influenza surveillance using ajoint Veterans Affairs and Department of Defense biosurveillancesystem. BMC Med Inform Decis Mak 2011, 11:56.
14. Lewis S, Feighner B, Loschen W, Wojcik R, Skora J, Coberly J, Blazes D:SAGES: A suite of freely available software tools for electronic diseasesurveillance in resource-limited settings. PLoS One 2011, 6(5):e19750.doi:10.1371/journal.pone.0019750.
15. Kalra D, Forslund D: Open source health systems. In Person-Centered HealthRecords. Edited by Demetriades J, Kolodner R, Chrsitopherson G. New York:Springer; 2005:169–185.
16. Savel T, Hall K, Lee B, McMullin V, Miles M, Stinn J, White P, Washington D,Boyd T, Lenert L: A Public Health Grid (PHGrid): architecture and value
proposition for 21st century public health. Int J Med Inform 2010,79:523–529.
17. Mamlin BW, Biondich P, Wolfe B, Fraser H, Jazayeri D, Allen C, Miranda J,Tierney W: Cooking up an open-source EMR for developing countries:OpenMRS – A recipe for successful collaboration. Proc AMIA Annu Symp2006, 2006:Spp529–533.
18. Lambert HD, Leonhardt CF: Federated authentication to supportinformation sharing: Shibboleth in a bio-surveillance information grid. IntCongr Ser 2004, 1268:135–150.
19. Edwards WA, Vaid A, Brooks IS: INDICATOR: an open-source cyberenvironmentfor biosurveillance. Seattle, WA, USA: Proc. 7th International ISCRAMConference; 2010. May.
20. Johns M, Blazes D: International Health Regulations (2005) and the USDepartment of Defense: building core capacities on a foundation ofpartnership and trust. BMC Publ Health 2010, 10(Suppl 1):54.
21. Lewis S, Feighner B, Campbell T, Wojcik R, Coberly J, Blazes D: Suite forautomated global electronic biosurveillance (SAGES). Atlanta, GA, USA: USCenters for Disease Control and Prevention 2011 Public Health InformaticsConference, Session on Low Cost Tools for International Success; 2011.August 22.
22. Johnson R, Hoeller J, Arendsen A, Risberg T: Professional Java Developmentwith the Spring Framework. Hoboken, NJ: Wrox Press, division of John Wileyand Sons; 2005:672.
23. Spring software: SpringSource, a division of VMware.; 2011. http://www.springsource.org. Accessed 2 December.
24. Koenig D, Glover A, King P, Laforge G, Skeet J, Gosling J: Groovy in Action.Shelter Island, NY: Manning Publications; 2007:696.
25. Groovy software: SpringSource, a division of VMware.; 2011. http://groovy.codehaus.org. Accessed 2 December.
26. Lewis S, Wojcik R: Methodologies for data collection. BMC Proc 2008,2(Suppl 3):S5.
27. The power of mobile money: The power of mobile money. In TheEconomist.; 2009. http://www.economist.com/14505519/]. Accessed 30November 2011.
28. Coberly J, Tomayo A, Velasco JM, Cabugao F, Tac-an I, Wojcik R: DengueSMS surveillance project in the Philippines. US CDC Public Health InformationNetwork Conference. Atlanta, GA, USA: US Centers for Disease Control andPrevention (CDC); 2009. September 1.
29. Kulldorff M: Prospective time periodic geographical disease surveillanceusing a scan statistic. J R Stat Soc Ser A 2001, 164(1):61–72.
30. Kulldorf M: SaTScan software. Boston, MA 02215, USA: Harvard MedicalSchool; 2011. http://www.satscan.org, Accessed 9 December.
31. Burkom H: Biosurveillance applying scan statistics with multiple,disparate data sources. J Urban Health 2003, 80(2 Suppl 1):i57–i65.
32. McAffer J, Lemieux J-M: Eclipse Rich Client Platform: Designing, Coding, andPackaging Java Applications. London: Addison-Wesley ProfessionalPublishers, division of Pearson; 2006:504.
33. Epi Info software: US Centers for Disease Control and Prevention, 1600Clifton Rd, Atlanta, GA 30333 USA: http://wwwn.cdc.gov/epiinfo, Accessed22 November 2011.
34. uDig software: Refractions Research, Suite 300, 1207 Douglas Street, Victoria,BC, V8W 2E7, Canada: http://udig.refractions.net, Accessed 22 November2011.
doi:10.1186/1472-6947-12-99Cite this article as: Campbell et al.: Developing open source, self-contained disease surveillance software applications for use in resource-limited settings. BMC Medical Informatics and Decision Making 2012 12:99.