Embed Size (px)
Citation preview

Developing Low Carbon Society 2035 Bhopal: Initiatives and Actions
Manmohan Kapshe School of Planning and Architecture, Bhopal, India
19th AIM International Workshop NIES, Tsukuba Japan
13-14 December 2013
Aashish Deshpande National Institute of Technical Teachers’ Training and Research, Bhopal, India

SPA, Bhopal, India NITTTR, Bhopal, India
Presentation Outline
• Indian Scenario • LCS Development in Bhopal • BRTS Bhopal

SPA, Bhopal, India NITTTR, Bhopal, India
Demographic Transitions in India: Urban/Rural

SPA, Bhopal, India NITTTR, Bhopal, India
Mega UAs/Cities • Three megacities in India as per Census 2011
(Provisional) with 10 million or more population • These are:
• Greater Mumbai UA 18.4 million • Delhi UA 16.3 million • Kolkata UA 14.1 million
53 Million Plus UAs/Cities in India with population of one million or more. In Census 2001 the number was 35.
Million Plus UAs / Cities India: 2011

SPA, Bhopal, India NITTTR, Bhopal, India
Low Carbon Development: Few Questions for India
Recent Govt. Schemes (If these are taking care of Low Carbon guidelines?)
MRTS / BRTS (Is the shift happening? What about stranded assets?)
Urban lifestyle / Awareness (Is society ready to cope up with Low Carbon guidelines?)
Local Governance (Coordination / Plan implementation?)
Financing (Long recovery Period?) Need for Paradigm shift from Project Approach to Holistic Approach

SPA, Bhopal, India NITTTR, Bhopal, India
LOW CARBON SOCIETY: BHOPAL
3
1
2
6
5
7
4

SPA, Bhopal, India NITTTR, Bhopal, India
The Study area Bhopal
• The city is centrally located in India • The climate is composite climate representing a large part of India • The city has physical features like large water body, Hills and forests for analysis
of local variations. • A million plus city, it can represent many large Indian cities. • Amongst the 21 fastest growing cities in India.

SPA, Bhopal, India NITTTR, Bhopal, India
Bhopal: Chronological Development
1010 - 1200 AD 1201 - 1800 AD 1801 - 1850 AD 1851 - 1880 AD 1881 - 1930 AD
1931 - 1955 AD 1956 - 1973 AD 1974- 2000 AD

SPA, Bhopal, India NITTTR, Bhopal, India
Bhopal: Drivers of Change • Population growth
– Urban population has increased at an average decadal growth rate of over 70% in last 4 decades.
– The longer perspective and various estimates indicate that the city would grow around 3.5 million by 2021.
287
405
790
570
0
100
200
300
400
500
600
700
800
2000 2010 2020 2030
Hous
ehol
ds (i
n th
ousa
nds)

SPA, Bhopal, India NITTTR, Bhopal, India
Bhopal: Drivers of Change • Land-use change
– The development plan area has expanded as the density of many wards has reached to more than 400persons/hectare.
– The residential sector has doubled in the two plan period.
0
2000
4000
6000
8000
10000
12000
14000
16000
18000
20000
Residential Commercial Industrial Public andSemi-public
Public utilities Recreational Transportation Total
Area
allo
cate
d in
hecta
re
Land allocation (BDP 1991) Land allocaltion proposed (Draft BDP 2005)
SPA, Bhopal, India NITTTR, Bhopal, India
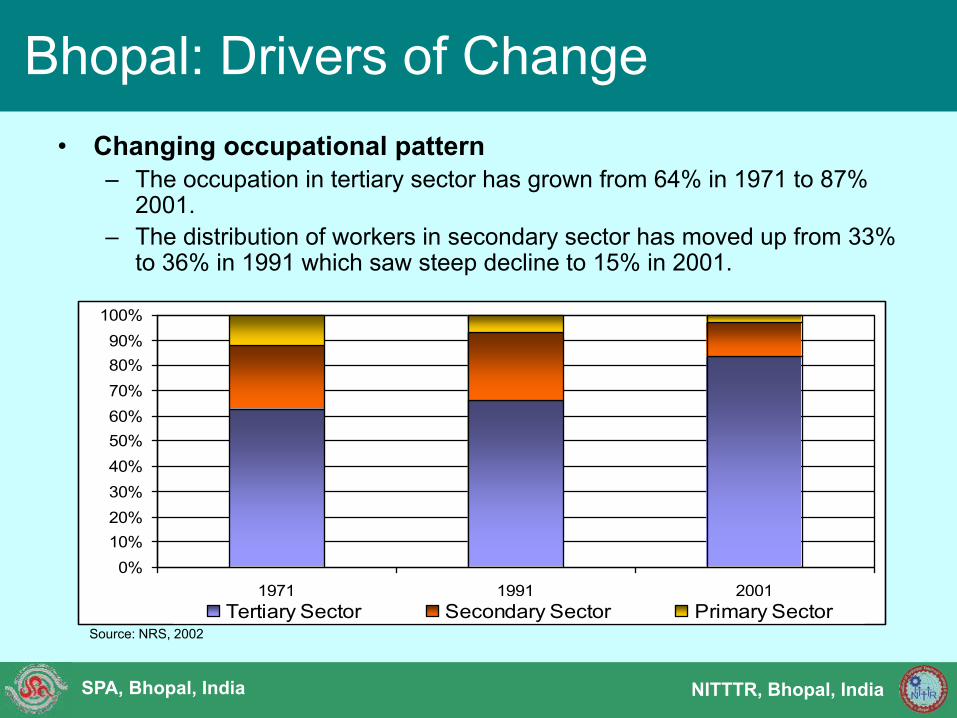
Bhopal: Drivers of Change • Changing occupational pattern
– The occupation in tertiary sector has grown from 64% in 1971 to 87% 2001.
– The distribution of workers in secondary sector has moved up from 33% to 36% in 1991 which saw steep decline to 15% in 2001.
0%10%20%30%40%50%60%70%80%90%
100%
1971 1991 2001Tertiary Sector Secondary Sector Primary Sector
Source: NRS, 2002

SPA, Bhopal, India NITTTR, Bhopal, India
Bhopal LCS vision
• To be a sustainable low carbon city in line with Development Priorities – Ready for future and resilient to change – Conservation and green orient for quality of life – Economic and social competitive clean and
green industries – Efficient transport system – Community participation in city development

SPA, Bhopal, India NITTTR, Bhopal, India
Two Scenarios
• Business As Usual (BAU) scenario – The present trend in Bhopal city has been considered with existing
technology in both residential and transport sector with prevailing economic and demographic trends. The BAU scenario for future energy consumption and emissions projection in Bhopal city envisages the continuum of present government policies, and capture forecast for various economic, demographic, land use and energy use indicators.
• Low Carbon Society (LCS) scenario – For analysing the possibilities of reducing the GHG emissions in future a
sustainable development future scenario is drawn here for Bhopal city that is expected take it towards Low Carbon Society. the energy consumption trajectory / emissions trajectory in residential and transport sector in Bhopal that would result from aggressive policies to promote demand side management, energy efficiency, development of renewable energy, and other policies to promote sustainable development

SPA, Bhopal, India NITTTR, Bhopal, India
Bhopal LCS: Seven Actions Action 1: Green Governance
Action 2: Holistic Habitat
Action 3: Sustainable Style
Action 4: Cellular City Form
Action 5: Form and Flow
Action 6: Nurturing Nature
Action 7: Rural Riches
SECTORAL CONTRIBUTION
ACTIONS Residential Commercial Industry Passenger Transport
Freight Transport
1 GREEN GOVERNANCE 2 HOLISTIC HABITAT 3 SUSTAINABLE STYLE 4 CELLULAR CITY FORM 5 FORM AND FLOW 6 NURTURING NATURE 7 RURAL RICHES

SPA, Bhopal, India NITTTR, Bhopal, India
Actions towards LCS Bhopal 2035
• Action-5: Form and Flow – Integrating Transport with City structure – a two level approach
• Connecting the Cells: – Route optimization considering the topography, water bodies and other
natural barriers. – Reducing travel demand and time between zones. – Enhancing Public Transport systems.
• Walkable Cells: – Transportation within compact closely knit work-home mixed land use
zones. – Promoting non-automated means of transport-Inclusion of bike tracks,
pedestrian walkways, subways and cross overs. – Migration to Sustainable Technology
• Emission norms • Alternative fuels use • Traffic management (passenger and freight) • Parking policy

SPA, Bhopal, India NITTTR, Bhopal, India
Most Recent addition August 2013:
24 km Bhopal BRTS (became operational ) total route length 44 km.
BRTS Bhopal

SPA, Bhopal, India NITTTR, Bhopal, India
Area Population
(lakhs) (2011)
Area (sq km)
Density (persons/sq
km)
Municipal Area 17.96 258 6,961
Planning Area 1.35 505 267
Kolar Town 0.87 50 1,740
Total 20.18 813 2,482
Kolar Mandideep
Neelbad
Bhouri Neori
Bairagarh
Misrod
BHEL
TT Nagar
Kokta Peer Gate
Urban Area – As per census of India Population density shall be greater than 400 persons/ sq. km
No provision for rail based urban transport in Master Plan
City Form

SPA, Bhopal, India NITTTR, Bhopal, India
One of the fastest sprawling city of the country
Sprawling Bhopal City

SPA, Bhopal, India NITTTR, Bhopal, India
Since 1981, the population of Bhopal has multiplied about 2.5 times and number of registered vehicles has increased 85 times. Of the 7.9 lakh registered vehicles in 2011, 92% are cars and two wheelers which accounts for only 28% of modal share.
Population growth
Vehicular growth
Walk 43
Two Wheeler
s 25Car 3
Bus 23
Others 5
Cars12%
Two wheelers
80%
Others8%
Flow of Population and Vehicles

SPA, Bhopal, India NITTTR, Bhopal, India
Road Network Map of Bhopal City
PWD Road 368 km Nagar Nigam Road 125 km NH road 80 km BRTS road 24 km BHEL road CPA road 50 km
BHOPAL MUNICIPAL COPRORATION
Total 647 Km. major city Roads

SPA, Bhopal, India NITTTR, Bhopal, India
Bhopal BRTS: Phase-I
Running ParametersCapacity of Bus (seating and standing) 100
Running Speed 25 kmph Turnaround Time 10 minutes Spacing of Stops 0.6 km
Average Stoppage Time 20 seconds

SPA, Bhopal, India NITTTR, Bhopal, India
Report Generation • Trace of the vehicle travelled in the
specified time range. • Vehicle Start/End Time wise
Searching… • Maximum Speed wise searching…. • Distance wise searching… • Idle location details. • Speed Graph • Vehicle Statistics Schedule Adherence System• Expected Time of Arrival (ETA)
• Deviations or Violations PAS • Next Stop to be reached • Destination of the Bus
Intelligent Transport System Live Tracking • Current Location • Current Speed • Last Updated Time • Status of the Vehicle
PIS• Route Name • Destination • ETA in minutes

SPA, Bhopal, India NITTTR, Bhopal, India
Depot Maintenance Mobile Squad
Dry run Traffic Wardens Regular Training
Training & Support Infrastructure

SPA, Bhopal, India NITTTR, Bhopal, India
Bhopal before BRTS Bhopal after BRTS
• Enhanced Street Lighting
• Better
Public transport
• Promoting
growth along the corridor
BRTS is Transforming Bhopal

SPA, Bhopal, India NITTTR, Bhopal, India
Bhopal before BRTS Bhopal after BRTS
• Improved ROW and travel space • Better Urbanscape • Smoother traffic flow • Segregation by speed of travel.
BRTS is Transforming Bhopal

SPA, Bhopal, India NITTTR, Bhopal, India
Live Tracking on the Hybrid Map

SPA, Bhopal, India NITTTR, Bhopal, India

SPA, Bhopal, India NITTTR, Bhopal, India
Ridership data for month of November 2013 (on Government run transport facilities)
71,220
59,289
21,775
36,582
64,655
75,250
83,809 81,554 79,780 77,949
1,00,437
91,705
84,391
91,497
70,339
84,789 80,748
96,097 93,457 92,130 87,628
1,01,807 1,05,183
72,223
44,743
95,122 91,020 90,526 92,987 94,000
0
20000
40000
60000
80000
100000
120000

SPA, Bhopal, India NITTTR, Bhopal, India
BRTS impact on CO emissions
From Mini Buses From Tata Magic From Two
wheelers From City
Buses
Mode Share (% age) 60% 25% 15% 100%
No of Passengers per day 48000 20000 12000 80000 Number of vehicular trips 1600 2500 8000 1330 Avg. Trip Length 30 20 8 35 Vehicle KMs 48000 50000 64000 46550 CO Emission Factor(gm./km) 2.8 0.64 2.4 2.8 Total Emission(gms.) 134400 32000 153600 130340
Total Emission(kgs.) 134.4 32 153.6 130.34
Nearly 80,000 passenger trips were shifted from other modes of transport to Bus transport
Reduction in CO levels : (134.4+32+153.6)-130.34=189.66 kgs Source: BMC estimates

SPA, Bhopal, India NITTTR, Bhopal, India
Proposed and Ongoing Activities
• Origin & Destination Survey • Classified Traffic Volume Count • Intersection Turning Movement
Count • Boarding and Alighting Survey • Pedestrian Surveys • Public Transport and
Passengers Survey • Public/Passenger Opinion
Survey • Speed and Delay Studies • Parking Studies • Road Inventory
• Topographic Surveys • Topographic survey for major
and minor intersections • Bridge Inventory & Investigation • Geotechnical Investigations • Pavement Investigation • Utility Surveys
Traffic and Transit studies Technical design studies

SPA, Bhopal, India NITTTR, Bhopal, India
Issues and Challenges
• Structural issues – Non uniformity of road widths through out the corridors – Impediments of topography – Presence of heritage buildings
• Behavioural issues – Traffic violation on dedicated corridors – Restricting on-street parking along the BRTS corridors. (Parking Policy)
• Ridership issues – Generation of additional demand on BRTS corridors
• Restricting other competing modes of transport (including individual private modes) • Attracting with quality services
• Institutional challenges – Integration of land use planning and urban transport development
• TOD related provisions in land laws/master plan/zonal plan • Defined enforcement strategies/agencies and • Capacity development of sector experts at planning and execution level