Embed Size (px)
Citation preview

Developing an Educational Module on the Impacts of Climate Change on
Puerto Rico and its Inhabitants
An Interactive Qualifying Project (IQP) to be submitted to the Faculty of Worcester
Polytechnic Institute (WPI) in partial fulfillment of the requirements for the degree of
Bachelor of Science
SUBMITTED BY: PRINCESA CLOUTIER MICHAEL GAGLIANO EMMA RAYMOND
SUBMITTED TO: PROJECT ADVISORS: PROF. LAUREN MATHEWS, WORCESTER POLYTECHNIC INSTITUTE PROF. TINA-MARIE RANALLI, WORCESTER POLYTECHNIC INSTITUTE PROJECT LIAISON: PEDRO RÍOS, UNITED STATES FOREST SERVICE

pg.
ii
Abstract Small islands like the island of Puerto Rico are susceptible to the negative effects of
anthropogenic climate change. Because of this, it is important that climate change education is
developed and implemented on the island so that the population, especially its youth, can
adequately adapt to climate change. The goal of this project was to develop effective lessons that
could be used to teach middle school students in Río Grande, Puerto Rico about the immediate
and long-term effects of climate change. These lessons were designed to be relevant to the
students by providing evidence and examples of climate change in the island of Puerto Rico.
Through the use of interviews with experts on climate change, members of environmental
education initiatives, and teachers, we were able to determine what material to incorporate into
our lessons and how to best deliver it. To analyze the effectiveness of our lessons we tested our
lesson on a ninth grade class and utilized a pre-test and a post-test as a method of evaluation.
These tests asked questions based on the learning objectives covered in the lessons, and were
then compared using statistical analysis. The analysis showed a significant increase in
understanding climate change based on the information provided in the lessons. Additional
evaluations suggested that the lessons required further development to incite a greater increase of
student knowledge on climate change. We revised the lessons, and recommend that they be
tested further and in different settings. Additionally, we developed supplemental lesson outlines
to deepen student understanding of climate change topics that are relevant to Puerto Rico. We
recommend that these outlines be further developed and tested so that they may encourage
climate change education and help pave the way to having a more environmentally conscientious
Puerto Rican youth.

pg.
iii
“Education is the most powerful weapon
we have to change the world.”
-Nelson Mandela

pg.
iv
Executive Summary
Background
Throughout the world, it is apparent that anthropogenic climate change is having more
and more adverse effects on the environment and on society as a whole. These effects are varied,
and can range from the destruction of coral reefs and other marine ecosystems to increased
instances of water-associated diseases such as malaria, cholera, dengue, and viral encephalitis
(Boelee et al., 2012; McMichael et al, 2006). In the Caribbean, the effects of climate change are
more tangible and observable, as the region is comprised of small islands, which will be
impacted by even the most minute effects of climate change, when compared to a large-scale
continental region of the world. Specifically, the Caribbean will face rising sea levels, coastal
erosion, habitat shifts, and changing precipation patterns (Nurse et al., 2014).
In Puerto Rico, these effects are already apparent, and include, among others, the loss of
coastal regions and changes in precipitation. The island’s various ecosystems are all vulnerable
to the impacts of anthropogenic climate change. El Yunque National Forest (EYNF) is one such
ecosystem that is currently experiencing the effects of climate change, such as erosion, habitat
shifts, and species endangerment. As a result, the island has seen the development of several
initiatives and legislative changes to combat this issue. One of the most imperative aspects of this
devlopement is the education of the public on the causes and effects of climate change. It is
especially imperative that the Puerto Rican youth are educated, as they are the future decision
makers of the island. Through education, effective adaptations to climate change can be made by
the public, which can allow for a more sustainable lifestyle and, ideally, the prevention of more
severe effects of climate change.
Methodology and Results
The goal of this project was to develop an educational module for middle school students
of Río Grande, Puerto Rico, which is a city just outside of El Yunque National Forest. This
educational module was intended as the first step towards the development of a climate change
curriculum to be administered by our sponsor, the United States Forest Service (USFS). This
curriculum would be able to be used by teachers and other environmental education groups, and
would include material that focused in particular on the region. To achieve this project goal, our
team developed the following project objectives:

pg.
v
1. Identify the main concepts and concerns with respect to climate
change in Puerto Rico.
2. Determine the best way to educate middle school students in Río
Grande
3. Create an educational module for the area and our targeted students
4. Evaluate the effectiveness of our developed learning unit and revise as
necessary.
Our sponsor selected a local middle school for our team to use as a resource for our last
three objectives. This school, the Carmen L. Feliciano Carreras del Sector Palmer Middle
School, is a Spanish language middle school serving grades seven through nine, and is just ten
minutes from El Yunque, in the city of Río Grande. More specifically, we were paired with a
ninth-grade class in this school. The entire class was also a participant of an environmental youth
initiative known as 4-H. The school integrates extracurricular activities with electives instead of
having them after school. Therefore, the class participated in the 4-H organization primarily as
an integration with their visual arts elective. As members of 4-H, the class often took field trips
to El Yunque, and had already formed a strong relationship with our sponsor.
This first objective was to identify what concepts and concerns that experts in various
fields related to climate change were aware of. Thes experts included technicians and managers
associated with the USFS, professors at the University of Puerto Rico, as well as participants in
various environmental education initiatives. Through interviews with these people we were able
to determine what the content of our lessons should be and what kinds of activities and topics
had been successful in similar initiatives. We received a general consensus from these interviews
that the Puerto Rican public was generally unaware of, and lack of concern about, climate
change. This was inclusive of the youth that our lessons were to be geared towards. As such, we
were frequently advised to make our lessons introductory, to start the process of emerging
students into the topic of climate change, but also relatable by providing local examples in order
to drive the point home and emphasize the importance of the topic in a manner that would make
the students care.
To understand exactly how we would develop our lesson plans, we went to the school in
which we would be testing the lessons to learn more about the classroom structure of the school
itself. We met objective 2 in two parts: classroom observations and teacher interviews. In our
classroom observations, we noted that lectures were conducted in Spanish, but classroom

pg.
vi
materials, such as activities and informative posters, were often in English. We took this to
denote that there was at least some understanding of and exposure to English amongst the
students, allowing us to implement the use of graphs and figures in English as needed in our
lessons. We also observed that the time in class was a mixture of lecture and interactive
group/class activities, which gave us the flexibility to include both in our lesson.
We interviewed three teachers to further our understanding of the school’s academic
structure. These interviewees consisted of a mathematics teacher, a general science teacher, and a
visual arts teacher. We received a wide variety of information that helped guide our lesson plan
development. This included how typical classes were structured in the school, how the teachers
plan their lessons, and the integration of climate change and the environment into the class
material.
Once we understood what topics we were going to include in our lessons, as well as how
to execute them, we began the development of our educational module (objective 3). We utilized
background research on creating a curriculum and general pedagogy in the development of our
lesson plans. We first created 7 learning objectives that we intended to be achieved by our two
lessons, such as “Students will be able to identify sources of CO2 emissions.” We created
activities, homework assignments, discussion questions and diagrams to address these learning
objectives. In the first lesson, we covered topics such as the greenhouse effect, the different
greenhouse gases, the relationship between carbon dioxide emissions and global temperatures,
the carbon cycle, and sources of carbon dioxide emissions. The impacts of climate change such
as rising sea levels, changes in precipitation patterns, and changing conditions for plants and
animals were discussed in detail in our second lesson. We developed a PowerPoint presentation
in order to display the graphs and diagrams of our lesson. In addition, we created student
worksheets that included these same diagrams and graphs for students to complete and materials
for the activities of our lesson. In order to make our lesson easier to use, we wrote an instructor’s
guide to teaching each facet of our lessons with extensive explanations of the many complex
concepts that were incorporated in our lesson. Lastly, we translated all the written components of
our lesson to Spanish to increase the usability of our lesson.
Once the lessons were developed, we proceeded to administer our pilot lessons to the 4-H
class of students at the Carmen Feliciano Carreras Middle School and test its effectiveness

pg.
vii
(Objective 4). We administered our pre-test, post-test, and lessons over the course of three days.
On the first day, we delivered a pre-test to the 4-H students, as well as distributed a student
questionnaire to the four other classes of ninth graders. On the second and last day, we delivered
lesson one and lesson two to the students, respectively. Immediately following lesson two, we
delivered the post-test. The comparison of the pre-test and post-test results for each student can
be seen below.
Student # Number of
questions correct
(Pre-test)
Numbers of
questions correct
(Post-test)
1 3 9
2 8 7
4 2 1
5 5 8
6 5 9
7 4 5
10 5 8
11 5 5
13 7 6
14 3 6
16 8 9
17 5 8
18 6 7
Using the data from the pre- and post-tests, we performed a paired samples t-test within
subjects statistical analysis to determine whether our pilot lessons were effective. This test
worked under the assumption that there would be no increases in test scores between the pre- and
post-tests, also known as the null hypothesis. The application of the paired samples t-test within
subjects showed a statistically reliable difference between the mean number of the pre-test (mean
= 5.08, sd = 1.85) and the post-test (mean = 6.69, sd = 2.25, t= =2.63, df=12, p = .022, α = .05).
Because the p-value was less than or equal to .05, we were able to reject the null hypothesis, and
definitively conclude that our pilot lessons were effective in increasing the students’ climate
change knowledge at the 5% significance level.

pg.
viii
After the formal testing of our lessons, we completed a process of revisions on the
lessons we administered. These revisions were largely based upon the changes in score of the
students on each learning objective, from the pre- to post-test. In order to obtain a breakdown in
student learning by objective from the pre- to post-test, we calculated the mean number of
students that answered each question correctly. Then, we grouped together questions of the same
learning objective and determined a rough average score for each objective. We informally
compared these scores and decided upon which learning objectives needed to be addressed by
revisions. Additional edits were also made according to the suggestions of the teacher of the 4-H
class. After these major revisions were applied, we developed 4 additional lesson outlines that
briefly explained different topics and activities that could be used to provide a more complete
learning unit on climate change in Puerto Rico. To accompany the additional lesson outlines, we
created a bibliography of different activities that detailed various supplemental activities, their
sources, and where one could utilize them within the context of our learning unit.
Recommendations
Our overarching recommendation to those looking to expand upon this project would be
to continue the development and testing of our learning unit. Particularly, we recommend that
any future iteration of the project conduct validity and reliability tests on their pre- and post-tests,
as these analyses can definitively state whether these tests are an appropriate representation of
the learning objectives. Upon further expansion and testing, we believe our learning unit can
become an extremely useful educational resource for teaching anthropogenic climate change, and
how it specifically affects Puerto Rico and its inhabitants.

pg.
ix
Acknowledgements It has been an honor to work on this project and to be a part of the movement to preserve
the landscape, environment, and future of Puerto Rico through the education of youth on the
topic of climate change. We would like to thank our sponsor, the United States Forest Service
(USFS) for providing us with the opportunity to work on this project, as well as our liaisons
Pedro Ríos and Felipe Cano, both of the USFS, for the resources and time they’ve put into
making this project a success. Additionally, we would like to thank Worcester Polytechnic
Institute (WPI) for the opportunity to complete our Interactive Qualifying Project (IQP) in the
Puerto Rico project site, and our academic advisors, Professors Tina-Marie Ranalli and Lauren
Mathews, for their continued guidance and support throughout the course of this project. Thank
you to Professor Stephen McCauley for his guidance in constructing our project proposal during
the preparation phase of this project. We would like to thank the USFS technicians Benjamin
Fuentes and Bruce Drapeau for providing transportation to and from El Yunque, as well as to the
school in which we tested our learning unit.
We would like to acknowledge the Carmen L. Feliciano Carreras del Sector Palmer
Middle School in Río Grande, Puerto Rico, in which we tested our learning unit. We thank the
teachers of this school, in specific Amabel Soto and Marganese Sanjunto, for their cooperation in
distributing student questionnaires and in obtaining information on Puerto Rican educational
standards. We especially want to thank Stephanie Santos for her willingness to test our lesson in
her classroom as well as for her valuable feedback on the lesson itself. In addition, we would like
to thank the students of the ninth grade 4-H class (Group 9-2) for their committed and
enthusiastic participation in the testing of our lesson.
We acknowledge all of our interviewees including Filipe Cano, Edgardo Gonzalez,
Caroline Krupp, Federico Cintron-Moscoso, Marcela Cañon, Ashley Perez, Eduardo Agostini,
Isabel Rivera, Isabel Pares Ramos, and Cybele Londoño. The information we learned from them
was extremely useful when creating our test lessons and additional lesson scaffolds. We want to
thank Craig Teed Jr., Daniel Youkana, and Juan Torres Betancur, or team AltCrops, for helping
us in the informal testing of our habitat shift activity during the development process of our
lessons. Additionally, we would like to acknowledge Kristin Gagliano for the assistance and
guidance she provided for the utilization of Statistical Package for the Social Sciences (SPSS).
Lastly, we would like to thank the Courtyard Marriot, Miramar, for housing us and becoming a
home to us throughout our two months in Puerto Rico. Specifically, we would like to thank the
hotel concierge staff for all the help they provided in translating many communications to our
various project connections, access to many necessary office supplies for the administration of
our lessons, and more. Without the help of all of these people, the completion of our project
would not have been possible. From the three us, we express our deepest gratitude for making
this a challenging and enjoyable learning experience.

pg.
x
Reconocimientos Ha sido un honor trabajar en este proyecto y ser parte del movimiento para preservar el
paisaje, el medio ambiente, y el futuro de Puerto Rico a través de la educación de los jóvenes en
el tema de cambio climático. Nos gustaría dar las gracias a nuestro patrocinador, el Servicio
Forestal de los Estados Unidos (USFS) por darnos la oportunidad de trabajar en este proyecto,
así como nuestros enlaces Pedro Ríos y Felipa Cano, ambos del USFS, por los recursos y el
tiempo que han puesto en hacer de este proyecto un éxito. Además, nos gustaría dar las gracias a
Worcester Polytechnic Institute (WPI) por la oportunidad de completar nuestro Proyecto
Interactivo Calificación (IQP) en el sitio de proyecto Puerto Rico, y nuestros asesores
académicos, profesores Tina-Marie Ranalli y Lauren Mathews, por su orientación continua y
apoyo durante el transcurso de este proyecto. Gracias a Stephan McCauley por su ayuda y
orientación en la construcción de nuestra propuesta de proyecto durante la fase de preparación
del proyecto. Nos gustaría dar las gracias a los técnicos del USFS, Benjamín Fuentes y Bruce
Drapeau, de proporcionar el transporte desde y hacia El Yunque, así como a la escuela en la que
hemos probado nuestra unidad de aprendizaje.
Nos gustaría reconocer la Escuela Intermedia Feliciano Carreras del Sector Palmer en Río
Grande, Puerto Rico, en la que hemos probado nuestra unidad de aprendizaje. Damos las gracias
a las maestras de esta escuela, en específico Amabel Soto y Marganese Sanjunto, por su
colaboración en la distribución de los cuestionarios de los estudiantes y en la obtención de
información sobre las normas educativas de Puerto Rico. En especial queremos agradecer a
Stephanie Santos por su disposición para poner prueba nuestra lección en su salón de clases, así
como por su valiosa opinión sobre la misma lección. Además, nos gustaría dar las gracias a los
estudiantes de la clase 4-H del noveno grado (grupo 9-2) por su participación comprometida y
entusiasta en la prueba de nuestra lección.
Reconocemos todos nuestros entrevistados incluyendo Filipe Cano, Edgardo Gonzalez,
Caroline Krupp, Federico Cintron-Moscoso, Marcela Cañon, Ashley Perez, Eduardo Agostini,
Isabel Rivera, Isabel Pares Ramos, y Cybele Londoño. La información que hemos aprendido de
ellos fue extremadamente útil al crear nuestras lecciones de prueba y el desarrollo de lecciones
adicionales. Queremos agradecer a Craig Teed Jr., Daniel Youkana, y Juan Torres Betancur, o el
equipo AltCrops, por ayudarnos en la prueba informal de nuestra actividad de cambios de
hábitats durante el proceso de desarrollo de nuestras lecciones. Además, nos gustaría reconocer
Kristin Gagliano para su asistencia y orientación que se proporcionó para la utilización de
Paquete Estadístico para Ciencias Sociales (SPSS). Por último, nos gustaría dar las gracias al
Courtyard Marriott, en Miramar, por recibirnos y por ser un hogar para nosotros durante nuestros
dos meses en Puerto Rico. Específicamente, nos gustaría dar las gracias al personal de
conserjería para toda la ayuda que ellos proporcionaron en la traducción de muchas
comunicaciones a nuestras diversas conexiones del proyecto, el acceso a muchos materiales de
oficina necesarios para la administración de nuestras lecciones, y mucho más. Sin la ayuda de
todas las personas mencionadas, la realización de nuestro proyecto no hubiera sido posible.
Desde los tres de nosotros, expresamos nuestro agradecimiento más profundo por hacer de esto
una experiencia de aprendizaje estimulante y agradable.

pg.
xi
Table of Contents
Abstract ......................................................................................................................................................... ii
Executive Summary ..................................................................................................................................... iv
Background .............................................................................................................................................. iv
Methodology and Results ........................................................................................................................ iv
Recommendations .................................................................................................................................. viii
Acknowledgements ...................................................................................................................................... ix
Reconocimientos ........................................................................................................................................... x
List of Figures ............................................................................................................................................. xv
List of Tables ............................................................................................................................................. xvii
1. Introduction ............................................................................................................................................... 1
2 Background ................................................................................................................................................ 4
2.1 Introduction ......................................................................................................................................... 4
2.2 El Yunque ........................................................................................................................................... 4
2.3 Climate Change ................................................................................................................................... 6
2.3.1 The Tropical Rainforest Biome .................................................................................................... 6
2.3.2 Causes of Climate Change in Tropical Rainforests ..................................................................... 7
2.3.3 Effects of Climate Change in Tropical Rainforests ................................................................... 11
2.4 Climate Change Initiatives in Puerto Rico ........................................................................................ 15
2.5 Education .......................................................................................................................................... 17
2.5.1 Pedagogy .................................................................................................................................... 17
2.5.2 Creating and Assessing a Curriculum ........................................................................................ 19
2.5.3 STEM Education ........................................................................................................................ 25
2.5.4 Climate Change Education ......................................................................................................... 26
2.5.5 Education in Puerto Rico ........................................................................................................... 28
3. Methodology ........................................................................................................................................... 30
Objective 1 .......................................................................................................................................... 30
Objective 2 .......................................................................................................................................... 31
Objective 3 .......................................................................................................................................... 32
Objective 4 .......................................................................................................................................... 33
4. Results and Discussion ........................................................................................................................... 35
Objective 1 .............................................................................................................................................. 35
Objective 2 .............................................................................................................................................. 39

pg.
xii
Objective 3 .............................................................................................................................................. 43
Objective 4 .............................................................................................................................................. 46
5. Recommendations ................................................................................................................................... 55
Literature Cited ........................................................................................................................................... 58
Appendix A: Interview and Questionnaire Questions ................................................................................ 69
1. Interview Questions ............................................................................................................................ 69
Appendix B: Interview Transcripts ............................................................................................................. 72
Climate Change and Climate Change Education Expert Interviews: ..................................................... 72
Interview 1: Filipe Cano ..................................................................................................................... 72
Interview 2: Edgardo Gonzalez ........................................................................................................... 81
Interview 3: Caroline Krupp ................................................................................................................... 87
Interview 4: Federico Cintron-Moscoso ............................................................................................. 96
Interview 5: Marcela Cañon .............................................................................................................. 101
Interview 6: Ashley Pérez & Eduardo Agostini ................................................................................ 111
Interview 7: Isabel Rivera ................................................................................................................. 119
Interview 8: Isabel Pares Ramos ....................................................................................................... 125
Environmental Specialist Interview Coding Charts .............................................................................. 130
Educator Interviews: ............................................................................................................................. 138
Interview 1: Amabel Soto ................................................................................................................. 138
Interview 2: Stephanie Santos ........................................................................................................... 145
Interview 3: Marganese Sanjunto ..................................................................................................... 151
Interview 4: Cybele Londoño ........................................................................................................... 157
Educator Interview Coding Charts ........................................................................................................ 165
Appendix C: Proposed Learning Unit - Pre-test ....................................................................................... 169
Appendix D: Lesson PowerPoint Presentation ......................................................................................... 171
Appendix E: Proposed Learning Unit - Lesson 1 ..................................................................................... 175
Part I: Pre-Homework ........................................................................................................................... 175
Part II: In-class activities ...................................................................................................................... 175
Part III: Homework activity ................................................................................................................. 191
Part IV: Additional materials ................................................................................................................ 191
Lesson 1 Worksheet (English) .......................................................................................................... 191
Pictionary Activity Worksheet (English) .......................................................................................... 197
Homework Activity Worksheet (English) ........................................................................................ 199

pg.
xiii
Appendix F: Proposed Learning Unit- Lesson 2 ...................................................................................... 200
Part I: In-Class Activities ...................................................................................................................... 200
Part II. Additional Materials ................................................................................................................. 212
Habitat Activity (English) ................................................................................................................. 212
Appendix G: Proposed Learning Unit - Post-test ..................................................................................... 218
Appendix H: Lesson PowerPoint Presentation (Spanish) ......................................................................... 221
Appendix I: Proposed Learning Unit (Translated) – Pre-test ................................................................... 225
Appendix J: Proposed Learning Unit (Translated) – Lesson 1 ................................................................. 228
Parte I: Pre-Tarea .................................................................................................................................. 228
Parte 2: Actividades de Clase................................................................................................................ 228
Parte III: Tarea ...................................................................................................................................... 241
Parte IV: Materiales Adocionales ......................................................................................................... 242
Lesson 1 Worksheet (Spanish) .......................................................................................................... 242
Pictionary Activity (Spanish) ............................................................................................................ 249
Homework Activity (Spanish) .......................................................................................................... 251
Appendix K: Proposed Learning Unit (Translated) – Lesson 2 ................................................................ 252
Lesson 2 Instructor Guide (Spanish) ..................................................................................................... 252
Habitat Activity (Spanish) .................................................................................................................... 262
Appendix L: Proposed Learning Unit (Translated) – Post-test ................................................................. 269
Appendix M: SPSS Output and Additional Graphical Analysis ............................................................... 272
SPSS Outputs ......................................................................................................................................... 272
Pre-test and Post-test Data for the 4-H Class: ....................................................................................... 275
Pre-test (Paired Samples) .................................................................................................................. 275
Post-test (Paired Samples) ................................................................................................................ 276
Pre-test Scores: 9-2 Class .................................................................................................................. 277
Pre-test Scores: 9-3 Class .................................................................................................................. 278
Pre-test Scores: 9-4 Class .................................................................................................................. 279
Pre-test Score: 9-5 Class ................................................................................................................... 280
Pre-test Scores: 9-6 Class .................................................................................................................. 281
Additional Graphs: Comparing Pre- and Post-tests of the 4-H Group .................................................. 282
Appendix N: Revised Lesson PowerPoint Presentation ........................................................................... 283
Appendix O: Revised Learning Unit - Lesson 1 ....................................................................................... 287
Appendix P: Student materials .................................................................................................................. 305

pg.
xiv
Lesson 1 Worksheet .............................................................................................................................. 305
Pictionary Activity Worksheet .............................................................................................................. 310
Homework Activity Worksheet ............................................................................................................ 312
Appendix Q: Revised Learning Unit - Lesson 2 ....................................................................................... 313
Habitat Activity ..................................................................................................................................... 326
Appendix R: Additional Lesson Outlines ................................................................................................. 333
Lesson 3: Water .................................................................................................................................... 333
Lesson 4: Impacts on Humans, Adaptation, and Mitigation ................................................................. 336
Lesson 5: Recycling .............................................................................................................................. 338
Lesson 6: Food ...................................................................................................................................... 339
Appendix S: Activity Bibliography ............................................................................................................. 343
CO2 Observation Activity: .................................................................................................................... 343
Activity 3.3; Baúl de Actividades ......................................................................................................... 344
Activity 3.4; Baúl de Actividades ......................................................................................................... 349
Climate Kids ......................................................................................................................................... 355
Bag an old T-shirt ............................................................................................................................. 355
Make Sun S’mores ............................................................................................................................ 355
Do a Science Fair Project .................................................................................................................. 355
Videos ................................................................................................................................................... 356
ClimateKids: What is happening in the ocean? ................................................................................ 356
Mythbusters: The Great Ice Debate .................................................................................................. 356
The Human Impact of Climate Change: Personal Stories from Belize, Bolivia, and Brazil ............ 356

pg.
xv
List of Figures Figure 1: Diagram of the Greenhouse Effect (GRID Arendal & UNIP)........................................................... 8
Figure 2: Comparison of Global Temperature and Carbon Dioxide Concentrations Over Time (NOAA,
2014). ............................................................................................................................................................ 9
Figure 3: Projected Global Temperature in the Caribbean From 1900 to 2100 Based on Two Emission
Scenarios (From Karl et al. (2010) using data from Smith et al. (2008) and CMIP-3A (1993) .................... 10
Figure 4: Projected Pricipitation Patterns in the Caribbean from 1900 to 2100 Based On Two Emission
Scenarios (From Karl et al. (2010) using data from CMIP-3A (1993) .......................................................... 11
Figure 5: The maximum pH levels that can be tolerated by these aquatic animals (EPA, 2012) ............... 13
Figure 6: Topics of Interest - Climate Change ............................................................................................. 36
Figure 7: Education Techniques Discussed in Interviews ........................................................................... 42
Figure 8: Activity from Lesson 1 (see Appendix uviwelyb) ......................................................................... 43
Figure 9: Excerpt from our Instructor's Guide ............................................................................................ 45
Figure 10: Plot of Mean Test Scors for Each Ninth Grade Class as Determined by an ANOVA test ........... 50
Figure 11: Depiction of natural climate change over the Earth's history .................................................. 176
Figure 12: Greenhouse Effect diagram ..................................................................................................... 178
Figure 13: Diagram of the greenhouse effect (GRID Arendal and UNIP) .................................................. 179
Figure 14: Relative percentage of greenhouse gases in terms of greenhouse gas emission levels
(Environmental Protection Agency) .......................................................................................................... 180
Figure 15: A Comparison of Carbon Dioxide Concentrations and Global Temperature over the last
century (National Oceanic and Atmospheric Administration) .................................................................. 182
Figure 16: Greenhouse Gas concentrations from Year 0 to 2005 (Global Greenhouse Warming) .......... 184
Figure 17: Relationship between Global Temperature Anomaly and Carbon Dioxide Concentration
(Environmental Protection Agency) .......................................................................................................... 184
Figure 18: Simplified depiction of the carbon cycle (UCar.edu) ............................................................... 185
Figure 19: Detailed depiction of the carbon cycle (Sciencelearn.org) ...................................................... 186
Figure 20: Breakdown of carbon dioxide emission by source of emission (Environmental Protection
Agency) ..................................................................................................................................................... 188
Figure 21: Una representación de cambio climático natural sobre la historia de la Tierra ...................... 229
Figura 22: Un grafico del efecto invernadero ........................................................................................... 231
Figura 23: Un diagrama del efecto invernadero (GRID Arendal y UNIP) .................................................. 232
Figura 24: Porcentaje relativo de gases invernaderos en términos de los niveles de emisión de gases
invernaderos (Agencia de la Protección Ambiental). ............................................................................... 233
Figura 25: Una comparación de las concentraciones de dióxido de carbono y la temperatura global
durante el siglo pasado. (National Oceanic and Atmospheric Administration) ....................................... 235
Figura 26: Concentraciones de gases invernaderos desde el año 0 hasta el año 2005 (Global Greenhouse
Warming) .................................................................................................................................................. 236
Figura 27: Relación entre la temperatura global de anomalías y la concentración de dióxido de carbono
(EPA) .......................................................................................................................................................... 237
Figura 29: Representación detallada del ciclo del carbono (Sciencelearn.org) ........................................ 238
Figura 28: Una representación simplificada del ciclo del carbono (UCar.edu) ......................................... 238

pg.
xvi
Figura 30: Distribución de las emisiones de dióxido de carbono por fuente de emisión (EPA) ............... 240
Figure 31: Natural climate change over the Earth's history ...................................................................... 289
Figure 32: Greenhouse Effect diagram ..................................................................................................... 291
Figure 33: Diagram of the greenhouse effect (GRID Arendal and UNIP) ............................................... 292
Figure 34: Relative percentage of greenhouse gases in terms of greenhouse gas emission levels
(Environmental Protection Agency) ......................................................................................................... 293
Figure 35: A Comparison of Carbon Dioxide Concentrations and Global Temperature over the last
century (National Oceanic and Atmospheric Administration) .................................................................. 296
Figure 36: Greenhouse Gas concentrations from Year 0 to 2005 (Global Greenhouse Warming) .......... 297
Figure 37: Relationship between Global Temperature Anomaly and Carbon Dioxide Concentration
(Environmental Protection Agency) ......................................................................................................... 297
Figure 38: Simplified depiction of the carbon cycle (UCar.edu) ............................................................... 298
Figure 39: Detailed depiction of the carbon cycle (Sciencelearn.org) ...................................................... 299
Figure 40: Breakdown of carbon dioxide emission by source of emission (Environmental Protection
Agency) ..................................................................................................................................................... 300

pg.
xvii
List of Tables Table 1: Creative Learning Techniques (Iowa State University, 2014) ....................................................... 20
Table 2: Eight key aspects of climate change education (National Research Council, 2010) ..................... 27
Table 3: Explainations of the Identified Climate Change Topic .................................................................. 36
Table 3: Learning Objectives For Our Two Developed Lessons About Climate Change .......................... 43
Table 4: Paired Data for the 12-Question Pre- and Post-Tests ................................................................... 48
Table 5: Mean Number on Correct Responses by Objective (Entire Class) ................................................ 48
Table 6: Descriptive Statistics of Initial Student performance on 12 Pre-test Questions........................... 49

1. Introduction Climate change is the modification of the Earth’s climate resulting from changes in the
atmosphere as well as interactions between the atmosphere and other factors within the Earth’s
system (Cusbasch et al., 2013). This change in climate can range from local seasonal changes to
a global shift in weather patterns. While it is a natural occurrence, since the latter years of the
Industrial Revolution (1820-1840) the planet has seen unusually dramatic changes in its climate
as a direct result of human activity. Human influenced (anthropogenic) climate change, including
high emissions of greenhouse gasses into the atmosphere and deforestation, has resulted
primarily in an increase in the Earth’s temperature by 0.9°C in the span of twenty years. This
form of climate change, known as anthropogenic warming or global warming, coupled with
natural climate change has had and continues to have undesirable effects all over the world
(Cusbasch et al., 2013).
Though climate change is considered a global issue, the effects it has on different
ecosystems and biomes are extremely varied. For example, in northern Canada there was a 20%
decrease in the polar bear population between the years of 1987 and 2004. This decrease has
been correlated to decreases in the amount of time that sea-ice is present in the habitat, one of the
effects of climate change. This results in longer fasting periods for the polar bears on land and
inadequate fat reserves for them to live off of as they fast (Guardia et al., 2013). Furthermore, in
sub-Saharan Africa, there has been a trend towards decreases in the precipitation of the area
since 1970. Additionally, there has been a doubled rate of rain runoff which, coupled with
increasingly variable levels of precipitation, has resulted in more severe floods (Boelee et al.,
2012). This high variability of rainfall in the area is predicted to become even more variable with
climate change. Therefore, wet seasons and dry seasons will become more extreme, which will
lead to millions of people experiencing increased water stress during dry seasons by the year
2020. One product of this stress is the increase of water-associated disease burdens (Boelee et al.,
2012) including viral diseases such as malaria, cholera, and viral encephalitis (McMichael et al,
2006).
Likewise, tropical rainforests throughout the world have also been affected by climate
change. These forests are important natural regulators of the planet’s atmosphere, as they are
partially responsible for the removal of carbon dioxide (CO2) from the atmosphere (Ricker,

pg.
2
2007). They are a great source of biodiversity and pharmaceutical treatments, such as the rosy
periwinkle of Madagascar, which is used today as a part of cancer therapy (Curry, 2012). Higher
concentrations of CO2 combined with higher average temperatures and changed precipitation
patterns alter the behavior of plants in a tropical rainforest by changing photosynthesis and
respiration rates. Such changes in tropical rainforest vegetation are concerning, considering their
key role in regulating the essential carbon, water, and nutrient cycles of the forest (Ostendorf et
al., 2001).
Similar to other tropical rainforests around the world, El Yunque National Forest, in the
Commonwealth of Puerto Rico, is currently experiencing changes due to shifts in the climate of
the area (Billmire et al., 2008). Throughout the island of Puerto Rico the average minimum
temperatures have risen over recent years at rates higher than typical global warming trends. The
effects of this are especially noticeable in El Yunque, where the rain patterns of the region have
changed, resulting in more drastic dry and wet seasons, as well as a trend towards a drying of the
forest. If these trends continue, the result could be a complete change to many components of the
forest including the local extinction of several indigenous plants and animals (Billmire et al.,
2008).
Unified global cooperation to mitigate the effects of climate change has thus far been
unsuccessful (Rao, 2014); instead, the efforts of individual governments, non-governmental
organizations (NGOs), and communities have shifted to adapting to climate change. These
efforts include government regulations and objectives (Swedish Environmental Protection
Agency, 2012; United Nations Environmental Programme, n.d.), agricultural adaptation
(Yulandhika & Nugrahanti, 2014), community engagement, and education. Educating
community members, especially youth, on climate change is a particularly useful method of
communicating the importance of adaptation to climate change, since education can encourage
support for policy changes (Yulandhika & Nugrahanti, 2014) and unify communities to adapt to
climate change as a whole (Cano, personal communication, 2014). As the effects of climate
change in Puerto Rico continue to manifest themselves, the need for climate change education
will become greater. While there have been initiatives to develop effective educational materials
on this issue, the lack of environmental literacy of youth in the area, as well as their families,
continues to be problematic (Cano, personal communication, 2014).

pg.
3
Our goal was to develop an effective education module that can be used to teach middle
school students in the city of Río Grande, just outside of El Yunque National Forest, about the
immediate and long-term impacts of climate change. In order to achieve our project goal, there
were several objectives that must be reached. We first identified the main concerns of local
environmental experts, in relation to climate change. We also identified how the education
system is structured in middle schools in Río Grande. We acquired this information through the
use of classroom observations and interviews with teachers. By doing this, we ascertained the best
ways to educate local students on climate change. Using the information gathered, as well as
applying various principles of pedagogy, we developed a learning unit to be used by the USFS to
be distributed to teachers as they see fit. In addition, we delievered two lessons of our module to
a 4-H class in the Carmen Feliciano Middle School in Río Grande. By conducting pre- and post-
tests we developed for those two lessons, we evaluated the effectiveness of our learning unit.
This information was used to modify our educational module to increase its effectiveness. These
steps helped us pave the way towards preparing a more environmentally conscientious youth for
the future effects of climate change.

pg.
4
2 Background
2.1 Introduction
The area that is currently designated as El Yunque National Forest has been an important
area in Puerto Rico for hundreds of years, and adds a fundamental depth to the culture and
history of Puerto Rico. To understand the importance of climate change literacy in the area
today, it is vital that one understands the history of the forest, as well as how climate change may
adversely affect it and its surrounding communities. By understanding climate change education
and education as a whole, one is able to convey the importance of these topics in a manner that
can result in a positive change for the forest. In this chapter, we intend to enrich the
understanding of this project by providing in-depth information about the history of El Yunque
National Forest, climate change in the world and in Puerto Rico, and various aspects of
education including climate change education, STEM education, pedagogy, and curriculum
development.
2.2 El Yunque
El Yunque National Forest has been viewed as an important area of unique nature and of
nature conservation since prior to the arrival of the Spanish to the New World. The Taíno
Indians, who were the indigenous people of Puerto Rico, viewed the land that is now known as
El Yunque to be sacred. It was believed that the supreme god Yucahú lived in the forest, and that
the forest’s waters had religious properties (Luquillo LTER, 2014). Even after the Spanish
colonized the Americas and the Taíno no longer had a presence on the island, the forest was still
viewed as an important region on the island of Puerto Rico. When Puerto Rico was still
considered a colony under Spanish Rule, the forest was proclaimed by the Spanish king as a
forest reserve, one of the earliest existing reserves of the Western Hemisphere, to be regulated by
the Spanish Forest Service (United States Department of Agriculture, 2013).
When the island was acquired by the United States following the Spanish-American War
(April, 1898 – August, 1898), the American government made efforts to maintain the forest, the
names of its various geographic landmarks, and its status as a forest reserve as it was under the
Spanish Crown. The forest reserve was renamed as the “Luquillo Forest Reserve”, and several
initiatives were recommended to ensure that the forest remained intact for the conservation of
both the ecological and economic feasibility of the region. In 1904, during one of the first
American analyses of the forest, tropical forest expert and university professor John C. Gifford

pg.
5
(1905) stated that the forest lands should be maintained and protected to prevent an otherwise
disastrous end to the forest. In this same analysis however, Gifford encouraged using the forest
as a source of lumber to be used and sold, which eventually led to dramatic deforestation.
During the Great Depression, El Yunque, like much of the United States, was affected by
the New Deal programs enacted by President Franklin D. Roosevelt (mid 1930s) to lift the
country out of its economic state. Here, the Civilian Conservation Corps - also known as The
CCC or “Las Tres C” in Spanish - planted a large variety of trees to restore and reforest El
Yunque (United States Department of Agriculture, 2013). The help of the CCC revitalized the
forest, replacing many of the lost trees for newer ones. During this time, the group was proactive
in identifying trees that were older and could be used for lumber, allowing the younger trees to
grow and reforest El Yunque. The CCC also developed roads, trails, and facilities, some of
which are still used today, to make the forest accessible to the public (United States Department
of Agriculture, 2013).
It was originally thought that El Yunque contained very little animal life. In 1904,
Gifford commented in his analysis of the forest that there was minimal animal life present during
his observations (Gifford, 1905). However, the wide variety of trees planted by the CCC sparked
an interest in the biodiversity contained within El Yunque. Starting in the 1940s, research was
conducted to understand and catalogue these many tree types, as well as the forest’s natural
reforestation patterns. As the years progressed this research segued into observation of both the
flora and fauna found in El Yunque. Since then, several native animal species have been found in
the forest, including the Elfin Woods Warbler (Setophaga angelae), the Puerto Rican boa
(Epicrates inornatus), several species of coquí frogs , and the endangered Puerto Rican parrot
(Amazona vittata) (United States Department of Agriculture, 2013). Additionally, ancient
petroglyphs made by the Taíno Indians, as well as 50 types of orchid flowers, have been
discovered in the forest (Luquillo LTER, 2014).
Puerto Rican Boa (Photo: El Yunque National Forest Archive); Orchid Found in El Yunque (Photo: Princesa Cloutier); Taino Petroglyph (Photo: Rex Cauldwell)

pg.
6
El Yunque is an incredible source of biodiversity for the island of Puerto Rico with its
many species of flora and fauna. It serves as a window to the history of the island, and even as a
home to animals that are iconic to the Puerto Rican identity, like the coquí. The existence of El
Yunque preserves part of the rich history and beauty of the island, yet the present and future
impacts of climate change may have significant negative consequences for the forest.
2.3 Climate Change
By definition, climate change refers to the cyclic variations of climate conditions
throughout Earth’s history. The phenomenon of climate change is one that has been occurring
naturally for hundreds of millions of years. Indeed, in just the past 650,000 years there have been
seven distinct periods of glacial ingress and egress, meaning that the Earth goes through phases
of global warming followed by glacial periods (Cusbasch et al., 2013). The problem that
currently faces society in relation to climate change is not that it is occurring, but rather the
alarming rate at which climate change is happening.
2.3.1 The Tropical Rainforest Biome
El Yunque National Forest (1819’ N) is an example of the tropical rainforest biome. It is
located in an equatorial region of the world (28N to 28S), like most other tropical rainforest
biomes. Heavy rainfalls are characteristic of the tropical rainforest and can range from roughly
100 to 180 inches per year (Holzman, 2008). The estimated average precipitation in El Yunque is
120 inches per year. However, El Yunque National Forest contains various forest types that have
extremely varied precipitation levels ranging from 50 inches per year in low elevation to 250
inches per year on the mountain peaks (USDA, 2014). This rain is known to be orographic, or
dependent on the interactions between trade winds and mountain ranges. In El Yunque,
precipitation is a product of humid air from the Atlantic Ocean rising when it encounters the
Luquillo Mountain Range, then condensing into water (USDA, 2013).
Tropical rainforests are also known for their wealth of biodiversity in both flora and
fauna. It is believed that 50% of the Earth’s biodiversity is encompassed within the tropical
rainforest biome, despite only covering approximately 7% of the Earth’s terrestrial landmass
(Holzman, 2008). In El Yunque National Forest, many endangered species that contribute toward
Puerto Rico’s unique biological identity can be found, including the Puerto Rican parrot
(Amazona vittata), Puerto Rican boa (Epicrates inornatus), Puerto Rican helmet orchid

pg.
7
(Cranichis ricartii), Elfin-woods warbler (Dendroica angelae), as well as the lowland coquí
(Eleutherodactylus juanariveroi) (U.S. Fish & Wildlife Service, 2014). For this reason, these
species are inherently important as endemic to the island.
One of the environmental services that tropical rainforests provide is being a natural
carbon sink, removing carbon dioxide (CO2) from the air and converting it to biomass and
releasing oxygen (O2). This is a particular aspect of the photosynthetic process, which is
imperative to life on Earth, as it replenishes the oxygen supplies necessary for the respiration
systems of all organisms, including humans (Ostendorf, 2001). Being defined as a carbon sink is
inclusive of containing a high concentration of terrestrial carbon. This means that the forest
converts atmospheric carbons (particularly carbon dioxide) and converts it to biomass through
the process of photosynthesis. Since all living beings contain carbon, tropical rainforests are
abundant in surface carbons.
2.3.2 Causes of Climate Change in Tropical Rainforests
There are many mechanisms that contribute to climate change, both anthropogenic and
natural. Whether natural or anthropogenic climate change, there are certain biological,
geological, and chemical cycles involved that are important to understand, such as the carbon,
nitrogen, and water cycles. Due to the complexities involved in each of these cycles, this section
will have a particular focus on those processes that are relevant to the tropical rainforest biome.
Specifically, tropical rainforests are affected most by changes in greenhouse gas (GHG)
concentrations, increased temperature and its related consequences, as well as human activities.
Greenhouse Gases:
In establishing a basic background in the science behind climate change, it is important to
know details about greenhouse gases and how they relate to climate change. Greenhouse gases
are a collection of gases including carbon dioxide, methane (CH4), nitrous oxide (NO2), Ozone
(O3), and various fluorocarbons (CFCs, HFCs, PFCs), that trap infrared heat from the sun’s rays
in the Earth’s atmosphere (Hartmann et al., 2013), as can be seen in Figure 1.

pg.
8
Figure 1: Diagram of the Greenhouse Effect (GRID Arendal & UNIP).
This trapping of heat can lead to increased air temperatures as well as increased average water
temperature in oceans and lakes (Hartmann et al., 2013). Many of the gases that are categorized
as greenhouse gases are vital to natural Earth processes. Ozone, for example, serves the purpose
of protecting life on Earth from harmful amounts of ultraviolet radiation. However, this can only
occur when ozone is located in the stratospheric layer of the atmosphere. When in the
troposphere, ozone acts like any other greenhouse gases and no longer reflects radiation (Ciais et
al., 2013).
Many other GHGs are similar to ozone in the aspect of being both helpful and harmful to
the environment. Methane, for example, has both advantages and disadvantages, with advantages
including being used as a component of natural gas fuel. Methane is also naturally produced as a
product of digestive processes (Hartmann et al., 2013). As outlined above, carbon is a central
element in the tropical rainforest and is imperative to its proper functioning. However,
atmospheric carbon in excess can trap heat within the troposphere and lead to increases in global
mean temperature. Likewise, nitrous oxides are environmentally beneficial toward creating
fertile soil compositions, especially when applied to the process of nitrogen fixation. Similar to
carbon, excess atmospheric nitrogen has minimal purposes outside of trapping infrared heat in
the troposphere.
This diagram depicts how energy is emitted by the Sun and trapped in the
Earth’s troposphere via. the greenhouse effect.

pg.
9
A History of Anthropogenic Climate Change:
The issue of rapid climate change is one rooted firmly in anthropogenic, or man-made,
causes. Today’s rates of global warming are certainly the highest they have been in hundreds of
thousands of years, and perhaps the highest in the Earth’s history (EPA, 2014a). Substantiating
this claim are multiple environmental reports stating mean global temperatures have increased
anywhere from 0.3 to 0.9 degrees Celsius within the last hundred years alone, with this trend
becoming more drastic in recent decades (Cusbasch et al., 2013). Furthermore, many of these
reports contain data supporting the inference that the rate of modern climate change can be
largely attributed to human activities, such the emission of greenhouse gases (Cusbasch et al.,
2013). For example, Figure 2 below, created by the National Oceanic and Atmospheric
Administration (NOAA), depicts the positive correlation between increasing concentrations of
atmospheric CO2 and increasing global temperatures from 1880 to 2010 (NOAA, 2014).
Figure 2: Comparison of Global Temperature and Carbon Dioxide Concentrations Over Time (NOAA, 2014).
Furthermore, it is projected that median annual surface temperature in the Caribbean
could increase by 1.2 to 2.3 degrees Celsius by 2100 when compared to a 1986-2005 baseline.
This prediction uses an assumption of a moderate-low emission scenario, or a scenario where
CO2 emissions continue to increase at a rate slightly lower than the current rate (Nurse et al.,
2014). The shaded blue portions in Figure 3 show this projection.
This graph depicts the concentration of atmospheric CO2 (ppm) and the
average global temperature over the past century.

pg.
10
Figure 3: Projected Global Temperature in the Caribbean From 1900 to 2100 Based on Two Emission Scenarios (From Karl et al. (2010) using data from Smith et al. (2008) and CMIP-3A (1993)
Overall, many of the observable aspects of climate change can be attributed to
anthropogenic causes. Such phenomena include increased variability in global climate, as well
as changes in precipitation. Though scientific studies and scholarly works, such as reports by the
Intergovernmental Panel on Climate Change (IPCC), confirm with high confidence the existence
of rapid man-made climate change (Cusbasch et al., 2013; EPA, 2014a; NOAA, 2014), it is still
controversial. Currently, there is skepticism stating that modern climate change is nothing more
than a natural cycle (RFF, 2011), as has occurred throughout the Earth’s history. Though natural
factors may be a part of current climate change, the current rate has been greatly exacerbated by
human activities (National Association of Geoscience Teachers, 2013). These activies are largely
varied and include the burning of fossil fuels (CO2), trash incineration (NOX), bulvine fecal
matter (CH4), and the use of aerosol products (F-Gases). Further substantiating this claim, the
Environmental Protection Agency gathered data from Antarctic ice cores to document the
concentrations of atmospheric CO2 over the past 800,000 years. The data indicated that
atmospheric carbon fluctuated naturally between 180 and 300 parts per million (ppm) over this
time period (EPA, 2014a). However, the data collected over the past century have shown an
increase in atmospheric carbon concentration levels from 290 ppm to 388 ppm (NOAA, 2014).
This rapid increase is almost entirely due to the burning of large amounts of fossil fuels by
humans (EPA, 2014a).

pg.
11
Another such human activity that exacerbates climate change is deforestation (Ciais et al.,
2013). This is particularly pertinent in El Yunque, as the forest experienced deforestation in the
early years of United States acquisition. Deforestation is a term that encompasses the clearing of
trees, either by selective cutting of trees or non-selective clear cutting (National Geographic,
2014b). Deforestation is complex due to the ways that it connects to the carbon and nitrogen
cycles. Carbon that would normally be used in photosynthetic processes would, after
deforestation, become excess atmospheric carbon. In terms of nitrogen, the presence of varied
flora helps ensure a nitrogen-rich and fertile soil structure. However, when deforestation strips
away the trees as well as the surrounding soils, nitrogen gas (N2) is allowed to escape the soils,
interact with oxygen (O2) and form nitrous oxides (NOx), which are a group of greenhouse gases.
Therefore, deforestation contributes to an increase in atmospheric greenhouse gases (Ciais et al.,
2013).
2.3.3 Effects of Climate Change in Tropical Rainforests
The effects of climate change can be wide and varied when observed on a global scale,
but for the purposes of this project only those effects that are directly relevant to tropical
rainforests will be examined. The most observable effect of modern climate change is an
increased global mean temperature. The effects of increased global temperatures are two-fold, as
increased temperature leads to variability in regional precipitation patterns and changes in sea
level. Examples of possible effects of these increased temperatures include rises in sea level and
the increased acidification of the world’s oceans (Ciais et al., 2013). Human activities also have
an extremely pronounced effect on global climate, including contributions to increased global
temperatures as well as introducing the pollutants
involved in acid rain into the environment.
Changes in Precipitation Patterns:
One of the key components of climate change
that will affect tropical rainforests is change in
precipitation patterns (Nurse et al., 2014). In the
Caribbean, it is predicted that rainfall amounts will
decrease over the coming century by anywhere from
five to twenty percent based on low and high emission Figure 4: Projected Pricipitation Patterns in the Caribbean from 1900 to 2100 Based On Two Emission Scenarios (From Karl et al. (2010) using data from CMIP-3A (1993)

pg.
12
scenarios, respectively, as shown in Figure 4 above. This figure depicts two simulations of the
decreases in precipitation, relative to the precitation levels of the year 2000, that the Caribbean
may face throughout the 21st century. This decrease is partly due to an increase in evaporation
rates caused by a warmer atmosphere. Though the levels of water vapor in the atmosphere would
increase, a warmer atmosphere would also lead to lower condensation rates, inhibiting the
formation of clouds. With less cloud formation, more water vapor would remain trapped in the
atmosphere, where it would act as a greenhouse gas and further contribute to climate change.
Accompanying this decrease in precipitation, climate change experts expect the
Caribbean to also experience greater seasonal variability in precipitation. This unpredictability in
rainfall will negatively affect Puerto Rico in particular, due to the presence of extremely
sensitive ecosystems, such as the elfin forest type, that require specific amounts of precipitation.
Variability in precipitation in Puerto Rico will have a noticeable effect on its inhabitants, as there
will be higher likelihoods of drought in the dry season and excessive flooding in the wet season.
Due to the gradual warming of the Earth, recent data have shown an increase in the severity of
both the rainy and dry seasons of tropical rainforests. In other words, while it may rain more in
the wet season, interspersed rain in the dry season will be much less frequent. This is a major
issue to humans living in such habitats because it can increase the likelihood of water shortages
during the dry season (Nurse et al., 2014).
Acidification of Water:
An additional element of climate change that can have serious consequences on the water
cycle is the acidification of water. This includes the acidification of oceans as well as higher acid
concentrations in rainwater. Acid rain occurs when sulfur dioxide (SO2) in the air reacts with
water vapor to form sulfate salts as well as sulfuric acids that fall down to the earth as rain
(McGouldrick et al., 2011). Air pollution that particularly emits high amounts of sulfur dioxide
into the air contributes to the formation of acid rain (EPA, 2014c). This phenomenon can be
devastating toward tropical forest biomes, as it has the potential to strip soils of its nutrients and
turn lakes and streams so acidic that they are uninhabitable for wildlife (National Geographic,
2014a; Nurse et al., 2014).

pg.
13
Acid rain must be taken into account when discussing climate change in El Yunque, as it
poses a clear potential threat to aquatic life. Many native species can only withstand certain
amounts of acidty within their habitats without causing some degree of harm to the animal itself
(EPA, 2012). Some specific tolences for
the pH levels that various aquatic species
can tolerate can be found in Figure 5. As
defined in chemistry, pH is the
measurement of an aqueous solution’s
acidity or basicity. When describing the
pH of a solution, the pH scale must be
used. The pH scale is used to simplify
complicated chemical measurements by
assigning a value of 1 through 14 to a
solution, with 1 indicating an extremely
acidic solution, 7 corresponding to a chemically neutral solution, and 14 indicating an extremely
basic solution (Ophardt, 2003). This same corrosive effect also occurs on the flora of the tropical
rainforest. Acid rain can greatly degrade many of the various layers of foliage in El Yunque.
When this is paired with heavy rainfall, a multi-tier problem persists of the rain harming fauna,
corroding flora, and hastening potential erosion in the various watersheds of El Yunque (Nurse et
al., 2014).
An effect of climate change that is also relevant to Puerto Rico is the acidification of
large bodies of water (Nurse et al., 2014). This is due largely to increases in atmospheric CO2
concentrations, as this can cause these bodies of water to dissolve more carbon, or act as a sink
of atmospheric CO2. For example, when oceans absorb atmospheric carbon dioxide, a chemical
reaction to create carbonic acid commences. This chemical reaction involves absorbed CO2
reacting with oceanic H2O to form carbonic acid (H2CO3). As the ocean absorbs more carbon
dioxide, the overall pH level of the ocean will decrease and become more acidic (pH<7). A pH
under 7 can be extremely harmful to aquatic ecosystems, such as coral reefs, that are located
along Puerto Rico’s coasts (Nurse et al., 2014).
Biodiversity:
Figure 5: The maximum pH levels that can be tolerated by these aquatic animals (EPA, 2012)

pg.
14
The island’s previous degradations are important in understanding El Yunque’s current
environmental state. Due to expansive clear-cutting for farming during the island’s initial
European contact, many native animal species lost their primary habitats and became formally
endangered (USDA-FS, 2013; U.S. Fish & Wildlife Service, 2014). Even after large tracts of El
Yunque became protected land, invasive species better suited for the changing climate took over
primary habitats in the forest as opposed to the native species. A specific example can be found
in the story of the Puerto Rican parrot, which used to thrive before the arrival of Columbus in
1493, but currently only has about 50 wild individuals of the species, due to rapid deforestation
and competition from invasive species (USDA-FS, 2013).
The phenomenon of invasive species taking over areas originally inhabited by endemic
species is something that will become more common as climate change continues to progress. In
general, non-native “alien” flora will be better adapted for the new extremes in precipitation, as
they will not be suffocated by the increasing amounts of rainfall in the wet season. Just the
opposite would be seen in the fauna of the island, as the native species would not be well adapted
to the lack of precipitation in the dry season (Holzman, 2008).
Another phenomenon that is beginning to occur due to climate change in El Yunque
National Forest is habitat shift. Habitat shift occurs when environmental conditions change,
causing entire populations of flora and fauna to change location. This is presently being observed
in El Yunque, where habitats are shifting upward in elevation due to changes in global
temperature and precipitation patterns (Felipe Cano, personal communication, 2014). Habitat
Puerto Rican Parrot (above) and Common Coquí (below): Photos
courtesy of El Yunque National Forest Archive

pg.
15
Elfin-woods Warbler: Photo
Courtesy of El Yunque National
Forest Archive
shift greatly affects the fauna in El Yunque, as much of the endemic wildlife (species exclusive
to Puerto Rico) that resides there live in habitats that are in critical
danger of disappearing or shifting upwards in elevation. One species
that is currently experiencing habitat shift is the elfin-woods warbler.
This species is currently seeing the disappearance of its prime
habitat, the elfin forest, and being forced to relocate to habitats
that it is not well suited for. This is a trend that has been noted by
USFS species managers in El Yunque National Forest. Should
current climate change trends continue, the elfin-woods warbler would eventually completely
disappear from Puerto Rico (Felipe Cano, personal communication, 2014). Similar patterns have
also been observed for other species that are endemic such as the Puerto Rican parrot.
2.4 Climate Change Initiatives in Puerto Rico
In recent decades, professionals, legislators, and social movements have showed a
marked interest in climate change initiatives throughout the island of Puerto Rico. These efforts
have already positively changed the environmental situation of Puerto Rico in significant ways.
As they continue, the result will continue to positively impact the entire island from an
ecological and industrial standpoint. In the 1930s, more than 94% of Puerto Rico was deforested
(Guerrero, 2014; Nieves & Ruiz, 2010) as a product of agricultural expansion on the island (Zou
et al., 1995). The rise of environmental and climate change awareness, as well as spontaneous
reforestation as a result of the abandonment of the agricultural industry (Rudel et al., 2000), has
helped guide the island toward obtaining forest cover greater than 60% (Guerrero, 2014).
Tract of Deforested Land Near San Juan, Puerto Rico: Photo Courtesy of

pg.
16
Many previously established environmental groups in Puerto Rico have started to refocus
their efforts in the past few decades to combat the rising issues stemming from global climate
change. The Department of Natural and Environmental Resources (DRNA), for example, has
been a functioning department in the Puerto Rican government since the 1970s. It has served to
manage and develop Puerto Rico’s natural resources while conserving and protecting the
environment of the island (DRNA, 1993). In the 1990s, the department became much more
active in its environmental conservation and protection programs, as evident from the numerous
laws they have administered during this past decade (2000-2010) (DRNA, 2012). The
department went so far as to restructure itself in 1993, so that its five new components and one
pre-existing component may better address the shifting needs of the island. As a department, they
placed more emphasis on the island’s conservation (DRNA, 1993). Many other environmental
groups have either followed suit and shifted their objectives to being more environmentally
conscientious, or have been created, in response to anthropogenic climate change. This can be
inferred from how the timing of these shifts and emergences coincided with the occurrence of the
United Nations Earth Summit that was hosted in Rio de Janeiro, Brazil in 1992 (United Nations,
1997). At this concefernce, it was agreed upon that the countries of the world needed to begin
finding solutions to reduce negative human impact to the Earth. A particular group that has
recently shifted their objectives is the International Institute of Tropical Forestry (IITF). This
institute, a program of the USFS that is stationed in Puerto Rico, has conducted research in El
Yunque and its surrounding areas since the late 1930s. Previously, the institute focused its
research on forestry, forest inventory, endangered species, and similar topics. In recent years,
however, it has turned its focus toward understanding forest ecology, climate change, and the
human impact on the environment (IITF, 2014). Likewise, organizations such as the Caribbean
Landscape Conservation Cooperative (CLCC) and programs such as the Environmental Sciences
program of the University of Puerto Rico have been established in response to a continued and
growing need for impactful climate change initiatives and awareness (CLCC, 2014; UPR
College of Natural Sciences, 2014).
The USFS, and its personnel in El Yunque National Forest, are also actively shifting their
focus toward becomming more aware of climate change and climate change initiatives. Every
fifteen years, the Forest Service is required to revise their management plan. The rationale
behind this mandated restructuring is to ensure that the USFS is addressing relevant and poignant

pg.
17
problems that the forest is actively encountering. For the past year and a half, they have been
developing the latest management plan (Frederico Cintron-Moscoso, see Appendix B). This plan
is described in a document that lists the standards, guidelines, and tools that must be followed for
any and all activities that occur in the forest (Frederico Cintron-Moscoso, see Appendix B). For
this new plan, forest managers are consulting a variety of groups, including environmental
educators, biologists, and ecologists. This “model forest” management plan is geared towards
working with communities neighboring El Yunque to develop a more sustainable and
economically beneficial collaboration between human and forest activities (Ríos, personal
communication, 2014). Some of the proposed actions of this new plan include the planning,
development, and participation in agroforestry initiatives, using adaptive management to plan the
production of resources, renovation of exhibitions in its visitor center, El Portal, and education
(Edgardo Gonzales, see Appendix B). Education is an especially important aspect to the
proposed management plan, as it has the potential to influence the next generation of Puerto
Ricans to make more environmentally conscientious decisions to preserve the island for
generations to come.
2.5 Education
The future decisions concerning our environment will be made by today’s students.
Therefore, it is critical that the concepts of climate change be communicated effectively to
adolescents (UNESCO, 2010). In order to make these decisions, future generations must have a
basic understanding of climate science and its many components. The best way to prepare
today’s students is through education (UNESCO, 2010). To develop a climate change
curriculum, one must first understand pedagogy – the study of education – and how to create and
assess a curriculum. In addition, one must have knowledge about the topic of climate change as
well as the geographic and educational area in which they are trying to educate.
2.5.1 Pedagogy
According to the Department of Education at Aarhus University (2014), pedagogy is
defined as the process of creating a supportive environment in which learning can thrive and
impact the lives of the students in a meaningful way. It encompasses the science, art and craft of
teaching. In order to teach effectively, one should be creative, skillful, and interdisciplinary in
one’s approach to teaching. Thus, a critical component of an effective approach to education is to
combine these elements of creativity with relevant, fact-based research (Smith, 2012).

pg.
18
Student Protests at University of
California, Berkeley (above): Photo
Courtesy of The Berkeley Lab; Parisian
Student Revolt Against Teacher
Repression, May 1968 (below): Photo
Courtesy of Serge Hambourg
Pedagogical theory has helped change the way education has been conceptualized over
the past century in the United States and around the world. In the United States, education was
developed and expanded so that it may be applicable to many groups of people, such as women,
African-Americans, and Catholics (Franklin et al., 1991). Despite being more inclusive,
traditional education methods continued to be prevalent (Franklin et al., 1991). It was not until
the Civil Rights era (1954 – 1968) and the Vietnam War era (1955-1975) that these methods
evolved. This evolution occurred partly in response to the rapidly advancing mechanical
technologies of the time, and partly in response to the demand for universal human rights,
including the demand for equal public education amongst people of various backgrounds
(Gamble & Kinsler, 2001) as well as the numerous student protests and riots across the country
that demanded improved, sophisticated education (Stephen McCauley, personal communication,
2014). In this time, students realized that they had the power to influence society, including how
they were educated. Most prominent among the protests in the US were the Berkley riots of the
1960s, which sought larger social reform. Particularly, students were seeking to incite societal
reform using the ideologies of the free speech and anti-war movements, as well as the women’s
rights movement (Gales, 1966).
These riots were not limited to the United States, as France also experienced numerous
protests at this time, one such example being the May
1968 student protests. These protests sought to change
the notion of traditional institutions, and replace these
infrastructures with new, progressive ones (Erlanger,
2008). Since then, education has been progressing to be
more inclusive of not only different groups of people,
but also different individual learning styles and more
interactive, hands-on curricula (Mazurek & Winzer,
2006; Egan, 1992).
The ideological basis behind pedagogy is to
create an environment of support and mutual respect
between student and educator in order for education to
pg.
19
flourish (University of Tasmania, 2014b). Education is a personal experience; therefore, it is
important that formal education incorporate the student’s experiences and thoughts into the class.
This allows the student to form a meaningful connection to the material being presented,
resulting in the potential for better retention of the subject matter (University of Tasmania,
2014a). In order to bring learning to life, an effective curriculum often includes new experiences
for the students, reflection on their past experiences, and ways to take action and change their
own lives, while accounting for the stages of mental development of each student (University of
Tasmania, 2014a, b). According to the Teaching and Learning Research Programme (2009),
effective pedagogy should prepare students for life by equipping them with the skills to be better
citizens, while also setting standards of quality and expertise and providing a supportive
environment. Additionally, it must expand on their prior education, assess knowledge only for
the purpose of advancing student learning, engage students to actively participate and
independently choose to learn, provide students with independent and social opportunities to
learn, and allow students to learn in an informal setting (Teaching and Learning Research
Programme, 2009).
2.5.2 Creating and Assessing a Curriculum
In order to develop a curriculum, one must determine what will be taught, the persons
whom will be taught, and how they will be taught. In particular, one should consider the issue(s)
or problem(s) that has brought about the need for this curriculum to be created as well as the
needs of the learners. From there, learning objectives should be determined in addition to the
methods and relevant information needed to meet those objectives. Lastly, there should be a way
to evaluate the curriculum in order to gauge its effectiveness. All of these steps are crucial when
developing environmental education curricula that often cover extremely broad and complex
topics (Natural Resources Management and Environment Department, 2014).
The important steps in creating a curriculum include planning, determining the content
and methods, implementation, and evaluation (Natural Resources Management and Environment
Department, 2014). In the planning stage, the scope of the curriculum and the needs of the class
are determined. Assessing the needs of the students can be done through focus groups,
observations of the learning environment, or by knowledge, attitude, and practice surveys. From
these assessments, one can prioritize the needs of the students and identify the characteristics of
the class. When determining the content and methods of the curriculum, one must define the

pg.
20
intended outcomes of the curriculum and transform these outcomes into learning objectives for
the curriculum. In addition, one must determine methods that will accomplish those objectives
which may consist of activities and lessons. Once the methods and the content of the curriculum
are created, it can be implemented by presenting it to the target audience. Following the
completion of the curriculum, its effectiveness should be evaluated. There are two types of
evaluation: formative, which provides feedback during the process, and summative, which
determines the impact of the curriculum after it is completed. From these evaluations, the
curriculum can be revised and re-tested if necessary to improve its effectiveness (Natural
Resources Management and Environment Department, 2014).
In order to make a curriculum that will engage students and help them better understand
the concepts, it is important to use creative activities and learning techniques that actively engage
students. In a Stanford University study researchers found a positive correlation between levels
of student engagement in the classroom and learning (Carroll et al., 2010). Furthermore, this
finding is supported by scholarly works that emphasize the need to utilize active teaching
techniques as opposed to passive techniques (Egan, 1992). Table 1 below lists and describes
creative learning techniques that can be used.
Table 1: Creative Learning Techniques (Iowa State University, 2014)
Creative Learning Technique Definition
Assumption The class makes a list of assumptions about a topic and then
each assumption is analyzed.
Brain sketching
In small groups, students are given a problem or concept. Each
student independently sketches something relating to the
concept or question and passes it to the next person in their
group. The student then expands on the sketch or is inspired to
make a new one.
Brainstorming
The class comes up with ideas and thoughts about a topic.
These ideas can be ridiculous at first and then changed to be
useful.
Concept Mapping
The class is given a focus question in which they must create a
list of key concepts (the most general at the top and the more
specific at the bottom of the list). From there, the class will
create a graphic of the hierarchical organization of the
concepts, linking the concepts together.

pg.
21
DO IT
Define the problem
Be Open to many solutions
Identify the best solution
Transform it into an action
Fishbone Diagram
The class is given a problem, and must come up with its
causes. This creates a diagram in which the causes are
branches to the problem. For each branch, sub causes can be
determined.
Laddering
The class is given an idea and they must determine the
category it belongs to (ladder up) and find examples of the idea
(ladder down).
Mystery Spot The class is given a mystery that they must solve. The story
evolves as the students investigate.
Questioning Activity The class is given a topic and is tasked with coming up with
100 questions.
Random Action The class is given a random noun and is asked to determine its
attributes and associations.
Reverse Brainstorming The class is given a list of ideas and is asked particular
questions about each idea.
Role-playing Each student assumes the role of someone affected by a
particular issue.
Slip Writing
Each student is given small pieces of paper and the class is
given a question. Each student must write down an idea about
the question on each one of their slips.
Storyboarding
The class is given a set of topic cards and will create categories
or general points for each topic card. Specific points will be
created for each category or general point. These cards will be
displayed on a cork board or a similar apparatus.
Though it is important to engage students while educating, some studies have claimed
that students actually prefer to utilize a mixture of both lectures and activities in the classroom.
One such study conducted by Brawer et al. (2012), used a qualitative questionnaire and
quantitative survey to assess whether students like the use of lectures as an educational
technique. This study was conducted on medical and dental students in their first year graduate
school. The researchers of the study found that students thought lecture was an important aspect

pg.
22
of the learning process. Some specific reasons provided by students for preferring the utilization
of lectures included the focus and emphasis that a lecturer can provide. Also, students liked that a
lecture could be a multisensory experience where one could write, hear and see the information
being presented (Brawer et al., 2012).
Developing a Lesson Plan
A curriculum encompasses several different lessons. For each lesson, a plan can be
developed, which is the road map for an educator that is determined by the learning objectives of
the lesson. The objectives should be ranked and the objectives that are essential should be
determined in addition to those that can be omitted if time runs out (Milkova, 2014). This type of
curriculum design is known as backward design or backward mapping, which puts an emphasis
on student learning objectives (Wiggins & McTighe, 2005). When implementing a backward
design approach towards developing a curriculum, it is imperative that the learning objectives be
clearly defined by the educator. The learning objectives are crucial in determining the types of
teaching methods that an educator should use in individual lessons of a curriculum, as well as
providing a very focused goal for each lesson (Wiggins & McTighe, 2005).
First, a creative introduction should be developed in order to engage students in the
concept as well as gauge the students’ previous knowledge of the subject (Milkova, 2014). Next,
the specific activities should be planned which can include real-life examples, analogies, and
visuals. It is important to determine the amount of time each activity will take, factoring in time
for explanation and discussion. In addition, one should plan ways in which to check for the
student’s understanding of the topic, such as asking questions specific to the lesson. Lastly, a
conclusion should be created that summarizes the topics discussed and previews the next lesson.
In planning a lesson, one should make sure to have a realistic timeline in mind and anticipate
what problems or questions students may have (Milkova, 2014).
In addition, an important component of a lesson plan is being able to assess how effective
it is. Two types of lesson assessment include formative and summative assessment, which
provide feedback during and after the development process, respectively (Carnegie Mellon
University, 2014a). When using formative assessment, an educator can get a more immediate
feedback through use of inquiry during the lesson process. An example of formative assessment
would include having students create concept maps about the contents of the lesson. This
pg.
23
feedback can then be applied before the delivery of the lesson is completed. Ways to apply
formative assessment during an ongoing lesson include conducting further discussion on topics
that are not well understood by students and readjusting the time frame of a lesson based upon
students’ receptiveness to certain topics. When summative development is used, an educator
administers a proposed lesson in its entirety, and then seeks feedback through the use of a high-
stakes assessment. In terms of a single lesson, summative feedback is applied only after the
lesson is administered to students. Examples of summative assessment can include exams,
homework, or even projects (Carnegie Mellon University, 2014b).
Pre- and Post-testing
Pre- and post-tests measure the learning during a class by comparing what the student
knew before to what they know after. The pre-test determines the starting point for the
curriculum and determines what topics need to be emphasized and what can be omitted. The
post-test determines what students learned and the appropriateness of the learning objectives. In
addition, the post-test establishes who needs extra help on the subject as well as what should be
changed in the curriculum to best reflect learning objectives. Pre-tests should be administered at
the beginning of the class following the introduction of the subject matter, while a post-test
should be administered directly after the class as well as at later date. The importance of
conducting both of these tests is to gauge the immediate effectiveness of the curriculum as
measured by the first post-test as well as the long-term retention of the material as measured by
the second post-test. The tests should be focused on the objectives of the curriculum and can
include multiple choice and short answer questions. Once the pre- and post-tests are compared,
the strengths and weaknesses of the student’s knowledge can be determined. The curriculum can
then be revised based on the established weaknesses (Boston University School of Medicine,
2013).
When developing pre- and post-tests, it is advantageous to have these tests be
isomorphic, or of similar form, to each other (Gormally et al., 2012). By utilizing nearly identical
pre- and post-tests, data gathered from these tests can be directly compared. Additionally, this
allows educators to more easily identify which learning objectives were well addressed in a
curriculum, as well as those that were not. In a study conducted by Gormally et al. (2012), pre-
and post-tests comprised of entirely multiple-choice questions were utilized to assess science

pg.
24
literacy skills in university undergraduates after the completion of a basic life science course.
The pre- and post-test they used contained 28 multiple-choice questions that were rigorously
scrutinized by both expert biology educators and undergraduate students. After addressing any
imperfections, the questions were categorized in accordance to the learning objective or skill it
addressed. In doing this, the researchers were able to directly compare the answers to the
questions in both tests and determine whether the completion of a life science course increased
students’ scientific literacy skills. In this study, significant positive learning gains were reported
for the class. Gains were also reported across a majority of learning objectives, with some
objectives having larger learning gains than others (Gormally et al., 2012).
It is also possible to use isomorphic pre-and post-tests that are comprised entirely of short
answer questions. This can have the advantage of making students think critically about the
questions, and synthesize more detailed responses from recalled knowledge. This type of test
structure was utilized by Brownell et al. (2013) in a study on the ways that students think about
and approach experimental design in biology courses. In this study the pre- and post-tests that
were used were completely isomorphic, and utilized a single Expanded Education Data Analysis
Tool (E-EDAT) prompt, or open-ended question, that asked students to design a scientific
experiment to determine the effects of ginseng. Each student in the class had to complete two
activities, designated as the “design” activity and the “analyze” activity. These activies served as
the lesson that was being tested in this study. Both the “design” and “analyze” activity pertained
to a theoretical experiment about the growth rates of poppy plants. A detailed answer key was
provided for the E-EDAT pre- and post-test, which explicitly outlined the responses that would
be awarded full credit for each facet of the question. As well, the answer key included responses
that would be awarded partial credit and the grading breakdown for each of these answers. After
the pre- and post-tests were graded, various means of statistical analysis were applied to
determine whether students experienced learning gains. The overall findings showed that
introductory biology students were more likely to experience significant learning gains when
compared to advanced biology students. The two tests also helped identify areas where
introductory students had the most misconceptions (Brownell et al., 2013).

pg.
25
2.5.3 STEM Education
STEM education stands for science, technology, engineering, and mathematics education.
The problems facing STEM education in the US include student underperformance, gaps in
instructional practices, lack of theory development, and a limited system of standards (Saxton et
al., 2013). Numerous scholarly works about STEM education bring to light the low quality
methods often used in teaching this subject area. One core issue is a dependence on textbooks as
the sole learning tool in the classroom. In addition, many teachers tend to adopt a strictly oratory
lecture style of teaching, which does not actively engage students (Saxton et al., 2013). In order
to fix these issues, there needs to be a common and regulated system of STEM education
standards for secondary education that take advantage of innovative and progressive pedagogical
approaches. This system would facilitate effective learning by emphasizing conceptual
knowledge of STEM content and higher-order thinking about those concepts. In addition, a
regulated system would benefit the individual student by expanding on individual academic
backgrounds and providing motivation for further learning.
There is strong evidence to indicate that the implementation of standardized STEM
education can be particularly effective in communicating material to students. In a recent study,
specialists in elementary science education were brought into a school district to test a more
involved and hands-on science curriculum which deliberately adhered to the national standard
(National Academy of Sciences, 2000) in fourth, fifth, and sixth grade classes (Schwartz et al.,
2000). This district was observed in conjunction with a nearby, comparable school district. The
default teaching program in the district, like many school districts across the country, did not
follow the national standard set in place. Instead, science was taught in a traditional manner with
textbook readings and context-free and content-free activities. After both respective curricula
were administered, students were asked to take a test as part of the experiment. The test used was
designed specifically for this study and was based upon the recommended national standards
provided by the United States Department of Education. The results of the study indicated that
students in the classes taught by the elementary science specialists showed 96 percent
proficiency in STEM subject area for fourth and fifth grades and 89 percent proficiency for sixth
grade, compared to 9 percent, 74 percent, and 50 percent proficiency for fourth, fifth, and sixth
grades respectively in the comparison district. These numbers suggest the effectiveness and need

pg.
26
for a more universal and regulated STEM curriculum, as well as the need to incorporate hands-
on learning into STEM curricula (Schwartz et al., 2000).
In order to achieve an effective STEM curriculum, teachers must employ teaching
techniques firmly based in current pedagogical theory such as understanding their students’
thinking. This includes students’ prior knowledge, misconceptions, difficulties, and development
levels. In addition, teachers of STEM disciplines should attempt to use strategies such as
engaging students in inquiry, guiding dialogue, and integrating technology. Some instructional
practices that teachers can employ include active engagement, facilitating discussion, formative
assessments, and using activities that are relevant to students’ lives (Saxton et al., 2013).
2.5.4 Climate Change Education
There are many challenges to communicating climate change effectively. Climate change
denial is one such challenge that remains to this day (National Center for Science Education,
2012). Resistance to its education is also prevalent, however, teachers must be willing to defend
the importance of teaching climate change. Currently, many people, especially students, have
misconceptions about climate change. For example, people may believe that the Earth actually
moves closer to the sun during the summer, that air is simply empty space above the Earth and
has no function, that CO2 cannot impact climate change, and that climate change is just long-
term weather and cannot be predicted (National Center for Science Education, 2012).
To effectively educate students about climate change, it is important to understand and
correct such misconceptions, and to not draw too much attention to them thereafter so as to not
reinforce them (National Center for Science Education, 2012). The evidence about climate
change should be presented by teachers in order to convey to their students that climate change is
a relevant issue in today’s society and that it is becoming more severe. However, the fact that our
planet is drastically changing, though not necessarily for the better, can be disturbing and
students may find the subject upsetting. For that reason, it is important in climate change
education to stress that, while there are long-term solutions, no single action we take will
completely stop climate change from happening in the short-term. Furthermore, it is imperative
that climate change education teaches ways to adapt to the changing climate (National Center for
Science Education, 2012).
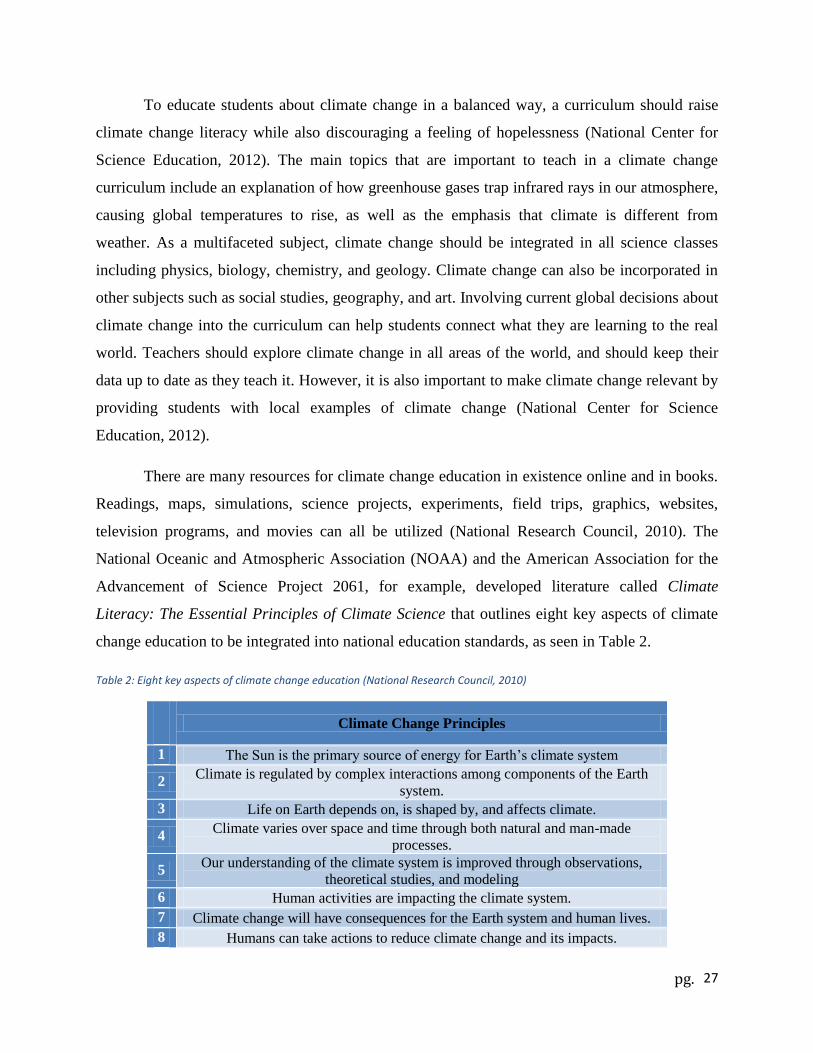
pg.
27
To educate students about climate change in a balanced way, a curriculum should raise
climate change literacy while also discouraging a feeling of hopelessness (National Center for
Science Education, 2012). The main topics that are important to teach in a climate change
curriculum include an explanation of how greenhouse gases trap infrared rays in our atmosphere,
causing global temperatures to rise, as well as the emphasis that climate is different from
weather. As a multifaceted subject, climate change should be integrated in all science classes
including physics, biology, chemistry, and geology. Climate change can also be incorporated in
other subjects such as social studies, geography, and art. Involving current global decisions about
climate change into the curriculum can help students connect what they are learning to the real
world. Teachers should explore climate change in all areas of the world, and should keep their
data up to date as they teach it. However, it is also important to make climate change relevant by
providing students with local examples of climate change (National Center for Science
Education, 2012).
There are many resources for climate change education in existence online and in books.
Readings, maps, simulations, science projects, experiments, field trips, graphics, websites,
television programs, and movies can all be utilized (National Research Council, 2010). The
National Oceanic and Atmospheric Association (NOAA) and the American Association for the
Advancement of Science Project 2061, for example, developed literature called Climate
Literacy: The Essential Principles of Climate Science that outlines eight key aspects of climate
change education to be integrated into national education standards, as seen in Table 2.
Table 2: Eight key aspects of climate change education (National Research Council, 2010)
Climate Change Principles
1 The Sun is the primary source of energy for Earth’s climate system
2 Climate is regulated by complex interactions among components of the Earth
system.
3 Life on Earth depends on, is shaped by, and affects climate.
4 Climate varies over space and time through both natural and man-made
processes.
5 Our understanding of the climate system is improved through observations,
theoretical studies, and modeling
6 Human activities are impacting the climate system.
7 Climate change will have consequences for the Earth system and human lives.
8 Humans can take actions to reduce climate change and its impacts.

pg.
28
These principles are important to discuss with students in order to enhance their basic
understanding of climate change. In an effort to bring climate change education outside the
classroom, one can visit science centers, museums, parks, and zoos (National Center for Science
Education, 2012). It is essential that climate change includes a human aspect such as lectures
from local scientists, documentaries, or narratives on climate change. The National Science
Foundation funded a cognitive research project, Visualizing Earth, proving the effectiveness of
letting students see images of Earth and how life on Earth is connected to the land, water, and
atmosphere by giving the changing climate tangibility towards which they can feel empathy
(National Research Council, 2010; Egan, 1992). There are several other initiatives in the US for
climate change education including: NASA’s Global Climate Change Education, NOAA’s
Environmental Literacy, NSF’s Informal Science Education, USFS’s Educator Resources and the
Department of Energy’s Global Change Education Program (National Research Council, 2010).
In addition, the Climate Literacy and Energy Awareness Network is a great tool to use for
activities, videos, visualizations, tips, and interactive concept maps on climate change (National
Center for Science Education, 2012).
2.5.5 Education in Puerto Rico
In Puerto Rico, education is free for all children between the ages of six and sixteen, with
one third of its annual budget spent on education (Wagenheim, 2014). Puerto Rico offers a
variety of schooling options, including 1460 public schools and 764 private schools (Studylands,
2014). These schools typically focus on a broad range of subjects including history, English
language, mathematics, physical education, and many science courses (Studylands, 2014).
Despite the variety of education in Puerto Rico, the education is not of the highest quality
(Casiano Communications, 2014). While most children complete at least 8 years of education,
only 50% of Puerto Ricans over the age of 25 have a high school diploma and only one-seventh
of the total population pursues a Bachelor’s degree (Wagenheim, 2014). 85% of Puerto Rico’s
public schools take part in improvement programs because of their poor academic performance
on standardized tests (Casiano Communications, 2014).

pg.
29
Middle Schools
Middle school is compulsory in Puerto Rico and consists of students in grades 7 through
9 or typically ages 12 through 15 (Studylands, 2014). Students can fulfill this education at both
private and public institutions. Topics of study include language arts, English, mathematics,
world and Puerto Rican history, geography, health science, life science, earth science, biology,
art, physical education, and health. Typically in middle schools in Puerto Rico, students change
classrooms and teachers for each area of study (Studylands, 2014).
Types of Schooling
Generally public schools in Puerto Rico can be divided into the two overarching
categories of rural and urban schools. Rural schools provide 4 years of primary education and
then a pre-vocational program. The urban school curricula consist of studies of agriculture, some
economics, health and physical education, Spanish, English and manual training (Puerto Rico
Department of Education, 2014). There is not an adequate amount of educational facilities for all
students in both urban and rural schools (Wagenheim, 2014). As a result, homeschooling is a
popular option for education on the island. There are several homeschooling organizations,
including Puerto Rico Protection and Advocacy Agency, Escuela en el Hogar Nuevos
Horizontes, Grupo Area Metro de Educadores en el Hogar, North Area Christian
Homeschoolers, and The Caribbean Center of Home Education Resources (ED Anywhere,
2012). Homeschool programs are typically not funded by the government and therefore have no
regulations, teacher qualification requirements, or standardized testing (HSLDA, 2014).
Ironically, this lack of regulation proves to be beneficial, as homeschooling students tend to test
better than students enrolled in public and private schools.

pg.
30
3. Methodology Our goal was to develop an effective educational module that can be used to teach
middle-school students in the city of Río Grande, Puerto Rico, about the immediate and long-
term impacts of climate change. We worked on this project in collaboration with the United
States Forest Service in Puerto Rico from October 2014 to December 2014. Based on interviews
with regional and local experts on climate change and teachers, questionnaires given to students,
and observations of classroom settings, we developed a learning unit to address the current need
for climate change literacy in the community. This unit included two lessons and a homework
assignment. Provided with each lesson were student materials and an instructor guide. The intent
of making this guide was to provide the teachers with sufficient knowledge to teach the concepts
presented in each lesson.
In order to fulfill our goal, we developed the following objectives:
1. Identify the main concepts and concerns with respect to climate change in Puerto Rico.
2. Determine the best way to educate middle school students in Río Grande
3. Create an educational module for the area and our targeted students
4. Evaluate the effectiveness of our developed learning unit and revise as necessary.
These objectives will be addressed in the subsequent sections.
Objective 1
Identify the main concepts and concerns with respect to climate change in Puerto Rico.
For this project, the USFS’s particular interest was to create an educational module that
focuses on the aspects of climate change that are affecting El Yunque National Forest, as well as
Puerto Rico in its entirety. In order to create the most relevant learning unit on climate change
possible, we had to gain knowledge about the forest and the island.
We conducted interviews with local experts to determine the current state of climate
change impacts in the region. This group of experts was identified by the USFS, and included,
amongst others, members of the DRNA and the University of Puerto Rico. We asked these
experts about their observations of climate change and the effects that they foresee in the future
as a result of these observations (see Appendix A). Our aim was to determine the most important
effects of climate change that are impacting the island of Puerto Rico. These interviews
expanded upon our previous climate change research by providing more specific information
about the observed impacts of climate change in Puerto Rico, as well as helping us to identify the

pg.
31
misconceptions that Puerto Ricans have about climate change. In addition, the data gained during
these interviews helped us to determine what topics are most relevant to include in a learning
unit involving adaptation to local climate change impacts. This was done by identifying common
topics in the interviews and by directly asking what topics the interviewees thought were
important to include in a learning unit about climate change. We used a coding system to
evaluate and quantify the information gathered from these interviews. The system included
identifying phrases and terminology that were common throughout the interviews. These phrases
were then placed into three categories: climate change, environmental education techniques, and
public opinion. Example topics that we found in our interviews included “outside of their
reality”, “loss of coastal resources”, and “relatable/personal”. These topics would be categorized
into the public opinion, climate change, and environmental education techniques, respectively.
The topics that appeared most often throughout the interviews were the topics that
influenced what was discussed in our learning unit. Lastly, we further researched topics that had
yet to be covered in our background research in order to develop our learning unit. In addition,
we asked our interviewees about what studies they had done or observed as well as what
resources and literature they could provide that was relevant to Puerto Rico. After receiving
these resources, we incorporated what we learned into our background research and learning
unit.
Objective 2
Determine the best way to educate middle school students in Río Grande.
In order to identify the best ways to educate middle school students in Río Grande, we
conducted interviews with local educators. From these interviews, we gained knowledge about
the teaching styles of local educators as well as their familiarity with teaching topics related to
climate change to students (see Appendix A). The techniques that were found to overlap between
the responses of the interviewed teachers and our background research, as well as techniques
found in modern pedagogy, were the techniques that we intended to incorporate into our learning
unit.
By identifying the education styles used in the area, our intention was to make the
learning unit as relatable and as easily integrated as possible while introducing a new topic to the
students. This helped us to develop a learning unit that is suitable for the average Puerto Rican
middle school, in order for it to be used as a potential resource for these and other teachers in

pg.
32
Puerto Rico. From our interviews with educators, we gained an insight to the educational styles
and structures in place in the school. After these interviews, we observed classroom settings to
acquire a first-hand view of these educational styles. This helped guide the process of creating a
learning unit that can be easily integrated into the current learning environment. In order to better
integrate this learning unit into varied learning environments, we felt it necessary to create an
instructor’s guide that incorporated detail on both the subjects of the lesson as well as how those
subjects are presented. This ensured that teachers that do not ordinarily employ modern
pedagogical techniques could easily include our lesson plans into their own curricula. This guide
would also be informative for teachers that do use active learning techniques, as it would provide
crucial background information on climate change and its related topics.
Objective 3
Create an educational module for the area and our targeted students.
Our selection process for determining what subjects to include in our lessons was based
upon the results from our expert interviews and our background research. Our lessons targeted
the topics that were deemed important by the experts and that we felt would serve well as an
introductory course to climate change. From interviews with teachers we determined the best
ways to present these concepts. The concepts identified above were translated into specific
learning objectives for our lesson plans (see Appendices E and F). These objectives were the
intended learning outcomes of our lessons. Based on these, we created activities, diagrams, and
discussion questions to address each objective within two 50-minute lessons. In addition to these
lessons, we created a homework assignment designed so that both the students and their family
members would find them informative. Lastly, we translated all written components of both
lessons into Spanish so that it would be more accessable for Puerto Rican students. In order to
ensure that crucial activities could be completed as desired in an allotted time, we tested them on
a group of three fellow WPI students. We then applied the feedback received from this
preliminary testing of the proposed activity as necessary.
While we were only able to test two lessons, as per the request of our sponsor, we
developed complementary lesson outlines that can be further expanded upon in future iterations
of this project. In addition, we created a few field activities intended to show the immediate
impacts of climate change in the students’ locality. The components of our lessons and the

pg.
33
homework assignment, as well as instructions on how to present these materials, were combined
to create a deliverable to be accessed both in person and online.
Objective 4
Evaluate the effectiveness of our learning unit and revise as necessary.
We assessed the effectiveness of these lessons by administering them to a class of 24
students, aged 14 to 15 years old. Prior to this pilot test, we developed a pre-test to determine
what the students know of and understand about climate change. This pre-test gauged the
students’ preexisting knowledge about the learning objectives that we desired to address in our
lessons. The test was comprised of 12 multiple choice questions, with questions allocated to each
learning objective, and was distributed the day before the presentation of the first lesson.
Immediately after the execution of our second lesson, we administered a post-test to the students.
In developing our post-test, we used the same questions used in our pre-test, but the order was
changed, since using an identical set of tests could skew our comparisons, as the students could
easily remember the questions of the pre-test and not genuinely answer the post-test questions
(Gormally et al., 2012). These post-tests also included qualitative questions such as “did you
enjoy the past two lessons?” (see Appendix G) that gauged the students’ opinions of the lessons.
During our project development process, we created our resources under the assumption
that our pilot tests would be taught by a non-science teacher. It was for this reason that we
created a detailed instructor’s guide, so that any teacher could easily include our lessons into
their classrooms. However, due to unforeseeable circumstances we had to step in at the last
minute and teach both of our pilot lessons ourselves. Additionally, the timing of when we were
going to administer our lessons differed from what we had initially planned, resulting in a single
day gap in between the two lessons. These circumstance also lead to us conducting these lessons
at different locations. Lastly, the amount of time we had for the first lesson was
miscommunicated due in part to the presence of a language barrier. All of these complications
we faced forced us to alter certain parts of our methodology.
The results of the pre-test and post-test data were compared to examine whether an
increase in knowledge about climate change occurred. To determine this, we performed a paired
samples t-test (a within-subjects test comparing each student’s change in score) using the
program, Statistical Package for the Social Sciences (SPSS). We based our analysis on the null

pg.
34
hypothesis (h0) that there would be no changes between the pre- and post-test, and an alternate
hypothesis (h1) that there would be increases in the scores between the pre- and post-test. We
took each individual’s tests and graded the pre-test and post-test as a pair. Each question was
weighted equally, and a numerical score was determined for each test. The change in test scores
between the pre-test and the post-test was determined, and the percent change between these two
scores was generated. The percent changes from pre- to post-test of each student were analyzed
to evaluate the overall effectiveness of the lessons. For this testing, we defined the term
“effective” to correspond to a p-value of less than .05.
Additionally, percent changes were determined for each learning objective, first
individually and then as a whole class. We compared the results of how well each learning
objective was addressed by calculating the change in correct student responces on each
objective’s corresponding questions between the pre- and post-test, and made observational
inferences based upon the data. Based on the learning objectives that showed the least
improvement from the two tests, we revised the learning unit to cover the learning objective in a
different and potentially more effective way. In addition, we distributed student questionnaires to
four other classes of students of the same grade level in the same school. To statistically compare
the pre-test scores of the students we planned to test our lessons on with the questionnaire data of
the other ninth grade classes, we decided to utilize an independent samples t-test. The rationale
behind conducting this test was to ensure that our testing class was not significantly different
from the other ninth grade classes in terms of test scores and, moreover, knowledge about
climate change. This provided us with additional information on how to prioritize the other
revisions to our lessons. Furthermore, lesson outlines on additional climate change topics were
created, taking into account the gaps in knowledge of the ninth grade, as a whole. These lesson
outlines, as well as the revised pilot-test lessons, were provided to our sponsor. The results of our
lesson evaluation and the topics determined from expert interviews about climate change
(Objective 1) were used to create these additional lessons.
pg.
35
4. Results and Discussion
Objective 1
To best understand the most pressing issues of climate change facing Río Grande, we
interviewed several local environmental specialists with knowledge of climate change as well as
participants of environmental education initiatives. Our interviewees consisted of professors at
the University of Puerto Rico, forest managers in El Yunque National Forest, and DRNA
employees.We asked these experts about their observations of climate change and its potential
effects, public perception of climate change, adaptation, and effective means of communicating
change to students. Throughout our interviews there was a consensus that rain patterns have
changed in the area over recent years, that the public is generally unaware of and unconcerned
about climate change, and that, to adapt to climate change, there needs to be an effort towards
local, relatable education.
To determine what information was most relevant in our interviews, we first recorded and
transcribed each interview. We critically read each transcription, and completed a process of
thorough coding based upon three predetermined categories: climate change, environmental
education techniques, and public perception. We recorded the topics discussed in each interview
in a table that organized these topics into columns corresponding to each categories. We then
compared our interview tables to identify any repeating topics. We calculated the number of
times each of these topics appeared in an interview, and presented the results in a bar graph.
Only the topics that were discussed at length in at least two interviews were included in the bar
graph.
For our interviews with climate change experts, we noticed that changing rain patterns
were mentioned in 7 out of these 8 interviews. Additionally, we saw that rising sea levels, rising
temperatures, and effects on endemic species were mentioned in these interviews. In the
interviews with specialists who were also participants in environmental education initiatives, we
chose to expand our focus to include topics such as how these experts were trying to raise public
awareness of climate change and how effective and efficient these initiatives were. There was a
consensus amongst the interviewees that the Puerto Rican public knows very little about climate
change and is, on the whole, unconcerned about it. The reasons for this perception range from a
lack of understanding to the denial of this rather large and overwhelming topic. Overall, our

pg.
36
interviewees expressed a feeling of genuine concern for the future of the island because of this
lack of awareness.
It was apparent from these interviews that climate change is an issue of pressing concern
in Puerto Rico, and one that the general public is virtually unaware of (see Appendix B). The
island is currently experiencing many of the effects of climate change typical of a tropical island.
These include changing precipitation patterns, increased median temperatures across the island,
ecosystem degradation, and rising sea levels (Nurse et al., 2014). These topics were frequently
mentioned by our interviewees, as seen in Figure 6Error! Reference source not found. below,
which measures the number of interviews in which this topic was discussed at length. Further
explanations of each of these topic headings is provided in Table 3.
Figure 6: Topics of Interest - Climate Change
Table 3: Explainations of the Identified Climate Change Topic
Climate Change
Topic Meaning
Loss to coastal
regions
Discussions referring to the disappearance of the coasts due to rising sea
levels
Changing Rain
Patterns
Discussions about how climate change will cause changes in precipitation
due to the increase in atmospheric temperatures
Changes in
temperatures Discussions about how temperatures will be altered due to climate change
Sea level rise Discussions about how climate change contributes to rising sea levels
0
1
2
3
4
5
6
7
8
Nu
mb
er
of
inte
rvie
ws

pg.
37
Effect on coastal
resources Discussions on how sea level rise will effect resources on the coast
Effects on tourism Discussions on how the effects of climate change, such as sea level rise
and changes in precipitation patterns, can impact the tourism industry
New diseases Discussions about how new diseases can arise because of changes in
precipitation patterns and in temperatures
Extinctions Discussions on how animal extinction in an area can occur due to the
species’ inability to adapt to changing climate conditions conditions
Adaptations Discussions about adapting to climate change, in general
Effect on Endemic
Species
Discussions about how changing precipitation patterns and temperatures
can affect species only found in Puerto Rico
Drying Trend Discussions about how the island may be experiencing a drying climate
due to climate change
Effect on food
production
Discussions on how food production can be affected by changing
precipitation patterns, rising temperatures, and other affects of climate
change
Connectivity of
Nature
Discussions about the how all of nature is connected and therefore climate
change is a problem that can affect every aspect of nature
Renewable energy Discussions about how the use of renewable energy sources can help
mitigate climate change
Agroforestry Discussions about the use of agroforestry, or farming in forests, as a way to
adapt to climate change
Adaptation- new
agricultural
practices
Discussions about adapating to climate change in reference to utilizing new
agricultural techniques in order to improve food production as the climate
changes
Changes in precipitation have already had a visible effect on the island (Filipe Cano,
personal communication, 2014). Previously, the island’s rain patterns followed a steady trend
over the course of a year based upon the wet and dry seasons. Since the 90s, however, these rain
patterns have begun to fluctuate drastically, and are now able to be represented graphically by
spikes and troughs. This indicates that in place of a steady rain trend, the island is now seeing
extreme weather, with very dry and very wet periods. This in turn gives way to very rainy wet-
seasons and very arid dry-seasons (Filipe Cano, personal communication, 2014). This past
summer, the island experienced an example of such weather extremes with a several-month-long
drought, followed by floods (Isabel Rivera, personal communication, 2014). The results of this
small period of time alone included huge financial losses, as well as burdens on several
industries such as the coffee industry and farming (Univision PR, 2014). It can be inferred from
this incident alone that the island’s rain patterns have an enormous effect on many parts of the
island, and the continuation of current precipitation changes may have devastating effects on the
island as a whole.

pg.
38
Puerto Rico is experiencing changes in its wildlife in response to climate change as well
(Filipe Cano, personal communication, 2014). The changing rain patterns and increased
temperatures are having an effect on the island’s many ecosystems by shifting its nature in
response to these changes. As a result, the animals in these ecosystems have begun to inhabit
different ecosystems so that they may have a better quality habitat. This leads to an increase in
competition for resources, which has the potential to lead to other changes in the area. One such
example is the potential increase in tropical diseases, which are now able to survive in areas they
previously did not exist in, as a result of the changing ecosystems. Already there is an increase of
instances of Dengue and Chikungunya cases in Puerto Rico at higher rates and in locations
where these diseases did not exist in the past (Filipe Cano, personal communication, 2014).
Climate change in Puerto Rico also has an effect on the island’s land use. As an island,
Puerto Rico is very susceptible to changes in its coastline. As sea levels around the world rise,
the island suffers from a loss of land via its coastline. Not only does this result in less land, there
is also a loss of beach tourism – a particularly viable industry on the island (Isabela Perez,
personal communication, 2014; Marcela Canon, personal communication, 2014).
Despite the many negative impacts that climate change could have, there is the potential
for it to be beneficial for the world. Provided that the world changes some of its habits on both
microscopic (individual) and macroscopic (governmental) levels, there is the possibility for
economic shifts that may open up opportunities for islands like Puerto Rico (Ashley Perez and
Eduardo Agostini, personal communication, 2014). One of the biggest contributors to this shift
would be the use of renewable energy. In an island like Puerto Rico, the use of fossil fuels is
extremely costly due to the need to import them, which in turn burns even more fossil fuels. A
shift toward renewable energy would reduce the need for such importation. For example, a solar
megawatt farm could save five million gallons of gas from being burnt over the course of
twenty-five years. Because Puerto Rico is very sunny by virtue of its climate, it most likely
would have the ability to sustain its own energy market. The recycling industry also has the
potential to have an enormous, positive financial impact on the world economy. In an area like
Puerto Rico where there is currently an excess of trash, the possibility for such an economy
could help relieve the island of its trash burden and provide it with another form of income
(Ashley Perez and Eduardo Agostini, personal communication, 2014). An awareness of the

pg.
39
positive impacts of climate change is useful, as it could allow for a more receptive audience to an
otherwise daunting topic.
Objective 2
After conducting interviews described in Objective 1, we began to meet our second
objective of understanding the school system in Puerto Rico, more specifically in the school we
worked in. We observed several classes during the course of a school day and interviewed
teachers to get a sense of the school and a typical day in their classroom. By doing this, we were
able to have a deeper understanding of the school and the students for whom we would be
customizing our learning unit.
We interviewed three teachers in the Carmen L. Feliciano Carreras del Sector Palmer
Middle School in Río Grande, Puerto Rico. These teachers, a math teacher, a visual arts teacher,
and a science teacher, all taught primarily, if not exclusively, ninth grade students – the
demographic for whom our learning unit is to be designed. From the interviews, we were able to
learn that the school offers classes in English, Spanish, mathematics, science, and more to its
students, as well as elective classes such as physical education, visual arts, and music (Amabel
Soto, personal communication, 2014). Classes are typically about forty minutes in length and
consist of at least twenty-one students. The classes that we observed were all classes taught by
the teachers that we interviewed. Lectures began with instruction on that day’s material,
followed by some sort of group work or class-wide activity until the period ended. Some of these
classes also incorporated technology into the lesson, such as with interactive learning tools on an
iPad or the use of Google Earth.
The progressive tools and styles implemented in the school were not unique to one single
classroom, and not even to the school itself. From our interviews, we learned that such methods
have been suggested throughout the island as part of the latest revisions to its academic
requirements (Departamento de Educación de Puerto Rico, 2014; Marganese Sanjunto, personal
communication, 2014). These revisions included, among other things, the use of problem-based
learning and other student-centered pedagogical techniques (Departamento de Educación de
Puerto Rico, 2014). We also learned that among the curriculum changes were new requirements
for students to be taught climate change in science and in other classes (Marganese Sanjunto,
personal communication, 2014). This school year was the first iteration of the new curriculum,

pg.
40
and climate change was taught in the first few weeks of the semester. The material covered was
an introduction to the topic, meaning it was not especially in depth and did not include many
details about the effects of climate change on Puerto Rico. According to the science teacher that
we interviewed, the material that was covered was still enough to bring an awareness of climate
change to the students, and they expressed concern and outrage for the current state that the
planet is in and is headed towards (Marganese Sanjunto, personal communication, 2014). Due to
these findings, we determined that our learning unit pre-test and post-test would most likely
reflect some sort of effect of this curricular change, as we would be testing the learning unit on
students that have recently had an exposure to the topic. However, because the learning unit was
intended to be introductory, while also including some aspects that focused on Puerto Rico, we
kept our learning unit design ideas the same. Because the learning unit was intended to be
designed for students who had never had an exposure to climate change, the results of our pre-
test had the potential to be higher than anticipated.
Our interviews also informed us about other aspects of the school. In particular, we
learned about the school’s involvement with large-scale projects and its participation in field
trips. This knowledge was fundamental to the development of our learning unit, as we originally
intended to include a field activity in it. We also were considering large-scale projects as part of
our learning unit development for later iterations of this project. In our interviews we learned that
field trips were often used to supplement class material. At this school, the definition of a field
trip included outdoor activities on school grounds as well as activities off of the school grounds.
When asked, teachers reported that they found using field trips to be particularly effective at
emphasizing class material and engaging students. These teachers felt that, by exiting the
classroom, students were able to have more mental stimulation simply from being outside of the
classroom setting, and that field activities provided resources that teachers could not always
provide in a classroom. This ultimately would result in a deeper, multi-layered understanding of
the topic being taught and its many applications in the outside world. The teachers in the school
also reported often incorporating large-scale projects into their curriculum to further student
understanding. One such project was conducted by Amabel Soto (2014), wherein students
applied the topics learned in their math classes to a recycling project. Using trash barrels of a
certain size, students applied basic geometry to calculate how many recyclables can be placed
into the barrel, allowing them to not only put their acquired knowledge to a real-world situation

pg.
41
but also to see how efficient the barrel is at containing the recyclables before it is brought to a
recycling center.
We also conducted interviews with members of various environmental education
initiatives to help us establish various education techniques in conjunction with the information
provided by the Carmen L. Feliciano Middle School teachers. Many of these initiatives that
interviewees were involved in involved a youth outreach component, such as the following youth
initiatives: Children’s Tropical Forest, Sierra Club, and Project Learning Tree. From the
questions that we asked our interviewees, we determined some of the ways in which we may
structure our lessons. One of the most important aspects that were recommended to us was to
make our lesson relatable to students. In this way, they would have a better point of reference
from which to understand the subject matter. By having a relatable lesson, the students would
also be able to find the material more relevant to their lives, allowing for the potential for them to
be more concerned with the issue (see Figure 6). In previous environmental education initiatives
many topics had not been particularly relevant to Puerto Rican students and were as a result not
very effective (Carolyn Krupp, personal communication, 2014). We were also advised to try
incorporating outdoor activities and field trips to make the material more tangible and to
stimulate the students’ interest. Due to the age, grade-level, and lack of exposure to the topic of
climate change, we were instructed to keep the lesson superficial and introductory so that the
students would be able to understand the material. Figure 7 below depicts the other
recommendations we received. The graph measures how many interviews mentioned the same
education technique at length. These techniques were determined using the same general process
of coding the interview trancripts as outlined in Objective 1. However, for the teacher interviews
specifically, we separated the information into education techniques, environmental education,
and specifics of Puerto Rican education.

pg.
42
This graph shows the various techniques discussed in our interviews. This
included utilizing tools such as videos and worksheets, as well as suggestions
such as making the lesson relatable/persobnable.
Figure 7: Education Techniques Discussed in Interviews
Overall, the observations of the classes and the classrooms at the Carmen Feliciano
Carreras Middle School gave way to a better understanding of the possibilities available while
developing our learning unit. We found that though the classes were taught in Spanish, many
tools presented to the students were in English. This included informational wall posters and
interactive, online activities. By having this mixture of languages, we were able to use more tools
in the development of our learning unit, as we had more English-based tools that were at our
disposal. Most of the classrooms we saw also had an integration of technology, which again
opened a range of possibilities for learning unit development. The availability of technology both
in the classroom and in the student use of personal cell-phones allowed us to be able to
realistically include slide-shows, videos, and/or technology based homework assignments in the
construction of our learning unit. Our learning unit construction also included classroom
activities to allow for a more hands-on approach to the topic. By including classroom activities in
conjunction with lectures, this mixed approach to our learning unit would be easily integrated
into Puerto Rican schools, as this format mirrors the formats seen in the classrooms that we
observed as well as those described in the island’s latest curriculum guideline (Departamento de
Educación de Puerto Rico, 2014).
0
1
2
3
4
5
6
Nu
mb
er o
f In
terv
iew
s

pg.
43
Objective 3
As the data from the first two objectives were gathered, we began to develop our climate
change learning unit. First, we developed seven learning objectives to be covered in the two
lessons, as seen in Table 4. These objectives were based on the topics that were deemed
important by our experts in addition to the topics we found in our research on climate change
education. However, we wanted our lesson to be an introduction to climate change, as requested
by our sponsor and as reiterated by the interviewees. Therefore, in our first lesson we began with
discussing the causes of climate change and the processes involved. Then we presented the
specific effects of climate change that are impacting Puerto Rico.
Table 4: Learning Objectives For Our Two Developed Lessons About Climate Change
Learning
Objective
Students will be able to…
1 Identify an evidence of climate change, focusing on the relationship between CO2
concentrations and atmospheric temperature.
2 Describe the greenhouse effect and identify the gases involved in it.
3 Describe how carbon enters the atmosphere as depicted by the carbon cycle.
4 Identify sources of CO2 emissions.
5 Identify the predicted impacts of a warmer atmosphere on the earth, focusing on
the water cycle and oceans.
6 Determine the impacts of climate change on animals and plants in El Yunque,
focusing on the impacts of rising temperature and changing precipitation patterns.
7
Determine the impacts of climate change on humans, especially how changing
precipitation patterns, rising sea levels, and changing animal and plant habitats
affect humans
We developed a PowerPoint presentation to display material and guide activities. This
presentation addressed each learning
objective using graphs, discussion
questions, and activities. Such graphs and
diagrams from the first lesson included a
diagram of the greenhouse effect, a pie-
chart depicting the different percentages
of each greenhouse gas in the atmosphere,
and a diagram of the carbon cycle, a pie-
Figure 8: Activity from Lesson 1 (see Appendix uviwelyb)

pg.
44
chart of the sources of CO2 emissions (Figure 8). Each of these graphs was doctored to not
include specific information in order for the student to supply said information. A student
worksheet was created that exhibited these graphics and allowed for students to fill-in the
appropriate information as the lesson progressed. These graphics were either found or created
based upon data provided by various government agencies. The activities involved in lesson 1
included having the students create graphs depicting changes in global temperature and carbon
emissions over time and a version of the classic board game Pictionary, in which the students
had to draw sources of carbon emissions.
In our second lesson, discussion questions and other graphics included a diagram
depicting the water cycle and a graph displaying the change in ocean temperature over time were
utilized. Additionally, we developed an activity in which students placed endemic animals and
plants on an illustration of a mountain in El Yunque and shifted their elevation on the mountain
based on hypothetical scenarios in which the precipitation levels or temperature changed. We
developed this activity based on a conversation we had with Filipe Cano (see Appendix B) where
we discussed how climate change contributes to habitat shift. We created a worksheet to
accompany this activity that included the pictures of the animals and plants, the picture on the
mountain in El Yunque, graphs depicting the required conditions of the animals, plants, and
forests, and detailed instructions on how to complete the activity. This activity is intended to
encourage students to think critically about how changing temperatures and precipitation patterns
due to climate change can affect the wildlife of El Yunque. In order to ensure that this activity
would work the way we intended, we tested the activity on a group of college students. In this
testing, we gave three students a rough draft of our habitat activity and they were allotted twenty-
five minutes to complete it. They were able to complete the four scenarios by moving the
animals and plants to different elevations. In that time, they were able to complete the discussion
questions and provide detailed responses. However, the fact that they could not move the
different forests types provided confusion. Therefore, we created labels of each forest type that
could be moved in elevation when the temperature and precipitation ranges changed.
In addition to this PowerPoint presentation, we created worksheets for the activities and
an instructor’s guide that provided instructions for teachers on how to present each part of the
lesson. It also included additional information on each aspect of the lesson in case the teacher

pg.
45
had never taught climate change before. This instructional guide explained each of the concepts
addressed in our lessons in order to provide a deeper understanding of what we are asking them
to teach, with the use of supplemental diagrams. Figure 9 below is an example of a page in this
instructor’s guide.
Figure 9: Excerpt from our Instructor's Guide

pg.
46
1. Which of the following is not a greenhouse gas?
(Objective 2)
a. Carbon dioxide
b. Propane
c. Methane
d. Water vapor
Objective 4
To understand the effectiveness of our developed lesson plan, we went to the Carmen
Feliciano Carreras Middle School to test the individual lessons. We were paired with a class of ninth
grade students at the school (designated as class 9-2) that was also involved in a 4-H club through the
University of Puerto Rico, Río Piedras. The class
groups at the school were separated by their
chosen elective courses; in the case of the class
that we worked with, the students were all taking
a visual arts elective. This elective art class was
integrated with 4-H through the environmental
education program known as Casa del Árbol, a
project that focused on developing tree
propagation, planting, and transplanting, as well
as nursery management and maintenance skills in 4-H members. The class therefore was very
involved with El Yunque and they frequented the forest for various school field trips, such as a large-
scale photojournalism project. There were a total of 24 students in the class who participated in our
lessons; there were 16 girls and 8 boys in the group.
To evaluate the effectiveness of our lesson plans on this class, we gave each student a pre-test
on the material to be covered in the lessons. This pre-test was designed to evaluate their
understanding of these topics before participation in our lessons. Each question in the pre-test was
geared to address one of the seven learning objectives for the lessons, and they all contained
information that was to be covered in the lesson. a sample of a question on this test can be seen
below.
Additionally, we handed out questionnaires (which contained the same questions as the pre-
test) to the entire ninth grade to be able to obtain a comparison of the results of the pre-test for the 4-
H class and determine if the additional exposure to climate change topics that the 4-H classes
received would correspond to significantly better pre-test scores. These contained demographic

pg.
47
questions such as age and gender. To distribute these questionnaires, we asked the ninth grade math
teacher, Amabel Soto, to administer them to all of her classes, with the exception of the 4-H class.
We asked that she only give students ten minutes to complete the questionnaire and work
individually, so as to best simulate the condition that were present when the 4-H class received the
pre-test.
The lessons were developed with the intent of being administered on two consecutive days by
a professional teacher. However, due to unforeseen circumstances, our team had to deliver the
lessons ourselves with little time to prepare. Furthermore, there were last-minute schedule and
location changes. We had to deliver the two
lessons with a day in between them, and the
post-test on the day of the second lesson as
opposed to a day after. These factors could
affect our lessons’ effectiveness. Firstly, our
team members have no formal training in
teaching, leading to the possibility that various
points in the lesson could have been delivered
more effectively had we been professional
teachers. We were also limited in part due to a language barrier. Though for the most part, the
students were able to understand English, they were more comfortable speaking Spanish. Meanwhile,
for the most part, we could understand Spanish and had moderate to high proficiency in the
language, but there was still an occasional confusion between both parties. In an attempt to minimize
confusion, we translated all written material involved in our lessons, including the pre- and post-tests.
Despite this, we still received questions concerning the meaning of certain technical terms, such as
“correlation”. Overall, we found that the ten minutes given to complete these test was reasonable, as
students did not seem to have any difficulty completing the test in this time. It is important to note
that most student utilized the full ten minutes to complete the pre-test.
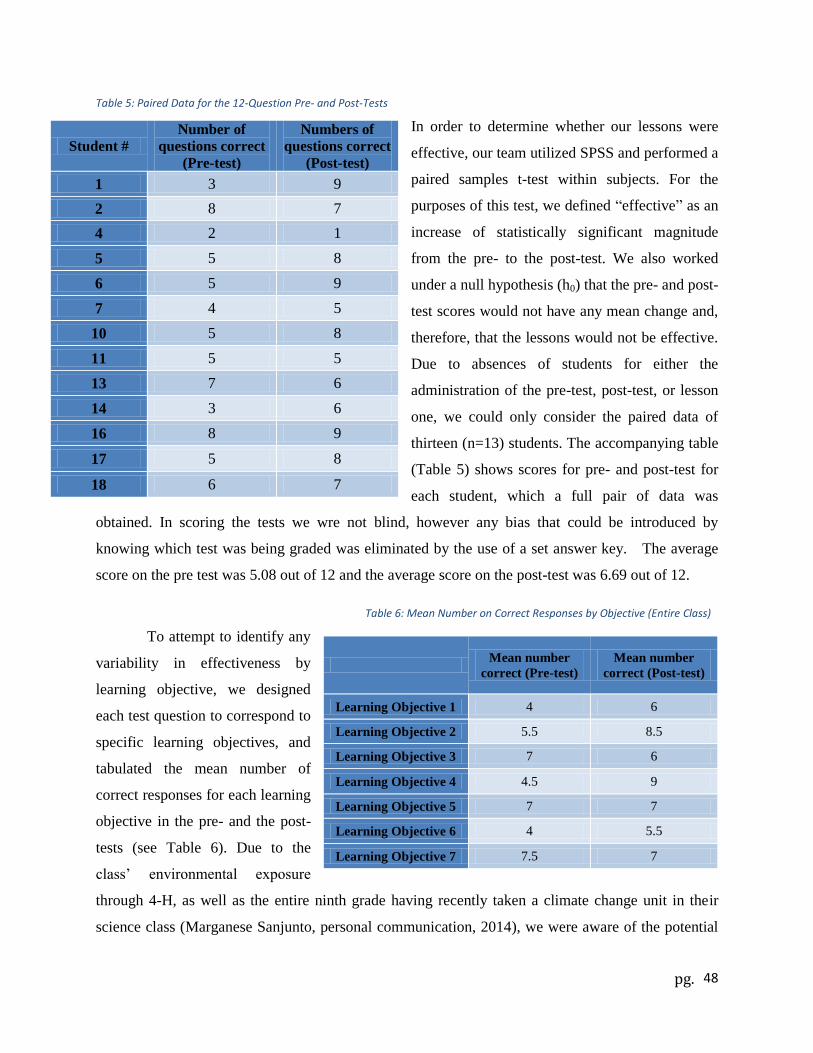
pg.
48
Table 5: Paired Data for the 12-Question Pre- and Post-Tests
In order to determine whether our lessons were
effective, our team utilized SPSS and performed a
paired samples t-test within subjects. For the
purposes of this test, we defined “effective” as an
increase of statistically significant magnitude
from the pre- to the post-test. We also worked
under a null hypothesis (h0) that the pre- and post-
test scores would not have any mean change and,
therefore, that the lessons would not be effective.
Due to absences of students for either the
administration of the pre-test, post-test, or lesson
one, we could only consider the paired data of
thirteen (n=13) students. The accompanying table
(Table 5) shows scores for pre- and post-test for
each student, which a full pair of data was
obtained. In scoring the tests we wre not blind, however any bias that could be introduced by
knowing which test was being graded was eliminated by the use of a set answer key. The average
score on the pre test was 5.08 out of 12 and the average score on the post-test was 6.69 out of 12.
Table 6: Mean Number on Correct Responses by Objective (Entire Class)
To attempt to identify any
variability in effectiveness by
learning objective, we designed
each test question to correspond to
specific learning objectives, and
tabulated the mean number of
correct responses for each learning
objective in the pre- and the post-
tests (see Table 6). Due to the
class’ environmental exposure
through 4-H, as well as the entire ninth grade having recently taken a climate change unit in their
science class (Marganese Sanjunto, personal communication, 2014), we were aware of the potential
Student #
Number of
questions correct
(Pre-test)
Numbers of
questions correct
(Post-test)
1 3 9
2 8 7
4 2 1
5 5 8
6 5 9
7 4 5
10 5 8
11 5 5
13 7 6
14 3 6
16 8 9
17 5 8
18 6 7
Mean number
correct (Pre-test)
Mean number
correct (Post-test)
Learning Objective 1 4 6
Learning Objective 2 5.5 8.5
Learning Objective 3 7 6
Learning Objective 4 4.5 9
Learning Objective 5 7 7
Learning Objective 6 4 5.5
Learning Objective 7 7.5 7

pg.
49
for skewed data analysis as we evaluated our lessons. For this reason, we thought it was extremely
important to compare the 19 pre-test results of class 9-2 to the questionnaire results of classes 9-3, 9-
4, 9-5, and 9-6. We received a total of 89 completed questionnaires from among those classes. A one-
way between subject ANOVA was conducted to compare the effect of different classes of students
on the number of questions that students correctly answered on a pre-test in the 9-2 (4-H), 9-3, 9-4,
9-5, 9-6 class conditions. There was a significant effect of different classes of students on the number
of questions that students correctly answered on a pre-test at the p<.05 level for the three conditions
[F(4,103) = 5.693, p = .000].The descriptive statistics of this data, determined through the use of the
ANOVA test, are provided in Table 7 below.
Table 7: Descriptive Statistics of Initial Student performance on 12 Pre-test Questions
Class Number of
Students
Mean number of
correct answers
Standard
Deviation
Minimum
number of
correct
answers
Maximum
number of
correct
answers
Variance
9-2 (4-
H) 19 4.31 2.02 2.00 8.00 4.08
9-3 21 3.05 1.43 1.00 5.00 2.04
9-4 24 4.24 1.97 0.00 7.00 3.88
9-5 23 2.24 1.67 0.00 5.00 2.79
9-6 21 3.57 1.63 1.00 7.00 2.66
While the ANOVA test did determine that there were significant differences in test score
between all classes, it did not state which classes were significantly different from each other. A plot
of the mean pre-test scores for all ninth grade classes can be seen below in Figure 10.

pg.
50
Figure 10: Plot of Mean Test Scors for Each Ninth Grade Class as Determined by an ANOVA test
In order to determine which class’s test scores, if any, were significantly different when
compared to the 4-H class test scores, we decided to use an additional statistical analysis, known as
an independent-sample t-test, for each class. Like the ANOVA test, the independent samples t-test
utilized a null hypothesis of no difference in test scores between classes. An independent-samples t-
test was conducted to compare the number of questions that students correctly answered on a pre-test
in the 9-2 (4-H) class and 9-3 class conditions. There was a significant difference in the score for the
9-2 (4-H) class (mean = 4.42, sd = 1.92) and 9-3 class (mean = 3.05, sd = 1.43) conditions;
t(38)=2.58, p = .014). This p-value of less than .05 indicated the the difference between test scores in
classes 9-2 and 9-3 were of a statistically significant magnitude. Next, an independent-samples t-test
was conducted to compare the number of questions that students correctly answered on a pre-test in
the 9-2 class and 9-4 class conditions. There was not a significant difference in the score for the 9-2
class (mean = 4.42, sd = 1.92) and 9-4 class (mean = 4.04, sd = 1.80) conditions; t(40)=.66, p =
.515). In this case, the tests for students in the 9-2 and 9-4 classes showed a difference in test scores
that was insignificant in magnitude. Then, an independent-samples t-test was conducted to compare
the number of questions that students correctly answered on a pre-test in the 9-2 class and 9-5 class
conditions. There was a significant difference in the score for the 9-2 class (mean = 4.42, sd = 1.92)
and 9-5 class (mean = 2.26, sd = 1.66) conditions; t(40)=3.91, p = .000). Of all the classes we
compared the 4-H students to, the difference in test score between these two classes had the greatest
statistical significance. Lastly, an independent-samples t-test was conducted to compare the number
of questions that students correctly answered on a pre-test in the 9-2 class and 9-6 class conditions.

pg.
51
There was not a significant difference in the score for the 9-2 class (mean = 4.42, sd = 1.92) and 9-6
class (mean = 3.57, sd = 1.63) conditions; t(38)=1.51, p = .139). The results of this analysis, similar
to the previous analysis of classes 9-2 and 9-4, showed that the difference in test scores between
these two classes was not statistically significant. Because we were only able to reject the null
hypothesis for the analyses comparing 9-2 with 9-3 and 9-2 with 9-5, we concluded that, although the
4-H student had increased prior exposure to climate change topics, their test scores were not
significantly greater than ninth grade classes who had not had this increased exposure.
Based on the data in Table 7, we determined that there was no statistically signifigant
difference between the overall mean class scores of the 4-H group, which we used for testing, and
other classes of ninth grade students in the Carmen Feliciano Carreras Middle School. We were not
able to definitively determine whether the 4-H class’ recent exposure to a climate change curriculum
provided a skew, as there was no pre-test data from before that curriculum to compare our pre-test
with. However, the theoretical score that a student should get on this exam if they were to randomly
guess the answer for each question would be a 3 out of 12, as this test comprised of multiple-choice
question with four responces each. Having determined that the 4-H class did not display a
significantly greater pre-existing knowledge of climate change, we further analyzed the output of the
statistical analysis of our pre- and post-test.
During this analysis, we adopted a null hypothesis predicting no changes students’ test
scores, and an alternative hypothesis (h1) predicting that our lessons would be effective in increasing
the students’ test scores. The application of the paired samples t-test within subjects showed a
statistically reliable difference between the mean number of the Pre-Test (mean = 5.08, sd =
1.85) and the Post-Test (mean = 6.69, sd = 2.25, t= =2.63, df=12, p = .022, α = .05. Because the
p-value was less than or equal to .05, we were able to reject the null hypothesis, and definitively
conclude that our pilot lessons were effective in increasing the students’ climate change
knowledge at the 5% significance level.
While we were able to statistically demonstrate that our lessons, as a pair, were effective, we
did note that learning objectives 3 and 7 experienced a small negative change in the number of
student who answered their corresponding questions correctly (Table 6). Additionally, we observed
that learning objective 5 experienced no change in the average number of students who answered the
corresponding questions correctly. Therefore, we targeted these objectives as the focus of our
revisions. Our revisions will also incorporate the recommendations from the teacher of class 9-2, in

pg.
52
order to make our instructor guide more useful for teachers. An additional factor that we would like
to note is that we did not test the validity of the questions presented in our pre- and post-tests due to a
lack of resources, and this may have affected the results of these tests.
Additionally, we coded the answers to the qualitative answers on the post-tests. These
answers revealed, overwhelmingly, that students enjoyed our lessons. When asked specifically what
they liked about the lessons, the students stated that they liked the interactive form of the lessons, the
student-focused activities, and the dynamics of working in groups. Furthermore, fifteen out of the
eighteen students present for the post-test reported that the lessons further inspired them to want to
learn more about climate change. This finding implies that our lesson was successful from a
qualitative standpoint, since the lessons were well received by the students.
In the testing of our lesson, there were various factors that may have affected the results of
our lesson administration. One key factor that may have affected the outcome of our lesson
administration was not strictly following our instructor’s guide. During our lessons, we omitted some
examples while teaching certain topics in the lessons, and this did have a noticeable effect on some
of the questions on our post-test. One question in particular that we believe suffered because of these
omissions is provided below:
Student response for this question from pre- to post-test did not greatly differ . This may be
attributed to the omission of the example of changed chemical composition as an effect of a warmer
atmosphere. Similarly, we were forced to omit the Pictionary activity from the delivery of the first
lesson and replace it with a brief verbal description about sources of carbon emissions. These factors,
though unpredictable in nature, could have contributed toward whether the lessons were effective.
Lastly, we found that the questions corresponding to the learning objectives of lesson one
experienced much larger increases than the questions corresponding to the learning objectives of
lesson two. This observation points out a critical flaw in the testing structure that we employed.
Specifically, we tested the lessons as a pair. Since lesson one was administered two days before the
6. Which is not an environmental effect of warmer oceans? (Objective 5)
a. Rising sea levels
b. Coral reef changes
c. Changed chemical compositions
d. Increased waves

pg.
53
distribution of the post-test and had a pre-homework and homework accompany it, students were
given a chance to both absorb the information in the classroom and think about the content of that
day’s lesson. On the other hand, the second lesson was taught directly before administering the post-
test, without any opportunity afterward for the students to think about the material covered in the
lesson. Since lesson two was largely comprised of an interactive group activity, it was imperative that
students be given the proper time to critically think about the information presented to them in the
lesson. However, due to scheduling difficulties, this was not a possibility. Overall, though our lessons
proved to be statistically and qualitatively effective in teaching students about climate change, there
were many variables that may have affected these results that were, ultimately, out of our control.
Based on the results from our pre- and post-tests, we established that we needed to revise
the portion of our lessons that addressed learning objectives 3 and 7. In order to address these
concerns, at least in part, we decided to omit learning objective 7 (which states that students will
be able to identify the impacts of climate change on humans) in the revised version of lesson 2.
We believe that the lack of understanding could be attributed to the fact that there was not
adequate time to address this learning objective in the fifty minutes of lesson 2. Instead of
lengthening the duration of our lesson, we decided to not address that specific learning objective.
Therefore, we recommend creating an additional lesson that mainly focuses on the impacts of
climate change on humans (see Recommendations).
In order to address our concern with learning objective 3, we decided to simplify the
diagram of the carbon cycle. The students seemed to have difficulty with completing the activity,
which required students to use a list of terms to correctly complete the carbon cycle diagram, due
to the overabundance of terms that needed to be placed. We kept the original diagram however;
we required them to place less of the terms on the diagram. Therefore, some of the steps of the
cycle were already were provided on the diagram, such as ocean uptake, root respiration, organic
carbon, and decay organisms. Based on our observations of students completing this activity, we
noticed that these specific terms were particularly hard for the students to place in the correct
location because the terms themselves were either vague or more complicated to comprehend.
Additionally, we increased the estimated time of the activity to allow the teacher to completely
review and explain each step of the carbon cycle.

pg.
54
In addition, we observed through teaching the lessons ourselves that the layout of our
instructor’s guide could be revised to be more intuitive. At times, we found that the use of long
paragraphs to describe each activity and aspect of the lesson were hard to follow, especially
while teaching the lesson. Therefore, we decided to format the instructor’s guide in a way that
more clearly organizes what the teachers need to ask or explain to the students and then,
separately, provide additional information that will aid their own understanding of the topics. We
also adjusted the estimated times for each aspect of the two lessons to be more realistic and
reflect what happened when we taught each lesson. Minor edits were made throughout the lesson
correcting grammatical errors as well as making the lesson more intuitive for the students. For
example, we added an answer bank (like we had for the carbon cycle) to two diagrams in order
to help the students fill in the diagram more accurately (see Appendicies N and O). Some of the
edits for making the lesson more intuitive to the students were provided by the visual arts
teacher, Stephanie Santos, as she observed the administration of our lessons. For further reading,
the revised lessons, in their entirety, can be found in Apendices N through Q.

pg.
55
5. Recommendations We would like to highly encourage additional testing of our lesson plans. A major
component of this testing process would be to apply formal validity and reliability analyses to
the questions on our pre- and post-tests, as is often done in studies that involve using written tests
(Gormally et al., 2012; Brownell et al., 2013). Conducting these types of rigorous analyses
would be crucial in any further testing (Phelan, 2006). First, a validity analysis would determine
whether each question truly measures the learning objective it corresponds to. Second, a
reliability analysis would determine with what consistency our questions measure each learning
objective (Phelan, 2006). After performing this set of analyses, we would recommend applying
any necessary changes to the pre-and post-test that would increase both validity and reliability.
Our lessons should be tested upon a classroom of students who have had no previous exposure to
climate change topics in an academic setting. This type of testing condition could help isolate
whether our climate change lessons are effective on students who have not studied climate
change, as well as on students who have studied climate change. We encourage the
administration of an additional post-test one month after the lessons are taught to be able to
analyze the long-term retention of the content present in each lesson.
Lastly, we recommend the continued revision and expansion of our developed lessons
and lesson outlines, as we believe the six proposed lessons in our unit, which integrate both
scientific content and personal experiences, have the potential to be an excellent introduction to
the complexities of climate change that. To supplement our revised lessons, we developed
outlines for additional lessons that could be used in a classroom setting to provide more
knowledge about climate change to students (see Appendix R). These outlines contain the
desired learning objectives and topics of interest for each lesson, as well as potential activities
that encourage a hands-on understanding of these topics. The subject material for these lessons
was determined by analyzing the topics mentioned in the interviews conducted in Objective 1
(See Figure 6). One of the most frequently discussed topics of climate change by our
interviewees was the effect that climate change would have on various bodies of water and the
water cycle. We therefore decided to develop our first supplemental lesson outline to address this
topic in more depth, focusing on the aspects of climate change that resulted in effects on water.
This included rising sea levels, coastal erosion, changing precipitation patters and the
consequences of each of these aspects on Puerto Rico. Adaptation was another frequently

pg.
56
discussed topic, a specific example being adaptation through recycling. Accordingly, our next
lesson outline focused more closely on the impacts of climate change on humans, as well as
ways to mitigate and adapt to these changes. The fifth lesson was built off of this topic and
focused exclusively on recycling. Here, we were able to propose a variety of lesson activities,
including art using recycled materials. Seeing as art was a frequently discussed education
technique (See Figure 7) in our environmental education interviews from Objective 2, we
decided that it would be best to incorporate art into one of the supplemental lesson outlines that
we provided. Following this was a final lesson that focused on the more societal impacts that
climate change would have on Puerto Rico, food. Here, we suggested material that focuses on
the environmental impacts that Puerto Rico’s large volume of food importation has, as well as
ways to lower these impacts, thus encouraging self-sustainability and the potential mitigation of
climate change effects.
We believe that these lessons will start to lay down the framework for an effective
climate change unit that is relevant to youth in Puerto Rico. To make these lessons even more
accesable, we suggest that they be designed in a simple and straight-forward manner so that
students of the target age group may best understand the material. By following these
recommendations, we believe that our project can become an extremely useful and informative
tool for teachers in Puerto Rico when discussing climate change in their classrooms. After being
fully expanded, this completed learning unit could have a large impact upon students in Puerto
Rico by introducing many essential facets of anthropogenic climate change in an active and
engaging manner.

pg.
57

pg.
58
Literature Cited Aarhus University Department of Education (2014). What is pedagogics?. Retrieved October 30,
2014, from http://edu.au.dk/en/research/
Billmire, M. G., Daimler, J. L., Wong, W. R., & Yi, J. Y. (2008). Future Management Strategies
for El Yunque National Forest. Ann Arbor: Natural Resources and Environment at the
University of Michigan.
Boelee, E., Yohannes, M., Poda, J., Mccartney, M., Cecchi, P., Kibret, S., et al. (2013). Options
for water storage and rainwater harvesting to improve health and resilience against
climate change in Africa. Regional Environmental Change,13(3), 509-519.
Boston University School of Medicine. (2013). Pre- and Post-Testing. Retrieved October 11,
2014, from http://www.bumc.bu.edu/fd/files/PDF/Pre-andPost-Tests.pdf
Brawer, J., Lener, M., & Chalk, C. (2012). Student Perspectives on the Value of Lectures.
Medical Science Educator, 19(3).
Brownell, S., Wenderoth, M., Theobald, R., Okoroafor, N., Koval, M., Freeman, S., ... Crowe, A.
(2013). How Students Think about Experimental Design: Novel Conceptions Revealed
by in-Class Activities. BioScience, 64(2), 125-137.
Caribbean Landscape Conservation Cooperative [CLCC]. (2014). Mission, Vision, & History.
Retrieved November 17, 2014, from http://caribbeanlcc.org/about
Carnegie Mellon University. (2014a). Formative vs Summative Assessment. Retrieved
November 17, 2014, from
http://www.cmu.edu/teaching/assessment/howto/basics/formative-summative.html

pg.
59
Carnegie Mellon University. (2014b). What is the difference between formative and summative
assessment? Retrieved November 17, 2014, from
http://www.cmu.edu/teaching/assessment/basics/formative-summative.html
Carroll, M., Goldman, S., Britos, L., Koh, J., Royalty, A., & Hornstein, M. (2010). Destination,
Imagination and the Fires Within: Design Thinking in a Middle School Classroom.
International Journal of Art & Design Education, 29(1), 37-53.
Casiano Communications. (2014). A look at Puerto Rico’s education system. Retrieved
September 30, 2014, from
http://www.caribbeanbusinesspr.com/cbdirectory/cb_education.php?cat_id=09
Ciais, P., C. Sabine, G. Bala, L. Bopp, V. Brovkin, J. Canadell, A. Chhabra, R. DeFries, J.
Galloway, M. Heimann, C. Jones, C. Le Quéré, R.B. Myneni, S. Piao and P. Thornton.
(2013). Carbon and Other Biogeochemical Cycles. In: Climate Change 2013: The
Physical Science Basis. Contribution of Working Group I to the Fifth Assessment
Report of the Intergovernmental Panel on Climate Change. [Stocker, T.F., D. Qin, G.-K.
Plattner, M. Tignor, S.K. Allen, J. Boschung, A. Nauels, Y. Xia, V. Bex and P.M.
Midgley (eds.)]. Cambridge, United Kingdom and New York, NY, USA. Cambridge
University Press.
Cubasch, U., D. Wuebbles, D. Chen, M.C. Facchini, D. Frame, N. Mahowald, and J.-G. Winther.
(2013). Introduction. In: Climate Change 2013: The Physical Science Basis.
Contribution of Working Group I to the Fifth Assessment Report of the
Intergovernmental Panel on Climate Change. [Stocker, T.F., D. Qin, G.-K. Plattner, M.

pg.
60
Tignor, S.K. Allen, J. Boschung, A. Nauels, Y. Xia, V. Bex and P.M. Midgley (eds.)]. ,
Cambridge, United Kingdom and New York, NY, USA. Cambridge University Press.
Curry, H. A. (2012). Naturalising the Exotic and Exoticising the Naturalised: Horticulture,
Natural History and the Rosy Periwinkle. Environment and History, 18, 343-365.
Departamento de Educación de Puerto Rico. (2014). Cartas Circular núm. 27-2013-2014. [PDF].
Retrieved December 17, 2014, from http://www.de.gobierno.pr/files/Carta_Circular_27-
2013-2014_Ciencias.pdf
DRNA. (1993). Plan de Reorganización Núm. 4 de 1993. Retrieved November 15, 2014, from
http://www.presupuesto.gobierno.pr/PresupuestosAnteriores/af2008/Tomo_II/suppdocs/
baselegal/186/Plan4.htm
DRNA. (2012). Leyes. Retrieved November 15, 2014, from
http://www.drna.gobierno.pr/biblioteca/leyes-1/folder_summary_view?b_start:int=0&-
C=
ED Anywhere. (2012) Puerto Rico: Homeschool, best curriculum, Homeschool Group,
Accredited Homeschool, GED Prep. Retrieved September 19, 2014, from.
<http://www.edanywhere.com/PuertoRico.html>.
Egan, K. (1992). Imagination in teaching and learning: The Middle School Years. Chicago:
University of Chicago Press.
EPA. (2012). Effects of Acid Rain - Surface Waters and Aquatic Animals. Retrieved December
18, 2014, fromhttp://www.epa.gov/acidrain/effects/surface_water.html
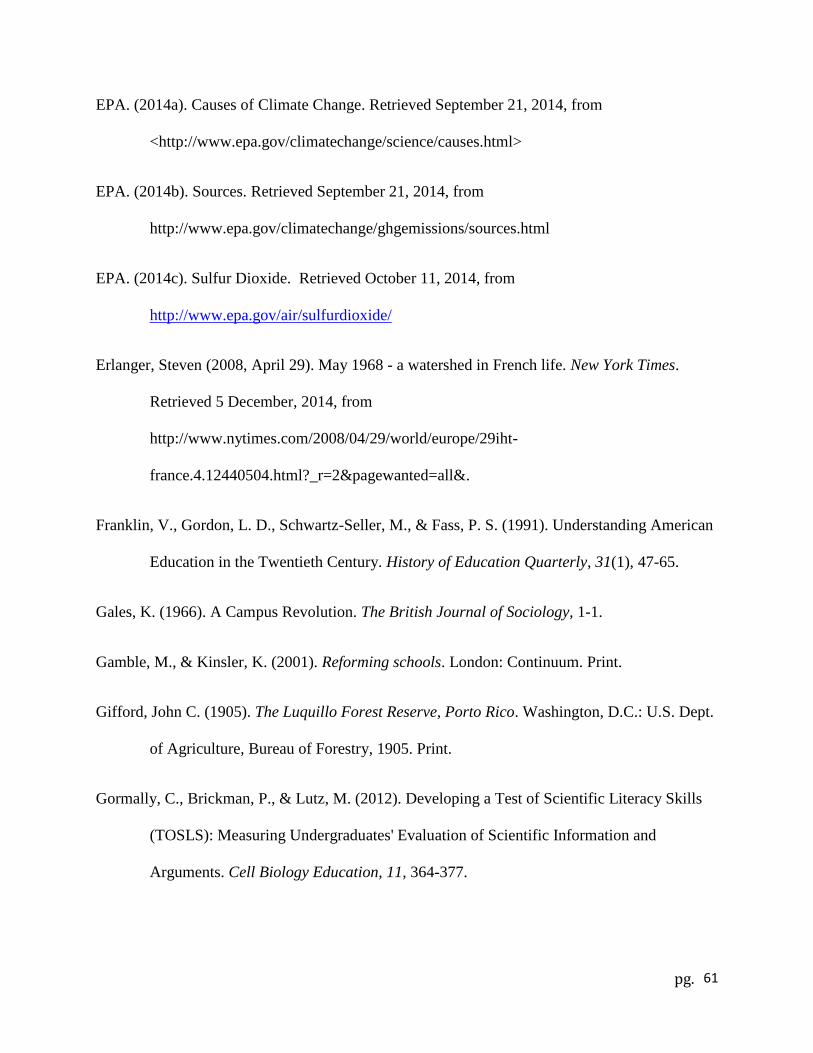
pg.
61
EPA. (2014a). Causes of Climate Change. Retrieved September 21, 2014, from
<http://www.epa.gov/climatechange/science/causes.html>
EPA. (2014b). Sources. Retrieved September 21, 2014, from
http://www.epa.gov/climatechange/ghgemissions/sources.html
EPA. (2014c). Sulfur Dioxide. Retrieved October 11, 2014, from
http://www.epa.gov/air/sulfurdioxide/
Erlanger, Steven (2008, April 29). May 1968 - a watershed in French life. New York Times.
Retrieved 5 December, 2014, from
http://www.nytimes.com/2008/04/29/world/europe/29iht-
france.4.12440504.html?_r=2&pagewanted=all&.
Franklin, V., Gordon, L. D., Schwartz-Seller, M., & Fass, P. S. (1991). Understanding American
Education in the Twentieth Century. History of Education Quarterly, 31(1), 47-65.
Gales, K. (1966). A Campus Revolution. The British Journal of Sociology, 1-1.
Gamble, M., & Kinsler, K. (2001). Reforming schools. London: Continuum. Print.
Gifford, John C. (1905). The Luquillo Forest Reserve, Porto Rico. Washington, D.C.: U.S. Dept.
of Agriculture, Bureau of Forestry, 1905. Print.
Gormally, C., Brickman, P., & Lutz, M. (2012). Developing a Test of Scientific Literacy Skills
(TOSLS): Measuring Undergraduates' Evaluation of Scientific Information and
Arguments. Cell Biology Education, 11, 364-377.

pg.
62
Guardia, L. C., Derocher, A. E., Myers, P. G., Scheltinga, A. D., & Lunn, N. J. (2013). Future
sea ice conditions in Western Hudson Bay and consequences for polar bears in the 21st
century. Global Change Biology, 19(9), 2675-2687.
Guerrero, C. (2014). Cambio climático: conflictos con la conservación y los usos de terrenos
exigidos por necesidades apremiantes. 28th Simposio DRNA: Manejo del Paisaje de
Puerto Rico. (Public presentation, November 7).
Hartmann, D.L., A.M.G. Klein Tank, M. Rusticucci, L.V. Alexander, S. Brönnimann, Y.
Charabi, F.J. Dentener, E.J. Dlugokencky, D.R. Easterling, A. Kaplan, B.J. Soden, P.W.
Thorne, M. Wild and P.M. Zhai. (2013). Observations: Atmosphere and Surface. In:
Climate Change 2013: The Physical Science Basis. Contribution of Working Group I to
the Fifth Assessment Report of the Intergovernmental Panel on Climate Change.
[Stocker, T.F., D. Qin, G.-K. Plattner, M. Tignor, S.K. Allen, J. Boschung, A. Nauels,
Y. Xia, V. Bex and P.M. Midgley (eds.)]. Cambridge, United Kingdom and New York,
NY, USA. Cambridge University Press.
Holzman, B. A. (2008). Tropical forest biomes. Westport, Conn.: Greenwood Press.
HSLDA. (2014). Home Schooling in Puerto Rico Frequently Asked Questions. Retrieved
September 30, 2014, from http://www.hslda.org/hs/state/pr/FAQeng.asp
International Institute of Tropical Forestry [IITF]. (2014). Research. Retrieved November 15,
2014, from http://www.fs.usda.gov/main/iitf/research
Iowa State University. (2014). Techniques for Creative Teaching. Center for Excellence in
Learning and Teaching. Retrieved October 10, 2014, from

pg.
63
http://www.celt.iastate.edu/teaching-resources/classroom-practice/teaching-techniques-
strategies/creativity/techniques-creative-teaching/ General techniques for teaching
creatively
Karl, T.R., Melillo, J. M., Peterson. T.C. [eds.] (2009). Global Climate Change Impacts in the
United States. Cambridge, United Kingdom and New York, NY, USA. Cambridge
University Press.
Luquillo LTER. (2014). Archeology: River Education Program. Retrieved September 17, 2014,
from <https://sites.google.com/a/ites.upr.edu/luquillo-lter/archeology-arqueologia>.
Mazurek, K., & Winzer, M. A. (2006). Schooling around the world: debates, challenges, and
practices. Boston, MA: Pearson/Allyn and Bacon.
McGouldrick, K., Toon, O. B., & Grinspoon, D. H. (2011). Sulfuric acid aerosols in the
atmospheres of the terrestrial planets. Planetary and Space Science, 59(10), 934-941.
McMichael, A. J., Woodruff, R. E., & Hales, S. (2006). Climate Change And Human Health:
Present And Future Risks. The Lancet, 367(9513), 859-869.
Milkova, S. (2014). Strategies for Effective Lesson Planning. Retrieved October 9, 2014, from
http://www.crlt.umich.edu/gsis/p2_5
National Academy of Sciences. (2000). Inquiry and the National Science Education Standards a
guide for teaching and learning. Washington, D.C.: National Academy Press.
National Association of Geoscience Teachers. (2013). Teaching Climate Change. Retrieved
September 19, 2014, from <http://nagt.org/nagt/policy/ps-climate.html>

pg.
64
National Center for Science Education. (2012). Teaching Climate Change | NCSE. Retrieved
September 19, 2014, from <http://ncse.com/climate/teaching>
National Geographic. (2014a). Acid Rain Facts, Acid Rain Information, Acid Rain Pictures,
Acid Rain Effects. Retrieved September 21, 2014, from
<http://environment.nationalgeographic.com/environment/global-warming/acid-rain-
overview/>
National Geographic. (2014b). Deforestation Facts, Deforestation Information, Effects of
Deforestation. Retrieved September 21, 2014, from
http://environment.nationalgeographic.com/environment/global-warming/deforestation-
overview/
National Oceanic and Atmospheric Administration. (2014). Global Climate Change Indicators.
Retrieved December 6, 2014, from http://www.ncdc.noaa.gov/indicators/
National Research Council. (2010) Informing an effective response to climate change.
Washington, D.C.: National Academies Press, 2010. Print.
Natural Resources Management and Environment Department. (2014). Curriculum development
Guide: Population Education for non-Formal Education programs of Out-of-School Rural
Youth. Retrieved October 10, 2014, from http://www.fao.org/docrep/009/ah650e/AH6.
Nieves, V. M., Ruiz, C. E. (2010) EL YUNQUE: a glance at the natural wonder. San Juan, PR.
Impressive Publications.
Nurse, L.A., R.F. McLean, J. Agard, L.P. Briguglio, V. Duvat-Magnan, N. Pelesikoti, E.
Tompkins, and A. Webb, 2014:Small islands. In: Climate Change 2014: Impacts,

pg.
65
Adaptation, and Vulnerability. Part B: Regional Aspects. Contribution of Working
Group II to the Fifth Assessment Report of the Intergovernmental Panel on Climate
Change. [Barros, V.R., C.B. Field, D.J. Dokken, M.D. Mastrandrea, K.J. Mach, T.E.
Bilir, M. Chatterjee, K.L. Ebi, Y.O. Estrada, R.C. Genova, B. Girma, E.S. Kissel, A.N.
Levy, S. MacCracken, P.R. Mastrandrea, and L.L. White (eds.)]. Cambridge, United
Kingdom and New York, NY, USA. Cambridge University Press.
Ophardt. (2003). PH Scale. Retrieved December 18, 2014, from
http://www.elmhurst.edu/~chm/vchembook/184ph.html
Ostendorf, B., Hilbert, D. W., & Hopkins, M. S. (2001). The effect of climate change on tropical
rainforest vegetation pattern. Ecological Modelling, 145(2-3), 211-224.
Phelan, C., & Wren, J. (2006). Exploring Reliability in Academic Assessments. Retrieved
December 18, 2014, from http://www.uni.edu/chfasoa/reliabilityandvalidity.htm
Puerto Rico Department of Education. (2014). An Overview of the Education System in
Puerto Rico. Retrieved September 19, 2014, from http://www.puertorico.com/education
Rao, N. D. (2014). International and intranational equity in sharing climate change mitigation
burdens. International. Environ Agreements, 14, 129-146.
RFF. (2011). Attitudes Toward Climate Change: A Multiple Country Study. Retrieved
September 21, 2014, from <http://www.rff.org/Publications/Resources/Pages/178-
Attitudes-Toward-Climate-Change.aspx>

pg.
66
Ricker, M., Gutiérrez-García, G., & Daly, D. C. (2007). Modeling long-term tree growth curves
in response to warming climate: test cases from a subtropical mountain forest and a
tropical rainforest in Mexico. Canadian Journal of Forest Research, 37(5), 977-989.
Rudel, T., Perez-Lugo, M., & Zichal, H. (2000). When Fields Revert to Forest: Development and
Spontaneous Reforestation in Post-War Puerto Rico. The Professional Geographer,
52(3), 386-397.
Saxton, E., Burns, R., Holveck, S., Kelley, S., Prince, D., Rigelman, N., et al. (2013). A
Common Measurement System for K-12 STEM education: Adopting an educational
evaluation methodology that elevates theoretical foundations and systems
thinking. Studies in Educational Evaluation, 40, 18-35.
Schwartz, R. S., Lederman, N. G., & Abd-El-Khalick, F. (2000). Achieving the Reforms Vision:
The Effectiveness of a Specialists-Led Elementary Science Program. School Science and
Mathematics, 100(4), 181-193.
Smith, M. K. (2012). ‘What is pedagogy?’, The encyclopaedia of informal education. Retrieved
October 11, 2014, from http://infed.org/mobi/what-is-pedagogy/
Studylands. (2014). The Education System in Puerto Rico. Retrieved September 30, 2014, from
http://www.studylands.com/guide/PR-education.htm
Swedish Environmental Protection Agency. (2012). Environmental Objectives Portal. Retrieved
October 5, 2014, from <http://www.miljomal.se/sv/Environmental-Objectives-Portal/>
Teaching and Learning Research Programme. (2009). TLRP: Themes. Retrieved October 11,
2014, from http://www.tlrp.org/themes/themes/tenprinciples.html.

pg.
67
U.S. Fish & Wildlife Service. (2014). Environmental Conservation Online System. Retrieved
October 11, 2014, from http://ecos.fws.gov/tess_public/pub/SpeciesReport.do
UNESCO. (2010) Home Teaching and Learning for a Sustainable Future. Retrieved September
19, 2014, from <http://www.unesco.org/education/tlsf/mods/theme_c/mod19.html>
United Nations Environment Programme. (n.d.). Costa Rica: A Leader in Sustainable Practice
and Policy. Retrieved October 5, 2014, from
<http://www.unep.org/forests/Portals/142/docs>
United Nations. (1997, January 1). Earth Summit. Retrieved December 18, 2014, from
http://www.un.org/geninfo/bp/enviro.html/
United States Department of Agriculture. (2013) Las Tres C: El Yunque National Forest -
History & Culture. Retrieved September 17, 2014, from
<http://www.fs.usda.gov/detail/elyunque/learning/history-
culture/?cid=fsbdev3_042964>
United States Department of Agriculture. (2014). El Yunque National Forest. Retrieved
December 5, 2014, from
http://www.fs.usda.gov/detail/elyunque/home/?cid=fsbdev3_043038
University of Puerto Rico College of Natural Sciences. (2014). Curriculum. Retrieved November
17, 2014, from http://envsci.uprrp.edu/index.php?page=curriculum-2&hl=en_US
University of Tasmania. (2014a). Action Learning. Retrieved October 30, 2014, from
http://www.educ.utas.edu.au/users/ilwebb/Research/action_learning.htm
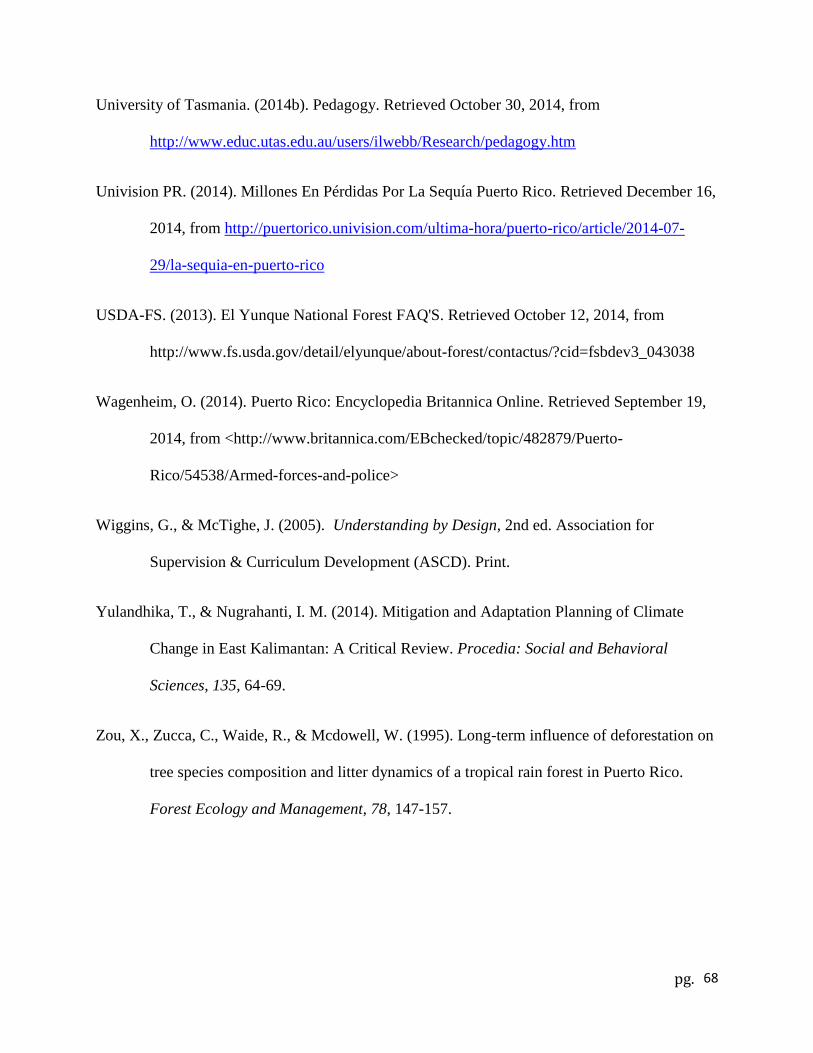
pg.
68
University of Tasmania. (2014b). Pedagogy. Retrieved October 30, 2014, from
http://www.educ.utas.edu.au/users/ilwebb/Research/pedagogy.htm
Univision PR. (2014). Millones En Pérdidas Por La Sequía Puerto Rico. Retrieved December 16,
2014, from http://puertorico.univision.com/ultima-hora/puerto-rico/article/2014-07-
29/la-sequia-en-puerto-rico
USDA-FS. (2013). El Yunque National Forest FAQ'S. Retrieved October 12, 2014, from
http://www.fs.usda.gov/detail/elyunque/about-forest/contactus/?cid=fsbdev3_043038
Wagenheim, O. (2014). Puerto Rico: Encyclopedia Britannica Online. Retrieved September 19,
2014, from <http://www.britannica.com/EBchecked/topic/482879/Puerto-
Rico/54538/Armed-forces-and-police>
Wiggins, G., & McTighe, J. (2005). Understanding by Design, 2nd ed. Association for
Supervision & Curriculum Development (ASCD). Print.
Yulandhika, T., & Nugrahanti, I. M. (2014). Mitigation and Adaptation Planning of Climate
Change in East Kalimantan: A Critical Review. Procedia: Social and Behavioral
Sciences, 135, 64-69.
Zou, X., Zucca, C., Waide, R., & Mcdowell, W. (1995). Long-term influence of deforestation on
tree species composition and litter dynamics of a tropical rain forest in Puerto Rico.
Forest Ecology and Management, 78, 147-157.

pg.
69
Appendix A: Interview and Questionnaire Questions
Interview Questions
Qualitative Data
To whom it will apply: experts on climate change, educators
Climate change experts
1. What is your area of expertise?
2. What organization(s) are you a part of or involved in?
a. What environmental education initiatives have you been a part of? (If Applicable)
3. Where on the island have you focused your studies? (If Applicable)
4. What studies have been done in the Caribbean on climate change? In Puerto Rico? If so,
can you explain the findings?
a. Is there any available literature about these findings that we can have a copy of?
(If Applicable)
5. What are the main issues and impacts of climate change that you have observed in Puerto
Rico?
6. What are ways to adapt to these changes (that are feasible)?
7. What forms of adaptation have you seen? (Ex: water harvesting)
a. What kinds of problems arose from these, if any?
8. What are the main socioeconomic consequences of climate change? (Ex: industries,
culture, etc.)
9. What about climate change is the public unaware of?
a. Which of these topics do you feel is most important to know?
b. Why is not being informed about these topics especially concerning?
10. In order to develop a lesson that covered a good majority of climate change concepts,
what topics of climate change do you feel are important to incorporate into the lesson?
pg.
70
Educators
1. What subject do you teach?
2. What subjects are available at the school where you work?
3. How long have you been teaching?
4. What age/grade level do you teach?
5. What language do you normally teach in?
6. Could you describe what a typical day in your classroom is like?
7. What educational tools and styles do you use to teach a topic?
a. (Classroom activities, problem based learning, readings, visuals, homework,
outdoor activities, etc)
b. **When teaching a science course, what educational tools/styles do you find most
effective?** (To be used in special situations, like teachers who teach multiple
topics)
8. Is climate change taught in any way in the school where you work? If so, to what
capacity?
a. Have you ever taught climate change before?
b. What were the results of teaching climate change? What about it was
successful/unsuccessful? (If Applicable)
9. To what extent have you taught environmental science in a formal classroom setting?
a. To what extent have you taught environmental science in a club, student group, or
informal setting?
10. What problems do you typically face when teaching a new topic?
11. How do you develop your curriculum and lesson plans?
12. Do you ever have any challenges with planning and executing class activities, field trips,
etc.?
a. If so, could you please describe the challenges you encounter?
13. Are you open to using field trips to supplement a classroom topic?
a. What types of field trips have your school done with classes in the past?
b. What defines a field trip at the school you work in?
i. Outside the classroom on school grounds? Off school property? etc.
14. Are you open to doing a large-scale school project? Ex: School-wide project, activity, etc.
a. What kinds of projects do you think are feasible?
b. Have you ever done a large-scale school project? Ex: Grade-wide artwork? (If
Applicable)
c. Do you think there are any benefits/disadvantages to doing a project like this?
15. How do you deal with teaching controversial subject material? (If Applicable)

pg.
71
Español
1. ¿Cuál tema usted enseña?
2. ¿Cuáles temas se ofrecen en la escuela donde usted trabaja?
3. ¿Por cuánto tiempo ha estado enseñando?
4. ¿Cuál edad/grado de estudiantes enseña?
5. ¿En cuál idioma enseña?
6. ¿Usted puede describir un día típico en su clase?
7. ¿Cuáles herramientas y estilos de educación usted use para enseñar una tema?
a. Por ejemplo, actividades de clase, tareas, actividades fuera de la clase, lecturas,
visuales, etc.
b. **¿Cuándo usted enseña una clase de ciencias, cuales herramientas/estilos de
educación son los más eficaces?**
8. ¿Se enseñan cambio climático en su escuela? ¿Cómo?
a. ¿Ha ensañado cambio climático?
b. ¿Qué fue la resulta de enseñar cambio climático? ¿Tuvo éxito? ¿Cómo?
9. ¿Hasta qué punto la ciencia del medio ambiente han enseñado en un ambiente formal en
el aula?
a. ¿Hasta qué punto la ciencia del medio ambiente han enseñado en un club, grupo
estudiantil, etc.?
10. ¿Cuáles problemas usted encuentra cuando se enseña una tema nueva?
11. ¿Cómo desarrolla sus currículos y planes de lección?
12. ¿A veces tiene desafíos con la planificación y ejecución de las actividades de clases,
viajes de estudio, etc.?
a. Si es así, ¿podría describir los desafíos que usted encuentra?
13. ¿Estás abierto a la utilización de salidas de campo para complementar un tema aula?
a. ¿Qué tipos de salidas de campo han hecho su escuela con clases en el pasado?
b. ¿Qué es lo que define a un viaje de estudios en la escuela donde se trabaja?
i. Por ejemplo, ¿es definido como salir del edificio, salir del campus de la
escuela, etc.?
14. ¿Está dispuesto a hacer un proyecto de la escuela a gran escala? Como una actividad, un
mural, un jardín, etc.
a. ¿Cuales tipos de proyectos usted piensa son practícales?
b. ¿Ha hecho un proyecto a gran escala en el pasado?
c. ¿Usted piensa que hay beneficios/desventajas de hacer un proyecto como eso?
15. ¿Cómo lidiar con la enseñanza de material de tema controvertido?

pg.
72
Appendix B: Interview Transcripts
Climate Change and Climate Change Education Expert Interviews:
The following interviewees were selected for us by our sponsor and were deemed to have significant
knowledge and expertise in climate change topics and/or environmental education initiatives.
Interview 1: Filipe Cano
Wildlife and fishery manager, United States Forest Service – El Yunque National Forest
Date & Time: November 5, 2014; 11 a.m.
Emma (E):…And you don’t mind us recording you, right?
Filipe Cano (C): No, I don’t.
E: Okay.
Princesa (P): So, the first question we really wanted to ask was what your area of expertise was?
FC: Okay. My area of expertise is in the management of wildlife and fishery species here in El Yunque,
so I manage the program. That’s basically a lot of monitoring any management activities that we do with
our species. I’m usually the one in charge and leading that effort.
P: So if there’s a species you want to preserve is that something you would -
FC: Yeah. I’d probably be leading that with the resources we had: providing objectives, standards,
guidelines to technicians and probably to other cooperators and federal agencies or other state agencies to
work together and to work on that particular species concern.
P: Well, we were also wondering if you were involved in any organizations? In particular, any
environmental organizations or environmental initiatives?
FC: You mean societies? Professional societies?
P: Yes, or really any especially that goes out to the public.
E: So, environmental education initiatives.
Michael (M): Any types of grassroots types of organizations? Those kinds of things.
FC: Oh! I started, like three years ago, an agroforestry initiative. This is sort of outside of the forest so I
don’t have much authority. I work with partners, private landowners, so that they can, because there’s a
lot of agriculture to the east and to the south of us, and I wanted to have wildlife habitat be a priority for
them. So, I work with NRCS (that’s the Natural Resource Conservation Service), and then the farms
service agency, and the Puerto Rico Agricultural extension agent to work with many of our landowner
neighbors to try to have more emphasis on more ecofriendly use of their land. The products – the
agricultural products - that they produce, either livestock or vegetation or fruits to be a little bit more,
again, ecofriendly so that it provides healthy habitats for wildlife that they can off forest and back onto
the forest. Okay? Then, like, a year and a half ago I started a children’s education effort. It’s called the

pg.
73
Children’s Forest. This is the forest service initiative and so what we’ve done here is we received funding
to work with four NGOs – Nongovernmental Organizations – surrounding the forest and the theme is
climate change. Then, the second requirement is the use of art so, instead of it being a classroom where
you lecture students, the NGO’s have to come up with an art project and then that way learn what climate
change is to these children and what, if possible, can they do to counteract the effects of that.
P: Why use art?
FC: People are much more interactive with art than they are with listening to a lecture. You know, if you
go to any sort of professional symposium, after a while people just get tired and bored! But, with
something you do with your hands, especially with children, they love doing things with their hands and
seeing something fun come out of it, and so they learn at the same time. So, humans have this tendency to
be much more connected if they have something of an ownership in it, and so the art is that ownership.
P: Do you do any specific kinds of arts? So for an example, do you use recycled materials or do you focus
maybe on drawing and painting? Or, is it kind of scattered?
FC: It’s scattered. It all depends on the NGO partners. We have one NGO group in the urban areas.
They’re coming up with these huge steel structures in the form of bees and then they put flowers in that
structure so that it’s a living structure, knowing that bees are affected by climate change. So, that’s one
NGO. Another NGO is doing the use of video making a small movie, I guess, of how habitat in El
Yunque and off to the east in relation to climate change and students are making a movie out of that. The
third NGO is creating long term photography projects, so they are going to different plots and taking
photos. This is mostly on the forest, and they are using trees – the planting of trees – as that project. Then,
the fourth NGO is making an interactive social map, so kids are actually creating an interactive GIS map
and they are looking into – and this is also in an urban estuary – creating a map that really makes sense to
kids, and social components that relate to kids. So, those are the four projects.
E: That definitely has a lot to do with our project that we are working on. Do you have any pictures from
those that we could take a look at so we could use it as inspiration for our educational module?
FC: Yeah. I do! Each group was supposed to have a proposal and they have all turned it in. Some of them
have pictures.
E: Okay! Is there any way you could send that to use?
FC: Yeah, I can send to Princesa, I guess? I have your email? Okay, so I’ll send it to her. I’ll need to
write that down!
P: okay! So, regarding your personal work, where do you – I’m guessing you focus your studies here in el
Yunque? Or do you do anywhere else on the island?
FC: I do other places because of the need of the wildlife species, for example the parrot. We work with
Fish and Wildlife service and the Department of Puerto Rican Natural Resources out in places in
Mayaguas, which is out west, and Arecebo. Those are locations where the parrot is really doing really
well so we help out also in other parts of Puerto Rico. I also do a little bit of international projects, mostly
in Africa, Central America, northern South America, and that’s it!

pg.
74
P: What kinds of projects are those? Are those in environmental?
FC: Yeah. I was a planner in the Forest Service so in Africa they needed a planner with background with
natural resources, so I helped them out with that. In Central and South America it was based upon
expertise with wildlife issues.
E: So, on the topic of climate change, what studies that you know of have been done either in the
Caribbean or in Puerto Rico? If you could please expand on that.
FC: Oh, yeah. Lots and Lots! You’re very lucky because this is a central node for climate change studies.
USDA has actually created a hub with all those studies, and they call it the climate change hub and it’s on
the internet, USDA, and you’ll find a lot of the research that our research station – that’s the International
Institute of Tropical Forestry - they’ve done. Then there’s the University of Puerto Rico. They have
elevation stations where they’re measuring change in temperature and rain patterns so that all affects the
water quantity that is collected on the forest and flows off. Also, a lot of nutrient cycling like Nitrogen,
Phosphorus, Sulfur, Calcium, Carbon. Studies that have occurred here, and you will find them in that hub.
P: what are the main impacts and issues of climate change that you may have observed in the area or in El
Yunque? Puerto Rico overall?
FC: The first thing would be, in regards to wildlife, what’s called behavioral adaptation that’s where –.
Imagine yourself where you would live on the coast back in Massachusetts and say the sea level rises
twenty feet. Say you live very close to the water. Obviously you’re going to have to change, so you
change by the sense of, you know, moving more inland and maybe your lifestyle will change because not
only you but a mass amount of people are gonna have to move inland so there’s going to be change in
people competing for resources, so things might get not as safe and it’s the same thing with wildlife. So if
you have a species that have occurred in one habitat, let’s say through climate change, whether it’s
through change in rain patterns or change in temperature, it reduces the quality of the habitat. Well, that
species now either has to go to other locations and compete with what’s already there. So, that’s sort of
like, what are the interactions of the wildlife species? Are there going to be new diseases that’ll come out
based from these interactions? What is the type of potential for sustained population viability for these
species? So those are basically it, those three things.
P: Have you observed any other effects of climate change?
FC: Yes, I’d say one in particular species is the elfin-woods warbler. This is a bird that was discovered
here in the 1970’s. A black and white little bird. It was called elfin-woods warbler because the Elfin
Woods are up in a high elevation. Now, we are starting to see them in lower elevations. We don’t know
why. We don’t know if this is because of climate change or perhaps another factor we just haven’t figured
out. So that’s a type of behavioral adaptation. They moved from these high elevations to low elevations,
so that’s one particular species.
P: If I’m remembering correctly, in previous conversations with you, you might’ve mentioned something
about rain pattern – weather pattern – changes? Could you maybe elaborate on that?
FC: Yeah. I would probably say in the past you would be able to see a type of trend that occurs with the
water gauges that IITF researchers have out there. Much of the pattern that you would look, prior to the

pg.
75
1990’s, the rain pattern would look more of a sloping downward, but once the 90’s occurred then it sort of
did this unique spike and then it drops. Up and down. That’s what researchers are finding now, so one of
the hypothesis is that with changing rain patterns where we could probably see a more steady trend, we’re
going to be seeing the extremes. Think of it like a pendulum, no longer is it going to be weather or
patterns like this moving in a natural oscillation. Now we’re thinking, “Very dry. Very wet. Very dry.
Very wet.”
P: Now, is that within the course of a year, or a couple years? Like, that pattern.
FC: That one was particular – I believe that one was a thirty-year trend of this all of a sudden shifts. Prior
to that it was all the way back to the 1920’s. You know, that it would be a steady trend.
P: So, within a year are you seeing that, say, there’s a five-year block of a lot of rain and another five-
year block with no so much rain? Or, is it more that within one year you’ll have a lot of rain suddenly and
then no rain?
FC: No rain. Yeah.
P: Within one year?
FC: Yeah. That’s what we’re looking at.
P: So, what kind of effects would you think that might have on the forest, maybe in terms of the animals
or even the plants or anything like that?
FC: I guess the best way to explain that would be to think of the mountain itself, and think of it in four
sections. Each section is a vegetation type. So, if you have drier conditions - and that’s what the theory is,
that the Caribbean region will become much drier – those that are on the top are adapted for wet
conditions. So, if we have less rain, hotter temperatures, that upper quarter will basically disappear
because the three below that will shift up. So that’s why the Elfin-woodlands warbler that would occur up
on the very top, they’re moving down into one of these lower quarters of the mountain. So, that’s
basically what you’ll see more of what’s called a habitat shift. And so, with that, you have population
effects. We just finished coming out of what’s called a genetic bottleneck with the Puerto Rican parrot so
we may be seeing, perhaps, another genetic bottleneck with, perhaps, the Elfin-woods warbler. It’s a good
example. Humans sort of experienced that in the past also and with humans it’s all just speculating but
it’s, sort of, more geneticists looking at what sort of seems to be humans did have in a some type of
response to genetic bottlenecking. So, think of it that way, as if you have a small group of humans but
even then conditions were right for you to expand throughout the globe and you have all this diversity.
Now, if we can keep those species safe so that they can make it through their bottleneck and try to make it
so that there’s preferred habitat afterwards, then they’ll explode and take care of themselves.
P: So, with the disappearance of animals in that top quarter you were mentioning, what kind of effect
would that have on the forest as a whole or even the entire island, if you can?
FC: That would affect food webs. That would affect certain nutrient cycling. That would affect, perhaps,
extinctions. It’s all based off of mutualistic relationships, communal relationships among all these
individual members of the ecosystems. So that’s what you would see – something like that. So, who

pg.
76
know?! It’s all speculation, but until it happens and scientists can confirm it, then we have something we
can hang our hat on.
P: What about what it would have as an effect on people?
FC: On people? It’s all speculation, but the biggest thing that people would see be and increase in tropical
diseases. Think about it up in the continental U.S. All of a sudden we’re seeing west-Nile virus – west-
Nile fever – well those are actually sub-tropical diseases and no they’re occurring in temperate zones.
That tells you that temperature has somewhat fluctuated on a very minuscule scale, that those particular
virus can now occur in, say, corn belt USA. You know? That’s not a subtropical, but it’s changed so
much that that’s what you see. That’s why here in Puerto Rico, you probably saw in the airport,
Chikungunya and Dengue.
P: wasn’t Dengue already common here though? Or was it not so?
FC: No, it was not common. That was because of globalization. It was brought in, most likely, from
South America and then it was brought in here. Now, here at the high elevations you won’t see much
Dengue, but in the coastal regions, and that’s just as temperature and conditions changes, that’s when
you’ll start seeing people – even other people up in the mountains getting Dengue and all these interesting
tropical diseases. Even though we’re in the tropics the elevations, especially high elevations, are not
characteristic of a tropical wet zone, just a tropical high zone, so it’s a little bit different. It’s a little bit
cooler and just a few degrees make a difference.
E: Is there any effects you see in industry or culture or anything like that?
FC: In regards to climate change?
E: Yeah.
FC: Maybe societal cohesion. That’s probably the only thing, because if you get change and then say you
have refugees, then you’ll see a lot of refugees due to coastal flooding. That is probably what I’d say is
the biggest stress for social fabric. You know, keeping order, having structure. So it’s a classic nut-to-
soup sort of scenario. That’d be the biggest concern: loss of that structure.
P: As there continues to be changes in the forest and in the weather and everything, especially on an
island, do you know of any ways people can adapt to them and even possibly mitigate these effects?
FC: Yeah. I think in the Children’s Forest, we call it the Children’s Tropical Forest, effort, one of the
things we’ve sort of found out is that focus on pollinators .You know, bees and native pollinators,
butterflies, stuff like that. One of the results that came from the agroforestry is we’re establishing
beehives – controlled beehives – in the forest so that the community can have honey – organic honey –
and we can get extra pollinators throughout the forest. So, one of those things would probably be
improving local habitats for growth of vegetation. The vegetation we’re talking about is vegetables, fruit
trees, stuff like that which also helps out wildlife. So, since I’m only focusing on wildlife – obviously
there are other social components. Obviously there is population control; it’s the big elephant in the room,
but that’s out of my scope. But that would probably be the big thing for the most part: sort of would the
improving your local habitat, wherever you’re at, whether it’s a river or riparian or land. Try to reduce

pg.
77
heat island effects. These are urban areas. If you have to have urban areas, plant trees so that it reduces
the temperature and then probably practice recycling habits. I know we consume a lot and we’re sort of
encouraged to consume a lot and that sort of a –. It’s something that’ll take a generation to really address,
but if you keep recycling and try and keep the young generation asking, “do you really need to consume
that much?” That’s probably a good way to go.
P: What about climate change do you feel the public in general is not very aware of?
FC: I’d probably say the whole thing! Yeah, and we’re in another meeting with developing the forest plan
and we’re finding that out. It’s very complex, very scary, and who really wants to deal with that - a scary,
complex boogieman? So people just try to shy away, so with the Children’s Tropical Forest we tried to
bite-size small steps and working with the youth for the most part.
P: So how have you been able to figure out that most people don’t really know anything about it? Did
you just – I don’t know – I guess, how did you find that out?
FC: Well, two things. The first thing would be the general response of people when you talk about
climate change. It’s really a big thing to wrap your mind around. Then, the second thing is just sort of
getting – gauging the public’s response to many of these, you know, news articles or newspaper items that
come out. People maybe sit there and shake their heads; it’s just too big for me to do anything about it.
You know, that kind of deal. So, that’s how I sort of know that. Nothing official. No scientific study or
anything to back me up on that, but that’s how it is.
E: So our project is going to be working with a ninth grade 4-H club, and we’re creating a lesson plan for
them about climate change. Are there any particular topics that you think are important for youth to know
concerning climate change and any activities, since I know that you worked a lot with teaching youth
about climate change, that are particularly effective?
FC: Well, I’d probably have to say… topics?
E: Yeah, the topics.
FC: Well climate change is its own sort of topic.
P: More of the subtopics. The specifics. Greenhouse gases, water levels –
FC: For a curriculum?
P: Yeah, especially for the first few lessons as we really try and introduce it.
FC: Okay. I see what you’re saying.
E: We have one lesson [to test] so we want to make sure we have everything that’s really important in
there –
P: - and for our supplemental lessons afterward.
FC: That’s always been my weak point. I’m not much of an instructor like a teacher who develops a
curriculum, and you’ll talk to [Edgardo] next. He’s on the Children’s Tropical Forest and he helps me out

pg.
78
with those particular items because, especially when it comes to Department of Education, there’s
curriculum requirements that’s necessary and for the Children’s Tropical Forest we’re making a
smartphone app. An application for android or iPhone and the public or the very kids themselves can
access this curriculum and actually glean information from it. For public teachers, if they come here we
no longer have resources to act as a host to public schools, so they can use that app as a virtual host once
they come here and learn about climate change. But, that’s a question that’s really hard for me to answer.
I don’t know teaching theories or teaching tools.
P: It doesn’t have to be a tool so much as if you just had to –. If you knew that you only had -. Because
we only have one lesson that we present to them and then we hope to develop a couple lessons afterwards
just to kind of present to the USFS as well as our personal advisors from our school, we wanted to know
what kind of main topics would be really essential to getting a kick-start for developing a curriculum. So,
in the first lesson what would be something that would help get information out about some general
things that really tie to El Yunque and to Puerto Rico? Did that make sense?
FC: Yeah. You’re thinking of a lesson plan and so you’re coming up with -. In your lesson plan is broken
down by component activities and so your first component activity would probably be, I’m assuming,
“what is climate change?” I’d probably start from there. You know, what is climate? You know, what is
weather? I would use a lot of analogies. A very good one that I saw on television was the analogy of the
man walking with a dog on a beach. You see a man who walks in a parallel to the ocean and he has his
dog, and his dog is going left to right, left to right. What was a very good analogy was weather is that dog
that goes left and right; he doesn’t stay in one particular pattern parallel to the ocean like the guy walking
on the beach. We’ll that guy walking on the beach is climate because climate doesn’t change as quick as
weather, so something fun that kids can designate, because they’ll go outside and say, “Oh! It’s a sunny
day! What do you mean: ‘climate change is occurring?’” While another kid will come up and say, “Oh,
my God! It’s raining cats and dogs! This must be climate change!” And so you have to designate those
first with definitions. What is weather? What is climate? That’s where that particular component, I would
start off with. Anything else?
E: Since we only have an hour to do this lesson, how in depth would you suggest going into greenhouse
gases? I know that’s a major component to causing climate change, so how in depth do you suggest going
into that with youth?
FC: With youth you don’t want to go too deep because you’ll lose them really quick. Try to make it into
something that challenges their mind. Probably when you were in ninth grade, if you started immediately
quoting data or studies then you’ve already lost them form the get go. You want something that’s
contemporary. Something that relates to them, like what’s the technological mode or fashion nowadays.
Try to have a very superficial introduction of greenhouse gases to kids like ‘where does greenhouse gases
come from?’ You know, that kind of deal. Can somebody show me? They probably wouldn’t be able to
tell you since they probably would say, “I don’t even know what it is. What am I doing here?” Those kind
of things. That’s where you educate them. You know, carbon monoxide. What else? You’ve got natural
sources like volcanoes then you’ve got manmade like cars, automobiles, smokestacks, those kind of stuff.
That’s where I’d keep it very, probably, piques their interest. They’ll be like, “Didn’t think about that.”
That kind of stuff.

pg.
79
P: If you were to pick a topic that you found to be the most, out of all those subtopics of climate change,
if you were to pick one or two that were the most pressing to El Yunque, what would they be?
FC: I’d say that’s easy. I’d say basically the danger that wildlife would be in from climate change. Not
only to our birds, but also to our coquís. Those are our tree frogs. People know one of the icons of Puerto
Rico is the Puerto Rican parrot and then for El Yunque also there’s the parrot and also coquís, the little
tree frogs and here on the forest we have eleven species of coquís. One of the things that I think kids
would definitely look interested in is, you know, a coquí in their hands since we did something like that
with river shrimps and kids are just taking pictures. They wanted to hold them. Once you have something
in your hands then you see the click. You see the connection and they’re like, they understand now
because, I guess, us humans, unless we have something in our hands we don’t understand it. Then it
becomes no longer an abstract. Take them out of that abstract realm and into hard, ‘This is it, this is what
it is’. That’d probably be the trick.
P: And the things that affect those wildlife would be climate change - changing temperatures, changing
weather patterns - all that is tied?
FC: Yeah. How it affects habitat quality. Focus it on – Yeah it’s pretty cool, I think. Is there anything,
like, initiatives like that happening up in Massachusetts? You’re all from Massachusetts?
E & P: Yeah.
M: I’m from New York.
FC: New York, huh? So, the New England Area.
E: Yeah, there’s this park called the Audobon Park where they have camps and stuff where they do stuff
like that and they talk about wildlife and changing habitats and things like that.
P: I think Boy and Girl Scouts do something like that.
E: Yes. Definitely camps do it.
M: State parks do.
FC: Yes, some state parks here do that too. That’s a good format to follow. In the states – I used to live in
Arizona – they had a really good one too where it’s communicating to different groups of the public and
they’ve really done a good job. I think the States seem to be at least trying to do – certain states – try to
include that so a lot of education.
P: I think it depends on the state. Like California and Washington. I think those kinds of states really
would try and push for that. I don’t particularly notice anything in Massachusetts not being someone
who’s a Girl Scout or a Boy Scout.
E: I remember having Earth Science in the sixth grade and they did a lot about climate change. It really
depends on what school district you go to.
P: For me, earth science was geology.

pg.
80
E: For mine, they had two years of earth science, so one was more geology based and the other one was
more climate change and that sort of stuff.
P: I did have a geography class.
FC: In Massachusetts?
P: Yeah, My school was a charter school, but we did have a bit of global warming type of education in
my class, but the teacher really made it more doom and gloom, we’re all going to die…
FC: You probably don’t want to do that!
E: We watched The Inconvenient Truth.
FC: It does wake you up. Don’t get me wrong. But, sometimes you can overkill on the doom and gloom.
You guys have got to be optimistic and then try to stress that we’ve still got a chance to do something.
P: Definitely with the research we’ve done I’ve personally noticed that there is hope.
M: Do you think that is a better option: to more so stress the optimistic approach to teaching climate
change than trying to do the scare tactic?
FC: Yeah. I would probably do that. I would just let the science do it since science is not positive or
negative, it’s just – it is science. You know? This is what it is. It’s up to humans to think of it as good
news or bad news, but once you have the science there – you can just go to the climate change hub -
you’ll be able to glean off a whole bunch of publications and then, I imagine, also in the Forest Service
we also have, I think it’s called Nature Watch. Nature Watch has some examples of types of curriculums
that can use that type of data into. So what I need to do is send you an email with all of the proposals from
the NGOs.
M: Lastly, you don’t mind having your name in our report for transcriptions purposes?
FC: Yes, no problem. Once you’re federal you don’t have any say since it’s all public funding, so go
ahead.
M: I think that we are all set.
E: Thank you very much.

pg.
81
Interview 2: Edgardo Gonzalez
Research Associate at Centro para la Conservación del Paisaje
Date & Time: November 5, 2014; 1 p.m.
Emma (E): Do you mind if we have a transcript of this interview in our paper that we’re doing?
Edgardo Gonzalez (EG): No problem
E: ‘kay…let me just pull up the questions real quick
Princesa (P): So our first question to ask was what your area of expertise was?
EG: The main area of expertise is forestry, and then I also have a background in biology and natural
resource management
P: Okay. Um, so do you participate in any organizations, like environmental organizations or
environmental education initiatives?
EG: Well I used to work in the government, in the Department of Natural Resources. And in there my
main work was with the unity in charge of the state forest. So in there there were a lot of different
initiatives involving education at different levels, you know? So that I was related with. Right now I’m
working with, uh, as a private consultant, and I have a project with the Centro Para Conservacion del
Paisaje – that’s the organization that right now its working also with El Yunque in the management plan.
So there, just right now, I’m working with a project that have a – basically an education focus and its just
to start the development of uh, there is a program in the forest service that is called Children’s Forest, so
we will directing that to what we’re gonna call Children’s Tropical Forest. And uh, the idea will be to
develop educational alternatives with different groups that are associated with tropical forests, not
necessarily inside El Yunque. And I’m working that with Felipe [Cano] right now. With that initiative
we’re working with, uh, four different groups that are developing initiatives – educational initiatives.
When I took – basically right now with uh, an art experience with the students, and also direct it to the
main theme of climate change.
E: So where have you focused your studies on the island? Like in El Yunque or all over –
EG: All over. Basically, yeah, when I was working in the Department of Natural Resources, they’re all
over, you know, from the east to the north to the south to the different islands in one island so I have been
general with all the different systems around the island.
E: Now, do you know of any or have you maybe worked on any studies involving climate change in the
Caribbean or in Puerto Rico?
EG: Well, uh, I participate through the Department of Natural Resources to – with the climate change
initiative that was in contact with the Coastal Zone management program, and in there with the
development of the documents that has been already produced as part of those initiatives and I’m part of
the committee in there basically working with the Area of Natural Resources and Biology. They develop
different alternative in there – I don’t know if you are gonna talk with Ernesto Diaz, but Ernesto Diaz is
the director of Coastal Zone Management Program. And, uh, he’s basically leading that initiative in the
pg.
82
agency right now. So that has been my main contact with the theme, other than secondary activities that
are more related probably with a particular project or an educational alternative.
E: What, have you noticed, would be the main issues and impacts of climate change?
EG: In Puerto Rico?
E: In Puerto Rico, yeah.
EG: The main issues I think is basically, right now I think probably it’s because how the thing has been
developed, is in the coastal areas and the changes in the dynamics of some of the coastal zones in Puerto
Rico. And connected to that is probably the issue that the infrastructure of the island that is associated
with some of those areas. For example, the main power supply of the company that provides electricity in
Puerto Rico is located in coastal areas. So from there the changes in the dynamics of the coastal areas and
the loss of coastal resources of coastal areas – or beach areas – I think is the main problem right now.
Because of my background I am also probably say that there are other issues that people might not be
connecting with that. For example, with some agricultural products there has been some of the pests that
have been affecting some of the areas, there has been some changes in the pattern of rain that we’re
receiving in the area, and those things are affecting some agricultural products. Probably people are not
connecting them with this issue. But, and probably we need further study to establish that there is a
specific connection, but at least you start to see some of those things that are…at last in my experience or
my feeling are connected with climate change. But I think the main thing will be the coastal changes that
we have right now, the impact of those changes in the coastal areas, and the loss of some coastal zones
because of the changes in patterns that we’re having in Puerto Rico.
E: Now, when we talked to Felipe Cano earlier today he talked a lot about precipitation changes due to
climate change. Can you expand on that, or have you noticed anything concerning that?
EG: Well, it’s an issue that is in discussion right now, so I think that there’re more people that are
interested to know or to understand it a little bit better. It’s a thing that is not that easy to understand.
Probably in some of the educational activities that I have been involved, it has been interesting how the
students or the participants understand what they understand as climate change. And then we start to
present some other examples and people start to connect a little bit better, and then they’re more able to
present examples. So I think that in terms of perception, uh, yes at that level. In terms of perception in
other levels like agencies, I think that it’s not that dramatic, you know? I think that after some of the
words that Ernesto developed as part of that initiative of climate change through the Department of
Natural Resources and the Coastal Zone Management Program, because there were some products that
people can read, and there was also an initiative to send those documents to the different agencies. Now
we start to see a little bit more responses from agencies. But in general I would say yes there has been a
change in that perspective and trying to understand a little bit more.
E: What are ways to adapt to these changes in climate, that you know of?
EG: Well, adaptation. I think that the main thing, that, uh, at least my experience with the climate change
initiative in there, is to maintain a certain aspect of monitoring these changes, and then to start to develop
an initiative in that area of adaptation. For example, in terms of construction there might some need to
review some of the alternatives of some of the uses of the coastal areas. That might take some time, it

pg.
83
might take a little more energy from other agencies, like the planning board for example. And redefining
some of these zones in a different way. I think the main thing will be adaptation in terms of construction
in those areas. In terms of other activities like agricultural activities, I think it will be more to continue a
monitoring strategy, and to see the responses of the main crops that have been used here in Puerto Rico.
So some of these changes, you know, changes in the pattern of rain distribution, changes in pest
management in some of the species, and start to develop new practices. I see a response in there. I think
probably the adaptation process will probably have to go by phases and by demonstration projects, you
know? See how this work in this specific area, and then try to use that as an educational alternative so –
and they need to apply them, you know? So I think the main thing will be construction in the coastal area,
reevaluation of the available infrastructure of those areas to start to identify some changes, and probably
monitoring areas in terms of crops and agricultural activities, to evaluate demonstration projects that
might be needed to protect some of these crops.
P: Um, by coastal sounds, what do you –
EG: Zones. The coastal zone areas.
P: Zones! Okay, I’m sorry!
EG: Yeah, coastal zones.
P: Okay
EG: And, uh, there is a technical definition from the Coastal Zone management program that established
a certain distance. In there, according – my background is more in science so I use the “coastal plane”, so
you know, anything in there, I don’t go as much as in distance. For me, coastal resources might include
even, you know, the wet lands, and different areas that get more inside the areas, probably that are outside
the consideration of the Coastal Zone Management Program. So when I refer to coastal zones in there will
be what is more in those areas in the coastal parts of Puerto Rico, but not limiting only to the have coast
with the ocean or the sea level.
E: So going back to ways to adapt to climate change, has there been any adaptation to climate change
already? Like any programs and such, that you’ve seen?
EG: Not that I can talk about it. My only connection will be that initiative of the documents produced by
the Coastal Zone Management Program that were sent to the different agencies in Puerto Rico, and there
was a request that the agencies must evaluate the documents in terms of their infrastructure and present
alternatives of adaptations. I cannot tell you that there has been that product, but I think – I know – that
that initiative was done at the beginning of last year. And, uh, I think probably by mid or late last year the
document was sent to the different agencies. And as far as I know there were certain workshops with the
agency for the discussion of the documents because, again, it was, uh, there was some gaps in the
information and some of the agencies were not that clear on how to use those documents. So in there my
recommendation will be to talk with Ernesto. And I don’t know if he’s in your list of interviews.
P: I think he’s not actually…
E: No he’s not, what’s his name again Ernesto –

pg.
84
EG: Ernesto Diaz
E: Okay
Michael (M): Yeah, I have it in here
P: Oh, you do?
M: Yup!
EG: If you’re gonna be visiting the symposium, he’s probably gonna be there.
P: The one tomorrow?
E: Yeah…
EG: Yeah. So I can, uh, arrange that you can meet with Ernesto. So, Ernesto and in that initiative that’s
the only one that I think will be more related to that. There have been some remediative things more than
adaptation things. Probably in some coastal areas because of erosion problems, but I don’t see that as
adaptation process, you know, right now, it’s more of – it’s for protection of infrastructure in some of the
areas. So those will be the ones that I can recall. But I can arrange it. If I saw Ernesto and I saw you both
days in the symposium one of the days I can point out that to him so that you can make an interview with
him, because I think it will be important.
P: For, uh, you mentioned something about erosion. Would you say that maybe – not would you say –
um…do you think that climate change as it effects the coastal regions, would that have an impact on
erosion?
EG: Yeah
P: Would it make it more pronounced? I know that the weather patterns are changing and that I guess
overall the island is becoming drier –
EG: It will depend. When I talk there on erosion I’m talking about coastal erosion basically. The pattern
of rain in other areas, um, I have to see. There might be some changes in some of the areas in terms of
patterns of rain and erosion inside the island, but what I’m referring to right now is more coastal erosion
problems. An initiative that has been done to protect some coastal resources, basically infrastructure,
houses, roads, in some of these areas. So I don’t see it more as adaptation its more as a, uh, you know, as
they don’t got any more options than to try to do something to try to protect those –
M: Like more of an immediate solution as opposed to a long-term one?
EG: Yeah
E: So what are some of the main consequences of climate change that affect people? Like culture or
anything like that? Or industries, I guess? That you find –
EG: Well, here, again, the issue of infrastructure I think will be critical, you know? There are a lot of
infrastructure that is associated in areas – in coastal areas in Puerto Rico. And, uh, just to give you an

pg.
85
example of the electrical companies, you know, are there in coastal areas and basically that will affect
everybody. I think in most of the areas, even the airport is an area that is very close to coastal areas and
that’s, um, one of the main influences, uh, here in Puerto Rico in terms of companies like tourism. So
those are the big ones that I think it would be affecting. If we get down to the residents or people, uh,
probably the fishermen in coastal areas and towns like that are dependent to the activities, I would say,
with coastal resources that, uh, again we’re talking about like Fajardo in the east, that, uh, a lot of people
visit them because of the coastal resources they have in there and because it’s an area that has a
connection to the islands of Vieques and Culebra that are to the east, and there’s a lot of tourism activities
in those areas. Uh, there there would be probably an impact of the type of activities and people that live in
those areas. Other areas like Guanica that’s in the southern part of the island that is part of the – part of
Puerto Rico – and Cabo Rojo in the southwestern part of the island again there might be some
communities in there that have some tradition in terms of, uh, weekend residents, for example, for people
and as an area for tourism that might be impacted with some of these changes. And again, uh, people that
just provide recreational activities, you know, fishermen that takes you in their boat to some of the
different islands that are outside here in those areas in Cabo Rojo like Cayo Ratones, those are
recreational areas in there that might be affected, that might need to be some changes in there and that
will affect some of the probably secondary economic resources in some of these areas.
P: You mention Cabo Rojo as well as areas – what was the other one?
EG: Guanica
P: How do you spell that?
EG: Guanica. G-U-A-N-I-C-A, and it’s in the southern part, just a little bit after Ponce.
P: Oh, okay.
E: So what about climate change is the public in Puerto Rico unaware of?
EG: Could you provide me a scale there? Very? Almost? None?
P: On a scale of Complete Ignorance to, uh, Expert-Forest-Service-Been-Teaching-and-Learning-This-
For-Hundreds-of-Years –
EG: And I go from zero to ten in there I…below five – probably a three. People have hearing about it,
people have, uh, some – might have some general concept about it – uh, not really a big concern I would
say in [the] general public. It’s more like, uh, you see it in the movies or in some of the documentaries
that you might see but they don’t see it in their backyard. There might be in some of the coastal areas
people that have a little bit more concern that have seen some of these changes, but again, you know, less
than five if you go on a scale zero to ten in there.
P: Why would you say that that is? What makes that sort of not known? Is it just people don’t know, or
don’t pay attention –
EG: Well, education. There has been a little bit of disconnection, you know, “it will not happen to us”.
Uh, and basically because they don’t have received enough education or educational alternative of the
problem, you know I think. So, they also see it as on a scale of time, they don’t see it as an immediate
pg.
86
impact to their daily life activities. So they might not be that concerned about it. You know those I think
would be the main areas, you know, in relation because of this connection because of information or
education, and because of the scale of time that they see it, and probably there might be a little bit of, you
know, responsibilities in the way that some of the educational programs present that, you know? That
they put it further in the scale of time, and I think those will be the main reasons, you know? It’s not an
issue that it’s over the table, in some of the discussions. I think the initiative of the Coastal Zone
Management Program is starting to bring it to the table of discussion and integrating agencies and
municipalities, and those kinds of things will probably start to grow up more in the concerns of the
people.
E: So our project is to create a lesson about climate change for a ninth grade classroom in Río Grande. So
what do you think are the main topics about climate change that should be emphasized?
EG: Well, understand it – understand it probably from the basic, you know? And, uh, as simple as
possible, and how it will affect a student at that level. I think from there, how it will affect the family of
that student. And from there how it will affect the community where the family of the student is living.
And there, growing in scales, you know? Different areas, and there will be some of the problems in terms
of the island of Puerto Rico. But I think it will probably be important to try to show them and understand
it at their personal level. And I think also in terms of education, I think it would be important to show
some of the alternatives that people might have, you know? And in some educational activities that I have
been doing, for example I try to show them how the trees work in relation of capturing CO2 and how it’s
important, how they are working all the day, basically doing that type of work and we are not seeing
work, and we’re doing a very simple experiment, where as part of the talk that I – that we produce – or
the activity – we select a tree that is in the zone and we put a plastic bag, basically, over one of the
branches getting most of the leaves in there, and we just close it in there. And we go back to the talk and
we say “this is to see how the tree is gonna be working as we are doing the activity there”. And there we
just present the function of the trees and all the cycles that are associated and how the trees are producing,
like, water by transpiration and how that is part of the system of how they fix carbon and other things. So
we go back out there and the plastic bag is full of water, basically from transpiration and there they see,
you know, how the tree has been working. And then I say “well, look at all the trees we have in here”. So
that might be an alternative that you can do and bring up the importance of the vegetation in this problem.
And then I try to explain how in general some other initiatives have been working – depends on the level
of the students more than that. But for example I get to the point of the Carbon Credits if we’re talking
with university students, and how that has been an economic alternative in other areas, you know? But I
think it will be important, in terms of education, to let them know how that might affect them personally,
their family, where they live, and then the island. I think that will be my recommendation.
E: So I’m all set. Do you guys have any other questions?
P: I don’t believe so.
E: Thank you very much for meeting with us.

pg.
87
Interview 3: Caroline Krupp
Public Affairs Officer, United States Forest Service – El Yunque
Date & Time: November 5, 2014; 3 p.m.
Emma (E): Do you mind if we record you?
Caroline Krupp (CK): Sure. No, that is no problem. Go ahead.
E: Thank you
Princesa (P): So the first question we wanted to ask, was about what your area of expertise was? Kind of
like what you do, what you focus on.
CK: Ah, okay. I sort of do everything. I’ve been here a long time. I’ve been working here at the Forest
Service in Puerto Rico for probably even close to twenty years. So I’ve done many different things.
That’s the thing. My background was in, actually my area of education and I guess interest where it
started all along was in Natural Resource Management, Recreation Management and Conservation
Education. So and I’ve tended to always work, at least started in what they had Public Affairs and
Communications. Here in Puerto Rico I worked in that capacity as well as with the Institute of Tropical
Forestry years ago. I worked with the visitor’s center, El Portal, where I worked with the managing the
center and working with recreation and interpretive and education programs and I worked for about ten
years with the permitting program here which is a variety of uses from filming, recreation, tour operators,
events, research permits, communications like telecommunications, water, utilities, probably other things
I can’t think of right now and even worked with the lands and the land acquisition programs. Then, just
recently, within the last probably about two years, I went back to communications and then shortly
thereafter they put with the focus on planning initiatives, so the forest plan revision. So I have been sort of
working on a little bit of everything. I go in circles. So, my background is all those things mostly related
to say recreation, communications, outreach, education. That’s where I am.
P: Okay. Going off of the education, have you been a part of, sort of, education -environmental education
- initiatives of any kind?
CK: Yes. I mean, the past I worked with that so probably earlier on I was more hands on with that like,
worked a lot with, this was back when I was actually working in Colorado more, where I did, you know,
teacher training. I worked with Project Learning Tree at the time, which still exists. And so, that’s the
type of work I was doing with education and now, I am getting, I can explain some of the history of the
education here on the forest. I think that’s one thing I can possibly help provide today, sort of, at least
from my perspective, where we’ve been, where we are, and now that’s wide open where we are going. So
I think we had a vision for the forest, and now its changing a little bit because of the planning initiative
and so we are seeing maybe ourselves moving in a different direction, which is being defined. But, as far
as my background working specifically with education I’m not a curriculum developer, probably it’s been
mostly support messages, conservation messages, seeing that we align our programs with our
interpretative things, with the conservation and education messages with hands on delivery, so being in
the schools, working with department of education, leading um classes and doing that type of thing. I
haven’t been doing a lot of that. It’s more in the context of the plans, structure, where we want to go,
vision and strategy.

pg.
88
P: You say that you kind of know the background of what is going on in the forest. Can you kind of
elaborate on that please?
CK: Yeah! What I was doing some of the looking into like where we’ve been and I would say, and again
everything is sort of focused on the planning revision, because I have been working so much with that,
but in a way that is the foundation of where we are and where we’ve been and where we need to go in the
future. So it still needs to support that, but back when we did the planning, before we did the plan back
when in the early nineties, is when the vision or the idea for the El Portal visitor’s center, the rainforest
center, was really getting the energy and the synergy behind it to become the project that it is today.
There was a lot of interest in the whole forest management because of deforestation that was happening
particularly in, no different parts of the world, but I think they had a big summit. I think it was in Brazil.
The timing of all that really helped the forest get the momentum for getting the support to back the
visitor’s center in Puerto Rico. So the themes of the time that were designed for the visitor’s center were
based on the tropical forestry, tropical forest management and the significance of the tropical forest, and
since El Yunque is the tropical forest - the only tropical rainforest in the national forest system we had
that unique role because of the you know having the international institute of tropical forestry here - they
had a lot presence in tropical forest research and management. The project had the architecture, the idea
of it being more, to tell a story of the tropical forest, why they are significant is really the focus of El
Portal. We had a staff of probably eight to ten people at that time who were just there and provided a lot
of hands on activities for students coming to the rainforest. People would come to the rainforest and have
a guide to take them out to the forest and talk about some of it.
P: that was called rent-a-ranger, right?
CK: Yeah. That was for schools that – schools were encouraged to come by reservation where we could
have people available and they would there to take groups out on the forest. It tended to be on one
particular area in the forest, at the palm Colorado recreation area, using that trail and those areas around
there. It was by reservation and they were active with the staff to do that with a lot of the interpretive
themes supporting the educational themes. One of the things I see with the forest service is there is a lot
going on with conservation education, but it’s a big agency. It’s very broad and it’s not necessarily
specific to a particular location and so here, a lot of the work they did at the time was based on either
language translation – things were coming out in English that they had to translate to Spanish – and the
other was the different species and ecosystems that are shown in the woodsy owl and the smoky bear
educational materials wasn’t really resonating with kids here. It’s like when you’ve got deer and species
that you’re not finding in Puerto Rico as –
P: the mascots?
CK: exactly! As the mascots or even in the educational material. It just wasn’t the same, so it was a lot of
effort to try to information and provide it through education and interpretation more specific to Puerto
Rico. The Puerto Rican parrot, species that are found here, their vegetation, so they created this lot of
brochures and information about that. They got the webpage up and running at about that time so there is
a lot of information there that hasn’t been updated as much as it should be, so it’s the foundation of what
has been there since, probably, the 1990s, still supports where it is today. There’s lots of good information
buried in there, but it hasn’t been made – they haven’t taken it to the current generation. It’s the
foundation there but it’s not necessarily in a format that’s as visually exciting or connecting as well.

pg.
89
Basically, the other thing they did specific to education was – there were some funds that became
available – the woman who was leading that program, her name is Blanca Luis – she’s retired, but she’s
still around Puerto Rico and sometime you might want to talk to her – she took the project learning tree
concept and basically developed this, I can get you guys a copy of this too. This was when we were
Bosque Nacional del Caribe, so 1990s again when that information is all being generated and in turn
conservation Ed was really integrated. So, this is the baul de actividades para bosques tropicales. She
basically took the idea and concepts of how Project Learning tree was set up – interdisciplinary – and then
taking activities that were in lesson plans and, this had accompanied with it materials that supported the
work.
Michael (M): Is that only in Spanish?
CK: I think it is. I don’t know if we ever had an English version of this, I think we only have it in
Spanish. That was basically the audience that we were trying to out reach to at the time. She had
workshops and was working with the Department of Education in Puerto Rico, so there was a team of
people helping to develop these. An interdisciplinary team that worked together to develop these lesson
plans and educational indicators and academics and scientists and managers came up with this, and then
they were able to put on workshops. Teachers, through the department of education sponsored two-day
workshop, they put it here in the forest and let them stay at the camp and it was two days of getting
immersed in this. Teachers got the materials and the idea was for tem to go back to their schools or sphere
of influence and to help put more training or workshops on.
M: And this was information just specifically on the rainforest and how rainforests work?
CK: Pretty much that and specifics to El Yunque, but it could have other environmental issues related to
water and watersheds that could be applicable to other parts of the island, but it was really specific to
Puerto Rico to El Yunque, to students here.
P: That’s just a pamphlet for teachers to teach the teachers or is it lesson plans?
CK: lesson plans to teach the students.
P: Do you know how effective the workshops were and if they would convey things to the teachers?
CK: that’s a good question. I would have to look into some of the background on that. I know they were
pretty well attended, but they only lasted about two to three years because funding and changes within the
structure of being able to put them on. Probably because the project didn’t last more than a five-year
period, so for me to say how effective they were in terms of numbers of people and the outreach beyond
that, I don’t know if we know. I’m sure Blanca, when she was here, did some monitoring of that, but I
don’t know where that is, but it could be – there are some things talked about in this [pamphlet] because
back in 2009 – well, let me finish on this one. Basically, a lot of people still were talking about the
workshops and knowing that we were doing that. That made the connection that we were doing this at one
time but we’re not doing it anymore. So we’re hearing that as we go out for the communities around here
with the plan, and we’re hearing from people, “you used to put on workshops”, and yes, we did. We sort
of lost the continuity of this. We lost the staffing and we also lost the continuity of the project. But, we
have some good materials that, probably, are dated like some of our stuff, but some are not. I don’t know
if there’s anything in here that talks about climate change. I sort of doubt it since it wasn’t in the

pg.
90
conversation as much back when this was prepared in the late 90s. But, in 2009, they did an interpretive
education and conservation master plan, and this one is in English and I think it’s on our webpage too.
P: Yes. I feel like we have that as a reference.
CK: I can send you the link.
M: Yes, that would be helpful.
CK: The interpretive education and conservation master plan for El Yunque in 2009. This is sort of like
“this is where we’ve been, here’s where we are now. What are the new messages, where do we want to
go? I know that, in looking at this, we won’t have the staffing we had before. Although I think that even
in here sometimes there are things that I’m not sure that we would necessarily implement because of the
same reasons. Climate change became another topic that we wanted to start providing more messages
about and outreach. Another was cultural and historic resource that people could come and get a pretty
background. I have information available about the ecological environment, but not so much about what
the forest means to the culture in a cultural and historic context. It’s there, but there were opportunities to
do more. I think some of the other things that this talked about was that we have El Portal, we are using
El Portal, and when I read this I believe there was 8,000 students at they time that they were saying that
were being served every year by coming to El Yunque, so that gives you an idea of how much. I think
there are records to see how many students over time we’ve been working with. I would say that that was
an average that we work with 8,000 students were coming and taken on ranger tours, and then how many
other people are we outreaching to. That’s something that I don’t know if they were even able to address
with this. That’s something that we need to get to. The next wave of planning has come along and now I
think we’re at a point again that when we go out to the communities and ask, “what’s the vision of the
forest as we plan and look into the future.” people in the communities around the forest, what are they –
what’s important to them? One of the issues that we hear a lot is the role of the forest being more
involved in education. That can be formal education by working with students in schools, to just
education about conservation and conservation ethics with working more with the communities and
working more with partnerships. To me, education is not just schools and children. That’s a big part of it,
but it’s also just working with everyone societally, that there’s a higher level of understanding and
conservation and the importance of resources. Things like ecological services were something that we
weren’t talking about back then, but we’re talking about more now. What’s the value of some of the
resources that we have in the forest and why is it important to conserve them, and what would happen is
we don’t have them?
P: So, as students who are making a curriculum, or starting a curriculum to educate more about climate
change, What would you say is something that we could – that is almost essential to put into that
curriculum so that we can kind of meet those needs for students and for the community overall.
CK: That’s a really good question. The issue with climate change is that it’s a fairly new topic and it’s – I
think there’s a lot of good information out there. It’s pretty technical for the most part, but there’s a lot of
curriculum guides out there that you can use. . I’m sure you’ve been looking into what’s available. For
me, I’m not really clear right now with how that would look – I don’t have a good idea of what exactly a
climate change curriculum for this forest or this area would look like right now. But I know it needs –
some of the things that it would need to talk about is the big picture, what is happening globally related to

pg.
91
climate change, and how is it affecting things everywhere. I think that’s the thing about climate change is
it’s a big issue. Then maybe what are some of the things we’ve seen that have changed and how can we
show it’s changed more locally and even region-wide. I think it’s important to talk about the Caribbean
and the tropics and what would be the effects of climate change happening here that students and the
public would see and notice. Then, if we could bring it to a level where it resonates with what’s going on
in your background that provides a more hands-on approach of looking at and monitoring the change or
doing some sort of activity that helps students be involved in measuring or seeing or observing what these
changes are starting, to look at things differently in connection with what might be happening now and
how it could be connected to climate change.
P: One of the parts of our curriculum is to actually have a sort of class activity or field activity. Could you
maybe go into a little more of a specific example that you think would be effective of either one that
would involve observation or measuring or whatever?
CK: I don’t know. I don’t really have that as well thought out. It isn’t an area that I’ve been – I’m just
starting to get involved in this. Really, we don’t have somebody right now who’s involved in climate
change discussions at kind of a planning level, but I’m not really involved in working with students and
kids and teachers. One of the things I think would be helpful is, and this is just an idea I had, and I don’t
know enough about what you are doing – if the curriculum you are working on is specific to a place, or is
broader.
(Emma briefly explains the goals and objectives of our project)
M: It’s designed to be able to be used by other students, going forward, and obviously under some
revisions, but it is definitely designed that it doesn’t have to be a 4-H group to understand it, and it should
be able to educate any student at the ninth grade level.
CK: Okay. But it would be specific to, say, Puerto Rico?
M: Yeah. This group is just who we’re testing it on.
CK: Testing, good! I think at least one thing is that - again, specific things in the classroom, I don’t
know. I couldn’t give – I just haven’t done enough with that type of teaching or those types of
experiences. Outside, that’s where I am connected more with – the outdoor learning opportunities – and I
think talking with the biologist on some of the things we talk about is the impacts on, we’ve seen impacts
on -. Things we can easily see are we’re having more – the rain events or weather patterns are sort of
changing. We seem to have more intense rains and our temperatures are fluctuating. Some of the times
that are more traditionally wetter times May not be as distinguished as it used to be. It was a little bit more
seasonal and it used to be heavier rains, but now it’s fluctuating. What affect does that have in your
backyard? What are you seeing there’s a road that washed away back in May. Can you directly tie that to
climate change? Maybe. Maybe not, but there might be some things that are more rainy or steep slopes.
Soils could wash away and this effects the water and soil quality. What are some of the things you might
have changed that would’ve – of course, these are ninth graders, so their history of seeing things is a little
bit less than someone like me who’s a little bit older. What’s a good connector here is the water and
watersheds, and that’s the one thing that, as we would go out to students and teachers around the forest.
Not everyone can get out to El Yunque to do a curriculum or a placed activity, but could we be using

pg.
92
more of the watersheds that flow from El Yunque that probably go by most of the communities, or many
of the schools nearby to try and start to make those connections. I think that’s a really important point that
we start showing that El Yunque isn’t just this isolated place, but that it’s connected to you [people who
live around it], the water, and to the ocean, so that there’s these connectivities occurring within some of
the things happening to vegetation. I know there are some things that are changing – where you’re finding
species and the types of species you’re finding and then also some of the effects on wildlife. Those are
things that are being studied, but exactly how – I see that those things have changed, but when you’re that
young maybe you don’t see that, but you want them to realize climate change does exist out there and
how to be more observant of it. Exactly what those activities are, I don’t know. You guys have any good
ideas?
E: We have some. We’re still brainstorming. We’re just trying to come up with what’s going to be more
effective for Puerto Rico and El Yunque. Learning more about the forest is helping us come up with
ideas.
P: especially, as you mentioned, the watersheds. Using the fact that it can be applied to Puerto Rico
overall with all the different watersheds is pretty helpful because it might give us sort of a path to follow.
CK: We did a project a couple of years ago. It was called FOCCUs: Forest, Oceans, Climate Change, and
Us. It was a forest service project and there was an artist. His group, Wylan Foundation, worked with it
and they were part of the with the national level projects where they did them all over the country, and we
were one of the forests that they picked because of our proximity to the ocean. Very few, Washington
state, California, maybe Alaska, I don’t know on the east coast where, Florida may’ve had one, but the tie
was, obviously having the connector. The important one is water. They had an art component too, where
we had the museo del arte contemporanio and the artists from there who were aiding with them and
talking about visually expressing some of the changes or what they’re concerned about. Doing it about
why these resources are important to protect and the impacts that climate change could have in the future,
but then to be drawing and painting – in this case they painted these big murals – and they put them up in
the museum. It was a connector, because what we were able to do with the schools that we sponsored
around the forest was we took them into the forest where they could have waters and learn about what
was going on within the forest, and then they followed to points along the way down to the estuary and to
the ocean so they could follow a river to see how it changed and what was going on to that river as it went
down the stream. I don’t think too many people have those connections, and I think that’s very important.
We have a place where we can do it in a fairly close distance and so that’s why I keep thinking the rivers
and the watersheds, and students getting more exposed to that in their backyards could be a good
connector to tie these two. You can’t always get everyone up here and its even harder, but if there’s
something that they can do that can, kind of, create that link between the mountains and the oceans and
what’s happening in between and how much what they do or what happens in there. Even kids like
saying, “wow, I’ve seen more pollution” or, “I found this area and there was trash there that wasn’t there
before.” I’m seeing a lot more people – you know, things that they can observe is maybe a good decision,
is a part of how we can change these policies to protect the ecosystems.
P: So, within our first introductory lesson about climate change and what it is, and to get them more
aware, would you say that introducing the water cycle and watersheds, how they’re important and how

pg.
93
they can be affected – would you say that should be something that would be effective in that first lesson,
to really drive home the point home?
CK: I think it could help. Yeah. I mean, there might be other ideas too, but that’s just one that I think is a
good connector here. This is a rainforest with lots of water and watersheds, all the plants and animals
depend on and all have a relationship with here. So, it seems like a big part of it. It’s like something that
you see goes down to the ocean and there’s this connection there that we have there that I think is a good
example. I don’t know, for example – I’m working more on planning and strategic planning level than
doing lesson plans for kids, at all. I don’t know if down there, if people are working with interpretation in
our forest. Victor Juevos and Cynthia Winfred have been working with all the climate changes or have
any more specific stuff. I know in the interpretive area that we need to get done some key messages,
whether they come up with specific interpretive or conservation Ed activities. I don’t know. I don’t have a
whole lot of activities-based examples to give or provide to you. I’m anxious to see what you guys come
up with, though.
P: So are we.
CK: And, the other thing is - it’s a topic of discussion. Have you found some links with – EPA has been
doing things on conservation Ed. I know the forest service does with the baul, though not necessarily on
climate change education. I few times I’ve sat in and watched them. The kids, teaching kids, training kids,
kid speakers, kids talking to kids – where it was basically high school students that put on this program,
and they were talking about the effects of climate change to other students. I think that they were talking
to middle schoolers. These kids who were high school age put the whole thing together and they were
talking to students about climate change and why it is important and what the effects are or may be.
M: was that in Puerto Rico?
CK: no. It was somewhere in the states. I think in the national office – Washington office – I think it was
somewhere in the DC area. If I’m not mistaken, somewhere in the North East that they were working on
these seminars. If you need, I can get links to that to you.
P: We’d appreciate that.
CK: Yes, like I said, I’m more at the planning stage than the strategic side of it. I’m not so much of the
implementer. I can talk about that, not the one who goes out there and talks and is going to the schools
and giving the talks. It doesn’t mean I wouldn’t want to in the future, but I just haven’t been where I’ve
been, but we’ve had staffers doing that.
P: So, My reading isn’t always perfect. Is this – I feel like this isn’t – but I want to say activity owl?
CK: Baul would be like the trunk – trunk of activities – because what this came with. This was the
activity guide and then there were all these other things that you could do like these little – use this
package of whatever! They could create these little games or activities that related, so you needed these
materials. Everything came in this little trunk. So when they would come, they could come in and actually
make reservations to use the trunks. Say, if there was a teacher who wanted to do this in their school, they
would come and use the activity guide or some of the activities and then the materials that corresponded
with it. Sort of like the package deal, but it was very physical that you had to come here and pick up this

pg.
94
trunk and take it to your school and so, with technology now. Did you talk to Filipe Cano a little bit?
Definitely better on the biology, better on the what’s going on with climate change. Some things he’s
seen. He’s definitely studied that more than I have, but the idea right now is – he probably talked about
the Children’s Forest component, which the 4-H group is part of that, so I don’t know how that connects
with the other project, but I think that it’s wonderful because hopefully we’ll have a good curriculum
ideas and activities that can then be incorporated into that. The idea is – we’ve been struggling a little bit
with conservation education. What can we deliver that we don’t have? The publics expecting us to do a
lot. That’s how I feel when asked, “what do you do?” I was throwing out thing praying more specific
things are going to help you, but – you know hearing it. What I’m seeing is there’s a lot of people doing
thins out there that may not be specific to climate change, but conservation education. We need to help
find ways to support that because we need to be somehow connected to those efforts and provide support
by working together when we build our capacity to affect kids in the area. So, instead of us trying to
figure out how are we going to take on climate change, how can we help find and build capacity if it’s not
just us trying to do it but others. That’s one part of the conservation effort in education, not the whole
thing. I don’t think – let me finish the whole children’s tropical forestry thing first. Basically, we still
have the visitor center and we use it and still get people going there, but you don’t have the hands-on
people to meet and greet and take groups out there anymore. We’re’ down to one interpreter one day a
week to meet whoever shows up, so it’s not what we were offering ten years ago. Can we use technology?
Can we get teachers and students using their iPhones or whatever to connect more through the exhibits
and to use technology when they’re in the forest here, but make it for when they get out of the forest, you
see? It’s always been that they have to come here, but we’re working on some conservation messages
outside the forest. I don’t know, since I don’t work with the Department of Education, is if there is a
conservation education curriculum? Is there one? What requirements do they have? Really, is anything
going on? That’s where I’m coming into this area with what we can do from that perspective. I don’t
know what’s going on in the bigger picture surrounding Puerto Rico. That’s where Edgardo Gonzalez was
talking with your group, and I know he’s working with DRNA. They’ve been working with this idea of
project learning tree and having the standard curriculum translated into Spanish and sort of using that, so
it would be different from this form, and they have climate change information, specific activities, which
would help to create. Look at Project Learning Tree if you haven’t already and see if they have climate
change specific activities. Because that’s probably what’s being translated into Spanish that the Institute
gets its funding for state and private forestry. Conservation is more important with them to see if they can
get it more integrated into our life. So, for me, I think it would be to get kids – what we were doing before
was great but – another project which was called More Kids in the Woods, where the remaining
interpreter and conservation staff had to go out to about six schools around the forest in a year. They
would go to the class and then the students would go to El Yunque and they would take them on an
interpretive tour of the forest, so they were doing in school and getting out into the forest. We were doing
that up until three years ago and that was good. As much as specific activities, I would have to look into –
I need to do some homework and send some links, but those were some of the contacts that – the other
thing is that there are a lot of little groups. Here people tend to be more grassroots and go for – I know of
several groups that are working within the estuary back in San Juan. CCP, Edgardo’s NGO, they’re
working on Río Espiritu Santo. they’re working with some other student groups. It’s like these, they’re
great efforts, but it just seems overall not clear who’s responsible for conservation Ed and climate change
initiatives.

pg.
95
M: There’s no unifying force.
CK: That’s what I don’t sense. Maybe it’s through DNR, maybe the Department of Education, I don’t
really know enough about the curriculums to say. Yeah. That’s where I am. I wish I could give you more
specific things.
E: That’s fine! That’s why we’re here. I think that is all we had to ask. Thank you for helping us.

pg.
96
Interview 4: Federico Cintron-Moscoso
Applied anthropologist, University of Puerto Rico, Rio Piedras, Department of Sociology and
Anthropology
Date & Time: November 6, 2014; 11:45 a.m.
Emma (E): Do you mind if we record this?
Frederico Cintron-Moscoso (FCM): Yes.
E: Okay. And we’re gonna put the transcript in our paper.
FCM: uh-huh.
Princesa (P): So first we would like to kind of ask what your area of expertise was? Or what you’ve
focused on in your work?
FCM: In general?
P: mm-hm!
FCM: I’m an applied anthropologist. For the last say four years I’ve been working on environmental
education issues. Before that my main area of work is anthropology of education. So I’ve done work in
participatory action research with youth in the US and Puerto Rico. And so, what I’m doing now is trying
to combine that work and participation – student participation –into the management and protection of
natural resources. So right now I’m the principle coordinator for the participation campaign of the
revision of the forest management plan for El Yunque. That’s what I’m doing right now.
P: The forest management plan is…its just to kind of restructure how the resources are distributed or
something with the forest or…?
FCM: That’s kind of like the framework all the programs and activities that the administrators do on a
daily basis. So every 15 years they have to revise the plan.
P: Okay.
FCM: So what they’ve been doing now for the last year and a half is going through that process of
looking at the previous one and then changing it to create a new one. Yeah. But the plan is just a
document and what it does is that if the guidelines, the standards, all the tools for then different entities –
it doesn’t have to be only the forest service but it could be also a group of the community that then
suggests a specific project s and initiatives and they will have to fit the new plan and the guidelines that
are set up there.
P: During our research we found your dissertation or something, it was about Puerto Rico and
encouraging youth I believe to get more involved in environmental initiatives and environmental
education?
E: Articulating social change in Puerto Rico?
FCM: Yes.
pg.
97
P: Could you maybe go into a little bit into detail about that and a little about what the goal was for that
paper and what you were trying to –
FCM: What I was trying to accomplish with the dissertation? Sure. Like I said, my main focus is on
working with youth and doing participatory action research in general. So the dissertation was actually to
look at a youth group that was working – a youth led group because that was one of the things that I
wanted to look at. It was not only – there’s many groups that are formed by organizations or by adults –
but what I wanted to see was a group that they have come together themselves and have an agenda and
they have a plan to work and do activism. So I found this wonderful group here in Puerto Rico and what
they were doing is they design a curriculum – an environmental education curriculum – for elementary
schools – public elementary schools. And they started when they were in 11th grade and it was a great
story and I wanted to document it biographically and then to go for that year to follow them throughout
the process of how they organize as an organization and what are their networks and try to look at it as
from an ecological theory – an ecological perspective – and try to understand the group in a broader
context. So one of the key findings was to see how they relate to other components. For example the
Department of Education which they were intervening on how schools run basically. But also the
environmental movement. And it was interesting to see how – well many things. So how the group was
able to serve as a link between the environmental movement and the public schools in Puerto Rico,
because one of the critics to the public education is that they don’t really teach environmental education.
They’re not taking over that responsibility. So how can that happen, how can we promote that? And the
other critic to the environmental movement is that, you know, you work outside schools, so how can we
start communicating both towards that goal? And I found that this one particular group was doing that.
And that the fact that they were young was one of the main factors for them to be able to access the
school. So the other problem is that public schools are very restrictive in terms of who can go there and
give workshops and do all these kind of things without a permit and things like that. Well this group was
doing it with no problem they just go, they just talk to the principles and the principles were like “ah yeah
sounds good, when do you start?” And I was like “woah so how does that happen?” And it was mainly
because they were youth, and they were seen as nonthreatening to a school system. And because of that
they were like “yeah take this group of kids” and they would go in school gardens and they’re still
around. So my thesis was trying to document that process and trying to understand better the whole
relationship. And then on the other side most of the youth that created it came from the environmental
movement directly. So they for example were trained by the Sierra club on activism lobbying and that
kind of stuff, and that’s how they decided to come back with this idea. So that was part of it. The other
part of it was that there is a lot of discussion in the literature about how do you move people from
knowledge to action? And there’s no concrete answer on how that happens, so we don’t know how
someone suddenly becomes a pro-environmental person and kind of start behaving that way. And one of
these things that I found in the group was that some of the members were actually – so before they joined
the group they wouldn’t even think about the environment. They didn’t care. But because of personal
relationships with the other members they found it interesting and start participating. And through their
participation in the group and through going to the schools, they actually start getting more aware of the
importance of behaving in favor of the environment. And that was very important because caring for the
education was what motivated people to join the group; it wasn’t caring for the environment. And that
was actually a very interesting thing. So I would say half of the members at that point when you asked
them “so why did you join?” it’s like “well because I want to make a change in education”. Not because

pg.
98
they wanted to make a change in the environment. So it’s fascinating that through the process of
participating they then got very, very aware of why it was important to be a part of the group. So that’s
kind of a short summary of what the dissertation was about.
P: Would you say that environmental groups like that are more effective? So a student-led group, would
you find that to be more effective than, say adults from a forest group coming and educating children?
FCM: It’s a challenging question. It wasn’t meant to evaluate their work necessarily, or to compare, but
there’re definitely some elements that they, you know that allowed them to do that. The fact that they
were younger definitely, students can maybe relate more to them? But that’s not necessarily the case in
every case because then each school’s like “we leave that one with that group who’d come to teach”, then
it’s like free time! You know? It’s not part of the school. So that transgression of what are the limits and
what are the schools saying on that change, and it’s difficult to see, to evaluate if that’s really the best way
of doing it. And then you compare that, for example, with teachers, who are adults, and are teaching
environmental education in their schools on their own and are very successful. So I don’t necessarily
think that because they were younger that they were more effective, but because they were maybe from
outside the school they were more effective. So the kids were more interested, the new thing, the new
people that were coming in.
Michael (M): Oh, Shiny Object Syndrome.
FCM: Haha, Yeah. And they would bring, that’s the third thing or fourth thing in the dissertation, is that
that group is important because they channel resources into the school. So you have a poor [? 12:00]
school system and you have these people that are bringing a lot of resources. Not only knowledge but new
methodologies for teaching those topics, and literally materials and resources to do that. So then in a
sense that makes them an asset to the schools.
P: Why do you think climate and environmental education groups, initiatives, why do you find those to be
important for youth, for communities, for Puerto Rico overall?
FCM: Well, we need to live with the environment and I think that as a society we need to learn how to do
that and sustain our way. And in order to do that we need to understand the environment, we need to
understand what we believe the environment is. I think that some of the presentations today are trying to
get at that. How historically, as a society, we have made decisions and now we have to reflect on those
decisions and say “well, do we want to continue with that, or is it time for a change?” And I think that
process of reflection is part of the import teachings of environmental education. So to me, environmental
education is not only about knowledge about the environment and our attitudes about the environment,
but we need to identify criteria for people to be able to make decisions about the future. And that is the
way I see the importance, and you know I’m also an anthropologist so I’m trained and I’ve studied
different cultures and their relationships to the environment and learned that its important throughout the
history of humanity it has been the decisions and the way that the people have related to the things around
them. So for me it’s like a no-brainer. As an anthropologist I should say.
P: So for our project because we’re doing something with developing a new curriculum if you were to
give any suggestions to something that we could do to make it more effective or really drive home the

pg.
99
importance of climate change and how to be aware of it, how to adapt to it, what would you say is
something to stress, especially within the first couple of lessons?
FCM: Well for your team the first thing I would suggest is to look into materials that have been created
and adapted for Puerto Rico. So there’s probably a library of documents that have been prepared by
different people. I think the way to connect is by making it local and relevant, and that’s key. Part of that
history that I was talking about is that most of the curricula that has been developed for Puerto Rico has
been brought from outside and the examples and the references do not reflect the reality of children who
are going to be listening to that, who are gonna be trying to learn all of that unless, you know if you don’t
engage them at that level it doesn’t matter that you told them that its urgent, that its gonna happen, that its
already here. You know that doesn’t matter, and you have to show that right when there’s some
information that is coming out now from the environmental natural resources about things that are already
happening, I think it will be key to show those examples in Puerto Rico. Now one challenge is where do
you teach these things? One of the things that we saw with that in my dissertation is that sometimes you
talk to the children about things they have never seen. So part of the issue is that public schools,
especially in urban areas, doesn’t really encourage seeing, experiencing nature, and their surroundings.
So you’re like “oh, we’re losing the coast because of erosion”. What coast? What beach? You know, I
don’t know what beach? So you know, things like that, it’s kind of like part of what we tried to do with
that group and the group that we’re working with now is that we create lessons that beyond in the school,
the classroom, are beyond the classroom. Just part of learning about global warming is understanding, for
example, is understanding that you live in a globe. You know? It’s bigger than just the classroom. It’s
bigger than just your household. And so I think that creating that is relevant and that is also think of the
learning setting outside the school and the classroom.
P: How do you suggest we do that? Would it be through, say like a field trip or a field activity?
FCM: It could be that.
M: It could be like some primary photos, things like that that even if they can’t physically be there they
can see examples that are on the island, that are places that do exist and are tangible to them?
FCM: Of course, yeah. Photos and videos are good to bring to the classroom. And then if you combine
that with the idea of field trips and getting out. And it doesn’t have to be far, you know, places far from
the communities. Sometimes some of these problems you can see them real close by, you don’t have to
go that far. But learning to identify them you know, and know that that thing that I see there, it’s not just
normal, it’s not just what should be. What’s causing that, and why should I care about that. I think those
connections are pretty important.
M: You had mentioned previously about how the youth led group had done activities, kind of like you
had said water garden is, I believe, an example? What sort of activities do you think would be feasible
and applicable to apply to a public school and try and implement.
FCM: It really depends on the schools and on the resources they have, and that’s a challenge. But I know
that the school gardens have been pretty much successful. You can keep them very contained and it could
be still within the school. So that works. Also establishing a relationship with things that happen in the
community. For example I know that in some cases they have like a community garden that then they

pg.
100
bring the students. If you cannot do the garden in the school then you can bring the students to the
community garden. So, that kind of thing. Of course there’s a lot of different initiatives that are
happening, a lot of the work that is to be done and it would be good if you set it up in a way that is a
guideline for the curriculum or the lesson is that part of the work is for the teachers to look and do that
mapping of resources outside the school. So if I do that mapping then I can identify and be able to do this
connecting and going and doing all these kinds of things. And that could be a part of the standard
guidelines of the lesson, like how you prepare for the lesson is to do that mapping and to recognize the
social mood. Also encouraging research through the lesson. I think it’s a very, very useful way of learning
about it. So it’s not only showing them that this is happening, that this is important, but go and interview
someone in that area that has been affected and ask them how things have changed in the last 50 years. So
integrating research into the lesson is hands-on, again it’s very important for the students to be engaged,
and it’s not the same thing that they’re used to so you want to break that routine.
M: That about covers what I had to say.
P: So I think we’re all set. Thank you.

pg.
101
Interview 5: Marcela Cañon
Natural Resources Director, Bahía Beach Resort and Golf Club
Date & Time: November 6, 2014; 2 p.m.
Emma (E): Do you mind if we record?
Marcela Canon (MC): No that’s alright.
Princesa (P): We would first like to start off by asking what your area of expertise was? What you do for
your work?
MC: I am a marine biologist. I work with environmental sciences basically. And what I do right now is I
work with a resort, a nature sanctuary. We are located in the mouth of the Rio Espiritu Santo river. So we
our like totally connected to the rainforest of el Yunque, through the Rio Espiritu Santo river and we are
one of the neighbors of the river. And we work in the conservation of the whole watershed cause that’s
how you should approach environmental education and how you should approach your neighbors if you
want to conserve an area. So we have been working with that and what I do being a marine biologist and a
master of environmental science, is trying to be responsible for the landscape and we work toward the
improvement of the whole watershed with different step by step. So right now I have been working with
Pedro and with the different activities around the river, this is one of them actually, and trying to put more
people in organizations around that river. So that is what I basically do.
P: Okay. So do participate in any sort of environmental initiatives.
MC: I do. I lead them.
P: Oh okay.
MC: We have different activities. One of them is the resort, Bahia Beach Resort located in Rio Grande,
and in the resort, in the nature sanctuary, we have an environmental education program. The basic one is
that we educate our staff, environmental education, different topics. I haven’t dealt with climate change
yet. That’s something I haven’t done, I work with recycling, waste, nature conservation, things that, and
of course I mention climate change but not like something specific about it. We educate our members of
our club, our residents and also our guests because we have a hotel. We are the first five star hotel in
Puerto Rico, a St. Regis. So we have a St. Regis there. So our guests, we educate through activities, one
of them is nature tours. We provide nature tours for our guests. And we provide kayak nature tours for our
guest so we provide information around that. We also have a close relationship with the community,
every year we have an environmental campaign and that campaign has three components. One is like a
contest between schools, which is like a joint contest. And you can read it here, I don’t know if you saw
the poster. The second thing that we do is a - we provide workshops for public schools. So that’s why we
are going to need to work together. So we provide workshops for public schools on different topics. Each
year we have a different topic for our campaign. Two years ago it was mangroves, guardians of the coast,
so the emphasis was on the coastal line mangroves. Then it was the Rio Espiritu Santo River, by itself, so
we focused on the Rio Espiritu Santo River and then extrapolate that for everywhere else. And the third
one is the, I mean the last one that we had was the Al Mar Bahia, that’s our foundation but I wasn’t
talking about the foundation, I was talking about the environmental problem that we have. Not talking
about the resort, it’s complicated because you can’t because I don’t want to talk about the resort I want to
pg.
102
share the basic things with the kids in the Palmer schools in Rio Grande. For something that is really
important is education in Puerto Rico lacks a lot of components and the environmental component is one
of those. So that environmental component is mostly lacking in the schools, they don’t have tools, there is
no interest in some case, there is no knowledge. So I think it is important because of that. And we
identified that even though they have free education, the quality of the education is not that good in public
schools. We also provide workshops and conferences, for private schools in San Juan. The best schools in
San Juan, I have given conferences and workshops and that’s part of our environmental education
commitment. So the third component of our campaign, as I mentioned the drawing contests, the
conferences, and the third one is beach clean-up. So we have a beach clean-up, its massive, well not
massive, but we usually have 300 people from the community come and that is another involvement in an
education opportunity. And so during the year I keep on training our staff in the environment. I am marine
biologist; I am the natural resource director of the resort. And what I do is that, usually a resort doesn’t
have someone who is always working on that issue. And Ashley, the person I am going to introduce you
to, is the environmental assistant. And they all work on that. So we work with our guests but we also
work with other things and with training our staff is basically environmental education. It’s how I train
them because they need to understand what we have and how they can relate to it, to take care of it.
That’s it.
P: The kind of guests you get at the resort are they usually local, are they more from maybe outside of
Puerto Rico or is it a combinations of people from Puerto Rico and tourists?
MC: It’s mostly people from the states from the east coast. Mostly our main areas are New York and
Boston. There is some people from the west coast also, some Europeans, not many Puerto Ricans, some
Puerto Ricans especially during summer. But it’s a luxury hotel I mean it’s on the level; it is five
diamonds, five stars. So at the level we are it is difficult to provide to the local market. But that’s the
hotel. But as I mentioned to you we are a resort that has residents. So we are a club. SO we have
members. Our members are mostly Puerto Ricans so we have members. We have residents, we have
villas and houses and our residents are mostly Puerto Ricans but there are a lot of New Yorkers and
people from the east coast. So it is a mix in the resort part, residents and club, its like 60% Puerto Ricans,
40% outsiders. For the hotel it would be about 90% from the states, 6% Europeans. We have Puerto
Ricans but not as many, especially groups.
P: Regarding the Rio Espiritu Santo, have you noticed any problems regarding it, anything to do with
climate change, I know you said you don’t really focus on this a lot, but have you maybe heard of or
noticed anything about that?
Michael (M): Or any changes that have occurred that could be tied to climate change?
MC: I don’t know if there are any problems ecosystemically or in the river currents, I don’t know that.
We don’t study that. Maybe Felipe could have told you yesterday. I don’t have that information. What I
know is that we need to talk about adaptation. And we need to talk to people about how to manage or how
to prevent, you can’t really prevent climate change on that level, but you can help. You can be part of the
solution, since the beginning with the prevention part. And that’s education. So it’s not just talking about
climate change and how climate change is a massive thing that you can’t manage, and it has to be solved
by the governments, no no no no. It’s how you produce climate change every day, with your actions your
increasing the effects of climate change. So I would focus on different ways, prevention, I’m not just

pg.
103
talking about students but I am talking about the river, too. You know, cause I don’t study it so I couldn’t
tell you the changes in the river, but I think that we have to talk about adaptation with the agriculture
people, with the people that are living around the river. But we have to put it in ways that they can
understand it. And so that is something that is eventually, that we need in the river. We are having a low
increase in temperature during the last years and we are seeing how it is hotter and hotter and hotter.
Maybe its not a pattern, it hasn’t been proved that is happening with the rates right now but we’ve seen it
and its tendency. So having that tendency, its been producing changes in the river itself. So I see that. You
see how birds, migratory birds, are getting here later or earlier depending on how the year goes and the
temperature rise. And that affects the river mouth, because they come to the river mouth and to the
mangroves in that area. So there are changes that I’ve seen but I couldn’t tell you exactly because I don’t
study it. Now, measures to mitigate, mitigation, adaptation, things like that are how we should talk to
people around the river by giving them facts and options. But I also going back and talking about simple
things. Like how in Puerto Rico we use fossil fuel to produce electricity and how much fossil fuels
increase climate change right now. So if you don’t drive your car as much or if you don’t use as much
light in your house, you can diminish that. Talking about education, I think that would be a way to start
and to get people engaged with little things, a part from projects around the river of course, for adaptation
and mitigation.
M: As something that I am just curious as to whether it has been something that has been occurring, is
that you said that temperatures have been changing, have you noticed if rain patterns have been changing
in the last few years?
MC: Yeah, it’s something that I’ve noticed. About a month ago, two months ago, they had a climate
change summit. And they were showing the figures of how it’s been changing and there has been an
increase in temperature, and there has been a change of rain problems. So it’s moved a little bit, that shift,
and how the rain patterns are related. I have to check but they had really interesting figures and how it
hasn’t been proved really having the increased temperature right now. And the level of the ocean has also
been increasing steadily in Puerto Rico. So there is lot of useful information…
M: So it is something that has been seen?
MC: …and it has been seen. And also…
M: And it has been studied?
MC: Yeah people have studied that, so you can find that information.
P: DO you know where we could find that information? Because it might be helpful for our project…
M: Useful for our group.
P: Right
MC: Maybe you should look at the climate change summit presentations. I can send you an email, one of
the emails, so you can check. It has the agenda. I have some data since I took a lot of notes, you know I
was really interested. They have the actual recording and all that, they have been checking the problems
and seeing what is going and what’s happening with some species. So they have a lot of information. I

pg.
104
was surprised. They do have some information, but they had some interesting information that had
applied like research.
P: Going of our project as something to develop a curriculum, what do you think is something that is
really important to kind of to share with students especially within the first couple of lessons. What do
you think are the some of the most important topics of climate change that are relvant? And maybe note
even climate change but environmental education?
MC: Photosynthesis. I’ve been giving workshops to kids, 4th grade/ 5
th grade, and they don’t know what
that is. I mean the basics. Go to the basics. How plants photosynthesize, how the forest can change the
microclimate of the plants. Why? If you study photosynthesis and how it breathes, you know when it
breathes it holds a lot of water, and that way you can change the microclimate. They don’t know that.
There aren’t too many people. And those kinds of facts are the kind of facts that I think engage kids. Oh
cool, so we get water from it or moisture really. And its cooler when you are around plants. You feel how
the microclimate changes. So those kinds of things, of course at first you have to go into the basics. That
is why I am saying photosynthesis. The relationship between the sun, plants, the soil, water, basic
elements and those relationships, and how that gets more complex and complex when you put the
atmosphere, gases and how the soil can get real hot and how that can affect it. So you can build upon
those things. So I would go basic things of life, like the elements, then processes, like photosynthesis, or
how the earth gets heated and all that. Those are things that are very basic. And then I would build up to
other concepts more complex and how those things affect and how things happen in different areas of the
world. And then I would put that into how what’s happening in the world can really affect you, where you
live. What’s happening in China, cause we are all connected. And then I would build up to the ozone hole
and how that happened, how is it being fixed. How have we been tackling some of the problems, and we
have been not solving them totally, but at least not making them something totally negative. How we can
work to make this better, and we can really adapt. I was talking about from your day to day, how you can
solve this. Because if you talk about climate change usually people think oh that’s something major and it
is not related to me. How you are related to it. What do you do in your day-to-day lifestyle that affects
this? What I was telling you before; I think you should include that in the curriculum. It can’t just be like
basic science, no. It has to be something that you can related it to, and that you can solve and fix from
your perspective. Like having a restoration project of the river, carbon fixation and you explain what that
is with a project you can do in your backyard. You know what I mean, so starting with basics, building
into more complex, and then how you…
M: How you can apply in, like, a physical sense, that you can do it hands-on.
MC: Exactly. So you understand it, you can relate to it, and then you understand the bigger complex
thing, is like the climate change concept that belongs to everyone that has to be dealt with in the UN and
things like that and how you relate it to that.
(We paused the interview to discuss our project and our goals, and Eduardo Agostini joined the
conversation)
M: I am kind of curious as to, like with climate change happening, what would be since you do work at a
resort and that is part of it, what would some of the economic effects that would be a product of like let

pg.
105
say the sea rising or increases in temperature or changes in rain patterns and those sort of effects of
climate change? How do you think it would affect like economic situations?
MC: I think like the tourism industry or in this case the hospitality industry is one of the most affect, a
part from ecosystems of course. But this industry is very much affected by climate change. And in places
like small islands, like Puerto Rico, the effect is much higher. And that’s how it happens. So whenever
you have the effect, you are going to be hit financially. I mean, if it rains, instead of raining four months,
its five months or two months. If it totally changes, you are going to be affected. If the sea rises, I mean,
you are going to have to do different projects. So the way I would approach it, would be, again,
adaptation, mitigation. How a hotel or a resort or complex, whatever from the beginning, from the
development, thinks about these kinds of things it can happen. How they can affected, and how they can
adapt and how they can like adapt in the next hundred years, you know when they have this kind of
business they are hoping to be at least 50 years. So what are the problems they have to work with and
that’s how I think. The effects, you can see them right now, also, in this industry at least. You can see
how the tourism pattern changes. People don’t go as much to some places, and more to others, depending
on how weather is affecting one or the other. And it is just like a decision that the public makes because
they see things happening. Even things like the fires in California, those could be increased by climate
change, and you know that. So when those things happen, I mean, the huge areas for things like tourism
stop completely because of fear and that’s in the short run. In the long run, the effects are going to be
more devastating. And they are always going to be financial. So its as you mentioned…
M: So it is really harmful to businesses?
MC: Yeh. So everything that you mentioned, and it’s the same thing, they see it like something that
affects the whole world but not me or my business. That’s how I see it. And that’s now like what’s
happening. Before we finish, Ashley and Eduardo went to the summit in Puerto Rico to the United Nation
Climate Change Conference two years ago.
Ashley Perez (AP): It was one year ago.
MC: Exactly. They are from the University of Puerto Rico so they represented the University. And also
Ashley went as a representative of the Puerto Rican government to the climate change summit. So they
can give you the also, you know they studied a lot about it, so they can give you lots of things.
Eduardo Agostini (EA): I was going to answer your question cause something happened here like
probably six months ago. Ah it was a small hotel, very small business, but the guy took the investment
and bought like prime real estate on the beach. It was a nice beach; he had complete access to the beach.
Now the water is hitting the entrance of the hotel. So imagine if you spent a million dollars,
MC: It’s been in the family for years and years.
EA: So they made the hotel with you know, it’s going to be like a super small luxury hotel. The best part
about it was that they had the beach in front of it. What else could you ask for? Well there is no beach for
them now. This property is probably now worth almost nothing because in five or ten years the sea is
going to cover it.
M: So imagine like places like Isla Verde and stuff?

pg.
106
EA: Yeah. Especially Condado.
MC: But there is a place, it is pretty close to Isla Verde, where it’s happening right now. Where there is a
mile, almost two miles, where it almost lost the beach completely, during the last eight months.
Tomorrow the tourism company of Puerto Rico is organizing a public hearing
M: Kinda like a town meeting a little bit?
MC: No, it’s a public hearing. It’s like a step to try to mitigate that.
P: It’s sorta like trying to get the public interested in the problematic, and trying to pass laws based
around that. And that’s what the public hearing is right?
MC: So what they are doing tomorrow is a public hearing to see what is going on in that area, specifically
that hotel. And it’s not just the hotel but it’s the whole area. So they are going to do it tomorrow and after
that they will enforce some laws that exist; what to do and how to build by the beach and things like that.
And they are also, I guess, going to try to pass other laws and make some of these people invest in
mitigation, or the municipality. That’s what they are looking for; they are looking for the municipality to
invest in mitigation. So the use of like hospitality or whatever can be still be (inaudible) because they
invested a lot of money. And that’s happening tomorrow, actually. So if anybody wants to go, because its
something that is affecting everyone. So what else?
M: We about covered that. Yeah that was pretty thorough.
MC: Listen guys, as you interview so many people and you’re trying to get something. There are a lot of
different curriculums out there and information, environmental information, everywhere. I mean that is
something you can get everywhere. There are some pretty cool tools, even in YouTube. I mean there are
like so many things developed by NASA, even little models developed by NASA for what climate change
is. So you can get all those, get all the sources, as many things as you want. We have a limitation here,
with having things in Spanish because they speak Spanish. But also you can get interesting things in
English. List all of them as part of the lecture. Because I know, that you do a research, to give to your
teachers and to Pedro, and I will eventually get it too. And that is going to be useful and you are going to
get all the sources and everything. And then you find all the different links and information that people
can get, even if it is not part of the lecture.
P: Like an appendix or something.
MC: Like in an appendix. Everything that you find that is useful. Because you are doing such a detailed
research, that it would be great. And people could have access to that. When I talk about people, I talk
about…
M: Teachers?
MC: Mostly
P: So for example the US forest services, have a “baul de actividades” something like that could be in the
appendix.
pg.
107
MC: Exactly. That you found on YouTube or Google or whatever, anything that you found. You can put
the link and just list them as an extra. It’s going to be like part of the product, but annex with lots of
detail. So if you want to teach them about Methane, and how Methane works, here is a cool video that
you can use. Or if you want to talk about whatever, here is a cool model that you can show or whatever or
readings, if you found something interesting that you read, pretty cool. And you think like this is gonna be
like useful. For this topic, use these readings. Are you gonna have something like that?
M: I think we were definitely going to have like places for further expansion. And that like if someone
wanted to further investigate topics that there would be some amount of resources there to do that.
P: I think there was more supposed to be kind of expanding on the curriculum itself.
MC: Yeah but this would be at the end, as like a list of references to share with the teachers. Because
when you provide the lecture to every kid in that class, they are going to ask a lot of questions that the
teacher might not be able to answer. But maybe they can either direct them to this or study it themselves
and provide the answers, you know. Somebody maybe, you know, there is a teacher who maybe is trying
to read about it and is like oh my God why do I have to do this. But then maybe he finds something that
interests them and he has the list and he goes to the list and he gets more information. And maybe he will
get a hook, cause you know how people get different entry points in their mind. So maybe this would
help. For me it would be great, because you could go and tell the students. Because I was telling them we
do this workshop, and provide them. So, kids get tired really easily and 1-hour lecture, that’s not possible.
Like you just said, we are going to do a one hour lecture, and put all the concepts in one, the teacher is
going to have to divide it into three different sessions or something like that. And I think that might be
better, instead of giving just one block with that set. Its going to be like, eeh I am going to puke climate
change cause that’s what happens with these kids.
P: And I think that was one of the things were thinking of,
M: That’s why we kinda wanted the activities and stuff so that it would break up so it’s not like a single
lecture.
MC: Yesterday or the day before, I was with this group of people in my kids’ school and there were
presenting this very elaborative process. Kids with computers, I didn’t like it. But the main thing in this
class was timing; a typically eleven year old is not going to keep his attention for forty minutes, not even
at the end of the class. So if you talk about an hour, for kids, you don’t have them there anymore,
especially for something so heavy and so many concepts and all that. So maybe having something that’s
an hour but it is varied so it’s three modules, something like that. That could be useful. And even for the
teacher, cause he can have further readings for the activities. So have like the twenty minutes and an
activity; the same thing and then the other twenty minutes and another activity; then the other twenty
minutes and another activity. If you don’t want to do the activities anymore and just do the whole hour
that is your decision as a teacher. It depends on your students, or how you want to invest your time.
AP: So what is your project about?
EA: Sustainable development education?
P: It’s more just climate change education. So teaching the students in Rio Grande about…

pg.
108
MC: Related to the Rio Espiritu Santo River…
EA: So what are the biggest polluters in the world?
P: Europeans
EA: Europeans? Yeah, that’s where all the oil that’s burned up. They’re the ones who buy it.
P: That wasn’t research based that was just observation based.
EA: Have you done corporate research on who are the companies that most pollute?
P: We didn’t as far as…
M: In some of the sources we saw some of the types of sources that it will come from like, it will be like
“x” percentage of the world would be, let’s say, from fossil fuels but it won’t be like particular areas. Its
just kind of like whatever that source is will say there, but not the location of the source, if that makes
sense.
EA: Yeah
P: But explicitly corporate we haven’t really done. So we haven’t seen like oh BP is doing this much…
EA: So the way it works is basic science. All of humanity needs electricity for consumption and
production. That’s our main goal, producing electricity because we are going to need it. We are always
going to need more, because we are always going to need more people. There is an actual figure for that.
How many electricity does the world consume in one day, one year, one month, right? So what happens is
that the markets are regulated by the government. And they try to do it so that all the interests are served.
So there’s going to be 20% petroleum, 20% coal, 20% renewable, 20% bio fuels. And they create
different markets, different energy markets, and they regulate them so one can’t compete for the other.
That’s not going to happen anymore. What happen was that, ah, now solar and renewables have open
market. And for the first time they decided that we are going to use more renewables than any other
source.
P: Now who decided this? Germany?
EA: This was decided at the conference of parties.
AC: That we went to last year.
P: Okay. Because from the laymen’s perspective, it doesn’t seem like there is any change.
EA: So right now, I think gas prices…
AC: They are trying to get it up, like Germany is doing complete renewable now.
P: Are they really? So for example, when you drive in a car, you are not going to fill it with petro, now
you are fueling with…

pg.
109
AC: With like energy from the sun. So for example, because like the place you are charging it is getting
its energy by solar power.
EA: They are at 54% consumption of electricity that is provided from solar or wind turbines.
MC: The thing is that we are in the States. We are not committed to it, yet.
EA: But it’s a market. They don’t have to be committed to it, because now it is a competition.
MC: Yes and no, because if you are still getting incentives for coal and for other things. You are still
going to have…
P: There is a lot of financial incentives in the US,
MC: A lot.
P: That’s why I think the Sudan,
EA: Yeah, but I can sell my kilowatt-hour cheaper than any other company.
P: And they get in trouble for it in some situations. Or you know there are plenty of things where it is like
you can have a solar powered light or you can have a wind turbine. And people argue that it is an eyesore
or they make really silly arguments. And because of that there hasn’t been, at least for my understanding
and my perspective, there hasn’t been much of a unified movement or even national or even like regional
to really push towards renewable energy, its been more…
AP: It’s been scattered…
EA: Because you have to understand that there are different markets, there is the petroleum market.
MC: But we aren’t talking about that right now (some arguing between Marcela and Eduardo) Listen to
this; it is the same thing that I was mentioning to you about the complex. And how you eventually have to
talk to the kids about the conference of the (inaudible) and the work about climate change, cause even
though the United States are not part of that yet. They are, they are like a supporter, but you have to know
what’s going on. So you give them all the concepts. You know what I mean, that’s what I was telling you.
You have to go to every different level, but you have to try not to get lost into like some things because
they are not going to understand what they do to impact or not to impact. So you have to keep it simple
here. (some arguing between Marcela and Eduardo). But you have to go eventually to those complex
concepts. So you understand how this is being driven by economic figures instead of like facts of what’s
good or bad for the environment. It’s more of like a market, as you said. It’s been market based, it’s
important for the kids to know it. Those are some of the complex concepts you have to go into with them
and give them the option to know. Why and how I can change this, if I change my consumption problems,
if I am willing to do it as an individual. As an individual, how can I change what’s going on.
P: Almost like boycotting in a sense, like if oh well petroleum is really, like the petroleum industry really
drives a lack of movement towards renewable energy, well then I will just walk or bike…

pg.
110
MC: Or how do I become a vegetarian or eating just fish, which is like eventually helpful to the ocean.
And how like I stop eating cow and then I help to decrease Methane production, have you read about
that?
M: Yeh
MC: For like climate change, the most important of the gases is Methane. Methane is produced in
massive amounts, by the cattle farm.
M: Yeh, we talked about that.
MC: And if its intensive, its worse because they are fed and fed and fed. And they just produce gases. So
if it’s like a regular household of cows or whatever, it’s different.
P: Then from my understanding…
MC: It’s for milk production. Because if it is for milk production it is different than meat production.
P: Because if it’s for meat, they raise it and kill it.
MC: So those things are important, these kids, because I am going back to your project. (talk about
timeline of project). It’s important to show those things, those facts.
P: But cows are really good for you, if it’s healthy.
MC: That’s the thing. I mean I am not saying you should tell them…
P: Never eat a cow.
MC: To not use that but how all the industries, because it’s the industry not the cow. It’s the whole
industry. And the impacts, and that’s the information they should get and not just the concept of climate
change, but where those gases come from and how we can diminish that, as individuals. I feel terrible
because I drive a jeep. And I turn on the AC and open the window and everything. And I think okay I am
turning on the AC and it’s horrible. At least, I think about it. I mean, I think there is like 80% of the
population that don’t even think about it.
P: But maybe if infrastructure was made better, you wouldn’t need as much AC. I am just hypothesizing.
MC: No of course. But since I moved to Puerto Rico, I have been like, and it’s terrible because you start
to do the same things that you should be avoiding. But if you teach people from the beginning, they can
grasp these things, and really make changes. And those changes are really important. And that’s what we
are looking for. So those things are important.

pg.
111
Interview 6: Ashley Pérez & Eduardo Agostini
Ashley Perez: Natural Resources Assistant, Bahía Beach Resort and Golf Club
Eduardo Agostini: Communications Director at United Nations Puerto Rico Youth Delegation
Date & Time: November 6, 2014; 3 p.m.
Emma (E): What is your area of expertise, or who have you mainly worked with?
Ashley Pérez (AP): Okay. So, I’ll start and then Eduardo will go. I’m an environmental scientist and I
work with Marcela at Bahia beach resort as an environmental assistant. Basically, we do all of the
conservation educational work within the property and within the community around the area and, apart
from that, I help out with the sierra club sometimes and, like we were saying before, last year we went to
the United Nations framework convention on climate change as representing Puerto Rico as Puerto Rican
youth delegation and basically working with the government and different entities. That sums it up.
Eduardo Agostini (EA): Yeah. I guess my area of expertise is politics. I’m a lobbyist for the sierra club;
I do environmental lobbying. The other thing I consider my expertise on is in renewable energy. That’s
corporate development and the actual, you know, developing the project so actual people change to
renewables.
E: So what is the Sierra Club exactly?
EA: Alright. The Sierra Club is the biggest non-profit in the United States. It’s also the oldest. It’s the
number one conservation non-profit organization in the world. It has over a hundred million members and
we have closed over twenty coal plants in the last ten years. We have – basically we declare war on
everything that’s not renewable, everything that’s not sustainable. Our main campaign is “Beyond Oil,
Beyond Coal, Beyond Natural Gas”. People want to change to natural gas now. I don’t know why. So,
Sierra Club is an NGO that – I don’t know, we do so many different things I get lost, but it’s really big.
E: Have either of you been a part of, like, Environmental education initiatives at all?
AP: Yes. We’ve been – well, me in particular. Like I said, throughout SoulBahia, which is Bahia Beach
resort’s NGO, we do work with the community and we walk into a lot of the communities that you guys
are working with, and basically give them trainings on different environmental themes, specifically things
they have around their communities like El Yunque National Rainforest, the Spiritu Santo river and
different areas around that. Apart from that, I’ve also worked in environmental education with the Sierra
Club a lot, specifically the SSC, which is the Sierra Student Coalition. It’s basically the youth group of
the Sierra Club, and I’ve worked with training a lot of youth in leadership initiatives along with Eduardo.
Around that we’ve worked with educating on leatherback turtles and different ecosystems around the
island, like coastal ecosystems and rainforest ecosystems and basically how it influences people’s lives
and all that. So, that’s what I’ve done in educating the public on these things.
EA: So, I educate people on environmental lobbying and, with Ashley, we used to have a summer
program called “sprog’. We used to invite a lot of high school student, a lot of college students that want
to learn more about environmental sciences, or just the environment, helping the community. We’ve
probably talked to, or educated, more than two hundred people already on a one to one basis. My other
part of the job is I have to explain to them why it’s better to change to solar than to the public grid of the

pg.
112
petroleum company. So, I have to sit down and explain to them why solar is cheaper, it’s more affordable,
and better technology than what they have today. I don’t know. I guess I’ve educated a lot of people on
that sort of stuff.
E: So, talking about climate change, do either of you know any particular studies that have been done
about climate change in either the Caribbean or Puerto Rico itself?
AP: Well, in Puerto Rico there’s actually a committee that’s based on climate change. Specifically,
they’ve worked mainly in – and it’s actually under the Natural Resources Department of Puerto Rico. I
don’t remember the name exactly, but it’s based more around the effects of climate change around our
coast because it’s – I think a thing that worries us most is that we are an island in the middle of the
Caribbean. We are a pretty small island so, if sea level rises and a lot of different things happen with
climate change, we would really be impacted in that sense. So, this group has mainly worked with
research on based on sea level rise, on impacts on corals, and a lot of things based around the coast and
they have a lot of good research based around that and the have a lot of proposals based on adaptation and
mitigation. So, that’s mainly what has been done locally and, last year when we were preparing to go to
the United Nations framework convention on climate change, we got to meet with these people and we
got to get together with different types of groups that have been mainly doing a lot of community
outreach to try to help communities in a lower scale to actually try to adapt or look for some methods to
mitigate climate change. Around the Caribbean there are different networks that work together that I
could get you the names for. Also, if you’re interested –
EA: There’s one called the ELAC.
AP: Yes! We can get you the names for all of them. Eduardo will probably remember and we’ll get you
the names for them.
E: So, what are the main issues and impacts of climate change that you’ve seen in Puerto Rico?
AP: In Puerto Rico I guess it has to do with what we were talking about before. Climate change would
really impact Puerto Rico very negatively and it already has in the sense that, as I said, we are an island in
the Caribbean and we are pretty small and we are in the tropics. So Puerto Rico is a small island but it is
very diverse in ecosystems and ecosystems here are, sort of, very micro and they are very specific to
certain weather changes and temperature changes so anything that changes a little bit can impact the
ecosystem very negatively and there is a lot of species that are very specific to certain micro ecosystems
within the island. So, I guess to resume it all, things like rising sea levels would basically make a lot of
our coast disappear - a lot of the areas where a lot of species are dependent on. There’s a lot of coastal
forests around the island that could really be impact if they basically just disappear. In that sense, There’s
a lot of reefs, a lot of coral reef experts here today, so you could talk to them about that also, but things
like acidification. We’ve already seen that. Especially on the east coast of Puerto Rico there’s a lot of
corals that are actually, basically, disappearing and it’s because of this rise in temperature around the
world. Things like El Yunque National Rainforest, that you guys are there. If the temperature keeps on
rising this forest will tend to get a lot less rain, especially if there’s a lot of development around its coast.
It’ll have a very negative affect on the rainforest because clouds will go up higher it won’t rain on the
rainforest and, throughout the years, they’ve been seeing that rain coming down less and less on this
rainforest, so that’s a worry. Especially on the top of the rainforest, there’s a few different species that are

pg.
113
specific to that area, so those species would basically disappear because they have nowhere else to go.
Puerto Rico also has a dry forest and there’s a lot of cave systems so a lot of these areas would also be
impacted by it, but those are just some examples that I’ve mentioned before.
EA: Yep. Rising sea levels, a lot of species that are – it’s going to get hotter or colder – where they’re
going to get their environment destroyed, and basically what Ashley said. I can’t add anything else to that.
E: So, are there ways to adapt to these changes such as specific forms that especially kids can do.
AP: With kids, I guess, let me see. I’m thinking specifically where you guys are going to be doing this.
Are you going to be doing this in Rio Grande where there’s probably a lot of kids who live close to the
coast and those who live closer to the rainforest. I guess it has to do mainly with that these kids really
need to understand that they are right in the middle of a hydrographic zone – that everything they do
around their communities and there houses basically impacts the river areas and all of these areas where
water will come to, and that’ll eventually impact all of the coastal zones that they are used to. So, I guess
it has to do with that – with educating on how to get rid of waste properly, specifically if they are so close
to these areas. So, even if they think that they’re right in the middle of the forest, that they throw a bottle
into the forest, that will eventually runoff maybe into where there’s a river and that will eventually get
into the ocean. I guess it mainly has to do with them mainly understanding that everything they do around
their lives, there’s that connection. There’s that connectivity in nature, they’re right around the rainforest,
but they’re connected to the river which is connected to oceans which is connected to the reefs which is
connected to the water that they get into their houses and all that. Just getting them to understand that
there’s nothing separate between their lives and that connectivity that we’re talking about. It has to do
with around that.
EA: If I were to adapt I’d just move somewhere else.
AP: (laughs) That’s adaptation at its finest!
EA: I can’t really do much here! I guess if we have rising sea levels we’re going to have a lot of these
government contracts building these giant walls so the houses don’t get buried under water. Apart from
that, I don’t really see how an island can really adapt to climate change.
AP: Another thing that, when you’re going to go to these kids and all that, I think another thing that
hasn’t been – it’s starting to be of more importance in Puerto Rico right now – is that these kids, they
need to learn that whatever they do in their lives if they want to – for example, if they like a beautiful area
close to the ocean, that they need to better understand that it’s not just going in there and building their
house wherever you want, it’s that you need to think things through and you need to have a more
sustainable view on things. So, I think that could also help you with educating on these things. That they
need to think about everything that they do in their lives in a more sustainable manner. Even if they want
to build their house right here, it’s fine just so long as you do it consciously and as long as you do it in a
way that you are not impacting the area around you,that you’re actually helping it and that you’re
watching out for conservation.
EA: I guess if we were to adapt here, if climate change really happens, I guess would expand that boat
park, right? We’d have an underwater hotel or something!

pg.
114
AP: (laughs) If water levels keep on rising we’d be safe up here, but that [hotel] wouldn’t be, down there!
EA: A beautiful ocean view…
AP: Yeah! Definitely and ocean view!
E: So, What are some of the main financial or cultural consequences of climate change?
AP: If you want to be specific on Puerto Rico, Puerto Rico has a lot – well, mainly most of the population
and most of the industry; Puerto Rico has a lot of pharmaceutical industries and also, since Puerto Rico
receives petroleum by ships, a lot of these plantations would need this petroleum from right on the coast,
so that would be a big problem. We’re tempting a really big natural disaster where water would actually
come a lot further in and that would these pharmaceutical industries, the petroleum that is coming into the
area because it wouldn’t have a stable place to be settled because all that area might be destroyed, and
also a lot of the population of the island is right along the coast. I guess, financially, it would be a very big
disaster and on the industrial side of it, it would also be a pretty big disaster.
EA: Could you repeat the question?
E: Yes. What’s the socioeconomic consequences of climate change?
EA: Climate change in Puerto Rico in general? I have to be honest. For me, climate change is the best
thing that’s ever happened to the world. I’m being honest, because what’s deriving from climate change is
a huge opportunity for, especially islands, to change completely to a renewable energy market. This is not
sustainable. No matter how low they buy the raw materials, they still have to bring it in a ship here, so it’s
always going to cost a lot of money to bring the energy here because we don’t have coal. We don’t have
natural gas. Right? So, financially, I think that climate change is going to help not only Puerto Rico, but
the world in the sense that the energy business is probably going to be the number one business in the
next ten years.
Princesa (P): So, by climate change you mean if people adapt to climate change?
EA: No. I’m saying from these horrible mistakes that have happened, the greatest opportunity for the
planet has also risen.
P: But, if you don’t take it, then –
EA: But we’re actually taking it! That’s some of the misinformation you get in the environmental
community. You know, that the good guys are always losing and the bad guys are always winning? No,
it’s the complete opposite. the bad guy is the petroleum industry, the coal industry, the natural gas
industry are actually losing a lot of money
AP: It’s starting to happen like Eduardo said.
EA: The energy business has doubled for the last eight years. It has doubled. If this month we sell a
million solar panels, by this date next year we’ll have sold two million! We’re only eight doublings away
from beating all of the fossil fuels.

pg.
115
AP: Apart from that, lock out the window! (Points behind her) Have you seen all the solar panels out
there?
Michael (M): Wow, that is a lot!
AP: That was unheard of a year ago in Puerto Rico. This area, it is not completely sustainable now, but
they’re aiming for that and those solar panels are powering part of that energy in this place right now.
M: This is something I definitely have seen in the states even in New York. My mom works with a
company that sells them and that’s the hugest new thing. They’ve been selling a lot of solar panels.
P: I have a similar case where my mom is trying to start a small solar farm.
AP: That’s good! That’s what we’re aiming for too also in our personal lives.
EA: I want to install a million solar panels… well maybe not; that’s a lot.
P: Even at our school there’s a couple of streetlamps that are solar powered. They have a solar panel just
on top of it that’s what turns on the streetlamp.
M: Yeah, and it’s light sensitive.
EA: They’re also smart appliances. But my main goal is to build a megawatt farm. a megawatt farm is
3800 solar panels and a solar farm – a one megawatt solar farm, which is the maximum allowed by law –
would give power to maybe ten thousand people that are not going to consume electricity. If you create a
megawatt farm you would save, over the course of twenty-five years, I think it’s five million gallons of
gas that will not be burnt. It will not be burnt so people can turn on their Apples and turn on their TV’s.
AP: Yes. You can live comfortably. You know, you don’t really have to worry about turning off the air
conditioning at a certain time or something like that.
EA: On the financial/economic side, for every problem, new solutions emerge. That’s what living is all
about. We grow up and find new problems and then new alternatives. I think the recycling business is
going to boom like no one has ever seen before. It’s going to be a ton of money to be made on garbage.
People just picking up garbage and going from rags to riches because they developed a processing plant,
and the energy business is probably going to be the most exciting business in the world in the next ten
years.
AP: But, in order for all these things to happen I think the whole multi-sectorial thing is really important.
You need to have everybody on board for these things to work. To have the business side of it, the
government side of it, the community side of it, kid side of it and making sure it all merges together for it
to work in that sense. So that’s why it’s important to have things like this [symposium] and a lot of
community based groups and NGOs that are actually pushing for these types of things. And, another
thing. Another financial pillar in Puerto Rico that would be impacted, like Marcela was saying before, is
tourism. Tourism is mainly one of the main economies on the island and most of the tourism is basically
based around coasts. A lot of these hotel businesses were built around twenty years ago. Maybe even
more, so things have changed a lot along the coast from twenty years back to now. A lot of these hotels

pg.
116
are starting to see things change around their areas, like the one Eduardo was talking about before [with
Marcela].
M: So there are some good and some bad that could happen? As is the case with most things –
AP: Yeah. Of course.
E: What ideas or things about climate change is the public of Puerto Rico unaware of right now?
AP: I guess with that it has to do mainly on what people you’re talking to on the island.
P: Well, just like the everyday person.
EA: The every day Puerto Rican is not aware that he belongs to the US or that he has a right to vote! I
don’t think they think much about climate change. They know it’s happening, they know “oh! global
warming” but –
AP: They don’t know exactly what it is. It really is outside of their reality.
EA: Yeah. 95% of the people here don’t even acknowledge that climate change is even a problem. Don’t
quote that number though!
AP: But really, the schools that you guys are going to be going into when you’re preparing everything
that you’re going to do – you need to be very aware that these are kids that, I’ve been to their schools and
some of these kids live five minutes from the rainforest yet they’ve never been to the rainforest, so it’s
those types of kids that you’re going to be going into their schools. It’s very important what you’re doing
because it is bringing in something that they’ve probably never even heard about or that they’re very far
away from. Maybe they’ve mentioned it a little bit in their science class, but they don’t fully grasp or
understand it, so I guess that what you guys are doing is going to be really important in that sense. You
need to be very – you know, explain to them thing that obviously are very close to what their reality is so
that they can actually get passionate about it and are understanding it a bit better.
EA: Do you guys know why climate change exists? There is a reason, it’s not just a coincidence.
M: It is a natural cycle. It’s more the we [humans] exacerbate it.
EA: Yes, but it has a reason and it’s very simple. It has one single answer that explains the whole mess
that we’re in. Well, people are behind everything, but I don’t thing God created climate change because
he hates us or something, but the main reason is energy. Everything is energy. People tend to believe that
climate change happens because of market development and overproduction, and yeah, it does. It does
affect it, but if factories were running on renewables. We weren’t talking about climate change or global
warming, but about scarcity of resources or how we are going to regulate raw materials for production
and consumption. Because we were not doing renewables the main choice for people and governments
like China and US, they have their own market. China’s the coal market, US is the oil market, European
nations are the natural gas, oil, and coal market combined. Because they choose to keep playing with
those markets, they don’t have a choice to get out. They’re not going to leave the entire population
without electricity. That’s the reason we have climate change. It’s the reason we decided on oil 250 years
ago and the reason why we have climate change today. So, I think the main point that people obviate is

pg.
117
that it is not a production or regulating or government thing, or even the good guys against the bad guys.
This is just what we chose. We chose petroleum and it worked out well. All of this was built with
petroleum, and now we’re accepting that we’re, you know, taking the consequences. But, if people choose
another alternative energy, we wouldn’t have climate change. We could overproduce whatever we want.
It wouldn’t pollute – it would throw carbon emissions to the air.
M: Carbon among other things…
EA: Yeah.
M: Nasty Sulfur…
EA: And Mercury…
P: I can’t wait for the day that mercury is not in the ocean.
EA: That’s another market that’s going to emerge. Every single problem that you see on climate change is
an opportunity to actually help out the world and make a lot of money for it. It’s true. People don’t see it
that way. People talk about “green” jobs and say “green” jobs don’t exist, or say that “green” jobs must be
terrible, but these are “green” jobs! I have a green job and I can make a lot of money saving the
environment. You know? It’s a good deal.
E: So, you’ve worked with children in the area on environmental education? What are some specific
activities that have worked well?
AP: They like videos a lot. I think that with – usually I’ve taken up groups that are either older kids that
are eleventh or twelfth grade and I’ve taken a lot of – from seventh to twelfth graders mainly, so having a
little game on a table doesn’t work with them because they’re not that small. What’s worked best for me
is I’ve tried to be funny and that works sometimes. But, videos and talking. They like to talk about cute
animals, like if your talking about the river you have to relate it to the manatees. And them seeing – you
tell them all these things about the river and the structure of the mangroves for example or the
contaminant or sediments on the river and then you show them a video of the manatee and you explain to
them why this manatee could be hurt by all these things, and that really gets to them. Like seeing that
leatherback turtles or the actual reefs – how pretty they are beautiful a healthy coral reef looks and how
horrible an impacted coral reef looks. Those things actually hit home for them. That’s what’s worked for
me.
M: Would it hit home even more so if it was species that are endemic to this island such as the coqui?
AP: Yes. Exactly. And, anytime I do my presentations I work with species that are native to the island
and are native to the areas where they are around. So, I can also help you with that to try and identify
what species are going to be more relatable to them that they’ve seen in their lives and that are close to
their neighborhoods. I could definitely help you out with that.
M: That would be great since we did look into trying to fit certain species like the Puerto Rican parrot,
certain species of coquis that are endangered because of human activities that are tied to climate change.

pg.
118
AP: Yeah, and with the Puerto Rican parrot, these kids live there in Rio Grande and there’s a parrot
rehabilitation center in El Yunque, but they’ve never seen a parrot in their lives. Most Puerto Ricans have
never seen a parrot in their life. Eduardo has never seen a parrot in his life, and that’s why – the only
reason I’ve ever seen one is because I actually went to the center.
EA: I never got invited.
M: I don’t have any other questions. Do either of you have any other question?
E & P: No.
E: Well, thank you very much for sitting down with us.
AP: You’re welcome!
E: This will be very helpful!

pg.
119
Interview 7: Isabel Rivera
Archeologist, University of Puerto Rico, Rio Piedras, Department of Sociology and Anthropology
Date & Time: November 10, 2014; 1 p.m.
Princesa (P): Is it alright if we record this interview, so that we can have a transcript of it so that we can
refer to it?
Isabel Rivera (IR): Yes
P: Okay thank you.
IR: Yep, no problem.
P: So our first question is, what your area of expertise is? Kind of like what you do…
IR: I specialize in environmental archaeology. And within it I have three specialties which are climate
change, landscape reconstruction and ecological context of coastal invertebrates, particularly mollusks.
P: With that do you have any maybe environmental education initiatives that you also are a part of?
IR: Do I have what?
P: Do you do any sort of initiatives with maybe environmental education or just maybe an outreach to
people about what you do at all.
IR: I have a subject currently running that involves citizens, so my project calls for integration with
citizens with an interest in environmental subjects to work with us in a research where we are
investigating how people have impacted what has been the long term impacts on the Grand de Manati
River (inaudible) and in relationship to environmental change. So in that context, where we are doing
surveys of the general area, we are incorporating the public and we are using informal education to talk
about climate and environmental change and how people respond to or effect the environment from a long
term perspective so in general terms. In that sense, I consider that outreach because we are using informal
education and research to show people how knowledge is (inaudible) and people. SO we integrate the
knowledge, the local ecological knowledge, into our project. In addition to that, I am part of the ILOC?
Industrial Latino (inaudible) Climatico. I am collaborating with them as well. So currently I have a
course, last semester I taught a course on the archaeology of climate change. So my students are asking
me to expand the program for an additional semester. I am currently working with them, it’s an individual
study class where I have 6 students and they are doing research on climate change in Puerto Rico during
the last seven thousand years. And for the start of that research, we’ll go through the ILOC? Industrial
Latino (inaudible) Climatico, we’re also incorporating what are the main concerns that people are
identifying in contrast to the main concerns of the government. And we are in touch with the communities
and we will be publishing our results in a scientific journal, in the general newspapers and media.
P: Do you find that when you do this sort of outreach with teaching people using the research, do you
find that to be particularly effective? Do you think people respond well to it and that they learn from it?
Do you find that it can be improved? What result do you see from doing those outreaches?

pg.
120
IR: In terms of the community, or my contact with the general public, the research of the citizen program,
it is a project in which we are investigating how informal education works for the information for the
public. So its not just my project, my project is intended to be a larger project. We have statistically
analysis of some of what we are doing and we interview people before, during, and after working on the
project to make sure how effective our methods are. And so far we have (inaudible) an hypothesis.
Especially on the archaeology project that I direct, the research itself is not just archaeology. So what
concerns the archaeology problem, our methods have proven to be very successful in conveying our
concerns and gathering the concerns of the public, informing our behavior. As people have given a very
(inaudible) reviews of our project, so it is just hypothesis, and it is just informative. In terms of my
teaching at the university, I also have observed positive results and I have seen people changing their
behavior towards climate. And the fact that I have these students that have continued with me, and are
currently developing and implementing new ways in which they can share our discoveries and our
information with the public that is also very encouraging. So I believe in the project because I have been
working at the university for just 32 years. I have been working on this project for a short period so far,
but I have had a very good result.
P: For our project we are developing a climate change curriculum for middle school students in Rio
Grande, we hope to do sort of a pre and post test to measure its effectiveness, kind of like what you just
mentioned. We kind of want to research how this is effective, like how it is known to be effective to have
a pre and post-test, how to develop one. Do you have any sort of resources we could look into?
IR: I could put you in contact; give you the address of the people who are working of that aspect of the
project. And I can give you their information Ruben Esperera, from the Puerto Rico. And I think you
could directly contact the (inaudible) project we also have already have some publication, they are mostly
in the form of posters. But we are still writing our results because the project is not over yet, so we are
still working on our results for a more wider publication. But I think it might be best if you go ahead and
directly contact (inaudible), she is the CI of the project. So she could give you a summary of our results
and informal education and what aspects are working and how you can measure your progress before and
after we develop our forms, (inaudible). So everything has been very particular; it’s a complicated
project, evaluating your concepts but it is very rewarding. If you send me an email reminding me, I can
send you all the contacts.
P: We will make sure to email you a few minutes after we finish up, that would be really great. Thank
you so much. Go back to the questions of climate change, what are the main issues or impacts that you
observed in Puerto Rico from climate change?
IR: What type of impacts are you referring to, because the impacts can be very broad? Do you mean
social impacts, or natural impacts or what specifically are you referring to?
P: I meant natural impacts, and then also social impacts but as two separate sort of questions so if you
could first please address natural ones if you have observed any.
IR: Well that’s a very very very huge question. In terms of natural changes, there has been a very wide
variation on precipitation ranges, and temperature changes, and seasonality and I am referring to big
perspective. I work in a much larger context than like the last one hundred years. We are working on the
last seven thousand years; that is the whole story of people living on the island. In that sort of big scale,

pg.
121
we are seeing changes in precipitation, temperature and seasonality, you know how the difference
between summer and winter and also in the frequency and intensity of storms. Actually the paper that
they are writing at the moment is referring just to the last hundred years. In order to understand the last
one hundred years, you have to understand at least the last five hundred years if not more. After the
maybe mid 19th century we finished what is known as “the little ice age”, it what was a period that was
very cold and dry. And after that the climate has been more rigorous with more precipitation during the
19th century. But the last one hundred years have been in a trend of drying up and dryer than “the little ice
age”. So the main impact is not going to be solved immediately, but possibly in a hundred years time,
then we are going to be in the drying trend. But at the moment we are in a rather wet period, we consider
the last seven thousand years. And the moisture level at the moment is actually pretty similar to the
conditions that were prevalent ten thousand years ago.
P: I was going to ask if this drying that has been occurring, is this drying a natural sort of drying or is it
anthropogenic or perhaps is it…
IR: There is a combination of factors, certainly the climate during the last hundred years, and there are
some others that support finding the beginning of the trends that we are experiencing at the moment
starting in doing the revisioning in 1950 and that’s why we recording the last period, the period where
humans have had the strongest impact in the environment. But, it is never that simple. So if the current
climate change is anthropogenic only, that is a mistake because there is never a single factor. However,
the climatic process which is so complex, responds to the series of interconnected connections globally.
There are changes that are natural. In the case of the last one hundred years, human’s activity has had a
particularly significant aspect in some of the factors that regulate climatic trends. The main impact that
we will be seeing or the main impact of the climate that we will experience in approximately the next one
hundred years, most climatologists agree that those characteristics will be affected by the increase in
greenhouse gases and other aspects and deforestation and other aspects that are directly linked to human
activity. However, it is naïve to say that human activity, that climate change is caused by human activity,
because it’s not. It’s a combination of human activity in the last one hundred years and natural processes.
So it’s a complex scenario of factors that are affecting one and the other. Certainly, especially in the last
one hundred years, we can see the effects of human activity in some of the main aspects that affect
climatic characteristics.
P: So as far as social impacts of this kind of climate change, have you observed any of those? Maybe
socioeconomic, on culture, or industry…
IR: It’s just as complex, I would never say something is a natural catastrophe because crises are not
natural they are social. So whenever we say there is a natural disaster, it is not necessarily a natural
disaster it’s a social disaster. Its people that suffer because of the way they have organized their society or
how they depend on things. In the case of Puerto Rico, we have six thousand years of human activity on
the island and in those six thousand years, there is many hundreds of thousands of, millions of people that
have lived and modified our ecosystem. So whenever we have changes and we depend on particular
aspects of the environment, we have to acknowledge that people have changed the environment. So in the
case of social crisis, or in response to climate change, in the past we had a severe crisis six thousand years
ago. So for example, six thousand years ago we (inaudible) and this affected the entire Caribbean. They
have the movement of people all around. Four thousand years ago, you had that movement of people and

pg.
122
the redistribution of people and that affected archaeology in different ways. One thousand years ago, there
was a decrease in moisture and precipitation on the island. So you had dryer periods and that also
simulated a high movement of people in what already was established in the Caribbean as a long distance
network, social-support network. And along those social-support networks, as there were droughts in
other areas, there was a movement of people coming into the wetter areas. And that also affected
(inaudible) and to understand that in particular. During the “little ice age” there were also changes in the
intensity and frequency of hurricanes, and people were dependent on particular resources from Europe or
from the business on the island and fruits that might have been affected by hurricanes. And so this would
be a record of crisis and there are historical records of people making the best out of climatic conditions.
So whenever they would have good climatic conditions or different distribution of precipitation through
the year, people would take advantage of those things. So, sometimes social responses to climate change
are not always negative. There are also positive responses to climate change. In the case of current Puerto
Rican conditions, our society is currently highly dependent on particular and very specific mammals
options for the system. So first we depend on imported product, so we are displacing our vulnerability.
Also, if we were going to change that, say that if something happens so that we couldn’t import our food
any more than we are going to be severely affected by the fact that we have lost, through our ecological
knowledge, we lack productivity of our land. So that is another problem that we going to be facing. And
actually, what I find most worrying is the impact of precipitation on the production of the system’s
resources (inaudible). However, the government is focusing on the loss of coastal lands so they are more
concerned with sea level rise and how we are going to be losing the characteristics of the current coast
and that may not be the main problem that we are going to be facing. There is a difference between what
we are going to be facing due to climate change and the priorities of the climate change council for Puerto
Rico. So, that is something that needs to be addressed. But there is something to take away, with sea level
rise we are going to be losing one, and we are also going to be losing the sea as a resource (inaudible) and
the exploitation of coastal resources and the acidification of oceans. So all those factors, so if we are just
going to simplify a condition that might present a problem in our society at the moment, food production
would be one of the main issues because of our vulnerability. Because we have lost the ecological
knowledge of how to make the best of our island, we are currently dependent on others to supply our food
and to supply our water. In our recent past, at the beginning of the 20th century, most houses had water
storage and would gather rain water and that would be stored in the houses. So they were less vulnerable
to a lack in water. At the moment we depend on the government to supply water to everyone. So there is a
loss of knowledge that increases the vulnerability.
P: So if these are the main issues that people are vulnerable to as a society, what ways so you think people
can adapt to make themselves less vulnerable as the global climate changes?
IR: (inaudible) increased knowledge, and increased investment in, identification of options to apply in
case your main option failed. So definitely I would argue for an investment in local agriculture and all
these ecological projects and an investment, and it’s not because I am an archaeologist, in archaeology
because as archaeologists we can gather information that has been lost, the knowledge that has been lost
historically. So we can show people what has been done in the past and what these people used because
the magnitude of climate change that we are going to be experiencing in the near future, is not something
that has never happened before, the magnitude of change has happened before. We have had in the past, a
strong variability in climate and people in Puerto Rico have responded to it. So we can use archaeology to
recover that knowledge and increase our resilience to future change. So aside from increasing knowledge,
pg.
123
we need to empower our people to produce their own product, so other ecological products are certainly
the way to go, especially if they invest in usable food, and not just earth, and not just the supplies for
meals but trying to supply people. Certainly we need to reduce our carbon footprint. And to realize that
we live in a tropical island we cannot expect to consume so much energy modifying our small, baby
environment using all this air-conditioning. So we need to not consume so much energy. So there are
some other aspects to consider in terms of our consumption, to reduce our consumption and reduce our
misused production. And increase our production of food and the way we manage our portable water
because those are the main aspects that we are going to be facing soon. But the first thing that we need to
address is knowledge, so we need to increase how people understand and how people identify options to
respond in one facing crisis and increasing the number of available responses that they could be facing
even if their options (inaudible). For example, if we know that sea level is going to rise, we cannot expect
the government to supply and restore the problem. The government cannot stop sea level rise. So the
people need to know that sometimes they will have to move, and they will have to be less costly to
relocate or stay in the place trying to invest more to keep things in a static state without changing. Change
is going to happen and we cannot avoid it. So that is one of the things that is important, and we can see
that archaeologically. In the past, there was a period two thousand years ago, of particularly high
precipitation that involved a lot of instability in the rivers and the adaptation strategy that locals used was
relocating to a different location. And two hundred years later when the precipitation reduced in the area
became stable then they returned to the area that they used to inhabit in the past. So that is one strategy
that we can see from the archaeology perspective as well.
P: In terms of education, do you think that it is important to address any certain group over another? For
example, maybe youth or maybe people within a sort of adult age range? Or do you think it is best to do
sort of an all-around education…
IR: I think all-around, I think everyone needs to be involved in an education program. However, I don’t
think education problems should be seen as linear. I do not think that a program where I go to a school or
a community and I say “Hey guys, I am going to teach you about climate change and how we are going to
survive”. That will never be successful. In order for change to happen, it needs to integrate the
community. The decision needs to come from the community itself, as well as the threats that they feel
they will be facing and the process of identifying threats. In order for change to happen, it has to come
from the community and the entire community needs to be concerned. For example, we have had in
Puerto Rico many times in which people have tried to refuse disposal or change attitude to throwing away
garbage all-around. And whenever, it is a program in which you have someone outside of the community
or a foreigner or a person external to a community that comes and tells everyone “Hey you have to start
throwing out (inaudible) on the road” it never works. You might have ads or you might have an
investment in an educational or there is an ad in the news or the cinema or a lot of people at meetings or
programs or things like that. But the attitude at the end does not change, because it is external. But if
change comes from the community itself, then it will be long term. That’s why I feel that our project is so
successful in Manati, because we are integrating the community at the community level and we are
respecting their own interests and their own goals. So in order for things to be successful, there needs to
be taking into account each community in particular and the threats that community will be facing. And if
that’s with children, which I know is your main objective for developing a curriculum for schools, it
should start with (inaudible) and you should try to reach the parents. But, even if you change the children,
it will not directly change the parents. And the parents can also affect how much credibility the children

pg.
124
can give to what they learn in school. So it would have to be an integrated program, to involve whole
communities and not just those from the school.
P: So I don’t think we have any additional questions, so we will send an email about the contact
information for the other people involved that project.
IR: Okay
P: Thank you very much.
IR: And also, in terms of education, environmental education, I think you should talk, specifically about
the education program and how to educate communities, you should talk to Frederico Cintron-Mistoso,
the guy that emailed me. So if you talk to him directly, ask him directly about education, and community
activism from an anthropological view, he is the guy to talk to because that is precisely what he does, he
specializes in education from an environmental point of view and he is involved in communities in that
area. I would strongly suggest that you talk to him as well.
P: We actually just did on Friday, so it’s kind of funny you mentioned that.
IR: Cool.
P: Thank you very much.
IR: You are welcome let me know if there is any way I can help.
P: We will. Thank you.

pg.
125
Interview 8: Isabel Pares Ramos
Environmentalist, Landscape management researcher
Date & Time: November 13, 2014; 9:30 a.m.
Emma (E): Do you mind if we record you?
Isabel Pares (IP): No. It’s okay.
E: So, as I was saying, with our project so far we’ve just been doing interviews with people like yourself
and next week we hope to start interviewing teachers and start developing the lesson plan that we will test
out on a ninth grade 4-H group in Río Grande at the, I think it’s the Palmer school. So, that’s our progress
so far.
IP: Are you using, like, a model. A model of a curriculum that you would like to develop for Río Grande?
E: We’ve been researching lots of different climate change education modules online and such and kind
of we’re going to use those as inspiration for our lesson plan, but we don’t exactly have a – it’s our task to
create it on our own with using different inspiration.
IP: You know, if it is the first time that a club 4-H develops climate change curriculum here in the island?
E: I’m pretty sure. We don’t know yet. We’re waiting to talk with the teacher we’re working with on
Friday, tomorrow actually, and so we’re going to talk with her and observe one of her classes as they take
a field trip to El Yunque.
IP: Oh, great!
E: So, We’ll have to wait to see what her opinions of the project are and such.
Princesa (P): So, as far as our questions, our first question is: we would like to know what your area of
expertise was.
IP: Well, I did undergrad in environmental science and geography here at the University of Puerto Rico
and then I did a masters in international cooperation and urban development. I’ve been mixing both of
them in terms of research. I’ve done a lot of scientific and social research for the past ten years and I’ve
worked with land use change with the human dimensions of environmental change, demographic changes
in Latin America, usually from the university ecology lab and with the forest service.
P: Going off of that, what kind of organizations or environmental education initiatives have you
participated in or that you were a part of.
IP: Well, environmental organizations, they’re a lot here in Puerto Rico. When you’re studying
environmental science, you are very into it. The major ones such as in San Juan: the Eletuaria de San
Juan, that’s a big one. It’s a unique project that is over twenty years old and they’ve been restoring the
whole around the San Juan basin area. That’s an important one. I have also founded my own organization
but I work with a different type of environmental issues such as transportation and CO2 emissions to
reduce CO2 emissions by having a carpooling project, the first one in Puerto Rico. Very dependent on
what you’re looking for.
pg.
126
P: So where in the island have you focused your studies? You mentioned San Juan just now. Is that really
where you primarily work or have you worked in other forests or anywhere else on the island?
IP: Well, in terms of landscape, I’ve – Usually my work is related to remote sensing so I work at the
landscape level. That means the whole island and usually from cartography lab you work a lot with maps
and with GIS and you look at the island as a whole, not into a specific forest. My research was about land
use changes in Puerto Rico from 1990 to 2000 and how population changes affected those land use
changes like agriculture, forest expansion, and deforestation. That was ten years ago that I did that
research but more recently I’ve been looking at – I work at El Yunque on the Atlas project looking at
different environmental factors. Social factors economic factors, around the municipalities that are in El
Yunque, the forest.
P: What sort of landscape change have you found? I’m just curious. What kind of, over the past ten,
twenty years, what changes have there been?
IP: Yeah. That last study revealed that most agricultural lands that are being lost was due to suburban
development. Many people talk about deforestation and the island was truly recovering. The forests were
recovering ten years ago because people abandoned farmlands and they migrated to the city. So, those
lands become abandoned and they started the process of natural regeneration. As well, people were
moving to the suburbs because it’s cheaper there so that expansion also – they expanded in primary
agricultural land around coastlands, around the coastlines, and also areas that are now very steep. You can
see how the plants and landscape is changing.
P: What studies have you done specifically about climate change in the Caribbean or Puerto Rico? I know
you’ve done studies about different aspects like landscape usage, but what about them might be more
reflective of climate change overall?
IP: I’ve only been working with climate change for two months now. I just started this project that I
presented at the symposium last week. I’ve only been working for two months in there, so the first step of
the project is make a vulnerability assessment of agricultural lands and forestry - how vulnerable it is to
climate change. We’re working on that right now, so it’s very – I think that’s going to be the first study
related to climate change we’re going to do, looking deeply into variables and what’s happening around
the island.
P: Is there anything that you have found so far that’s maybe a common trend or something?
IP: The lab that I work at, they’ve been looking at climate data, and so far the models say that in 2100 the
island is going to be very dry, so we’re going to have a lot of changes in our life zones, a lot of changes in
where you can grow things and that’s a very important aspect of climate change. You need to really look
into the future. We’re just starting to look at what are the effects of droughts, of changes in rainfall
patterns, in the agricultural sector, and what that means for production. I don’t know if you guys have
heard about the drought that happened in Puerto Rico during the summer. It was just a couple weeks
without rain and that was devastating for the island. That’s just a small proof of what can happen in the
long-term when the island gets drier and drier, as we have no good adaptation practices.
P: Is that dryness a definite reality? Is that a definite? Or as the land has been reforested – I mean I read
somewhere that reforestation helps cool the island because of, just, the natural processes of different

pg.
127
cycles and different gas cycles. If that continued, would that fate be, on the island, that it would still
become drier or is it possible that it changes?
IP: Well, the analysis, they are based on patterns of annual rainfall and annual temperatures over already
reforested today – and the patterns still, the weather is going to get drier and hotter, so the trees, they
grow slower. Many species grow slower on those parameters. The maps are showing that we are going to
have, under different scenarios of greenhouse gas emissions, depending on the scenario and depending on
development and industry production, you’re going to have a between one degree and five degree
warming. That’s kind of how it’s looking.
P: Celsius?
IP: Yeah.
P: So, you kind of touched a bit upon what those – what the impacts of that kind of drying would be.
Could you maybe go into a little more detail about the climate change drying up the island?
IP: Well, that’s not really my area of expertise, but I can tell you that definitely we have no water, then
this drier climate means a lot of stress – environmental stress – because of lack of rainfall, lack of water,
hotter winds, etc. There can be many plagues as well, many diseases that would affect not only agriculture
but also the healthy forest, not to mention the social impacts of all these environmental dynamics, but
we’re talking about the ecological impacts you can have. We are an island, so our coastline is going to be
really effected. We don’t have that many sources of potable water. Many of our waters are underground,
and if those aquifers get dried, then we are going to have a lot of issues not only for the population, but
also for agriculture production and forestry.
P: So, from the social standpoint, what would be the effects there?
IP: Well, of climate change in general? What we have is many people live on our coastline. We have a lot
of communities that are going to be affected by see level rise, by the impacts of extreme weather events,
as much of our population is very vulnerable already. They, if you see the map of coastal communities,
many of them have water intrusion and their houses are affected. Farmland is affected already by water
intrusion, so, we are a country that is not prepared for – we haven’t started the adaptation processes yet.
So, I think it’s a necessity that we start educating people, especially young children, to start thinking
about what we can do: what we can change in our everyday behavior and the way we build a country just
to make it more resilient to climate change.
P: Why especially in children?
IP: Because it’s more different, I think, when you’re trying to the perception of adults here. And,
especially children, they’re still living here. When you get a young adult, here the social conditions on the
island are not that stable, so they’re leaving. Many people are leaving everyday to live in the states, so
you’re educating people that are going anyway go and live in the States, so it’s better to educate the
children that are going to live here for a long time and you need to start from a young age, understanding
what are the implications of climate change under today and also in the future because that’s what’s more
important.

pg.
128
P: So what kind of aspects of climate change do you think the public might be unaware of?
IP: Maybe the effects on food production. But also that’s a challenge as well since we don’t produce a lot
of the food that we eat. Mostly, we import 85% of all the things that we eat and at the same time, climate
change and the effects – it’s all going to affect food supply exchange on the island, so trying to link
climate change with food production and how it affects us, like on the table of what we eat, what food is
accessible to us today that is not going to be for us in the future, what can we start producing. Maybe it’s
a good opportunity to start looking for ways to improve the relationship between children and the
environment, and try to motivate them to grow their own food, to be more resilient to climate change and
talk all about food security and all those concepts that people are not really taking into account today
when they make decisions on how to act and what’s their relationship with nature.
P: So for that food supply, that would have to change again how the landscape is used I would think.
Right?
IP: Yeah.
P: How would it change? You said there was a migration of people toward people living in urban and
suburban areas, and then there was that benefit that there was some reforestation from those agricultural
lands. What would have to be done to maintain that balance not having as much deforestation as there
was in the past, but being adequately able to supply food to adapt to climate change?
IP: That’s definitely the dialogue, the discussion; what method of production and system we’re going to
adopt produce food for 3.7 million people. We’re definitely not going to reach – we’re not going to be
able to produce enough food for everybody, but we can start with some crops and some commodities that
are very important for the diet of people here. You have many options today. Not only technological
advances, allow you to produce more, but there’s also many ecological ways to produce food such as
agroforestry and agricology. They are looking and many people on the island, especially the small-scale
still, are looking at those practices to see and to show the rest of the people that it is going to be possible
to grow food without really cutting forests down or going back to those intense agricultural practices that
were very harmful for the soil, the consuming of water that are not really the best ways to move forward
when you’re thinking of climate change and the impacts it’s going to have already. But if you want to go
back to those practices that are not ecologically sustainable – They’ve started to look at different methods
of production, but that’s still under discussion.
P: Out of curiosity, if you combined agroforestry and urban gardening and urban farming, do you think
that those coupled together would create enough food for everybody? If every household, or every other
household had a plot of beans or something?
IP: It would be amazing but I haven’t done the calculations or anything. But, the problem is that we have
a lot of people living here and especially in urban areas and urban areas are very decayed and there are
not many green spaces. I think there are many potential areas you can rescue to build urban gardens but
you would need to teach many people how to grow their own food, because they lost that know-how and
have no connection with the land. They lost that so they don’t’ know how to grow food, so you really
need to educate them first before trying to follow – to promote – urban gardening and other stuff because
you need to have people that can manage that in the long-term. There are areas that could be rescued for
pg.
129
that. Many, many areas in San Juan that I can think of and all around the island, but how do you convince
people that that’s the right way to go? That’s another question.
P: For our curriculum, like you said, we’re trying to educate children, which you said is really important.
That is really what our curriculum is aimed to do. What do you think would be something that would be a
good thing to teach, or maybe a good activity to help people adapt to climate change and learn about the
effects of climate change?
IP: Well, since I’m working on this project that is related to food production I – it’s amazing how
neglected the figure of a farmer is. I think many children, they don’t recognize, and they don’t value what
a farmer is because they come from, you know, urban neighborhoods. They are not connected to the lands
and it would be amazing to just try to promote. Kind of to teach children the importance of working the
lands. Not only as a farmer, but working as a forester or just a profession more related to building a
relationship with the land that human people don’t mention. I think that if you ask many children, they
don’t know. They don’t even know where food comes from! Just visiting farms or just teaching them that,
really, where your tomatoes come from. The answer is not from a supermarket because they really –
they’ve never asked themselves where food comes from and maybe they’re not even aware of the
capability that they have when they learn to grow their own food. So, I think that’s very much some
aspect that needs to be tackled, you know, to just make agriculture an attractive thing, like farming is
attractive or forestry is attractive. All the kids, they want to be lawyers or doctors and everything because
that’s what society tells you is good, but those other professions are really neglected and I think it would
be very interesting to see how kids react about being more closer to the land – working the land.
P: As we develop our lessons, then should we do something like that where we have, maybe, a lesson or
activity that has “here’s where we talk about food”? Is that a thing you suggest would be a good idea?
IP: I think it would be. It would be fantastic. Also there are many traditions and knowledge about
growing food that has been lost over generations that are simply not connected to the land, and it would
be a good opportunity to rescue that know-how and traditional knowledge that people have of how to
grow food here. Especially crops that are very local like yuca, yautía, or even beans that people will eat
them everyday but we don’t grow them anymore because our food, our local cuisine, is mostly imported
because we lost the control of the production on the island. So, I think that would be very interesting and
that is connected with nutrition that’s connected with just empowering kids to be more conscious about
what they eat, to be more healthy, so I think it’s like a circle. If you talk about health, like club 4-H it is
very important – the health part. So, you can connect that with nutrition and food production. Maybe
developing some skills in kids that help them in the future to be more independent in terms of food
production.
P: Can you think of any other questions?
E: No, I’m good.
Michael (M): I can’t think of anything else.
P: It seems like that is it. Thank you.

pg.
130
Environmental Specialist Interview Coding Charts
Filipe Cano
Climate Change Education Public Opinion
Eco-friendly use of land Agroforestry initiative Unaware of entirety of climate
change
Behavioral adaptation Children’s Forest Very complex, very scary
Change in rain patterns Use of art
New diseases Hands on education
Elfin Woods Warbler Video
Habitat shift Photography
Food webs Planting trees
Nutrient cycling Interactive social map
Extinctions Smartphone app
Coastal flooding
First component- “what is
climate change? What is climate?
What is weather?”
Adaptation- Improving local
habitat Dog Analogy
Adaptation- reduce heat island
effects/ plant trees
Don’t go too deep, lose them
very quickly
Adaptation- practice recycling
habits Challenge them
Effect of Endemic Species Relatable
Superficial intro of greenhouse
gases
Optimistic
Nature Watch (group)

pg.
131
Edgardo Gonzalez
Climate Change Education Techniques Public Opinion
Changes in coastal areas
Develop initiatives to educate
people about climate change
adaptation
People are not really concerned
Infrastructure Start by understanding the basics People don’t see it “in their
backyard”
Loss of coastal resources As simple as possible “It will not happen to us”
Patterns of rain
How it will affect student, tier
out to larger and larger scales of
relevance
Haven’t received enough
education on topic
Adaptation: Alternative uses for
coastal areas
Make it understandable at
personal level
Doesn’t seem to have an
immediate effect on lives
Adaptation: Monitoring the
changes in the climate
Adaptation: Infrastructure
(construction)
Agricultural Adaptation:
Changes in pest management
Agricultural Adaptation: Develop
new agricultural practices
Coastal erosion
Coastal changes = Impact on
tourism activities
Coastal changes = Impact on
fishermen
Effects secondary economic
recourses

pg.
132
Carolyn Krupp
Climate Change Education Techniques Public Opinion
Rain events and weather
patterns are changing Project Learning Tree
Temperatures are fluctuating Hands on learning
Conservation education
El Yunque should be more
involved in education
Conservation and conservation
ethics
Big picture – global-ness.
Show how things have
changed locally/regionally
Outdoor learning opportunities
Learn about the impacts of
climate change on area
Expose students to rivers and
watersheds
Interconnectivity

pg.
133
Federico Cintron-Moscoso
Climate Change Education Techniques Public Opinion
Loss of coast?? Sierra Club Environmental education not
taught in public schools
We live in a globe Need to learn how to live with
the environment
Sustainability
Need to understand the
environment
Process in reflection (on
climate change)
Knowledge of environment
and our attitudes about the
environment and identification
of criteria to make decisions
about future.
Make local and relevant
Convey the sense of
understanding to beyond
classroom and home.
Photos
Videos
Learn to identify abnormalities
that result from climate change
Guideline for teachers
Encourage research
Integrate research into lesson.
Ex: interview someone in the
area that has been affected by
climate change and ask how
things have changed.

pg.
134
Marcela Cañon
Climate Change Education Techniques Public Opinion
Low increase in temperature Conservation No interest, no knowledge
Birds are migrating later or
earlier in the year
Be a part of the solution-
prevention
That’s something major- not
related to me
Fossil Fuel production Make it relevant
Mitigation Adaption- agriculture and the
river
Change in rain problems Keep it basic
Sea level rise How what’s happening in the
world can affect you
Photosynthesis Build it to be more complex
Relationship between sun, soil,
water, plants Public hearings
Hole in the Ozone Tools created by NASA, etc
Effects on tourism and
hospitality Videos
Coast disappearing List of references for teachers
Renewable Energy Intersperse lecture with
activities
How it is market based
Explain the different complex
figures

pg.
135
Ashley Pérez and Eduardo Agostini
Climate Change Education Techniques Public Opinion
Small island Sierra Club Outside of their reality
Large impact by sea level rise
In the middle of a
hydrographic zone- Rio
Grande
Don’t acknowledge it as a
problem
Disappearing of corals Videos Don’t fully grasp or
understand it
affect micro-ecosystems Cute animals
Coasts disappear Comparing an effected region
to a not effected region
Precipitation change
Extinction
Connectivity of Nature
Impact on pharmaceutical
industry
Renewable Energy Market
Megawatt farm
Recycling business
Business, government,
community on the same page
Scarcity of resources
Endemic Species

pg.
136
Isabel Rivera
Climate Change Education Techniques Public Opinion
Wide variation of precipitation ranges Integration with
community
Knowledge about the
productivity of land
Variation on temperature changes Respecting interests and
goals
Knowledge of the past and
how they dealt with
climate change
Seasonality Involving parents
Social responses to climate
change aren’t always
negative
Frequency and intensity of storms
Drying trend
Human’s affect on climate
Increased greenhouse gases
Deforestation
Climate change is not solely caused
by human factors
Puerto Rico is dependent on certain
mammal species
Dependence on imported product
Sea level rise
Loss of coastal lands
Exploitation of coastal resources
Acidification of oceans
Vulnerability of food production
Dependent on others to supply water
and food
Adaptation- produce own product
Adaptation- not consume as much
energy
Adaptation- reduce our misused
production

pg.
137
Isabel Pares Ramon
Climate Change Education Techniques Public Opinion
Agricultural lands being lost
due to suburban development
Adaptation: Educate people,
especially youth, to think
about what we can do
Island has no good adaptation
practices
Island expected to be very dry
by the year 2100
Motivate students to grow
their own food
Drought on island as
devastating
Improve relationship between
children and environment
Weather is going to get drier
and hotter
Teach children the importance
of working the lands (farmer,
forester, etc.)
Changes in precipitation make
trees grow slower
Make agriculture an attractive
thing
Between a 1 and 5 degree
warming (Celcius)
Rescue traditional knowledge
and teach it to
Drier climate = environmental
stress
Connect students with food
production
Diseases and plagues
Effect on coastline
If aquifers dry there will be
issues with population,
agriculture production, and
forestry
Sea level rise
Extreme weather events
Water intrusion
Effects on food production
Effect food supply exchange
Adaptation: Agroforestry and
agriculture and urban
gardening

pg.
138
Educator Interviews:
The following interviewees were selected by and were deemed to have significant knowledge and
expertise in educational topics.
Interview 1: Amabel Soto
Ninth grade mathematics teacher, Carmen L. Feliciano Carreras del Sector Palmer Middle School, Río
Grande, Puerto Rico
Date & Time: November 18, 2014; 11 a.m.
This interview was conducted in a mixture between English and Spanish. The following transcript has
had all of the Spanish portions translated into English, with the original wording in parenthesis next to
the translation.
Michael (M): And we’ve started
Princesa (P): Can we remember you? (¿Podemos recordarse?)
Amabel Soto (AS): Record (Grabar)
P: Record! Record, excuse me (¡Grabar! Grabar, permiso.)
AS: Yes (Si)
P: Okay. First I wanted, uh, we want to know what subject you teach, but – (Primero quería…uh
queremos saber cual tema usted enseña, pero –)
AS: The subject from today? It’s transformations, and there are different types of transformations. There’s
reflection, rotation, and translation that we’re working with. (El tema de hoy? Son transformaciones, y
hay diferentes formas de transformaciones – transformations – esta reflexión, rotación, y translación, que
la estamos trabajando)
P: But you work as a mathematics teacher, yes? (¿Pero trabaja como maestra de matemáticas, si?)
AS: Mathematics, yes (Matemáticas, si.)
P: What subjects do they offer here [at this school]? So, there is mathematics and there is English, but
what else? (¿Cuales temas se ofrecen aquí? ¿Entonces, hay matemáticas y hay ingles pero cual más?)
AS: Ah, Spanish, social studies, English, and some electives like visual arts. Eh, here there is theater,
music, art, physical education, home economics, and industrial art. (Ah, español, estudios sociales, ingles,
y algunas electivas como bellas artes. Eh, aquí esta teatro, música, arte, educación física, salud,
economía domestica, y arte industrial.)
P: How long have you been teaching for? (¿Por cuánto tiempo ha estado enseñado?)
AS: For twenty years. (Por 20 años.)
P: And here? (¿Y aquí?)
AS: Here, eighteen. (Aquí, dieciocho.)

pg.
139
P: And what grade do you teach? (¿Y cuál grado de estudiantes usted enseña?)
AS: Ninth grade (Noveno grado)
P: Ninth, not any other grade, just this one? (Noveno, no de otro grado, solo esto?)
AS: Aha, at the moment just ninth grade (Aha, en este momento solo noveno grado.)
P: And have you always taught – (Y siempre enseñado –)
AS: I’ve always taught ninth, or I have for a while but not always. I’ve taught all grades. (Siempre he
enseñado noveno, pues hace mucho tiempo si pero no siempre. Enseñado todos los grados.)
P: Okay. Can you describe a typical day in your class? (Okay. ¿Usted puede describir una día típico en su
clase?)
AS: A typical day? (¿Un día típico?)
P: Mmhmm
AS: The students, right, arrive at the classroom and have to, right, work with the routine activity, the
day’s instructions, and then, well they go to the lesson, right, that one has planned for the class. Then,
well, one answers questions like you all saw and one gives them work to do or gives it to them the next
class. (Los estudiantes, verdad, llegan al salón de clase, hay que, verdad, trabajar con la actividad de
rutina, de las instrucciones del día, y luego entonces pues se va a la lección, verdad, que uno tiene
planificado en la clase. Luego pues se contestan preguntas como ustedes vieron y se deja haciendo un
trabajo o se les da seguimientos de la próxima clase.)
P: And do they behave well, they don’t have any problems or – (Y se portan bien, no tienen problemas o
–)
AS: In general, there’s always exceptions. (Por lo general, siempre hay sus excepciones.)
P: But there isn’t chaos? (Pero no hay caos?)
AS: No, there’s not chaos. (No, no hay caos.)
P: That’s good. Um, what tools and education styles do you use? For example you used an iPad [in the
lecture that we just observed] – (Que bueno. Um, cuales herramientas y estilos de educación usted use?
Por ejemplo, uh, usó el iPad –)
AS: The iPad, yes, the iPad, the computer, right, with different manipulative strategies. It depends on the
topic really. (The iPad, sí, el iPad, eh, la computadora, verdad, con diferentes estrategias manipulativos.
Dependo en el tema, verdad.)
P: And do you always use activities with the whoe class? So that they can – (Y siempre usa esas
actividades con toda la clase? Para que ellos pueden –)

pg.
140
AS: Well , sometimes we do work in separate groups (Bueno, a veces hacemos trabajo en grupos,
apartes.)
P: But, um, it’s not always lecture? (¿Pero, um, no son siempre lectura?)
AS: No, no. We do distinct things. Yes, especially in mathematics, it’s not just the whiteboard and
answering exercise questions. We do different types of activities. (No, no. Nos hacemos cosas distintas.
Sí, especialmente en matemáticas, no es solamente la pizarra y contestar ejercicios. Hacemos diferentes
tipos de actividades. )
P: And that, um, (Y eso, um,) is that – do you find that efficient?
AS: Yes, because what I – they see the different types of math, understand? By doing different things,
well, it movitaves them, especially in mathematics, which they don’t like, many people don’t like to do
math. But they do different things and that helps motivate them. And like we saw today, right, what we’re
going to do today, looking for things. And that helps them a lot to motivate them and make them practice
more. (Yes, porque yo lo – ellos veen las matematicas diferentes, entiendes? Hacer cosas diferentes, pues,
lo motivan, especialmente en matematias, que no les gusta, hacer matematicas mucha de la gente. Pero
ellos hacen diferentes cosas y eso los ayuda a que estén motivados. Y que vamos a hacer hoy, verdad, que
vamos a hacer hoy, buscando cosas. Y eso los ayudan bien a que se motiven y hacer, verdad, a practicar
más.)
P: So they practice more and they learn and their grades are good? (¿Entonces se practican mas y se
aprenden y sus notas salen buenos?)
AS: They get better. Always, when they study, because I can do a mountain of things in the classroom,
but if they don’t study, well, what I do doesn’t matter – Bell (Mejoran. Siempre cuando estudien, porque
yo puedo hacer montones de cosas en el salón de clases, pero si ellos no estudian, pues, nada vale que yo
– Bell)
P: But, um, Okay. Do you know if they teach climate change in this school? (Pero, um, okay. ¿Sabe si
enseñan cambio climático en la escuela?)
AS: Climate change? I believe so, in science class. (¿Cambio climático? Creo que si, en la clase de
ciencias.)
P: Okay, and you were always a math teacher, not – (Okay, y usted siempre era de matemáticas, no –)
AS: Yes, yes, yes, always math. I integrate other things for example recycling, right, in math class so that
it can integrate, well we try to have topics of all different areas including, well, environmental problems.
(Sí, sí, sí siempre la tema de matemáticas. Yo integro otras cosas por ejemplo el reciclaje, verdad, en la
clase de matemáticas para se integra, pues, tratamos de tener temas de todas la aéreas incluyendo, pues,
las problemas ambientales.)
P: So, like, what have you done specifically with like environmental things with a mathematics class?
AS: Okay, we work with volume – with the concept of volume in mathematics. So we use how to
calculate the volume of space for how to better trashcans – the capacity of trashcans. What is the

pg.
141
trashcan’s volume? So that they can know how much trash is accumulated in that trashcan and they can,
in general, and there, well, we integrate then, if we go to a recycling center so that they can bring the
materials and work with that using specifically mathematics within the concept of solid waste. (Okay,
trabajamos con volumen – con el concepto del volumen en matemáticas. Pues usamos cómo calcular el
volumen de espacios para como dar mejor los zafacones – cantidad de zafacones. ¿Qué volumen tiene el
zafacón? Para saber cuánto basura se acumula en ese zafacón y pueden, en general, y ahí, pues,
integramos entonces, si vamos a un centro de reciclaje para que ellos trajeen los materiales y trabajaran
con eso usando específicamente la matemáticas dentro del concepto de desperdicios sólidos.)
P: Um, what kind – do you ever have any problems when you’re teaching a new topic?
AS: A what?
P: Do you have like, uh, problems teaching a new topic? In a class.
AS: In a specific topic?
P: Just any topic
AS: Yes, especially in fractions. They have a lot of problems with fractions.
P: So, how do you, uh, get them to kind of overcome that?
AS: Ah, I’m trying to use the manipulative to encourage that they’re doing them. That’s is not – that is a
problem that they have, uh, from the elementary schools.
P: So, do you give them worksheets like today or –
AS: Yes
P: Okay
AS: Worksheets and some other things that they try to incorporate the fractions in say a problem that they
have.
P: Do they kind of end of getting better grades eventually or does it just kind of coast somewhere?
AS: It comes. We have a diversity in the classroom.
P: Um, and then for when you develop a curriculum and our lesson plan, how do you do that? How do
you specifically do that, or how do they do it at your school?
AS: Uh, the lesson plan? Ah, we always make the lesson plans the week before to integrate all the
activities and, not always, the plan – we can use the plan, all the things that we plan to do, but we try.
P: So when you make a lesson plan, do you, um, how do you…[To Emma] Can you take over our lesson
plan question, because I’m not sure what I’m trying to ask any more
Emma (E): Um,

pg.
142
P: I’m trying to be like, do you make, like, activities or do you plan – how in detail do you plan for a
lesson? Cuz we have to try to make a lesson
AS: Oh, that – there’s different things because, you need to have the unit that you want, the whole unit,
that you want to develop. And then you are going to part every skills, because inside that – the unit – you
have different skills. And then you are going to try with one skill each. Then when you have the plan for
each skill.
M: So it’s based off of the student’s learning objective? From this lesson they will gain this and be able to
do this after the lesson?
AS: Yes
M: Okay
P: And then for homework, uh, do you give out a lot of it
AS: Um, I’m uh, not – I don’t want to. I don’t like to give homeworks to the students, because they don’t
do it. And the other day we needed to begin with the same thing because they didn’t do it. But I don’t like
to use homeworks. Uh, it’s good if they do it because homework – they practice in the home. This is what
one would want, right? (Esto es que uno quisiera, verdad?) It’s how we want it but that is not the real
thing. Regrettably (Lamentablemente.)
M: Um, would you happen to maybe know a reason perhaps why they don’t do the homework?
AS: They are lazy. They don’t want to make anything of school in their home. There’s some students,
maybe 20% of the students want to do it because they are good students and want to make better. But they
– [the] other 80% students – they don’t want to work in home. That’s the reason
P: I’m sad to say I would have been that student
AS: Excuse me?
P: I would have been in the 80%, I’m sorry.
M: Me too
AS: That 80% don’t like it.
P: I’m sorry to all my teachers now. Um, so do teachers here do any sort of field trips or anything? You
mentioned the recycling –
AS: Yes, uh, the field trip you told? Yes we would – we have right here. Specifically the centro de acopia.
I don’t know how to say it in English but recycle –
M: Recycle center

pg.
143
AS: Recycle center, right. And we have right here in the school, but we are doing about all those things,
field trips, specifically arquitectura. They go to some places that, uh, somebody talk about how math
includes in different arts.
P: So, uh, is a field trip something where you go off of the school grounds or can you be outside and
doing something kind of outdoors but it’s still –
AS: No, outdoors right here in the school
P: So you can have a field trip where you’re doing something on the ground, but it’s a field trip
AS: Mmhmm
P: And are there ever any problems with coordinating field trips, like do you have to do permission slips
or –
AS: Sometimes. That depends on the skills.
P: Okay. Um, are you personally – do you think that field trips are really helpful for school, or for the
classroom?
AS: Yes, yes. Everything that you do extracurricular is good for the students.
P: How come?
AS: Because they have other experience that is not inside of the classroom, and they need it too.
P: To kind of make it more interesting?
AS: Yes, and they see how they can apply it – use it. For example, the math outside. How they can
integrate math with other disciplines like math with science, math with art.
P: Math with arquitecture.
AS: Yes
P: Um, do they ever do sort of big projects at the school? So like instead of one little project with the
class it’s like the whole grade does a project or something
AS: Specifically we do the project of the recycle, and we began with one group, last year, and then the
other group during this year is incorporated with the project and they are now incorporating now the
whole school to know the benefits of recycling, and use the recycling [uh? 13:56] image in the classroom.
P: So they all – are students getting more involved in that?
AS: Yes.
P: And do they like it?
AS: Yes, they like it.

pg.
144
P: Okay. Um, I guess in math you don’t really have this but do you ever have any sort of tricky or maybe
controversial topics? In math you wouldn’t really I guess. Kind of like in a science class if one has to talk
about evolution versus religion, like that becomes controversial sometimes.
AS: Mmm. No, no that’s not really math.
P: I dunno, it was on our list of questions.
AS: Yes, I know (Giggle)
P: So, that was pretty much it, do you guys have any other questions?
M: Nope
E: No
M: That pretty much covered it. So thank you very much.
E: Thank you
AS: You’re welcome, you’re welcome.

pg.
145
Interview 2: Stephanie Santos
Visual arts teacher, Carmen L. Feliciano Carreras del Sector Palmer Middle School, Río Grande, Puerto
Rico ; 4-H participant.
Date & Time: November 18, 2014; 1 p.m.
This interview was conducted in a mixture between English and Spanish. The following transcript has
had all of the Spanish portions translated into English, with the original wording in parenthesis next to
the translation. The English translations may have some wording corrections, as there was some
difficulty with the language barrier, and some incorrect word usage was understood through inference.
Michael (M): We’ve started
P: We know that you teach art class; how long have you taught for? (Sabemos que usted enseña clase de
arte, ¿por cuánto tiempo ha enseñado clase?)
Stephanie Santos (SS): Twenty-three years. (Veintitrés años.)
B: And here? (¿Y aquí?)
SS: In this school, eight. (En este esquela, ocho.)
P: Eight. What grade do you teach? Or grades? (Ocho. ¿Cual grado de estudiantes? ¿O cuales grados?)
SS: The intermediate level: seventh, eighth, and ninth. (El nivel intermedio: séptimo, octavo, y noveno.)
P: Oh, seventh, eighth, ninth. And that’s all intermediate? (Oh, séptimo, octavo, noveno. ¿Y todo eso es
intermedio?)
SS: All of that is intermediate in Puerto Rico. (Todo eso es intermedio en Puerto Rico.)
P: Okay. Can you describe a typical day in your class? (Okay. ¿Puede describir un día típico en su
clase?)
SS: Well the typical day for an art elective is a bit chaotic because it is an elective with work, a lot of
activity, sometimes very messy, but very enthusiastic because the students really like art. (Pues el día
típico de un taller de arte es un poco caótico porque es un taller de trabajo, mucha actividad, a veces
mucho reguero, pero mucho entusiasmo porque a los estudiantes les gusta mucho el arte.)
P: Why do they like it? (¿Por qué se gustan?)
SS: Why do they like it? (¿Por qué les gusta?)
P: Mmhmm!
SS: Art is unique. Art class helps you express yourself. And in art something’s not good or bad. As a form
of expression, your expression is as valid as another person’s expression. And the students have that
liberty, because in art two plus two is not four, it’s what you want. (El arte es único. La clase de arte te
ayuda a expresarte. Y en el arte, no es que esté bien o esté mal. Como expresión, tu expresión es tan
válida como la expresión de él. Y los estudiantes tienen ese libertad, porque en el arte dos más dos no es
cuatro, es lo que tu quiera.)
pg.
146
P: Mmhmm, yeah. To teach a topic, do you use special tools or educating styles like – it’s difficult with
art but when you teach a new one what do you use to do it? (Mmhmm, sí. Para enseñar un tema, ¿usa
herramientas especiales o estilos de educar como – es difícil con el arte pero cuando enseña una nueva
que es lo que usa para hacerlo?)
SS: I use a reference for teachers – a curriculum framework. (Yo uso una referencia que es para los
maestros – un marco curricular.)
P: Okay
SS: In those documents I can find distinct units, which are that topics that I work with. With an activity I
have the most freedom and it allows me and I work to the students’ liking, to their age, to the moment that
we are in. But yes I have a regulatory documentation that has curriculum maps and planning guides. (En
esos documentos yo voy a encontrar distintas unidades, que son los temas que yo trabajo. Para la
actividad, es donde es más libre y me dejo llevar por el gusto de los estudiantes, por la edad de los
estudiantes, por el momento en que estamos. Pero sí tengo una documentación normativa que son mapas
curriculares y guías del plan.)
P: And with that, you develop your – (Y con eso, desarrolla sus – )
SS: I develop my class activities, exactly. (Yo desarrollo mis actividades de clase, exacto.)
P: Okay. Eh, have you ever taught climate change? (Okay. Eh, ¿ha enseñado cambio climático?)
SS: I work much better with the topic of the environment, but through creation. But it does inform the
students about the benefits of using trash, for benefits for the earth, for the environment, for the planet,
which is all connected to the topic. (Trabajo más bien el área ambiental, pero atreves de la creación.
Pero sí se informan los estudiantes de los beneficios de utilizar la basura, para beneficios de la tierra, del
ambiente, del planeta, que está conectado el tema.)
P: Because there is a lot of trash right now. (Porque hay mucho basura ahora.)
SS: Of course. And one of the things that obviously affects us is the mismanagement of waste. I do
projects where I use trash as material. (Claro. Y una de las cosas que obviamente nos afecta es el mal
manejo de los desperdicios. Yo hago proyectos donde yo utilizo la basura como material.)
P: For art. (Para arte.)
SS: Exactly, to create art. And I always tell them and I touch upon the topic of the importance of
environmental conservation through reusing or recycling. (Exactamente, para crear arte. Y siempre les
hablo y les toco del tema de la importancia de conservación ambiental atreves de la reutilización o le
reciclaje.)
P: And do they listen to that, do they pay attention to that message? (¿Y ellos se escuchan a eso, se portan
atención a este mensaje?)
SS: Yes, they show interest, well they show more interest in what they are going to do. Not the
information because they’re adolescents and they do things quickly. But one tries because at least it

pg.
147
creates the awareness. (Si, muestran interés, pues muestran más interés en lo que van a ser. No la
información porque son adolecentes y ellos son de rápido hacer. Pero uno trata que por lo menos creen
la conciencia.)
P: Can you please describe the 4-H group? (¿Puede describir el grupo de 4-H, por favor?)
SS: The 4-H group is a group of very committed students. They are students with very good grades, who
always accept the challenge to do more. One presents a project to them and they always say that yes, they
are going to do it. And it’s a group of students that any teacher would love to have. Time and time again,
because they are people that are always going to do. Students with very good grades. (El grupo de 4-H
son estudiantes bien comprometidos. Son estudiantes con muy buenas notas, que siempre aceptan el reto
de hacer más. Les presentan un proyecto y siempre dicen que sí, que lo van a hacer. Y es un grupo de
estudiantes que cualquiera maestra quisiera tener. Repetidas veces porque son personas que siempre van
a hacer. Estudiantes de muy buenas notas.)
P: And they’re part of the group because they have good grades, or it’s a coincidence or – (Y están parte
de este grupo porque tienen buenas notas, o una coincidencia o – )
SS: Well, they’re part of 4-H because they’re very disciplined and committed. Obviously their grades are
important because if they had bad grades they could not participate in the outdoor activities because that
would affect their grades. (Pues, son parte de 4-H porque son muy disciplinados y comprometidos.
Obviamente las notas son importantes porque si tuvieran malas notas no podía participar de las
actividades de afuera porque sí van a afectar.)
P: So then did the school pick the students and put them in this group? (Entonces, ¿la escuela se escogió
estos estudiantes y se pusieron en ese grupo?)
SS: I picked them. (Yo los escogió.)
P: You? (¿Usted?)
SS: I made the selection because I had known the studentes for two years. I saw them grow. And I saw
over time they were more committed. (Yo hice la selección porque yo conocí a los estudiantes hace dos
años lo que conozco. Lo he visto crecer. Y he visto que pasa el tiempo y más comprometidos están.)
P: So, you met them in the – (Entonces, usted los conocieron en el – )
SS: The seventh grade. And now they are in the ninth. (Séptimo grado. Y ahora están en el noveno.)
P: And last year you chose them – (Y en el año pasado tú los escogieron – )
SS: I had already chosen them, and many of them were already in 4-H. (Ya yo los había escogido, y
muchos de ellos ya estaban en 4-H.)
P: Oh. Outside of the school? Or – (Oh. ¿Fuera de la escuela? O – )
SS: 4-H is outside of the school, but I work in the project with my kids in the school. But the activities are
all related with this organization. What this group of 4-H specifically is is the Casa del Árbol, and that’s
why we are in El Yunque. (4-H es fuera de la escuela, pero en ese proyecto yo lo trabajo con mis niños

pg.
148
de la escuela. Pero las actividades todas son relacionadas con esa organización. Que específicamente
ese 4-H, es la Casa del Árbol, que por eso estamos en El Yunque.)
P: Mmhmm.
SS: That group will be in charge of the nursery where there are trees. The 4-H group from this school
basically belongs to El Yunque. To the forest. (Ese grupo va estar a cargo de ese vivero que es donde
esta los arboles. Es que el 4-H de esta escuela básicamente pertenece a El Yunque. Al bosque.)
P: And do they do anything more than that or do they focus in – (Y se hacen algo más de eso o tienen una
enfoque en – )
SS: The focus of this group of 4-H is mainly environmental. If we go out to El Yunque to do
photographic work we also go to rescue trees, to do seeding work, that is in the nursery. We go out to
areas that always have to do with caring for the environment, with enjoying the surroundings, nature,
nature, nature. (El enfoque de este grupo de 4-H es mucho de ambiente. Si salimos a El Yunque a hacer
trabajo fotográfico también salimos a rescatar arboles, hacer trabajo de siembra, eso es en el vivero.
Salimos a aéreas que tienen siempre que ver con cuidado ambiental, con disfrutar del entorno,
naturaleza, naturaleza, naturaleza.)
P: What is “viveo”? (¿Qué es viveo?) Oh! Live.
SS: It’s a place where you go to work with tres, like a nursery of trees. (Vivero es un lugar donde tu vas a
trabajar con los arboles, como un nusery de arboles.)
P: Oh, Okay. So you all do field trip activities a lot. (Oh, Okay. Entonces ustedes hagan actividades del
campo muchas veces.)
SS: In 4-H we’re always out of the school. (En 4-H todo tiempo, fuera de la escuela.)
P: Are they successful? (¿Tienen éxito?)
SS: Always. (Siempre.)
P: Always, why? (Siempre, ¿Por qué?)
SS: When the students go out of the classroom, they learn more. They learn more in terms of academics
and they learn more in terms of things that have to do with interpersonal relationships, with teamwork,
with appropriate behavior. Many times there are better results with students outside of the classroom.
(Cuando los estudiantes salen del salón de clase, aprenden más. Aprenden más en la académica y
aprenden mas en lo que tiene que ver con las relaciones interpersonales, con el trabajo en equipo, con
comportamiento adecuado. Se tienen muchas veces mejores resultados con los estudiantes fuera del
salón.)
P: And why is that? Why do those activities help? Why do they have more interest in them? (¿Y por qué
es? ¿Por qué esas actividades se ayuden? ¿Por qué tienen más interés?)
SS: Because they’re out in the fresh air, because they’re in natural surroundings, because they are
surrounded by nature. And human beings connected with nature learn more. They learn better. They have

pg.
149
more stimulation. Looking around in an enclosed space is never the same, never. I hope that every one
could have projects like this, and take out their students from the classroom and take them away from the
chalkboard. The students would have better results, and they would behave better. (Porque están en el
aire libre, porque están en su entorno, porque los rodea la naturaleza. Y el ser humano conectado con la
naturaleza aprende más. Aprende mejores. Tienen muchos estímulos. Miren el espacio encerado, no es lo
mismo, jamás. Ojala todo el mundo tuviera proyectos así, y los sacara del salón de clase los alejara de la
pizarra. Tuviera mejores resultados, y se portara mejor.)
P: Do they do projects here that are bigger than one class. Like a project with two classes or a project with
the whole school. (¿Aquí se hagan proyectos más grandes de una clase? Como un proyecto de dos clases
o de toda la escuela.)
SS: Integration (¿Integración?)
P: Yes. (Si.)
SS: The math teacher and I are working on an integrated project. She is working with waste management,
I think a recycling center, where she brings trash – metals, paper – and there I work with here so that I can
rescue the trash and convert it into art work. That project is an integration of mathematics and art. (La
maestra de matemáticas estamos trabajando en un proyecto integrado. Que ella está trabajando con
manejo de desperdicios, crea un centro de acopio, que es donde se pone la basura– metales, papel – y de
ahí yo trabajo con ella para yo rescatarlo para convertirlo en las piezas de arte. Ese proyecto es de
matemáticas y de arte integrado.)
P: So this school is willing to do those - (Entonces este esquela está dispuesto a hacer esos – )
SS: Yes, integration. (Si, la integración.)
P: Okay. When you are teaching an art class do you ever have topics that are controversial? (Okay.
Cuando estas ensenando la clase de arte, ¿nunca tiene temas que son controvertidos?)
SS: Controversial topics? It’s that – maybe it’s the age that the students are – that controversy is not so
present. Maybe if they were older, but we’re well – we concentrate in an area of creativity. That is to say
that it is pretty individual. To create controversy, I believe that controversy is normal in growing
adolescents, but in correlation with the class topics, not so much. Our dynamic doesn’t give to it. (¿Temas
controversiales? Es que la – tal vez en la edad que ellos están – esa controversia no se da tanto. Tal vez
si fueran más grandes, pero somos bien – nos concentramos en la aérea de creatividad. Que es bastante
individual. Que para crear la controversia, yo creo que es la controversia normal de adolecentes que
están creciendo, pero en correlación de las temas de la clase, no se da. Nuestra dinámica no se da.)
P: Okay. Eh, outside of the class, there are activities, do you have activities related to the environment or
climate change that you do? (Okay. Eh, fuera de la clase, tiene actividades, ¿usted tiene actividades con
el medio ambiente o cambio climático que usted haga?)
SS: Well, look, with it – and it is linked to the change that we have gardens in which we work with at the
edge of the school, that we work with planting. And we plant trees and do landscaping, and they are
working also with benefiting the environment because when they are planting they benefit the climate and

pg.
150
the environment. That is work I have with additional projects. All of my students have that experience
because it is an area at the edge of the school. (Pues, mira, con el – y está vinculado a lo del cambio
nosotros tenemos unos jardines que trabajamos en lo exterior de la escuela, que, haciendo trabajo del
siembra. Y sembramos arboles y hacemos landscaping, y ellos están trabajando también beneficiando el
ambiente porque cuando ellos están sembrados benefician al clima y al ambiente. Ese trabajo yo lo tengo
con proyectos adicional. Todos mis estudiantes tienen la experiencia porque es un aérea que está en los
exteriores de la escuela.)
P: But that is outside of the school, it’s not connected with the school? (Pero eso es fuera de la escuela,
¿eso no es conectado la escuela?)
SS: I connect it because when they work with planting, we don’t forget elements of art. The color, the
shape, a garden is to beautify. And art works with beauty. So in some way there is a connection. (Yo lo
conecto porque cuando ellos trabajan la siembra, no olvidamos los elementos del arte. El color, la forma,
un jardín es para embellecer. Y el arte trabaja con la belleza. Así que de alguna manera tienen
conexión.)
P: But that is not something that you all do with the school, just – (Pero eso no es algo que ustedes haga
con la escuela, solo – )
SS: I do it with my students, from my class, in a part of the school that needs rescuing to fix it or planting.
(Yo lo hago con mis estudiantes, de mi salón, en un lugar del escuela que necesite ser rescatado para
arreglarlo o sembrar.)
P: Oh Okay. So they have gardens her in – (Oh Okay, entonces tienen jardines aquí en – )
SS: Benefits, exactly, in the same school (Beneficias, exacto, a la misma escuela.)
P: Oh, Okay. I think that that is it, those are all of our questions. (Oh, Okay. Pienso que eso es, eso es
todo nuestros preguntas.)
SS: Perfect! (¡Perfecto!)

pg.
151
Interview 3: Marganese Sanjunto
Ninth grade science teacher, Carmen L. Feliciano Carreras del Sector Palmer Middle School, Río Grande,
Puerto Rico
Date & Time: November 18, 2014; 3 p.m.
Emma (E): Do you mind if we record you?
Marganese Sanjunto: No.
Princesa (P): the first question we wanted to know what subject you teach.
MS: Earth Science. That’s the current subject in, like, middle school for especially the ninth grade for
students around 13 to 14 years old.
P: Okay. Do you only teach ninth grade or do you teach other grades as well?
MS: Currently, I’m just teaching ninth grade. Like, two years before, I was teaching eighth and ninth
grade.
P: how long have you been teaching for?
MS: The last 9 years.
P: Wow, and then here?
MS: No, I have been only three years in this school, but currently I was around the island in other public
schools and private schools.
P: Okay. Could you describe what a typical day in your classroom is like, please?
MS: Noisy… (laughs) I’m pretty messy. Actually, it’s like the same dynamic of I present a topic and they
have to divide in groups, and do the topic I am teaching, like the activity you were seeing. It’s like not
every single day, but mostly everyday we will usually use the computer and present the topic and then we
start to discuss it and construct and make different diagrams on the board and they write it down and we
start discussing all of the topic together.
P: We, so far in the other on of the classes we’ve been in, there’s been similar dynamics where there’ll be
a group that goes along with whatever is being learned or being taught to? Is that common in this school
or is that something that everybody does?
MS: No, it’s not. It depends on the topic, but we are trying to make more activities that uses that pin-on.
P: The entire school?
MS: The entire school.
P: Is that just the school or does that go out further, like the entire island doing that?
MS: The entire island.

pg.
152
P: Do you know why?
MS: Well, we had, like, new standards this year that were using the next generation science standards and
the common course like the activities. They are directed that students are going to remain in groups and
they are going to use that.
P: so when you’re teaching a topic and you’re kind of doing these activities, what do you use? Like
what’s a kind of activity you use a lot?
MS: I use labs, group activities, we have a lot of things we have to do and write and create.
P: Is climate change taught in any way in this school?
MS: What?
P: Do you ever teach climate change?
MS: Climate change? Yes we do.
P: To what extent?
MS: We use it in my grade in this unit, but actually the art teacher is using that. She’s using her class to
teach the consequences of climate change and what can we do to stop it and prevent it. The math teacher
is also using it, the English teacher, so it’s a general topic that is being used as, specifically in my grade,
as a topic in our different classes.
P: Is that just this school or is that kind of in the area or the island.
MS: In the island, because we have these new standards and it’s one of the topics that is present.
P: - Is teaching climate change. So do you usually have – is it usually successful teaching climate change
or is it kind of, because it’s so new, it’s hard to tell if kids are learning from it or not.
MS: No. They actually know a lot about climate change and what causes and what can we do. So, we get
all that information and they bring it to class and we discuss, like, what chemicals are involved, what
human actions are involved, what nature conservation concerns are involved.
P: So when you’re teaching a topic – any sort of topic at all – and it’s new, do you have any problems
teaching it to the students? Do they, maybe they’re not always receptive to it? do you usually have any
sort of trouble with getting kids into new material and getting them involved in it and motivated to learn
it.
MS: Yeah, always. When there’s a new topic we have issues with the students because they have a lot of
misconceptions and we start asking them questions and then they tell us what they know about the topic
and from there we start directing the class.
P: and then you say, “This is true. This isn’t true”?
MS: Yes.

pg.
153
P: Okay. So, how do you personally develop your lesson plan for the students?
MS: Well, the papers I gave you? Every teacher now has to create units using the standards. So we have
these units that come from the Department of Education and they are separated in the different subjects.
We have all this information and we have to use it to create our own units using what the kids know and
all the other things involved in the book that we use primarily. So, we have to use all this information that
the department [DoE] gives us and create our own units.
P: And having new standards – does that make it hard to do that with all the things you have to use for it,
and the new standards? Is it harder to develop a curriculum?
MS: It is because all this information from the standards that they are giving us are new. The had started
in this august, so we have to take time to get involved with all the new stuff and redesign our classes.
P: We you ever – do you use field trips in your class at all?
MS: We do.
P: Do you ever have trouble making them happen or do they happen rather easily for you?
MS: They are pretty easy to do.
P: Okay. Do you find them useful for your students?
MS: They are.
P: What kind do you use?
MS: Well, next week we’re going to a geologist to different parts of the island and we’re going to use the
geologist to take the kids and he’s going to teach them about the different types of rocks and how Puerto
Rico was created around the planet’s tectonic plates of the Caribbean and the local area. It’s an activity
that we don’t have the facilities to do in a school, but when we use the field trips, there’s another
experience for the students and they are pretty receptive to it and they learn more.
P: Do you ever do, kind of, large-scale projects? So, instead of in just one class do you ever do one that is
maybe with an entire grade or the entire school?
MS: Not really. Not in my experience.
P: Okay. Going off of climate change material, do you ever have – is it ever controversial for you? Do
you ever have to, sort of, find a way to deal with it being controversial if it is?
MS: there’s usually a relatedness that comes from the news and all the stories that they read on the
Internet so it’s not a big issue. They are really related to the topic
P: So, do you think that the students here are – you say they’re actually pretty well aware of climate
change?
MS: Yes I do.
pg.
154
P: Okay.
MS: They actually are upset because we teach them about climate change, but they are really upset about
the government and all the other areas that they don’t do what they’re supposed to do to stop it from
happening.
E: What time during year do you go over climate change?
MS: That’s the first unit, actually from August and – August, September and half of October. That’s the
first unit. It’s all about climate and temperature and we have the topic involved in that unit.
E: Alright. so you were talking about the standards – the new standards. Is there any way we can view
those, or are they on the internet or anything?
MS: Yes. They are actually on the webpage of the department under the science faculty, but I actually
have it right here.
E: Okay!
MS: (she gets the binder containing the new standards) this is for ninth grade, okay? We have, like, a map
with different units. Climate change is in this unit [1]. This has the curriculum maps that we use. Here we
have all the vocabulary that we have to work with the kids. For the whole unit, here’s the different
activities that we can use and the different questions that we have to make the kids understand the
questions and from there start teaching them all the different topics. So, it’s actually a lot of reading we
have to do in each unit. This just came in August, so in the summer we were told that this is going to
change in all the areas; Spanish teaching, English teaching, Science, and Math. Social Studies, they
haven’t turned to the new standards, but in the other classes they have. So, it’s a lot of information and we
have to create all our own units and from there our own lesson plans. What I gave you is a unit that uses –
this unit over here – I’m sorry. It’s all in Spanish.
Michael (M): No problem.
E: We can understand it a little!
MS: Well, that unit that I gave you takes all of this. That includes a lot of vocabulary and notes. Do you
want to review it?
E: Yeah.
M: I have a question then while they’re doing that. Are there any difficulties that you find in using this.
Are there any things that may be hard to follow or not intuitive?
MS: the structure that they use to put all the information together is kind of hard. For me, it’s not that
hard because I have a masters degree in curriculum, so I’m used to creating units but for a regular teacher
that doesn’t have any classes in curriculum design, it’s really hard.
M: Okay.

pg.
155
MS: And, there’s a lot of topics in each unit and sometimes the time is not enough and we have to start
teaching a topic but we can’t tell the kids a lot of information about it because we are pretty limited on the
time that they gave us.
M: So how do you then pick and choose between the topics that you do include and then choose to
exclude due to time?
MS: We have to choose the topics that are more related and that the kids are used to. So, the topics that
are included in previous grades. For example, climate change is a topic they are very used to since fourth
grade, so it’s easier to teach that topic but there are other topics like in geology. Tectonic plates is a really
hard topic because they are not used to it. They are used to listening about volcanoes and earthquakes, but
the different layers of the earth – they’re not used to it and they don’t understand what are they made of
and all the history that it takes to start talking about tectonic plates. So, there are topics that are harder to
teach and sometimes we are really behind. In reality, there are a lot of topics that we are not going to be
able to teach in the whole grade. We can teach the first unit, second unit, but the last unit is astronomy
and I’m sure that I’m not going to be able to, in May, teach this because time and all the complexities of
the document.
M: If you had a recommendation of, since we are trying to develop a few lesson plans that deal with
climate change, of how to make it so it could be easily taught within the time frame, what would those
be?
MS: A time recommendation to teach the topic of climate change? Well actually, the first unit is not that
bad because the have to teach it in seven weeks, but the other ones are harder, so around seven week we
can deal with, including climate change and teaching students temperature and the difference between
climate and time and stuff like that. But if we start the same temperature –teaching temperature scales –
so they can actually under stand what is it: low temperature or high temperature? That part that includes
math is crazy because they have a lot of issues with math. So if we teach then to change from Fahrenheit
to Celsius, actually that takes around a week. There are thing about climate change that we can teach
them, but other are going to take more time if you want to be more specific about it.
M: It’s better to keep it more at a conceptual level then?
MS: If you keep it at a conceptual level, it’s easier, but if we want to teach the whole spectrum of what
climate change is, it’s going to take a while. Around five, six, seven, eight weeks to teach all the things
that are related to it and the difference between global warming and climate change.
P: I have one question actually. When you guys teach climate change, how in depth do you go? Do you
talk about El Yunque in particular or is it just a general “what global climate change is”?
MS: General, and we can give then examples of what they can find. Here in this school we talk to then
about El Yunque because it’s really near but in other schools they use a lot of other parts. Like in
Guanica, they teach them about the one forest in Guanica and the difference between Guanica and El
Yunque and the temperature difference and the difference between the rain. So we use those examples to
teach them, and we use others examples. For example, there is that picture over there of the Kilimanjaro
and a few decades ago it was much different because it had more snow and the temperature – the climate
effect has changed a lot of the Kilimanjaro Mount – It’s a volcano, right? So, that’s what we do. We use

pg.
156
local examples, but usually we teach climate change in a really wide concept. We don’t get more specific
because of the time and we maybe don’t have the facilities to do it. You were seeing in class - it was
really hard since I was trying to use the Google Earth application and some kids have their cell phones
with them, but they were using my iPad and using my computer. They were even using the globe model
too. It’s pretty hard because we don’t have the resources which makes it even more hard and the
instruction about the topic needs to be wider in general. If you have more resources, you can make other
activities that are more specific and the process is more enlightening for them [the students].
P: Do you guys have any further questions?
M: I think that is all we have to ask. Thank you for sitting down and doing this with us.

pg.
157
Interview 4: Cybele Londoño
Biology teacher, Academia del Perpetuo Socorro – High School, San Juan
Date & Time: November 21, 2014 ; 12:30 pm
Emma (E): do you mind if we record you?
Cybele Londoño (CL): As long as you can un-record any really stupid thing I say I’m fine! No problem.
You can record me if you want to. Although, it makes me nervous…
E: (laughs) Don’t worry. So, we were just wondering what is the subject you teach?
CL: Okay, I’ve been teaching – right now I teach biology and AP Biology, but I used to teach life
science, earth science, physical sciences, biology, AP biology, and chemistry because I had six classes I
taught. I had very small groups, but I had to teach all of them, so I’m pretty familiar with the curriculum.
I’ve developed my own biology curriculum for both my AP and my regular classes. I am originally a
biologist, or was I guess. Then, I became a teacher after that. What else?
E: Maybe we should sit instead of walking and talking….
CL: If you want to ask me the next question I can start thinking about it.
Princesa (P): Okay. How long have you been teaching?
CL: I’ve been teaching since ’99, but I have taken some time off because I had kids. I had three kids, so I
took 4 years somewhere in there to take care of my daughter when she was young.
E: So, basically we were creating this curriculum on climate change. Have you had any experience with
teaching climate change?
CL: we have taught, I mean I have taught particular units in earth science that are related to climate,
weather, atmosphere – those kinds of things, definitely. We’ve talked about that. It tends to be very
general because it doesn’t address climate change specifically.
(Found a place to sit)
E: so, what age or grade level do you teach?
CL: Okay. Right now I’m teaching 15 and 16 year olds and 17 and 18 year olds.
E: could you describe what a typical day in your classroom would be like?
CL: Okay. A typical day in my classroom. Well, I teach five different groups of students, so each group is
really quite different than the other. Three of those groups are regular biology groups, then, I have an
honors group and an advanced placement [AP] group. Each group is really different from the other. I’m
supposed to teach the same material to the regular students and then the honor biology group are a little
bit more advanced, and my AP biology group is supposed to be even more advanced. That is with the
seniors. In reality, each group is so different – they have their own personalities, their own dynamics – so,
I really don’t end up teaching the same material or the same way to all of the groups. Pretty much, my day

pg.
158
flows according to blocks and we have some free periods but more than anything I focus on content. I’m
very a content teacher. I didn’t specialize or anything, like in special ed. I’d rather be interested in giving
a lot of content in an organized manner, keeping them very busy so that they don’t misbehave. That’s a
big issue for teens.
E: What kind of educational tools are your favorite to use or that you find most effective?
CL: I see. I use a number of different techniques, strategies, and tools even. We’ve got – certainly I have
labs that we do, so that’s really hands on, very kinesthetic. Kids have to, you know, prepare in advance,
which frequently they don’t, so I need to explain before we go into the lab. That gives kids a hands-on
perspective, but if you don’t explain it before and after, it’s like you didn’t do it. Somehow it does not
record in their heads. We use a lot of video. There are different particular, what do you call those,
companies that develop video materials for teachers. One is RicoChe and they’re pretty good. We have
Kans Academy that’s also pretty good, so I pick and choose and take material from them. I also use
mastering Biology. That’s a – it comes on disks and is sold by [Pierson], not that I want to promote
Pierson or anything. So, videos, labs – I try to show them stuff a lot, like if I have actual live organisms I
show them. If I have skeletons, fossils. I try to use a lot of hands-on, but that’s more difficult when the
groups are larger. We do use – I use a very traditional fill-in-the-worksheet and I do that sometime
because kids get very hyper and that really calms them down. I don’t know. Maybe they’re very used to it
or very comfortable with that kind of technique but, even though it’s not really recommended anymore,
they really like to sit down and fill in a crossword puzzle, do classwork, paperwork. They like to use the
book, read through it and fill out questions. Again, I don’t find that that’s that useful in terms of making
them learn the material. It helps them review but only if you go over it with them. Frequently, I find that
students are just not paying attention to stuff.
P: So, what do you use that you find is effective when you teach?
CL: let me think about that. The most effective stuff is really making it – well, first I find that, if you
come up with a presentation, you introduce the subject. What makes it most effective, what makes a
subject, when you present a new subject, is first of all doing a lot of brainstorming with the students –
letting them provide you with information about them. you need to know who they are before you can
teach them anything, really you need to know what do they have inside their heads because usually they
have huge misconceptions. I was dealing with that today, and I’ll tell you a little bit about it in a minute,
but they have misconceptions so we brainstorm about the subject and I try to find out where they are in
terms of a particular subject, particularly if it’s something new. it’s useful to come up with a short video
or presentation to kind of get them thinking about it a little bit more. Then, explaining it yourself, really
explaining it and, perhaps, reading from the textbook but not reading the whole textbook. Just choose
small excerpts from the book that you’re using, usually teachers are still using books, so reading short
excerpts from the book and talking about it, explaining it, and asking them. Really addressing them like
they’re people, not just sponges that are absorbing. I find that if you don’t – everything needs to have a
beginning, a middle, and an end. If you don’t start from the beginning or assess at the end they’re not
going to pick up on the material very well. some student do, but many don’t. you lose them in that way.
Today we were talking about energy and kids have the funniest misconceptions about energy. they think
that if you sleep you get energy. why do they think that? because that’s what their parents tell them – if
you don’t sleep you won’t have any energy. so, what I ask the is, “what is energy and how do you get it?”

pg.
159
They go, “well, you get it from sleeping.” or they might not even know what energy is. They certainly
don’t know all of the different types of energy or that energy can be transferred, so you really have to
spend a lot of time on these particular concepts and, even though they kind of know, they don’t really
know. Now something I don’t spend time on is the cell because everybody has been studying the cell
since kindergarten. They’ve done models. They’ve done this. Everybody kind of has an idea of the cell,
so we try to really address misconceptions on the different topics that we’re covering.
E: have you ever worked with any controversial subject matters?
CL: Definitely. We deal with controversial subject matter all the time. In fact, the topic, one of the
biggest controversial subjects that I deal with is evolution. I work at a catholic school and, fortunately,
these particular students are pretty open-minded and most of them accept that evolution is a fact. But, I
used to teach at a Baptist school. I was not allowed to teach about evolution. It was not allowed. I just
could not even use that word. That was not acceptable in that school. So, I couldn’t teach a lot of material
because that’s a huge and important concept in biology – it’s a central, core theme in biology – but we
couldn’t teach it.
P: When you do teach it at this school, what’s something that you use to kind of – I almost want to say
break the ice, about that?
CL: What I say to them is, “okay. We’re going to talk about evolution. It’s a very important subject in our
class. You may have heard, or your parents may have spoken to you about it. In reality in my classes, I
teach you what science teaches. This is not about what we believe, but rather what’s being taught in this
field at this time.” I try to kind of remove the controversy from it I think. This is what the books are
telling us, and again, you have the right and your parents have the right to teach you whatever they teach
you, and if you don’t want to believe that evolution occurs, it’s up to you. Then, I go on to say that
evolution is simply change over time, modification upon descent to try to take the stigma away from it. It
works pretty well in this school, but this school is a higher socioeconomic level and they tend to be much
more open-minded for some reason. I don’t know why, but the Baptist school won’t even allow that I
even teach it. My students were telling me I was going to go to Hell because I was talking about
evolution, so it made it very difficult. I left that school. I couldn’t teach there. I didn’t feel comfortable
because I’m also Jewish and it was a problem. It was a big problem. I couldn’t be Jewish. I was told, “If
you’re going to be Jewish, that’s fine, but don’t tell anybody.” It was not a good place for me whereas this
school is perfectly accepting of this, of my practices.
E: So, how do you go about developing a lesson plan?
CL: Okay. There are different ways of developing lesson plans, certainly. If I was in your shoes –you
guys are clearly brilliant people studying really difficult careers or difficult subject matters – probably the
main challenge for you would be getting down to the students’ level. Really coming down a little bit
because you’re probably really good at math I suppose and you probably know a lot. You may not be
aware of what they don’t know, so what I would do is, if I was doing to develop – first I would choose a
subject. I suppose you have some subject matter that’s specific about climate change, that you want to
teach. I would start out with the beginning. what is the beginning what you want to teach? I assume you’ll
start with some definitions, finding the very specific subjects that have to do with climate change.
Address those, but in a very condensed manner. I know you’re going to be dealing with the atmosphere

pg.
160
and think of subjects like “what do they really need to know to be able to acquire the knowledge you want
to impart?” I would make a list of that. what do you really need to know first. Then, I would develop your
subject, your content, again, in a very specific manner, kind of in a bullet fashion, until you really know
what it is you’re trying to teach them. Do you already know what you’re trying to teach them?
E: Yes. We kinda have to lessons that we’re developing. one’s going to be on the greenhouse effect and
the different greenhouse gases and ways to reduce greenhouse gas emissions. That’s the first lesson. The
second lesson is going to be about the impacts of climate change, so on how it causes warmer oceans,
how it causes changes in sea levels.
CL: But, you’ve got a lot of material here. A beginning, from what I can hear that you are saying is
you’re talking about gases. Definitely, you need to talk about the atmosphere. They might not even know
that the atmosphere is made up from a mixture of gases. I would go into, what are gases? What gases are
available? What are present in our atmosphere, and talk about those concentrations. Also, explain how
they are not fixed, how they can change over time. I would talk about – so you have gases and
atmosphere. Then, I would talk a little bit about the effect of temperature and pressure on gases. you’re
dealing with areas where there is, at higher elevations, you’re going to have lower air pressure. at lower
elevations you’re going to have higher air pressure. they might not know much about air pressure or that
much about temperature that affects gases. I would use cars as an example, since everyone has gotten into
a hot car. They know how, when yu get into a hot car, it’s so hot. essentially, they understand the green
house effect when using an example of getting into a hot car, so they do kind of know, but not know. I
would talk about, for example in San Juan, I would use the fact that, when you get into a building – in old
San Juan the buildings are really tall because hot air rises. So, how does that/what does that have to do
with climatic change? Since you’re dealing with the changes in temperature, that’s all related. Again, I’m
going to let you decide and figure out how it’s all related, but you’re dealing with gases, pressure, and
temperature. I would develop a lesson first on gases, a short one, and then one on temperature and
pressure and the greenhouse effect. Why not mix them? Because if you mix them you have too many
details and the kids are not going to be able to separate them in their own minds. When they get to ninth
grade usually they take earth science. Eighth or ninth grade.
P: They seem to be taking it now, yeah at the ninth grade.
CL: So it depends on the school really. And they don’t really understand physics, yet. And they are not
that good at algebra. So you need to kind of all really tone it down to their level. Because if you have a
really great group, and they are really advanced; you can explain all this with physics and algebra and talk
about pressures and gases. These kids don’t know this, they don’t understand this. And they probably
learned photosynthesis but in a very general manner. So you may want to talk about that too. So, so far
you got a lesson plan, on gases, air temperature, and effect of altitude on. Then of course you have to talk
about climate, what is climate? How does is it differ from weather? If you are teaching in Puerto Rico,
talk about hurricanes because they are interested in that. And use the ocean also, because they know the
ocean; so talk about the ocean, use the ocean. If they are in El Yunque, then they are aware that it rains a
lot in el Yunque. They might not know why it rains so much there. So, see, you’ve got a lot of material.
You’ve got a lot of material to develop. May I ask you something?
P: Mhmm.
pg.
161
CL: Are you going to try to develop this and then try to do it? Or did you already develop it, these lesson
plans?
E: We’re testing out; we’re basically testing out two lesson plans.
CL: You’ve already developed them?
E: Yeah. We are in the process of developing.
CL: Would you like me at them before you take them to your school and give you feedback? Or would
you rather me not touch it and let you guys just do all the work?
E: We can send it to you, we still have some edits, but…
Michael (M): We have to make it more…
E: Yeah, we still have to finish it up but like…
CL: Because I can give you feedback based on my opinion, but it would just be my opinion.
Again I talk a lot, but I think I have a pretty good sense of all of this. I think you are doing a beautiful job.
It’s very, very interesting what you are trying to do. Okay next question?
(paused when we trying to relocate our questions)
E: Actually that was all the questions we had, specifically.
P: Was that really? That was very quick?
CL: It’s because I talk so fast, I know. And that’s me without coffee. It’s helpful for me to be very hyper.
Because my students, it’s how I stay one step ahead of them.
(Brief talking about another question to ask)
E: We are translating everything into Spanish for our curriculum, because the school we are working with
is not bilingual at all.
CL: That tends to become an issue. It’s not so easy. I think so. I have taught in English speaking schools
and I have taught at bilingual schools. And in English speaking schools, the English is better. So they
really do understand English now. Where I am teaching now, they understand English but they tend to
have difficulty with tests. They don’t test well in English. There are many words that they don’t know. If
you are translating, just make sure you get a really really good translator. Make sure that they really
translate well, so that you can explain your subject well, and address the issues that you want to address
well. I don’t know, I would say keep it simple. Make it short, but give yourself the opportunity to
lengthen it if necessary.
E: That’s something that we are planning on doing. What we will be testing out two lessons that kind of
cover most topics of climate change but in kind of a superficial level almost. And then be able to expand
on those for our project’s sake. But we will not be able to actually test those out. But we will expand
them, so we can do more in depth lessons about the different subjects.

pg.
162
CL: But when I say make it long enough. I mean, you don’t want kids without anything to do during a
period. So you want to make them long enough in terms of time use. Pacing is one of the hardest things
when you do lessons because you might have something wonderful but it might only last twenty minutes.
What do you do with these monkeys for the next twenty five minutes? So give yourself enough activities,
even if you don’t use them all. First, have enough activities. And something that I find, that tends to
become a problem is when we cover subjects in a very general way then when they take a test they don’t
know enough. You have to simplify it but teach other relevant content any way and find a way to make it
easier for them. That’s where you have to do your work. Make it easier and more understandable for
them, so they can have breadth but also depth so that they know enough.
M: Okay so kind of an example that might be…
CL: Okay an example. Like sometimes we talk about gases and how our atmosphere is a mixture of
gases. But you also need to tell them what gases these are. What are the specific gases and what are their
proportions and they might not understand why it’s a mix. And why it’s a mix and you don’t see the parts.
You have to tell them it’s a mix and it’s homogeneous and its transparent and clear. And give them like a
little handout of the different specifics of the atmosphere and the different percentages of each gas. So
they have something to hold on to. So you can explain that is a mix, but also give them what’s involved
and what’s in the mix. You see, so some teachers say “oh it’s a mix” but they don’t go into that much
detail but you need to give them the detail. So when they have a test that asks what is the percentage of
“CO2 in the environment, they can answer that question. Or what is the percentage of oxygen or they need
to know for example that ozone is a pollutant if you have it down here, but up there it is necessary or
required. Those kinds of details that give kids a kind of edge for testing but sometimes take up a lot of
your time. So provide that one way or another. But don’t forget to explain that it’s a mix, do you see what
I am saying.
P: Yeah, even if it’s just like a table that says all these things.
CL: Also, remember, when you do take tables nobody reads a lot. Kids don’t read a lot. They don’t want
to read. So make it big enough, colorful and simple. Don’t put too much stuff in your tables. What I’ve
realized over the years, nobody reads anything. A few really really smart great kids like to read but they
don’t want to read any more. Kids want it all like this (snaps her finger). If you could do interactive stuff
using your computer, that’s better for them. I mean, it’s better for them in the sense that they are more
likely to use that. Don’t expect that they are going to read a lot they won’t. Some will but most won’t. A
lot of kids are very auditory, and they don’t read well. Or they don’t want to read. And that’s a big issue
they don’t know how to read and write any more. I’m sure you’ve found that. Did that happen to you, do
your read and write well?
P: I was always a bookworm so…
CL: So you read and write well, what about you do you read and write well?
E: I don’t know. Well, I write pretty well. I don’t read very well. I’ve never had a liking for it.
CL: Okay, so you are the kind of person that gets a lot out of these video clips and google.
E: Absolutely.

pg.
163
CL: So use that. That’s very available nowadays. Use it as much as you want to. Let your kids know that
is out there. Give them links. You don’t want to read about it. Watch this link. And then assess, assess,
assess. Always assess at the end, otherwise they are not going to do it.
M: Cause I know I am like personally, like a very auditory person. So like a song about something might
like teach me so much more than reading something.
CL: So like if I tell my students, read chapters four and five over the Thanksgiving break. They aren’t
going to do it. But if I say, I am going to put this disk online or I am going to give it to you as a link.
Please look at this video, this PowerPoint presentation and it’s the same stuff that is in the book. But they
are going to be much more likely to go through that. Our children today are not what they used to be. The
attention span is about 8 seconds. I mean, they are so not able to pay attention anymore. I mean I am
talking about you guys. Am I?
P: Yeah
CL: And they are worse because they have ipods, ipads, computers. Even kids who don’t have a lot of
money, have access to ipads, ipods, i-whatever. So you are looking at a very different population than I
had when I started. And we have to evolve with them, or we will not have work in two or three years. I’m
afraid of what will happen in five years. I don’t know. Okay. You guys feel free to contact me. I want to
become a teacher’s teacher someday. I have so much experience. I don’t mean to boast, but I’ve been in,
you know, I’ve been in this so long, and I know – I wish I could, you know, teach at a teachers college
and really share all this with people who are going to use it. So please contact me any time.
M: I actually have a question then on that same note, then. In terms of what sorts of materials to provide
for teachers who may not be accustomed to teaching a science topic like this, what –
CL: Okay, new teachers
M: Or even just teachers who, they may teach a subject that, such as art, that isn’t necessarily intrinsically
related to climate change. What sort of material would you say that we should provide to them?
CL: If I were you and I were going to talk to an art teacher, I would focus it all towards artistic. There’s
so much beautiful stuff that kids can do with art and climate. I mean, they can do collages, they can do,
they can make, they can draw planet Earth in different ways, they can make models using models of the
atmosphere using Play-dough clay, things like that. If you look at a book for example, open a book, one
of your books that have information about climate change that you wanna teach, I bet you have a lot of
beautiful illustrations. How can you transfer that into an art lesson? How can you convert that? And I bet
you can think of and find ways to use construction paper to make models of the atmosphere. I mean
there’s so many layers of the atmosphere. Why is the sky blue? I mean, that’s one right there. You can do,
for example, you can have – you can do stuff with particulate matter that will stick onto paper with jelly.
You can take paper and jelly and go out and find particulate matter that can be observed under a
microscope or that can be used in some way as a stencil for some artwork. I don’t know, I mean, let your
imagination go but look at what’s available. You have maps, you have models of different layers. Climate
change, you involve temperatures so you can do stuff with water, how water rises what it gets hot. You
can show kids boiling water and you can show them how the bubbles are coming up, things like that. I
don’t know if this helps – does it help?

pg.
164
M: Yeah it does.
CL: I mean I just – you have a lot of knowledge and you have imagination, just let it go for a while.
Brainstorm. Before you try to do stuff just brainstorm and write it all down, write it all down and then
organize. Puke it out, clean it up. (Laughter)
M: Yup, I mean that’s just a weird question that I had.
CL: If you wanna email me with any questions –
E: Yeah, absolutely.
CL: If you wanna send me stuff, I’m happy to look at it. Let me give you my email. As a teacher I’m
very, very creative and sometimes I’m too creative and that can be a problem for me. Because when you
creative you also have to be very organized, and it’s hard sometimes. It’s easy to be creative, hard to be
more organized. And you really have to be very organized. I mean you’re very creative probably (Motions
to Emma). You’re very creative probably, also.
M: Yeah, because we found that we’re trying to do a bunch of creative, sort of innovative approaches
towards teaching it and it’s harder to stay organized when trying to do all that.
CL: I think that we can’t throw out the baby with the bath water. Teachers have known how to teach for
years, for millennia, and now we’re trying to throw away all of this expertise and if you’re gonna teach
something to students you have to actually teach it to them. You have to require that they use their
memory. You have to use basic cognitive skills to acquire their knowledge, and you have to provide a
framework for that knowledge to fit. Provide a framework, and like a closet, like a bunch of shelves. If
they don’t have those shelves, they can’t squeeze in the information. They might put it somewhere where
it doesn’t belong. So you have to give them frameworks. And you have to provide them information and
knowledge. Nowadays we try to be so creative and innovative, that we stay away from providing
frameworks. You have to provide it. They are not going to learn unless they have somewhere to put it in. I
don’t know if this makes sense.
E: It does.
CL: Okay. Alright, well good.

pg.
165
Educator Interview Coding Charts
Amabel Soto
Education Techniques Environmental Education Puerto Rican Education
Interactive activities Integration of math and
environment: volume of
trashcans and students take
trashcans to recycle center
School: Spanish class, social
studies, English class, electives:
theater, music, art, PE, home ec.,
industrial art
Group activities
Activities integrating technology
Manipulative strategies
Worksheets
Develop lesson plan to integrate
activities
Have a plan for each learned skill
Not big on homework
Field trip = anything outside
(including school grounds)
Field trips give students better
understanding

pg.
166
Stephanie Santos
Education Techniques Environmental Education Puerto Rican Education
Curriculum framework Creation – benefits of using trash 4H group belongs to el Yunque
Distinct units Environmental conservation
Curriculum maps and planning
guides
Planting and landscaping
Develop class activities
Field trips- very successful
Teamwork- on field trips
Connection with Nature
More stimulation- outside of
classroom

pg.
167
Marganese Sanjunto
Education Techniques Environment Education Puerto Rican Education
Use computer New standards involve climate
change education
Hands on activities on the whole
island
Class discussion Students know about climate
change, its causes, what people
can do, how people are involved,
chemicals involved, etc.
New standards (2014) include
more group work and creative
activities
Diagrams Students are upset about current
state the world is in with respect
to climate change
Teachers have to create their
learning units using standards
Field trips – geologist for
example
Only just had their first unit
earlier this year (fall, 2014)
Limited time to teach everything
to standard
Field trips help them learn more
– effective!
Climate change education is
pretty general, but they try
relating it to their region
Choose topics that the students
are more related to and are used
to

pg.
168
Cybele Londoño
Education Techniques Environment Education Puerto Rican Education
Labs Talk about the atmosphere
Explanations before and after
activities
What are gases?
Traditional fill-in worksheets Ocean and hurricanes
Fill out questions
Brainstorming
Need to know the students and
any misconceptions
Explanation and asking questions
Reading small excerpts from
books
Address them like they are
people
Start from the beginning
Assess at the end
Definitions
Address specific subjects in a
condensed manner
Keep it simple. Make it short
Have a lot of activities planned
Breadth and Depth
Use colorful, simple tables
Links to videos
Incorporate art –collages
Use models
Use frameworks

pg.
169
Appendix C: Proposed Learning Unit - Pre-test Pre-test for lessons 1 and 2
Estimated time: 10 minutes
Give students the following pre-test a day before conducting lesson 1. This pre-test addresses learning
objectives of lesson 1 and lesson 2. The responses that are highlighted below correspond with the answer
to each question.
Name: Provide space for response
1. Which of the following is not a greenhouse gas? (Objective 2)
a. Carbon dioxide
b. Propane
c. Methane
d. Water vapor
2. What is the relationship between CO2 concentrations and global temperature? (Objective
1)
a. There is a positive correlation
b. There is a negative correlation
c. There is no correlation
d. There is a slant correlation
3. From among the following, what do greenhouse gases trap in the atmosphere? (Objective
2)
a. Water
b. Oxygen
c. Carbon dioxide
d. Thermal energy
4. Which of the following is not a way that humans can decrease greenhouse gas emissions?
(Objective 4)
a. Use natural lighting during the day
b. Move from cities into suburbs
c. Drive a car with increased gas mileage
d. Unplug items when not in use
5. Which of the following describes a predicted effect of climate change in Puerto Rico?
(Objective 7)
a. The seasons will become more extreme. The dry season will become drier while
the wet season will be wetter
b. 85% of the island will be under water by the year 2050
c. A large portion of native species will disappear from Puerto Rico within the next
15 years

pg.
170
d. Smog levels will increase in San Juan due to increases in average annual
temperature
6. Which of the following is not an effect of climate change that is currently affecting
Puerto Rico? (Objective 6)
a. Rising sea levels
b. Changes in the habitats of native animals
c. Changes in precipitation patterns
d. Decreased coastal erosion
7. Which of the following is an effect of climate change that affects wildlife? (Objective 6)
a. Greenhouse gases are poisoning animals
b. Animals are migrating farther north than usual
c. Animals are migrating at different times of the year
d. Greenhouse gases are affecting reproduction patterns
8. What is the highest source of man-made carbon dioxide emissions? (Objective 4)
a. Electricity
b. Transportation
c. Industry
d. Residential/Commercial
9. Which is not an environmental effect of warmer oceans? (Objective 5)
a. Rising sea levels
b. Coral reef changes
c. Changed chemical compositions
d. Increased waves
10. What is an impact of changing animal and plant habitats on humans? (Objective 7)
a. Increased noise pollution due to coqui overpolulation
b. Lower food supply due to precipitation changes
c. Architectural damage due to birds nesting in city buildings
d. Increase of growth of poisonous plants in residential areas
11. Climate change experts have stated that increases in greenhouse gases can lead to
increases in atmospheric temperature. Which is not an effect of a warmer atmosphere?
(Objective 5)
a. Warmer oceans
b. Longer days
c. Changing conditions for animals and plants
d. More evaporation
12. Which of the following does not directly affect atmospheric carbon levels? (Objective 3)
a. Plant respiration
b. Animal respiration
c. Decay of organic matter
d. Burning of fossil fuels

pg.
171
Appendix D: Lesson PowerPoint Presentation

pg.
172

pg.
173

pg.
174
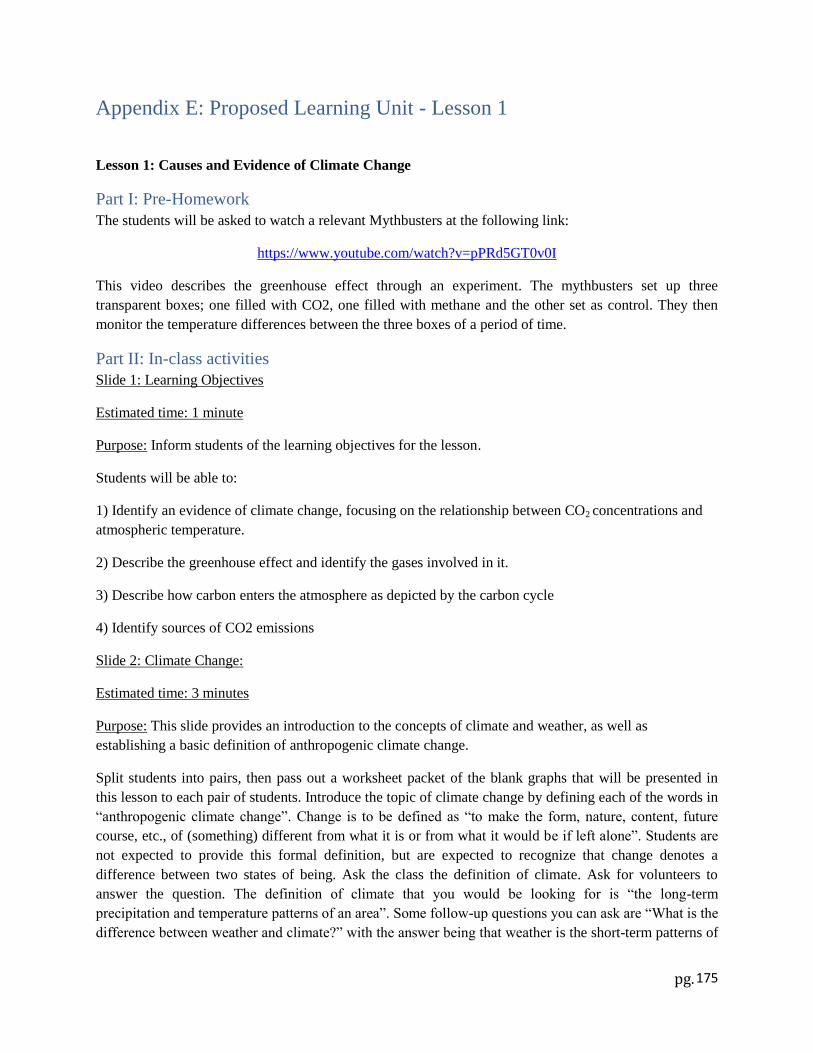
pg.
175
Appendix E: Proposed Learning Unit - Lesson 1
Lesson 1: Causes and Evidence of Climate Change
Part I: Pre-Homework
The students will be asked to watch a relevant Mythbusters at the following link:
https://www.youtube.com/watch?v=pPRd5GT0v0I
This video describes the greenhouse effect through an experiment. The mythbusters set up three
transparent boxes; one filled with CO2, one filled with methane and the other set as control. They then
monitor the temperature differences between the three boxes of a period of time.
Part II: In-class activities
Slide 1: Learning Objectives
Estimated time: 1 minute
Purpose: Inform students of the learning objectives for the lesson.
Students will be able to:
1) Identify an evidence of climate change, focusing on the relationship between CO2 concentrations and
atmospheric temperature.
2) Describe the greenhouse effect and identify the gases involved in it.
3) Describe how carbon enters the atmosphere as depicted by the carbon cycle
4) Identify sources of CO2 emissions
Slide 2: Climate Change:
Estimated time: 3 minutes
Purpose: This slide provides an introduction to the concepts of climate and weather, as well as
establishing a basic definition of anthropogenic climate change.
Split students into pairs, then pass out a worksheet packet of the blank graphs that will be presented in
this lesson to each pair of students. Introduce the topic of climate change by defining each of the words in
“anthropogenic climate change”. Change is to be defined as “to make the form, nature, content, future
course, etc., of (something) different from what it is or from what it would be if left alone”. Students are
not expected to provide this formal definition, but are expected to recognize that change denotes a
difference between two states of being. Ask the class the definition of climate. Ask for volunteers to
answer the question. The definition of climate that you would be looking for is “the long-term
precipitation and temperature patterns of an area”. Some follow-up questions you can ask are “What is the
difference between weather and climate?” with the answer being that weather is the short-term patterns of

pg.
176
precipitation and temperature such as a hot day or a thunderstorm while climate is the long-term patterns.
Or “What is the climate in Puerto Rico?” with the answer being tropical. Lastly it is important to define
the term anthropogenic as meaning “caused or produced by humans”. State that this lesson will primarily
cover anthropogenic climate change.
Figure 11: Depiction of natural climate change over the Earth's history
The Environmental Protection Agency’s website says the following about natural climate change:
Estimates of the Earth’s changing carbon dioxide (CO2) concentration (top) and Antarctic temperature
(bottom), based on analysis of ice core data extending back 800,000 years. Until the past century, natural
factors caused atmospheric CO2 concentrations to vary within a range of about 180 to 300 parts per
million by volume (ppmv). Warmer periods coincide with periods of relatively high CO2 concentrations.
NOTE: The past century’s temperature changes and rapid CO2 rise (to 390 ppmv in 2010) are not shown
here.

pg.
177
Slide 3: What is the greenhouse effect?
Estimate time: 6 minutes
Purpose: Illustrates how solar energy heats up the Earth and how greenhouse gases in the atmosphere
increase the absorption of infrared heat in the Earth’s atmosphere (Objective 2).
First, establish a definition of a greenhouse gas by asking students what they believe the definition of a
greenhouse gas to be. A greenhouse gas is formally defined as any gas that absorbs infrared radiation
produced by solar warming of the Earth's surface (Dictionary.com). Examples of these gases are carbon
dioxide (CO2), methane (CH4), nitrous oxide (NOx), and water vapor (H2O [g]). The greenhouse effect
can be formally defined as an atmospheric phenomenon in which infrared radiation of short wavelengths
is easily transmitted into the Earth’s atmosphere (specifically the troposphere), while infrared radiation of
longer wavelengths is less easily transmitted out of the atmosphere (specifically the troposphere) due to
its absorption by atmospheric greenhouse gases (dictionary.com)
Use an analogy that describes this effect using an actual greenhouse. In this analogy, the atmosphere is
like the “glass” of the greenhouse. Thermal energy from the sun is allowed to pass into the “glass”, yet is
partially unable to pass back out of the “glass”. This trapped energy then increases the temperature within
the greenhouse. Refer back to the Mythbusters video the students watched the previous night for
homework.
Next, Go through each of the steps of the greenhouse effect. Identify the various points in the
accompanying diagram where each step of the greenhouse effect occurs. The locations of these points in
the diagram are labeled as points 1 through 7. Ask the students what they think is happening at each
designated location on the diagram. An answer key to these points is provided below the blank diagram.

pg.
178
Figure 12: Greenhouse Effect diagram
Point 1: Solar radiation passes into the Earth’s atmosphere.
Point 2: Some of this radiation is reflected back into space by the atmosphere and Earth’s surface.
Point 3: The remaining radiation that was not reflected outward is then absorbed by the Earth’s surface.
Point 4: The solar radiation that was absorbed by the Earth’s surface is converted to thermal heat. This
thermal energy heats the Earth’s surface and is then radiated back out from the surface.
Point 5: A portion of the radiated thermal energy is absorbed by atmospheric greenhouse.
Point 6: The portion of thermal energy that was not absorbed by the greenhouse gases travels back to the
surface where it is emitted outward yet again.
Point 7: This thermal energy is reflected back off the surface of the earth and back out to space.

pg.
179
Figure 13: Diagram of the greenhouse effect (GRID Arendal and UNIP)

pg.
180
Slide 4: Which greenhouse gas has the greatest emissions?
Estimated time: 5 minutes
Purpose: Defines the different greenhouse gasses (Objective 2).
Ask the students what they believe is the greenhouse gas with the highest emissions and then reveal the
answer. Next, ask what they believe is the second greenhouse gas with the highest emissions and then
reveal the answer. Continue in this manner, until all four of the greenhouse gases are revealed. Have
students fill out their own graph as it is discussed. The answers include CO2 (carbon dioxide), CH4
(methane), NOx (nitrous oxides), F-gases (Fluorocarbons).
Figure 14: Relative percentage of greenhouse gases in terms of greenhouse gas emission levels (Environmental Protection Agency)
Explain that these gases are not necessarily bad for the environment. Carbon dioxide is only an issue
because it is currently present in the highest amounts recorded in the Earth’s history. It is for this reason
that the remainder of the lesson will focus on the effects of carbon dioxide concentrations on mean global
temperature.
82%
9%
6% 3%
Carbon dioxide
Methane
Nitrous Oxide
Flourine gases

pg.
181
Slides 5 - 7: Evidence of Climate Change Graph:
Estimated time: 10 minutes
Purpose: Have students identify evidence of anthropogenic climate change by proving that increases in
CO2 concentrations are positively correlated with increases in global temperature (Objective 1). Have
students identify evidence of anthropogenic climate change by proving increases in CO2 concentrations
can cause increases in global temperature (Objective 1).
Provided below are two blank graphs that are provided to students in the worksheet packet.

pg.
182
Ask students to fill in the above graphs in their worksheets. Students will work in pairs, with one student
creating the CO2 concentration graph and the other creating the temperature graph. Give the students 5
minutes to complete their graphs. Furthermore, give them another minute to compare the two graphs that
they have created. The data for these graphs was extrapolated from the graph in Figure 3.
Figure 15: A Comparison of Carbon Dioxide Concentrations and Global Temperature over the last century (National Oceanic and Atmospheric Administration)
The completed graphs should look similar to the graphs below.

pg.
183
57
57.4
57.8
58.2
58.6
59
1880 1890 1900 1910 1920 1930 1940 1950 1960 1970 1980 1990 2000 2010
57.45
57.15
57.55
57
57.3
57.55
57.75
57.95
57.657.65
57.95
58.2558.2
58.5
AnnualGlobalTemperature
AnnualGlobalTemperature
Annual Global Temperature from 1880 to 2010
Time (Years)
Ann
ua
lG
lob
al
Te
mp
era
ture
(Fah
ren
heit)
280
304
328
352
376
400
1880 1890 1900 1910 1920 1930 1940 1950 1960 1970 1980 1990 2000 2010
290294 295
300304
309 310 310315
325
337
352
367
388
AtmosphericCarbonDioxideconcentration
AtmosphericCarbonDioxideconcentration
Carbon Dioxide Concentration from 1880 to 2010
Time (Years)
Ca
rbo
nD
ioxid
eC
oncen
tra
tio
ns
(ppm
)

pg.
184
Go over the graph and have students correct their graphs if necessary. Ask the students what they think
this graph means. Discuss with students the correlation between CO2 concentrations and global
temperature. Next, ask students to apply their knowledge of greenhouse gases to the findings of their
graphs. What predictions can be made? The prediction that should be made is as follows: increasing CO2
concentration will cause atmospheric temperatures to increase. Provided below are additional
representations of the increases in greenhouse gases and temperature, respectively.
Figure 16: Greenhouse Gas concentrations from Year 0 to 2005 (Global Greenhouse Warming)
Figure 17: Relationship between Global Temperature Anomaly and Carbon Dioxide Concentration (Environmental Protection Agency)

pg.
185
Slide 8: How does carbon dioxide enter the atmosphere?
Estimated time: 7 minutes
Purpose: demonstrate the carbon cycle and how carbon enters the atmosphere as CO2 (Objective 3).
Because Carbon dioxide has the greatest emissions, discuss with the class how carbon enters the
atmosphere. Ask the students to fill out the diagram below on their worksheets. Students will continue
working in the same pairs as before. They can use the list of term to help determine which term belongs in
which space. This list of terms is comprised of the labels present in the diagram below. Give students
some time to discuss their ideas.
Explain each step of the carbon cycle with the entire class, starting with sunlight, and then moving onto
photosynthesis, living organic carbons, and animal/plant respiration. man-made carbon emission should
be mention separately, as they are not a part of the natural carbon cycle. Explain that all living beings
contain carbon. Furthermore, explain that carbon is exchanged between the oceans, air, and organisms via
numerous natural functions. An important aspect of the carbon cycle involves the decay of organisms into
the soil, returning nutrients to the soil. In cases where anaerobic decomposition has occurred over
millions of years, fossil fuels can be formed, explaining why high amounts of carbon are emitted in the
atmosphere as a product of burning fossil fuels.
Before administering this lesson, consult the diagram below for a more detailed representation of the
carbon cycle and the various related processes. For further student learning, students may consult the
website provided at the end of this document for an interactive version of the below diagram.
Figure 18: Simplified depiction of the carbon cycle (UCar.edu)

pg.
186
Figure 19: Detailed depiction of the carbon cycle (Sciencelearn.org)
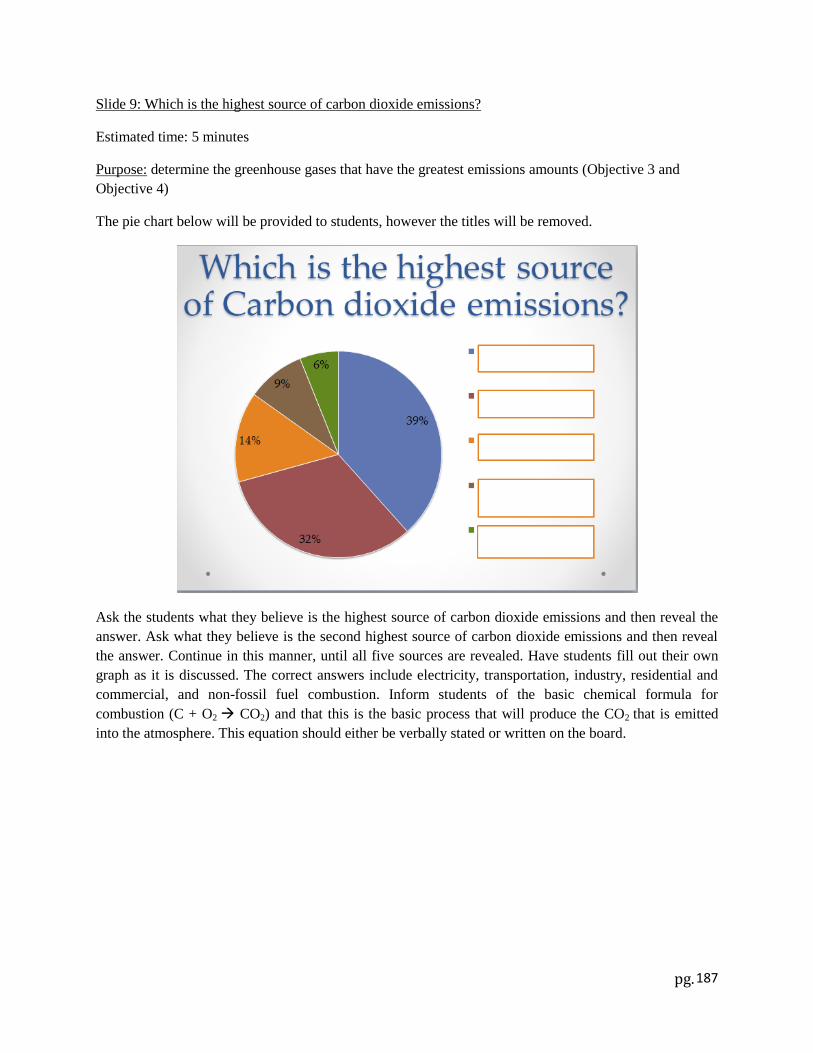
pg.
187
Slide 9: Which is the highest source of carbon dioxide emissions?
Estimated time: 5 minutes
Purpose: determine the greenhouse gases that have the greatest emissions amounts (Objective 3 and
Objective 4)
The pie chart below will be provided to students, however the titles will be removed.
Ask the students what they believe is the highest source of carbon dioxide emissions and then reveal the
answer. Ask what they believe is the second highest source of carbon dioxide emissions and then reveal
the answer. Continue in this manner, until all five sources are revealed. Have students fill out their own
graph as it is discussed. The correct answers include electricity, transportation, industry, residential and
commercial, and non-fossil fuel combustion. Inform students of the basic chemical formula for
combustion (C + O2 CO2) and that this is the basic process that will produce the CO2 that is emitted
into the atmosphere. This equation should either be verbally stated or written on the board.

pg.
188
Figure 20: Breakdown of carbon dioxide emission by source of emission (Environmental Protection Agency)
39%
32%
14%
9% 6%
Fossil fuel consumtion to produce Electricity
Burning fossil fuels for Transportation
Industrial use of fossil fuel
Residential and Commericial use of fossil fuel
Other (Non Fossil Fuel Combustion)

pg.
189
Slide 10: Activity- Pictionary (Sources of CO2 emissions)
Estimated time: 10 minutes
Purpose: illustrate the different sources of CO2 emissions (Objective 4)
Split the class into groups of four or five students. Give each group a timer and have them randomly
select four index cards per group, each labeled with sources of CO2 emissions. Each group will pick a
person to draw first, and that person will randomly select one of the index cards and attempt to draw the
source listed on a blank piece of paper. The remaining members of the group must attempt to guess the
source that is being drawn. The team will only be given one minute to guess the source being depicted.
Should the group be unsuccessful in guessing the source, the answer will be provided after the minute has
elapsed. The group will then decide on a new person to draw and continue this process until all four cards
have been selected.
After this process is complete, have each group categorize the source listed on each card, placing them
into the four categories. Students will write their categorizations on the picture that corresponds to each
source of carbon emission. The categorizations are as follows:
Electricity: light bulb, air conditioner, computer
Transportation: car, plane, motorboat
Industrial: Factory, smoke stack, freight train
Commercial/Residential: furnace, campfire, barbeque
.

pg.
190
Slide 11: How can we reduce CO2 emissions?
Estimated time: 5 minutes
Purpose: Encourage students to think proactively about what they can personally do to reduce CO2
emissions (Objective 4).
Ask the students how society as a whole can reduce CO2 emissions. Discuss this openly with the
students.
Possible responses may include:
• Use less energy
• turn off lights when you aren’t using them
• don’t leave the TV on when you aren’t watching it
• don’t overuse air conditioning
• Don’t drive as much- walk when you can or use public transportation
• Eat less red meat
• Use energy-efficient appliances
• Recycle or reuse products when possible
• Buy local produce
Then, ask students how they personally can reduce CO2 emissions. Write the responses on the board to
create a list of ideas. Make sure to distinguish the differences between what society can do and what the
students can personally do. Also, make sure to emphasize that individual actions can make an impact.
These actions, when done by many individuals, can have a huge impact in lessening carbon dioxide
emissions.

pg.
191
77%
14%
8% 1% Carbon dioxide
Methane
Nitrous Oxide
Flourine gases
Part III: Homework activity
Inform students that there are two copies of the homework activity at the end of the worksheet pack. Each
student should answer the questions and return the worksheet the next day.
Instructions:
Students will complete the following activities, like a scavenger hunt.
1. Find a brief story from someone you know about how climate change affects him or her.
Write a description of this story.
2. Find an object (a picture or the object) that you use or describe an activity that you
encounter in your life that emits greenhouse gases.
3. Describe a new way to use the object or complete the activity that you chose in step 2 in a
way that emits less greenhouse gases.
Part IV: Additional materials
Lesson 1 Worksheet (English)
Lesson 1: Causes and Evidences of Climate Change
Please fill out the following graphs when your teacher instructs you to do so.
1. Which Greenhouse Gas has the greatest emissions? Fill out this graph as the class discusses what the
greenhouse gas with the greatest emissions is.

pg.
192
2. Global Temperatures vs. CO2 Concentrations: Split into pairs. Using the below table, have one person
create the graph for global temperatures and one person create the graph for CO2 concentrations.
CO2 Concentration Graph:
Year CO2 (ppm)
1880 290
1890 294
1900 295
1910 300
1920 304
1930 309
1940 310
1950 310
1960 315
1970 325
1980 337
1990 352
2000 367
2010 388

pg.
193
Global Temperature Graph:
Year Temp (F)
1880 57.45
1890 57.15
1900 57.55
1910 57.0
1920 57.3
1930 57.55
1940 57.75
1950 57.95
1960 57.6
1970 57.65
1980 57.95
1990 58.25
2000 58.2
2010 58.5

pg.
194
Now compare these two graphs. What is the correlation between global temperature and CO2
concentrations?
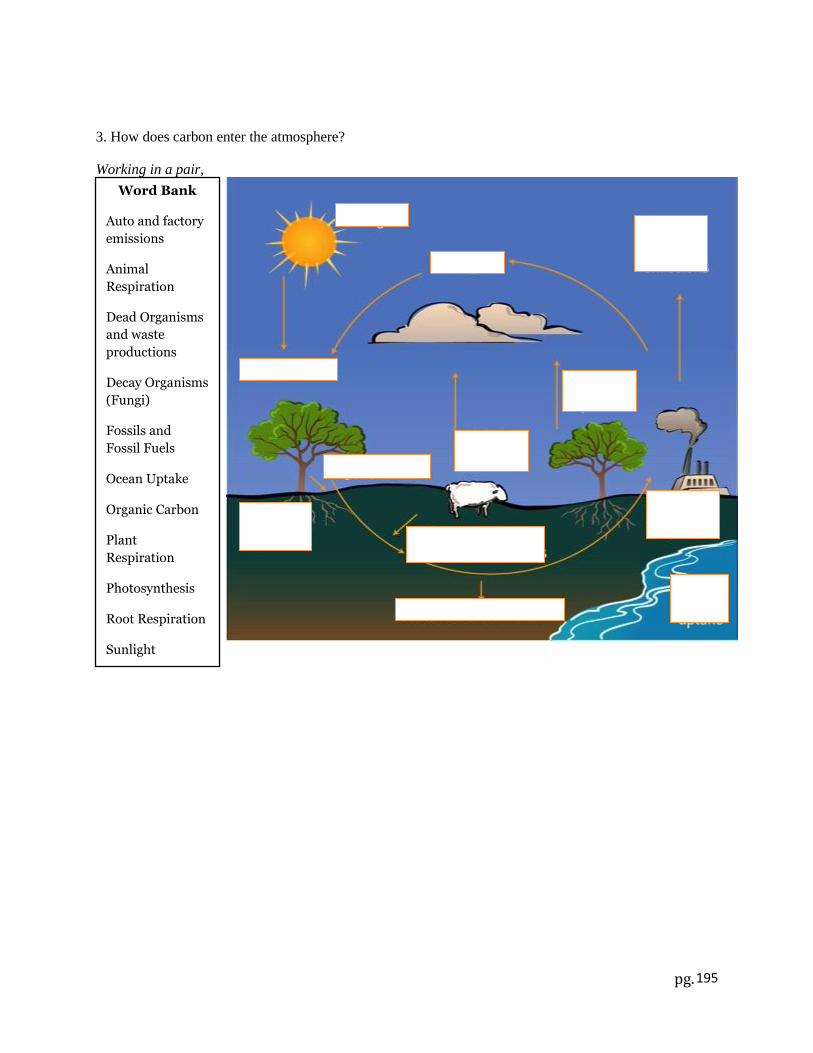
pg.
195
3. How does carbon enter the atmosphere?
Working in a pair,
fill out the below
graph using the
word bank below
Word Bank
Auto and factory
emissions
Animal
Respiration
Dead Organisms
and waste
productions
Decay Organisms
(Fungi)
Fossils and
Fossil Fuels
Ocean Uptake
Organic Carbon
Plant
Respiration
Photosynthesis
Root Respiration
Sunlight

pg.
196
39%
32%
14%
9%
6% Electricity
Transportation
Industry
Residential and Commericial
Other (Non Fossil Fuel Combustion)
4. Which is the highest source of carbon dioxide emissions? Fill out this graph as the class discusses what
the highest source of carbon dioxide emissions is.

pg.
197
Pictionary Activity Worksheet (English)
Pictionary Activity: Below are the cards to be used for the Pictionary activity. Cut out the cards
before class and give each group 4 cards.
Light Bulb
Light Bulb
Air Conditioner
Air Conditioner
Computer
Computer
Car
Car
Plane
Plane
Motorboat
Motorboat
Factory
Factory

pg.
198
Smoke Stack
Smoke Stack
Freight Train
Freight Train
Furnace
Furnace
Campfire
Campfire
Barbecue
Barbecue

pg.
199
Homework Activity Worksheet (English)
Name:________________________________________________________
Homework Activity
1. Find a brief story from someone you know about how Climate Change affects him or her.
Write down a description of this story.
______________________________________________________________________________
______________________________________________________________________________
______________________________________________________________________________
______________________________________________________________________________
______________________________________________________________________________
______________________________________________________________________________
____________
2. Find an object (a picture or the object) you use or describe an activity you encounter in
your life that emits greenhouse gases.
______________________________________________________________________________
______________________________________________________________________________
______________________________________________________________________________
______
3. Describe a new way to use this object or complete this activity in a way that emits less
greenhouse gases.
___________________________________________________________________________
___________________________________________________________________________
___________________________________________________________________________
___________________________________________________________________________
___________________________________________________________________________
___________________________________________________________________________
________________________________________________________________________

pg.
200
Appendix F: Proposed Learning Unit- Lesson 2 Lesson 2: The Impacts of Climate Change
Part I: In-Class Activities
Slide 13: Learning Objectives
Estimated time: 1 minute
Purpose: Inform students of the learning objectives for the lesson.
Read these learning objectives to the students.
Students will be able to:
5) Identify the predicted impacts of a warmer atmosphere on the earth, focusing on the water cycle and
oceans
6) Determine the impacts of climate change on animals and plants in El Yunque, focusing on the impacts
of rising temperature and changing precipitation patterns.
7) Determine the impacts of climate change on humans, especially how changing precipitation patterns,
rising sea levels, and changing animal and plant habitats affect humans

pg.
201
Slide 14:What causes a warmer atmosphere?
Estimated time: 3 minutes
Purpose: Review what was discussed in the previous lesson by discussing how increased CO2 causes
atmospheric temperatures to increases.
Ask the question to the class of students, having them provide various answers based on the previous
lesson. This question is meant to be a quick review of topics that students will have learned in the
previous day’s lesson on the causes and evidence of climate change. Continue this discussion until
students have provided three accurate responses. Possible responses may include increases in CO2
concentrations, increased greenhouse gas emissions, continued deforestation, and continued burning of
fossil fuels.

pg.
202
Slide 15: What are some natural processes that can be affected by a warmer atmosphere?
Estimated time: 5 minutes
Purpose: Explain the impacts of a warmer atmosphere on natural processes (Objective 5).
Briefly explain that a warmer atmosphere affects many natural cycles and processes, including the
nitrogen cycle, carbon cycle, and water cycle, among others. Provided below are explanations of these
cycles as well as a description of the predicted impacts.
Carbon Cycle – The carbon cycle, as explained in the previous lesson, starts with the sun’s energy being
used for photosynthesis in plants. Plants and animals can both be identified as organic carbons. Both
animal respiration and the burning of fossil fuels contribute CO2 to the atmosphere. Additionally, plants
and animals contribute carbon to the earth when they decompose. Oceans act as carbon sinks and can take
in atmospheric carbons. Lastly, there are deposits of carbon that are locked away in glacial ice and
bedrocks, but this carbon is much less accessible. Anthropogenic contributions to the carbon cycle are
strongly tied to climate change. A significantly warmer atmosphere (due to anthropogenic climate
change) would indicate that distribution of accessible carbon would greatly differ from any other period
in the Earth’s recorded history. Looking at CO2 levels from the past 800000 years substantiates this
conclusion. Before the past decade, it is believed that atmospheric CO2 levels had not risen past 300 ppm.
Nitrogen Cycle – The nitrogen cycle contains 4 main processes: nitrogen fixation, ammonification,
nitrification, and denitrification. Nitrogen fixation is the process of converting nitrogen gas (N2) to
ammonium (NH4+). This process is primarily done by certain bacteria and allows certain organisms to
utilize nitrogen directly from the atmosphere. Next ammonification occurs when organic nitrogen is
converted into NH4+ by organisms that decompose matter such as various fungi. From there, NH4
+ is
converted into nitrate (NO3-) by bacteria in the process known as nitrification. Lastly, the anaerobic
process of denitrification occurs which converts NO3- into nitrogen gas (N2), nitrous oxide gas (NO2),
nitrous oxide (N2O) and nitric oxide (NO). Due to human activities, there are excess amounts of
atmospheric nitrogen oxides (NOX). Nitrous oxides are currently the world’s third largest contributor to
temperature increases of the atmosphere. This is due to increased release of nitrogen into the atmosphere
during the combustion of fossil fuels. Furthermore, this accumulation of nitrogen has been seen to affect
the functionality of varied ecosystems. Other human impacts include increased concentrations of
ammonia (NH3) due to increased fertilizer use and increased NO concentrations due to the elevated
presence of N2 in the atmosphere in the last century.
Water Cycle – The water cycle describes the collective movements of water throughout terrestrial and
oceanic biomes, and the atmosphere. Basic processes involved in this cycle are evaporation, transpiration,
precipitation, and condensation. This process will be described in greater detail in the following slides.
The water cycle would be affected in terms of increased evaporation and resultant decreased precipitation.
This phenomenon can be confusing for students since a common misconception would be that increases
in evaporation lead to increased precipitation. While this is somewhat true, the former description does
not account for global wind patterns affecting the tropics and subtropics. The winds in subtropical areas
(such as Puerto Rico) carry the moisture-laden air to equatorial tropics, therefore increasing rainfall in the
tropics, but decreasing it in the subtropics.

pg.
203
Slide 16: What are the specific impacts of a warmer atmosphere on the water cycle?
Estimated time: 8 minutes
Purpose: Explain how a warmer atmosphere impacts the water cycle (Objective 5).
Show students the above diagram. Explain the various steps listed.
Evaporation: The changing of liquid water into water vapor
[H2O (l) + Energy H2O (g)].
Condensation: The changing of water vapor into liquid water in the form of clouds or fog
[H2O (g) H2O (l) + Energy].
Transpiration: The evaporation of liquid water from vegetation. It creates a cooling effect when it occurs
in large-scale scenarios, such as tropical rainforests.
Runoff: The transfer of liquid water from one physical location to another, usually from a higher
elevation to a lower elevation and/or body of water.
Precipitation: The falling of liquid water from clouds or fog down to the surface of the earth. Precipitation
can take the form of rain, hail, snow, sleet, and fog drip.
Next, lead a guided inquiry, asking how a warmer atmosphere might affect each of these steps. It is
important that you frame the changes that may occur in the broad sense (i.e. precipitation changes and
evaporation changes). This will ensure that this discussion does not become too narrowly focused on
topics that will not be addressed.
Two more detailed and holistic depictions of the water cycle are provided below for the purpose of
instructors being able to better understanding some of the more intricate portions of water cycle.
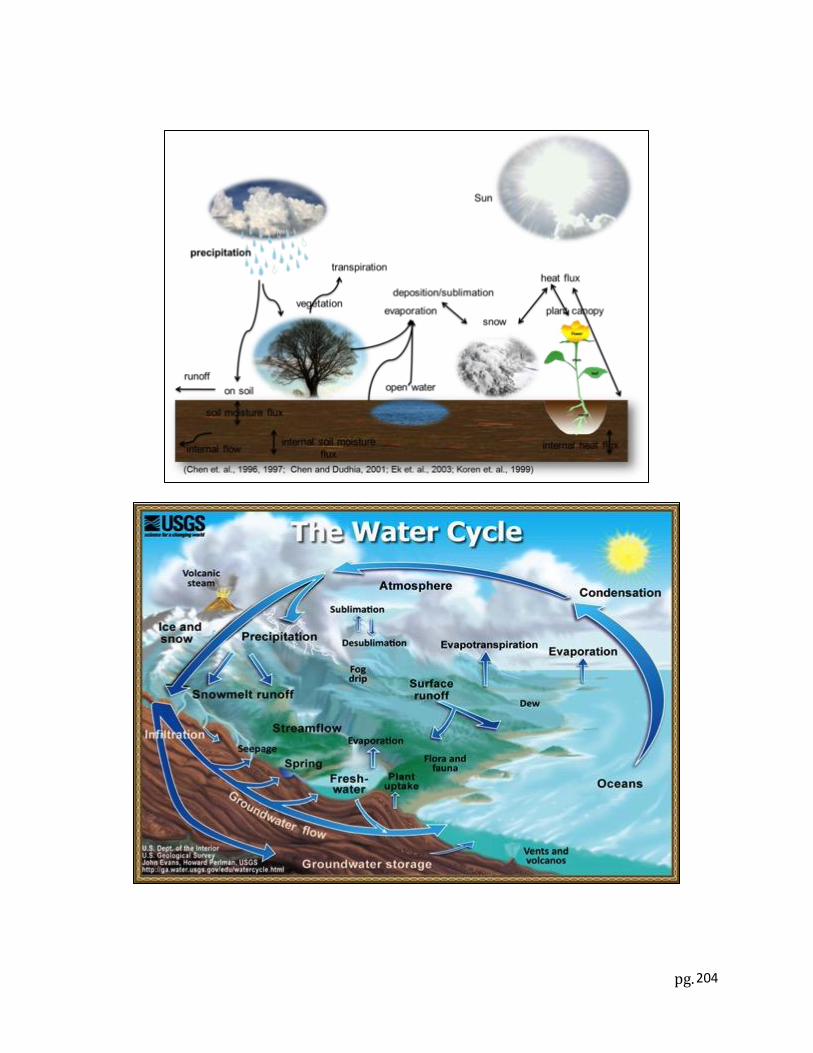
pg.
204

pg.
205
Slide 17: How would warmer atmosphere affect the oceans?
Estimated time: 3 minutes.
Purpose: Describe how increased atmospheric temperatures cause increased ocean temperatures
(Objective 5).
Ask students how a warmer atmosphere affects the oceans. Have students provide different ideas. If
students do not provide the answer “warmer oceans” after 2 minutes, you should provide the response.
The following graph will then be displayed. This graph shows the change in ocean temperatures from
1880 to 2012, relative to the average ocean temperature from 1971 to 2000.

pg.
206
Slide 18: What are possible environmental effects of warmer oceans?
Estimated time: 4 minutes
Purpose: Discuss the effects of warmer oceans (Objective 5).
Ask students what the possible environmental effects of warmer oceans are and discuss each topic further.
Then ask students what effects of warmer oceans would particularly affect Puerto Rico.
Possible Answers include the following:
Rising sea levels – Sea ice will begin to melt more rapidly as ocean temperatures rise, creating excesses
of liquid water that will cause global sea levels to rise.
Changed chemical composition – Warmer oceans can more readily act as a sink of carbon dioxide. As
more CO2 is added into the ocean, the chemical process of creating carbonic acid (CO2 + H2O H2CO3)
happens in greater amounts. This can lead to slight shifts (or potential differences) in the ocean’s pH
toward acidic levels (pH<7).
Coral reef changes – as the chemical composition of oceans change, fragile habitats like the coral reef
will change, namely by experiencing excessive coral bleaching. Coral then dies, eliminating prime aquatic
habitats.
Loss of aquatic wildlife – as the chemical composition of oceans change, certain species of fish and
plants will be poorly adapted to new chemical conditions. As well, species many also be unable to survive
in warmer waters and die as a result.
Habitat shifts – Species that are not well adapted to the rising temperatures in the oceans will cause them
to move to other areas that have conditions they are more accustomed to.

pg.
207
Slide 19: What are the impacts of a warmer atmosphere on the water cycle?
Estimated time: 4 minutes
Purpose: Review the effects of a warmer atmosphere on oceans and the water cycle (Objective 5).
Review the below diagram with the class in order to emphasize how a warmer atmosphere can cause
warmer oceans which can cause sea levels to rise and can change evaporation which can cause
precipitation changes.
Warmer atmosphere: This is caused by increased greenhouse gas emissions. This observed heating
effect has a profound impact on the water cycle. In particular, rates of all processes involving evaporation
would become increased. Additionally, increased global temperature due to increased greenhouse effect
would lead to warmer oceans.
Warmer oceans: The oceans would experience a similar warming effect as a result of increased
greenhouse effect. These warmer oceans would lead to the occurrence of many other phenomena,
including the thermal expansion of the oceans water and the increased melting of sea ice.
Sea level rise: Sea levels could rise drastically if continued climate change were to occur. This is partially
due to slight thermal expansion of water as it is heated. This effect is usually very miniscule when
involving small amounts of liquid. However, this expansion would be able to be observed and measured
when occurring in large bodies of water, such as the ocean. Another source of sea level rise would be the
melting of sea ice and increased glacial melting/run-off, which would deposit excess liquid water into the
ocean.
Change in evaporation: Evaporation would increase in tropical regions as global temperatures increase.
This would occur in all processes that involve evaporation, including transpiration. The atmosphere’s
capacity to hold water would increase by 7% for each degree Celsius that atmospheric temperature rises.
This allows for increased ability to hold water meaning that the atmosphere’s saturation point for holding
water vapor would become greater. According, as the amount that water is held in the atmosphere
changes, so does patterns on precipitation.
Warmer Atmosphere
Warmer Oceans
Sea Level Rise
Change in Evaporation
Change in Precipitation

pg.
208
Change in precipitation: Depending on the region, precipitation could either increase or decrease. Wind
patterns are a crucial factor in whether precipitation will increase or decrease. Equatorial regions, such as
the Amazon, will experience increases in precipitation. This is largely because winds will carry the
excesses of evaporated moisture to these areas. Puerto Rico is an area that would, although variable in its
rain patterns across the island, experience a general decrease in precipitation. Additionally, Puerto Rico
would experience more extreme seasons, with less rain falling in the dry seasons and more rain falling in
the wet season. The most immediate impact of a drying trend in Puerto Rico would be increased
likelihood of droughts.

pg.
209
Slide 20: Habitat Shift Activity
Estimated Time: 20 minutes
Purpose: Illustrate the effects of changes in precipitation and increased global temperatures on animals
and plants (Objective 6).
Students will be given an activity to further illustrate the effects of precipitation changes and increasing
global temperature, specifically on Puerto Rico.
Goal: Understand the effects of climate change on animal and plant habitats in El Yunque and how these
effects are connected and can cause habitat shifts for animal species that are endemic to, or only found on,
Puerto Rico.
Each group will be provided with:
-Picture of a typical Puerto Rican mountain, labeled with different habitat descriptions
-Pictures of various animals of El Yunque that are endemic to Puerto Rico including coquís,
Puerto Rican parrots, and elfin woods warblers
-Pictures of various plants of El Yunque that are native to Puerto Rico including the sierra palm,
aceitillo falso , and bananas.
-Instruction sheet describing the activity, as well as the habitat requirements for the different
animals and plants
Directions:
-Divide students into groups of 5
-Students will first place the different habitats on the picture of the mountain based on their required
temperature and precipitation levels. This information is provided in the tables accompanying this
activity.
-Have students place the provided animals into their corresponding habitats on the picture of the mountain
by following their respective habitat descriptions and needs. Specifically, use each animal’s temperature
range, diet, possible eleavations and precipitation needs to determine its placement on the mountain
diagram. This information is provided in the tables accompanying this activity.
-Next, students will look at each scenario described below, and move each habitat according to the
changes that have occurred due to that specific climate change.
-Students will then move animals and plants to new locations as the instruction sheet describes habitat
changes that are reflective of climate change.
Note: If animals cannot be placed in any of the habitats, they should be left off of the page.

pg.
210
-Students will reflect on how climate change can affect the various biomes and animal habitats in Puerto
Rico.
Students will write their responses to each question on the provided worksheets. When all teams have
finished, go over the questions with the students. Students are expected to see the disappearance of the
elfin woods habitat as well as the elfin-woods warbler. They also will see that the habitats of most of the
listed species will shift up the mountain to higher elevations.
Discuss with students that habitat shift is not something that is only hypothetical, but is actually
happening in Puerto Rico. One species that is currently experiencing habitat shift is the elfin-woods
warbler. This species is currently seeing the disappearance of its prime habitat, the elfin forest, and being
forced to relocate to habitats that it is not well suited for. This is a trend that has been noted by USFS
species managers in El Yunque National Forest. Should current climate change trends continue, the elfin-
woods warbler would eventually completely disappear Puerto Rico. Similar trends have also been
observed for other species that are endemic, or can only be found in Puerto Rico, such as the Puerto Rican
parrot.
pg.
211
Slide 21: How do the predicted impacts of climate change affect humans?
Estimated time: 5 minutes
Purpose: Discuss the effects of rising sea levels, changing precipitation patterns, changing animal
and plant habitats on human beings in Puerto Rico (Objective 7).
Ask students to brainstorm how each of these phenomena (rising sea levels, changing precipitation
patterns, changing animal and plant habitats) can affect human beings in Puerto Rico. The effects may
include water and food shortages, loss of coastal zones, more extreme weather and its economic
consequences
According to the Intergovernmental Panel on Climate Change (IPCC), regions such as Puerto Rico, and
the Caribbean as a whole, will experience decreases in precipitation as climate change continues to occur
at its current rate. This is a matter of concern for the island of Puerto Rico, since many of its habitats are
reliant on rainfall. With decreases in rainfall, there would be definite impacts on the inhabitants of Puerto
Rico including increased potential for droughts and water shortages. Furthermore, the 2014 IPCC report
on small islands greatly describe the affects humans would face as a result on climate change. Particular
statements that capture many of the issues Puerto Rico faces are as follows:
Intensive coastal development in the limited coastal zone, combined with population
growth and tourism, has placed great stress on the coast of some small islands and has
resulted in dense aggregations of infrastructure and people in potentially vulnerable
locations (pg. 1623).
Extreme weather and climate events such as tropical cyclones, storm surges, flooding,
and drought can have both short- and long-term effects on human health, including
drowning, injuries, increased disease transmission, and health problems associated with
deterioration of water quality and quantity. Most small island nations are tropical areas
with weather conducive to the transmission of diseases such as malaria, dengue, filariasis,
and schistosomiasis (pg. 1624).

pg.
212
Part II. Additional Materials
Habitat Activity (English)

pg.
213
Forest Requirements: The forests below can only exist where the precipitation level and the
average temperature ranges match the below requirements.
Forest Level Precipitation
Levels (inches/year)
Average Temperature Range
(° F)
Tabonuco Forest < 100 80– 85
Palo Colorado Forest 150- 180 75 – 80 Sierra Palm Forest 100-150 70 – 75
Elfin Forest > 180 65 – 70
Animal and Plant Requirements: The animals and plants below can only exist where the
precipitation level, the average temperature ranges, and diet match the below requirements.

pg.
214
Animal Habitat
Temperature Range
(° F)
Habitat Precipitation
Range (inches/year)
Diet
Predators
Coquí 65– 85 > 32 insects Puerto Rican boa
Puerto Rican parrot 70– 85 < 150 plants Puerto Rican boa
Elfin-woods warbler 65– 75 < 200 insects Puerto Rican boa
Puerto Rican boa 80– 85 < 100 birds and
lizards None
Puerto Rican twig anole
80– 85 < 100 insects Puerto Rican boa
Sierra palm 70– 75 < 150 photosynthes
is Puerto Rican
parrot
Aceitillo falso 80– 85 < 100 photosynthes
is Puerto Rican
parrot
Little fire ant 65 – 85 Any plants Birds and lizards
Bananas 75 – 85 < 180 photosynthes
is
Little fire ant and Puerto Rican
parrot
Step 2: The original condition
According to the original condition below, place the forests in the elevation section on the El
Yunque map. Make sure that the forest is in the elevation section of El Yunque that has the
precipitation levels and average temperature ranges that are required for that forest. Then place
the animals and plants in the elevation section on the El Yunque map that has the precipitation
levels, average temperature ranges, and diet that are required for that forest.
Original Condition:
Section Elevation
(ft. above sea level)
Precipitation Level
(inches/year)
Average Temperature (° F)
1 < 2000 90 82 2 2000-2500 165 77 3 2500-3000 125 72 4 > 3000 190 67

pg.
215
Step 3: The effects of changing temperatures and precipitation levels on habitats.
Scenario 1: The precipitation levels have decreased from their original levels by 50 inches per
year.
Fill in the graph below, change the precipitation levels and average temperature ranges
according to the above scenario.
Section Elevation
(ft. above sea level) Precipitation Level
(inches/year) Average
Temperature (° F) 1 < 2000 82 2 2000-2500 77 3 2500-3000 72 4 > 3000 67
Move the forests in the elevation section on the El Yunque map. Make sure that the forest is in
the elevation section of El Yunque that has the precipitation levels and average temperature
ranges that are required for that forest. Then move the animals and plants in the elevation
section on the El Yunque map that has the precipitation levels, average temperature ranges, and
diet that are required for that forest.
Scenario 2: The average temperatures of all of the habitats have increased from their original
measurements by 5° F
Fill in the graph below, change the precipitation levels and average temperature ranges
according to the above scenario.
Section Elevation
(ft. above sea level) Precipitation Level
(inches/year) Average
Temperature (° F) 1 < 2000 90 2 2000-2500 165 3 2500-3000 125 4 > 3000 190
Move the forests in the elevation section on the El Yunque map. Make sure that the forest is in
the elevation section of El Yunque that has the precipitation levels and average temperature
ranges that are required for that forest. Then move the animals and plants in the elevation
section on the El Yunque map that has the precipitation levels, average temperature ranges, and
diet that are required for that forest.

pg.
216
Scenario 3: The precipitation levels have decreased from their original levels by 50 inches per
year AND the average temperatures of all of the habitats have increased from their
original measurements by 5° F
Fill in the graph below, change the precipitation levels and average temperature ranges
according to the above scenario.
Section Elevation
(ft. above sea level) Precipitation Level
(inches/year) Average
Temperature (° F) 1 < 2000 2 2000-2500 3 2500-3000 4 > 3000
Move the forests in the elevation section on the El Yunque map. Make sure that the forest is in
the elevation section of El Yunque that has the precipitation levels and average temperature
ranges that are required for that forest. Then move the animals and plants in the elevation
section on the El Yunque map that has the precipitation levels, average temperature ranges, and
diet that are required for that forest.
Scenario 4: The precipitation levels have decreased from their original levels by 75 inches per
year AND the average temperatures of all of the habitats have increased from their original
measurements by 10° F.
Fill in the graph below, change the precipitation levels and average temperature ranges
according to the above scenario.
Section Elevation
(ft. above sea level) Precipitation Level
(inches/year) Average
Temperature (° F) 1 < 2000 2 2000-2500 3 2500-3000 4 > 3000
Move the forests in the elevation section on the El Yunque map. Make sure that the forest is in
the elevation section of El Yunque that has the precipitation levels and average temperature
ranges that are required for that forest. Then move the animals and plants in the elevation
section on the El Yunque map that has the precipitation levels, average temperature ranges, and
diet that are required for that forest.

pg.
217
Step 4: Reflection
Answer the following questions.
1) What can be said about the effect that changes in precipitation levels have on the plants and
animals?
2) What can be said about the effect that changes in temperature have on the plants and
animals?
3) What can be said about the effect that changes in both temperature and precipitation levels
have on the plants and animals?
4) As the animal habitats change in response to the above scenarios, what can be said about its
affects on the food chains?
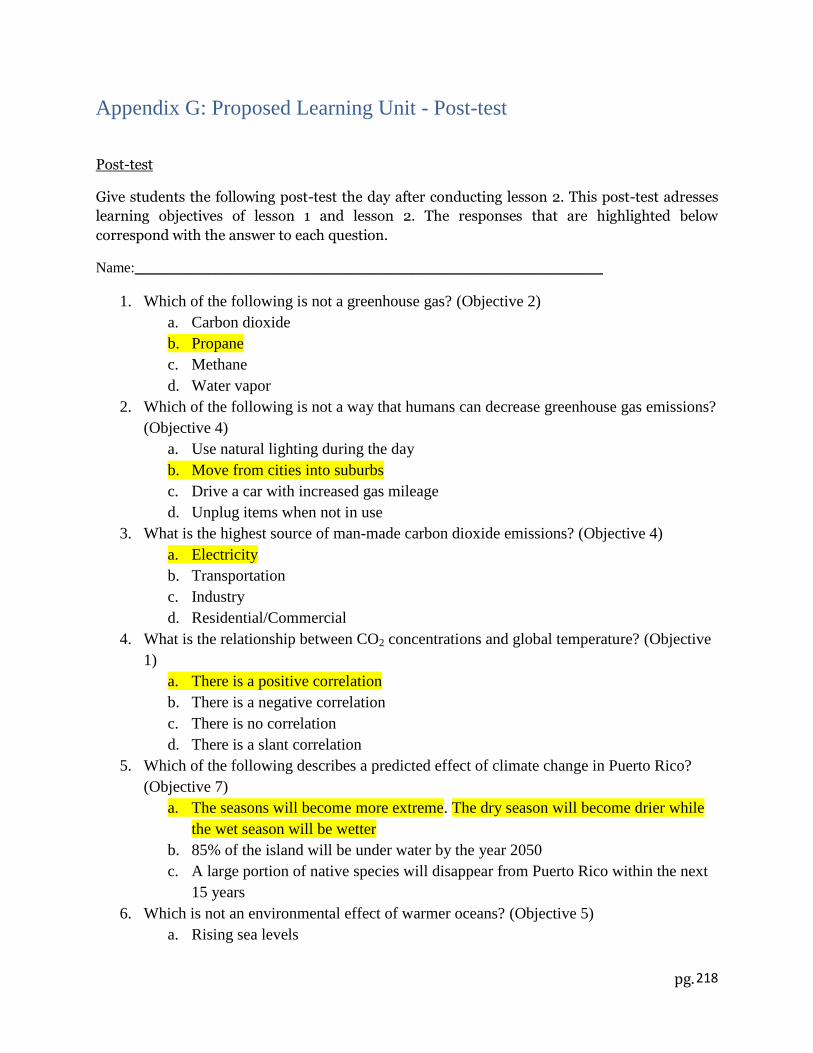
pg.
218
Appendix G: Proposed Learning Unit - Post-test
Post-test
Give students the following post-test the day after conducting lesson 2. This post-test adresses
learning objectives of lesson 1 and lesson 2. The responses that are highlighted below
correspond with the answer to each question.
Name:________________________________________________________________
1. Which of the following is not a greenhouse gas? (Objective 2)
a. Carbon dioxide
b. Propane
c. Methane
d. Water vapor
2. Which of the following is not a way that humans can decrease greenhouse gas emissions?
(Objective 4)
a. Use natural lighting during the day
b. Move from cities into suburbs
c. Drive a car with increased gas mileage
d. Unplug items when not in use
3. What is the highest source of man-made carbon dioxide emissions? (Objective 4)
a. Electricity
b. Transportation
c. Industry
d. Residential/Commercial
4. What is the relationship between CO2 concentrations and global temperature? (Objective
1)
a. There is a positive correlation
b. There is a negative correlation
c. There is no correlation
d. There is a slant correlation
5. Which of the following describes a predicted effect of climate change in Puerto Rico?
(Objective 7)
a. The seasons will become more extreme. The dry season will become drier while
the wet season will be wetter
b. 85% of the island will be under water by the year 2050
c. A large portion of native species will disappear from Puerto Rico within the next
15 years
6. Which is not an environmental effect of warmer oceans? (Objective 5)
a. Rising sea levels

pg.
219
b. Coral reef changes
c. Changed chemical compositions
d. Increased waves
7. From among the following, what do greenhouse gases trap in the atmosphere? (Objective
2)
a. Water
b. Oxygen
c. Carbon dioxide
d. Thermal energy
8. Climate change experts have stated that increases in greenhouse gases can lead to
increases in atmospheric temperature. Which is not an effect of a warmer atmosphere?
(Objective 5)
a. Warmer oceans
b. Longer days
c. Changing conditions for animals and plants
d. More evaporation
9. Which of the following is an effect of climate change that affects wildlife? (Objective 6)
a. Greenhouse gases are poisoning animals
b. Animals are migrating farther north than usual
c. Animals are migrating at different times of the year
d. Greenhouse gases are affecting reproduction patterns
10. Which of the following does not directly affect atmospheric carbon levels? (Objective 3)
a. Plant respiration
b. Animal respiration
c. Decay of organic matter
d. Burning of fossil fuels
11. What is an impact of changing animal and plant habitats on humans? (Objective 7)
a. Increased noise pollution due to coqui overpolulation
b. Lower food supply due to precipitation changes
c. Architectural damage due to birds nesting in city buildings
d. Increase of growth of poisonous plants in residential areas
12. Which of the following is not an effect of climate change that is currently affecting
Puerto Rico? (Objective 6)
a. Rising sea levels
b. Changes in the habitats of native animals
c. Changes in precipitation patterns
d. Decreased coastal erosion

pg.
220
Answer the following questions honestly and openly. Your feedback will be utilized and is greatly
appreciated
1. Did you enjoy the past two lessons?
2. Name one thing you liked about the lessons.
3. Name one thing you did not like about the lessons.
4. Do you have an interest in learning more about climate change after taking part in these lessons?
5. State one additional climate change subject you would like to learn about that was not included in
the lessons.
6. State one thing you did not know before the lesson that you now know after completing these
lessons.

pg.
221
Appendix H: Lesson PowerPoint Presentation (Spanish)
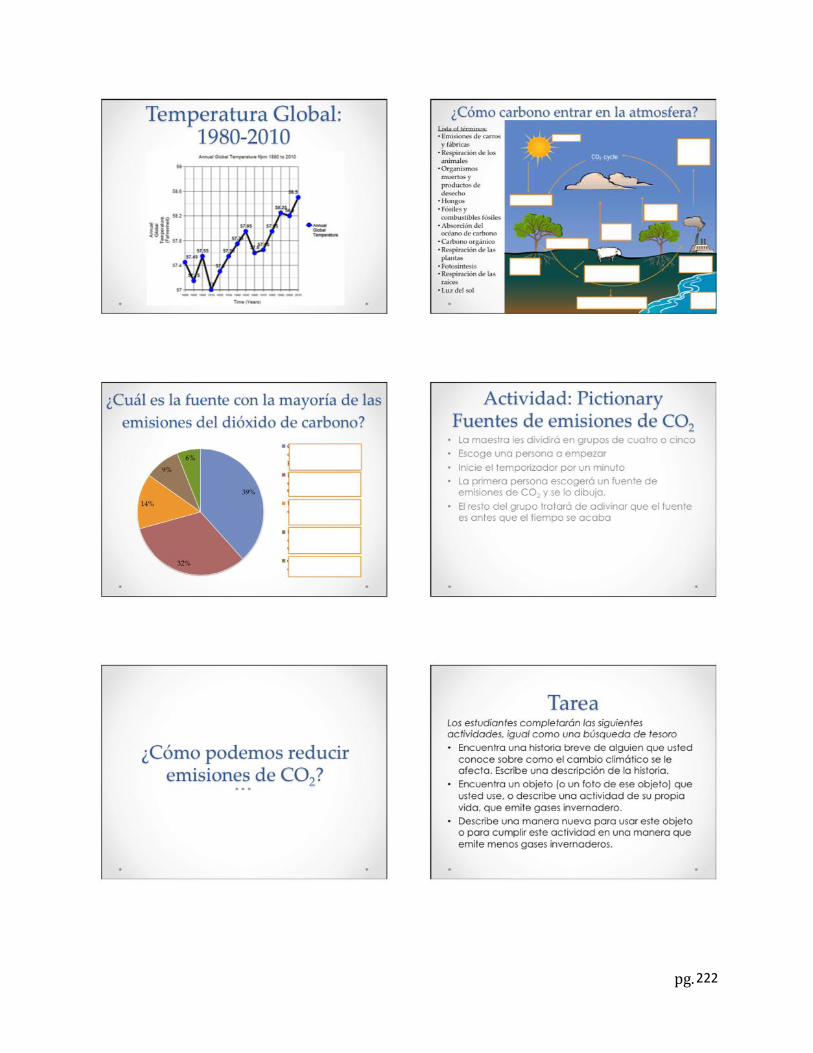
pg.
222

pg.
223

pg.
224

pg.
225
Appendix I: Proposed Learning Unit (Translated) – Pre-test
Pre-prueba
Hora prevista: 10 minutos
Dar a los estudiantes la siguiente pre-prueba un dia antes de la realizacion de lección 1. Esta pre-prueba se
dirige a los objectivos de lecciones 1 y 2. Las respuestas destacados abajo son las respuestas correctas.
Nombre: ______________________________________________________________________
1. ¿Cuál de los siguientes no es un gas invernadero? (Objetivo de Aprendizaje 2)
a. Dióxido de carbono
b. Propano
c. Metano
d. El vapor de agua
2. ¿Qué es la relación entre las concentraciones de CO2 en la atmósfera y la temperatura
global? (Objetivo de Aprendizaje 1)
a. Hay una correlación positiva
b. Hay una correlación negativa
c. No hay correlación
d. Existe una correlación diagonal
3. De los siguientes, ¿cual es algo que los gases invernadero atrapan en la atmósfera?
(Objetivo de Aprendizaje 2)
a. Agua
b. Oxígeno
c. Dióxido de carbono
d. La energía térmica
4. ¿Cuál de los siguientes no es una manera en que la gente pueden disminuir emisiones de
gases invernaderos? (Objetivo de Aprendizaje 4)
a. Utilice iluminación natural durante el día
b. Mudar de las ciudades a los suburbios
c. Manejar un carro con un mayor rendimiento de gasolina
d. Apagar dispositivos electrónicos cuando no esté en uso
5. ¿Cuál de los siguientes describe un efecto predicho del cambio climático en Puerto Rico?
(Objetivo de Aprendizaje 7)
a. Las estaciones serán más extrema. La estación seca se volverá mas seco, mientras
que la temporada de lluvias será más húmedo
b. 85% de la isla estará bajo el agua para el año 2050
c. Un gran parte de las especies nativas desparecerá de Puerto Rico de los próximos
15 años
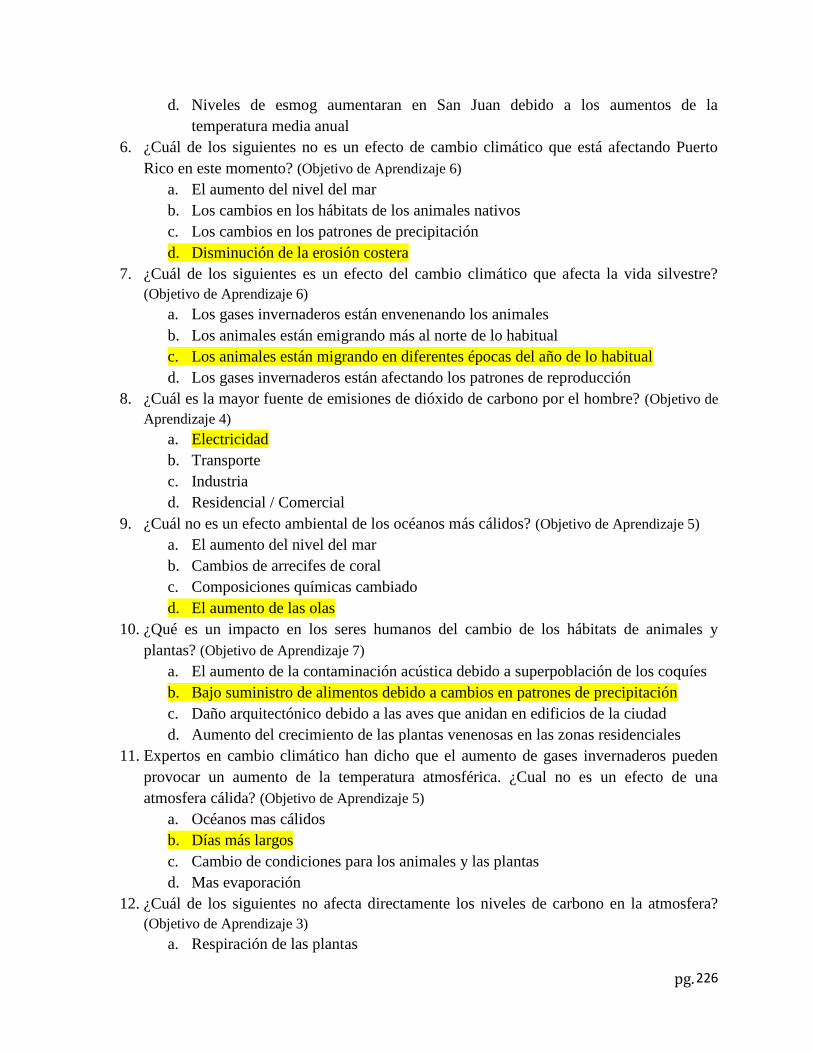
pg.
226
d. Niveles de esmog aumentaran en San Juan debido a los aumentos de la
temperatura media anual
6. ¿Cuál de los siguientes no es un efecto de cambio climático que está afectando Puerto
Rico en este momento? (Objetivo de Aprendizaje 6)
a. El aumento del nivel del mar
b. Los cambios en los hábitats de los animales nativos
c. Los cambios en los patrones de precipitación
d. Disminución de la erosión costera
7. ¿Cuál de los siguientes es un efecto del cambio climático que afecta la vida silvestre?
(Objetivo de Aprendizaje 6)
a. Los gases invernaderos están envenenando los animales
b. Los animales están emigrando más al norte de lo habitual
c. Los animales están migrando en diferentes épocas del año de lo habitual
d. Los gases invernaderos están afectando los patrones de reproducción
8. ¿Cuál es la mayor fuente de emisiones de dióxido de carbono por el hombre? (Objetivo de
Aprendizaje 4)
a. Electricidad
b. Transporte
c. Industria
d. Residencial / Comercial
9. ¿Cuál no es un efecto ambiental de los océanos más cálidos? (Objetivo de Aprendizaje 5)
a. El aumento del nivel del mar
b. Cambios de arrecifes de coral
c. Composiciones químicas cambiado
d. El aumento de las olas
10. ¿Qué es un impacto en los seres humanos del cambio de los hábitats de animales y
plantas? (Objetivo de Aprendizaje 7)
a. El aumento de la contaminación acústica debido a superpoblación de los coquíes
b. Bajo suministro de alimentos debido a cambios en patrones de precipitación
c. Daño arquitectónico debido a las aves que anidan en edificios de la ciudad
d. Aumento del crecimiento de las plantas venenosas en las zonas residenciales
11. Expertos en cambio climático han dicho que el aumento de gases invernaderos pueden
provocar un aumento de la temperatura atmosférica. ¿Cual no es un efecto de una
atmosfera cálida? (Objetivo de Aprendizaje 5)
a. Océanos mas cálidos
b. Días más largos
c. Cambio de condiciones para los animales y las plantas
d. Mas evaporación
12. ¿Cuál de los siguientes no afecta directamente los niveles de carbono en la atmosfera?
(Objetivo de Aprendizaje 3)
a. Respiración de las plantas

pg.
227
b. La respiración animal
c. Descomposición de la materia orgánica
a. La quema de combustibles fósiles

pg.
228
Appendix J: Proposed Learning Unit (Translated) – Lesson 1
Parte I: Pre-Tarea
Se les pedirá a los estudiantes a ver un episodio relevante Mythbusters en el siguiente enlace:
https://www.youtube.com/watch?v=pPRd5GT0v0I
Esta video describe el efecto invernadero atravez de un experimento. Los Mythbusters preparan tres cajas
transparentes: una llena de CO2, una llena de metano, y una como un variable de control. Se monitorean
las diferencias en temperatura entre las tress cajas durante un período de tiempo.
Parte 2: Actividades de Clase
Diapositiva 1: Objetivos de Aprendizaje
Hora prevista: 1 minuto
Lee a los estudiantes los siguientes objetivos de aprendizaje.
Los estudiantes serán capaces de:
1) Identificar una evidencia de cambio climático, centrándose en la relación entre las concentraciones de
CO2 y la temperatura atmosférica
2) Describir el efecto invernadero e identificar los gases que intervienen en ella
3) Describir cómo entra el carbono de la atmósfera según lo representado por ciclo del carbono
4) Identificar las fuentes de las emisiones de CO2
Objetivo: Informar a los estudiantes de los objetivos de la lección
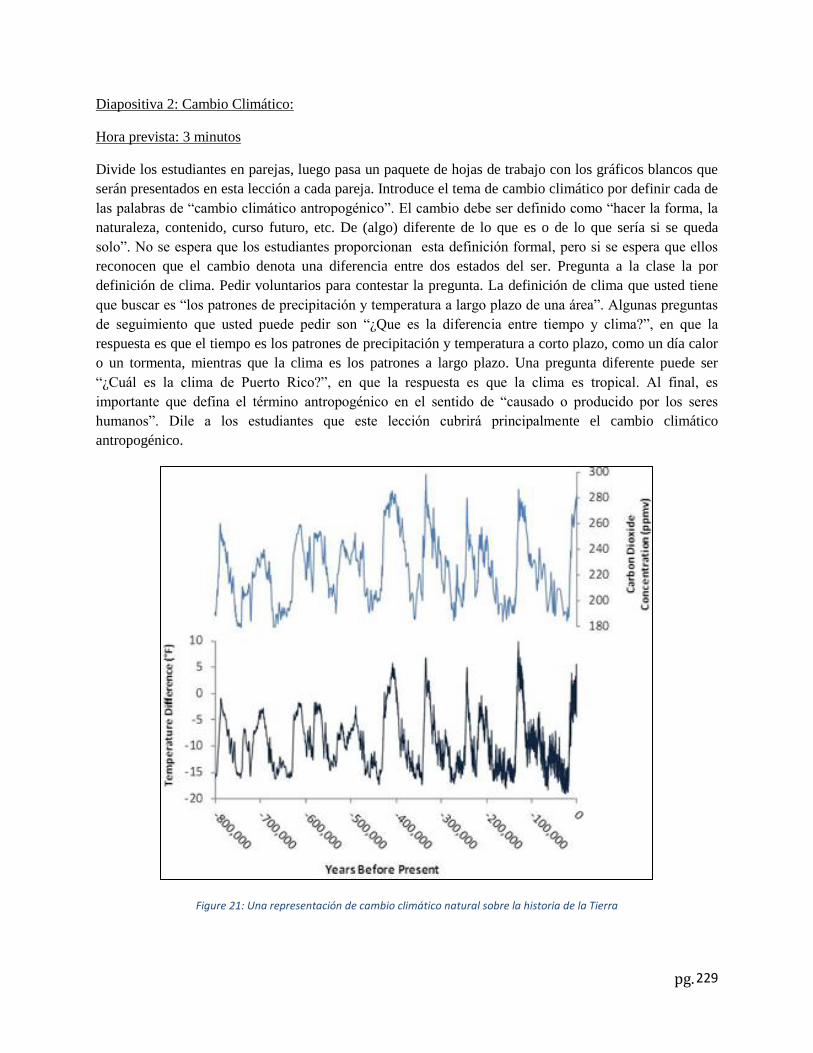
pg.
229
Diapositiva 2: Cambio Climático:
Hora prevista: 3 minutos
Divide los estudiantes en parejas, luego pasa un paquete de hojas de trabajo con los gráficos blancos que
serán presentados en esta lección a cada pareja. Introduce el tema de cambio climático por definir cada de
las palabras de “cambio climático antropogénico”. El cambio debe ser definido como “hacer la forma, la
naturaleza, contenido, curso futuro, etc. De (algo) diferente de lo que es o de lo que sería si se queda
solo”. No se espera que los estudiantes proporcionan esta definición formal, pero si se espera que ellos
reconocen que el cambio denota una diferencia entre dos estados del ser. Pregunta a la clase la por
definición de clima. Pedir voluntarios para contestar la pregunta. La definición de clima que usted tiene
que buscar es “los patrones de precipitación y temperatura a largo plazo de una área”. Algunas preguntas
de seguimiento que usted puede pedir son “¿Que es la diferencia entre tiempo y clima?”, en que la
respuesta es que el tiempo es los patrones de precipitación y temperatura a corto plazo, como un día calor
o un tormenta, mientras que la clima es los patrones a largo plazo. Una pregunta diferente puede ser
“¿Cuál es la clima de Puerto Rico?”, en que la respuesta es que la clima es tropical. Al final, es
importante que defina el término antropogénico en el sentido de “causado o producido por los seres
humanos”. Dile a los estudiantes que este lección cubrirá principalmente el cambio climático
antropogénico.
Figure 21: Una representación de cambio climático natural sobre la historia de la Tierra

pg.
230
\La página web de la Agencia de la Protección Ambiental (EPA) dice lo siguiente sobre el cambio
climático natural: Estimaciones del cambio de las concentraciones del dióxido de carbono (CO2) de la
Tierra (arriba) y las temperaturas antárticas (abajo), basado en el análisis de los datos de las muestras de
hielo se extiendan 800.000 años de antigüedad. Hasta el siglo pasado, los factores naturales causaron
concentraciones de CO2 en la atmósfera a variar dentro de un rango de aproximadamente 180 a 300 partes
por millón por volumen (ppmv). Periodos más cálidos coinciden con periodos de concentraciones
relativamente altas de CO2. NOTA: Los cambios de temperatura del siglo pasado y el aumento de las
concentraciones de CO2 (a 390 ppmv en 2010) no se muestran aquí.
Objetivo: Este diapositiva presenta una introducción a los conceptos de clima y te tiempo, así como
establecer una definición básica de cambio climático antropogénico.
Diapositiva 3: ¿Que es el efecto invernadero?
Hora prevista: 6 minutos
Primero, establece una definición de un gas invernadero por preguntar los estudiantes que ellos creen la
definición de un gas invernadero es. Un gas invernadero se define formalmente como cualquier gas que
absorbe la radiación infrarroja producida por el calentamiento solar de la superficie de la Tierra
(dictionary.com). Ejemplos de estos gases son el dióxido de carbono (CO2), el metano (CH4), el oxido
nitroso (NOx), y el vapor de agua (H20 [g]). El efecto invernadero se define formalmente como un
fenómeno atmosférico en que la radiación infrarroja de de longitud de onda corta se transmite fácilmente
en la atmosfera de la Tierra (específicamente en la troposfera), mientras que la radiación infrarroja de
longitudes de onda más largas se transmite con menos facilidad fuera de la atmosfera (específicamente en
la troposfera) debido a su absorción por los gases atmosféricos de efecto invernadero (dictionary.com).
Use una analogía que describe este efecto utilizando un invernadero real. En la analogía, la atmosfera es
como el “vidrio” del invernadero. Energía térmica del sol pase por el “vidrio”, pero es parcialmente
incapaz de salir fuera del “vidrio”. Esta energía atrapada luego aumenta la temperatura dentro del
invernadero. Refiera al video de Mythbusters que los estudiantes vieron la noche anterior para su tarea.
Luego, pase por cada paso del efecto invernadero. Identifica los puntos en el diagrama acompañada en
que cada paso del efecto ocurre. Las locaciones de estos puntos en el diagrama son etiquetado como
puntos 1 a 7. Pregunta a los estudiantes que ellos piensan está pasando a cada punto del diagrama. Se
proporciona un clave de respuestas a estos puntos debajo del diagrama.

pg.
231
Figura 22: Un grafico del efecto invernadero
Punto 1: La radiación solar pasa a la atmosfera de la Tierra
Punto 2: Parte de esta radiación es reflejada de vuelta al espacio por la atmosfera y la superficie terrestre.
Punto 3: La radiación restante que no era reflejada hacia el exterior es absorbido por la superficie
terrestre.
Punto 4: La radiación solar que fue absorbida por la superficie de la Tierra se convierte en calor térmico.
Esta energía térmica calienta la superficie de la Tierra y luego se irradia de nuevo fuera de la superficie.
Punto 5: Una parte de la energía térmica radiada es absorbida por efecto invernadero atmosférica.
Punto 6: La parte de la energía térmica que no fue absorbida por los gases invernaderos viaja de regreso a
la superficie, donde se emite hacia el exterior una vez más.
Punto 7: Esta energía térmica se refleja fuera de la superficie de la tierra y de vuelta al espacio.

pg.
232
Figura 23: Un diagrama del efecto invernadero (GRID Arendal y UNIP)
Objetivo: Ilustra cómo energía solar calienta la Tierra y cómo los gases invernaderos en la atmosfera
aumentan la absorción de calor infrarrojo en la atmosfera de la Tierra.
Diapositiva 4: ¿Cual gas invernadero tiene la mayoría de las emisiones?
Hora prevista: 5 minutos
Pregunta a los estudiantes cual gas invernadero que ellos creen tiene la mayoría de las emisiones
atmosféricas y luego revele la respuesta. A continuación, pregunta lo que ellos creen que es el segundo
gas invernadero con las emisiones más altas y luego revele la respuesta. Continúa así hasta que los cuatro
de los gases invernaderos son revelados. Haga que los estudiantes completen su propio grafico durante la
discusión. Las respuestas son (en orden) el dióxido de carbono (CO2), el metano (CH4), los óxidos
nitrosos, y gases fluorados.

pg.
233
Figura 24: Porcentaje relativo de gases invernaderos en términos de los niveles de emisión de gases invernaderos (Agencia de la Protección Ambiental).
Explique que estos gases no son necesariamente malos para la ambiente. El dióxido de carbono es un
problema solo porque en este momento hay los niveles más altos de sus concentraciones en la historia de
la Tierra. Es por esta razón que el resto de la lección se centrará en los efectos de las concentraciones de
dióxido de carbono en la temperatura media global.
Objetivo: Definir los gases invernaderos diferentes (Objetivo de Aprendizaje 2).
Diapositivas 5 - 7: Gráficos sobre la evidencia de cambio climático
Hora Prevista: 10 minutos
Abajo se proporcionan dos gráficos vacios que se ofrecen a los estudiantes en el paquete de hojas de
trabajo.
82%
9%
6% 3%
Dióxido de Carbono Metano
Óxido Nitroso
Los Gases Fluorados

pg.
234
Pida a los estudiantes para llenar los gráficos anteriores en sus hojas de trabajo. Los estudiantes trabajarán
en parejas, con un estudiante de crear el grafico de la concentración de CO2 y el otro de crear el gráfico

pg.
235
de la temperatura. Dar a los estudiantes 5 minutos para completar sus gráficos. Además, les dan un
minuto para comparar los dos gráficos que han creado. Los datos de estor gráficos se extrapolaron a partir
de la grafica en la Figura 3.
Figura 25: Una comparación de las concentraciones de dióxido de carbono y la temperatura global durante el siglo pasado. (National Oceanic and Atmospheric Administration)
Los gráficos completos deben parecer como los gráficos de abajo.
57
57.4
57.8
58.2
58.6
59
1880 1890 1900 1910 1920 1930 1940 1950 1960 1970 1980 1990 2000 2010
57.45
57.15
57.55
57
57.3
57.55
57.75
57.95
57.657.65
57.95
58.2558.2
58.5
AnnualGlobalTemperature
AnnualGlobalTemperature
Annual Global Temperature from 1880 to 2010
Time (Years)
Ann
ua
lG
lob
al
Te
mp
era
ture
(Fah
ren
heit)

pg.
236
Revise el grafico y haga que los estudiantes corrijan sus gráficos, si es necesario. Pide a los estudiantes
pensar lo que el gráfico significa. Discuta con los estudiantes de la correlación entre las concentraciones
de CO2 y la temperatura global. Luego, pida a los estudiantes aplicar sus conocimientos de gases
invernaderos a los resultados de sus graficas. ¿Qué puede ser predicho? La predicción de que debe
hacerse es la siguiente: el aumento de la concentración de CO2 causa a las temperaturas atmosféricas a
aumentar. Abajo se proporcionan representaciones adicionales de los aumentos de gases invernaderos y la
temperatura, respectivamente.
Figura 26: Concentraciones de gases invernaderos desde el año 0 hasta el año 2005 (Global Greenhouse Warming)
280
304
328
352
376
400
1880 1890 1900 1910 1920 1930 1940 1950 1960 1970 1980 1990 2000 2010
290294 295
300304
309 310 310315
325
337
352
367
388
AtmosphericCarbonDioxideconcentration
AtmosphericCarbonDioxideconcentration
Carbon Dioxide Concentration from 1880 to 2010
Time (Years)
Ca
rbo
nD
ioxid
eC
oncen
tra
tio
ns
(ppm
)

pg.
237
Figura 27: Relación entre la temperatura global de anomalías y la concentración de dióxido de carbono (EPA)
Objetivo: Que los estudiantes identifican evidencia del cambio climático antropogénico por demonstrar
que los aumentos en las concentraciones de CO2 se correlacionan positivamente con el aumento de la
temperatura global (Objetivo de Aprendizaje 1). Pida a los estudiantes identificar evidencias del cambio
climático antropogénico por demonstrar que los aumentos en las concentraciones de CO2 pueden causar
aumentos en la temperatura global (Objetivo de Aprendizaje 1).
Diapositiva 8: ¿Cómo carbono entrar en la atmosfera?
Hora prevista: 7 minutos
Debido a que el dióxido de carbono tiene las mayores emisiones de los gases invernaderos, usted debe
discutir con la clase cómo entra el carbono la atmosfera. Pida a ellos que llenan el siguiente diagrama en
sus hojas de trabajo. Los estudiantes continuaran a trabajar en las mismas parejas como antes. Ellos
pueden usar el banco de palabras para ayudar a determinar cual término pertenece en cual espacio. Este
banco de palabras se compone de las etiquetas presentas en el siguiente diagrama. Dé a los estudiantes
tiempo para discutir sus ideas.
Explique cada paso del ciclo de carbono con toda la clase. Empieza con la luz solar, y después de pasar a
la fotosíntesis, el carbono dentro de las plantas y los animales vivos, y la respiración de las plantas y los
animales. Las emisiones de carbono artificiales deben ser mencionadas separadas, ya que no son parte del
ciclo natural del carbono. Explique que todos los seres vivos contienen carbono. Además, explica que el
carbono se intercambia entre los océanos, el aire, y los organismos a través de numerosas funciones
naturales. Un aspecto importante del ciclo del carbono consiste en la descomposición de los organismos
en el suelo, qué vuelva nutrientes a la tierra. En los casos en que se ha ocurrido descomposición
anaeróbica por millones de años, los combustibles fósiles se pueden formar, explicando por qué altas
cantidades de carbono se emiten en la atmosfera como producto de la quema de combustibles fósiles.

pg.
238
Antes de administrar esta lección, consulte el siguiente diagrama para una representación más detallada
del ciclo del carbono y los diversos procesos relacionados. Para mayor aprendizaje de los estudiantes,
ellos pueden consultar el sitio web, que se proporciona al final de este documento, para una versión
interactiva de la figura.
Figura 29: Representación detallada del ciclo del carbono (Sciencelearn.org)
Figura 28: Una representación simplificada del ciclo del carbono (UCar.edu)

pg.
239
Objetivo: Demonstrar el ciclo del carbono y cómo entra el carbono de la atmosfera en forma de CO2
(Objetivo de Aprendizaje 3).
Diapositiva 9: ¿Cuál es la fuente con la mayoría de las emisiones del dióxido de carbono?
Hora prevista: 5 minutos
El gráfico abajo será proporcionado a los estudiantes, pero los títulos serán eliminados.
Pregunta a los estudiantes lo que creen es la mayor fuente de emisiones de dióxido de carbono y luego
revela la respuesta. Pregunte lo que ellos creen que es la segunda mayor fuente de emisiones de dióxido
de carbono y revuela la respuesta. Continúe de esta manera, hasta que todas las cincos fuentes se revelan.
Haga que los estudiantes completen su propio grafico durante la discusión. Las respuestas correctas son la
electricidad, el transporte, la industria, aparatos residenciales y comerciales, y la combustión de
combustibles no fósiles. Informa los estudiantes de la formula química básica para la combustión (C + O2
CO2) y que es el proceso básico que va a producir el CO2 que se emite a la atmosfera. Esta ecuación
debe ser ya sea verbalmente o escrito en la pizarra.
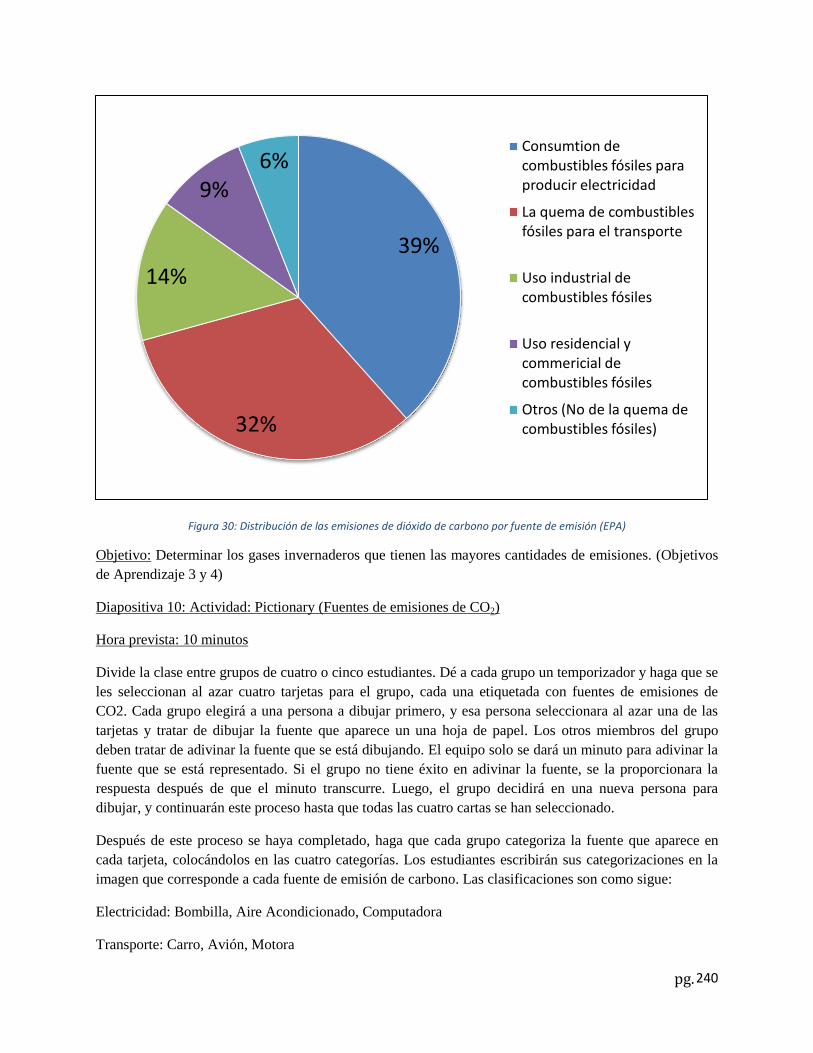
pg.
240
Figura 30: Distribución de las emisiones de dióxido de carbono por fuente de emisión (EPA)
Objetivo: Determinar los gases invernaderos que tienen las mayores cantidades de emisiones. (Objetivos
de Aprendizaje 3 y 4)
Diapositiva 10: Actividad: Pictionary (Fuentes de emisiones de CO2)
Hora prevista: 10 minutos
Divide la clase entre grupos de cuatro o cinco estudiantes. Dé a cada grupo un temporizador y haga que se
les seleccionan al azar cuatro tarjetas para el grupo, cada una etiquetada con fuentes de emisiones de
CO2. Cada grupo elegirá a una persona a dibujar primero, y esa persona seleccionara al azar una de las
tarjetas y tratar de dibujar la fuente que aparece un una hoja de papel. Los otros miembros del grupo
deben tratar de adivinar la fuente que se está dibujando. El equipo solo se dará un minuto para adivinar la
fuente que se está representado. Si el grupo no tiene éxito en adivinar la fuente, se la proporcionara la
respuesta después de que el minuto transcurre. Luego, el grupo decidirá en una nueva persona para
dibujar, y continuarán este proceso hasta que todas las cuatro cartas se han seleccionado.
Después de este proceso se haya completado, haga que cada grupo categoriza la fuente que aparece en
cada tarjeta, colocándolos en las cuatro categorías. Los estudiantes escribirán sus categorizaciones en la
imagen que corresponde a cada fuente de emisión de carbono. Las clasificaciones son como sigue:
Electricidad: Bombilla, Aire Acondicionado, Computadora
Transporte: Carro, Avión, Motora
39%
32%
14%
9% 6%
Consumtion de combustibles fósiles para producir electricidad
La quema de combustibles fósiles para el transporte
Uso industrial de combustibles fósiles
Uso residencial y commericial de combustibles fósiles
Otros (No de la quema de combustibles fósiles)

pg.
241
Industrial: Fabrica, Pila de Humo, Tren de Carga
Comercial/Residencial: Horno, Fogón, Barbacoa
Objetivo: Ilustrar las diferentes fuentes de emisiones de CO2 (Objetivo de Aprendizaje 4).
Diapositiva 11: ¿Cómo podemos reducir emisiones de CO2?
Hora prevista: 5 minutos
Pregunta a los estudiantes cómo la sociedad en su conjunto puede reducir las emisiones de CO2. Hable de
este tema abiertamente con los estudiantes.
Respuestas posibles pueden incluir:
• Utilice menos energía
• Apaga las luces cuando no las esté utilizando
• No deje el televisor cuando no lo está mirando
• No se debe usar el aire acondicionado demasiado
• No maneja tanto – camina cuando puedas o utiliza el transporte público mas
• Coma menos carne roja
• Utiliza aparatos de ahorro energético
• Recicla o reutiliza productos cuando sea posible
• Compre productos locales
Luego, pide a los estudiantes cómo ellos personalmente pueden reducir las emisiones de CO2. Escribe las
respuestas en la pizarra para crear una lista de ideas. Asegúrese de distinguir las diferencias entre lo que la
sociedad puede hacer y lo que los estudiantes pueden hacer personalmente. Además, asegúrese de hacer
hincapié en que las acciones individuales pueden hacer in impacto. Estas acciones, cuando se hace por
muchas personas, pueden tener un gran impacto en la disminución de las emisiones de dióxido de
carbono.
Objetivo: Animar a los estudiantes a pensar de forma proactiva sobre lo que pueden hacer personalmente
para reducir las emisiones de CO2 (Objetivo de Aprendizaje 4).
Parte III: Tarea
Diapositiva 12: Tarea
Informar a los estudiantes que hay dos copias de la actividad al final del paquete. Cada estudiante debe
contestar las preguntas y entregar la hoja de trabajo el próximo día.
Instruciones:
Los estudiantes completarán las siguientes actividades, igual como una búsqueda de tesoro
1. Encuentra una historia breve de alguien que usted conoce sobre como el cambio climático se le
afecta. Escribe una descripción de la historia.
2. Encuentra un objeto (o un foto de ese objeto) que usted use, o describe una actividad de su propia
vida, que emite gases invernadero.

pg.
242
77%
14%
8% 1% Carbon dioxide
Methane
Nitrous Oxide
Flourine gases
3. Describe una manera nueva para usar este objeto o para cumplir este actividad en una manera que
emite menos gases invernaderos.
Enlaces usados para las figures:
Figura 1: http://www.epa.gov/climatechange/science/causes.html
Figura 2: http://www.grida.no/publications/vg/africa/page/3110.aspx
Figura 3: http://www.epa.gov/climatechange/ghgemissions/gases.html
Figura 4: http://www.global-greenhouse-warming.com/greenhouse-gas.html
Figura 5: http://www.ncdc.noaa.gov/indicators/
Figura 6: http://www.epa.gov/climatechange/science/indicators/weather-climate/temperature.html
Figura 7: https://eo.ucar.edu/kids/green/cycles6.htm
Figura 8: http://sciencelearn.org.nz/Contexts/The-Ocean-in-Action/Sci-Media/Interactive/Carbon-cycle
Figura 9: http://www.epa.gov/climatechange/ghgemissions/gases/co2.html
Parte IV: Materiales Adocionales
Lesson 1 Worksheet (Spanish)
Lección 1: Causas y Evidencias del Cambio Climático
Por favor completa los siguientes gráficos cuando su maestra le indica que lo haga.
1. ¿Cual gas invernadero tiene la mayoría de las emisiones? Completa este grafico mientras que la clase
discute cual gas invernadero tiene la mayoría de las emisiones.

pg.
243
2. Temperaturas globales vs. Concentraciones de CO2: Dividir en parejas. Usando la tabla de abajo,
tenga una persona a crear el grafico de las temperaturas globales y una persona a crear el grafico de las
concentraciones de CO2.
Gráfico de la concentración de CO2:
Año CO2 (ppm)
1880 290
1890 294
1900 295
1910 300
1920 304
1930 309
1940 310
1950 310
1960 315
1970 325
1980 337
1990 352
2000 367
2010 388

pg.
244
Gráfico de la Temperatura Global:

pg.
245
Año Temp (F)
1880 57.45
1890 57.15
1900 57.55
1910 57.0
1920 57.3
1930 57.55
1940 57.75
1950 57.95
1960 57.6
1970 57.65
1980 57.95
1990 58.25
2000 58.2
2010 58.5

pg.
246
Ahora compara los dos gráficos. ¿Qué es la correlación entre la temperatura global y concentraciones
de CO2?

pg.
247
Absorción del océano de carbono
3. ¿Cómo carbono entrar en la atmosfera? Trabajando en parejas, completa el grafico abajo usando el
banco de palabras
Banco de Palabras
Emisiones de carros y fabricas
Respiración de los animales
Organismos muertos y productos de desecho
Hongos
Fósiles y combustibles fósiles
Absorción del océano de carbono
Carbono orgánico
Respiración de las plantas
Fotosíntesis
Respiración de las raíces
Luz del sol

pg.
248
39%
32%
14%
9%
6% Electricity
Transportation
Industry
Residential and Commericial
Other (Non Fossil Fuel Combustion)
4. ¿Cuál es la fuente con la mayoría de las emisiones del dióxido de carbono? Completa este grafico
mientras que la clase discute que es la fuente con la mayoría de las emisiones de dióxido de carbono.

pg.
249
Pictionary Activity (Spanish)
Actividad de Pictionary: Abajo se presentan las tarjetas que se utilizaran para la actividad de
Pictionary. Recorta las tarjetas antes de la clase y dar a cada grupo 4 tarjetas.
Bombilla
Bombilla
Acondicionador de aire
Acondicionador de aire
Computadora
Computadora
Carro
Carro
Avión
Avión
Motora
Motora
Fábrica
Fábrica

pg.
250
Pila de Humo
Pila de Humo
Tren de Carga
Tren de Carga
Horno
Horno
Hoguera
Hoguera
Barbacoa
Barbacoa

pg.
251
Homework Activity (Spanish)
Nombre:______________________________________________________
Búsqueda del Tesoro
1. Encuentra una historia breve de alguien que usted conoce sobre como el cambio
climático se le afecta. Escribe una descripción de la historia.
______________________________________________________________________________
______________________________________________________________________________
______________________________________________________________________________
______________________________________________________________________________
______________________________________________________________________________
______________________________________________________________________________
____________
2. Encuentra un objeto (o un foto de ese objeto) que usted use, o describe una actividad de
su propia vida, que emite gases invernadero.
______________________________________________________________________________
______________________________________________________________________________
______________________________________________________________________________
______
3. Describe una manera nueva para usar este objeto o para cumplir este actividad en una
manera que emite menos gases invernaderos.
___________________________________________________________________________
___________________________________________________________________________
___________________________________________________________________________
___________________________________________________________________________
___________________________________________________________________________
___________________________________________________________________________
________________________________________________________________________

pg.
252
Appendix K: Proposed Learning Unit (Translated) – Lesson 2
Lesson 2 Instructor Guide (Spanish)
Lección 2: Los Impactos de Cambio Climático
Diapositiva 13: Objetivos de Aprendizaje
Hora prevista: 1 minuto
Lea estos objetivos de aprendizaje a los estudiantes.
Los estudiantes serán capaces de:
5) Identificar los impactos predichos de una atmósfera más cálida, centrándose en el ciclo de agua y los
océanos.
6) Determinar los impactos de cambio climático en los animales y las plantes de El Yunque, centrándose
en los impactos de una temperatura aumentada y en cambios en patrones de precipitación.
7) Determinar los impactos del cambio climático en los seres humanos, especialmente cómo cambios en
patrones de precipitación, aumentos en niveles océanos, y cambios en los hábitos de los animales y
plantas afectan los seres humanos.
Objetivo: Informar los estudiantes de los objetivos de aprendizaje de la lección.
Diapositiva 14: ¿Qué causa una atmósfera más cálida?
Hora prevista: 3 minutos
Haga esta pregunta a los estudiantes, y hace que se ofrecen diversas respuestas basadas en la lección
anterior. La pregunta se pretende ser una revista breve de los temas que los estudiantes aprendieron el día
anterior durante la lección sobre las causas y evidencias de cambio climático. Continúe la discusión hasta
que los estudiantes han proporcionado tres respuestas exactas. Respuestas posibles incluyen aumentos en
las concentraciones de CO2, aumentos en las emisiones de los gases invernaderos, la continuación de
deforestación, y la continuación de la quema de combustibles fósiles.
Objetico: Revisar lo que era discutido en la lección anterior por discutir cómo aumentos en
concentraciones de CO2 causa a las temperaturas atmosféricas se aumentan.
Diapositiva 15: ¿Cuáles procesos naturales pueden ser afectados por una atmósfera más cálida?
Hora prevista: 5 minutos
Brevemente explique que una atmósfera más cálida afecta muchos ciclos y procesos naturales, incluyendo
el ciclo de nitrógeno, el ciclo de carbono, y el ciclo de agua, entre otros. Está proporciona abajo
explicaciones de estos ciclos así como una descripción de los impactos predichos de una atmósfera más
cálida.

pg.
253
El ciclo de carbono – El ciclo de carbono, como se explica en la lección anterior, se inicia con la energía
del sol. Se utiliza para la fotosíntesis en las plantas. Ambos las plantas y los animales pueden ser
identificados como carbonos orgánicos. La respiración de animales y la quema de combustibles fósiles
añaden CO2 a la atmósfera. Además, las plantas y los animales contribuyen el carbono al suelo cuando
descomponen. Los océanos actúan como sumideros de carbono y pueden absorber carbonos. Finalmente,
hay depósitos de carbono que son atrapados en el hielo glacial y en roca madre, pero esto carbono no es
muy accesible. Contribuciones antropogénicas al ciclo del carbono están fuertemente ligados al cambio
climático. Una atmosfera mucha más caliente (debido al cambio climático antropogénico) indicaría que la
distribución de carbono accesible diferiría mucho de cualquier otro periodo de la historia de la Tierra.
Mirar a las niveles de CO2 de los últimos 800.000 anos corrobora esta conclusión. Antes de la última
década, se cree que los niveles de CO2 en la atmósfera no se habían levantado más de 300 ppm.
El ciclo de nitrógeno – El ciclo de nitrógeno contiene 4 procesos principales: la fijación de nitrógeno,
amonificación, nitrificación, y desnitrificación. La fijación de nitrógeno es el proceso de convertir el gas
de nitrógeno (N2) a amonio (NH2+). Este proceso se realiza principalmente por ciertas bacterias, y
permite que ciertos organismos utilicen nitrógeno directamente de la atmósfera. Luego, amonificación se
ocurre cuando el nitrógeno orgánico esta convertido a amonio por organismos que descomponen la
materia, como diversos hongos. Después, el amonio se convierte en nitrato (NO3-) por las bacterias en el
proceso conocido como nitrificación. Finalmente, los procesos anaeróbicos de desnitrificación ocurren,
que se convierten el nitrato al gas de nitrógeno (N2), gas de óxido nitroso (NO2), óxido nitroso (N2O) y
óxido nítrico (NO). Debido a las actividades humanas, hay un exceso de las cantidades de óxidos de
nitrógeno (NOX) atmosféricos. Los óxidos de nitrógeno en este momento son el tercer mayor
contribuyente del mundo a aumentos de la temperatura atmosférica. Esto es debido al aumento de la
liberación de nitrógeno en la atmosfera durante la combustión de combustibles fósiles. Además, esta
acumulación de nitrógeno se ha visto para afectar a la funcionalidad de los ecosistemas variados. Otros
impactos humanos incluyen concentraciones de amoniaco (NH3) aumentados, debido a un aumento en el
uso de fertilizantes y el aumento de las concentraciones de óxido nítrico de elevada presencia de N2 en la
atmósfera en el siglo pasado.
El ciclo de agua – El ciclo de agua describe los movimientos colectivos de agua a través de biomas
terrestres y oceánicas y de la atmósfera. Los procesos básicos involucradas en esto ciclo son evaporación,
transpiración, precipitación, y condensación. Este proceso se describirá con mayor detalle en las
siguientes diapositivas. El ciclo de agua se vería afectado en términos de aumento de la evaporación y la
consiguiente disminución de las precipitaciones. Este fenómeno puede causar confusión para los
estudiantes, ya que un error común sería creer que los aumentos de evaporación causan aumentos en
precipitación. Esto es algo cierto, pero la anterior descripción no da cuenta de los patrones de vientos
globales que afectan a las zonas tropicales y subtropicales. Los vientos en las zonas subtropicales (como
Puerto Rico) llevan el aire cargado de humedad a los trópicos ecuatoriales, por lo tanto, causando el
aumento de la precipitación en los trópicos pero precipitación disminuyendo en los subtrópicos.
Objetico: Explicar los impactos de una atmosfera más cálida en los procesos naturales (Objetivo de
Aprendizaje 5)

pg.
254
Diapositiva 16: ¿Cuáles son los impactos específicos de una atmósfera más cálida en el ciclo de
agua?
Hora prevista: 8 minutos
Muestra a los estudiantes el diagrama arriba. Explique los pasos que se indican abajo.
Evaporación: El cambio de agua líquida a vapor de agua.
[H2O (l) + Energía H2O (g)]
Condensación: El cambio de vapor de agua a agua líquida en la forma de nubes o niebla
[H2O (g) H2O (l) + Energía]
Transpiración: La evaporación del agua líquida de la vegetación. Se crea un efecto de enfriamiento
cuando ocurre en escenarios de gran escala, como en selvas tropicales.
Escorrentía: La transferencia de agua líquida de un lugar físico a otro, por lo general de una elevación
superior a una elevación inferior y/o a un cuerpo de agua.
Precipitación: La caída de agua líquida desde las nubes o niebla hacia abajo a la superficie de la Tierra. La
precipitación puede tomar la forma de lluvia, granizo, nieve, aguanieve, y goteo de la niebla.
Siguiente, guía la clase en una investigación verbal por preguntar cómo una atmósfera más cálida podría
afectar a cada uno de estos pasos. Es importante que encuadre los cambios que pueden ocurrir en el
sentido amplio (es decir, cambios en las precipitaciones y en evaporación). Esto asegurará que esta
discusión no sea demasiado centrada estrechamente en temas que no se trataran.
Dos representaciones más detalladas e integrales del ciclo de agua se proporcionan abajo para que
instructores pueden mejorar sus conocimientos de algunas de las partes más complejas del ciclo de agua.

pg.
255
Objetivo: Explicar cómo una atmósfera más cálida afecta el ciclo de agua (Objetivo de Aprendizaje 5).
Diapositiva 17: ¿Cómo es que los océanos serían afectados por una atmósfera más cálida?
Hora prevista: 3 minutos.

pg.
256
Pregunta a los estudiantes cómo una atmósfera más cálida afecta a los océanos. Haga que los estudiantes
proporcionan ideas diferentes. Si los estudiantes no proporcionan la respuesta "océanos más cálidos"
después de dos minutos, usted debe proporcionar la respuesta. El gráfico siguiente se mostrará. Esto
gráfico muestra el cambio en las temperaturas océanos desde el año 1880 hasta 2012, en comparación con
la temperatura media de los océanos desde 1971 hasta 2000.
Objetivo: Describir cómo temperaturas aumentadas de la atmósfera pueden aumentar las temperaturas
oceánicas (Objetivo de Aprendizaje 5)

pg.
257
Diapositiva 18: ¿Cuáles son posibles efectos ambientales de océanos más cálidos?
Hora prevista: 4 minutos
Pregunta a los estudiantes cuales son posibles efectos ambientales de océanos más cálidos y discute cada
respuesta más a fondo. Luego, pregunta a los estudiantes cuales efectos de océanos más cálidos afectaría
Puerto Rico en particular.
Respuestas posibles incluye la siguiente:
El aumento del nivel del mar – El hielo del mar comenzará a derretirse más rápidamente a medida que
las temperaturas del océano aumentan, creando excesos de agua líquida que hará que los niveles del mar
aumentan.
Composición química cambiado – Océanos más cálidos pueden actuar más fácilmente como sumidero
de dióxido de carbono. Medida que más CO2 es añado en el océano, el proceso químico de la creación de
ácido carbónico (CO2 + H2O H2CO3) ocurre en mayores cantidades. Esto puede dar lugar a pequeños
cambios (o diferencias de potencial) en el pH del océano hacia niveles ácidos (pH < 7)
Cambios de arrecifes de coral – Mientras que la composición química de los océanos cambia, hábitats
frágiles, como los arrecifes de coral van a cambiar, es decir al experimentar excesivo blanqueamiento de
corales. Coral luego muere, eliminando habitas acuáticos principales.
La pérdida de la fauna acuática – Mientras que la composición química de los océanos cambia, ciertas
especias de peces y plantas estarán mal adaptadas a las nuevas condiciones químicas. Además, muchas
especias también serán incapaces de sobrevivir en aguas más cálidas y morirá como resultado.
Cambios de hábitat – Las especies que no se adaptan bien a la subida de las temperaturas en los océanos
se verán obligados a desplazarse a otras zonas que tienen condiciones que están más acostumbrados.
Objetico: Discutir los efectos de océanos más cálidos (Objetivo de Aprendizaje 5).

pg.
258
Diapositiva 19: ¿Cuáles son los impactos de una atmósfera más cálida en ciclo de agua?
Hora previsto: 4 minutos
Revise el siguiente diagrama con la clase para subrayar cómo una atmosfera más cálida puede causar
océanos más calientes que pueden causar los niveles del mar se elevan. También pueden cambiar la
evaporación, qué puede causar cambios en las precipitaciones.
Atmósfera más Cálida: Esto es causado por aumentos en las emisiones de gases invernaderos. Este
efecto observado de calentamiento tiene un profundo impacto en el ciclo de agua. En particular, las tasas
de todos los procesos de evaporación se aumentarían. Además, el aumento de la temperatura global
debido al aumento del efecto invernadero llevaría a los océanos más cálidos.
Océanos más Cálidos: Los océanos similarmente experimentarían un efecto de calentamiento como un
resultado de aumento del efecto invernadero. Estos océanos más cálidos llevarían a la aparición de
muchos otros fenómenos, incluyendo la expansión térmica del agua de los océanos y el aumento del
derretimiento del hielo marino.
Aumento del Nivel del Mar: Los niveles del mar podrían aumentar drásticamente si continua el cambio
climático llegara a ocurrir. Esto es parcialmente debido a una ligera expansión térmica del agua a medida
que se calienta. Este efecto suele ser muy minúscula cuando involucra pequeñas cantidades de líquido.
Sin embargo, esta expansión sería mucho más grande y podría ser observado y medido cuando se produce
en grandes cuerpos de agua, como el océano. Otra fuente de aumento del nivel del mar sería la fusión del
hielo del mar y el derretimiento/ la escorrentía de los glaciares, lo que depositar el exceso de agua líquida
en el océano.
Cambios en Evaporación: La evaporación se incrementaría en regiones tropicales mientras que las
temperaturas globales aumentan. Esto podría ocurrir en todos los procesos que implican la evaporación,
incluyendo la transpiración. La capacidad de la atmosfera para retener el agua se incrementaría en un 7%
Atmósfera más Cálida
Océanos más Cálidos
Aumento del Nivel del Mar
Cambios en Evaporación
Cambios en Precipitación

pg.
259
por cada grado centígrado que la temperatura atmosférica aumenta. Esto permite una mayor capacidad de
retener agua, lo que significa que el punto de saturación de la atmosfera para aguantar vapor de agua se
convertiría en una mayor. En consecuencia, como la cantidad de agua que se mantiene en la atmosfera
cambia, también lo hace en los patrones de precipitación.
Cambios en Precipitación: Dependiendo de la región, la precipitación podría aumentar o disminuir. Los
patrones de viento son un factor crucial en si la precipitación aumentara o disminuirá. Regiones
ecuatoriales, como el Amazonas, experimentarán aumentos en las precipitaciones. Esto es en gran parte
debido a los vientos llevarán a los excesos de humedad evaporada a estas áreas. Puerto Rico es un área
que, aunque variable en sus patrones de lluvia en toda la isla, experimentar una disminución general de la
precipitación. Además, Puerto Rico experimentaría estaciones más extremas, con menos lluvia que cae
en las estaciones secas y más lluvia que cae en la estación húmeda. El impacto más inmediato de una
tendencia a la sequía en Puerto Rico seria el aumento de la probabilidad de sequías.
Objetivo: Repasar los efectos de una atmósfera más cálida en los océanos y en el ciclo de agua (Objetivo
de Aprendizaje 5).
Diapositiva 20: Actividad del Cambio de Hábitat
Hora Prevista: 20 minutos
Objetivo: Ilustrar los efectos de cambios en las precipitación y el aumento de la temperatura global en los
animales y las plantas (Objetivo de Aprendizaje 6).
Los estudiantes recibirán una actividad para ilustrar los efectos de cambios en las precipitaciones y el
aumento de la temperatura global, específicamente en Puerto Rico.
Meta: Comprender los efectos del cambio climático en los hábitats de animales y plantas en El Yunque y
cómo estos efectos se conectan y pueden causar cambios de hábitat para animales que son especies
endémicas, o especies que sólo se encuentran en Puerto Rico.
A cada grupo de estudiantes se le proporcionará:
Una foto de una montaña típica de Puerto Rico, etiquetado con diferentes
descripciones de hábitats.
Fotos de varios animales de El Yunque que son endémicas de Puerto Rico,
incluyendo coquíes, cotorras, y reinitas de bosque enano.
Fotos de diversas plantas de El Yunque que son nativas de Puerto Rico
incluyendo la palma de sierra, aceitillo falso, y guineos
Una hoja de instrucciones que describe la actividad, así como los
requerimientos de hábitat para los diferentes animales y plantas.
Instrucciones:
Divide a los estudiantes en grupos de 5
pg.
260
Los estudiantes primero colocarán los diferentes hábitats en la imagen de la montana en
función de sus niveles de temperatura y precipitación requeridos. Esta información se
proporciona en las tablas que acompañan a esta actividad.
Haga que los estudiantes colocan los animales proporcionados en sus correspondientes
hábitats en la imagen de la montaña siguiendo sus respectivas descripciones y
necesidades de hábitat. Específicamente, use el rango de temperatura, la dieta, posibles
elevaciones, y las necesidades de precipitación de cada animal para determinar su
colocación en el diagrama. Esta información se proporciona en las tablas que acompañan
a esta actividad.
Luego, los estudiantes se verán en cada escenario descrito abajo, y moverán cada hábitat
de acuerdo a los cambios que se han producido debidos a que el cambio especifico de
clima.
Los estudiantes entonces moverán a los animales y plantas a nuevos lugares como la hoja
de instrucciones describe los cambios de hábitat, que son reflejo de los cambios
climáticos.
o Nota: Si los animales no pueden ser colocados en cualquiera de los hábitats,
deben ser dejados fuera de la página
Los estudiantes reflexionarán sobre como el cambio climatice puede afectar a los
distintos biomas y hábitats de los animales de Puerto Rico.
Los estudiantes escribirán sus respuestas a cada pregunta en las hojas de trabajo. Cuando todos los grupos
han terminado, repase las preguntas con ellos. Los estudiantes deben ver la desaparición de los bosques
enanos, así como la reinita de bosque enano. También verán que los hábitats de la mayor parte de las
especies enumeradas se desplazarán a elevaciones más altas de la montaña.
Discute con los estudiantes que cambios en habitas no es algo solo hipotético, pero en realidad está
pasando en Puerto Rico. Una especie que está experimentando actualmente cambio de su hábitat es la
reinita de bosque enano. Actualmente esta especie se enfrenta a la desaparición de su hábitat principal, el
bosque enano, y se ve obligada a trasladarse a hábitats a que no se está bien adaptada. Esta es una
tendencia que se ha observado por los administradores de las especies del USFS en El Yunque. En caso
de continuar las tendencias actuales del cambio climático, la reinita de bosque enano eventualmente
desaparecería por completo de Puerto Rico. Tendencias similares se han observado en otras especies que
son endémicas a Puerto Rico, o sólo se pueden encontrar en Puerto Rico, como la cotorra puertorriqueña.
Diapositiva 21: ¿Cómo es que los impactos de cambio climático predichos afecta a los seres
humanos?
Hora prevista: 5 minutos
Pida a los estudiantes que piensen cómo cada uno de estos fenómenos (aumento del nivel del mar,
cambios en los patrones de precipitación, cambios en los hábitats de animales y plantas) puede afectar a
los seres humanos en Puerto Rico. Los efectos pueden incluir escasez de agua y escasez de alimentos, la
perdida de zonas costeras, un clima más extreme y sus consecuencias económicas.

pg.
261
Según el Panel Intergubernamental sobre el Cambio Climático (IPCC), regiones como Puerto Rico, y
como el Caribe en su conjunto, experimentarán disminuciones en la precipitación mientras que el cambio
climático continúa ocurriendo al ritmo actual. Este es un motivo de preocupación para la isla de Puerto
Rico, ya que muchos de sus hábitats son dependientes de las lluvias. Con la disminución de las lluvias, no
habría impactos definitivos sobre los habitantes de Puerto Rico, incluyendo el aumento de potencial de las
sequías y escasez de agua. Por otra parte, el informe de 2014 del IPCC sobre las pequeñas islas describir
un gran medida los efectos humanos enfrentarían como resultado del cambio climático. Declaraciones
particulares que captura muchas de las cuestiones Puerto Rico se enfrente son los siguientes:
Desarrollo costero intensivo en la zona costera limitada, combinando con el crecimiento
de la población y el turismo, ha puesto gran énfasis en la costa de algunas pequeñas islas y
ha resultado en agregaciones densas de la infraestructura y la gente en lugares
potencialmente vulnerables (pg. 1623).
Fenómenos meteorológicos y climáticos extremos, como ciclones tropicales, tormentas,
inundaciones y sequias pueden tener efectos tanto a corto como a largo plazo en la salud
humana, incluyendo el ahogamiento, las lesiones, el aumento de la transmisión de
enfermedades y problemas de salud asociados con el deterioro de la calidad del agua y la
cantidad. La mayoría de los pequeños estados insulares son las zonas tropicales con clima
favorables para la transmisión de enfermedades como la malaria, el dengue, la filariasis y
la esquistosomiasis (pg. 1624).
Objetivo: Discutir los efectos del aumento del nivel del mar, el cambio de los patrones de precipitación, el
cambio de los hábitats de animales y plantas en los seres humanos en Puerto Rico (Objetivo de
Aprendizaje 7)

pg.
262
Habitat Activity (Spanish)

pg.
263
Requisitos Forestales: Los bosques a continuación sólo pueden existir donde el nivel de
precipitación y la temperatura promedio oscila coinciden con siguientes requisitos
Nivel del Bosque Niveles de
Precipitación (pulgadas/año)
Rango de Promedio Temperatura (° F)
Bosque Tabonuco < 100 80– 85
Bosque del Palo Colorado
150- 180 75 – 80
Sierra Bosque de Palmeras 100-150 70 – 75
Bosque Enano > 180 65 – 70
Requisitos de Animales y Plantas: Los animales y las plantas a continuación sólo pueden
existir donde el nivel de precipitaciones, la temperatura promedio oscila, y la dieta coinciden
con las siguientes requisitos

pg.
264
Animal
Rango de temperatu
ra de hábitat (°
F)
Rango de Precipitación
de Hábitat (pulgadas/año
)
Dieta Depredadores
Coquí 65– 85 > 32 Insectos Boa de Puerto Rico
Cotorra Puertorriqueña
70– 85 < 150 Plantas Boa de Puerto Rico
Reinita de bosque enano
65– 75 < 200 Insectos Boa de Puerto Rico
Boa de Puerto Rico 80– 85 < 100 Aves y
Largatos Ninguno
Lagartijo ramita de Puerto Rico
80– 85 < 100 Insectos Boa de Puerto Rico
Palma de Sierra 70– 75 < 150 Fotosíntesis Cotorra
Puertorriqueña
Aceitillo Falso 80– 85 < 100 Fotosíntesis Cotorra
Puertorriqueña
Hormiguita de fuego 65 – 85 Any Plantas Aves y Largatos
Guineos 75 – 85 < 180 Fotosíntesis Hormiguita de fuego y Cotorra Puertorriqueña
Paso 2: El condición original
De acuerdo a la condición original de abajo, coloque los bosques en la sección de elevación en el
imagen de una montaña de El Yunque qué tiene los niveles de precipitación y temperatura
promedio que se requieren para ese bosque. A continuación, coloque los animales y las plantas
en la sección de elevación en el foto que tiene los niveles de precipitación, temperatura
promedio, y la dieta que se requieren.
Condiciones Originales:
Sección Elevación
(ft. sobre nivel del mar)
Nivel de Precipitación
(pulgadas/año)
Temperatura Media (° F)
1 < 2000 90 82 2 2000-2500 165 77 3 2500-3000 125 72 4 > 3000 190 67

pg.
265
Paso 3: Los efectos de cambios en temperatura y en niveles de precipitación en los
hábitats.
Escenario 1: Los niveles de precipitación han disminuido respecto a sus niveles originales por
50 pulgadas por año.
Completa el siguiente grafico. Cambia los niveles de precipitación y cambia la temperatura
media oscila de acuerdo con el escenario anterior.
Sección Elevación
(ft. sobre nivel del mar)
Nivel de Precipitación
(pulgadas/año)
Temperatura Media (° F)
1 < 2000 82 2 2000-2500 77 3 2500-3000 72 4 > 3000 67
Mueva los bosques en la sección de elevación en la foto de una montaña de El Yunque.
Asegúrese de que el bosque está en la sección de elevación de El Yunque qué tiene los niveles de
precipitación y temperatura promedio que se requieren para ese bosque. A continuación, mueva
los animales y las plantas en la sección de elevación qué tiene los niveles de precipitación,
temperatura promedio, y la dieta que se requieren para ese bosque.

pg.
266
Escenario 2: Las temperaturas medias de todos los hábitats han aumentado 5°F de sus
medidas originales
Completa el siguiente grafico. Cambia los niveles de precipitación y cambia la temperatura
media oscila de acuerdo con el escenario anterior.
Sección Elevación
(ft. sobre nivel del mar)
Nivel de Precipitación
(pulgadas/año)
Temperatura Media (° F)
1 < 2000 90 2 2000-2500 165 3 2500-3000 125 4 > 3000 190
Mueva los bosques en la sección de elevación en la foto de una montaña de El Yunque.
Asegúrese de que el bosque está en la sección de elevación de El Yunque qué tiene los niveles de
precipitación y temperatura promedio que se requieren para ese bosque. A continuación, mueva
los animales y las plantas en la sección de elevación qué tiene los niveles de precipitación,
temperatura promedio, y la dieta que se requieren para ese bosque.
Escenario 3: Los niveles de precipitación han disminuido respecto a sus niveles originales por 50
pulgadas por año y las temperaturas medias de todos los hábitats han aumentado 5°F de
sus medidas originales
Completa el siguiente grafico. Cambia los niveles de precipitación y cambia la temperatura
media oscila de acuerdo con el escenario anterior.
Sección Elevación
(ft. sobre nivel del mar)
Nivel de Precipitación
(pulgadas/año)
Temperatura Media (° F)
1 < 2000 2 2000-2500 3 2500-3000 4 > 3000
Mueva los bosques en la sección de elevación en la foto de una montaña de El Yunque.
Asegúrese de que el bosque está en la sección de elevación de El Yunque qué tiene los niveles de
precipitación y temperatura promedio que se requieren para ese bosque. A continuación, mueva
los animales y las plantas en la sección de elevación qué tiene los niveles de precipitación,
temperatura promedio, y la dieta que se requieren para ese bosque.

pg.
267
Escenario 4: Los niveles de precipitación han disminuido respecto a sus niveles originales por
75 pulgadas por año y las temperaturas medias de todos los hábitats han
aumentado 10°F de sus medidas originales
Completa el siguiente grafico. Cambia los niveles de precipitación y cambia la temperatura
media oscila de acuerdo con el escenario anterior.
Sección Elevación
(ft. sobre nivel del mar)
Nivel de Precipitación
(pulgadas/año)
Temperatura Media (° F)
1 < 2000 2 2000-2500 3 2500-3000 4 > 3000
Mueva los bosques en la sección de elevación en la foto de una montaña de El Yunque.
Asegúrese de que el bosque está en la sección de elevación de El Yunque qué tiene los niveles de
precipitación y temperatura promedio que se requieren para ese bosque. A continuación, mueva
los animales y las plantas en la sección de elevación qué tiene los niveles de precipitación,
temperatura promedio, y la dieta que se requieren para ese bosque.

pg.
268
Paso 4: Reflección
Contesta las siguientes preguntas.
1) ¿Qué se puede decir sobre el efecto que los cambios en los niveles de precipitación han sobre
las plantas y los animales?
2) ¿Qué se puede decir sobre el efecto que los cambios en temperatura han sobre las plantas y
los animales?
3) ¿Qué se puede decir sobre el efecto que los cambios en ambos la temperatura y los niveles de
precipitación han sobre las plantas y los animales?
4) A medida que los hábitats de los animales cambian en respuesta a los escenarios anteriores,
¿qué se puede decir acerca de sus efectos en las cadenas de comida?

pg.
269
Appendix L: Proposed Learning Unit (Translated) – Post-test Pos-Prueba
Dé a los estudiantes el siguiente pos-prueba al día siguiente de la realización de la lección 2. Este pos-
prueba se centra en los objetivos de aprendizaje de la lección 1 y la lección 2. Las respuestas que se
destacan abajo se corresponden con la respuesta correcta de cada pregunta.
Nombre:________________________________________________________________
13. ¿Cuál de los siguientes no es un gas invernadero? (Objetivo de Aprendizaje 2)
a. Dióxido de carbono
b. Propano
c. Metano
d. El vapor de agua
14. ¿Cuál de los siguientes no es una manera en que la gente pueden disminuir emisiones de
gases invernaderos? (Objetivo de Aprendizaje 4)
a. Utilice iluminación natural durante el día
b. Mudar de las ciudades a los suburbios
c. Manejar un carro con un mayor rendimiento de gasolina
d. Apagar dispositivos electrónicos cuando no esté en uso
15. ¿Cuál es la mayor fuente de emisiones de dióxido de carbono por el hombre? (Objetivo de
Aprendizaje 4)
a. Electricidad
b. Transporte
c. Industria
d. Residencial / Comercial
16. ¿Qué es la relación entre las concentraciones de CO2 en la atmósfera y la temperatura
global? (Objetivo de Aprendizaje 1)
a. Hay una correlación positiva
b. Hay una correlación negativa
c. No hay correlación
d. Existe una correlación diagonal
17. ¿Cuál de los siguientes describe un efecto predicho del cambio climático en Puerto Rico?
(Objetivo de Aprendizaje 7)
a. Las estaciones serán más extrema. La estación seca se volverá mas seco, mientras
que la temporada de lluvias será más húmedo
b. 85% de la isla estará bajo el agua para el año 2050
c. Un gran parte de las especies nativas desparecerá de Puerto Rico de los próximos
15 años
d. Niveles de esmog aumentaran en San Juan debido a los aumentos de la
temperatura media anual
18. ¿Cuál no es un efecto ambiental de los océanos más cálidos? (Objetivo de Aprendizaje 5)

pg.
270
a. El aumento del nivel del mar
b. Cambios de arrecifes de coral
c. Composiciones químicas cambiado
d. El aumento de las olas
19. De los siguientes, ¿cual es algo que los gases invernadero atrapan en la atmósfera?
(Objetivo de Aprendizaje 2)
a. Agua
b. Oxígeno
c. Dióxido de carbono
d. La energía térmica
20. Expertos en cambio climático han dicho que el aumento de gases invernaderos pueden
provocar un aumento de la temperatura atmosférica. ¿Cual no es un efecto de una
atmosfera cálida? (Objetivo de Aprendizaje 5)
a. Océanos mas cálidos
b. Días más largos
c. Cambio de condiciones para los animales y las plantas
d. Mas evaporación
21. ¿Cuál de los siguientes es un efecto del cambio climático que afecta la vida silvestre?
(Objetivo de Aprendizaje 6)
a. Los gases invernaderos están envenenando los animales
b. Los animales están emigrando más al norte de lo habitual
c. Los animales están migrando en diferentes épocas del año de lo habitual
d. Los gases invernaderos están afectando los patrones de reproducción
22. ¿Cuál de los siguientes no afecta directamente los niveles de carbono en la atmosfera?
(Objetivo de Aprendizaje 3)
a. Respiración de las plantas
b. La respiración animal
c. Descomposición de la materia orgánica
b. La quema de combustibles fósiles
23. ¿Qué es un impacto en los seres humanos del cambio de los hábitats de animales y
plantas? (Objetivo de Aprendizaje 7)
c. El aumento de la contaminación acústica debido a superpoblación de los coquíes
d. Bajo suministro de alimentos debido a cambios en patrones de precipitación
e. Daño arquitectónico debido a las aves que anidan en edificios de la ciudad
f. Aumento del crecimiento de las plantas venenosas en las zonas residenciales
24. ¿Cuál de los siguientes no es un efecto de cambio climático que está afectando Puerto
Rico en este momento? (Objetivo de Aprendizaje 6)
g. El aumento del nivel del mar
h. Los cambios en los hábitats de los animales nativos
i. Los cambios en los patrones de precipitación
j. Disminución de la erosión costera

pg.
271
Conteste las siguientes preguntas con sinceridad y abiertamente. Sus comentarios se utilizarán y es muy
apreciada.
1. ¿Disfrutó las dos últimas lecciones?
2. Mencione una cosa que te gustó de las lecciones.
3. Mencione una cosa que no te gustó de las lecciones.
4. ¿Tiene interés en aprender más sobre el cambio climático después de tomar parte en
estas lecciones?
5. Mencione un tema adicional de cambio climático que le gustaría aprender acerca de
que no se incluyó en las lecciones.
6. Mencione algo que usted no sabía antes de las lecciones que usted ahora sabe después
de completarlas.
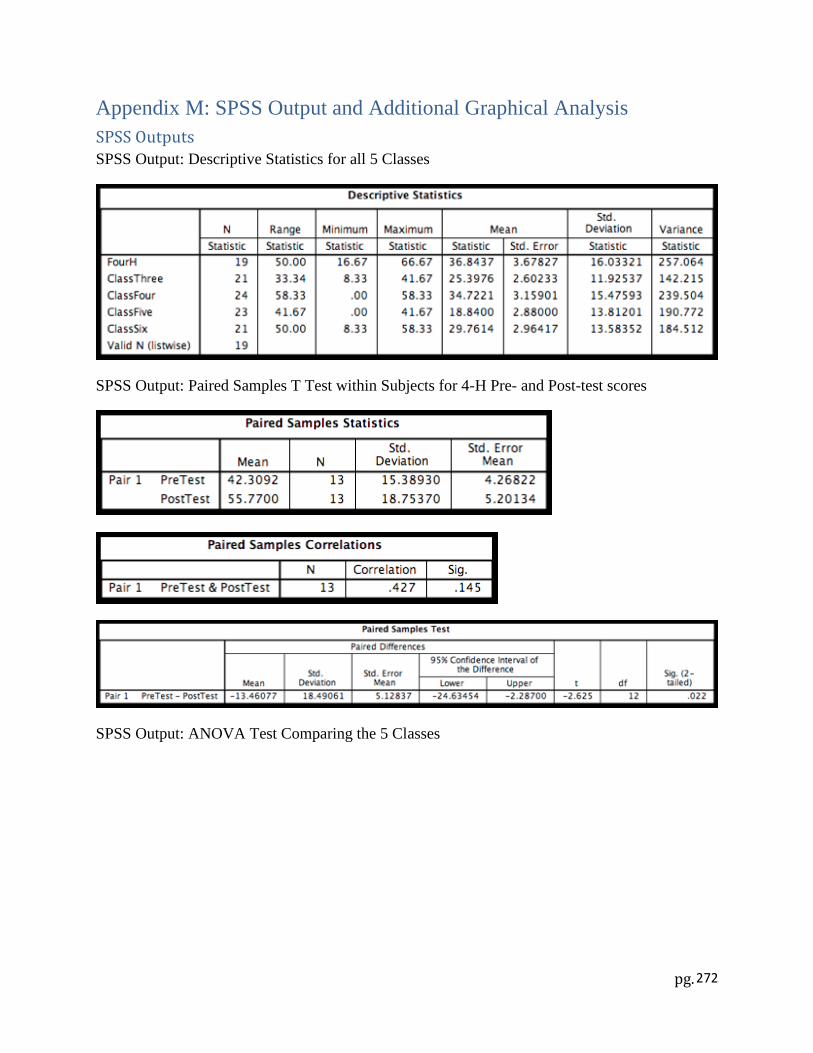
pg.
272
Appendix M: SPSS Output and Additional Graphical Analysis
SPSS Outputs
SPSS Output: Descriptive Statistics for all 5 Classes
SPSS Output: Paired Samples T Test within Subjects for 4-H Pre- and Post-test scores
SPSS Output: ANOVA Test Comparing the 5 Classes

pg.
273
SPSS Output: Independent Samples T Test between Class 9-2 and 9-3
SPSS Output: Independent Samples T Test between Class 9-2 and 9-4
SPSS Output: Independent Samples T Test between Class 9-2 and 9-5

pg.
274
SPSS Output: Independent Samples T Test between Class 9-2 and 9-6

pg.
275
Pre-test and Post-test Data for the 4-H Class:
Pre-test (Paired Samples)
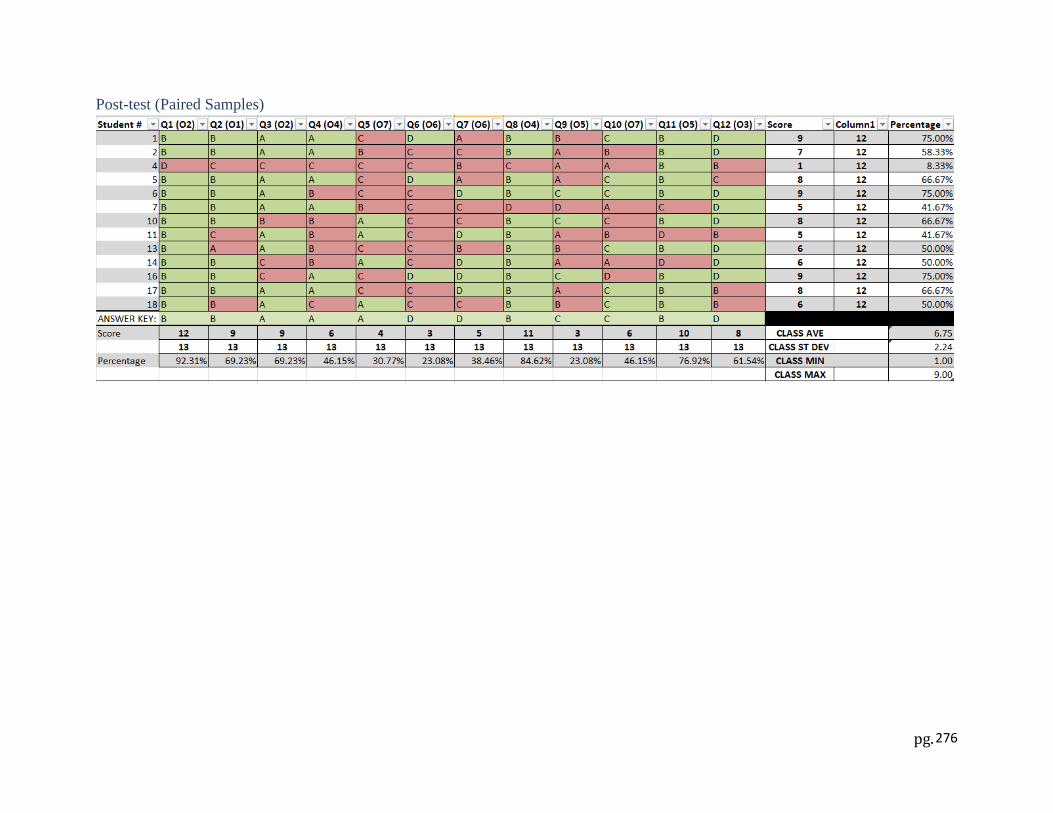
pg.
276
Post-test (Paired Samples)

pg.
277
Pre-test Scores: 9-2 Class

pg.
278
Pre-test Scores: 9-3 Class

pg.
279
Pre-test Scores: 9-4 Class

pg.
280
Pre-test Score: 9-5 Class

pg.
281
Pre-test Scores: 9-6 Class

pg.
282
Additional Graphs: Comparing Pre- and Post-tests of the 4-H Group
0
1
2
3
4
5
6
7
8
9
10
1 2 3 4 5 6 7 8 9 10 11 12 13
Nu
mb
er
of
Co
rre
ct A
nsw
ers
Student Number
Answers Correct Per Student
Pre-Test
Post-Test
Question
Letter
Pre-test
Question
Number
Post-test
Question
Number
A 1 1
B 2 4
C 3 7
D 4 2
E 5 5
F 6 12
G 7 9
H 8 3
I 9 6
J 10 11
K 11 8
L 12 10
0
2
4
6
8
10
12
14
A B C D E F G H I J K L
Nu
mb
er
of
Co
rre
ct A
nsw
ers
Question
Answers Correct per Question
Pre-test
Post-test

pg.
283
Appendix N: Revised Lesson PowerPoint Presentation

pg.
284
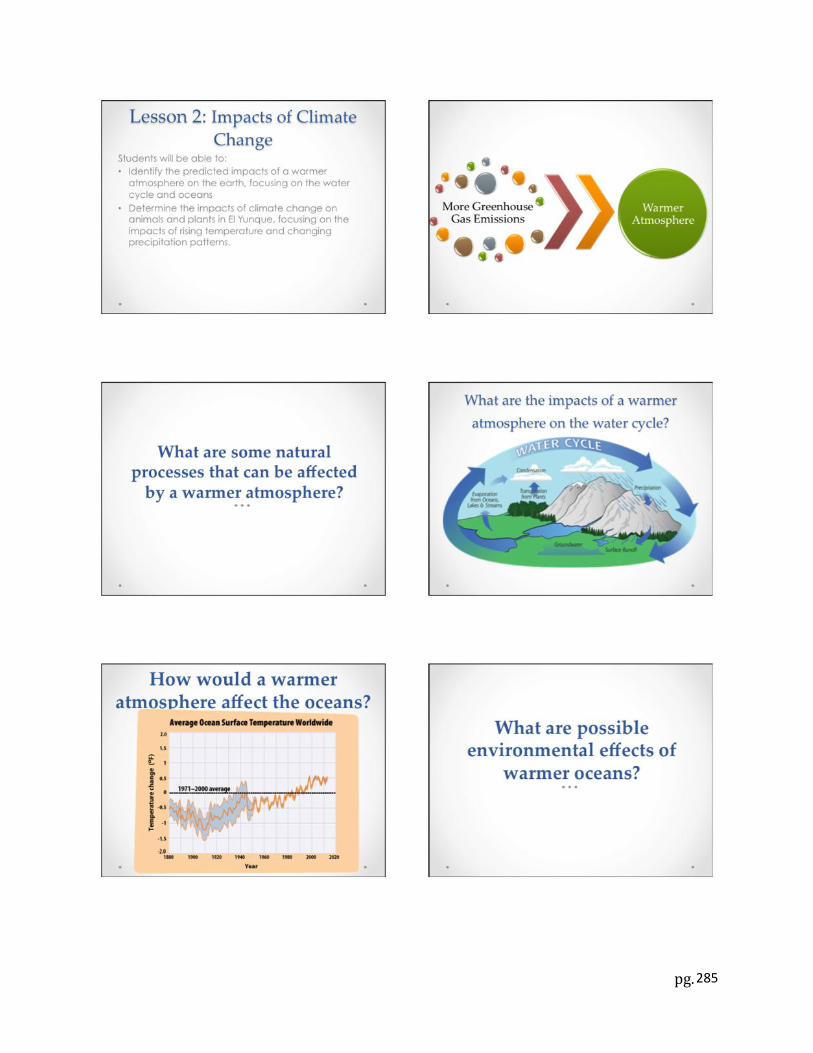
pg.
285

pg.
286
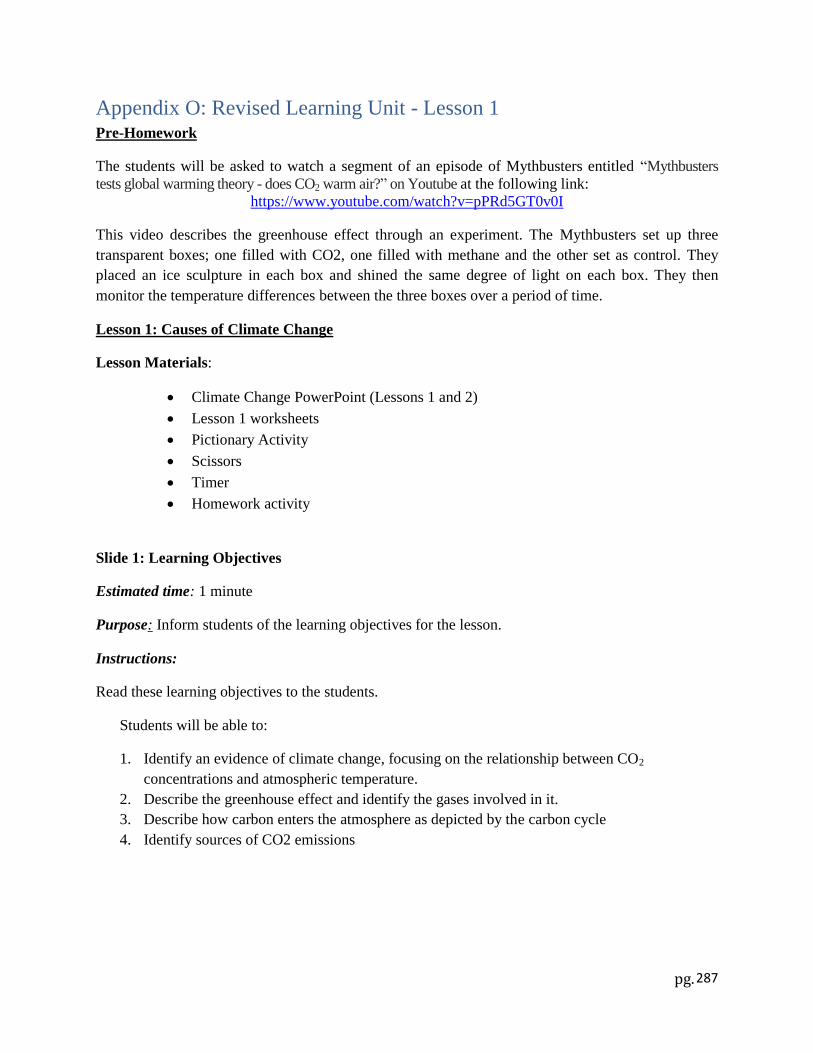
pg.
287
Appendix O: Revised Learning Unit - Lesson 1 Pre-Homework
The students will be asked to watch a segment of an episode of Mythbusters entitled “Mythbusters
tests global warming theory - does CO2 warm air?” on Youtube at the following link:
https://www.youtube.com/watch?v=pPRd5GT0v0I
This video describes the greenhouse effect through an experiment. The Mythbusters set up three
transparent boxes; one filled with CO2, one filled with methane and the other set as control. They
placed an ice sculpture in each box and shined the same degree of light on each box. They then
monitor the temperature differences between the three boxes over a period of time.
Lesson 1: Causes of Climate Change
Lesson Materials:
Climate Change PowerPoint (Lessons 1 and 2)
Lesson 1 worksheets
Pictionary Activity
Scissors
Timer
Homework activity
Slide 1: Learning Objectives
Estimated time: 1 minute
Purpose: Inform students of the learning objectives for the lesson.
Instructions:
Read these learning objectives to the students.
Students will be able to:
1. Identify an evidence of climate change, focusing on the relationship between CO2
concentrations and atmospheric temperature.
2. Describe the greenhouse effect and identify the gases involved in it.
3. Describe how carbon enters the atmosphere as depicted by the carbon cycle
4. Identify sources of CO2 emissions

pg.
288
Slide 2: Climate Change:
Estimated time: 3 minutes
Purpose: This slide provides an introduction to the concepts of climate and weather, as well as
establishing a basic definition of anthropogenic climate change.
Instructions:
Split students into pairs and pass out the Lesson 1 Worksheet to each pair of students.
Ask the class to define each of the words in “anthropogenic climate change”.
Anthropogenic- can be defined as “caused or produced by humans”.
Change - can be defined as “to make the form, nature, content, future course, etc., of
(something) different from what it is or from what it would be if left alone”. Change
denotes a difference between two states of being
Climate- can be defined as “the long-term precipitation and temperature patterns of
an area”.
State that this lesson will primarily cover anthropogenic climate change.
Some follow-up questions you can ask are:
“What is the difference between weather and climate?”
Weather is the short-term patterns of precipitation and temperature such as a hot day
or a thunderstorm while climate is the long-term patterns.
“What is the climate in Puerto Rico?”
Tropical
Additional Information:
The Environmental Protection Agency’s website says the following about natural climate change:
Estimates of the Earth’s changing carbon dioxide (CO2) concentration (top) and Antarctic
temperature (bottom), based on analysis of ice core data extending back 800,000 years. Until the past
century, natural factors caused atmospheric CO2 concentrations to vary within a range of about 180
to 300 parts per million by volume (ppmv). Warmer periods coincide with periods of relatively high
CO2 concentrations. NOTE: The past century’s temperature changes and rapid CO2 rise (to 390 ppm
in 2010) are not shown here.

pg.
289
Figure 31: Natural climate change over the Earth's history
pg.
290
Slide 3: What is the greenhouse effect?
Estimate time: 6 minutes
Purpose: Illustrates how solar energy heats the Earth and how greenhouse gases in the atmosphere
increase the absorption of infrared heat in the Earth’s atmosphere (Objective 2).
Instructions:
Ask students what they believe the definition of a greenhouse gas to be and for examples of
greenhouse gases. Below is the formal definition of a greenhouse gas as well as the examples
of greenhouse gases.
Greenhouse gas- any gas that absorbs infrared radiation produced by solar warming
of the Earth's surface (Dictionary.com).
Examples- carbon dioxide (CO2), methane (CH4), nitrous oxide (NOx), and water
vapor (H2O [g]).
Ask students what they learned about the greenhouse gas effect from the Mythbusters video
the students watched the previous night for homework. Below is a formal definition of the
greenhouse effect.
The greenhouse effect- an atmospheric phenomenon in which infrared radiation of
short wavelengths is easily transmitted into the Earth’s atmosphere (specifically the
troposphere), while infrared radiation of longer wavelengths is less easily transmitted
out of the atmosphere (specifically the troposphere) due to its absorption by
atmospheric greenhouse gases (dictionary.com).
Explain the analogy of the greenhouse effect being an actual greenhouse. In this analogy, the
atmosphere is like the “glass” of the greenhouse. Thermal energy from the sun is allowed to
pass into the “glass”, yet is partially unable to pass back out of the “glass”. This trapped
energy then increases the temperature within the greenhouse.
Go through each of the steps of the greenhouse effect. Ask the students what they think is
happening at each designated location on the diagram. Below are the descriptions of what is
occurring at each part of the diagram.
Point 1: Solar radiation passes into the Earth’s atmosphere.
Point 2: Some of this radiation is reflected back into space by the atmosphere and
Earth’s surface.
Point 3: The remaining radiation that was not reflected outward is then absorbed by
the Earth’s surface.

pg.
291
Point 4: The solar radiation that was absorbed by the Earth’s surface is converted to
thermal heat. This thermal energy heats the Earth’s surface and is then radiated back
out from the surface.
Point 5: A portion of the radiated thermal energy is absorbed by atmospheric
greenhouse.
Point 6: The portion of thermal energy that was not absorbed by the greenhouse
gases travels back to the surface where it is emitted outward yet again.
Point 7: This thermal energy is reflected back off the surface of the earth and back
out to space.
1
Figure 32: Greenhouse Effect diagram

pg.
292
Figure 33: Diagram of the greenhouse effect (GRID Arendal and UNIP)

pg.
293
Slide 4: Which greenhouse gas has the greatest emissions?
Estimated time: 5 minutes
Purpose: Defines the different greenhouse gasses (Objective 2).
Instructions:
Ask the students what they believe is the greenhouse gas with the highest emissions and then
reveal the answer.
The answers include CO2 (carbon dioxide), CH4 (methane), NOx (nitrous oxides), F-
gases (Fluorocarbons).
Ask what they believe is the second greenhouse gas with the highest emissions and then
reveal the answer.
Continue in this manner, until all four of the greenhouse gases are revealed. Have students
fill out their own graph as it is discussed.
The pie chart below will be provided to students, however the titles will be removed.
Figure 34: Relative percentage of greenhouse gases in terms of greenhouse gas emission levels
(Environmental Protection Agency)
Explain that these gases are not necessarily bad for the environment. Carbon dioxide is only
an issue because it is currently present in the highest amounts recorded in the Earth’s history.
It is for this reason that the remainder of the lesson will focus on the effects of carbon dioxide
concentrations on mean global temperature.
82%
9%
6% 3%
Carbon dioxide
Methane
Nitrous Oxide
Flourine gases

pg.
294
Slides 5 - 7: Evidence of Climate Change Graph: Estimated time: 10 minutes
Purpose: Have students identify evidence of anthropogenic climate change by proving that increases
in CO2 concentrations are positively correlated with increases in global temperature (Objective 1).
Instructions:
Ask students to fill in the graphs in their worksheets. Students will work in pairs, with one
student creating the CO2 concentration graph and the other creating the temperature graph.
Give the students 5 minutes to complete their graphs. Give the students another minute to
compare the two graphs that they have created.
Provided below are the two blank graphs that are provided to students in the
worksheet packet.

pg.
295
Go over the graph and have students correct their graphs if necessary. Ask the students what
they think this graph means. Discuss with students the correlation between CO2
concentrations and global temperature.
The completed graphs should look similar to the graphs below.
57
57.4
57.8
58.2
58.6
59
1880 1890 1900 1910 1920 1930 1940 1950 1960 1970 1980 1990 2000 2010
57.45
57.15
57.55
57
57.3
57.55
57.75
57.95
57.657.65
57.95
58.2558.2
58.5
AnnualGlobalTemperature
AnnualGlobalTemperature
Annual Global Temperature from 1880 to 2010
Time (Years)
Ann
ua
lG
lob
al
Te
mp
era
ture
(Fah
ren
heit)
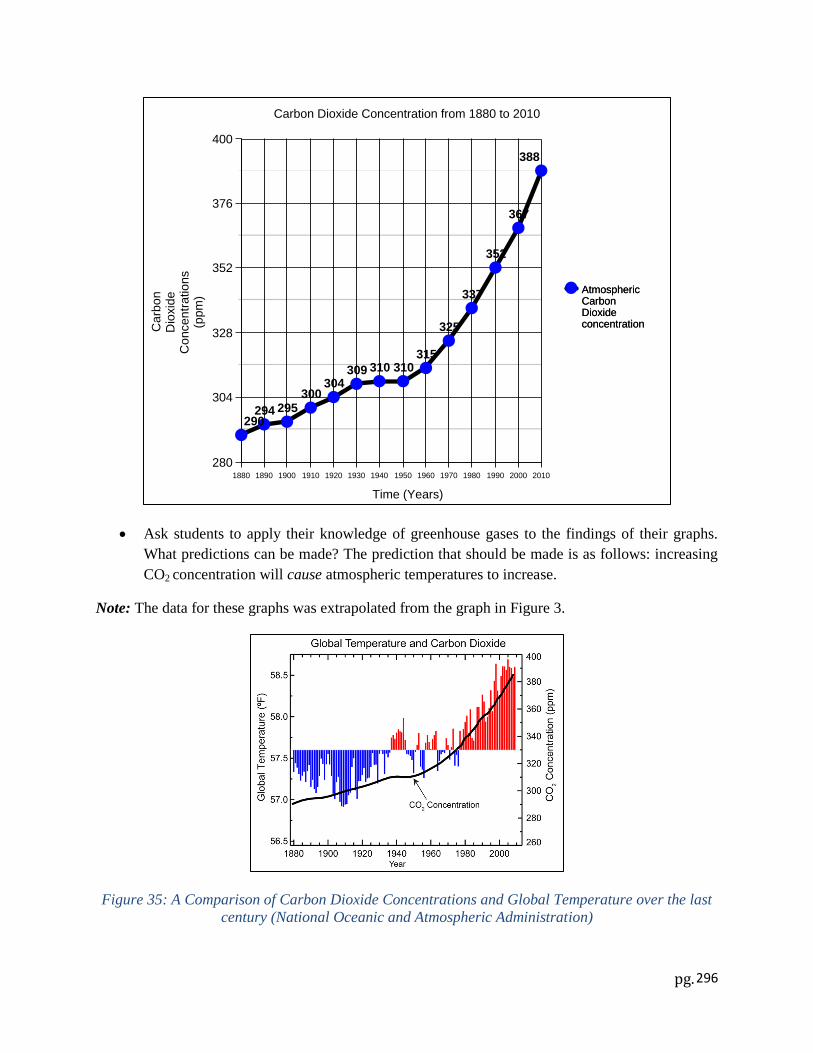
pg.
296
Ask students to apply their knowledge of greenhouse gases to the findings of their graphs.
What predictions can be made? The prediction that should be made is as follows: increasing
CO2 concentration will cause atmospheric temperatures to increase.
Note: The data for these graphs was extrapolated from the graph in Figure 3.
Figure 35: A Comparison of Carbon Dioxide Concentrations and Global Temperature over the last
century (National Oceanic and Atmospheric Administration)
280
304
328
352
376
400
1880 1890 1900 1910 1920 1930 1940 1950 1960 1970 1980 1990 2000 2010
290294 295
300304
309 310 310315
325
337
352
367
388
AtmosphericCarbonDioxideconcentration
AtmosphericCarbonDioxideconcentration
Carbon Dioxide Concentration from 1880 to 2010
Time (Years)
Ca
rbo
nD
ioxid
eC
oncen
tra
tio
ns
(ppm
)

pg.
297
Additional Information:
Provided below are additional representations of the increases in greenhouse gases and temperature,
respectively.
Figure 36: Greenhouse Gas concentrations from Year 0 to 2005 (Global Greenhouse Warming)
Figure 37: Relationship between Global Temperature Anomaly and Carbon Dioxide Concentration
(Environmental Protection Agency)

pg.
298
Slide 8: How does carbon dioxide enter the atmosphere?
Estimated time: 7 minutes
Purpose: demonstrate the carbon cycle and how carbon enters the atmosphere as CO2 (Objective 3).
Instructions:
Because Carbon dioxide has the greatest emissions, discuss with the class how carbon enters
the atmosphere.
Ask the students to fill out the diagram below on their worksheets. Students will continue
working in the same pairs as before. They can use the list of terms to help determine which
term belongs in which space. This list of terms is comprised of the labels present in the
diagram below. Give students some time to discuss their ideas.
Explain each step of the carbon cycle with the entire class starting with sunlight, and then
moving onto photosynthesis, living organic carbons, and animal/plant respiration. Man-made
carbon emission should be mention separately, as they are not a part of the natural carbon
cycle. Explain that all living beings contain carbon. Furthermore, explain that carbon is
exchanged between the oceans, air, and organisms via numerous natural functions. An
important aspect of the carbon cycle involves the decay of organisms into the soil, returning
nutrients to the soil. In cases where anaerobic decomposition has occurred over millions of
years, fossil fuels can be formed, explaining why high amounts of carbon are emitted in the
atmosphere as a product of burning fossil fuels.
Figure 38: Simplified depiction of the carbon cycle (UCar.edu)

pg.
299
Additional Information:
Before administering this lesson, consult the diagram below for a more detailed representation of the
carbon cycle and the various related processes. For further student learning, students may consult the
website provided at the end of this document for an interactive version of the below diagram.
Figure 39: Detailed depiction of the carbon cycle (Sciencelearn.org)

pg.
300
Slide 9: Which is the highest source of carbon dioxide emissions?
Estimated time: 5 minutes
Purpose: determine the sources of carbon dioxide that have the highest emissions (Objective 4)
Instructions:
Ask the students what they believe is the highest source of carbon dioxide emissions and then
reveal the answer.
The answers include electricity, transportation, industry, residential and commercial,
and non-fossil fuel combustion.
Ask what they believe is the second highest source of carbon dioxide emissions and then
reveal the answer.
Continue in this manner, until all five sources are revealed. Have students fill out their own
graph as it is discussed.
The pie chart below will be provided to students, however the titles will be removed.
Figure 40: Breakdown of carbon dioxide emission by source of emission (Environmental Protection
Agency)
39%
32%
14%
9% 6%
Fossil fuel consumtion to
produce Electricity
Burning fossil fuels for
Transportation
Industrial use of fossil
fuel
Residential and
Commericial use of fossil
fuel
Other (Non Fossil Fuel
Combustion)

pg.
301
Note: Inform students of the basic chemical formula for combustion (C + O2 CO2) and that this is
the basic process that will produce the CO2 that is emitted into the atmosphere. This equation should
either be verbally stated or written on the board.

pg.
302
Slide 10: Activity- Pictionary (Sources of CO2 emissions)
Estimated time: 10 minutes
Purpose: illustrate the different sources of CO2 emissions (Objective 4)
Instructions:
Split the class into groups of four or five students.
Give each group a timer and have them randomly select four index cards per group, each
labeled with sources of CO2 emissions.
Each group will pick a person to draw first, and that person will randomly select one of the
index cards and attempt to draw the source listed on a blank piece of paper. The remaining
members of the group must attempt to guess the source that is being drawn. The team will
only be given one minute to guess the source being depicted. Should the group be
unsuccessful in guessing the source, the answer will be provided after the minute has elapsed.
The group will then decide on a new person to draw and continue this process until all four
cards have been selected.
Have each group categorize the source listed on each card, placing them into the four
categories. Students will write their categorizations on the picture that corresponds to each
source of carbon emission. The categorizations are as follows:
Electricity: light bulb, air conditioner, computer
Transportation: car, plane, motorboat
Industrial: Factory, smoke stack, freight train
Commercial/Residential: furnace, campfire, barbeque
.

pg.
303
Slide 11: How can we reduce CO2 emissions?
Estimated time: 5 minutes
Purpose: Encourage students to think proactively about what they can personally do to reduce CO2
emissions (Objective 4).
Instructions:
Ask the students how society as a whole can reduce CO2 emissions. Discuss this openly with
the students. Possible responses may include:
Use less energy
Turn off lights when you aren’t using them
Don’t leave the TV on when you aren’t watching it
Don’t overuse air conditioning
Don’t drive as much- walk when you can or use public transportation
Eat less red meat
Use energy-efficient appliances
Recycle or reuse products when possible
Buy local produce
Ask students how they personally can reduce CO2 emissions. Write the responses on the
board to create a list of ideas. Make sure to distinguish the differences between what society
can do and what the students can personally do. Also, make sure to emphasize that individual
actions can make an impact. These actions, when done by many individuals, can have a huge
impact in lessening carbon dioxide emissions.

pg.
304
Homework activity
Instructions:
Pass out the homework activity to each of the students. Each student should answer the questions
and return the worksheet the next day. Below are the questions provided in the homework.
Students will complete the following activities, like a scavenger hunt.
4. Find a brief story from someone you know about how climate change affects him or her.
Write a description of this story.
5. Find an object (a picture or the object) that you use or describe an activity that you encounter
in your life that emits greenhouse gases.
6. Describe a new way to use the object or complete the activity that you chose in step 2 in a
way that emits less greenhouse gases.

pg.
305
82%
9%
6% 3% Carbon dioxide
Methane
Nitrous Oxide
Flourine gases
Appendix P: Student materials
Lesson 1 Worksheet
Lesson 1: Causes and Evidences of Climate Change
Please fill out the following graphs when your teacher instructs you to do so.
1. Which Greenhouse Gas has the greatest emissions? Fill out this graph as the class discusses what
the greenhouse gas with the greatest emissions is.
Word Bank
Fluorine Gases Methane Carbon Dioxide Nitrous Oxides
Examples:
Aerosol Products Bulvine Fecal Matter Fossil Fuel Burning Trash Incineration

pg.
306
2. Global Temperatures vs. CO2 Concentrations: Split into pairs. Using the below table, have one
person create the graph for global temperatures and one person create the graph for CO2
concentrations.
CO2 Concentration Graph:
Year CO2 (ppm)
1890 294
1900 295
1910 300
1920 304
1930 309
1940 310
1950 310
1960 315
1970 325
1980 337
1990 352
2000 367
2010 388

pg.
307
Global Temperature Graph:
Year Temp (F)
1890 57.15
1900 57.55
1910 57.0
1920 57.3
1930 57.55
1940 57.75
1950 57.95
1960 57.6
1970 57.65
1980 57.95
1990 58.25
2000 58.2
2010 58.5
Now compare these two graphs. What is the correlation between global temperature and CO2
concentrations?

pg.
308
3. How does carbon enter the atmosphere?
Working in a pair, fill out the below graph using the word bank below
Word Bank
Auto and
factory
emissions
Animal
Respiration
Dead Organisms
and waste
productions
Fossils and
Fossil Fuels
Plant
Respiration
Photosynthesis
Sunlight

pg.
309
39%
32%
14%
9%
6% Electricity
Transportation
Industry
Residential and Commericial
Other (Non Fossil Fuel Combustion)
4. Which is the highest source of carbon dioxide emissions? Fill out this graph as the class discusses
what the highest source of carbon dioxide emissions is.
Word Bank
Burning fossil fuels for Transportation
Fossil fuel consumption to produce Electricity
Residential and Commercial use of fossil fuels
Other (Non fossil fuel combustion)
Industrial use of fossil fuels
pg.
310
Pictionary Activity Worksheet
Pictionary Activity: Below are the cards to be used for the Pictionary activity. Cut out the cards
before class and give each group 4 cards.
Light Bulb
Light Bulb
Air Conditioner Air Conditioner
Computer Computer
Car Car
Plane
Plane
Motorboat Motorboat

pg.
311
Factory Factory
Smoke Stack Smoke Stack
Freight Train Freight Train
Furnace Furnace
Campfire Campfire
Barbecue Barbecue

pg.
312
Homework Activity Worksheet
Name:________________________________________________________
Homework Activity
4. Find a brief story from someone you know about how climate change affects him or her.
Summarize this story below.
_________________________________________________________________________________
_________________________________________________________________________________
_________________________________________________________________________________
_________________________________________________________________________________
_________________________________________________________________________________
_________________________________________________________________________________
5. Think of an object (a picture or the object) you use or describe an activity you encounter in
your life that emits greenhouse gases.
_________________________________________________________________________________
_________________________________________________________________________________
_________________________________________________________________________________
6. Describe a new way to use this object or complete this activity in a way that emits less
greenhouse gases.
______________________________________________________________________________
______________________________________________________________________________
______________________________________________________________________________
______________________________________________________________________________
______________________________________________________________________________
______________________________________________________________________________
______________________________________________________________________________

pg.
313
Appendix Q: Revised Learning Unit - Lesson 2
Lesson 2: The Impacts of Climate Change
Lesson Materials:
Climate Change PowerPoint (Lessons 1 and 2)
Habitat Shift Activity
Scissors
Slide 13: Learning Objectives
Estimated time: 1 minute
Purpose: Inform students of the learning objectives for the lesson.
Instructions:
Read these learning objectives to the students.
Students will be able to:
5. Identify the predicted impacts of a warmer atmosphere on the earth, focusing on the water
cycle and oceans
6. Determine the impacts of climate change on animals and plants in El Yunque, focusing on the
impacts of rising temperature and changing precipitation patterns.

pg.
314
Slide 14: What causes a warmer atmosphere?
Estimated time: 3 minutes
Purpose: Review what was discussed in the previous lesson by discussing how increased CO2 causes
atmospheric temperatures to increases.
Instructions:
Ask the question to the class of students, having them provide various answers based on the
previous lesson. This question is meant to be a quick review of topics that students will have
learned in the previous day’s lesson on the causes and evidence of climate change.
Continue this discussion until students have provided three accurate responses. Possible
responses may include increases in CO2 concentrations, increased greenhouse gas emissions,
continued deforestation, and continued burning of fossil fuels.

pg.
315
Slide 15: What are some natural processes that can be affected by a warmer atmosphere?
Estimated time: 5 minutes
Purpose: Explain the impacts of a warmer atmosphere on natural processes (Objective 5).
Instructions:
Briefly explain that a warmer atmosphere affects many natural cycles and processes,
including the nitrogen cycle, carbon cycle, and water cycle, among others. Provided below
are explanations of these cycles as well as a description of the predicted impacts.
Carbon Cycle – The carbon cycle, as explained in the previous lesson, starts with the
sun’s energy being used for photosynthesis in plants. Plants and animals can both be
identified as organic carbons. Both animal respiration and the burning of fossil fuels
contribute CO2 to the atmosphere. Additionally, plants and animals contribute carbon to
the earth when they decompose. Oceans act as carbon sinks and can take in atmospheric
carbons. Lastly, there are deposits of carbon that are locked away in glacial ice and
bedrocks, but this carbon is much less accessible. Anthropogenic contributions to the
carbon cycle are strongly tied to climate change. A significantly warmer atmosphere (due
to anthropogenic climate change) would indicate that distribution of accessible carbon
would greatly differ from any other period in the Earth’s recorded history. Looking at
CO2 levels from the past 800000 years substantiates this conclusion. Before the past
decade, it is believed that atmospheric CO2 levels had not risen past 300 ppm.
Nitrogen Cycle – The nitrogen cycle contains 4 main processes: nitrogen fixation,
ammonification, nitrification, and denitrification. Nitrogen fixation is the process of
converting nitrogen gas (N2) to ammonium (NH4+). This process is primarily done by
certain bacteria and allows certain organisms to utilize nitrogen directly from the
atmosphere. Next ammonification occurs when organic nitrogen is converted into NH4+
by organisms that decompose matter such as various fungi. From there, NH4+ is
converted into nitrate (NO3-) by bacteria in the process known as nitrification. Lastly, the
anaerobic process of denitrification occurs which converts NO3- into nitrogen gas (N2),
nitrous oxide gas (NO2), nitrous oxide (N2O) and nitric oxide (NO). Due to human
activities, there are excess amounts of atmospheric nitrogen oxides (NOX). Nitrous oxides
are currently the world’s third largest contributor to temperature increases of the
atmosphere. This is due to increased release of nitrogen into the atmosphere during the
combustion of fossil fuels. Furthermore, this accumulation of nitrogen has been seen to
affect the functionality of varied ecosystems. Other human impacts include increased
concentrations of ammonia (NH3) due to increased fertilizer use and increased NO
concentrations due to the elevated presence of N2 in the atmosphere in the last century.
Water Cycle – The water cycle describes the collective movements of water throughout
terrestrial and oceanic biomes, and the atmosphere. Basic processes involved in this cycle

pg.
316
are evaporation, transpiration, precipitation, and condensation. This process will be
described in greater detail in the following slides. The water cycle would be affected in
terms of increased evaporation and resultant decreased precipitation. This phenomenon
can be confusing for students since a common misconception would be that increases in
evaporation lead to increased precipitation. While this is somewhat true, the former
description does not account for global wind patterns affecting the tropics and subtropics.
The winds in subtropical areas (such as Puerto Rico) carry the moisture-laden air to
equatorial tropics, therefore increasing rainfall in the tropics, but decreasing it in the
subtropics.

pg.
317
Slide 16: What are the specific impacts of a warmer atmosphere on the water cycle?
Estimated time: 8 minutes
Purpose: Explain how a warmer atmosphere impacts the water cycle (Objective 1).
Instructions:
Show students the above diagram. Explain the various steps listed.
Evaporation: The changing of liquid water into water vapor
[H2O (l) + Energy H2O (g)].
Condensation: The changing of water vapor into liquid water in the form of clouds
or fog
[H2O (g) H2O (l) + Energy].
Transpiration: The evaporation of liquid water from vegetation. It creates a cooling
effect when it occurs in large-scale scenarios, such as tropical rainforests.
Runoff: The transfer of liquid water from one physical location to another, usually
from a higher elevation to a lower elevation and/or body of water.
Precipitation: The falling of liquid water from clouds or fog down to the surface of
the earth. Precipitation can take the form of rain, hail, snow, sleet, and fog drip.
Ask how a warmer atmosphere might affect each of these steps. It is important that you frame
the changes that may occur in the broad sense (i.e. precipitation changes and evaporation
changes). This will ensure that this discussion does not become too narrowly focused on
topics that will not be addressed.

pg.
318
Additional Information:
Two more detailed and holistic depictions of the water cycle are provided below for to better your
understanding of some of the more intricate portions of water cycle.

pg.
319

pg.
320
Slide 17: How would warmer atmosphere affect the oceans?
Estimated time: 3 minutes.
Purpose: Describe how increased atmospheric temperatures cause increased ocean temperatures
(Objective 5).
Instructions:
Ask students how a warmer atmosphere affects the oceans. Have students provide different
ideas. If students do not provide the answer “warmer oceans” after 2 minutes, you should
provide the response.
Then display the following graph. This graph shows the change in ocean temperatures from
1880 to 2012, relative to the average ocean temperature from 1971 to 2000.

pg.
321
Slide 18: What are possible environmental effects of warmer oceans?
Estimated time: 4 minutes
Purpose: Discuss the effects of warmer oceans (Objective 5).
Instructions:
Ask students what the possible environmental effects of warmer oceans are and discuss each
topic further. Then ask students what effects of warmer oceans would particularly affect
Puerto Rico. Possible Answers include the following:
Rising sea levels – Sea ice will begin to melt more rapidly as ocean temperatures rise,
creating excesses of liquid water that will cause global sea levels to rise.
Changed chemical composition – Warmer oceans can more readily act as a sink of
carbon dioxide. As more CO2 is added into the ocean, the chemical process of creating
carbonic acid (CO2 + H2O H2CO3) happens in greater amounts. This can lead to slight
shifts (or potential differences) in the ocean’s pH toward acidic levels (pH<7).
Coral reef changes – as the chemical composition of oceans change, fragile habitats like
the coral reef will change, namely by experiencing excessive coral bleaching. Coral then
dies, eliminating prime aquatic habitats.
Loss of aquatic wildlife – as the chemical composition of oceans change, certain species
of fish and plants will be poorly adapted to new chemical conditions. As well, species
many also be unable to survive in warmer waters and die as a result.
Habitat shifts – Species that are not well adapted to the rising temperatures in the oceans
will cause them to move to other areas that have conditions they are more accustomed to.

pg.
322
Slide 19: What are the impacts of a warmer atmosphere on the water cycle?
Estimated time: 4 minutes
Purpose: Review the effects of a warmer atmosphere on oceans and the water cycle (Objective 5).
Instructions:
Review the below diagram with the class in order to emphasize how a warmer atmosphere
can cause warmer oceans which can cause sea levels to rise and can change evaporation
which can cause precipitation changes.
Warmer atmosphere: This is caused by increased greenhouse gas emissions. This
observed heating effect has a profound impact on the water cycle. In particular, rates
of all processes involving evaporation would become increased. Additionally,
increased global temperature due to increased greenhouse effect would lead to
warmer oceans.
Warmer oceans: The oceans would experience a similar warming effect as a result
of increased greenhouse effect. These warmer oceans would lead to the occurrence of
many other phenomena, including the thermal expansion of the oceans water and the
increased melting of sea ice.
Sea level rise: Sea levels could rise drastically if continued climate change were to
occur. This is partially due to slight thermal expansion of water as it is heated. This
effect is usually very miniscule when involving small amounts of liquid. However,
this expansion would be able to be observed and measured when occurring in large
bodies of water, such as the ocean. Another source of sea level rise would be the
melting of sea ice and increased glacial melting/run-off, which would deposit excess
liquid water into the ocean.
Warmer Atmosphere
Warmer Oceans
Sea Level Rise
Change in Evaporation
Change in Precipitation

pg.
323
Change in evaporation: Evaporation would increase in tropical regions as global
temperatures increase. This would occur in all processes that involve evaporation,
including transpiration. The atmosphere’s capacity to hold water would increase by
7% for each degree Celsius that atmospheric temperature rises. This allows for
increased ability to hold water meaning that the atmosphere’s saturation point for
holding water vapor would become greater. According, as the amount that water is
held in the atmosphere changes, so does patterns on precipitation.
Change in precipitation: Depending on the region, precipitation could either
increase or decrease. Wind patterns are a crucial factor in whether precipitation will
increase or decrease. Equatorial regions, such as the Amazon, will experience
increases in precipitation. This is largely because winds will carry the excesses of
evaporated moisture to these areas. Puerto Rico is an area that would, although
variable in its rain patterns across the island, experience a general decrease in
precipitation. Additionally, Puerto Rico would experience more extreme seasons,
with less rain falling in the dry seasons and more rain falling in the wet season. The
most immediate impact of a drying trend in Puerto Rico would be increased
likelihood of droughts.

pg.
324
Slide 20: Habitat Shift Activity
Estimated Time: 20 minutes
Purpose: Illustrate the effects of changes in precipitation and increased global temperatures on
animals and plants (Objective 6).
Students will be given an activity to further illustrate the effects of precipitation changes and
increasing global temperature, specifically on Puerto Rico.
Goal: Understand the effects of climate change on animal and plant habitats in El Yunque and how
these effects are connected and can cause habitat shifts for animal species that are endemic to, or
only found on, Puerto Rico.
Each group will be provided with (in the Habitat Shift Activity packet):
Picture of a typical Puerto Rican mountain, labeled with different elevations
Pictures of various animals of El Yunque that are endemic to Puerto Rico including coquís,
Puerto Rican parrots, and elfin woods warblers
Pictures of various plants of El Yunque that are native to Puerto Rico including the sierra
palm, aceitillo falso , and bananas
Labels of each of the forests including Elfin Woods, Sierra Palm, Palo Colorado, Tabonuco
Instructions on how to complete each scenario, as well as the habitat requirements for the
different animals and plants
Questions for students to reflect on the activity
Instructions:
Divide students into groups of 5
Students will first place the different habitats on the picture of the mountain based on their
required temperature and precipitation levels. This information is provided in the tables
accompanying this activity.
Have students place the provided animals into their corresponding habitats on the picture of
the mountain by following their respective habitat descriptions and needs. Specifically, use
each animal’s temperature range, diet, possible elavations and precipitation needs to
determine its placement on the mountain diagram. This information is provided in the tables
accompanying this activity.

pg.
325
Next, students will look at each scenario described below, and move each habitat according
to the changes that have occurred due to that specific climate change.
Students will then move animals and plants to new locations as the instruction sheet describes
habitat changes that are reflective of climate change.
Note: If animals cannot be placed in any of the habitats, they should be left off of the
page.
Students will reflect on how climate change can affect the various biomes and animal habitats
in Puerto Rico by answering the question provided in the packet.
When all teams have finished, go over the questions with the students.
Students are expected to see the disappearance of the elfin woods habitat as well as
the elfin-woods warbler. They also will see that the habitats of most of the listed
species will shift up the mountain to higher elevations.
Discuss with students that habitat shift is not something that is only hypothetical, but is
actually happening in Puerto Rico.
One species that is currently experiencing habitat shift is the elfin-woods warbler.
This species is currently seeing the disappearance of its prime habitat, the elfin forest,
and being forced to relocate to habitats that it is not well suited for. This is a trend
that has been noted by USFS species managers in El Yunque National Forest. Should
current climate change trends continue, the elfin-woods warbler would eventually
completely disappear Puerto Rico. Similar trends have also been observed for other
species that are endemic, or can only be found in Puerto Rico, such as the Puerto
Rican parrot.

pg.
326
Habitat Activity
Step 1: Set-up
Cut out the pictures of each of the animals and plants below, as well as the names of the forests.
Coqui: Puerto Rican boa: aceitillo falso :
Puerto Rican parrot: Puerto Rican twig anole: Little fire ant:
Elfin-woods warbler: Sierra Palm: Bananas:
Palo Colorado
Forest
Sierra Palm
Forest
Elfin Forest
Tabonuco
Forest

pg.
327
0 ft.
2000 ft.
2500 ft.
3000 ft.
3500 ft.
Section 4
Section 2
23=2
Section 1
Section 3
Section 1
Section 1
Section 1
El Yunque Map

pg.
328
Forest Requirements: The forests below can only exist where the precipitation level and the average temperature ranges match the below
requirements.
Forest Level Precipitation Levels (inches/year) Average Temperature Range (° F)
Tabonuco Forest < 100 80– 85
Palo Colorado Forest 150- 180 75 – 80
Sierra Palm Forest 100-150 70 – 75
Elfin Forest > 180 65 – 70
Animal and Plant Requirements: The animals and plants below can only exist where the precipitation level, the average temperature
ranges, and diet match the below requirements.
Animal Habitat
Temperature
Range (° F)
Habitat Precipitation
Range (inches/year)
Diet Predators
Coquí 65– 85 > 32 insects Puerto Rican boa
Puerto Rican parrot 70– 85 < 150 plants Puerto Rican boa
Elfin-woods warbler 65– 75 < 200 insects Puerto Rican boa
Puerto Rican boa 80– 85 < 100 birds and lizards None
Puerto Rican twig anole 80– 85 < 100 insects Puerto Rican boa
Sierra palm 70– 75 < 150 photosynthesis Puerto Rican parrot
Aceitillo falso 80– 85 < 100 photosynthesis Puerto Rican parrot
Little fire ant 65 – 85 Any plants Birds and lizards
Bananas 75 – 85 < 180 photosynthesis Little fire ant and
Puerto Rican parrot

pg.
329
Step 2: The original condition
According to the original condition below, place the forests in the elevation section on the El Yunque map. Make sure that the forest is in
the elevation section of El Yunque that has the precipitation levels and average temperature ranges that are required for that forest. Then
place the animals and plants in the elevation section on the El Yunque map that has the precipitation levels, average temperature ranges, and
diet that are required for that forest.
Original Condition:
Section Elevation
(ft. above sea level)
Precipitation Level
(inches/year)
Average Temperature
(° F)
1 < 2000 90 82
2 2000-2500 165 77
3 2500-3000 125 72
4 > 3000 190 67
Step 3: The effects of changing temperatures and precipitation levels on habitats.
Scenario 1: The precipitation levels have decreased from their original levels by 50 inches per year.
Fill in the graph below, change the precipitation levels and average temperature ranges according to the above scenario.
Section Elevation
(ft. above sea level)
Precipitation Level
(inches/year)
Average Temperature
(° F)
1 < 2000 82
2 2000-2500 77
3 2500-3000 72
4 > 3000 67
Move the forests in the elevation section on the El Yunque map. Make sure that the forest is in the elevation section of El Yunque that has
the precipitation levels and average temperature ranges that are required for that forest. Then move the animals and plants in the elevation
section on the El Yunque map that has the precipitation levels, average temperature ranges, and diet that are required for that forest.

pg.
330
Scenario 2: The average temperatures of all of the habitats have increased from their original measurements by 5° F
Fill in the graph below, change the precipitation levels and average temperature ranges according to the above scenario.
Section Elevation
(ft. above sea level)
Precipitation Level
(inches/year)
Average Temperature
(° F)
1 < 2000 90
2 2000-2500 165
3 2500-3000 125
4 > 3000 190
Move the forests in the elevation section on the El Yunque map. Make sure that the forest is in the elevation section of El Yunque that has
the precipitation levels and average temperature ranges that are required for that forest. Then move the animals and plants in the elevation
section on the El Yunque map that has the precipitation levels, average temperature ranges, and diet that are required for that forest.
Scenario 3: The precipitation levels have decreased from their original levels by 50 inches per year AND the average temperatures of all of
the habitats have increased from their original measurements by 5° F
Fill in the graph below, change the precipitation levels and average temperature ranges according to the above scenario.
Section Elevation
(ft. above sea level)
Precipitation Level
(inches/year)
Average Temperature
(° F)
1 < 2000
2 2000-2500
3 2500-3000
4 > 3000
Move the forests in the elevation section on the El Yunque map. Make sure that the forest is in the elevation section of El Yunque that has
the precipitation levels and average temperature ranges that are required for that forest. Then move the animals and plants in the elevation
section on the El Yunque map that has the precipitation levels, average temperature ranges, and diet that are required for that forest.

pg.
331
Scenario 4: The precipitation levels have decreased from their original levels by 75 inches per year AND the average temperatures of all of
the habitats have increased from their original measurements by 10° F.
Fill in the graph below, change the precipitation levels and average temperature ranges according to the above scenario.
Section Elevation
(ft. above sea level)
Precipitation Level
(inches/year)
Average Temperature
(° F)
1 < 2000
2 2000-2500
3 2500-3000
4 > 3000
Move the forests in the elevation section on the El Yunque map. Make sure that the forest is in the elevation section of El Yunque that has
the precipitation levels and average temperature ranges that are required for that forest. Then move the animals and plants in the elevation
section on the El Yunque map that has the precipitation levels, average temperature ranges, and diet that are required for that forest.

pg.
332
Step 4: Reflection: Answer the following questions.
1) What can be said about the effect that changes in precipitation levels have on the plants and animals?
2) What can be said about the effect that changes in temperature have on the plants and animals?
3) What can be said about the effect that changes in both temperature and precipitation levels have on the plants and animals?
4) As the animal habitats change in response to the above scenarios, what can be said about its affects on the food chains?

pg.
333
Appendix R: Additional Lesson Outlines
Lesson 3: Water
The goal of this lesson is to expand upon of the effects that climate change would have on water as stated
in Lesson 2. The lesson is designed to emphasize the impacts that climate change would have on water,
specifically bodies of water and the water cycle.
Learning Objectives:
Students will be able to:
1. Understand and identify the components of the water cycle
2. Determine how warmer global temperatures affect the water cycle
3. Determine the effects that rising sea levels would have on Puerto Rico
4. Determine the cause of changed precipitation patterns with respect to climate change
5. Determine the consequences of changing precipitation patterns in Puerto Rico
Topics of Interest:
Review the water cycle from Lesson 2
Review how anthropogenic climate change results in increased greenhouse gasses. These include sulfur
dioxide, SO2, which when combined with water vapor acidifies rain and damages aquatic life and forest
fauna, and carbon dioxide CO2, which is a major contributor to rising global temperatures.
Explain how rising global temperatures leads to the melting of polar ice caps, leading to more water in the
ocean and higher sea levels.
Explain how sea level rise affects small islands like Puerto Rico. This includes coastal erosion and a loss
of the island’s landmass.
Explain how rising global temperatures leads to more water evaporation, which changes precipitation
cycles.
Explain the consequences of changed precipitation patterns, including wetter rainy seasons and dryer dry
seasons. Explain how this leads to droughts and flooding. Use examples like the drought that occurred in
Puerto Rico in the summer of 2014 to emphasize the impact that this would have on the island. Explain
how changed precipitation patterns affect plant and animal habitats, similar to the activity in Lesson 2.
Activity: Suggested by Edgardo Gonzalez (See Appendix B)
This activity is designed to show students how trees contribute to natural cycles, more specifically the
water cycle.
Materials: Plastic shopping bag
1. Take students to a tree outside with branches that are low enough to reach.

pg.
334
2. Place a plastic bag or have students place plastic bags over a tree branch. Be sure to get most of
the leaves that are on that branch into the bag.
3. Close the bag.
4. Leave the bag and the tree alone for some time. Time can be occupied with other activities,
class lecture, etc. This can include material that covers tree function and biological/chemical
cycles that trees are associated with. Examples include the carbon cycle and the water cycle
(transpiration).
5. Eventually, return with students and remove bag(s). The bags should have water, which can
show more concretely how trees work. Emphasize to students that the water in the bag is only
part of what was produced from one tree, and that therefore an entire forest of trees would
have a large amount of water involved in its cycles. Emphasize the importance of vegetation
overall.
Activity: Island in a box
Note: This activity can be scaled up or scaled down depending on what resources are readily available.
Materials:
12” x 12” x 6” solid bottomed container
Gravel
Platform to build the island on.
Sand
12” ruler x2
Duct tape
Building markers (some sort of token; such as buildings from the game “Monopoly”)
People markers (2 tokens that can represent people in two colors; blue and green)
Water
Step One: Students must set up the initial box apparatus
1. Place the container on the ground with the opening facing upwards.
2. Use the duct tape to tape one of the rulers vertically onto one of the faces of the container. Make
sure that the tape is placed near the top of the container, and that the ruler is attached securely.
Step Two:
1. Place the small platform in the center of the box apparatus.
2. Place the gravel/rock on top of this platform and slightly around the platform, until it is no longer
visible.
3. Pour the sand over the gravel and on the bottom of the container until the bottom of the container
is no longer visible. Leave an inch from each box wall uncovered, and make sure that the gravel
is mostly covered. If done correctly this island should look like a miniature “mountain” in the
center of your container.

pg.
335
Step Three:
1. Place the markers according to the following parameters:
a. Industries (houses) must be located within an inch and a half from the coast of the island.
b. The blue people (fishermen) cannot live more than two inches from the coast, as their
main source of income is dependent on the ocean.
c. The green people (farmers) must be placed at least three inches from the coast, as they
cannot grow crops in salty soils.
2. Have students note the rough placement of the people and buildings on a provided worksheet, as
this is the initial condition of the island
Step Four:
1. Pour the water into the box until it reaches the half-inch mark on the ruler.
2. Students will move the people further inland as sea levels rise, according to their specifications
outlined in step 3. However, the industries must stay stationary and will therefore be lost they are
covered in water.
3. Students should note what has occurred on the island, including whether industries were lost or
people were displaced.
4. Add another half-inch of water (the ruler should read 1 inch). Note any displacement of people or
loss of industries.
5. Repeat this pouring and displacing process until the water reaches the 3 inch mark on the ruler.
Potential Follow-up Questions:
How many industries remained on the island?
How far inland did the people have to move?
What did you observe about the sand as the water was added?
What effect of climate change would this correspond to in reality?

pg.
336
Lesson 4: Impacts on Humans, Adaptation, and Mitigation
The goal of this lesson is to convey to students how climate change impacts humans, as well as ways in
which humans can adapt to and mitigate these changes.
Learning Objectives:
Students will be able to:
1. Identify ways in which climate change would have an effect on various aspects of human society,
industries, and economy
2. Define adaptation and identify ways in which one can adapt to climate change
3. Define mitigation and identify ways in which one can mitigate climate change
Video:
The following video has people from Belize, Bolivia, and Brazil sharing personal stories about how
climate change has affected their lives. These stories focus primarily on water, which is one of the ways
in which climate change will have a negative impact on people, especially in Puerto Rico
https://www.youtube.com/watch?v=Lv2XxXNqZa8
This video has subtitles in English and Spanish
Topics of Interest:
Impacts on Humans
Explain how climate change would have an effect on various aspects of society
These include the tourism industry, the food industry, the energy industry, and more.
Explain how climate change could affect tourism industry in Puerto Rico. Pay close attention to
how sea level rise erodes beaches, one of the island’s biggest tourist attractions.
Explain how climate change could affect the food industry in Puerto Rico. Mention that the island
imports a majority of its food products, lending itself to becoming vulnerable to negative effects
of climate change in other parts of the world.
Explain how climate change could affect the energy industry and Puerto Rico’s ability to have
electricity. Focus on how, as an island, it must import fossil fuels to make electricity.
Mention how importing goods requires the use of more fossil fuels so that transport vehicles may
travel and bring said goods to the island.
Adaptation
Begin by defining adaptation.

pg.
337
Provide different examples of adaptation and how they help one adapt to the effects of climate
change. Examples can include changing where one lives or changing one’s diet.
Mitigation
Begin by defining mitigation; be sure to compare to the definition of adaptation so that students
understand the difference.
Provide different examples of mitigation and how it is that they mitigate the effects of climate
change. Examples can include recycling, agroforestry, and urban gardens.

pg.
338
Lesson 5: Recycling
The goal of this lesson is to provide an in depth understanding of recycling and its benefits.
Learning Objectives:
Students will be able to:
1. Identify the benefits on the environment that recycling has
2. Identify various ways in which one can recycle
Topics of Interest:
Introduce the topic of recycling and how it benefits the environment. Explain how recycling reduces
production rates, thus reducing greenhouse gas emissions.
Explain how recyclables in landfills can be problematic, especially with the example of trash burning.
Explain various ways that one can recycle
Activity:
Have students complete activity 3.3 on page 145 of the Baúl de Actividades sobre Bosques Tropicales.
This activity introduces students to the concept of composting, an effective way to dispose of and reuse
food waste in a way that does not release greenhouse gases into the atmosphere (as opposed to trash
burning) (See Appendix R)
Activity:
Have students complete activity 3.4 on page 149 of the Baúl de Actividades sobre Bosques Tropicales.
This activity introduces students to the concept of reducing, reusing, and recycling materials as a method
to practice better waste management in Puerto Rico (See Appendix R)
Activity: Art activity using recycled material
Divide class into groups of 6 – 8 students
Have each group choose which material they wish to work with: paper, aluminum, or plastic

pg.
339
Lesson 6: Food
The goal for this lesson is to teach students the societal and economic impact that global warming would
have on Puerto Rico’s food industry.
Learning Objectives:
Students will be able to:
1. Identify how much of Puerto Rico’s food supply is imported and where it is imported from
2. Identify the economic, time, and environmental costs of importing food from various countries to
Puerto Rico
3. Identify ways to improve Puerto Rico’s self-sustainability through agriculture
Topics of Interest:
Introduce students to how much of Puerto Rico’s food supply is imported from other countries.
Introduce which countries import food to Puerto Rico, what they import, and what percentage of the
island’s food supply is provided by each country.
Explain to students the amount of money, time, fuel, etc. is required for these importations. Emphasize
how much fossil fuel burning has to occur to deliver them.
Explain how buying food that is locally grown significantly reduces negative human impacts on the
environment
Introduce the topic of agroforestry
Introduce the topic of urban gardening
Explain how agroforestry and urban gardening can help Puerto Rican food supply, economy, etc.
Activity: Food Monopoly
Students will pick a token to represent them. They will role a die, and move the number of spaces
that corresponds to the number they role. Throughout this game, students will encounter opportunities to
buy and sell food industries, as well as encounter various climate change choices (CCCs) and trade-off
card (TOCs). These cards have the power to move the student’s playing token to specific properties, or to
give money to or take money from a player. Climate Change Choices cards describe an effect of climate
change on a particular crop or type of industry, and require students to make economic decisions based
upon the described effect. Trade-off cards describe how the food industries are all connected, and can
affect each other.
Below is an example of a possible board design, with all necessary information and keys below
the design. The numbers presented in this design are arbitrary, and may be changed if desired.

pg.
340
TAX
BREAK
CCS F1 F2 OTC D3 OTC C1 CCC C2 GET
SUED
T3 C3
CCS CCC
T2 C4
T1 OTC
D2 D4
OTC FT1
FR4 CCC
CCC FT2
FR3 FT3
COURT FR2 CCC FR1 OTC D1 L3 L2 CCC L1 GO!
MONEY TYPES AVAILABLE:
$100,000
$500,000
$1,000,000
$2,000,000
$5,000,000
$10,000,000
$50,000,000
CCC
TOC
FOOD
MONOPOLY

pg.
341
PROPERTY KEY
Property Category
Property Name
Property Code
Property Value ($)
Product Cost ($)
Property Sale Value ($)
Legumes Beans L1 500,000 100,000 200,000
Legumes Lentils L2 700,000 300,000 400,000
Legumes Peanuts L3 1,000,000 400,000 500,000
Fruits Guava FR1 1,100,000 600,000 600,000
Fruits Breadfruit FR2 1,500,000 800,000 800,000
Fruits Coconut FR3 1,700, 000 900,000 1,000,000
Fruits Passion Fruit
FR4 2,000,000 1,100,000 1,200,000
Tubers Platano T1 5,000,000 1,500,000 1,400,000
Tubers Yuca T2 5,600,000 2,500,000 2,000,000
Tubers Yautía T3 6,300,000 2,800,000 2,500,000
Fish Red Snapper
F1 11,000,000 4,700,000 3,500,000
Fish Grouper F2 12,300,000 5,800,000 5,000,000
Coffee Café Crema
C1 15,000,000 8,700,000 6,800,000
Coffee Café Rico C2 18,000,000 9,200,000 9,000,000
Coffee Yaucono Coffee
C3 23,700,000 11,700,000 11,500,000
Coffee Alto Grande
C4 30,000,000 14,400,000 14,000,000
Forest Toro Negro
FT1 54,300,000 26,800,000 25,000,000
Forest Guanica FT2 76, 900,000 40,000,000 36,000,000
Forest El Yunque FT3 100,000,000 63,000,000 48,000,000
DOCK KEY:
Property Category
Importer Name
Property Code
Property Value
# of Docks Owned
Dock Usage Cost ($)
Dock Nicaragua D1 25,000,000 1 12,500,000 Dock Australia D2 25,000,000 2 25,000,000 Dock China D3 25,000,000 3 37,500,000 Dock USA D4 25,000,000 4 50,000,000

pg.
342
OTHER TILE KEY:
Name Meaning Name Meaning
CCC Climate Change
Card. Court
Once in court,
on must stay
for 3 turns.
TOC Trade-off Card. GO!
When passing
go, collect
$20,000,000.
Got
Sued!
Travel directly to
court. Do not collect
the money from
passing the “GO!”
tile.
Tax
Break
If you land on
this, you gain
all the tax
money paid
during the
game.

pg.
343
Appendix S: Activity Bibliography
CO2 Observation Activity:
This activity is designed to demonstrate how CO2 works as a greenhouse gas. The following link shows a
video of the activity:
https://www.youtube.com/watch?v=kwtt51gvaJQ
Materials:
Alka-Seltzer
Two empty two-liter soda bottles
Two thermometers (preferably temperature probes. Ex: LoggerPro)
Lamp
1. Begin by filling the bottles with water.
2. Place two Alka-Seltzer tablets into one bottle. Alka-Seltzer releases CO2 as it dissolves, therefore
this bottle should have CO2 sitting in it during this activity.
3. Measure the temperature of the bottles
4. Close the bottles, and let the lamp shine on the bottles. Make sure that there is equal
distribution of light onto both of these bottles. The light from the lamp should act as a heat
source and warm up the bottles of water.
5. Let the bottle sit for a while, at least 40 minutes.
6. After time passes, measure the temperatures of the two bottles. Both bottles should have
increased temperatures. Note: the bottle with the dissolved Alka-Seltzer should have a higher
temperature than the bottle with just water.
7. Explain reasoning for the temperature difference to the students. The bottles act like the Earth’s
atmosphere, allowing heat to pass through and escape in a limited matter, and the lamp acts
like the sun. The demonstration shows how CO2 traps heat and warms up the contents of the
bottle, similar to how it traps heat in our atmosphere.
pg.
344
Activity 3.3; Baúl de Actividades
Activity 3.3 on page 145 of the Baúl de Actividades sobre Bosques Tropicales
This activity is available in the Baúl de Actividades sobre Bosques Tropicales, a book of classroom
activities provided by the USFS in 1990s whose activities related to environmental awareness, forest
preservation, etc. The book was intended to be used by educators in conjunction with a chest of resources
so that they may educate their students on the book’s topics. The description below is a summary of the
activity in English. For the original activity description, see page 327.
Instructions:
1. Pass out the attached worksheet so that the students can answer the guided question.
2. Demonstrate to the students how one makes compost.
3. Explore possible uses for compost
4. Indicate that a way to follow-up with this activity is to do an experiment fertilizing a plant with
organic compost soil and comparing the plant to another that has not been fertilized.

pg.
345

pg.
346
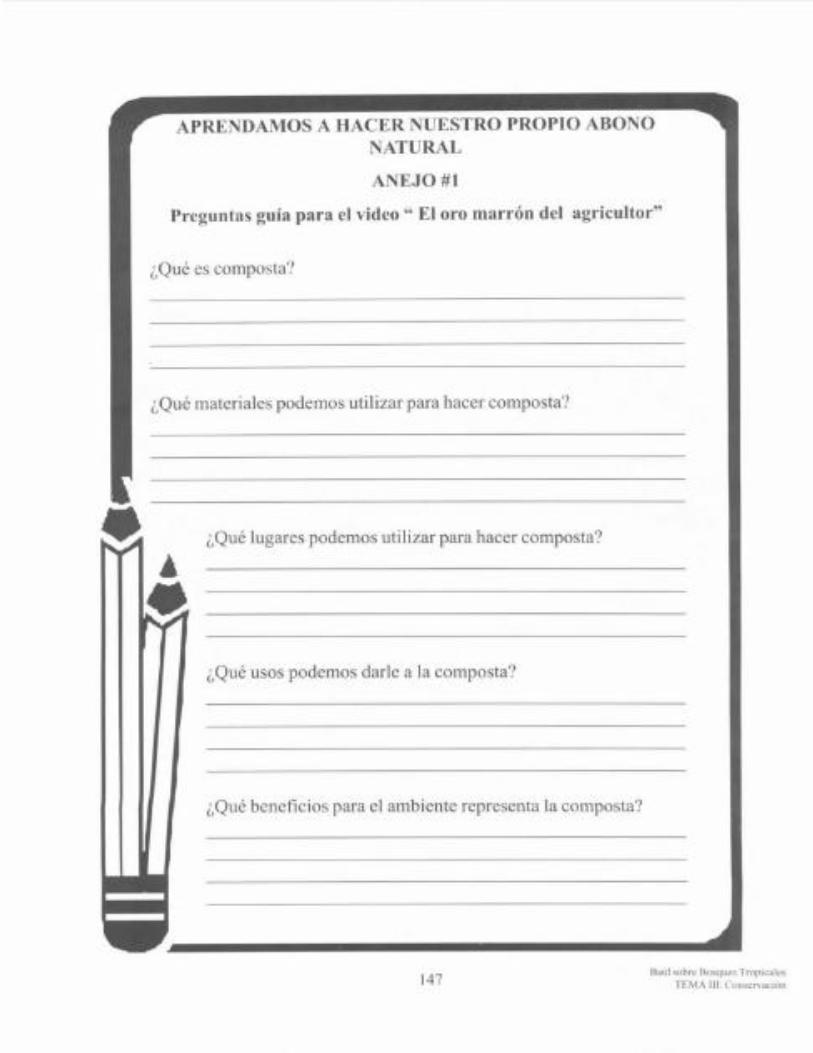
pg.
347

pg.
348

pg.
349
Activity 3.4; Baúl de Actividades
Activity 3.4 on page 149 of the Baúl de Actividades sobre Bosques Tropicales
This activity is available in the Baúl de Actividades sobre Bosques Tropicales, a book of classroom
activities provided by the USFS in 1990s whose activities related to environmental awareness, forest
preservation, etc. The book was intended to be used by educators in conjunction with a chest of resources
so that they may educate their students on the book’s topics. The description below is a summary of the
activity in English. For the original activity description, see page 332.
Preparation:
1. In the class before ask students to walk around with a plastic bag during the day and deposit all
of the waste that they generate into it. They should bring the bag to the next class. Clarify that
they should not include sanitary waste
2. Label 5 boxes:
a. 2 for trash
b. 2 for recyclables
c. 1 for solid waste
3. Prepare three stations in an adequate location
Activity Description:
1. The day of the class discuss the following questions with the students
a. How did it feel to carry the plastic bag all day?
b. Where do you think all of those materials will end up
c. Observe the materials in the bad. Do you think all of it is “trash”?
d. Discuss the concept of “trash” after presenting the background
2. Divide the class in two groups; groups A and B
3. Ask the students who placed solid waste in station C what they generated
4. Then, members of each group will stand at the back of station C in a single file. The last person
in each line will be facing station C
5. Begin a race or a fast walk. Each member of each team will go towards station C, take something
from the box and run back to the station corresponding to their team. They will deposit the
material in the box of recyclables or for trash according to what they believe to be correct. Then
they will go back to their group and give a tap on the back to the next person in line. This signal
will indicate that the next person must do the same thing (it is important that the rest of the
group hangs back to prevent them from helping to identify the materials)
6. The game ends when all of the members of one of the teams have participated
7. The winning group will be whichever one has correctly separated the most number of materials
8. Then, each student will take a material and answer the following questions:
a. Is it recyclable?
b. With what material is it made of?
c. In what way can it be recycled?

pg.
350

pg.
351

pg.
352

pg.
353

pg.
354

pg.
355
Climate Kids
This website, produced by the Earth Science Communications Team at NASA’s Jet Propulsion Laboratory
and California Institute of Technology, aims to teach children about the environment and about the
various aspects of climate change. This is done through a variety of games, activities, videos, and more.
http://climatekids.nasa.gov/
The following activities are taken from the website, and can be applied to our lessons.
Bag an old T-shirt
In this activity, students repurpose an old t-shirt into a reusable shoping bag. The shirt colar and sleeves
are cut off, and strips of fabric are removed from the sleeve cut-outs. Students use these strips to weave
the shirt shut to finish the bag.
http://climatekids.nasa.gov/tshirt-bag/
Make Sun S’mores
This activity is a fun way for students to harness and understand solar energy. Students build a solar
oven using a cardboard box, aluminum, and plastic wrap. The students then put the solar oven in direct
sunlight and use the heat from the Sun to make s’mores.
http://climatekids.nasa.gov/smores/
Do a Science Fair Project
The topics of the science fair proposed in this activity are alled related to topics of climate change. This
is a good final project to have students do at the end of a climate change unit. Students can either test a
hypothesis, answer a question, or show how nature works. The students must design their research and
create an exibit or a display to showcase their work. They must also write a short report that explains
their project.
http://climatekids.nasa.gov/science-fair/

pg.
356
Videos
ClimateKids: What is happening in the ocean?
This video, presented by NASA’s ClimateKids, describes greenhouse gasses and the effects that
anthropogenic climate change has on the world’s oceans. The video includes scientific concepts in a way
that is more likely to be understood by elementary school students as well as middle school students.
http://climatekids.nasa.gov/ocean/
Accompanying the video is information about the importance of oceans and ocean functions, coral reefs,
marine life, and ocean chemistry.
Mythbusters: The Great Ice Debate
Mythbusters SP11 – “Young Scientist Special” #4 The Great Ice Debate
This video describes the greenhouse effect through an experiment. The mythbusters set up three
transparent boxes; one filled with CO2, one filled with methane and the other set as control. They then
monitor the temperature differences between the three boxes of a period of time.
https://www.youtube.com/watch?v=pPRd5GT0v0I
The Human Impact of Climate Change: Personal Stories from Belize, Bolivia, and Brazil
The following video has people from Belize, Bolivia, and Brazil sharing personal stories about how
climate change has affected their lives. These stories focus primarily on water, which is one of the ways
in which climate change will have a negative impact on people, especially in Puerto Rico. This video can
be used to supplement Lessons 3 and 4 in Appendix Q
https://www.youtube.com/watch?v=Lv2XxXNqZa8
This video has subtitles in English and Spanish