Embed Size (px)
Citation preview

69
Int. J. Architect. Eng. Urban Plan, 29(1): 69-78, June 2019
RESEARCH PAPER
Environmental Design
Developing a Tool for Analyzing and Generating the Fittest Urban Morphology Based on the Sky View Factor and Insolation
(A Case Study on Yazd)
Sh. Roshanzamir1,*
, M. Farhadian Dehkordi2
1PhD, Department of Architecture & Urban Design, Art University of Isfahan, Isfahan, Iran 2PhD. Candidate, University of Applied Arts Vienna, Vienna, Austria
Received: November 2018, Revised: April 2019, Accepted: April 2019, Available online: June 2019
Abstract
Urban morphology, including buildings’ typology and configuration, affects sky view factor and insolation as two of the most
prominent parameters in urban microclimate, particularly in extreme environmental conditions. This research aims to generate
various rule-based urban block typologies in a parametric environment and then evaluate them based on the parameters
mentioned above to find the fittest climate responsive morphology. Grasshopper, Ecotect, and Genetic algorithms are used for
evaluation in relatively short computing time. Introducing a high-speed and user-friendly environment for designers to generate
forms and evaluate them in several iterations was the main consideration. The proposed tool consists of two parts, namely
generative algorithms to create various rule-based morphologies and analytics algorithms to find the fittest climate responsive
urban morphology based on insolation and sky view factor. As a case study, the focus is on different urban morphologies in Yazd
to find the fittest option. The maximum sky view factor and minimum insolation on building surfaces are ideal in hot and arid
climates; however, these two parameters suggest contradicting solutions for urban morphology. Considering the existing urban
fabric in Yazd, various block typologies and arrangements are parametrically generated. In each scenario, the evaluation
iterations identify the most suitable typologies and arrangements. After comparing the fittest versions of different types, the most
proper building typology, collective arrangement, and the best orientation are provided.
Keywords: Sky view factor, Insolation, Urban morphology, Building typology, Parametric design, Yazd.
1. INTRODUCTION
Due to the limitation in energy sources and problems like
Urban Heat Island (UHI), designers should consider the
enhancement of urban microclimates for inhabitants‘
comfort and reduction of energy consumption in active
and passive ways. Sky View Factor (SVF) and insolation
are two of the utmost factors that are directly linked to
urban density and configuration and influence urban
microclimate, energy production, and energy consumption
by affecting received daylight and solar access, daytime
heat gain, and night-time heat loss through radiation or
exposure to the outside environment. This article tries to
introduce a low-cost, fast, and accessible tool to generate,
evaluate, and optimize different design scenarios based on
these factors. As a case study, the proposed tool is
examined on different block configurations in Yazd, a city
located in the central part of Iran.
* Corresponding author: [email protected]
Tell: +983132200003
The SVF is a dimensionless parameter ranges from
zero to one. As defined by Oke ―It represents the fraction
of visible sky on a hemisphere centered over the analyzed
location‖ [1]. The relation between urban geometry, SVF,
and UHI is well studied [1-5]. Many types of research
consider SVF the main index of UHI [6-7], in the sense
that the higher the mean SVF, the lower the UHI
formation. However, this can lead to more exposure to
solar radiation. In this case, insolation comes to play.
Insolation is the solar radiation at the surface of the earth,
represented in units of energy/square meter [8]. This can
be a factor to evaluate daytime heat gain through radiation.
As discussed, insolation and SVF can have
contradictory effects on the optimization process of the
block‘s form, layout, and orientation. For instance, to
achieve the maximum radiative heat transfer to the sky,
maximum openness and SVF are needed, which means an
increase in daytime insolation and heat gain. Most of the
related studies on SVF have failed to consider this
contradiction [9-11], and few studies have merely pointed
to this issue without directly including it in their analyses
[6, 12-13].

Sh. Roshanzamir et al.
70
The present study is divided into two parts. The First
part is devoted to the introduction of the proposed tool that
provides the designer with the possibility to parametrically
generate different block configurations and analyze their
suitability based on average SVF and insolation values.
Then, using an evolutionary process based on the designer
setup, the program would suggest the optimum block
typology, proportion, openness, and arrangement in an
urban grid. In the second part, the program is used to
analyze common configurations in the existing urban
texture of Yazd and consequently suggest an optimized
version of each configuration. As the focus of the
proposed tool is on insolation and SVF calculation, it was
decided to study Yazd as a city with a high level of solar
radiation and clear sky (i.e., better effect of SVF on night
radiative cooling) with overall demand for cooling. It is
worth mentioning that although factors such as ventilation
and surface area to volume ratio are also important factors
in urban microclimate, for the sake of simplicity, they
were excluded from the optimization process.
2. AN EVOLUTIONARY MODEL FOR URBAN
MORPHOLOGY OPTIMIZATION BASED ON
SVF AND INSOLATION
The main goal of this research was developing a tool to
achieve the optimized urban blocks configuration and
layout based on SVF and insolation through an
evolutionary process in Yazd. Evolutionary algorithms, as
a class of heuristic techniques, were developed in the 60s
for the optimization problems [14]. In this study,
Grasshopper Galapagos, which is a plug-in for Rhino, was
chosen as the evolutionary algorithm.
To set the process, the first step is to parametrically
define the shape grammar for desired blocks and their
arrangements. Therefore, the program would generate a
vast range of geometrical configurations based on different
combinations of parameters. A certain number of
generated 3D models would be randomly selected as the
first step. Then, after the analysis process, the models with
higher SVF and lower insolation would be selected for the
next step. Then, the selected models again compete with
the newly generated ones to achieve the fittest model.
Many types of research have recently used generative
and evolutionary models to find energy optimization-
driven design. The studies with greater similarity with this
project have mostly focused on either solar access [14-21],
or SVF [6-7], [22-23] or failed to consider them as
contradictory factors [10] in search of more solar access.
Some studies have investigated the effect of block shapes
on both indoor condition and energy demand [10, 24-26].
Also, most of the works have presented very simple and
reductionist building typologies and forms limited to
simple extrusions or just street canyons and in-between
spaces, [7, 14, 20, 24, 27-29].
The most challenging part is to come up with an
analysis method that would be fast and potent enough to
work with parametric 3D models. To this end, Ecotect and
Geco plug-in for Grasshopper were used to calculate
insolation. For SVF, a Grasshopper definition was set in
line with the project purpose. In general, Grasshopper and
its plug-ins are widely-used and proper tools for both
generative- and evolutionary-based designs [7, 10, 15, 19,
21, 23, 27, 29].
The most common methods to calculate SVF include
mathematical models, fisheye-lens photographs analysis,
image processing, diagrams, and graphical determination
[30]. The focus of these models is on the existing urban
masses; therefore, they fail to be appropriate for the
analysis of design scenarios. Also, the calculations
conducted using these methods are not straightforward and
are usually costly and time-consuming [31]. In this
research, the focus is mainly on computer programs.
Generally, there are two main software approaches, viz.
vector and raster. In the raster-based method, a digital
elevation model (DEM) database is often employed. In
these models, each pixel representing building height can
be displayed in the shade of grey as a digital image like the
model developed by Ratti and Richens [32]. In this model,
a ‗shadow casting‘ algorithm calculates building shadow
patterns based on high-resolution DEM. This algorithm
that has been validated by Lindberg [33] to generate
satisfactory results is further modified to calculate SVF.
The accuracy of the method depends on the resolution of
the raster database [34]. The problem with using DEM is
that only the visible parts from above are considered in the
analysis, and the shapes and voids in the section are
ignored Fig. 1. Although this model is useful for the
evaluation of very large-scale urban textures, it fails to be
efficient for studying urban configurations, block
typology, and their arrangement in smaller scales [30]. In
the vector method, buildings are typically simplified to
flat-roofed blocks. To calculate SVF, a hemispheric
radiating environment is defined and divided into equal
slices by a rotation angle. Then, the tool searches for a
single building with the largest elevation angle along a
particular rotation angle. The sky segment obstructed by
this building is considered a slice of the basin. Then, SVF
can be calculated by summing up the view factors of all
the basin slices for all directions [35]. The accuracy of this
method depends on the rotation angle and the searching
radius, in the sense that a smaller rotation angle and larger
radius result in a more accurate SVF estimation [34].
Fig. 1 A view of the section configuration ignored in the DEM
(in this example, the red part would not be considered in SVF,
resulting in lower values for SVF and insolation)
Most models are based on representations of buildings
[31] or digital elevation models (DEM) [36], allowing only
for simple-shaped building and flat roofs except a few

Int. J. Architect. Eng. Urban Plan, 29(1): 69-78, June 2019
71
models which are allowing for modeling non-flat roofs [37].
To date, different tools have been developed for SVF
calculation in Grasshopper environment [38-40]. However, to
evaluate different geometries from simple cubic to more
curved and complex ones in a relatively short time, as
explained further in the essay, the idea of obstacles and the
hemispheric radiating environment was applied in this study.
There were also other challenges required to be
overcome to this end. Firstly, it was needed to develop an
algorithm to enable the generation of different 3D model
configurations, and secondly, a proper analysis grid
matching with the ever-changing models had to be prepared.
2.1. Parametric 3D model setup
In this study, two different setups were employed to
generate block typology and create different arrangements.
Value assignment to each parameter was conducted using
three methods. For (n) instances of the same parameter, the
assigned value can be: a) Constant for all components
(fixed or variable), b) Different for each instance (one-to-
one correspondence), or c) Different based on the zone
where the instance is located. The values will be assigned
to the fixed zones with the definable resolution, and the
instances will get the value from the related zone Fig. 2.
Fig. 2 Different ways of assigning values to parameters
The first diagram in Fig. 3 shows how different block
typologies can be generated. Values for overall Floor Area
Ratio (FAR), land area, and the number of lots in the Y
direction are fixed while the other values can be either fixed
or variable. As the number of lots in the X direction is
variable, values for voids type, proportion, or the number of
levels fail to be directly assigned hence the values were
firstly assigned to zones, and then, the lots will be
subsequently assigned accordingly. Based on the designer
scenario and genotype setup, different phenotypes can
emerge. In the next step, different arrangements of a certain
block are generated in a parametric process Fig. 3.
Fig. 3 Parametric setup to generate different blocks and their arrangement in the grid
Developing a tool for analysing and generating the fittest urban morphology based on sky view factor and insolation
72
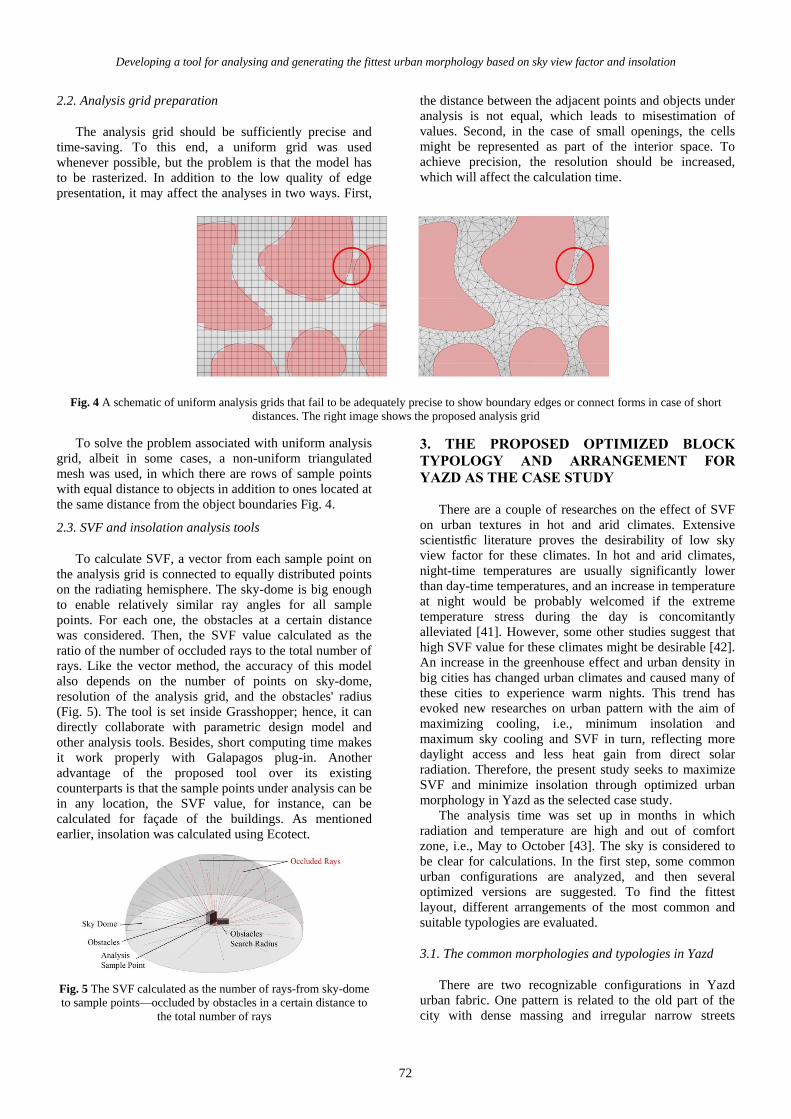
2.2. Analysis grid preparation
The analysis grid should be sufficiently precise and
time-saving. To this end, a uniform grid was used
whenever possible, but the problem is that the model has
to be rasterized. In addition to the low quality of edge
presentation, it may affect the analyses in two ways. First,
the distance between the adjacent points and objects under
analysis is not equal, which leads to misestimation of
values. Second, in the case of small openings, the cells
might be represented as part of the interior space. To
achieve precision, the resolution should be increased,
which will affect the calculation time.
Fig. 4 A schematic of uniform analysis grids that fail to be adequately precise to show boundary edges or connect forms in case of short
distances. The right image shows the proposed analysis grid
To solve the problem associated with uniform analysis
grid, albeit in some cases, a non-uniform triangulated
mesh was used, in which there are rows of sample points
with equal distance to objects in addition to ones located at
the same distance from the object boundaries Fig. 4.
2.3. SVF and insolation analysis tools
To calculate SVF, a vector from each sample point on
the analysis grid is connected to equally distributed points
on the radiating hemisphere. The sky-dome is big enough
to enable relatively similar ray angles for all sample
points. For each one, the obstacles at a certain distance
was considered. Then, the SVF value calculated as the
ratio of the number of occluded rays to the total number of
rays. Like the vector method, the accuracy of this model
also depends on the number of points on sky-dome,
resolution of the analysis grid, and the obstacles' radius
(Fig. 5). The tool is set inside Grasshopper; hence, it can
directly collaborate with parametric design model and
other analysis tools. Besides, short computing time makes
it work properly with Galapagos plug-in. Another
advantage of the proposed tool over its existing
counterparts is that the sample points under analysis can be
in any location, the SVF value, for instance, can be
calculated for façade of the buildings. As mentioned
earlier, insolation was calculated using Ecotect.
Fig. 5 The SVF calculated as the number of rays-from sky-dome
to sample points—occluded by obstacles in a certain distance to
the total number of rays
3. THE PROPOSED OPTIMIZED BLOCK
TYPOLOGY AND ARRANGEMENT FOR
YAZD AS THE CASE STUDY
There are a couple of researches on the effect of SVF
on urban textures in hot and arid climates. Extensive
scientistfic literature proves the desirability of low sky
view factor for these climates. In hot and arid climates,
night-time temperatures are usually significantly lower
than day-time temperatures, and an increase in temperature
at night would be probably welcomed if the extreme
temperature stress during the day is concomitantly
alleviated [41]. However, some other studies suggest that
high SVF value for these climates might be desirable [42].
An increase in the greenhouse effect and urban density in
big cities has changed urban climates and caused many of
these cities to experience warm nights. This trend has
evoked new researches on urban pattern with the aim of
maximizing cooling, i.e., minimum insolation and
maximum sky cooling and SVF in turn, reflecting more
daylight access and less heat gain from direct solar
radiation. Therefore, the present study seeks to maximize
SVF and minimize insolation through optimized urban
morphology in Yazd as the selected case study.
The analysis time was set up in months in which
radiation and temperature are high and out of comfort
zone, i.e., May to October [43]. The sky is considered to
be clear for calculations. In the first step, some common
urban configurations are analyzed, and then several
optimized versions are suggested. To find the fittest
layout, different arrangements of the most common and
suitable typologies are evaluated.
3.1. The common morphologies and typologies in Yazd
There are two recognizable configurations in Yazd
urban fabric. One pattern is related to the old part of the
city with dense massing and irregular narrow streets

Sh. Roshanzamir et al.
73
covered with vaults. In this section of the city, the
buildings are mainly one-story courtyard types with high
ceilings. Another pattern is the newly developed areas with
a uniform grid, relatively wide streets, and rows of
attached two- to seven-story buildings. In both patterns,
the overall orientation is 45° to -45° to the south. Fig. 6
shows the analyses of these configurations.
Fig. 6 The most common urban patterns in Yazd from older to more recent. (a) Google earth view, (b) Insolation analysis, (c) SVF analysis
The bars in Fig. 6 represent the average insolation and
SVF values for each sample point and their percent values.
Average insolation values for the selected points are
remapped to a domain from zero to one and then

Int. J. Architect. Eng. Urban Plan, 29(1): 69-78, June 2019
74
subtracted from the average SVF values to recognize
which configuration, on average, has the maximum SVF
and minimum insolation values. In this regard, the higher
values mean better function. As illustrated, the estimated
values have a less correlation with the density or height
and mostly depend on the configuration of elements.
Orientation in all models is 30° to the south. As shown,
courtyard typologies and proposed layout of blocks
(models 2, 5, and 1, respectively) have better performance
than the row layouts (models 3 and 4, respectively) which
are more common in new developments.
The next part presents the parametric model of the
most common block types and their evaluations. The most
widely used blocks are those with double rows of housing
repeated in urban grid, which are common in both
traditional and recent developments of the city.
3.2. Generation, evaluation, and comparison of the
optimized block typologies
The first model is a block with modular units. In all
analyses, the neighbors' condition is set to be the same as
the block; it should be notified that the respective
condition was considered in evaluations but fails to be
represented in figures. As mentioned earlier, the FAR and
area values are fixed in all models. In this model, all the
other parameters are variable; however, they are the same
for the lots. The evaluation suggests that a block with 30°
orientation to south and rows of buildings with yards in
north direction is the best pattern to achieve the maximum
SVF and minimum insolation. In all figures, the table
shows the parametric set up of blocks, the upper images
illustrate SVF and insolation analysis, and the lower
images indicate which parts of the model are flexible.
Fig. 7 The layout of the best configuration related to row buildings with yards positioned in northern side in a modular setup with variable
parameters
As courtyard types are associated with hot and arid
climates [41], the next part of the study merely focuses on
the position and proportion of the yard in modular lots and
the overall orientation of the block. Each lot is divided into
nine points, in such a way that the yard is located either in
the center of the area or in the middle or corner of the
edges. The yard area is 30% of the lot area, but its
proportion is variable. As illustrated in Fig. 8, the
optimized configuration is related to the block oriented 30°
to the south with detached parallel buildings and yards on
the western site. In the next step, a block configuration
with maximum possible flexibility is studied.

Developing a tool for analysing and generating the fittest urban morphology based on sky view factor and insolation
75
Fig. 8 A layout of the best configuration related to the blocks with detached parallel buildings with yards on the western site in a modular
setup with yard position, yard proportion, and block orientation set as variable parameters
Fig. 9 The model with maximum flexibility that shows the best performance
The optimum configuration in a model with high
flexibility resembles the old texture of the city (Fig. 9).
The variations in yards and heights helped the model to
achieve better results. However, some of the proportions,
such as courtyard dimensions, may fail to be suitable for
new developments.
In summary, for all the studied models, the best
orientation is 30° to the south. In general, different results
can be obtained depending on the flexibility of models and
the values of the fixed parameters. Even though in this
research, the model with a high level of flexibility shows the
best performance, more investigations are needed to identify
the fittest configuration in Yazd. In this case study, the
average value of SVF is higher than that of insolation. Also,
each factor has a better value in comparison with other
models. For arrangement studies, the first model with

Int. J. Architect. Eng. Urban Plan, 29(1): 69-78, June 2019
76
modular buildings was used due to its better results
compared with the second model; also, its proportions and
modularity are suitable for new developments.
3.3. Analysis of the most optimum arrangement of blocks
in urban grid
In this part, the same modular blocks are set inside a
grid, with the possibility to change their both orientation and
layout. The grid cell size is the result of the desired distance
between blocks and their orientation in relation to the grid
plane. The shifting parameter works in either the X or Y
direction to make the staggered patterns possible Fig. 10.
Fig. 10 The tables on the left show the parameters and their values, the upper images illustrate insolation and SVF values for the middle
block in the optimum arrangement, and the lower images show the parametric flexibility and the optimized arrangement
In both studies, blocks and the grid oriented 40° and 0°
to the south, respectively, with a staggered layout to
maximize shading. Shifting in the X direction has a better
cooling effect because of a higher SVF value. However,
with respect to the daytime heat gain reduction, the first
model shows lower values for insolation, and it can be
considered a better layout according to the final results
4. CONCLUSION
The tool presented in this study using generative and
evolutionary models based on SVF and insolation analyses
can be a helpful program for designers to evaluate
different urban configuration scenarios and find the most
suitable solutions. The optimum block configuration can
improve outdoor climate condition by providing shadow
and effective night-time radiative cooling. This, in turn,
affects the indoor environment and energy use of
buildings. However, other parameters, including
ventilation and ratio of surface to volume, should also be
considered to come up with a desirable solution. The
proposed tool has the potential to be further developed to
work with other analysis tools. It is noteworthy to mention
that the aim of this study was not to simulate the real
situation, but rather to find a decision-making support tool
for a climate-responsive design.
The present study sought to find the optimum block
typologies and arrangements in Yazd. These can vary
based on different constant and variable setups. However,
analyses suggest that 30° to 40° orientation to the south
seem to be desirable in all cases. The block model with
maximum flexibility in height and courtyard
configurations showed the best results in comparison with
the modular ones. In arrangement studies, the grids tend to
orient toward the south. Shifting grid rows in the X or Y
direction had a similar effect on the final values. In both
models, the staggered layout was proved as the fittest
solution. Shifting in the X direction provided higher values
of SVF, which makes it suitable for better night cooling
effect. However, shifting in the Y direction was more
effective on insolation and more helpful for controlling
heat gain through the daytime. Notably, the claim to find

Int. J. Architect. Eng. Urban Plan, 29(1): 69-78, June 2019
77
the most efficient urban patterns needs further studies on
configurations and arrangements with different variable
setups. In this regard, the use of the generative
evolutionary model in Grasshopper environment proved to
be very useful and fast in calculating the results.
This study reveals the importance of coupling SVF with
insolation in the evaluation of climatic behavior of various
urban morphologies. Accordingly, the results of the
researches with a specific focus on each of the factors
should be carefully employed in real design cases, having in
mind other influential parameters that can affect the overall
fitness. In addition, the possibility of having different
building typologies and multi-scale nature of the proposed
tool makes it more applicable for real design tasks.
CONFLICT OF INTEREST
The authors declare that there are no conflicts of
interest regarding the publication of this manuscript.
REFERENCES
[1] Oke TR. Canyon geometry and the nocturnal urban heat island:
Comparison of scale model and field observation, International
Journal of Climatology, 1981, Vol. 1, pp. 237-54.
[2] Johnson GT, Watson ID. The determination of view -factors
in urban canyons, Journal of Climate and Applied
Meteorology, 1984, Vol. 23, pp. 329-35.
[3] Bärring l, Mattsson JO, Lindqvist S. Canyon geometry, street
temperatures and urban heat is land in Malmö, Journal of
Climatology, 1985, Vol. 5, pp. 433-44.
[4] Ratti C, Richens P. Urban texture analysis with image
processing techniques. In: G. Augenbroe, Ch. Eastman (ed.),
Proceedings of the CAAD Futures 99 Conference, Kluwer
Academic Publishers, Atlanta, GE, 1999, pp. 49-64.
[5] Chapman L, Thornes JE, Bradley AV. Rapid determination
of canyon geometry parameters for use in surface radiation
budgets, Theoretical and Applied Climatology, 2001, Vol.
69, pp. 81-90.
[6] Hua Y, Whiteb M, Dinga W. An urban form experiment on
urban heat island effect in high density area, Procedia
Engineering, 2016, Vol. 169, pp. 166-174.
[7] Sakar B. Parametric modelling for the mitigation of urban
heat island effect: A model proposal, Middle East Techical
University, Ankara, 2018.
[8] Nelson V. Introduction to renewable energy, Taylor &
Francis, New York, USA, 2011.
[9] Masoud B, Coch RH, Crespo CI, Beckers B. Effects of urban
morphology on shading for Pedestrians Sky view factor
(SVF) as an indicator of solar access. In: E. Ng, S. Fong, C.
Ren (ed.), Proceedings of the 34th International Conference
on Passive and Low Energy Architecture, PLEA, Hong
Kong, China, 2019, pp. 1029-1031.
[10] Chang S, Saha N, Castro-Lacouture D, Yang P. Generative
design and performance modeling for relationships between
urban built forms, sky opening, solar radiation and energy,
Energy Procedia, 2018, Vol. 158, pp. 22-25.
[11] Lópeza CS, Salab M, Tagliabuec LCh, Frontinia F, Bouziria
S. Solar radiation and daylighting assessment using the sky-
view factor (SVF) analysis as method to evaluate urban
planning densification policies impacts, Energy Procedia,
2016, Vol. 91, pp. 989-996.
[12] Ratti C, Raydan D, Steemers K. Building form and
environmental performance: Archetypes, analysis and an arid
climate, Energy and Buildings, 2003, Vol. 35, pp. 49–59.
[13] Choi Y, Lee S, Moon H. Urban physical environments and
the duration of high air temperature: focusing on solar
radiation trapping effects, Sustainability, 2018, Vol. 10, No.
12, pp. 4837. https://doi.org/10.3390/su10124837.
[14] Vermeulen T, Knopf-Lenoir C, Villon P, Beckers B. Urban
layout optimization framework to maximize direct solar
Irradiation, Computers, Environment and Urban Systems,
2015, Vol. 51, pp. 1-12.
[15] Peronato G, Nault E, Cappelletti F, Peron F, Andersen M. A
parametric design-based methodology to visualize building
performance at the neighborhood scale. In: M. Baratieri, V.
Corrado, A. Gasparella and F. Patuzzi (ed.), Proceedings of
Building Simulation Applications, University Press, Bolzano,
Italy, 2015, pp. 351-358.
[16] Grifoni RC, D‘Onofrio R, Sargolini M, Pierantozzi M. A
Parametric Optimization approach to mitigating the urban
heat Island effect: A case study in ancona, sustainability,
2016, Vol. 8, No. 9, pp. 896.
[17] Taleb H, Musleh MA. Applying urban parametric design
optimisation processes to a hot climate: Case study of the UAE,
Sustainable Cities and Society, 2015, Vol. 14, pp. 236-253.
[18] Chen KW, Janssen P, Norford L. Automatic parameterization
of semantic 3D city models for urban design optimization, In:
G. Çagdas, M. Özkar, L.F. Gül, E. Gürer (eds.), Computer-
Aided Architectural Design Futures: Future Trajectories,
Springer, Istanbul, Turkey, 2017, pp. 51-65.
[19] Eltaweel A, SU Y. Parametric design and daylighting: A
literature review, Renewable and Sustainable Energy
Reviews, 2017, Vol. 73, pp. 1086-1103.
[20] Lobaccaroa G, Frontinib F. Solar energy in urban
environment: how urban densification affects existing
buildings, Energy Procedia, 2014, Vol. 48, pp. 1559-1569.
[21] Amadoa M, Poggib F. Solar urban planning: a parametric
approach, Energy Procedia, 2014, Vol. 48, pp. 1539-1548.
[22] Wei R, Song D, Wong NH, Martin M. Impact of urban
morphology parameters on microclimate, Procedia
Engineering, 2016, Vol. 169, pp. 142-149.
[23] Chokhachian A, Perini K, Giulini S, Auer T. Mathematical
generative approach on performance based urban form
design. in: m. burlando, M. Canepa, A. Magliocco, K. Perini
and M.P. Repetto (ed.), Proceeding of International
Conference on Urban Comfort and Environmental Quality,
Genova University Press, Genoa, Italy, 2017, pp. 30-35.
[24] Nagy D, Villaggi L, Benjamin D. Generative urban design:
integrating financial and energy goals for automated
neighborhood layout, In: T. Rakha, M. Turrin, D. Macumber,
F. Meggers and S. Rockcastle (eds.), Proceedings of the
Symposium for Architecture and Urban Design Design,
Delft, the Netherlands, 2018, pp. 265-274.
[25] Rodriguesa E, Amarala AR, Gaspara AR, Gomesb Á. An
approach to urban quarter design using building generative
design and thermal performance optimization, Energy
Procedia, 2015, Vol. 78, pp. 2899-2904.
[26] Rodriguesa E, Soaresa N, Fernandesa MS, Gaspar AR,
Gomes A, Costa JJ. An integrated energy performance-driven
generative design methodology to foster modular lightweight
steel framed dwellings in hot climates, Energy for
Sustainable Development, Vol. 44, pp. 21-36.
[27] Vasanthakumar S. A Computational design system for
environmentally responsive urban design, University of
Waterloo thesis, Waterloo, Ontario, Canada, 2015.
[28] Shi Z, Fonseca JA, Schlueter A. A review of simulation-
based urban form generation and optimization for energy-
driven urban design, Building and Environment, 2017, Vol.
121, pp. 119-129.
[29] Bassolino E, Ambrosini L. Parametric environmental climate

Int. J. Architect. Eng. Urban Plan, 29(1): 69-78, June 2019
78
adaptive design: the role of data design to control urban
regeneration project of borgo antignano, Naples, Procedia –
Social and Behavioral Sciences, 2015, Vol. 216, pp. 948-959.
[30] White M, Hu Y, Langenheim N, Ding W, Burry M. Cool city
design: Integrating real-time urban canyon assessment into
the design process for chinese and australian cities, Urban
Planning, 2016, Vol. 1, No. 3, pp. 25-37.
[31] Souza LCL, Rodrigues DS, Mendes JFG. A 3D GIS
extension for sky view factors assessment in urban
environment, In: Proceedings of the 8th International
Conference on Computers in Urban Planning and Urban
Management, Centre for northeast Asian studies, Tohoku,
Japan, pp. 27-9, 2003.
[32] Ratti C, Richens P. Raster analysis of urban form,
Environment and Planning B: Planning and Design, 2004,
Vol. 31, pp. 297-309.
[33] Lindberg F. Towards the use of local governmental 3-D data
within urban climatology studies, Mapping Image Science,
2005, Vol. 2, pp. 32-7.
[34] Chen L, Ng E, An X, Ren C, Lee M, Wang U, He Z. Sky
view factor analysis of street canyons and its implications for
daytime intra-urban air temperature differentials in high-rise,
high-density urban areas of Hong Kong: a GIS-based
simulation approach, International Journal of Climatology,
2012, Vol. 32, pp. 121-36.
[35] Gal T., Lindberg F, Unger J. Computing continuous sky view
factors using 3D urban raster and vector databases:
comparison and application to urban climate, Theoretical and
Applied Climatology, 2009, Vol. 95, pp. 111-23.
[36] Gal T, Rzepa M, Gromek B, Unger J. Comparison between
sky view factor values computed by two different methods in
an urban environment, ACTA Climatologica Et Chorologica,
2007, Vol. 40, pp. 17-26.
[37] Matzarakis A, Rutz F, Mayer H. Modeling radiation fluxes in
simple and complex environments-application of the Rayman
model, International Journal of Biometeorology, 2007, Vol.
1, pp. 323-34.
[38] Jie W, Zhang Y, Meng Q. Calculation method of sky view
factor based on rhino grasshopper platform, In: E. Wurtz
(ed.), Proceedings of the 13th Conference of the International
Building Performance Simulation Association, Miller-
Thompson, Chambéry, France, 2013, pp. 2658-2666.
[39] Jiang Z, You W, Ding W. Calculation of ground view factor
as an index for urban thermal environment optimization,
Energy Procedia, 2017, Vol. 142, pp. 2996-3001.
[40] Al-Sudani A, Hussein H, Sharples S. Sky view factor
calculation a computational-geometrical approach. In: A.
Fioravanti, S. Cursi, S. Elahmar, S. Gargaro, G. Loffreda, G.
Novembri and A. Trento (eds.), Proceedings of the 35th
eCAADe Conference, Sapienza University of Rome, Rome,
Italy, 2017, Vol. 1, pp.673-682.
[41] Ratti C, Raydan D, Steemers K. Building form and
environmental performance: archetypes, analysis and an arid
climate, Energy and Buildings, 2003, Vol. 35, pp. 49–59.
[42] Di Sabatino S, Hedquist BC, Carter W, Leo LS, Fernando
HJS. Phoenix urban heat island experiment: effects of built
elements, In: Proceedings of the Eighth Symposium on the
Urban Enviroment, Phoenix, Arizona, 2009.
[43] Yazd weather data, Available at: <http://apps1.eere.energy.gov/buildings/energyplus/weatherd
ata.cfm> [Accessed 12 May 2013].
COPYRIGHTS
Copyright for this article is retained by the author(s), with publication rights granted to the journal.
This is an open-access article distributed under the terms and conditions of the Creative Commons Attribution License
(http://creativecommons.org/licenses/by/4.0/).
HOW TO CITE THIS ARTICLE
Roshanzamir, Sh., Farhadian Dehkordi, M., (2018). Developing a tool for analyzing and
generating the fittest urban morphology based on the sky view factor and insolation (A case
study on Yazd). Int. J. Architect. Eng. Urban Plan, 29(1): 69-78, June 2019.
URL: http://ijaup.iust.ac.ir/article-1-207-en.html
AUTHOR (S) BIOSKETCHES
Roshanzamir, Sh., PhD, Department of Architecture & Urban Design, Art University of Isfahan, Isfahan, Iran
Email: [email protected]
Farhadian Dehkordi, M., PhD. Candidate, University of Applied Arts Vienna, Vienna, Austria
Email: [email protected]