Embed Size (px)
Citation preview

Baraton Interdisciplinary Research Journal (2017), 7(Special Issue), pp 1-14
DEVELOPING A SCHOOL CLIMATE MODEL FOR EFFECTIVE PUBLIC SECONDARY SCHOOLS: EVIDENCE FROM NANDI COUNTY, KENYA
Ernest YegohKisii University-Kericho Campus, P. O. Box 269-20100, Kericho, Kenya
Email address: [email protected]
This study intended to develop a school climate model for effective public secondary schools. The study was undertaken in Nandi County in Kenya. The research question that guided the study was; What is the school cli-mate of effective secondary schools in Nandi County in terms of the following dimensions: physical, academic and social dimension? The researcher used questionnaires and in depth interviews with the principals, students’ focus groups and members of the school management boards in six public secondary schools of comparable academic performance. Purposive sampling techniques were employed to select the schools and respondents for the study. Data was analyzed using statistical package for social sciences (SPSS) software. Thematic and triangulation techniques were also employed to analyze qualitative data. The main finding of the study was that effective secondary schools have an enduring favorable school climate conducive for learning.
Keywords: School climate, physical and academic performance
Introduction
Schools portray a lot of differences in terms of the feel, atmosphere or ideology, students’ behavior and academic performance among other aspects (Ye-goh, 2011). The net effect of these differences creates what scholars have defined as the ‘ethos’ or climate of the school. National School Climate Council (2007) define school climate as the patterns of people’s ex-periences of school life which reflects norms, goals, values, interpersonal relationships, teaching and learn-ing practices and organizational structures. Cohen, McCabe, Michelli, and Pickeral (2009) contend that school climate is more than individual experience: It is a group phenomenon that is larger than any one person’s experience. When these internal qualities of a school yield high performance among the students in National examinations, the school can be described as effective and of high quality (Yegoh, 2011). A positive or quality school climate is associated with a robust and encouraging outcomes such as better staff morale (Bryk & Driscoll, 1988) and greater student academic achievement (Shindler, Jones, Williams, Taylor, & Cardenas, 2009), while a poor or toxic school climate is associated with higher cases of absenteeism (Reid, 1983), suspension rates (Wu, Pink, Crain, & Moles, 1982) and school dropout rates (Anderson, 1982). Ding, Liu, and Berkowitz (2011) contend that the school climate affects the quality of school life. The ever-growing body of research on school climate continuously attests to its importance in a
variety of overlapping ways, including social, emo-tional, intellectual, physical and safety; positive youth development, mental health, and healthy relation-ships; higher graduation rates; school connectedness, engagement; academic achievement; teacher retention and effective school reform (Thapa, Cohen, Ales-sandro, & Guffey, 2013). School climate research is gaining momentum in Africa (Kgaile & Morrison, 2006) and particularly Kenya (Makewa, Yegoh, Role, & Role, 2011). A few secondary schools in Kenya have however, made deliberate and systematic approaches to promoting or maintaining the quality of their schools albeit ignorant of the constructs that define and shape these school climates. Those secondary schools with a positive school climate have over the past years recorded high academic performance and have high transition rates to tertiary education, while those with negative and repulsive school climates have consistently posted poor academic results despite their national status. A thorough and thoughtful study of the constructs that shape school climate was the main motivation of developing a model that will inform teachers and other stakeholders on the best practices in an attempt to spur higher academic achievement of secondary school students not only in Kenya but Africa and the world at large.
Methodology
Research Design
1

Baraton Interdisciplinary Research Journal (2017), 7(Special Issue), pp 1-14
Mixed methods research design was employed in this research where both quantitative and qualitative data collection techniques were used. Creswell (2012) defines mixed methods research design as a procedure for collecting, analyzing, and “mixing” both quantita-tive and qualitative research and methods in a single study to understand a research problem. Concurrent mixed research design was specifically used in this study where the researcher combined both quantita-tive and qualitative data in order to provide a compre-hensive analysis of the research problem. Information from both methods was integrated during the overall results. Qualitative research techniques were used more than quantitative methods. Qualitative research design aims to investigate a question without attempt-ing to quantifiably measure variables or look to poten-tial relationships between variables (Kara, 2012). He contends that qualitative research technique involves asking a broad question and collecting data in form of words, images and videos then searching for themes. This is also referred to as thematic analysis. Braun and Clarke (2006) define thematic analysis as a method of identifying, analyzing and reporting patterns (themes) within data. Data collected was analyzed and findings integrated and conclusions drawn using both quanti-tative and qualitative research designs. Quantitative techniques that involved the use of descriptive statis-tics were used to analyze the demographic profile of respondents and mean ratings of the physical, academ-ic and social dimensions of the school climate on both the students’ and the teachers’ questionnaires.
Validity and Reliability of Research Instruments
The research instruments that were used in the study were two questionnaires; one designed for students and the other for teachers. This was comple-mented by three interview schedules; one designed for the principals, the other two for the members of the school board of management and the students’ focus group respectively. Thirty questionnaires were distributed randomly to students in one class of form three and four. Twenty questionnaires were given to the teachers in each of the six secondary schools in Nandi County sampled for the study. The researcher modified the original instrument that Halpin and Croft (1963) constructed; the Organizational Climate Descriptive Questionnaire (OCDQ). The questionnaire comprised of four sections. Section A, dealt with the respondents’ demographic profile; section B, the physical dimension; section C; the academic dimension and section D; the so-cial dimension of the school climate. Halpin’s and Croft’s (1963) pioneering work concentrated mainly on the principal behaviour, but in this study the scope was broadened to include the physical, social and academic dimension of the school climate. Both the students’ and teachers’ questionnaires contained 49 items. A pilot study was conducted in two secondary schools comparable to those in the actual study in the neighboring Uasin Gishu County to test for reliability of the research instruments. The reliability coeffi-cients obtained are illustrated below:
Table 1
Reliability Coefficients
Cronbach’s Alpha No of items Physical
Dimension .717 14
Students Academic Dimension
.831 20
Social Dimension .869 15 Physical
Dimension .809 17
Teachers Academic Dimension
.872 20
Social Dimension .893 12
2

Baraton Interdisciplinary Research Journal (2017), 7(Special Issue), pp 1-14
In all the dimensions under study, the average Cron-bach Alpha coefficient was .800, and indication of high reliability.
Results and Discussion
This study was guided by the research ques-tion; what is the school climate of effective second-ary schools in Nandi County in terms of the physical, academic and social dimensions? The following scale of interpretation was used by the researcher for gathering quantitative data: 3.50 - 4.00 agree/high rating; 2.50 - 3.49 tend to agree/average rating; 1.50 - 2.49 tend to disagree/low rating; 1.00 - 1.49 disagree/very low rating
Students’ Perception of the Physical Dimension
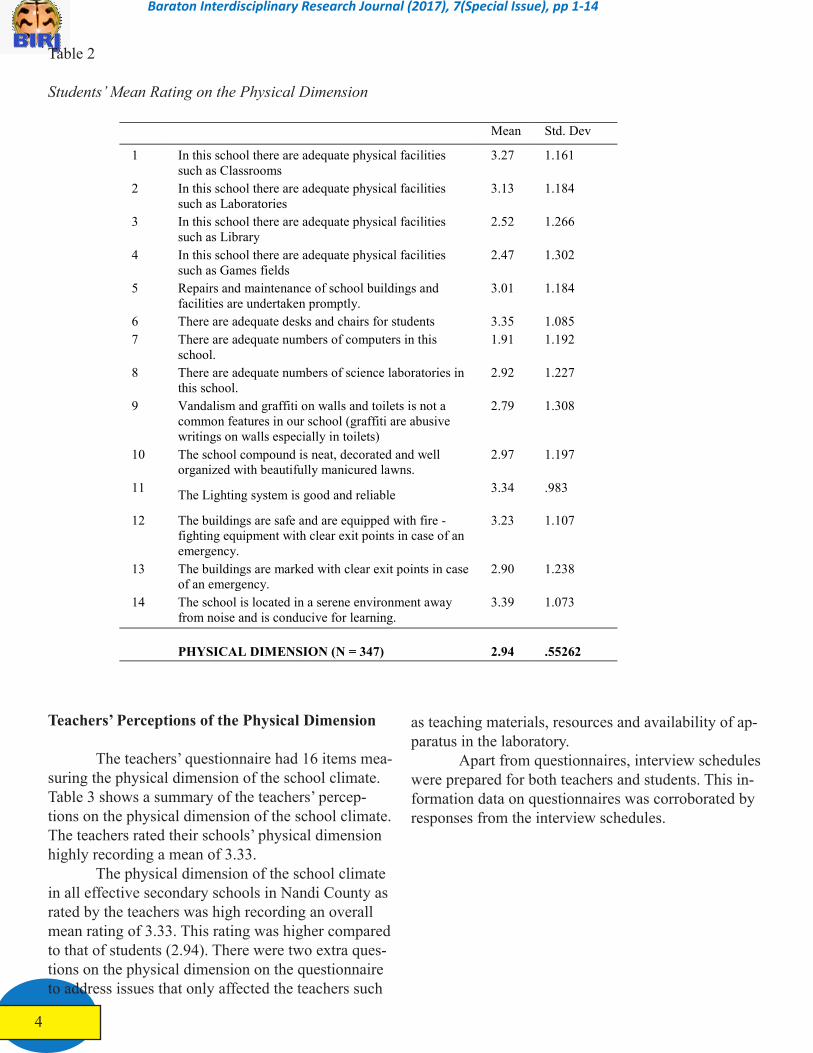
There were 14 items on the students’ question-naire that addressed the aspect of the schools’ physical dimension. Students responded to each item on the scale by putting a check (√) on any one of the follow-ing responses; agree (high rating), tend to agree (aver-age rating, tend to disagree (low rating), disagree (very
low rating). The students reported that their respec-tive schools had adequate physical facilities such as classrooms recording a mean rating of 3.27 and science laboratories recording a mean rating of 3.13. Students in all the schools studied rated their schools’ physical dimension as being favorable, recording an overall mean of 2.94; a fairly average rating on a scale of 4.0. The physical infrastructure in all the six sec-ondary schools studied was perceived by the students as being favorable and therefore, ideal for learning. These schools were generally neat with beautifully manicured lawns. The hedges were well trimmed. In all the schools studied the compounds were lined with paths and signposts positioned strategically to direct visitors to desired destinations within the school. The walls of most buildings had writings and drawings on academic topics, experiments on subjects such as biology and chemistry, mathemati-cal formulas and quotes from famous personalities to inspire students. The general environment was gener-ally conducive for learning. The ratings on other aspects of the physical dimensions are illustrated in table 2 below.
3
Baraton Interdisciplinary Research Journal (2017), 7(Special Issue), pp 1-14
Mean Std. Dev
1 In this school there are adequate physical facilities such as Classrooms
3.27 1.161
2 In this school there are adequate physical facilities such as Laboratories
3.13 1.184
3 In this school there are adequate physical facilities such as Library
2.52 1.266
4 In this school there are adequate physical facilities such as Games fields
2.47 1.302
5 Repairs and maintenance of school buildings and facilities are undertaken promptly.
3.01 1.184
6 There are adequate desks and chairs for students 3.35 1.085 7 There are adequate numbers of computers in this
school. 1.91 1.192
8 There are adequate numbers of science laboratories in this school.
2.92 1.227
9 Vandalism and graffiti on walls and toilets is not a common features in our school (graffiti are abusive writings on walls especially in toilets)
2.79 1.308
10 The school compound is neat, decorated and well organized with beautifully manicured lawns.
2.97 1.197
11 The Lighting system is good and reliable 3.34 .983
12 The buildings are safe and are equipped with fire -fighting equipment with clear exit points in case of an emergency.
3.23 1.107
13 The buildings are marked with clear exit points in case of an emergency.
2.90 1.238
14 The school is located in a serene environment away from noise and is conducive for learning.
3.39 1.073
PHYSICAL DIMENSION (N = 347)
2.94
.55262
Table 2
Students’ Mean Rating on the Physical Dimension
Teachers’ Perceptions of the Physical Dimension
The teachers’ questionnaire had 16 items mea-suring the physical dimension of the school climate. Table 3 shows a summary of the teachers’ percep-tions on the physical dimension of the school climate. The teachers rated their schools’ physical dimension highly recording a mean of 3.33. The physical dimension of the school climate in all effective secondary schools in Nandi County as rated by the teachers was high recording an overall mean rating of 3.33. This rating was higher compared to that of students (2.94). There were two extra ques-tions on the physical dimension on the questionnaire to address issues that only affected the teachers such
as teaching materials, resources and availability of ap-paratus in the laboratory. Apart from questionnaires, interview schedules were prepared for both teachers and students. This in-formation data on questionnaires was corroborated by responses from the interview schedules.
4

Baraton Interdisciplinary Research Journal (2017), 7(Special Issue), pp 1-14
Table 2
Teachers’ Mean Rating on the Physical Dimension
Mean Std. Dev 1 In this school there are adequate classrooms 3.61 .76436 2 In this school there are adequate laboratories 3.15 1.12473 3 In this school there are adequate library 3.12 1.05334 4 In this school there are adequate games fields 3.01 1.09176 5 Repairs and maintenance of school buildings and facilities are
undertaken regularly. 3.41 .79398
6 There are adequate desks and chairs for students. 3.47 .87810 7 There are tables for teachers in classrooms for placing teaching
materials. 2.94 1.14210
8 The school has adequate number of computers 2.85 1.06904 9 Laboratory apparatus are adequately provided by the school. 3.47 .80974 10 Vandalism and graffiti on walls and toilets is not a common
feature in our school. 3.25 1.31580
11 The school compound is neat, decorated and well organized with beautifully manicured lawns. 3.43 1.20833
12 The Lighting system is good and reliable in this school 3.63 1.19393 13 Ventilations are available and in good working condition. 3.63 1.28694 14 The buildings are safe and equipped with fire -fighting equipment 3.49 1.40824 15 There are clearly marked exit points in buildings in case of an
emergency. 3.12 1.62134
16 The school is located in a serene environment away from noise and is conducive for learning 3.81 1.45959
PHYSICALDIMENSION (N = 105) 3.33 .73392
The study found out that schools are ill pre-pared to deal with fires in case they occur. Out of six secondary schools studied, five studied did not have elaborate fire – fighting tools and skills required. The schools are equipped with fire extinguishers but had not been checked for many years. Two out of six schools had reported outbreak of fires in the past where halls of residence for students were razed down. De-spite these past fire experiences, the two schools have not instituted elaborate measures to fight fires save for the few fire extinguishers put at different locations within administration block buildings. When asked whether staff had been trained on fighting fires one of the respondent whose school had
been affected by past fire experiences, responded by saying; “we are planning to train our staff on dealing with emergency situations not only fires”. The situa-tion in three other schools studied was the same, ‘still planning to train personnel on dealing with emer-gency situations’. This attests to the fact that most secondary schools in Nandi County are ill prepared to deal with fire emergency situations. Otherwise, all the other aspects of the physical dimension were highly rated by both the students and teachers. Table 4 illustrates comparisons between the students and teachers on overall rating of the physical dimension of school climate in Nandi County.
Table 4
Descriptive Statistics of Students’ and Teachers’ Rating of Physical Dimension
Type of respondents
N Mean Std. Deviation
Std. Error Mean
PHYSICAL DIMENSION
Teachers 105 3.3333 .73392 .07162 Students 338 2.9330 .55587 .03024
5

Baraton Interdisciplinary Research Journal (2017), 7(Special Issue), pp 1-14
On Mann-Whitney U and Wilcoxon W test, there was a significant difference between the students’ and the teachers’ perception of the physical dimension
of the school climate with a p – value of .000 which is below .05 as indicated in table 5.
Table 5
Mann-Whitney U and Wilcoxon W Test
Physical dimension
Mann-Whitney U 10824.500
Wilcoxon W 68115.500
Z -6.042
Asymp. Sig. (2-tailed) .000
From these findings it can be concluded that teachers had a more positive perception of the physi-cal dimension of the school climate than the students. Mitchell, Bradshaw, and Leaf (2010) reported that few studies have empirically examined the differ-ences in climate perceptions between teachers and their students. They reported that they were surprised to observe that teacher ratings of the overall climate were not associated with student ratings of the overall climate.
Students’ Mean Ratings on the Academic Dimen-sion
There were twenty items on the students’ questionnaire measuring the aspect of the academic dimension of the school climate. Students generally rated highly the academic dimension of the school
climate in their respective schools with an overall average mean rating of 3.25. Students expressed a sense of enthusiasm about their school and looked forward to attending lessons recording a mean rating of 3.40. The students also rated favorably the extent to which they felt that teachers were doing enough to help them solve their academic problems recording a mean of 3.54. When the students were asked whether they were pushed by teachers in order to perform aca-demically, they rated this item lowly with a mean of 2.92. However, the teachers reported that they indeed pushed students in order to perform well academically. The students also reported that they expected a lot of assistance from the teachers in order to perform well academically rating this item with a mean of 2.99. Table 6 gives a summary of the students’ responses on the academic dimension of the school climate.
6

Baraton Interdisciplinary Research Journal (2017), 7(Special Issue), pp 1-14
Table 6
Students’ Perceptions on the Academic Dimension Mean Std. Devi 1 The level of morale to study among students in this school
is high. 3.41 .941
2 Students are enthusiastic about this school and look forward to attend lessons
3.40 .976
3 Students feel that teachers are doing enough to assist them in their school work.
3.54 .887
4 Students in this school are pushed in order to perform well academically.
1.90 1.209
5 Students express satisfaction with the way academic work is conducted in this school.
3.28 1.037
6 Students feel free to talk to teachers about academic matters in this school.
2.92 1.189
7 Students feel free to talk to the principal about academic matters in this school.
2.50 1.291
8 Students help each other in their academic work. 3.78 .614 9 The students’ ideas are sought and used by the teachers on
academic matters. 3.09 1.169
10 Teachers in this school seek and use students’ ideas on academic matters.
2.92 1.207
11 Teachers know the academic problems faced by students and take time to solve them
2.80 1.210
12 Teachers always take appropriate measures to solve students’ academic problems promptly.
2.99 1.189
13 The principal responds very quickly to students’ academic matters
3.44 1.005
14 The principal seeks and uses students’ ideas on academic affairs.
3.13 1.143
15 There is a strong tradition of academic success in this school.
3.65 .791
16 Exams and quizzes are administered very frequently in this school.
3.28 1.093
17 There is strong peer influence among students to perform academically well in this school.
3.27 1.075
18 The level of expectations by students to perform well in examinations is high in this school.
3.75 .677
19 Students expect a lot of assistance from their teachers in this school in order to perform well in examinations.
2.99 1.194
20 Praises and rewards are frequently used to motivate students to perform well in examinations
3.59 .870
ACADEMIC DIMENSION (N = 347) 3.25 .50702
Generally, the academic dimension of the school climate as perceived by the students was highly rated. The qualitative data targeting the students’ focus groups were in agreement with quantitative data. Focus group three summed it all. “We work as a team and help each other to perform well academically. Any student who does not perform well is assisted by good performers. The teachers are also very supportive. We
are free to consult teachers every time we have an academic problem. This has made this school perform well consistently in national examinations over the years”.
Teachers’ Perceptions of the Academic Dimension of the School Climate
7

Baraton Interdisciplinary Research Journal (2017), 7(Special Issue), pp 1-14
Table 7
Teachers’ Mean Ratings on Academic Dimension
Mean Std. Dev
1 Teachers in this school are enthusiastic about their academic work and look forward to attend lessons.
3.81 .521
2 Students feel free to talk to teachers about academic matters in this school.
4.00 3.968
3 Students help each other in their academic work in this school.
3.70 .606
4 Teachers in this school encourage each other to do their best by team teaching.
3.75 .496
5 Teachers in this school seek and use students’ ideas on academic matters.
3.42 .806
6 Teachers know the academic problems faced by students
3.61 .658
7 Teachers always take appropriate measures to solve students’ academic problems promptly.
3.71 .631
8 The principal is a team player in curriculum implementation
3.71 .600
9 The principal responds very quickly to academic matters
3.66 .677
10 The principal seeks and uses teachers’ ideas on academic affairs.
3.57 .783
11 The principal seeks and uses students’ ideas on academic affairs.
3.54 .694
12 The principal is consistent in the application of disciplinary rules.
3.70 .619
13 There is a strong tradition of academic success in this school.
3.74 .589
14 Exams and quizzes are administered very frequently in this school.
3.65 .665
15 There is strong peer influence among students to perform academically well in this school.
3.45 .877
16 The level of expectations by teachers on students to perform well in examinations is very high in this school.
3.72 .612
17 Students are pushed persistently by their teachers in this school in order to perform well in examinations.
3.16 1.066
18 Praises and rewards are frequently used to motivate teachers to perform well in their respective subjects.
3.50 .878
19 Examination results are used to improve and developed school performance.
3.75 .568
20 Weak students are given special attention by teachers in this school
3.52 .748
ACADEMIC DIMENSION (N = 105)
3.57 .4589
The teachers rated highly all items in the ques-tionnaire on academic dimension of the school climate recording an overall mean rating of 3.57. However, the teachers reported that students were pushed in order to perform well academically recording a mean rating of 3.16. The qualitative data was consistent with the teachers’ assertions. One of the Respondent who was a principal summed it all; “our school takes academic work very seriously. In this school there is team teach-ing where for instance, if there are four mathematics teachers in a school of four streams like ours, each
teacher is assigned a stream so that no one teacher can teach two streams of the same class. The four teachers compare notes and assist each other in their teaching. These teachers set examinations and mark together as a team. This has seen the improvement of mathematics performance in our school over the years recording a mean score of at least A- (A – mi-nus) every year for the last three years”. Table 8 below shows the descriptive statistics of teachers’ and students perceptions on the academic dimension.
Table 8 Descriptive Statistics of Teachers’ and Students’ Perceptions on Academic Dimension
Type of respondents
N Mean Std. Deviation
Std. Error Mean
ACADEMIC DIMENSION
Teachers 105 3.57 .45893 .04479 Students 338 3.24 .51043 .02776
8

Baraton Interdisciplinary Research Journal (2017), 7(Special Issue), pp 1-14
Both teachers and the students had comparable mean ratings on the academic dimension recording a mean rating of 3.57 and 3.24 respectively. The students and teachers were in agreement on almost every item on the questionnaire. However, when the students were asked whether they felt free to talk to the principal regarding academic matters they recorded an aver-age mean rating of 2.50. The study found out that the students preferred to channel their academic matters through the teachers recording the highest mean rating of 4.00. Qualitative data strongly supported this asser-
tion in that during interviews with the students’ focus group five, the students had this to say; “we fear meet-ing and interacting with the principal, we would rather interact with the teachers. Our culture dictates that we respect elders and that we don’t pester him with petty issues. There is also the fear of being caught with a mistake by the principal when one never intended. The best we do is to channel our grievances through the prefects or teachers”. Table 9 shows Mann – Whitney U and Wil-coxon test on comparison of teachers’ and students’ perceptions on academic dimension.
Table 9: Mann – Whitney U and Wilcoxon test
Academic dimension Mann-Whitney U 10539.000 Wilcoxon W 67830.000 Z -6.294 Asymp. Sig. (2-tailed) .000
There was a significant difference between the teachers’ and students’ perception of the academic dimension of school climate of effective secondary schools in Nandi County. Mann-Whitney U and Wil-coxon W test yielded a p – value of .000 which is be-low the acceptable error limit of .05 in social sciences. This implies that teachers have a more positive perception of the academic dimension of the school climate than the students. Mitchell et al. (2010) re-ported that the inverse relationship between the student and teacher ratings of the academic climate where the teachers had a more favorable rating than the students was unexpected.
Students’ Mean Ratings on Social Dimension The students’ overall mean rating on the social dimension was favorable recording a mean of 3.06. The students reported that communication between them and the principal was good and the principal knew the problems they faced recording a mean rating of 2.90 and 2.83 respectively. They also reported that their principals were consistent in the application of disciplinary rules and that they took appropriate mea-sures to solve their problems recording mean ratings of 3.52 and 3.25 respectively. The students also reported that their principals sought and used students’ ideas on non – academic matters recording an average mean rat-ing of 2.65.
During the interview with the students, they reported that they had reservations interacting with their principal. One of them retorted “Every time the principal walks around most students shy away from him. Our culture demands that we respect our elders. We consider our principal to be an elder. We do not fear but actually respect him”. The table 10 below shows the students’ means ratings on social dimension.
Teachers’ Mean Ratings on Social Dimension
The social dimension was rated favorably by the teachers recording an overall mean rating of 3.40. Concerning their relationship with the principal, the teachers rated this item favorably recording a mean of 3.52. They also reported that communication between them and the principal was good recording a mean rating of 3.59. The teachers also reported that their principals knew the problems they faced record-ing a mean rating of 3. 36. The teachers also reported that the principal often took appropriate measures to solve their problems promptly recording a mean rating of 3.34. The teachers reported that their principals sought and used teachers’ ideas on non-academic affairs and also respond quickly to their non – academic matters recording mean ratings of 3.22 and 3.21 respectively. The teachers reported that their schools have clearly defined rules and behavior
9

Baraton Interdisciplinary Research Journal (2017), 7(Special Issue), pp 1-14
parameters to guide students’ behavior recording a mean rating of 3.69. Teachers also reported that they often sought and used students’ ideas on non-academic matters recording a mean rating of 3.14. The teachers also reported that students felt free to talk to them about non-academic matters re-cording a mean rating of 3.25. Teachers reported that they often sought and used students’ ideas on non-ac-ademic matters recording a mean rating of 3.14. When asked whether students felt free to talk to them about non-academic matters the teachers rated this item favorably recording a mean rating of 3.25. Teachers also reported that they were given equal opportunity in
their schools recording a mean rating of 3.15. Teachers generally reported favorably about the social dimen-sion of the school climate.In an interview with respondent two, a principal in one of the schools. She had this to say regarding her school; “I have adopted an open door policy in my school. We work together as a team from the biggest to the smallest. I value healthy relationships, students and teachers interacting freely. This made us to realize a mean of over 10.0 (B+) in the recent Kenya Certificate of Secondary Examinations. The best we have ever had”.
Table 10
Students’ Mean Rating on the Social Dimension
Mean Std. Dev.
1 Communication between the students and the principal is good
2.90 1.261
2 The principal knows the problems faced by students in this school.
2.83 1.259
3 The principal is consistent in the application of disciplinary rules.
3.52 .947
4 The principal always takes appropriate measures to solve students’ problems promptly.
3.25 1.081
5 The principal seeks and uses students’ ideas on non-academic affairs.
2.65 1.300
6 The principal responds quickly to students’ non-academic matters
2.86 1.229
7 This school has clearly defined goals and behavior parameters to guide students’ behavior.
3.64 .811
8 There is consistency and co-operative effort among the teachers in the application of disciplinary rules.
3.55 .934
9 Communication between students and the teachers is good
2.93 1.176
10 Teachers in this school seek and use students’ ideas on non-academic matters.
2.56 1.276
11 Appropriate measures are always taken by teachers to solve students’ problems.
3.03 1.151
12 Students feel free to talk to teachers about non-academic matters in this school.
2.47 1.268
13 The relationship between the local community and the school is good.
3.20 1.171
14 Every student is given equal opportunity in this school.
2.78 1.347
15 There is a strong tradition of success in this school. 3.77 .688
SOCIAL DIMENSION (N = 347) 3.06 .61354
Table 11 gives a summary of the teachers’ perception of the social dimension.
10

Baraton Interdisciplinary Research Journal (2017), 7(Special Issue), pp 1-14
Table 11
Teachers’ Perceptions on Social Dimension Mean Std. Dev
1 The relationship between teachers and the principal is good and friendly
3.52 .773
2 This school has clearly defined goals and behavior parameters to guide students’ behavior.
3.69 .640
3 There is consistency and co-operative effort among the teachers and the principal in the application of disciplinary rules.
3.70 .587
4 Communication between the teachers and the principal is good.
3.59 .743
5 The principal knows the problems faced by teachers in this school.
3.36 .833
6 The principal always takes appropriate measures to solve teachers’ problems promptly.
3.34 .897
7 The principal seeks and uses teachers’ ideas on non-academic affairs.
3.22 .930
8 The principal responds quickly to non – academic matters affecting teachers
3.21 .927
9 Teachers in this school seek and use students’ ideas on non-academic matters.
3.14 .975
10 Students feel free to talk to teachers about non-academic matters in this school.
3.25 .948
11 The relationship between the local community and the school is good.
3.52 .773
12 All teachers are given equal opportunity in this school.
3.28 .995
SOCIAL DIMENSION (N = 105) 3.4024 .60870
Comparisons between the Perceptions of Teachers and Students on Social Dimension
The perception of teachers and students on the social dimension was fairly comparable though teach-ers had a more positive social climate than the students recording an overall mean rating of 3.40 and 3.06 respectively. However, when the students were asked
whether they were free to talk to teachers about non – academic matters the students recorded a low mean rating of 2.47. On the contrary, the teachers reported that students were free to talk to them on non – aca-demic matters recording a mean rating of 3.25. Table 12 shows descriptive statistics of the teachers’ and students’ perceptions on the social dimension.
Table 12
Descriptive Statistics of Teachers’ and Students’ Perceptions of the Social Dimension
Social Dimension
Type of respondents N Mean Std. Deviation
Std. Error Mean
SOCIAL DIMENSION
Teachers 105 3.40 .60870 .05940 Students 338 3.06 .61539 .03347
11

Baraton Interdisciplinary Research Journal (2017), 7(Special Issue), pp 1-14
There was a significant difference between the students’ and teachers’ perception on the social dimension of the school climate in effective second-ary schools in Nandi County. Mann-Whitney U and
Wilcoxon W test yielded a p – value of .000 which is below the allowable error limit of .05. Table 13 shows Mann-Whitney U and Wil-coxon W test on comparison of social dimension.
Table 13
Mann-Whitney U and Wilcoxon W Test on the Social Dimension
Social Dimension Mann-Whitney U 11546.500 Wilcoxon W 68837.500 Z -5.413 Asymp. Sig. (2- tailed) .000
The implications of these findings are that teachers had a more positive perception of the social dimension of the school climate than the students. The teachers had an overall rating of 3.40 while the students had 3.06 on the social dimension of the school climate. The findings are almost com-parable but teachers had a much more favorable rat-ing compared to the students. Teachers have a more mature and realistic perception of the dimensions that make up a positive school climate.
The School Climate Model
Figure 1 presents a school climate model for-mulated out of the findings of this study. An effective school climate has a carefully thought out plan of addressing the physical infrastruc-ture of the school. Maintaining the correct number of classroom is of utmost importance to cater for at least 40 students per class and extra classes to cater for optional subjects. Three science laboratories are man-datory to cater for physics, biology and chemistry. The impact of student learning through science experiments
cannot be underestimated. In a National Endowment for Science, Technology and Arts (NESTA, 2005) survey (n= 510), 99% of the sample of UK science teachers believed that inquiry learning had a posi-tive impact (33% - ‘very’; 16% -‘a little’) on student performance and attainment. Lunetta, Hofstein, and Clough (2007) argued that when well-planned and effectively implemented, science education laboratory and simulation experience situate students learning in varying levels of inquiry requiring students to be both mentally and physically engaged in ways that are not possible in other science education experiences.
Figure 1. The school climate model.12

Baraton Interdisciplinary Research Journal (2017), 7(Special Issue), pp 1-14
Dullon (2008) concurs that practical work can increase students’ sense of ownership of their learning and can increase their motivation. Five out of the six secondary schools studied had three science laboratories; biology, chemistry and a physics laboratory with only one school having seven science laboratories. This shows the importance the schools place on the role of science experiments in im-proving academic performance of students. The study recommends putting in place emergency protocols that should be adhered to such as placing fire extinguishers in strategic and accessible points and marking clearly exit points among other pertinent information. Schools should strive to beautify the environment and create an ambience that stimulates learning.
Conclusion
In conclusion, this study found out that in all the six secondary schools studied, they had a favorable school climate as measured by the physical, academic and the social dimension of the school climate as rated by both the teachers and students together with prin-cipals. Both quantitative and qualitative data attests to this fact. The development of a positive school climate takes both time and effort of all stakeholders involved working together towards a common goal of improv-ing academic performance of students. The quest for an effective school climate model is replete with chal-lenges. But when all stakeholders work together they can overcome them.
Acknowledgement
I thank God for the gift of life and ability to un-dertake this research. I thank Prof. Elizabeth Role for her mentorship and wise counsel in all my academic pursuits. I thank my contemporaries in the school of education, department of educational administration, curriculum and teaching. I thank my wife, Margaret and Children for their prayers and support.
References
Anderson, C. (1982). The search for school climate: A review of the research. Review of Educa tional Research, 52(3), 368–420.Braun, V., & Clarke, V. (2006). Using thematic analysis in psychology. Qualitative Research in Psychology, 3, 77–101.
Bryk, A. S., & Driscoll, M. (1988). The high school as community: Contextual influences and consequences for students and teachers. Madison: University of Wisconsin, National Center on Effective Secondary Schools. Cohen, J., McCabe, E. M., Michelli, N. M., & Pickeral, T. (2009). School climate: Research, policy, practice, and teacher education. Teachers College Record, 111(1), 180–213. Creswell, J. (2012). Educational research: Planning, Conducting, and evaluating quantitative and qualitative research (4th ed.) Upper Saddle River, N .J.: Pearson Education. Ding, C., Liu, Y., & Berkowitz, M. (2011). The Study factor structure and reliability of an abbrevi ated school climate survey. Canadian Journal of School Psychology, 26, 241. DO1:10.1177/0829573511414005. Dullon, J. (2008). A review of research on practical work in school science. London: Kings College.Halpin, A.W., & Croft, D. B. (1963). The organiza tional climate of schools. Chicago: Midwest Administration Centre of the University of Chicago.Kara H. (2012). Research and evaluation for busy practitioners: A time–saving guide. Bristol: Policy Press. Kgaile, A., & Morrison, K. (2006). Measuring and targeting internal conditions for school effectiveness in the Free State of South Africa. Educational Management Administration & Leadership, 34(1), 47-68.Lunetta, V. N., Hofstein, A., & Clough, M. (2007). Teaching and learning in the school science laboratory : An analysis of research, theory and practice. In S. K. Abell, & N. G. Lederman (Eds.), Handbook of research on science education (pp. 393 – 431). Mahwah, NJ : Lawrence Erlbaum Associates. Makewa, L. N., Role, E., Role, J., & Yegoh, E. (2011) School climate and academic performance in high and low achieving schools: Nandi Central District, Kenya. International Journal of Scientific Research in Education, 4(2), 93-104.Mitchell, M. M., Bradshaw, C. P., & Leaf, P. J., (2010) Student and teacher perceptions of school climate: A multi-exploration of patterns of discrepancy. Journal of School Health, 80(6),
13

Baraton Interdisciplinary Research Journal (2017), 7(Special Issue), pp 1-14
271 – 272.National School Climate Council. (2007). The school climate challenge: Narrowing the gap between school climate research and school climate policy, practice guidelines and teacher educa tion policy. Retrieved from http://www. schoolclimate.org/climate/advocacy.php National Endowment for Science, Technology and Arts (NESTA). (2005). Science teachers survey. Retrieved from http://www.planet- science.com/ArticleDocuments/1852/science_ teachers_report.pdfReid, K. (1983). Retrospection and persistent school absenteeism. Educational Research, 25, 110– 115.Shindler, J., Jones, A., Williams, A., Taylor, C., & Cardenas, H. (2009, January). Exploring below the surface: School climate assessment
and improvements as the key to bridging the achievement gap. Paper presented at the annual meeting of the Washington State Office of the Superintendent of Public Instruction, Seattle, WA.Thapa, A., Cohen, J., Guffey, S., & Higgins- D’Alessandro, A. (2013). A review of school climate research. Review of Educational Research, 83(3), 357-385.Wu, S. C., Pink, W., Crain, R., & Moles, O. (1982). Student suspension: A critical reappraisal. Urban Review, 14, 245–303. Yegoh, E. K. (2011). School climate differences between high and low performing provincial secondary schools and its influence on academic achievement in Nandi Central District, Kenya (Unpublished master’s thesis). University of Eastern Africa, Baraton, Kenya.
14