Embed Size (px)
Citation preview
Project co-financed by the European Commission, Directorate-General Transport and Energy
Road Safety Data, Collection, Transfer and Analysis
Developing a Road Safety Index
Please refer to this report as follows: Bax, C., Wesemann, P., Gitelman, V., Shen, Y., Goldenbeld, C., Hermans, E., Doveh, E., Hakkert, S., Wegman, F., Aarts, L. (2012). Developing a Road Safety Index. Deliverable 4.9 of the EC FP7 project DaCoTA.
Grant agreement No TREN / FP7 / TR / 233659 /"DaCoTA" Theme: Sustainable Surface Transport: Collaborative project Project Coordinator: Professor Pete Thomas, Vehicle Safety Research Centre, ESRI Loughborough University, Ashby Road, Loughborough, LE11 3TU, UK Project Start date: 01/01/2010 Duration 30 months
Organisation name of lead contractor for this deliverable: Belgian Road Safety Institute (IBSR)
Report Author(s): Charlotte Bax, Paul Wesemann, Charles Goldenbeld, Fred Wegman, Letty Aarts
– SWOV Institute for Road Safety Research, NL Victoria Gitelman, Etti Doveh, Shalom Hakkert – Technion University Haifa, IL Yongjun Shen, Elke Hermans – Transportation Research Institute IMOB, Hasselt University, BE
Due date of deliverable 31/1/2013 Submission date: 31/1/2013
Project co-funded by the European Commission within the Seventh Framework Programme
Dissemination Level
PU Public


3
TABLE OF CONTENTS
Executive summary ................................................................................................. 7
1. General introduction ...................................................................................... 14
1.1. The DaCoTA study on Road Safety Index ............................................................ 14
1.2. Existing practices in comparing road safety results .............................................. 16
1.3. Previous EU projects on benchmarking ................................................................ 17
1.4. The road safety target hierarchy ............................................................................ 17
1.5. Relationships between layers ................................................................................ 20
1.6. Towards a Road Safety Index ............................................................................... 21
1.7. New features present study ................................................................................... 22
1.8. Reading guide ........................................................................................................ 23
1.9. References ............................................................................................................ 24
PART I: THEORETICAL BACKGROUND .............................................................. 27
2. The theory of creating a composite index .................................................... 29
2.1. Introduction ............................................................................................................ 29
2.2. Indices in other fields ............................................................................................. 29
2.3. Previous road safety indices .................................................................................. 30
2.4. Index methodology ................................................................................................ 31
2.5. Weighting schemes ............................................................................................... 33
2.6. Concluding remarks ............................................................................................... 37
2.7. References ............................................................................................................ 37
3. Road safety outcome indicators ................................................................... 40
3.1. Introduction ............................................................................................................ 40
3.2. Risk and exposure ................................................................................................. 40
3.3. Comparing safety outcomes of countries .............................................................. 41
3.4. Data considerations and choice of indicators for the Road Safety Index .............. 44
3.5. Concluding remarks ............................................................................................... 45
3.6. References ............................................................................................................ 46
4. Ideal and available road safety performance indicators .............................. 48
4.1. Introduction ............................................................................................................ 48
4.2. Safety Performance Indicators .............................................................................. 48
4.3. SPIs on alcohol and drugs ..................................................................................... 49
4.4. SPI on speed ......................................................................................................... 52
4.5. SPIs on protective systems ................................................................................... 54
4.6. SPI on daytime running lights ................................................................................ 55
4.7. SPI on vehicles ...................................................................................................... 56

4
4.8. SPI for roads .......................................................................................................... 59
4.9. SPI on trauma management .................................................................................. 61
4.10. Data and choice of indicators for the Road Safety Index ...................................... 63
4.11. Concluding remarks ............................................................................................... 66
4.12. References ............................................................................................................ 67
5. Road safety policy indicators ........................................................................ 72
5.1. Introduction ............................................................................................................ 72
5.2. Set up of the study ................................................................................................. 73
5.2.1. Conceptual framework ....................................................................................... 73
5.2.2. Needs for knowledge and data .......................................................................... 74
5.3. Knowledge on quality of policy performance ......................................................... 74
5.4. Results of the DaCoTA WP 1 investigation on policy making factors ................... 78
5.4.1. Goal and terminology ........................................................................................ 78
5.4.2. Set-up of the investigation ................................................................................. 78
5.4.3. Outcomes of the extensive questionnaire survey.............................................. 78
5.4.4. Outcomes of the PIN/ Dacota questionnaire survey ......................................... 79
5.5. Concluding remarks ............................................................................................... 81
5.6. References ............................................................................................................ 82
6. Structure and culture ..................................................................................... 84
6.1. Introduction ............................................................................................................ 84
6.2. Characteristics of the structural and cultural background ..................................... 85
6.2.1. Structural indicators ........................................................................................... 85
6.2.2. Cultural indicators .............................................................................................. 88
6.3. Data considerations and selected indicators for the Road Safety Index ............... 90
6.4. Concluding remarks ............................................................................................... 90
6.5. References ............................................................................................................ 91
PART II: COMPOSING THE ROAD SAFETY INDEX ............................................. 95
7. Country grouping for composite index development .................................. 97
7.1. Introduction ............................................................................................................ 97
7.2. Exploring initial countries classification using the complete set of indicators ........ 99
7.2.1. Factor analysis................................................................................................... 99
7.2.2. Direct clustering ............................................................................................... 104
7.2.3. Comparison of the results ................................................................................ 106
7.3. Exploring a two-country-groups classification based on the complete set of indicators ............................................................................................................. 109
7.4. Recognizing two country groups based on four main structure and culture indicators ............................................................................................................. 112
7.4.1. Direct clustering ............................................................................................... 112
7.4.2. Factor analysis................................................................................................. 113
5
7.4.3. Comparison of the results ................................................................................ 116
7.5. Considering Hofstede cultural scores .................................................................. 117
7.6. Concluding remarks ............................................................................................. 117
7.7. References .......................................................................................................... 118
8. Results I: a composite index based on road safety outcomes ................. 119
8.1. Introduction .......................................................................................................... 119
8.2. Indicators and data .............................................................................................. 119
8.3. Analysis preparation: data normalization and assigning weight restrictions ....... 121
8.3.1. Data normalization ........................................................................................... 121
8.3.2. Weight restrictions ........................................................................................... 121
8.4. Results ................................................................................................................. 122
8.4.1. Index scores .................................................................................................... 122
8.4.2. Weight allocation ............................................................................................. 125
8.4.3. Country ranking comparison ............................................................................ 126
8.5. Concluding remarks ............................................................................................. 128
8.6. References .......................................................................................................... 129
9. Results II: a composite index based on road safety performance indicators ....................................................................................................................... 130
9.1. Introduction .......................................................................................................... 130
9.2. Indicators and data .............................................................................................. 130
9.3. Analysis preparation: data normalization and assigning weight restrictions ....... 132
9.3.1. Data normalization ........................................................................................... 132
9.3.2. Weight restrictions ........................................................................................... 132
9.4. Results ................................................................................................................. 133
9.4.1. Index scores .................................................................................................... 133
9.4.2. Weight allocation ............................................................................................. 136
9.5. Concluding remarks ............................................................................................. 137
9.6. References .......................................................................................................... 138
10. An index in two dimensions ........................................................................ 139
10.1. Introduction .......................................................................................................... 139
10.2. Methodology of a composite index ...................................................................... 139
10.3. Relations between two outcome indices ............................................................. 140
10.4. Ranking on two dimensions ................................................................................. 142
10.5. Concluding remarks ............................................................................................. 145
10.6. References .......................................................................................................... 146
PART III: FINAL WORDS ..................................................................................... 147
11. Discussion and conclusions ....................................................................... 149
11.1. Introduction .......................................................................................................... 149

6
11.2. Main findings and conclusions ............................................................................. 150
11.2.1. Composite index of final outcomes ................................................................. 150
11.2.2. Composite index of intermediate outcomes .................................................... 153
11.2.3. Composite index of policy performance .......................................................... 155
11.2.4. Overall Road Safety Composite Index ............................................................ 156
11.3. Recommendations ............................................................................................... 158
11.3.1. Short term recommendations .......................................................................... 158
11.3.2. Long term recommendations ........................................................................... 158
Appendix A. Final dataset collected for the RSI development ......................... 161
Appendix B. Final dataset with the values imputed .......................................... 164
Appendix C. The Structure and Culture dataset ............................................... 167
Appendix D. Outputs of factor analysis applied to the whole set of indicators ....................................................................................................................... 168
Appendix E. The standardized data applied for a direct clustering ................. 170
Appendix F. Exploring country classification based on Hofstede’s cultural scores............................................................................................................ 171
Appendix G. Using DEA for composite index construction ............................. 175
Appendix H. Final outcome index scores based on two country groups ....... 180
Appendix I. The weights of seven outcome indicators for 30 countries ......... 181
Appendix J. Safety performance index scores based on two country groups 185
Appendix K. The weights of eight SPI’s for 29 countries ................................. 186
Appendix L. Selection questions PIN-questionnaire ........................................ 191
D4.9 Developing a Road Safety Index
7
EXECUTIVE SUMMARY Road safety is a major social aim. The countries that perform best in road safety base their most effective policies on an evidence-based, scientific approach. Countries may learn to improve road safety from their own experiences but also from systematic comparison with other countries.
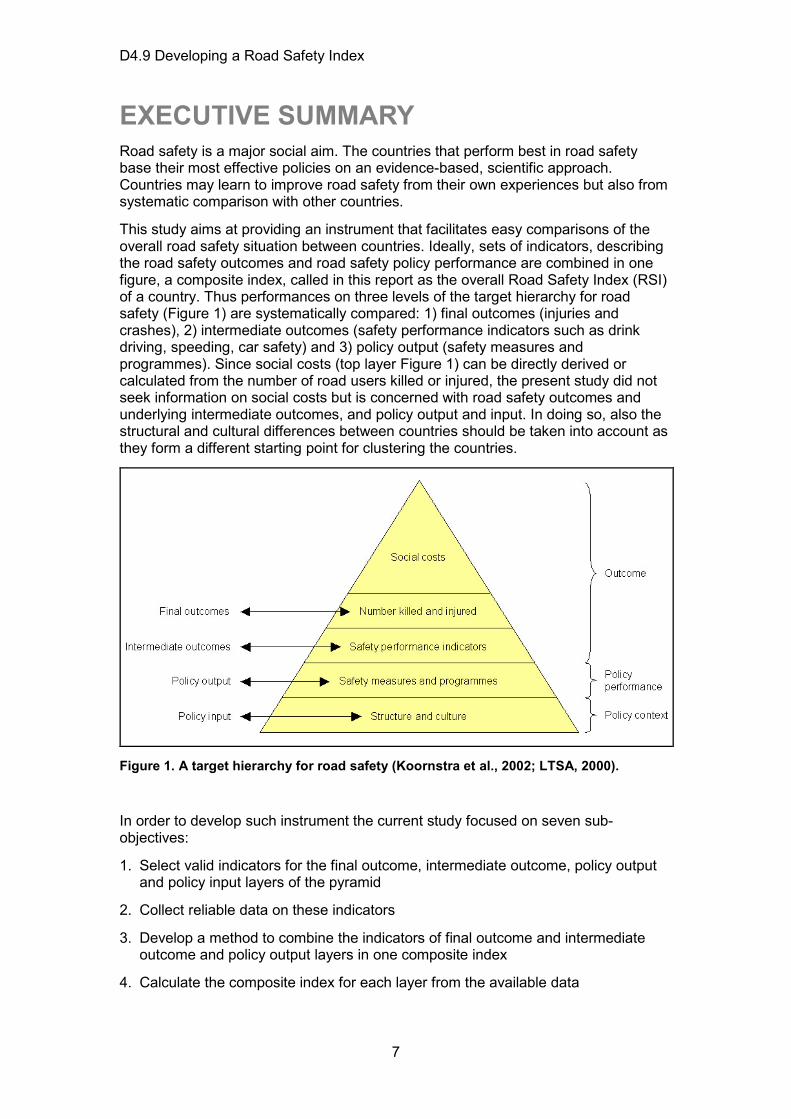
This study aims at providing an instrument that facilitates easy comparisons of the overall road safety situation between countries. Ideally, sets of indicators, describing the road safety outcomes and road safety policy performance are combined in one figure, a composite index, called in this report as the overall Road Safety Index (RSI) of a country. Thus performances on three levels of the target hierarchy for road safety (Figure 1) are systematically compared: 1) final outcomes (injuries and crashes), 2) intermediate outcomes (safety performance indicators such as drink driving, speeding, car safety) and 3) policy output (safety measures and programmes). Since social costs (top layer Figure 1) can be directly derived or calculated from the number of road users killed or injured, the present study did not seek information on social costs but is concerned with road safety outcomes and underlying intermediate outcomes, and policy output and input. In doing so, also the structural and cultural differences between countries should be taken into account as they form a different starting point for clustering the countries.
Figure 1. A target hierarchy for road safety (Koornstra et al., 2002; LTSA, 2000).
In order to develop such instrument the current study focused on seven sub-objectives:
1. Select valid indicators for the final outcome, intermediate outcome, policy output and policy input layers of the pyramid
2. Collect reliable data on these indicators
3. Develop a method to combine the indicators of final outcome and intermediate outcome and policy output layers in one composite index
4. Calculate the composite index for each layer from the available data

D4.9 Developing a Road Safety Index
8
5. Investigate the value of combining the composite layer-indices in one overall Road Safety Index
6. Visualize the results for a set of European countries
7. Develop a method to take into account structural and cultural differences between countries when comparing them on the preceding indices
Chapter 1 provides an overview of existing practices in comparing road safety results within the EU. A history of the background of the Road Safety Index is given as well as a short explanation of its nature, including thoughts on the acceptance of such an instrument by policy makers and politicians. The first SUNflower project, comparing road safety in Sweden, the United Kingdom and the Netherlands, aimed at a better insight into the development of policies and programs in the three countries to identify key factors to improve road safety. The three countries were chosen because, although they differ a lot, they have the best road safety level in the world. These road safety levels appeared to have been achieved through continuing planned improvements over recent decades. Their targeted policy areas had been similar, but their implemented policies differed at a detailed level. In a second study, called SUNflower+6, nine countries were studied using a similar method In the SUNflowerNext study, the concept of benchmarking was introduced to focus on learning from the best performing countries. The benchmarking concept, originated from quality control theories in the business sector, concentrates on improving performances by learning from others through identifying best performing countries, understanding why they are best performing, and by adapting outstanding practices from the countries which perform 'best-in-class'.
Chapter 2 explains the method of the construction of the composite index. Composite indices are increasingly recognized as a useful tool in policy analysis and public communication. A large number of composite indices have been developed and applied in a wide range of fields during the last decades. In the road safety context, the development of road safety composite indices is also valuable in order to reduce the large amount of information and to provide a meaningful tool for national (or sub-national) comparison and monitoring of road safety performance. Although the development of road safety composite indices is recommended, and some research efforts have already been devoted, care should be taken to ensure that the construction process of the index is transparent and follows sound conceptual principles.
The construction of a Road Safety Composite Index involves several methodological stages. Having selected the set of indicators to combine in the road safety outcome index (Second below top layer, Figure 1), respectively the road safety performance index (Middle layer, Figure 1) and the road safety management index (One above bottom layer, Figure 1), and having obtained and prepared the indicator data, the next step is to apply the appropriate weighting schemes in order to deduce a weight for each indicator, and to compute an index score for each country subsequently. However, different weighting methods have their own advantages and limitations, and imply different end results. In general, no weighting system is above criticism.
For this study, the technique of data envelopment analysis, known as the ‘benefit of the doubt’ approach, is chosen to construct the road safety composite indices, mainly due to the fact that the weights are retrieved from the observed data themselves, and more importantly, valuable information can be deduced, such as the identification of benchmark(s) for each underperforming country and the detection of aspects on which each country should focus.
D4.9 Developing a Road Safety Index
9
Chapter 3 describes the indicators that were chosen to represent the second top layer of the road safety target hierarchy (Figure 1), the Safety Outcome Indicators. The data for the safety pyramid outcome layer come mostly from the EC annual summaries, which are based on the Eurostat, CARE and other data sources. The summaries are annually produced which makes them a good platform for producing a Road Safety Index. The dataset was collected for 30 countries, most of the data concern 2008 except seat belt wearing rates which concern 2009 and car renewal rates which concern 2007. For the second top layer of the road safety pyramid, the following 7 indicators have been chosen: 1. the number of fatalities per million inhabitants, 2008; 2. the number of fatalities per million passenger cars, 2008; 3. the number of fatalities per 10 billion passenger-km travelled, 2008; 4. the share pedestrians among total fatalities, 2008; 5. the share pedal cyclists among total fatalities, 2008; 6. share motorcyclists among the total fatalities, 2008; 7. the annual average percentage reduction in fatalities, over 2001-2008.
Chapter 4 describes the indicators for road safety performance, the intermediate outcomes in the road safety hierarchy (Figure 1). Safety performance indicators (SPIs) are measures (indicators), reflecting those operational conditions of the road traffic system, which influence the system’s safety performance. Basic features of SPIs are their ability to measure unsafe operational conditions of the road traffic system and their regular repeated measurement independent from the occurrence of specific safety interventions. SPIs are aimed at serving as assisting tools in assessing the current safety conditions of a road traffic system, monitoring the progress, measuring impacts of various safety interventions, making comparisons, and for other purposes. The chosen SPIs were: 1. the percentage of drivers above legal alcohol limit in roadside checks 2008; 2. the number of roadside police alcohol tests per 1,000 population 2008; 3. the daytime seat belt wearing rates on front seats of cars (aggregated for driver and front passenger) 2009; 4. the daytime wearing rates of seat belts on rear seats of cars 2009; 5. the average percentage occupant protection score for new cars sold 2008; 6. the average percentage score of pedestrian protection for new cars sold 2008; 7. the renewal rate of passenger cars 2007; 8. the median age of the passenger car fleet 2008.
Chapter 5 deals with the road safety policy performance layer of the road safety pyramid. The Chapter reports on the actual insights into the effectiveness of road safety policy on the basis of available literature, and furthermore presents the results of a recently performed investigation by WP 1 on the validation of indicators of policy performance. The literature review showed that the institutional (road safety) management functions are almost without exception described qualitatively and need further operationalization. Moreover their impact will frequently depend on its quantity or intensity; this requires the assignment of quantitative values (categories).
A preliminary investigation into potential road safety management indicators could not establish sufficient validity of the chosen indicators. It is concluded that little knowledge is readily available on valid indicators for policy performance, neither for institutional management functions nor for measures. Operational definitions are lacking as well as data on the topical occurrence of these conditions in the countries of Europe. Just one exception from literature can be mentioned, the effect of target setting on fatality reduction. Thus for the time being it will not be possible to construct a composite index for the quality of policy performance of a country and to value European countries in terms of this index.
Chapter 6 pays attention to the Structure and culture layer of the road safety pyramid. The structural indicators consist of physical and social indicators that form the physical and functional structure of countries. The cultural level consists of the general norms, values and attitudes that may affect road safety, but that are not

D4.9 Developing a Road Safety Index
10
influenced by road safety policies. Both structural and cultural indicators can influence road safety but are themselves not influenced by road safety policies.
The aim of the layer Structure and culture is to group countries in comparable classes. These indicators are used in later chapters to group countries into comparable classes. Comparable classes are constructed because it can be expected that countries learn more and more easily from similar countries than from countries which differ on physical and social characteristics. Also, countries might be more motivated to improve themselves if being the ‘best-in-class’ is considered to be within reach. Eight indicators were chosen to represent the structure and culture layer: 1. the share of people under 25 years old 2008; 2. the share of people over 65 years old 2008; 3. the population per 1 km2 of a country's territory 2008; 4. the percentage of population living in urban areas (>10.000 inhabitants) 2008; 5. the number of passenger cars per 1000 inhabitants 2008; 6. Share of goods vehicles in the vehicle fleet 2008; 7. the share of powered two-wheelers in the vehicle fleet 2008; 8. the GDP per head (based on EU27 = 100) 2008. In addition, it was also decided to explore the importance of Hofstede’s cultural dimensions in grouping countries.
In Chapter 7 various forms of country grouping on the basis of structure and culture layer indicators were explored. Two groups of countries were identified using the four main country characteristics: GDP per head, motorization level, population density and the percentage of population living in urban areas. These two groups were stable across various classification methods. The key characteristics subdividing the countries into two groups were the indicators of motorization level and GDP per capita which are commonly known as characteristics of the level of a country's economic development. The first group includes 10 countries: Bulgaria, Czech Republic, Estonia, Hungary, Latvia, Lithuania, Poland, Portugal, Romania, Slovakia, and, on average, is characterized by lower values of economic development. The second group includes the remaining 20 countries, that score generally higher, but also more diverse on the background country characteristics.
Chapter 8 presents the results of an analysis which aimed at constructing a composite index based on road safety outcome indicators. By applying a data envelopment analysis, seven basic indicator values were combined into a composite index score for 30 countries. Two best-performing countries at the year under study were thereby identified, which were Iceland and Luxembourg. Furthermore, by obtaining a cross index score for each country, the countries were ranked and classified into five levels with respect to their road safety outcome. In total, nine countries were found to belong to the high level of road safety outcome, which are France, Germany, Iceland, Luxembourg, Netherlands, Sweden, Switzerland, United Kingdom, and Spain. Eight countries - Ireland, Portugal, Italy, Finland, Norway, Belgium, Malta, and Austria - were recognized as having a moderately high level of road safety outcome. In addition, six countries belonged to a medium level: Cyprus, Czech Republic, Denmark, Estonia, Latvia and Slovenia. Another six countries to a moderately low level: Bulgaria, Greece, Hungary,. Italy, Slovakia and Poland. Finally one country, Romania, belonged to a low level.
Further re-estimating the composite index scores for the two separate country groups that were recognized earlier based on the background country characteristics in Chapter 7, most of the countries in the group characterized by lower values of the background characteristics belong to the last three levels of road safety outcome, i.e., medium, moderately low, or low. Regarding the remainder of countries, i.e., the 20 countries having higher values of the background characteristics, most of them belong to a high or moderately high level of road safety outcome,Considering the weight allocation provided by the DEA-based composite index model, for each country, the characteristics of relatively good and poor performance compared to
D4.9 Developing a Road Safety Index
11
other countries, can be identified (see Appendix I), thus providing a basis for planning road safety improvement efforts. It was found that a considerable difference in the countries' ranking appeared mostly depending on the inclusion or exclusion of the dynamic indicator (annual average percentage reduction in number of fatalities), whereas the addition of scope indicators (i.e., the shares of vulnerable road user fatalities) did not change the countries' ranking significantly. Taking into account the impact of the dynamic outcome indicator and the similarity of the results observed when including the additional scope indicators, it is recommended to further apply a composite index with respect to road safety outcome based on the whole set of seven indicators.
Chapter 9 presents the results of an analysis which aimed at constructing a composite index based on road safety performance indicators (intermediate outcomes) of European countries. By applying a data envelopment analysis, eight basic safety performance indicator values were combined into a composite index score for 29 countries (Iceland was excluded from the analysis due to lacking SPI data). Moreover, by obtaining the cross index score for each country, the countries were ranked and further classified into five levels with respect to their road safety performance.
Based on the safety performance index values, five countries were found to belong to the high level of road safety performance, which are Finland, Sweden, Norway, France and Ireland, in which Finland and Sweden are the two best-performing ones. Four countries – Germany, Netherlands, Spain, and Switzerland - were recognized as having a moderately high level of road safety performance. In addition, ten countries belonged to a medium level of road safety performance (Austria, Belgium, Cyprus, Czech Republic, Denmark, Estonia, Hungary, Luxembourg, Slovenia, United Kingdom), six countries to a moderately low level (Bulgaria, Greece, Lithuania, Malta, Portugal, Slovakia) and four countries (Italy, Latvia, Poland, and Romania) to a low level.
Further re-estimating the composite index scores for the two separate country groups that were recognized earlier based on the background country characteristics in Chapter 7, the order of countries ranked in accordance with the safety performance index in the two separate groups repeated the order of countries received for the whole country set. However, once a more comparable country group was considered separately, a more realistic set of benchmark countries could be identified, especially for the country group with a lower level of the background characteristics, which in this study was Estonia and Hungary.
Considering the weight allocation provided by the DEA-based composite index model, for each country, the issues of relatively good and poor performance, compared to other countries, can be recognized, providing policy makers with a basis for formulating road safety priorities for each country (see Appendix K).
Finally, it is important to note that the selection of appropriate safety performance indicators requires periodic revisions. Apart from the SPIs developed in this study, other risk factors that have a strong relationship with road safety or a large contribution to road crashes and casualties, such as speed, road infrastructure, and trauma management, could also be incorporated in the future index research and corresponding indicators developed and data collected.
In Chapter 10, statistical examinations demonstrate that the composite SPI index has a clear link with the composite final outcome index, but country rankings based on both indices are not identical. In this chapter first a general ranking of countries based on their two index scores was studied, and later this ranking was separately
D4.9 Developing a Road Safety Index
12
performed for two groups of countries that were distinguished in Chapter 7 on the basis of structure and culture indicators.
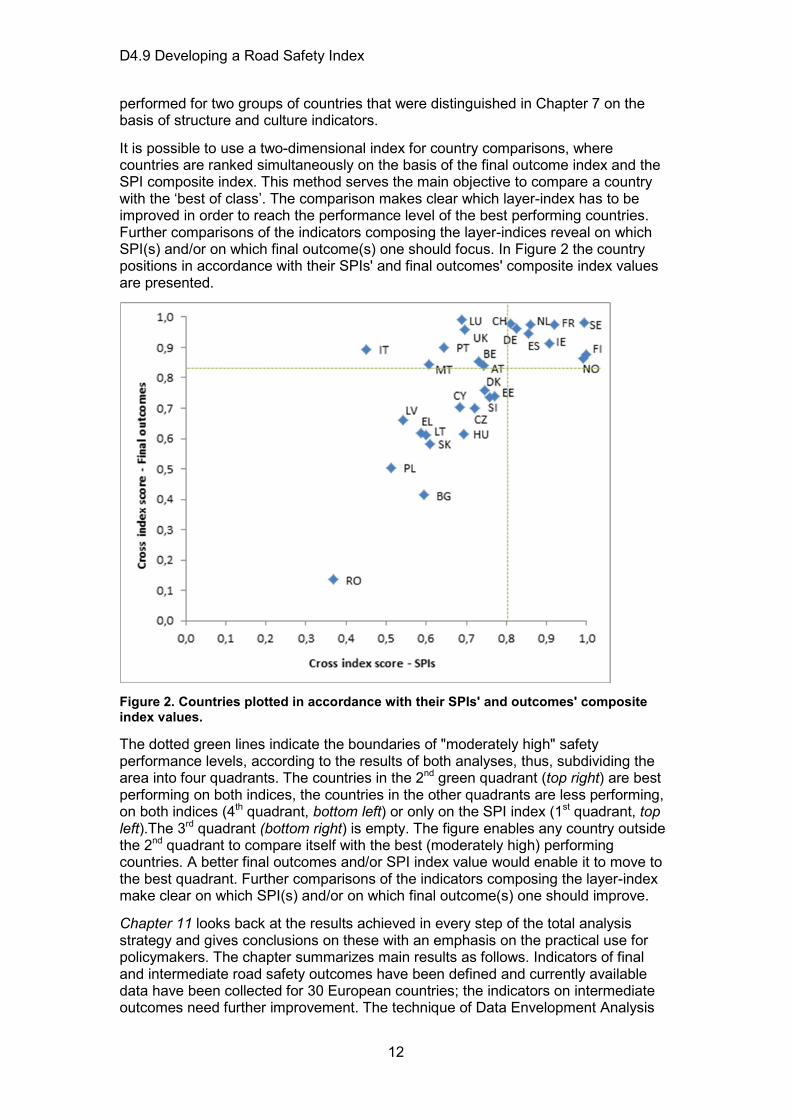
It is possible to use a two-dimensional index for country comparisons, where countries are ranked simultaneously on the basis of the final outcome index and the SPI composite index. This method serves the main objective to compare a country with the ‘best of class’. The comparison makes clear which layer-index has to be improved in order to reach the performance level of the best performing countries. Further comparisons of the indicators composing the layer-indices reveal on which SPI(s) and/or on which final outcome(s) one should focus. In Figure 2 the country positions in accordance with their SPIs' and final outcomes' composite index values are presented.
Figure 2. Countries plotted in accordance with their SPIs' and outcomes' composite index values.
The dotted green lines indicate the boundaries of "moderately high" safety performance levels, according to the results of both analyses, thus, subdividing the area into four quadrants. The countries in the 2nd green quadrant (top right) are best performing on both indices, the countries in the other quadrants are less performing, on both indices (4th quadrant, bottom left) or only on the SPI index (1st quadrant, top left).The 3rd quadrant (bottom right) is empty. The figure enables any country outside the 2nd quadrant to compare itself with the best (moderately high) performing countries. A better final outcomes and/or SPI index value would enable it to move to the best quadrant. Further comparisons of the indicators composing the layer-index make clear on which SPI(s) and/or on which final outcome(s) one should improve.
Chapter 11 looks back at the results achieved in every step of the total analysis strategy and gives conclusions on these with an emphasis on the practical use for policymakers. The chapter summarizes main results as follows. Indicators of final and intermediate road safety outcomes have been defined and currently available data have been collected for 30 European countries; the indicators on intermediate outcomes need further improvement. The technique of Data Envelopment Analysis
D4.9 Developing a Road Safety Index
13
(DEA) has been selected to construct a composite index. For each of the two layers of both final and intermediate outcomes a composite index has been constructed by using DEA. A visualisation was used to compare a country with the best of class according to the two composite indices in combination.
The chapter recommends three areas for further research:
1. Improve the indicators of intermediate safety outcomes; this is necessary because a number of key valid indicators are currently missing (on speed, alcohol use, trauma management and roads).
2. Develop indicators and a composite index for effective and efficient policy performance. This research may aim at the valuation of either a country’s measures and programmes or of its institutional management functions, or both.
3. Construct an overall Road Safety Composite Index based on the three composite indices for the two layers of safety outcomes and the third layer of policy performance. This will require insight in the relative weights for the three layer-indices.
References Koornstra, M., Lynam, D., Nilsson, G., Noordzij, P., Petterson, H.-E., Wegman, F., and Wouters, P. (2002). SUNflower: a comparative study of the development of road safety in Sweden, the United Kingdom, and the Netherlands. SWOV Institute for Road Safety Research / Transport Research Laboratory TRL / Swedish National Road and Transport Research Institute VTI. Leidschendam / Crowthorne / Linköping.
LTSA (2000). Road safety strategy 2010. A consultation document. National Road Safety Committee, Land Transport Safety Authority LTSA, Wellington.
D4.9 Developing a Road Safety Index
14
1. GENERAL INTRODUCTION
Charlotte Bax SWOV
Charles Goldenbeld SWOV
1.1. The DaCoTA study on Road Safety Index Road safety is an important social aim. Traffic crashes have a major impact on European society. In 2008 in the European Union, over 38,000 road users died in traffic and over 1.2 million were injured in Europe. The European Commission and National Governments place a high priority on reducing casualty numbers and have introduced targets and objectives (European Commission, 2010). Countries may learn to improve road safety from their own experiences but also from systematic comparison with other countries.
Previous studies reveal that the best-performing countries base their most effective policies on an evidence-based, scientific approach (Wegman et al., 2008). In the past, the EU funded the SafetyNet project to establish the European Road Safety Observatory (ERSO) to bring together data and knowledge to support road safety policy-making. The DaCoTA project aims at contributing to the Observatory by enhancing the existing data and adding new road safety information.
This report accounts for the results of one of the studies within the DaCoTa project. The study aims at building a composed Road Safety Index. The Road Safety Index (RSI) is a composed index, in which indicators describing the road safety outcome or output of a country are combined into one figure. The index facilitates easy comparisons between countries to inspire them to increase their efforts and improve road safety in their country.
The Road Safety Index aims at providing an instrument which systematically compares road safety results on three different levels: 1) on road deaths and injured, 2) on safety performance indicators such as driving under the influence, seat belt use and car safety, and 3) on several indicators regarding road safety management. The tool not only compares countries on these indicators, but, contrary to existing road safety benchmarking tools, integrates the scores on individual indicators into one composite score. The RSI also takes into account the structural and cultural differences between countries, as they form a different starting point for countries.
This introduction is a good place to explain what the Road Safety Index will and will not measure and deliver. The Road Safety Index will provide a total score, composed of indicators on several levels, of the road safety achievements per country. This enables countries to compare themselves with others, using a tool that measures more than just road safety outcomes. The index aims at offering especially policy-makers and politicians easy to read and easily accessible information on how their country is ranked to other countries in Europe. The ranking could inspire policy-makers and politicians to amplify their ambitions and to invest in road safety and an easy-readable tool as the Road Safety Index might attract political and press attention. The added value of the Road Safety Index as opposed to the available tools for comparing road safety achievements is the composed score: policy-makers and politicians do not have to construct a complete picture using several indicators for road safety, ranging from road deaths to alcohol road side checks. Instead, a

D4.9 Developing a Road Safety Index
15
complete picture, based on state-of-the-art theory and figures is made for them. For policy-makers or researchers who need more detailed information, the Road Safety Index provides detailed information on each level, and for each indicator. With this, policy-makers and researcher get the opportunity to compare their country on a detailed level to neighbors, countries with similar features or with best performing countries within Europe. This can help policy-makers to discover the specific road safety indicators most profitable to invest in.
Despite the added value, there are specific features the Road Safety Index does not offer. Although the index highlights the differences between countries, it does not explain these differences, as it is not more and not less than a composed score for road safety. Countries can use the detailed figures to clarify their own scores, and use this information to decide whether their policies require adaptation. Furthermore, the Road Safety Index is not a prediction of road safety in the future and due to lack of (reliable and recent) data, the indicators used to compose the index do also not explain all variance between the countries. The index at this point, due to practical limitations, is a first prototype, and demonstrates how a composed index could work for road safety, as it has worked for other policy fields in the past. When more theoretical knowledge on relations between outcomes and performance indicators will be available in the future, and when up-to-date, reliable and comparable figures on outcome and performance indicators will be available in years to come, the index could be adapted to more ideal standards.
This chapter provides an overview of existing practices in comparing road safety results within the EU. Furthermore, a history of the background of the Road Safety Index is given as well as a short explanation of its nature, including thoughts on the acceptance of such an instrument by policy makers and politicians.
Acknowledgement
For this report, an extensive quality procedure has been set up. In addition to the internal DaCoTA reviews, a draft report has been commented on by five experts in the fields of road safety and composite indices in September 2012. The report authors are very grateful to Richard Allsop, David Lynam, Luca Persia, Michaela Saisana and Claes Tingvall for taking the time for a thorough reading and review of this draft. Their valuable comments were used to improve the report and to indicate which steps can be made in order to further optimize the Road Safety Index. Of course, the possible flaws and faults in the report are entirely on the account of the present authors.

D4.9 Developing a Road Safety Index
16
1.2. Existing practices in comparing road safety results
Comparing road safety results between countries has been done for a long time. Several initiatives have been developed to provide countries within and outside the European Union with information on their results and progress in road safety (Bax, 2011). The European Union itself has initiated several tools to compare countries on road safety results. Examples range from basic statistical reports to participatory platforms and best practice guidebooks. The Road Safety Quick Indicator (European Commission, 2012), for example, has provided recent trends in road safety since 1988. Based on provisional data, basic road crash indicators such as the number of injury crashes, road fatalities and injuries assist decision-makers in comparing their national situation with that in other Member States. Every month, the provisional data is compared with the provisional data of that same month in the previous year. Yearly, the Statistical pocketbook (European Commission, 2011a) covers energy- and transport-related statistics in Europe. On road safety, road fatalities are mentioned, as well as country rankings. Furthermore, the European Commission publishes an annual leaflet called Road safety, How is your country doing (European Commission, 2011b). This leaflet provides a short overview and a comparison of the road safety performances of EU Member States.
Other initiatives have been developed to share best practices. A few EU research projects have explicitly been aiming at formulating best practices on road safety policy over the last years. Some recent examples are the SUPREME handbook (Van Schagen and Machata, 2010), providing best practices in road safety measures in general, and the ROSA handbook (Pérez Rubio et al., 2011) on best practices for the safety of powered-two-wheelers. Furthermore, the RIPCORD handbook (Sørensen and Elvik, 2008) provided best practices on black spot management and safety analysis of road networks. Also aimed at sharing best practices is the European Road Safety Charter, launched by The European Union in 2005. It comprises of a European participatory road safety platform for enterprises, associations, research institutes, public authorities and civil society. The members commit themselves to carrying out concrete actions and sharing their results to improve road safety in their daily environment. Members have made commitments to actions in user behaviour, vehicle safety, infrastructure, professional transport and crash investigation. The Charter currently has more than 2,000 member organizations.
Not belonging to the official EU policy tools, but nevertheless an influential benchmarking instrument are the PIN-reports and the PIN-awards from the ETSC (European Transport Safety Council). The Road Safety Performance Index (PIN) compares the road safety performances of European Union Member States. The yearly PIN-reports were first published in 2006. The Index measures several areas of road safety, among which road user behaviour, infrastructure and vehicles, as well as general road safety policymaking. Since 2012, the PIN-reports also take into account road safety management. Thirty countries and their research organizations participate in the PIN- project. In addition to the annual reports, ETSC yearly awards the PINaward to a high level policymaker responsible for the best performing country's road safety policy (for example Jost et al., 2012).

D4.9 Developing a Road Safety Index
17
1.3. Previous EU projects on benchmarking In the past, several EU research projects among which SUNflowerNext and SafetyNet, have explored comparing (or benchmarking) road safety results among countries.
The first SUNflower project (Koornstra et al., 2002, co-financed by SafetyNet), comparing road safety in Sweden, the United Kingdom and the Netherlands, aimed at a better insight into the development of policies and programs in the three countries to identify key factors to improve road safety. The three countries were chosen because, although they differ a lot, they have the best road safety level in the world. These road safety levels appeared to have been achieved through continuing planned improvements over recent decades. Their targeted policy areas had been similar, but their implemented policies differed at a detailed level. In a second study, called SUNflower+6, nine countries were studied using a similar method (Wegman et al., 2005). Increasing the amount of countries made it more difficult to interpret the results. Dividing the countries in three, more comparable groups with similar road traffic backgrounds solved this problem.
In the SUNflowerNext study (Wegman et al., 2008), the concept of benchmarking was introduced to focus on learning from the best performing countries. The benchmarking concept concentrates on improving performances by learning from others through identifying best performing countries, understanding why they are best performing, and by adapting outstanding practices from the countries which perform 'best-in-class'. This concept originates from quality control theories in business/the private sector in the late seventies (Blakeman, 2002), but has since also been applied by governmental agencies and non-profit organizations. The concept can also be applied to the road safety field, for example in comparing road safety performances between countries.
SUNflowerNext used the road safety target hierarchy to develop a set of indicators for benchmarking. This hierarchy is further explained in the next section.
The SafetyNet project (Vis et al., 2008) was initiated to develop the European Road Safety Observatory (ERSO, www.erso.eu). ERSO takes into account three different areas: collecting and analysing data at a macroscopic level (CARE, risk exposure data, and safety performance indicators), in-depth-data (independent accident investigation and in-depth accident causation data) and knowledge on road safety topics. Especially the development of road safety performance indicators has been an important progress to come to benchmarking on road safety.
1.4. The road safety target hierarchy The DACOTA-project on the Road Safety Index uses the road safety pyramid as a theoretical basis for benchmarking. The road safety pyramid was originally developed by Land Transport Safety Authority New Zealand (LTSA, 2000) and later applied in the SUNflower-project (Koornstra et al., 2002). Figure 2.1 shows the road safety target hierarchy is shown. The various layers of the pyramid illustrate what is to be understood by policy context, policy performance, and policy outcome.

D4.9 Developing a Road Safety Index
18
Figure 1.1. A target hierarchy for road safety (Koornstra et al., 2002; LTSA, 2000).
The model is built on a triangular hierarchy of layers, narrowing as it rises into the outcome levels. At the top of the pyramid is the social cost of road crashes: specifically the socio-economic consequences of fatalities, injuries, and so on. This level will not be included in the Road Safety Index, because they are calculated on the basis of the second level, the final outcomes. The second level includes the number of killed and injured people involved in road crashes. The third level, safety performance indicators, includes the safety qualities of the system components of road traffic — the safety quality of roads, vehicles, human behaviour and the medical system. The fourth level includes the safety measures and programs which are funded in the fifth, or base level, of the model — structure and culture. Below we pay further attention to each of the levels.
Outcome indicators
Road safety can be assessed in terms of the frequency. of crashes and injuries. Yet, it is clear that simply counting crashes or injuries is often an imperfect indicator of the level of transport safety. There are several reasons for this (ETSC, 2001). First, the number of crashes or injuries is subject to random fluctuations, meaning that a short-term change in the recorded number does not necessarily reflect a change in the underlying, long-term expected number. Second, reporting of crashes and injuries in official accident statistics is incomplete. This means that an observed change in the number of crashes could merely be a change in the propensity to report crashes to the police. Third, a count of crashes says nothing about the processes that produce crashes. In order to develop effective measures to reduce the number of accidents or the number of killed or injured people, it is necessary to understand the process that leads to accidents. Safety performance indicators can serve this end.
In spite of these shortcomings, the outcome indicators are still one of the most significant elements in road safety assessment and management. They provide, so to say in public health terminology, an indication of the state of health, or illness of a society. All road safety activities are essentially directed towards achieving an improvement in the outcome indicators.
D4.9 Developing a Road Safety Index
19
Safety performance indicators
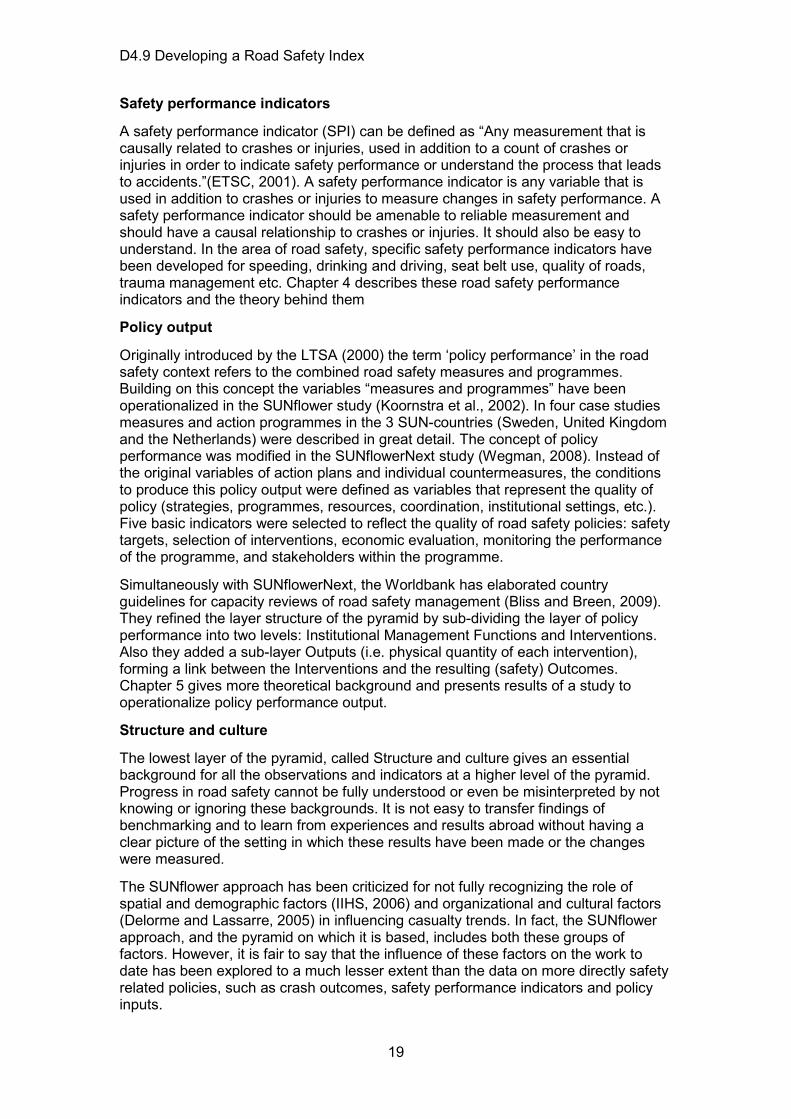
A safety performance indicator (SPI) can be defined as “Any measurement that is causally related to crashes or injuries, used in addition to a count of crashes or injuries in order to indicate safety performance or understand the process that leads to accidents.”(ETSC, 2001). A safety performance indicator is any variable that is used in addition to crashes or injuries to measure changes in safety performance. A safety performance indicator should be amenable to reliable measurement and should have a causal relationship to crashes or injuries. It should also be easy to understand. In the area of road safety, specific safety performance indicators have been developed for speeding, drinking and driving, seat belt use, quality of roads, trauma management etc. Chapter 4 describes these road safety performance indicators and the theory behind them
Policy output
Originally introduced by the LTSA (2000) the term ‘policy performance’ in the road safety context refers to the combined road safety measures and programmes. Building on this concept the variables “measures and programmes” have been operationalized in the SUNflower study (Koornstra et al., 2002). In four case studies measures and action programmes in the 3 SUN-countries (Sweden, United Kingdom and the Netherlands) were described in great detail. The concept of policy performance was modified in the SUNflowerNext study (Wegman, 2008). Instead of the original variables of action plans and individual countermeasures, the conditions to produce this policy output were defined as variables that represent the quality of policy (strategies, programmes, resources, coordination, institutional settings, etc.). Five basic indicators were selected to reflect the quality of road safety policies: safety targets, selection of interventions, economic evaluation, monitoring the performance of the programme, and stakeholders within the programme.
Simultaneously with SUNflowerNext, the Worldbank has elaborated country guidelines for capacity reviews of road safety management (Bliss and Breen, 2009). They refined the layer structure of the pyramid by sub-dividing the layer of policy performance into two levels: Institutional Management Functions and Interventions. Also they added a sub-layer Outputs (i.e. physical quantity of each intervention), forming a link between the Interventions and the resulting (safety) Outcomes. Chapter 5 gives more theoretical background and presents results of a study to operationalize policy performance output.
Structure and culture
The lowest layer of the pyramid, called Structure and culture gives an essential background for all the observations and indicators at a higher level of the pyramid. Progress in road safety cannot be fully understood or even be misinterpreted by not knowing or ignoring these backgrounds. It is not easy to transfer findings of benchmarking and to learn from experiences and results abroad without having a clear picture of the setting in which these results have been made or the changes were measured.
The SUNflower approach has been criticized for not fully recognizing the role of spatial and demographic factors (IIHS, 2006) and organizational and cultural factors (Delorme and Lassarre, 2005) in influencing casualty trends. In fact, the SUNflower approach, and the pyramid on which it is based, includes both these groups of factors. However, it is fair to say that the influence of these factors on the work to date has been explored to a much lesser extent than the data on more directly safety related policies, such as crash outcomes, safety performance indicators and policy inputs.

D4.9 Developing a Road Safety Index
20
In the Structure part of the bottom layer two dimensions are distinguished: physical structure and operational (functional) structure. The physical structure of a country can be described by numerous factors that can be defined as specific long-term conditions contributing to different road safety outcomes. They are typically not, or at least not only, amenable to interventions by conventional road safety policies. Moreover, they are typically modifiable by more general policies, in a long term only. The two groups of structural factors can be distinguished, stationary factors that do not change in time (e.g. geographic and climate conditions) and tractable, dynamic factors that are subject to evolutions or changes in time (e.g. demography, road topology, and urbanization).
The Culture part of the bottom layer contains cultural factors on several levels. Ward et al. (2010) suggest that safety culture can be approached from two perspectives: from the cognitive perspective of an individual road user, and from a social perspective.
From an individual perspective, road safety culture can be defined as the perceptions that people have about what behaviour is normal in their peer group and their expectations as to how the group reacts to violations of these behavioural norms (Wegman, 2012). In terms of road safety, this definition applies to behaviour that either increases crash risk (e.g. speeding) or is protective (e.g. wearing safety belts), as well as behaviour related to acceptance or rejection of traffic safety interventions (e.g. alcohol or speed limits).
A second level of culture can be approached from a societal level. Here we deal with the complex interplay between the individual, the relationship (peers, co-workers, and family members), the community (schools, working places, neighbourhoods) and the societal level. If we accept this approach in trying to influence road safety culture, we have to understand that all four levels can be influenced in order to change the behaviour of individual road users (Wegman, 2012).
1.5. Relationships between layers The pyramid's layers are stacked logically. This enables a top-down approach: understanding developments at the top and explaining them using developments at the bottom. It is also possible to make changes at the bottom and investigate to what extent they cause changes at the top.
The relations between indicators at different layers are very important and must be, conceptually seen, causal for the top four layers. Without these causal relations the pyramid is meaningless. We will use one example as an illustration. Policy interventions will first need to have an effect at the level of the intermediate variables (SPIs) before it can be made credible that the interventions have an effect on crashes and risks. Alcohol legislation will first have to result in fewer alcohol-related crashes and fewer alcohol-related casualties.
Although causality is presumed, not many studies exist which prove the causal relationship between indicators in one layer and another, let alone between the layers as a whole. In Chapter 4, examples are given of studies that researched the relation between road safety performance indicators and road deaths or risk. In Chapter 5, the effort of DaCoTA WP 1 on investigating the relationship between road safety management and road safety outcomes is accounted for. It should be stressed that the Road Safety Index, being a prototype, does not suggest that the causality between indicators are proven, or that the indicators used account for all the variation in road safety scores between countries. Relations between for example performance indicators and outcome indicators have proven to be complex (Tingvall
D4.9 Developing a Road Safety Index
21
et al., 2010). Furthermore, the number of indicators used in the RSI is, due to practical limitations, a small part of the indicators possibly influencing road safety is used. In future research, this number might be extended.
1.6. Towards a Road Safety Index The indicators derived from the different layers of the road safety target hierarchy provide the basis for comparing or benchmarking countries. To compare or benchmark countries, the set of indicators needs to cover the whole road safety field. To form a composite indicator, individual indicators are compiled into a single index on the basis of an underlying model. The composite index measures multi-dimensional concepts which are more complex than a single indicator. Examples of composite indices in other policy fields are for example the Human Development Index for life expectancy, education level and living standards in a country, developed by the United Nations; the Environmental Sustainability Index developed by the Yale and Columbia University in collaboration with the World Economic Forum and the European Commission Joint Research Centre; or the Overall Health System Index used by the World Health Organisation (WHO) (Wegman et al., 2008). Benchmarking the safety performance of countries enables us to monitor and understand differences in road safety outcomes between countries. Furthermore, countries are able to learn from each other by adapting strategies from best performing countries which are 'best-in-class'.
In order to develop the Road Safety Index the study focused on seven sub-objectives:
1. Select valid indicators for each of the three layers of the pyramid
2. Collect reliable data on these indicators
3. Develop a method to combine the indicators of each layer in one composite index
4. Calculate the composite index for each layer from the available data
5. Investigate the value of combine the composite layer-indices in one overall Road Safety Index
6. Visualize the results for a set of European countries
7. Develop a method to take into account structural and cultural differences between countries when comparing them on the preceding indices
The main objective of a Composite Index for road safety is to create a basis for the accelerated improvement of the road safety in a country or region, by summarizing large amounts of information into understandable formats and offering a tool for comparing and benchmarking countries and regions and thereby raising the interest and the sense of urgency on the political level.
Developing a successful composite index for road safety encompasses more than making the right model and finding relevant and useful data. A composite index can only be successful if it is accepted by the (majority of the) road safety community, including decision makers, policy preparers and researchers. Acceptance mostly comes 'from the bottom up': the chosen models will have to be accepted by the research community before the outcomes are accepted by the policy makers and the acceptance of the outcomes by policy makers precedes the acceptance by the decision makers.
D4.9 Developing a Road Safety Index
22
There are a number of conditions for acceptance and subsequent success. These include an optimum between simplicity and complexity of the model, a good fit between the RSI and the more subjective beliefs about the road safety state of a country or region, accepted data quality, continuity, added value to current practices and tools; and careful introduction and promotion.
A good balance between the simplicity and the complexity of the model chosen, is essential for the success of the composite index. A model that is too simple may still gain attention at the highest level, but will not be accepted by the researchers' and policy makers’ level. Moreover, a model that is too simple, will probably not provide enough input for policy makers. A model that is too complex may be accepted by the research community, but can be too difficult to explain to a wider audience and will therefore be an easy prey for the skeptics. The right level of complexity is therefore such that it still captures enough of the complexity of the traffic system, but still allows a wider group of people to understand how the output is related to the input. A growth model can be considered: starting simple and increasing complexity over time.
1.7. New features present study The current study on constructing a Road Safety Index is a natural follow-up of these SUNflower- projects. In SafetyNet and SUNflowerNext, the pyramid structure was developed, the concept of road safety performance indicators are appointed and elaborated and first calculations were made. The RSI aims at adding four issues to the work of the SUNflowerNext project:
1. It will investigate whether indicators for road safety management can be used in the Road Safety Index.
2. It will extend the work on indicators for structural and cultural differences among countries.
3. The indicators will be composed into one score per layer of the pyramid.
4. The composite index will investigate whether integrating the four layers into one score for the composite index as a whole contains added value.
Furthermore, the RSI will take into account all 27 Member States of the European Union, plus Norway, Switzerland and Iceland, an extension in number compared with the earlier studies. The goal of the present study is to establish a first prototype of a Road Safety Index. Because of the nature of prototypes, the concluding chapter includes an overview of possibilities to improve the prototype in the future. The RSI is of most value when it can be routinely executed and updated, ideally on a yearly basis, or else, every few years. We hope that in the future, funds will be found to further develop this prototype and keep the database up to date on a regular basis and high quality.
In the present study, in addition to the work already done in the SUNflowerNext, we aim at developing indicators for the two bottom levels of the pyramid: road safety management and the structural and cultural context of countries. For the structural and cultural context, the SUNflowerNext study already provides a first overview of potential indicators. In this study, we concretize these indicators and extend them somewhat. However, this culture and structure layer could theoretically contain an almost infinite amount of indicators. Therefore, apart from theoretical considerations, also practical considerations are taken into account. For example: data have to be easily, widely and routinely available for a large amount of countries (27 EU countries plus 3). Besides, it should be possible to update the data on a regular basis.

D4.9 Developing a Road Safety Index
23
Structural and cultural indicators are variables which are not, or not directly influenced by road safety policies. In this study, we use the structural and cultural indicators to be able to classify the 30 countries in groups which are as much alike within the group as possible, and as much different from other groups as possible. We do so, because countries vary substantially on structural and cultural characteristics, without being able to influence that (at least, not from a road safety perspective). These structural and cultural characteristics, however, do influence the road safety performance scores of countries. Therefore, it would not only be unfair, but particularly also uninformative to compare all 30 countries with each other. It has turned out that it works better (Wegman et al., 2008) to compare countries within more or less equal groups. That way, countries can learn from a comparable and theoretically reachable ‘best in class’.
The subject of road safety management is also underdeveloped in the SUNflowerNext study. Several other studies have elaborated this subject since. On behalf of the World Bank, Bliss and Breen (Bliss and Breen, 2009) have written guidelines for good road safety management. In Workpackage 1 of DaCoTa, road safety management was the key theme. This project developed a list of criteria for effective road safety management and a theoretical underpinning for these criteria. Within the project, an extensive survey was created which was held in 10 countries. Also the ETSC, in their latest PIN-report (Jost et al., 2012) conducted a short survey in all PIN-countries, based on the extensive DaCoTa survey. All three studies were taken into account in the investigation on the use of road safety management indicators in the index.
After evaluating for which year the data for each indicator could best be used in the RSI, it was studied how the various indicators within one layer of the pyramid could be composed into one score per layer. It was studied whether there were reasons to apply different weights to the indicators or whether it was better to treat them equally. If applicable, the relationship between the total score of indicators and the road safety outcome in terms of road deaths was studied. Composing the indicators into one score per pyramid layer did not cause a loss in information: per country, the individual performance indicator scores are still available, allowing policy makers, politicians and researcher to dig deep into the data and compare their country to other countries on a detailed level.
Finally, the results of the Road Safety Index are visually presented in a picture showing the road safety outcomes and road safety performance indicators for all countries. This composed visual results is an attractive way to present complex calculations to policy-makers and politicians. They can see at one glance how their country is performing, the comparison can be made quantitatively and the result is easy to communicate.
1.8. Reading guide This report contains three parts: a first part on the theoretical background of the Road Safety Index, a second part of the actual composition of the index and a third part with final words on discussions and conclusions. In the first part, on theoretical background, Chapter 2 offers more information about the nature of composite indices in general and the methods used to compose such an index. Chapters 3 to 6 focus on the theoretical underpinning of the indicators for the four layers of the pyramid: the outcome layer (Chapter 3), the layer of safety performance indicators (Chapter 4), the road safety management layer (Chapter 5) and the structure and culture layer (Chapter 6). In the second part on the composition of the index, Chapters 7 to 10 provide the results of respectively the Structure and culture layer (Chapter 7), where countries are grouped into comparable classes, the outcome layer (Chapter 8) and
D4.9 Developing a Road Safety Index
24
the safety performance layer (Chapter 9) and a visual presentation of the Road Safety Index in two dimension in Chapter 10. Finally, Chapter 11 offers a discussion on the advantages and disadvantages of our approach and provides conclusions.
1.9. References Bax, C.A. (2011). Policy instruments for managing EU road safety targets: carrots, sticks or sermons? An analysis and suggestions for the USA. PhD Thesis. SWOV Institute for Road Safety Research, Leidschendam.
Blakeman, J. (2002). Benchmarking: definitions and overview. Center for Urban Transportation Studies, University of Wisconsin-Milwaukee.
Bliss, T., and Breen, J. (2009). Country guidelines for the conduct of road safety management capacity reviews and the specification of lead agency reforms, investment strategies and safe system projects. The World Bank, Washington, D.C.
Delorme, R., and Lassarre, S. (Eds.) (2005). L’Insécurité routière en France dans le miroir de la comparison internationale. Report INRETS Nr. 261, INRETS, Arcueil.
European Commission (2010). Towards a European road safety area: policy orientations on road safety 2011-2020 COM(2010) 389 final. European Commission, Brussels.
European Commission (2011a). EU transport in figures; statistical pocketbook 2011. Publications Office of the European Union, Luxembourg.
European Commission (2011b). Road Safety 2011: how is your country doing ? European Commission, Brussels.
European Commission (2012). Road safety trends. Referred 30 October 2012 at http://ec.europa.eu/transport/road_safety/observatory/trends_en.htm.
ETSC (2001). Transport safety performance indicators. European Transport Safety Council, Brussels.
Hafen, K., Lerner, M., Allenbach, R., Verbeke, T., Eksler, V., Haddak, M., Holló, P., Arsenio, E., Cardoso, J., Gomes, S., Papadimitriou, E., Amelink, M., Goldenbeld, C., Mathijssen, R., Louwerse, R., Morsink, P., Schoon, C., Vis, M., Gitelman, V., Hakkert, S., Assum, T., Morris, A., and Rackliff, L. (2008). Deliverable D3.1: State of the art report on Road Safety Performance Indicators. European Commission, Directorate-General Transport and Energy, Brussels.
IIHS (2006). Bad statistics lead to misinformation. Insurance Institute for Highway Safety IIHS Status Report, 41 (4). Insurance Institute for Highway Safety IIHS, Arlington, USA.
Jost, G., Allsop, R., and Steriu, M. (2012). A challenging start towards the EU 2020 Road Safety Target; 6th road safety Performance Index PIN report + Methodological note. European Transport Safety Council ETSC, Brussels.
Koornstra, M., Lynam, D., Nilsson, G., Noordzij, P., Petterson, H.-E., Wegman, F., and Wouters, P. (2002). SUNflower: a comparative study of the development of road safety in Sweden, the United Kingdom, and the Netherlands. SWOV Institute for Road Safety Research / Transport Research Laboratory TRL / Swedish National Road and Transport Research Institute VTI. Leidschendam / Crowthorne / Linköping.
LTSA (2000). Road safety strategy 2010. A consultation document. National Road Safety Committee, Land Transport Safety Authority LTSA, Wellington.
Pérez Rubio, A., Molinero, A., Plaza, J., Chacel, J.L., Mansilla, A., Reyes, J.M., Toribio, J.C., Forte, R., Porto, A., Diez, J., and Forjaz, D. (2011). European handbook of best practices on powered-two-wheeler's safety. ROsa SAfety for the motorcyclists ROSA Project. European Commission, Directorate-General Mobility and Transport (DG MOVE), Brussels.

D4.9 Developing a Road Safety Index
25
Sørensen, M., and Elvik, R. (2008). Black spot management and safety analysis of road networks; best practice guidelines and implementation steps. Deliverable D6 of the RiPCORD-iSEREST project. European Commission, Directorate-General for Transport and Energy (TREN), Brussels.
Tingvall, C., Stigson, H., Eriksson, L., Johansson, R., Krafft, M., and. Lie, A. (2010). The properties of Safety Performance Indicators in target setting, projections and safety design of the road transport system. Accident Analysis and Prevention, 42, pp. 372–376.
Van Schagen, I.N.L.G., and Machata, K. (2011). Best practices in road safety; handbook for measures at the country level. Publications Office of the European Communities Eur-OP, Luxembourg.
Vis, M. (Ed.). (2008). Deliverable D3.1: State of the art report on Road Safety Performance Indicators. European Commission, Directorate-General Transport and Energy, Brussels.
Ward, N.J., Linkenbach, J., Keller, S.N., and Otto, J. (2010). “White paper on traffic safety culture” in the series: White papers for “Toward zero deaths: a national strategy for highway safety” – White Paper No.2, Western Transportation Institute, College of Engineering Montana State University.
Wegman, F., Eksler, V., Hayes, S., Lynam, D., Morsink, P., and Oppe, S. (Eds.) (2005). SUNflower +6: a comparative study of the development of road safety in the SUNflower +6 countries : final report. SWOV Institute for Road Safety Research, Leidschendam.
Wegman, F., Commandeur, J., Doveh, E., Eksler, V., Gitelman, V., Hakkert, S., Lynam, D., and Oppe, S. (2008). SUNflowerNext: towards a composite road safety performance index. SWOV Institute for Road Safety Research, Leidschendam.
Wegman, F. (2012). Driving down the road toll by building a Safe System Prepared by Professor Fred Wegman Adelaide Thinker in Residence 2011–2012. Government of South Australia, Adelaide.


D4.9 Developing a Road Safety Index
PART I: THEORETICAL BACKGROUND

D4.9 Developing a Road Safety Index
29
2. THE THEORY OF CREATING A COMPOSITE INDEX
Elke Hermans IMOB
Yongjun Shen IMOB
2.1. Introduction The construction of composite indicators or indices (CIs) concerns a mathematical aggregation of a set of individual indicators that measures multi-dimensional concepts but usually has no common units of measurement (Saisana and Tarantola, 2002). Currently, CIs are increasingly recognized as a useful tool in policy analysis and public communication, which is due to their remarkable ability to integrate large amounts of information into understandable formats that are often easier to interpret than finding a common trend in many separate indicators. The main advantages and disadvantages of using CIs are summarized in Saisana and Tarantola (2002) and OECD (2008). This chapter introduces the theory of creating a composite indicator or an index. Although we emphasize the road safety domain, existing indices in various fields are outlined first (Section 2.2), followed by previous research on creating a Road Safety Index (Section 2.3). Next, the different steps in the creation of an index are discussed (Section 2.4) followed by a description of different weighting schemes and the ideas behind them. The chapter closes with concluding remarks in Section 2.6.
2.2. Indices in other fields During the last decade, all the major international organizations such as the Organisation for Economic Co-operation and Development (OECD), the United Nations (UN), the European Commission (EC), and the World Economic Forum have been producing CIs in a wide variety of fields. Examples are listed below:
Economy • Internal Market Index (EC) • Product Market Regulation Index (OECD) • Macro-economic Performance Index (Ramanathan) • e-Business Readiness (EC)
Society • Human Development Index (UN) • Overall Health System Achievement Index (World Health Organization) • Sustainable Society Index (van de Kerk and Manuel)
Governance • Governance Indicators (World Bank) • World Governance Assessment (Overseas Development Institute)
Environment • Environmental Sustainability Index (Columbia University and Yale University) • Sustainable Development Index (UN)

D4.9 Developing a Road Safety Index
30
• Concern about Environmental Problems (Parker)
Innovation/Technology • Innovation Index (OECD) • Innovation Capacity Index (World Economic Forum) • Technology Achievement Index (United Nations Development Programme) • National Innovation Capacity Index (Porter and Stern) • Knowledge-Based Economy (EC) • General Indicator of Science and Technology (National Institute of Science
and Technology Policy)
No matter in which field, the index is commonly produced based on several indicators or sub-indices related to that field, which are then aggregated following some methodology to give an overall score for each country. Frequently, the country index scores are used to present the country rankings through a “League Table”. An alternative form of presentation is categorical classifications based on a range of the numerical value of these indices. Another form is to show—through colored bars or arrows—the progress or setbacks in a specific policy area (Bandura, 2008). For more information on these indices, we refer to NISTEP (1995), Porter and Stern (1999), Saisana and Tarantola (2002), Freudenberg (2003), Tarantola et al. (2004), Munda (2005), Saisana et al. (2005), OECD (2008), and Singh et al. (2009).
2.3. Previous road safety indices In the field of road safety, some research efforts have also been devoted to the creation of an index for the sake of meaningful national or sub-national comparison and monitoring of road safety performance. Al-Haji (2007) suggested a composite index, termed a road safety development index (RSDI) by him, consisting of three focus themes of the road safety domain: product focus (fatality rates), people focus (road user behaviour), and system focus (safer vehicles, safer roads, socio-economic level, enforcement, and organizational performance). The index was then applied for the comparison of road safety progress in highly motorized countries (eight European countries) on the one hand and less motorized countries (five Southeast Asian countries) on the other hand. In doing so, four weighting methods were adopted, which were equal weighting, expert judgments, subjective weights based on previous experience, and principal component analysis. The empirical and theoretical assessments indicated that the proposed RSDI could give a broader picture of the road safety situation in a country than single indicators and could serve as a simple and easily understandable tool for policy makers and the public.
Hermans et al. (2008) developed a Road Safety Index methodology which was applied to a set of safety performance indicators (SPIs), related to six risk domains, i.e., alcohol and drugs, speed, protective systems, vehicle, roads, and trauma management. Five weighting approaches were investigated to combine the separate indicators into one overall index for 21 European countries, which were: factor analysis, budget allocation, analytic hierarchy process, data envelopment analysis, and equal weighting. The results were further compared with one of the road safety risk indicators, which was the number of fatalities per million inhabitants. The study concluded that comparing the performance of countries in terms of road safety by means of an index at the intermediate outcome level (i.e., SPI level) enabled earlier and goal-oriented action.
Furthermore, in the SUNflowerNext study (Wegman et al., 2008, Gitelman et al., 2010), three different types of performance indicators, i.e., road safety performance indicators, implementation performance indicators, and policy performance indicators, were distinguished. Moreover, a composite Road Safety Index combining

D4.9 Developing a Road Safety Index
31
the indicators in each layer of the road safety pyramid was explored. Two weighting schemes, i.e., principal component analysis and factor analysis, were examined based on the data collected for 27 European countries. The analysis revealed that such an index gave a more enriched picture of road safety and the countries' ranking based on the combination of different indicators was not necessarily similar to the traditional ranking of countries based only on mortality or fatality rates.
Recently, Shen (2012) carried out research regarding the combination of risk indicators on the one hand and a hierarchy of safety performance indicators on the other hand for the sake of meaningful road safety benchmarking of 28 European countries. Based on the identification of six leading road safety risk factors (i.e., alcohol, speed, protective systems, vehicle, road, and emergency medical services) within the three main road transport components (i.e., road user, vehicle, and infrastructure), a comprehensive set of hierarchically structured safety performance indicators was developed to capture the road safety performance of a country. The technique of data envelopment analysis and its various extensions were investigated to develop a composite road safety performance index for cross-country comparison. In doing so, the hierarchical structure of the indicators was taken into account, and some practical challenges related to data (including missing values and qualitative indicators) were explored. The constructed road safety performance index showed a high correlation with the overall road safety risk from the view of the final outcome level, and useful insight in the areas of underperformance in each country was gained.
2.4. Index methodology A general objective of most of the indices that can nowadays be found in the literature is the ranking of countries and benchmarking according to some aggregated dimensions. As a consequence, the way these indices are constructed and used seems to be a very important research issue from both the theoretical and operational point of view. More specifically, the construction of an index involves several methodological stages: the selection of indicators, data collection and preparation (such as normalization, imputation of missing values, etc.), the assignment of weights to the different indicators, the choice of aggregation models, and so on. Other aspects can be added and the sequence of the different steps may slightly change between studies. Based on a number of studies (e.g., Salzman, 2003; Nardo et al., 2004), and Yale Center for Environmental Law and Policy and Center for International Earth Science Information Network, 2006), the following steps should be used for the creation of the Road Safety Composite Index (see also Hermans, 2009).
1. Selecting indicators: this first step decides on which indicators to combine in an index. This step is mainly theory-driven. Possible indicators can be listed and evaluated based on a set of selection criteria. This results in a set of best road safety indicators.
2. Collecting indicator data: in order to be able to compute an index score, data is required. In particular, the availability of high quality data influences the final selection of indicators to combine in the index. Ideally, time series data for all indicators deduced in the previous step are easily accessible in reliable databases for numerous countries. However, in practice, a lack of reliable, comparable data and limited country coverage often imply the use of ‘best available’ indicators. As the different road safety aspects require their own databases (i.e., one overall data source having information on all aspects is nonexistent), indicator data from several sources need to correspond to the same set of countries and the same time period.

D4.9 Developing a Road Safety Index
32
3. Data preparation: first, each indicator is studied separately. By means of visualization and basic summary statistics, an idea about the distribution of the indicator values can be obtained. Extreme values might need a closer look as they could become unintended benchmarks. Next, the indicator data set is studied as a whole. A possible necessary step (this is related to the choice of the index methodology) is normalization, aimed at rendering all data comparable. As the indicators might differ in magnitude, be expressed in different units or expose great variation with respect to the mean, they may cause bias in the index. Often used methods for normalization are standardization, rescaling and rank numbers (Freudenberg, 2003). Furthermore, the imputation of missing values in the data set is dealt with at this stage. Several possible methods can be considered in this respect, like mean substitution, regression imputation, expectation-maximization imputation or multiple imputation (e.g., Wilmots et al., 2011). Finally, some multivariate analysis techniques could be applied in order to gain insight into the degree of correlation between the various indicators, clusters of similar countries, etc.
4. Weighting: an index, being a weighted combination of a set of indicators, necessitates the assignment of an appropriate weight for each indicator, especially when several safety issues are covered by unequal numbers of indicators per safety issue. The set of weights has a large impact on the index scores. In the literature, several weighting methods can be found, none of them being a priori the best technique. Weights based on statistical methods (such as factor analysis), participatory methods (e.g., budget allocation), optimization methods (like data envelopment analysis) and equal weighting are examples of commonly used techniques. Below, the issue of weighting and the evaluation of relevant methods for the problem under study are discussed in more detail.
5. Aggregation: the mathematical formula for combining the indicators needs to be selected. Arithmetic averaging is most often used although other aggregation operators could be tested as well.
6. Robustness testing: it is important to rigorously test the robustness of the index to the assumptions and methodological choices made. The uncertainty in the final result with respect to the indicators included, the imputed missing values, the normalization technique chosen, the selected weighting method and the applied aggregation operator can be quantified.
7. Computing, visualizing and evaluating the index scores: using the (imputed, normalized) indicator data, the weights and the aggregation operator, a final index score can be calculated for each country. The results should be visualized and presented in a clear way. First of all, an index score per layer (i.e., the road safety outcome layer, the safety performance layer and the road safety management layer) will be computed, based on the previous steps. Afterwards, the relationship between these road safety indices (and possibly other related indicators or indices) will be assessed.
Although all of the above steps together result in a final (set of) index score(s) and ranking(s), the aspect of weighting plays a central role in the development of the composite index. Ideally, the weighting process should be made explicit and should be accepted by an as wide as possible public. However, this is practically impossible, as among several methods existing in the composite index literature for weighting the different indicators, there is no best one to use in all circumstances. In the following section, we evaluate a number of often applied weighting methods, which are promising for the case of the Road Safety Index.
D4.9 Developing a Road Safety Index
33
2.5. Weighting schemes In Table 2.1, six commonly used weighting schemes with their main idea are summarized, and a comparative analysis of their advantages and limitations is offered. The techniques that are discussed involve equal weighting, two participatory weighting methods (i.e., budget allocation, and analytic hierarchy process), and three statistical weighting methods (i.e., regression analysis, principal components analysis/factor analysis, and data envelopment analysis).
First, a brief description of each of the six methods is given.
• In case of equal weighting, the same weight is assigned to each indicator. Since the weights usually sum up to one, each indicator weight equals 1/the number of indicators in the analysis. Equal weighting is the simplest technique, yet it has some limitations. The most important drawback is that no insight is gained into the difference in importance of the indicators. As a result, equal weighting is not of great value for policymakers (nor researchers). In addition, it is unlikely that the resulting weights are similar to the real, unknown weights. Moreover, when two or more indicators are related to the same area, there is a risk of double weighting or overweighting this area in relation to other areas (Directorate for Science Technology and Industry, 2003). Equal weighting however, can be used if all indicators are uncorrelated or if they are all highly correlated.
• Budget allocation is one of the commonly used subjective weighting methods. In this technique, a selected panel of experts is asked to distribute a given budget over the indicators in such a way that spending more on an indicator implies that they want to stress its importance. In general, this method has four phases (OECD, 2008). First, the experts have to be selected. It is important to gather experts with a wide spectrum of knowledge and experience. Second, each expert allocates the predetermined budget of X points to the indicators. In a third step, weights are calculated from these figures. More specifically, the share of budget allocated to an indicator equals its weight. The fourth step is an optional one in which the procedure is iterated until convergence is reached.
• Budget allocation is a simple and often used weighting technique, but also with some limitations. The selection of experts is crucial and should be well-considered. Moreover, the method may not measure the importance of a specific indicator but the need for political intervention in that dimension (OECD, 2008). In addition, the maximum number of indicators over which to distribute the budget is limited to ten, enabling the expert to keep an overview (Saisana and Tarantola, 2002).
• Analytic hierarchy process, developed by Saaty in the early 1970s, is a comprehensible and popular technique for deducing weights by facilitating the decomposition of a problem into a hierarchical structure. In this technique, experts are asked to judge the relative (road safety) contribution of each indicator compared to another indicator. Values are given on a scale of 1 to 9, in which a preference of 1 indicates equality between two indicators, while a preference of 9 indicates that the indicator is extremely more important than the other one. A comparison matrix is thus obtained, and the relative weights of the individual indicators are calculated using an eigenvector. To use this method in practice, consistency, reflecting the soundness of judgment, is an important aspect. It is advisable to keep the number of indicators small and to define independent or at least sufficiently different indicators. Besides possible inconsistency, subjectivity is another characteristic of this method, making the selection of the expert panel
D4.9 Developing a Road Safety Index
34
crucial. Judgment is affected by experience, depth of knowledge, relative intelligence, personal involvement, etc (Saaty, 1980).
• In regression analysis, the ‘linkage’ between a set of indicators and a single output is estimated (e.g., National Innovation Capacity index). Specifically, the set of indicators is combined so as to represent the desired objective. A regression model, essentially linear, is then constructed to calculate the relative weights of the indicators. This method can handle a large number of variables of different types, and can examine the relationship among these variables. However, the primary limitation is in the underlying assumptions of normality, homoscedasticity, and serial independence of regression residuals. Also, Bessent et al. (1982) indicated that major difficulties arise when the regression analysis is used in multiple output cases due to the implicit impact on outputs having the same input resources. In addition, it is further argued that if the concept to be measured could be represented by a single output, then there would be no need for developing a composite indicator in the first place (Muldur, 2001).
• Principal component analysis/Factor analysis is often used to reduce the dimensions of a problem (Sharma, 1996). In particular, a smaller number of factors will be deduced from the set of indicators. Principal component analysis (PCA), and more specifically factor analysis (FA), groups together individual indicators which are collinear to form a composite indicator that captures as much as possible of the information common to individual indicators. Each factor (usually estimated using PCA) reveals the set of indicators with which it has the strongest association. The idea under PCA/FA is to account for the highest possible variation in the indicator set, using the smallest possible number of factors. Therefore, the composite index no longer depends upon the dimensionality of the data set but rather is based on the “statistical” dimensions of the data.
• The use of PCA/FA in the composite index field (either to examine the interrelationships between the indicators or for determining weights) is not rare. However, the most important drawback of this technique is that weights are based on correlations which do not necessarily correspond to the real-world links between the phenomena being measured (Saisana and Tarantola, 2002). In addition, deducing weights from FA requires a certain level of correlation in the data set (to reduce the problem in a number of factors), a justified selection of the optimal number of factors (as the weights depend on the chosen number of factors) and clear rotation results (because only the highest rotated factor loadings are used in the computation of weights). To conclude, this weighting method is most valuable in case several (sufficiently correlated) indicators per aspect are considered.
• Data envelopment analysis, developed by Charnes et al. (1978), is an optimization technique that determines the best possible weights, i.e., the weights resulting in the highest index score for a country. This implies that dimensions on which the country performs relatively well get a higher weight. By solving a linear programming problem, a composite index score between zero and one can be obtained for each country, with a higher value indicating a better relative performance. Compared to the previously discussed weighting methods, DEA is different. It is known as the ‘benefit of the doubt’ (BOD) approach (Cherchye et al., 2007), in which different indicator weights are obtained for each country individually, and the relative performance of a particular country is assessed by taking the performance of all other countries into account. In this way, key problems on road safety can be identified for each country separately, and policy-makers could not complain about unfair weighting, because each country is put in
D4.9 Developing a Road Safety Index
35
its most favorable light, and any other weighting scheme would generate a lower composite score. In other words, if a country turns out to be underperforming based on the most favorable set of weights, its poor performance cannot be traced back to an inappropriate evaluation process (Shen et al., 2012). Moreover, additional restrictions (e.g., based on expert information) can easily be incorporated leading to more acceptable weights (Cherchye et al., 2006). However, the weights calculated from this technique do not sum up to one, which makes the comparison with weights from other methods impractical.
• To conclude, DEA is a performance measurement technique in which the most favorable weights are selected both satisfying the imposed restrictions and resulting in the most optimal score. The results are influenced by the countries in the data set, hence this approach is about relative performance. This weighting method has already been used for a number of indices (see e.g., Cherchye et al., 2006), and it is most valuable when some expert opinions are available and there is no agreement on the correct set of weights.
In addition to the aforementioned weighting methods, there are still some other options, such as distance to targets and conjoint analysis which have for example respectively been used in the Human Development Index and the Indicator of Quality of Life in the City of Istanbul. However, for the distance to targets method, there are no international/national targets for all indicators available in the road safety context. The weakness of the conjoint analysis is that it needs a pre-specified utility function.
In this study, it is agreed that the selected indicators have different relationship with road safety or play different roles in the contribution to road crashes or casualties. Therefore, equal weighting is not considered suitable for this study. Moreover, it needs to be taken into account that a number of weighting methods require some input, such as a panel of experts for the subjective weighting methods. As a result, one of the objective weighting methods, i.e., data envelopment analysis, is chosen for Road Safety Composite Index construction. Its strongest point is that the weights are endogenously determined and derived directly from the data. More importantly, valuable information can be deduced from this method, such as the identification of benchmark(s) for an underperforming country and the detection of aspects on which each country should focus (Shen et al., 2012). All this cannot be (fully) realized by using regression analysis or principal component analysis/factor analysis. The detailed description of this technique will be elaborated in the following chapters.

D4.9 Developing a Road Safety Index
36
Table 2.1. Summary of six commonly used weighting methods. Adapted from Hermans et al. (2008) and OECD (2008).
Method Applied in the following composite indices Main idea Main advantage Main limitation
Equal weighting
• Innovation Index (OECD) • Environmental Sustainability Index
(WEF) • Technology Achievement Index
(UN) • Knowledge-Based Economy (EC) • Composite Leading Indicators
(OECD)
• Weights will be equally assigned to all the indicators
• Simple • No insight in indicator importance
Participatory weighting methods
Budget allocation
• Employment Outlook (OECD) • e-Business Readiness (EC) • Overall Health System
Achievement Index (WHO)
• Experts are asked to distribute a given budget over the indicators
• Weighting is based on expert opinion not on technical manipulations
• High transparency • Can be used both for
qualitative and quantitative data
• Allocating a certain budget over a too large number of indicators may lead to serious cognitive stress for the experts
Analytic hierarchy process
• EU new economy policy indicators (EU)
• Experts’ opinions are systematically extracted by means of pairwise comparisons
• People's beliefs are not always consistent and the judgment can be affected by many factors.
Statistical weighting methods
Regression analysis
• National Innovation Capacity Index (Porter and Stern)
• To calculate the ‘linkages’ between a number of indicators and a single output
• Examine the relationship among the indicators and the output
• Difficult to find one output
Principal component analysis/ Factor analysis
• General Indicator of Science and Technology (NISTEP)
• Product market regulation index (OECD)
• Internal Market Index (EC)
• To account for the highest possible variation in the indicator set using the smallest possible number of factors
• Indicators can be grouped according to their degree of correlation
• Correlations do not necessarily represent the real influence of the indicators on the phenomenon that the composite index is measuring
Data envelopment analysis
• Technology Achievement Index (Cherchye et al.)
• Human Development Index (Mahlberg and Obersteiner)
• Macro-economic Performance Index (Ramanathan)
• To determine the most optimal weights for each country and thereby distinguish between best performing and underperforming countries (also known as the “benefit of the doubt” approach)
• Useful in determining national policy priorities in case of country specific weights
• A specific benchmark can be derived based on a linear combination of best performances
• Weights are not comparable with those of other methods

D4.9 Developing a Road Safety Index
37
2.6. Concluding remarks We summarize the main conclusions of this chapter as follows:
• Composite indices are increasingly recognized as a useful tool in policy analysis and public communication. A large number of composite indices have been developed and applied in a wide range of fields during the last decades.
• In the road safety context, the development of road safety composite indices is also valuable in order to reduce the large amount of information and to provide a meaningful tool for national (or sub-national) comparison and monitoring of road safety performance.
• Although the development of road safety composite indices is recommended, and some research efforts have already been devoted, care should be taken to ensure that the construction process of the index is transparent and follows sound conceptual principles.
• The construction of a Road Safety Composite Index involves several methodological stages. Having selected the set of indicators to combine in the road safety outcome index (layer 1), respectively the road safety performance index (layer 2) and the road safety management index (layer 3), and having obtained and prepared the indicator data, the next step is to apply the appropriate weighting schemes in order to deduce a weight for each indicator, and to compute an index score for each country subsequently. However, different weighting methods have their own advantages and limitations, and imply different end results. In general, no weighting system is above criticism.
• For this study, the technique of data envelopment analysis, known as the ‘benefit of the doubt’ approach, is chosen to construct the road safety composite indices, mainly due to the fact that the weights are retrieved from the observed data themselves, and more importantly, valuable information can be deduced, such as the identification of benchmark(s) for each underperforming country and the detection of aspects on which each country should focus.
2.7. References Al Haji, G. (2007). Road safety development index (RSDI): Theory, philosophy and practice. Department of Science and Technology. PhD Thesis, Linköping University.
Bandura, R. (2008). A survey of composite indices measuring country performance: 2008 Update. United Nations Development Programme - Office of Development Studies.
Bessent, A., Bessent, W., Kennington, J., and Reagan, B. (1982). An application of mathematical programming to assess productivity in the Houston independent school district. Management Science, 28 (2), pp. 82-107.
Charnes, A., Cooper, W.W., and Rhodes, E. (1978). Measuring the efficiency of decision making units. European Journal of Operational Research, 2, pp.429-444.
Cherchye, L., Moesen, W., Rogge, N., van Puyenbroeck, T., Saisana, M., Saltelli, A., Liska, R., and Tarantola, S. (2006). Creating composite indicators with DEA and robustness analysis: The case of the technology achievement index. Catholic University of Leuven and Joint Research Centre.
Cherchye, L., Moesen, W., Rogge, N., and Van Puyenbroeck, T. (2007). An introduction to ‘Benefit of the doubt’ composite indicators. Social Indicators Research, 82, pp. 111-145.

D4.9 Developing a Road Safety Index
38
Directorate for Science Technology and Industry (2003). Composite indicators of country performance: a critical assessment. DSTI/IND(2003)5. Organization for Economic Co-operation and Development OECD, Paris.
Freudenberg, M. (2003). Composite indicators of country performance: a critical assessment. STI working paper 2003/16, Organization for Economic Co-operation and Development OECD, Paris.
Gitelman, V., Doveh, E., and Hakkert, S. (2010). Designing a composite indicator for road safety. Safety Science, 48, pp. 1212–1224.
Hermans, E., Van den Bossche, F., and Wets, G. (2008). Combining road safety information in a performance index. Accident Analysis and Prevention, 40, pp. 1337-1344.
Hermans, E. (2009). A methodology for developing a composite road safety performance index for cross-country comparison. PhD thesis,.
Muldur, U. (2001). Technical annex on structural indicators. Two composite indicators to assess the progress of Member States in their transition towards a knowledge-based economy. Directorate-General for Research RTD, Brussels.
Munda, G. (2005). Multi-criteria decision analysis and sustainable development. In: Figueira, J, Greco, S., and Ehrgott, M. (Eds.). Multiple-criteria decision analysis: State of the art surveys. Springer International Series in Operations Research and Management Science, New York, pp. 953-986.
Nardo, M., Tarantola, S., Saltelli, A., Andropoulos, C., Buescher, R., Karageorgos, G., Latvala, A., and Noel, F. (2004). The e-business readiness composite indicator for 2003: A pilot study. Ispra: Joint Research Centre. EUR 21294 EN.
NISTEP (1995). Science and technology indicators. Technical report, Report No. 37. National Institute of Science and Technology Policy NISTEP, Japan.
OECD (2008). Handbook on constructing composite indicators: Methodology and user guide, www.oecd.org/publishing/corrigenda, Organisation for Economic Co-operation and Development OECD, Paris.
Porter, M.E., and Stern, S. (1999). The new challenge to America’s prosperity: Findings from the innovation index. Council on Competitiveness, Washington, D.C.
Saaty, T.L. (1980). The analytic hierarchy process. McGraw-Hill, USA.
Saisana, M., Tarantola, S., Schulze, N., Cherchye, L., Moesen, W., and Van Puyenbroeck, T. (2005). KEI State-of-the-Art Report on Composite Indicators, Deliverable 5.1.
Saisana, M., and Tarantola, S. (2002). State-of-the-art report on current methodologies and practices for composite indicator development. EUR 20408 EN Report. the Joint Research Center of European Commission, Ispra.
Salzman, J. (2003). Methodological choices encountered in the construction of composite indices of economic and social well-being. Centre for the Study of Living Standards, Ottawa.
Sharma, S. (1996). Applied multivariate techniques. John Wiley and Sons, New York.
Shen, Y. (2012). International benchmarking of road safety performance and development using indicators and indexes: Data envelopment analysis based approaches. PhD thesis, Hasselt University.
Shen, Y., Hermans, E., Brijs, T., and Wets, G. (2012). Data envelopment analysis for composite indicators: a multiple layer model. Social Indicators Research. DOI: 10.1007/s11205-012-0171-0.
Singh, R.K., Murty, H.R., Gupta, S.K., and Dikshit, A.K. (2009). An overview of sustainability assessment methodologies. Ecological Indicators, 9, pp. 189-212.
D4.9 Developing a Road Safety Index
39
Tarantola, S., Liska, R., Saltelli, A., Leapman, N., and Grant, C. (2004). The internal market index 2004.
Vis, M.A. (Ed.) (2005). State of the art report on road safety performance indicators. D3.1 of the EU FP6 project SafetyNet.
Wegman, F., Commandeur, J., Doveh, E., Eksler, V., Gitelman, V., Hakkert, S., Lynam, D., and Oppe, S. (2008). SUNflowerNext: Towards a composite road safety performance index. SWOV Institute for Road Safety Research, Leidschendam.
Wilmots B., Shen Y., Hermans E., and Ruan D. (2011). Missing data treatment: Overview of possible solutions. Policy Research Centre Mobility and Public Works, track Traffic Safety, RA-MOW-2011-002, Diepenbeek, pp. 1-35.
Yale Center for Environmental Law and Policy and Center for International Earth Science Information Network (2006). Pilot 2006 environmental performance index. Yale University and Columbia University.
D4.9 Developing a Road Safety Index
40
3. ROAD SAFETY OUTCOME INDICATORS
Charles Goldenbeld SWOV
Victoria Gitelman Technion
3.1. Introduction The upper layer of the road safety target hierarchy, of the road safety management pyramid, is constituted by Safety Outcome Indicators. This chapter describes some of the theoretical and empirical foundations of safety outcome indicators. The chapter starts with an explanation of the relationship between risk and exposure, and the choice of exposure measurements (Section 3.2). The question how to compare countries on road safety outcomes is discussed in Section 3.3. Section 3.4 describes the data considerations and choice of outcome indicators for the Road Safety Index. The chapter is ended with some closing remarks in Section 3.5.
3.2. Risk and exposure In the field of road safety, the concept of risk is used as a way to quantify the level of road safety relative to the amount of exposure, as opposed to the absolute level of safety as measured by the absolute number of crashes or casualties (Hakkert and Braimaister, 2002). A frequently used general definition of risk is the probability of a crash occurring (Hauer, 1982; Hakkert and Braimaister, 2002)
Rumar (1999) defines the road safety problem as a function of exposure, crash risk and injury risk: I = E x C/E x I/C, where I is the number of people injured, E is exposure, C/E is the probability of a crash (crash risk), I/C is the probability of being injured in a crash (injury risk). Thus, countermeasures to improve road safety can be effective through reducing exposure (E), reducing the risk of an accident (C/E) or reducing the risk of injury (I/C).
It is also possible to take the time trend element into consideration (Hakkert and Braimaister, 2002).The absolute size of the safety problem, expressed in either the number of crashes or the number of casualties (SAFETY) of a certain severity results from multiplying the degree of risk, which has a trend that has a relation with the trend in exposure, which can be expressed as:
Safety (severity) = Risk (trend) x Exposure (trend).
In road safety analyses, different exposure measures are used, according to data availability and quality, as well as the particular objective of the analysis. In the SafetyNet-project, an inventory was made of exposure data need of EU countries (Yannis et al. 2008). Road safety analyses tasks may have diverse aims, and different exposure measures may be more or less useful in each case. A very general distinction is between two analysis tasks:
1. Health risk analyses, referring to more macroscopic and epidemiological approaches aiming to assess the risk of the entire population.
D4.9 Developing a Road Safety Index
41
2. Traffic risk analyses, referring to more detailed and transport-oriented analyses, aiming to assess the risk of various components of the transportation system (road users, vehicles, road network).
Mobility, or the distance travelled, is often seen as the best measure of exposure. For a variety of reasons, however, it can be meaningful to consider alternative measures of exposure (Hakkert and Braimaister, 2002; Yannis et al., 2005). To begin with, there may be a lack of mobility data, thus necessitating the use of alternative exposure measures. Furthermore, mobility may not be the best measure to use for specific issues, like comparing health risk between countries.
In international comparisons and for trend studies on a national level, in many cases, the number of inhabitants or the number of vehicles is selected as alternative exposure measure. The number of fatalities per 100,000 inhabitants is also referred to as the (traffic) mortality rate. In addition to international comparisons, this measure is also used to make comparisons between developments in the rates of various causes of death.
The risk as the number of fatalities, or casualties, per number of vehicles is another proxy to the risk of travel. In this context, the number of vehicles is selected as a proxy to the number of vehicle kilometres travelled, which is a variable that is much more difficult to obtain reliably in many countries. Obviously, if a certain type of vehicle is considered, one should use only relevant accident figures for the type of vehicle under consideration.
The advantage of these risk measures is that they use fairly reliable data that are generally widely available. It is therefore possible to conduct such international comparisons. The same cannot be said when attempting to calculate the risk of injury. Between countries, large differences exist in the reporting procedures of road casualties. Various levels of under-reporting of crashes and casualties exist in different countries (Nilsson, 1997; Yannis et al., 2005).
It should be noted that the two risk measures - fatality per population unit and fatality per vehicle unit - behave very differently over time when comparing different countries. It should also be noted that both measures are very comprehensive, but do not differentiate between different segments of the population (by age group, sex, urban or rural, etc.) and different types of vehicles.
3.3. Comparing safety outcomes of countries The fourth layer of the safety pyramid contains the safety outcomes, which are basically the number of persons killed or injured in traffic.
At a crude level road safety of countries can be compared by looking at total number of fatalities, casualties, fatal crashes or injury crashes. Obviously, this does not give much insight in the safety performance of these countries. After all, in countries with a large population, more crashes and casualties will happen than in countries with a small population, without this being indicative of the safety level. Therefore, we need to correct for differences in population size and, related to that, the mobility. For a meaningful comparison of countries, numbers of people killed or injured are typically 'normalized', resulting in fatality rates, e.g. fatalities per inhabitant, vehicle type, or kilometres travelled. Besides, the comparison may specifically concern vulnerable groups of road users, e.g. pedestrians, cyclists, motorized two-wheelers etc. Furthermore, different casualty rates may apply to different age groups or modes of transport, for example bicyclists. To enable consideration of these differences, we look at the casualty rate per subgroup, for instance at the number of moped casualties divided by their mobility, in this example the mobility of moped riders.
D4.9 Developing a Road Safety Index
42
Several methods can be used to make these corrections (SWOV, 2010):
1. Dividing the number of crashes by the size of the country, expressed, for example, in population, distances travelled, or road network length (all exposure measures, as discussed before).
2. Comparing the number of crashes with the number in a basis year which is set at 100 (indexing).
3. Examining certain subdivisions. In the Netherlands for instance, three quarters of all road deaths are male; more than one in five is a cyclist. Are these percentages the same in other countries?
4. Relating the number of road deaths to the total number of deaths. In the Netherlands, 4% die of unnatural causes; a decreasing percentage of these are road deaths (from more than 40% in the early seventies to 13% in 2008).
Countries that are in completely different phases of development are difficult to compare.
Besides the typical risks measures that are used (e.g. fatalities per million inhabitants, fatalities per million vehicles), the final safety outcomes layer may include additional comparative data such as:
• the rate of improvement in road safety
• the scope of the safety problem of particular groups, like vulnerable road users
• the scope of the safety problem on particular road types, such as rural roads
• the scope of the problem of certain age groups, like children and elderly people.
• the scope of the injury problem (e.g. injury crashes per fatality)
The rate of improvement of road safety is important for evaluating success of efforts and for predicting the need for renewed or increased policy effort. The specific safety indicators for groups of road users (e.g. pedestrians, cyclists, children, elderly) and road categories (e.g. rural roads) may help to orient policy makers towards areas/groups where further road safety measures are most needed. Each of these indicators, whether it concerns children, elderly, rural roads, represents a large share of the road safety outcome. For example, in 2009 rural roads contributed 55% of all road deaths across the EU, and as high as 70% for some Member States (ETSC, 2010). Another example: while elderly people account for one sixth of European population, every fifth person killed in road traffic is 65 years old or over (ETSC, 2008).
Table 3.1 presents the main distinctions of safety outcomes and some examples of frequently used indicators:
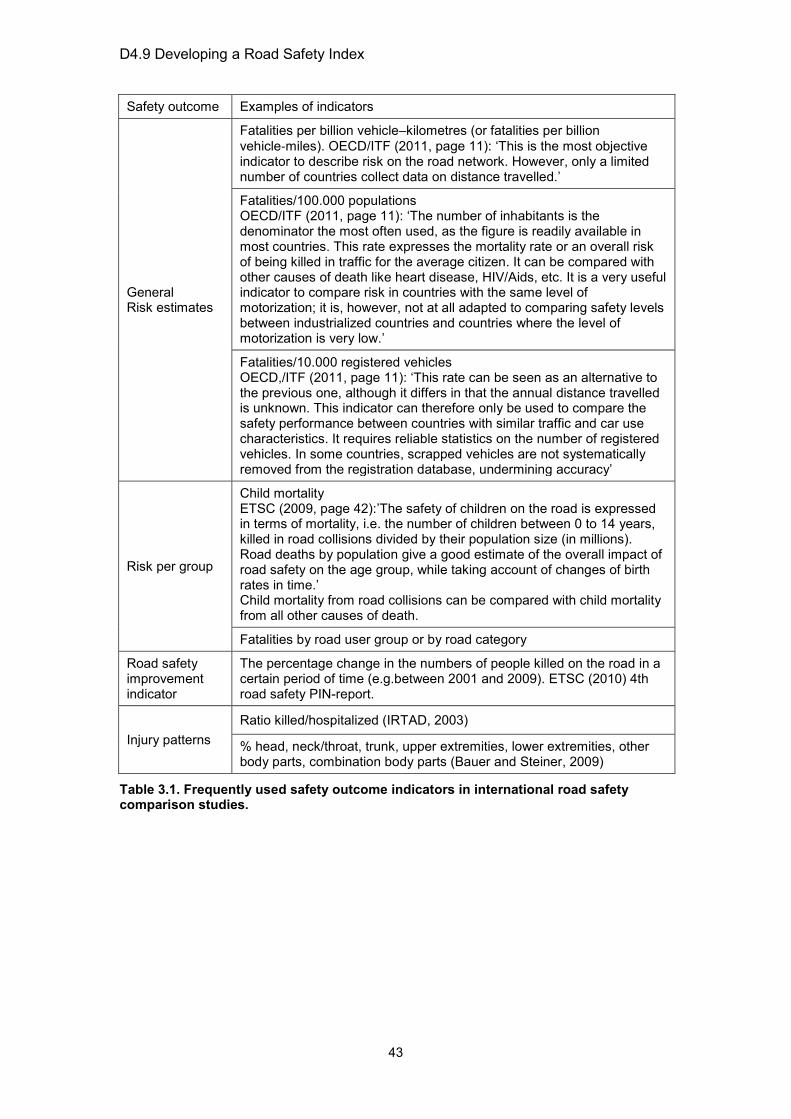
D4.9 Developing a Road Safety Index
43
Safety outcome Examples of indicators
General Risk estimates
Fatalities per billion vehicle–kilometres (or fatalities per billion vehicle‐miles). OECD/ITF (2011, page 11): ‘This is the most objective indicator to describe risk on the road network. However, only a limited number of countries collect data on distance travelled.’
Fatalities/100.000 populations OECD/ITF (2011, page 11): ‘The number of inhabitants is the denominator the most often used, as the figure is readily available in most countries. This rate expresses the mortality rate or an overall risk of being killed in traffic for the average citizen. It can be compared with other causes of death like heart disease, HIV/Aids, etc. It is a very useful indicator to compare risk in countries with the same level of motorization; it is, however, not at all adapted to comparing safety levels between industrialized countries and countries where the level of motorization is very low.’
Fatalities/10.000 registered vehicles OECD,/ITF (2011, page 11): ‘This rate can be seen as an alternative to the previous one, although it differs in that the annual distance travelled is unknown. This indicator can therefore only be used to compare the safety performance between countries with similar traffic and car use characteristics. It requires reliable statistics on the number of registered vehicles. In some countries, scrapped vehicles are not systematically removed from the registration database, undermining accuracy’
Risk per group
Child mortality ETSC (2009, page 42):’The safety of children on the road is expressed in terms of mortality, i.e. the number of children between 0 to 14 years, killed in road collisions divided by their population size (in millions). Road deaths by population give a good estimate of the overall impact of road safety on the age group, while taking account of changes of birth rates in time.’ Child mortality from road collisions can be compared with child mortality from all other causes of death.
Fatalities by road user group or by road category
Road safety improvement indicator
The percentage change in the numbers of people killed on the road in a certain period of time (e.g.between 2001 and 2009). ETSC (2010) 4th road safety PIN-report.
Injury patterns Ratio killed/hospitalized (IRTAD, 2003)
% head, neck/throat, trunk, upper extremities, lower extremities, other body parts, combination body parts (Bauer and Steiner, 2009)
Table 3.1. Frequently used safety outcome indicators in international road safety comparison studies.
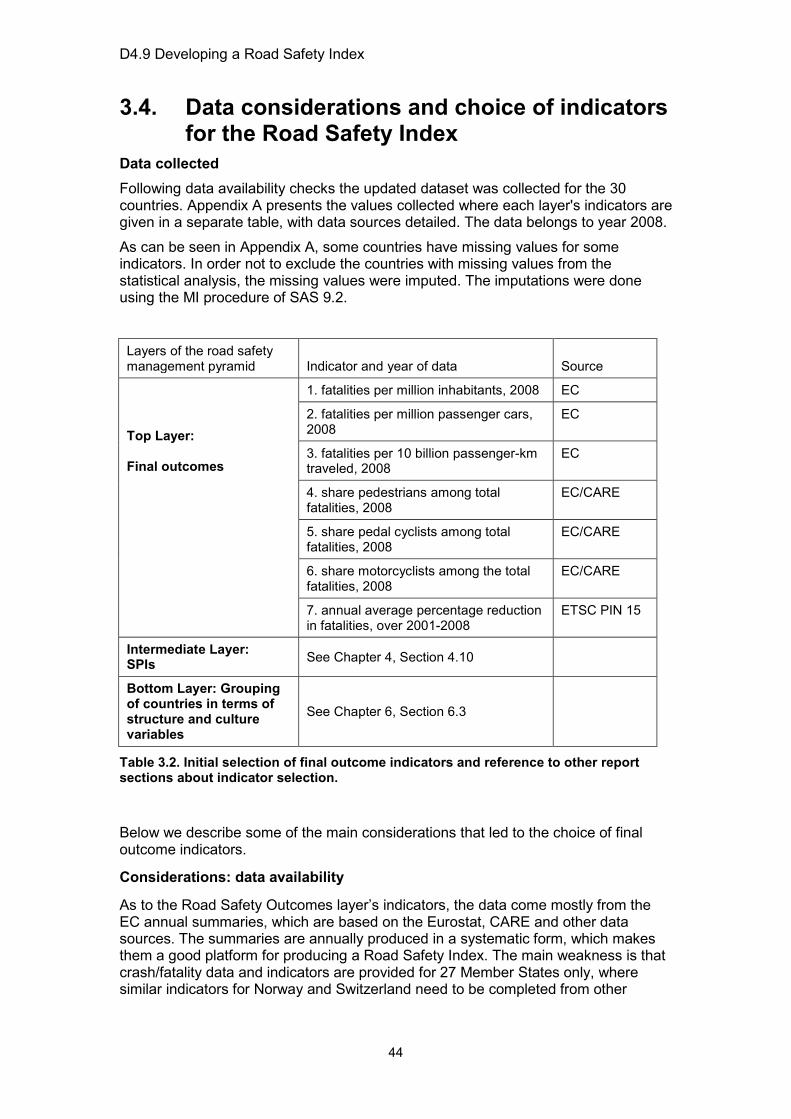
D4.9 Developing a Road Safety Index
44
3.4. Data considerations and choice of indicators for the Road Safety Index
Data collected Following data availability checks the updated dataset was collected for the 30 countries. Appendix A presents the values collected where each layer's indicators are given in a separate table, with data sources detailed. The data belongs to year 2008.
As can be seen in Appendix A, some countries have missing values for some indicators. In order not to exclude the countries with missing values from the statistical analysis, the missing values were imputed. The imputations were done using the MI procedure of SAS 9.2.
Layers of the road safety management pyramid Indicator and year of data Source
Top Layer: Final outcomes
1. fatalities per million inhabitants, 2008 EC
2. fatalities per million passenger cars, 2008
EC
3. fatalities per 10 billion passenger-km traveled, 2008
EC
4. share pedestrians among total fatalities, 2008
EC/CARE
5. share pedal cyclists among total fatalities, 2008
EC/CARE
6. share motorcyclists among the total fatalities, 2008
EC/CARE
7. annual average percentage reduction in fatalities, over 2001-2008
ETSC PIN 15
Intermediate Layer: SPIs See Chapter 4, Section 4.10
Bottom Layer: Grouping of countries in terms of structure and culture variables
See Chapter 6, Section 6.3
Table 3.2. Initial selection of final outcome indicators and reference to other report sections about indicator selection.
Below we describe some of the main considerations that led to the choice of final outcome indicators.
Considerations: data availability
As to the Road Safety Outcomes layer’s indicators, the data come mostly from the EC annual summaries, which are based on the Eurostat, CARE and other data sources. The summaries are annually produced in a systematic form, which makes them a good platform for producing a Road Safety Index. The main weakness is that crash/fatality data and indicators are provided for 27 Member States only, where similar indicators for Norway and Switzerland need to be completed from other
D4.9 Developing a Road Safety Index
45
sources, e.g. IRTAD, UNECE. At the same time, IRTAD cannot serve as a basic data source as it does not cover all the European countries.
The measurement of traffic risk per exposure (kilometers-traveled) is problematic. The EC provides a (systematic) estimation of risk per passenger-km travelled, for 27 countries. IRTAD estimates the risk per vehicle-km travelled, which is a more common indicator, but not for all the European countries. For example, for the year 2008 (IRTAD, 2010), the values were available for 13 countries only.
Further considerations
Concerning the ‘Final outcomes’ layers, the following issues were considered:
• A mix of static and dynamic indicators in the same set may be problematic. At the same time, the annual average percentage reduction in fatalities over a period can be a good indicator for progress, providing a kind of "compensation" for countries with a medium-bad current score (according to the current level of risks), but a good improvement rate, in comparison to those moderately performing countries with not so good improvement rates.
• Vulnerable road users have high risks in road traffic, where high shares of those among the total fatalities may highlight specific problems of a country, combined with the fact that it is generally perceived that especially those groups have to be protected for traffic hazards as much as possible. Other indicators demonstrate the number of fatalities per vehicle, in general. Thus, a combination of both characteristics will provide a more comprehensive picture of road safety situation in the country. In an ideal case, we would like to include specific exposure in the figures on vulnerable road users, but such exposure values are not available yet for most countries. It was decided to keep all the three vulnerable road user shares in the set of "Final outcomes".
• Estimating traffic risk, theoretically, it preferable to use vehicle-kilometers traveled as an exposure measure. However, this indicator is available for a limited number of countries, whereas passenger-kilometers figures are available for 27 countries. Although the use of passenger-km is not fully correct as it does not match all fatalities (but mostly those related to private cars and motorcycles), it was argued that the use of shares of vulnerable road users would provide some compensation for this disadvantage.
• The use of fatalities per total vehicle fleet instead of per passenger cars only is preferable due to the same reason of comparison correctness (i.e. total fatalities should be related to total vehicle fleet). Both figures are attainable based on the EC annual tables. Thus, the number of fatalities per total vehicle fleet was selected for country comparisons.
3.5. Concluding remarks The upper layer of the road safety target hierarchy, of the road safety management pyramid, is constituted by Safety Outcome Indicators.
The data for the safety pyramid outcome layer come mostly from the EC annual summaries, which are based on the Eurostat, CARE and other data sources. The summaries are annually produced which makes them a good platform for producing a Road Safety Index. The dataset was collected for 30 countries, most of the data concern 2008 except seat belt wearing rates which concern 2009.
D4.9 Developing a Road Safety Index
46
For the top layer of the road safety pyramid, the following 7 indicators have been chosen: 1. the number of fatalities per million inhabitants, 2008; 2. the number of fatalities per million passenger cars, 2008; 3. the number of fatalities per 10 billion passenger-km traveled, 2008; 4. the share pedestrians among total fatalities, 2008; 5. the share pedal cyclists among total fatalities, 2008; 6. the share motorcyclists among the total fatalities, 2008; 7. the annual average percentage reduction in fatalities, over 2001-2008
3.6. References ETSC (2001). Transport safety performance indicators. European Transport Safety Council ETSC, Brussels.
ETSC (2008). Countdown to 2010; Only two more years to act! 2nd Road Safety PIN Report. European Transport Safety Council ETSC, Brussels.
ETSC (2009). Reducing child deaths on European roads - Road safety performance index. Flash 12. European Transport Safety Council ETSC, Brussels.
ETSC (2010). Reducing deaths on rural roads - A priority for the next “Decade of action”. Pin Flash 18 Report. European Transport Safety Council ETSC, Brussels.
Hakkert, A.S., Gitelman, V., and Vis, M.A. (Eds.) (2007). Road safety performance indicators: Theory. Deliverable D3.6 of the EU FP6 project SafetyNet.
Hakkert, A.S., and Braimaister (2002). The uses of exposure and risk in road safety studies. R-2002-12. SWOV Institute for Road Safety Research, Leidschendam.
Hauer, E. (1982). Traffic conflicts and exposure. Accident Analysis and Prevention, 14, pp. 359-364.
IMOB (2010). Discussion note on index methods. Note to be discussed on 27/08/2010; prepared by IMOB, July 2010.
IRTAD (2010). IRTAD Database, June 2010 - Risk Indicators. IRTAD, Brussels.
LTSA (2000). Road safety strategy 2010; A consultation document. National Road Safety Committee, Land Transport Safety Authority LTSA, Wellington, New Zealand.
Nilsson, G. (1997). Methods and necessity of exposure data in relation to accidents and injury statistics. IRTAD Special report. Swedish Road and Transport Research Institute, Linkoping, Sweden
OECD/ITF (2011). IRTAD annual report 2010. Organisation for Economic Co-operation and Development OECD / International Transport Forum ITF, Paris.
Reurings, M.C.B., Papadimitriou, E., Vis, M.A., and Yannis, G. (2010). Functional specification of data browsing tool and country overview. Deliverable 4.3 of the EC FP7 project DaCoTA.
Robert, R., and Steiner, M. (2009). Injuries in the European Union statistics summary 2005-2007. Kuratorium für Verkehrssicherheit KfV, Vienna.
Rumar, K. (1999). Road safety and benchmarking. In: Proceedings of the Paris Conference on Transport Benchmarking. November 1999, Paris, France.
Vis, M.A. (July 30, 2010). Email to Jackie Knowles, 30 July 2010. Subject: DaCoTA - WP3 - Subtask 3.3 Assembly of national information.
Wittink, R. (2001). Promotion of mobility and safety of vulnerable road users: final report of the European research project PROMISING (Promotion of Measures for Vulnerable Road Users). D-2001-3. SWOV Institute for Road Safety Research, Leidschendam.

D4.9 Developing a Road Safety Index
47
Yannis, G., Lejeune, P., Treny, V., Hemdorff, S., Bergel, R., Haddak, M., Holló, P., Cardoso, J., Bijleveld, F., Houwing, S., and Bjørnskau, T. (2005). State of the art report on risk and exposure data. Deliverable 2.1 of the SafetyNet project. http://www.erso.eu. European Commission, Brussels.
Yannis, G., Duchamp, G., Lejeune, P., Treny, V., Hemdorff, S., Haddak, M., Lenguerrand, E., Holló, P., Gábor, M., Cseffalvay, M., Leitner, T., Angermann, A., Hoeglinger, S., Cardoso, J., Bijleveld, F., Houwing, S., Bjørnskau, T., and Rackliff, L. (2008). Deliverable 2.3. Risk exposure data common framework. Integrated Project No. 506723: SafetyNet. Project co-financed by the European Commission, Directorate-General Transport and Energy, Brussels.

D4.9 Developing a Road Safety Index
48
4. IDEAL AND AVAILABLE ROAD SAFETY PERFORMANCE INDICATORS
Charles Goldenbeld SWOV
Victoria Gitelman Technion
4.1. Introduction The third layer of the road safety target hierarchy, or the road safety management pyramid, is constituted by Safety Performance Indicators (SPIs). This chapter describes some of the theoretical and empirical foundations of SPIs as proposed in the SafetyNet-project and other projects, such as the PIN-projects of the ETSC.The chapter also explores some areas for the possible development of new SPIs.
The chapter is structured as follows. Section 4.2 first provides a general introduction to the concept of safety performance indicator (SPI). Following the recommendations of the ETSC report "Transport Safety Performance Indicators" (2001), seven problem areas were selected for the SPIs' development in the SafetyNet project: 1. Alcohol and Drugs; 2. Speed; 3. Protective Systems; 4. Daytime Running Light; 5. Vehicles; 6. Roads; and 7. Trauma Management. The knowledge and developments concerning these separate SPIs are described in Sections 4.3 to 4.9. In Section 4.10 a summary is given of the available indicators for the problem areas that were identified within DACOTA. In the final Section 4.11, concluding remarks are formulated.
4.2. Safety Performance Indicators Road safety research has revealed a number of risk factors, such as high speed, alcohol impairment and lack of occupant protection. A risk factor is any factor that increases the probability of accident occurrence (Elvik and Vaa, 2004). Thus, for road safety authorities it is important to control such factors, and consequently know whether the particular risk factor is becoming more or less important in their country. This can be done by comparing the presence of these risk factors in one country with the presence in other countries. Safety Performance Indicators (SPIs) can show in more detail the state of risk factors and the trends in these as well as the potential for reduction of these types of crashes. SPIs are the measures (indicators), reflecting those operational conditions of the road traffic system that influence the system’s safety performance (Gitelman et al., 2007), i.e. an SPI may be described as a measurement of a factor causally related to crashes or casualties. define SPIs as: The purpose of SPI is (Hakkert, Gitelman and Vis, 2007):
• to reflect the current safety conditions of a road traffic system (i.e. they are considered not necessarily in the context of a specific safety measure, but in the context of specific safety problems or safety gaps)
• to measure the influence of various safety interventions, but not the stage or level of application of particular measures
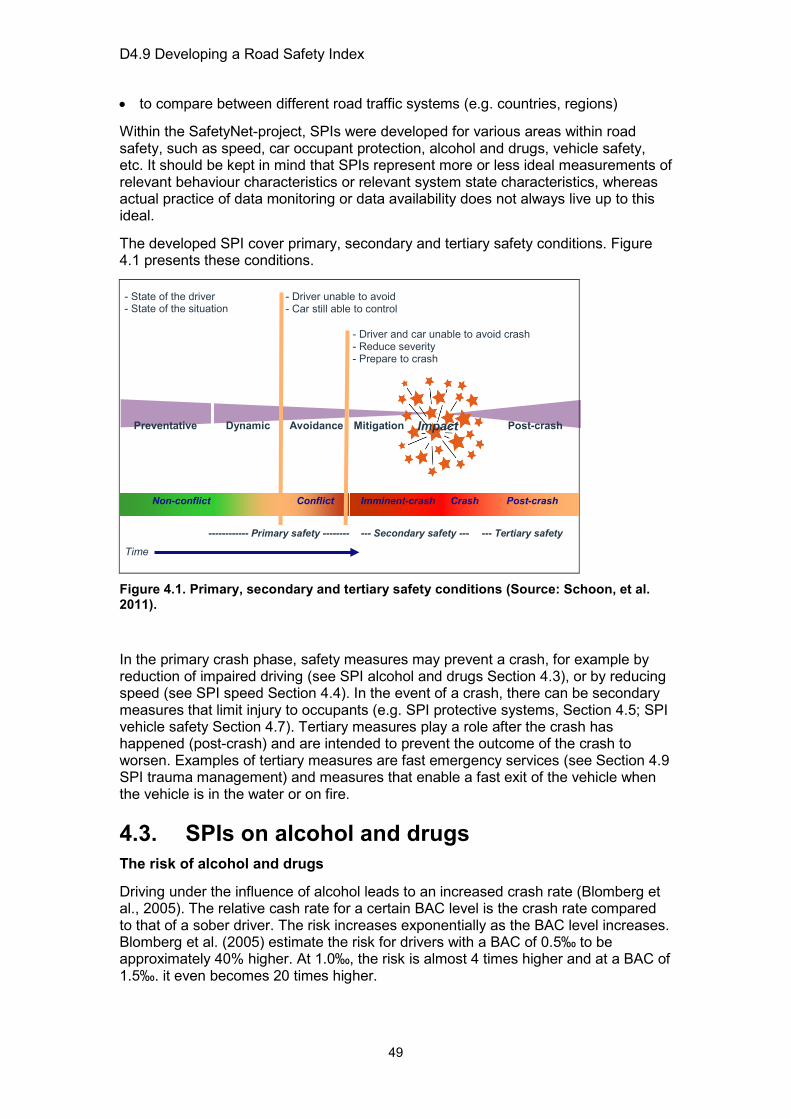
D4.9 Developing a Road Safety Index
49
• to compare between different road traffic systems (e.g. countries, regions)
Within the SafetyNet-project, SPIs were developed for various areas within road safety, such as speed, car occupant protection, alcohol and drugs, vehicle safety, etc. It should be kept in mind that SPIs represent more or less ideal measurements of relevant behaviour characteristics or relevant system state characteristics, whereas actual practice of data monitoring or data availability does not always live up to this ideal.
The developed SPI cover primary, secondary and tertiary safety conditions. Figure 4.1 presents these conditions.
Figure 4.1. Primary, secondary and tertiary safety conditions (Source: Schoon, et al. 2011).
In the primary crash phase, safety measures may prevent a crash, for example by reduction of impaired driving (see SPI alcohol and drugs Section 4.3), or by reducing speed (see SPI speed Section 4.4). In the event of a crash, there can be secondary measures that limit injury to occupants (e.g. SPI protective systems, Section 4.5; SPI vehicle safety Section 4.7). Tertiary measures play a role after the crash has happened (post-crash) and are intended to prevent the outcome of the crash to worsen. Examples of tertiary measures are fast emergency services (see Section 4.9 SPI trauma management) and measures that enable a fast exit of the vehicle when the vehicle is in the water or on fire.
4.3. SPIs on alcohol and drugs The risk of alcohol and drugs
Driving under the influence of alcohol leads to an increased crash rate (Blomberg et al., 2005). The relative cash rate for a certain BAC level is the crash rate compared to that of a sober driver. The risk increases exponentially as the BAC level increases. Blomberg et al. (2005) estimate the risk for drivers with a BAC of 0.5‰ to be approximately 40% higher. At 1.0‰, the risk is almost 4 times higher and at a BAC of 1.5‰. it even becomes 20 times higher.
Impact Dynamic Avoidance Post-crash
Time
Mitigation
- Driver unable to avoid - Car still able to control
- Driver and car unable to avoid crash - Reduce severity - Prepare to crash
- State of the driver - State of the situation
Preventative
Conflict Imminent-crash Crash Post-crash Non-conflict
------------ Primary safety -------- --- Secondary safety --- --- Tertiary safety

D4.9 Developing a Road Safety Index
50
Within the framework of the DRUID-project - Driving under the Influence of Drugs, Alcohol and Medicines – research was undertaken to study prevalence and risk of impaired driving (alcohol, drugs) and possible countermeasures. According to DRUID-research, the highest risk of getting seriously injured or killed is associated with driving with high alcohol concentrations (above 1.2 g/L) and alcohol combined with other psychoactive substances (Schulze et al., 2012). These two groups indicate extremely high risks of about 20-200 times that of sober drivers. Other high risk groups are drivers with medium blood alcohol concentrations (between 0.8 g/L and 1.2 g/L), multiple drug use and amphetamines. The risks indicated for this group are about 5-30 times that of sober drivers.
Lower increased crash risks - medium increased risk - were found for alcohol concentrations between 0.5 and 0.8 g/L, for cocaine, benzoylecgonine, illicit opiates and medicinal opioids. Risk for this group was estimated to about 2-10 times that of sober drivers. The risk associated with benzoylecgonine that is not an active agent might be caused by sleep deprivation after cocaine consumption. The risk associated with cannabis seems to be similar to the risk when driving with a low alcohol concentration (between 0.1 g/L and 0.5 g/L), which is slightly increased of about 1-3 times that of sober drivers.
The ideal alcohol SPI
According to the theoretical framework of the SafetyNet project, the 'ideal' Safety Performance Indicator (SPI) of the alcohol and drug related road toll would be the prevalence and concentration of impairing substances among the general road user population (Hakkert, Gitelman and Vis, 2007). There are several practical and judicial problems associated with obtaining the - theoretically - best SPI. Collecting data on alcohol and drug use in the general road user population is costly and difficult. Moreover, demanding breath or blood specimens for drugs from the general road user population without suspicion is not allowed in most countries. In some countries, random breath testing for alcohol of motor vehicle drivers is carried out, but in other countries, like Germany and the UK, random breath testing of motor vehicle drivers is not allowed. Voluntary testing is possible, but may be invalid, because the prevalence of drugs and alcohol may be lower than the non-response rate. Furthermore, countries differ in the blood-alcohol-concentration (BAC) that is accepted as a limit, and these limits may even vary within a country, depending on the type of road user (e.g. novice drivers or professional drivers). The country overviews that were made within DaCoTA, give a nice and actual overview of these limits.
In view of the difficulties mentioned above, the SafetyNet group chose the percentage of fatalities resulting from crashes involving at least one driver impaired by alcohol as the next best approximation of alcohol SPI (Assum and Sørensen, 2010). For practical purposes “impaired by alcohol” was defined as above the legal blood alcohol concentration (BAC) limit of each country, although –as noted before - the BAC limits in Europe vary. However, this indicator included fatality outcomes and thus is more an outcome indicator than a performance indicator as defined here. Furthermore, also with this indicator, not all countries can measure this indicator in the same way, as it is not common habit in some countries to test dead people on their BAC.
Another approximation of the alcohol SPI would be the numbers of roadside alcohol breath tests per 1,000 inhabitants and percentage of those tested found to be above the legal limit. This information is available for at least 17 EU countries (ETSC, 2010), which is by far the most complete dataset.

D4.9 Developing a Road Safety Index
51
In making country comparisons, there are even some more measurement compatibility issues that should be recognized. For alcohol, blood testing may be used or evidential breath testing for surviving road users involved in fatal crashes (Hakkert and Gitelman, 2007). The results of breath alcohol concentrations and blood alcohol concentrations are very well comparable. Fixed factors can be used for the transformation from one concentration to the other. However, in Europe, different transformation rules are used: e.g. the Netherlands and the United Kingdom use a factor of 2300 between the blood and breath alcohol concentration, whereas most other European countries use a factor of 2100. In order to avoid problems with comparability, the blood alcohol concentration (BAC) should at least be reported above or below a predetermined impairment threshold. This is in order to make international comparisons for certain levels, as legal limits vary from 0.0 to 0.8 in Europe. A general level of 0.5 grams per litre blood could be used.
The ideal SPI for drugs
For drugs, a saliva specimen or a blood specimen may be used (Hakkert and Gittelman, 2007). All illicit drugs and relevant psychoactive medicinal drugs should be tested for. For drugs neither the types of drugs nor concentration limits are established so far. International agreements need to be achieved as to for which drugs to test and categories of test results. Core substances may include: alcohol, cannabis, cocaine, opiates, XTC, amphetamines and benzodiazepines. In addition to these core substances the drug panel could be expanded to include other drugs that are nationally frequently used. The biggest issue however, is the lack of uniform impairment levels for psychoactive substances in blood. For drugs other than alcohol research is conducted to try to determine impairment levels for blood.
Drug level comparison among countries is difficult because of countries test on different drugs and the lack of sensitivity of saliva samples for benzodiazepines and THC can cause a bias in the actual drug levels of a country. A country that uses saliva specimens for collection for drugs could in this way have an under-registration, compared to countries that use blood specimens. However, as the technique of analysing saliva is developed further, a transformation factor from saliva to blood is likely to be developed.
Despite the noted problems with prevalence measures of alcohol and drugs, such a measure was actually achieved over a 5 year period within the DRUID-project (DRUID 2011b), which comprised 13 European countries. The main strength of the DRUID study was that, for the first time, a road side survey was conducted throughout Europe. Though the DRUID survey more closely approximates the ideal of measurement of prevalence and concentration of impairing substances among the general road user population, it has not solved all problems associated with this measure. DRUID has however made more clear how the measurement on a national level varies per country. Clustering of data was necessary to solve some problems due to under representation of certain time periods. However, neither clustering nor weighting can solve all representativeness issues.
Conclusions about alcohol and drugs SPIs
• The ideal alcohol and drugs SPI would be the prevalence and concentration of impairing substances among the general road user population.
• Status alcohol SPI: currently, all possible alcohol measures have their drawbacks, which are all related to differences in measurement methods and measurement possibilities in countries. For the RS index, we use 1) the numbers of roadside alcohol breath tests per 1,000 inhabitants and 2) percentage of those tested found
D4.9 Developing a Road Safety Index
52
to be above the legal limit because this information is available for at least 17 EU countries, which is not the case for other measures.
• Status drugs SPI: the DRUID-project allows in a limited way for some national comparisons of prevalence of impairing substances in driving population. Representativeness varies a lot per country, and because of these drawbacks, we do not (yet) use a drug SPI within the RS index.
4.4. SPI on speed The risk of speed
Speed is one of the basic risk factors in traffic (Aarts and Van Schagen, 2006). Higher driving speeds lead to higher collision speeds and thus to severer injury. Higher driving speeds also provide less time to process information and to act on it, the steering characteristics of the vehicle become less stable, and the braking distance needs to be longer to stop in time. Thus the possibility of avoiding a collision is smaller. In short: high driving speeds lead –under similar conditions - to a higher crash rate, and also to a higher probability on a more severe outcome. However, not everything is known yet about the exact relation between speed and road safety, and the exact conditions that influence this relationship.
Road safety practitioners and researchers make use of speed data in several ways, and for various purposes, such as to (Hakkert and Gitelman, 2007):
• Monitor the extent of speeding on selected roads in order to identify those with a relative high proportion of offenders and road sections with drivers who extremely violate the speed limits
• Monitor the development of speeding over time in order to identify hours per day, months in a year or seasons which show disproportionally high numbers of offenders
• Monitor the development of speeding over time in relation to the actual speeds enforced by the police (enforcement margins) and activities near the measured road type
• Monitor the development of speed distribution over time and identify time-frames exhibiting a deviant distribution with possible negative effects on road safety
• Monitor and analyse the relationship between traffic intensity and traffic speeds
• Monitor the proportion of heavy goods vehicle over times in order to study the possible connection to road safety
Ideal SPIs for speed
The SPIs developed for speed on a road are the mean speed, the standard deviation, the 85th percentile speed and the percentage of drivers exceeding the speed limit (Hakkert and Gitelman, 2007). Which of those measures is most important, is not yet sufficiently determined (see Aarts and Van Schagen, 2006)
The main practical guidelines for representative speed measurement are presented below (Hakkert and Gitelman, 2007):
• Speed SPIs should be segregated by road type, vehicle type, period of day and period of the week (week-days and weekends).
D4.9 Developing a Road Safety Index
53
• The selection of measurement sites should be based on a random sample of roads in a road network. This will allow generalization of the results to all traffic in that particular road network.
• As a rule of thumb, 30 locations per surveyed road type should constitute an accurate sample if the locations are carefully chosen.
• In order to ensure reliability and comparability of speed data, the locations at which speed measurements are carried must be chosen carefully.
• Ideally, the sampling procedure should comprise a selection from a database consisting of a list of uniform road segments, with their geographic coordinates and their characteristics such as Road type, Actual speed limit, AADT (Annual Average Daily Traffic), Number of lanes (not including additional lanes at intersections)
• Usually, road network databases are already divided in segments of relatively small length (typically one segment per portion of road between two intersections). In this case, the sample of measuring locations should be selected via a simple random sampling with probabilities of inclusions that are proportional to the length of the segments (e.g. the likelihood of a segment of 2 km to be included in the sample is twice higher as the likelihood of a 1 km segment).
Speed measurements are however not widely available. In the ETSC PIN-Flash 16 on speed, measurement data of nine countries are presented, covering the period 2000-2009 (ETSC, 2010). The report describes that Great Britain, Austria, Finland and Switzerland have a long tradition of monitoring speed in free-flowing traffic (i.e.: cars with a following distance of at least 3 sec.). France has been monitoring speed all year round since 2003 and publishes the results in its Observatory of Speeds. Belgium started monitoring speeds in 2003. Some others have started more recently, such as Estonia, the Czech Republic and Slovenia, following SafetyNet recommendations. Others perform speed measurement occasionally, e.g. before and after major changes in legislation or in the speed limit. Germany, Greece, Malta, Italy and Slovakia do not currently monitor mean speeds, which deprives them of important feedback on the effectiveness of their actions. In Portugal, measurements stopped in 2006. In the Netherlands, measurements are only nationally available for motorways. Sweden has developed a speed index to monitor speed developments at 83 points on the rural road network between extensive speed surveys made every few years.
Conclusions about the speed SPI
• Good speed SPIs are the mean speed, the standard deviation of speed on a road, the 85th percentile speed and the percentage of drivers exceeding the speed limit, measured by spot speeds measured at various locations on the road network during periods when traffic can be considered free flowing, segregated by road type, vehicle type, period of day and period of the week, i.e. weekdays and weekends
• Status: The SPI is well developed. Many EU countries have speed monitoring systems on different road types and most of them have it not available on a national basis. Representativeness may also vary. As less than 50% of European countries has speed data available, a speed SPI cannot be used for compiling a RS index.

D4.9 Developing a Road Safety Index
54
4.5. SPIs on protective systems The risk related to non-use of protective systems
Seat belts reduce the risk of fatal injury by 30 to 40%, depending on the position in the passenger car (SWOV, 2010). The effect of child restraint seats is –with an effectiveness of 50% - slightly larger. Seat belts have been developed for adults, not for children. Therefore, different protection devices (child restraint seats) have been developed for the safe transport of children shorter than 1.35 m. In 2006, it was decided on European level that children shorter than 1.35 m must be seated in a restraint seat or booster seat, in the front as well as in the back of the car. Only certified child restraint seats that meet the EC requirements are allowed to be sold.
Seat belts are still being improved. Systems have been developed, among others, to reduce the forces that the seat belt exercises on the human body (the seat belt tensioner and force limiter) and to activate the seat belt even earlier in the crashing process (pre-crash sensors).
The ideal SPI for protective systems
Eskler et al. (2007) defined appropriate SPIs for protective systems as the use (wearing) rates of protective systems. There are, however, several ways how the value of the indicator may be obtained: police reported rates, self-reported rates, roadside survey rates and accident rates. Although all these rates refer to the same indicator, their values vary considerably.
The police reported rates are usually largely overestimating the real rates, as they often come from the statistics of general roadside checks, which primarily focus on other, more serious offences. Furthermore, the presence of the police can have a deterrent effect, leading the person to try to buckle up before being checked or observed for seat belt wearing.
According to the SPI manual developed in SafetyNet (Hakkert and Gitelman, 2007), protective system wearing should be assessed on all major road types which are present in the country and are relevant for each road user category. Ideally, use is made of a well-designed road side surveys to measure use of protective systems. The sample identified for the survey should have a probability-based design such that estimates of safety belt (helmets) use will be representative for the population of interest in the country. Also confidence intervals may be calculated for each estimate produced. Relevant SPIs per road used group are:
Seat-belt wearing rates for: • occupants of passenger cars and vans over 12 years old in front seats, • occupants of passenger cars and vans over 12 years old in rear seats, • occupants of coaches and heavy-duty vehicles over 12 years old in front seats, • occupants of coaches over 12 years old in rear seats.
Child-restraint system use should be measured for: • children in passenger cars under 12 years old in front and rear seats.
Helmet-wearing rates should be measured for: • Bicyclists, • Moped riders • Motorcyclists.

D4.9 Developing a Road Safety Index
55
In recent ETSC PIN-measurements of seat-belt wearing, France, Germany, Sweden, the UK and the Netherlands showed to have the highest seat belt wearing rates in 2009, with 95% or more drivers and front passengers buckling up (Jost et al., 2010). In Israel, Finland, Denmark, Norway and Ireland, 90% or more drivers and front seat passengers wore their seat belt in 2009. The Czech Republic, Slovenia, Estonia, Austria, Switzerland, Portugal, Spain, Latvia recorded rates between 80% and 90%. In Poland, Cyprus, Belgium, Slovakia, Hungary, Greece and Italy, rates were 80% or lower.
As reported by ETSC (Jost et al., 2010), seat belt wearing rates are not regularly collected in Bulgaria, Italy, Lithuania, Luxembourg, Malta, Portugal and Romania. Seat belt rates in rear seats are not collected in Belgium, Cyprus, Slovakia and Slovenia.
Conclusions on protective systems SPIs
• Ideal protective systems SPIs: The use (wearing) rates of protective systems in the driving population, segregated by vehicle type, road type, and occupant type (drivers, front seat passengers, children). Also the helmet wearing rates for several types of two-wheelers.
• Status: The protective system SPI is well developed. Several EU countries have regular monitoring of use of protective systems, especially seat-belt wearing.
4.6. SPI on daytime running lights The risk of unlighted driving
Many traffic crashes occur because road users do not notice each other in time or do not notice each other at all. This is not only the case for traffic crashes in the dark, but also for traffic crashes during daylight as well. Vehicle visibility is therefore one of the factors which affects the number of crashes (Elvik and Vaa 2004). The eye reacts to contrasts and changes in contrast in the field of vision. When light conditions are particularly difficult, such as at dusk, in rain, or in fog, it becomes difficult to see all traffic elements (Elvik and Vaa, 2004).
Use of daytime running lights (DRL) (for cars) in all light conditions is intended to reduce the number of multi-party crashes by increasing the cars’ visibility and making them easier to notice (Elvik and Vaa 2004). Furthermore, the DRL use could increase the reliability of the estimation of other motorized road users’ moving direction, distance and speed.
In-depth crash studies have shown that not having seen the other road user plays a role in ca. 50% of the daytime crashes, and for intersection crashes this is even 80%. Theoretical insight and observations mainly attribute the DRL effect to the greater contrast between vehicles and their surroundings; DRL increase the visibility of vehicles and makes them better identifiable. An additional effect is that vehicles with DRL are estimated to be more near-by than they really are. This reduces risk-taking while overtaking and when approaching intersections.
An 2003 study commissioned by the EC, involved a meta-analysis of 41 studies of the effect for cars and 16 studies of the effect for motorcycles (Elvik et al., 2003). This showed that for cars, DRL reduce the number of daytime injury crashes by 3 to12%. The effect on fatal crashes can be estimated as somewhat larger (-15%). For motorcycles, DRL reduce the number of injury crashes by 5 to10%.
Research has shown that road users who do not carry lights during the daytime, pedestrians and cyclists, can also benefit from DRL. The meta-analysis of Elvik et al.
D4.9 Developing a Road Safety Index
56
(2003) concludes - be it with some reservation - that DRL probably reduces the number of car crashes involving cyclists and pedestrians. A TNO laboratory experiment (Brouwer et al., 2004) showed that the subjects saw motorcycles earlier, independent of the motorcycles having their lights on or off, if cars used DRL. However, motorcycles with DRL were spotted faster.
The EC has decided to implement DRL. This decision entails that as from 2011, new types of passenger and delivery vehicles must be equipped with low-energy lights that switch on automatically when the car is started (EC, 2008).
The ideal SPI on the use of daytime running lights
DRL SPIs are usually considered as the percentage of vehicles using daytime running lights (Holló et al., 2007). The general indicator can be estimated for the whole sample of vehicles, which were observed in the country. Similar values can be calculated for different road categories and for different vehicle types.
European countries differ a lot in DRL rules or laws beside the EC-law that has recently been decided on. Maybe for this reason, no (structural) national measurements are available for most European countries.
Conclusions about DRL SPIs
• Ideal DRL SPI: the percentage of vehicles using daytime running lights, where the value is estimated for different road categories and for different vehicle types (cars, heavy good vehicles (including vans), motorcycles and mopeds)
• Status: The indicator is well developed, but in most EU countries there is no annual measurement available.
4.7. SPI on vehicles The risk related to vehicles
While vehicle defects may play a small role in accident and injury causation, the crash protection performance of the vehicle is very important for the severity of the outcome in case a crash would occur. In EU countries, vehicle safety policy is ruled to a large extent via European rules rather than national rules. Regulations and standards are determined in Geneva and in Brussels through the EU Whole Vehicle Type Approval System.
Two types of vehicle safety can be distinguished here: primary and secondary safety. Primary safety comprises vehicle systems that can contribute to crash prevention, like ABS or ESC; secondary safety measures comprises measures that play a role in preventing the severity of the outcome of crash, like seat-belts, airbags and the crashworthiness of vehicles.
There is a large body of research showing that the efforts made to improve the secondary safety of cars seem to have been successful (Méndez et al., 2010). Méndez et al. (2010) refer to 6 studies in Great-Britain, France, Finland, Germany and Australia that showed decreased injury risk as a consequence to improvements of secondary safety. All of them refer exclusively to the risk to car drivers involved in crashes (i.e. other occupants are excluded).
Primary safety has started to develop somewhat later than secondary safety measures, but also shows to contribute to a large extent to the safety of drivers on the road.
D4.9 Developing a Road Safety Index
57
The ideal vehicle SPI
Within SafetyNet, the safety performance indicators used for vehicles (passive safety) concern (Rackliff et al., 2007):
• The crashworthiness and vehicle age of the passenger car fleet;
• The vehicle fleet composition, i.e. the compatibility of the vehicles in the fleet.
These vehicle SPIs differ from the other SPIs, in the sense that it mostly deals with the entire population not sample data. In other words, whilst protective systems use, for example, must be estimated using methods that probably differ from country to country, total numbers of vehicles are taken from national databases, which are intended to be a complete and international homogeneous record.
Crashworthiness and vehicle fleet age
The most widely used measure of the level of crashworthiness currently available in the EC is the EuroNCAP star rating. EuroNCAP stands for European New Car Assessment Programme. Euro NCAP aims to enhance vehicle safety by testing various car models and publishing the results. The aim is to encourage consumers to buy safer cars and to put pressure on designers and car manufacturers to put safer cars on the market. In this way, the program aims at exceeding the legal (European) standards for the safety of vehicles by using the free market system.
Euro NCAP crash testing is regarded as a reliable method of assessing the relative level of protection a vehicle offers for its occupants in certain common crash types (originally mainly frontal and side impacts). Since 2009 however, points can also be earned for the presence of devices for the prevention of crashes (primary safety), such as electronic stability control and speed limiters.
The European car models have become much safer during the last few decades. Especially the stronger cage construction of European car models protects occupants increasingly better during a frontal collision. Nevertheless, there are limitations. At present, Euro NCAP does not allow for mutual mass differences in frontal car-car collisions (incompatibility), whereas this in particular is a very determining factor in the further outcome of a crash. Another phenomenon is that heavier cars have also become more unyielding (less shock absorbing) and therefore are at an advantage in a crash with a lighter car in terms of protection of the occupants (Mori et al., 2007). It is therefore important to set high requirements to the crash friendliness (energy absorption) of the fronts of cars (Ablaßmeier et al., 2007) and the strength and the design of cage constructions (O’Neill, 2009).
In February 2009, Euro NCAP introduced a new overall safety rating with a maximum award of five stars. This new rating is made up from scores in four areas of assessment: adult occupant, child occupant, pedestrian protection and a new area, 'safety assist'. The adult occupant score is based on the protection of adult size dummies in frontal, side and pole impact tests. A new rear impact/ whiplash test was also introduced from 2009. To test child occupant protection, Euro NCAP uses 18-month-old and 3-year-old sized dummies in the frontal and side impact test. The child restraints used are those recommended by the vehicle manufacturer. Euro NCAP has always done pedestrian protection tests, but the results have only been published as a separate star rating. By including pedestrian protection in the new overall rating, Euro NCAP hopes to encourage improvements in vehicle performance in this area. Safety assist: The new 'safety assist' rating will allow Euro NCAP to take account of driver assistance and active safety systems. Points are awarded for fitment of electronic stability control and for the presence of a 'driver-set' speed
D4.9 Developing a Road Safety Index
58
limitation device. Euro NCAP continues to reward fitment of intelligent seat belt reminders.
In theory, the national vehicle fleets that have the greatest proportion of high star ratings according to EuroNCAP should be the safest in the EU. The data supplied, only relates to passenger vehicles; the situation for other vehicle types cannot be measured by this method. In each member state, it is acknowledged that a large percentage of the vehicle fleet will not have been subjected to EuroNCAP test procedures. Other indirect indicators of crashworthiness - such as vehicle age - could be considered as an alternative.
In SafetyNet, for each country, a EuroNCAP score was attributed to eligible vehicles. An average figure was then calculated for each year and weighted by the number of vehicles present in the 2003 fleet from that year. An overall average EuroNCAP score is then awarded for each country and, together with the median age of passenger cars in the fleet, these two figures make up the safety performance indicator for each country (Hakker and Gitelman, 2007). In fact, SafetyNet compiled an index for crashworthiness.
A number of systems have been developed internationally to rate the crashworthiness of vehicles from the analysis of real world crash data reported by the police or in insurance claims databases. Systems focused on crashworthiness include those developed in Sweden (Gustafsson et al., 1989), Great Britain (DfT, 1995), Finland (Tapio et al., 1995) and Australia (Cameron et al., 1995). In all instances, the ratings systems attempt to measure injury outcomes only related to vehicle design by adjusting the estimated ratings for the effects of non-vehicle factors. Benefits of these rating systems include the ability to evaluate changes in crashworthiness associated with changes in fleet composition. For example, in New Zealand, over the 10-year period from 2000 to 2010, it was projected that there would be a social cost reduction of about 22% associated with injuries prevented due to improved fleet crashworthiness (Keall et al., 2007). But the most obvious use of crashworthiness ratings is to provide car buyers with safety information on vehicles they are considering purchasing.
Various systems for rating secondary safety of particular marks and models of vehicles have been developed internationally. These measures generally evaluate crashworthiness (the ability of the vehicle to protect its own occupants in the event of a crash) separately from aggression (the harm a vehicle is liable to impose on other road users into which it crashes). Newstead et al. (2011) describe an approach using Australian and New Zealand data that combined the two facets of secondary safety into one ‘Total Secondary Safety Index’ estimated from real world crash outcomes. The Index estimates the risk of death or serious injury to all key road users in crashes involving light passenger vehicles across the full range of crash types. Newstead et al. describe the rationale and method for producing this Index, together with some estimates for common Australian and New Zealand makes and models of light passenger vehicles.
Fleet compatibility
The aim of the indicator for vehicle fleet compatibility is to measure how the composition of a vehicle fleet relates to its unsafety due to the incompatibility of the vehicles within the fleet (Hakkert and Gitelman, 2007). Incompatibility is the phenomenon that one vehicle absorbs more energy in a crash than the other, due to its characteristics. One of the most important characteristics is vehicle mass. The vehicle with the lower vehicle mass generally suffers the greater damage, and this is reflected in the severity of injury suffered by the occupants. The two basic components of the indicator are therefore:

D4.9 Developing a Road Safety Index
59
1. the crash severity per vehicle type, and
2. the risk of those vehicles (vehicle types) crashing.
In view of available vehicle characteristics data in the European countries, and to limit the complexity of the indicator, three main vehicle types were taken into account: passenger cars, heavy goods vehicles, and motorcycles. They are the most important vehicle types in terms of compatibility, represent the major part of the vehicle fleet (Vis and Van Gent, 2007), and are associated with the majority of the road fatalities in the EU (SafetyNet, 2008).
The indicator measures the severity of a crash between any two vehicles of the above vehicle types in a country's fleet, normalized such that the size of the fleet itself is not a factor. The latter is done so that only the fleet composition is of importance and countries with similar fleet compositions receive similar indicator scores. To capture only the fleet composition, other factors like the country's length of the road network are also carefully left out. In fact, also this indicator is a composed vehicle safety index.
Conclusions on vehicle SPIs
• Ideal vehicle SPI: 1. the rate of vehicles that will not protect the occupant well in a collision (crashworthiness); and 2. the rate of vehicles with an increased capacity to inflict injury (compatibility).
• Status: These indicators were compiled in SafetyNet into an vehicle safety indexes; In the meantime, there are new developments which have not been taken into account in an index. For this reason, vehicle SPIs need further development and testing
4.8. SPI for roads The risk of road elements
There are several links between road design and road safety. The design of a roadway can contribute to crashes by making it more difficult to see or anticipate on other vehicles, creating hazardous pinch points, presenting dangerous obstacles for drivers, or increasing susceptibility to weather conditions. Inadequate signage or signals, or their poor placement, can confuse drivers or make it more difficult to anticipate on hazards. The alignment of a road, the degree to which it is banked, the adequacy of nighttime lighting, the visibility of road markings, and the nature and condition of the surface material, can all contribute to road safety.
Thus, the quality of road infrastructure design plays a fundamental role in crash risk and in the severity of injuries in the event of a crash. This role is critical in two instances: in the initial design of the road and in the subsequent treatment of sites with high crash risk or incidence.
Ideal SPIs for road elements
Two SPIs for roads were developed during SafetyNet: the road network SPI and the road design SPI (Hakkert and Gitelman, 2007). The road network SPI indicates whether the actual road category is appropriate given the urban areas that it connects, and also given the function and use of roads. Among other things, appropriate in this context means a good fit between use and function of the road. Below a further description is given of how the network SPI is operationally defined. The road design SPI determines the level of more detailed safety elements of road elements such as road sections and intersections.
D4.9 Developing a Road Safety Index
60
Road design SPI
For the assessment of detailed road design, there are no direct SPIs in use at the moment. Exampled of methods that could be used to formulate indirect SPIs are the Road Protection Score (RPS) of EuroRAP and the Dutch Sustainably Safe Indicator (SSI). These methods score specific road design elements and are related to certain safety standards. This score can be used to formulate SPIs for road design. There is some overlap in the road elements that are considered in the two methods, however the way these elements are scaled differs a lot.
The European Road Assessment Programme (EuroRAP) includes a method to produce a score for the passive safety of each road section (Lynam, 2012). This score, called Road Protection Score (RPS), can be compared with the scores of other road sections. The RPS focuses on the road design and the standard of road-based safety features (Lynam et al., 2004). The concept 'protection' is used to mean protection from severe injury when collisions do occur (secondary safety). The road characteristics used are speed limit, median treatment, hard obstacles or barriers (type and placement), road site areas (cut and embankment), junctions and intersections (type and access). Per road characteristic, scores are given and compared to a standard that is defined per road type, related to speed limit. A description of the score calculation method of EuroRAP (basis, elements, classes, weights) is given by Lynam (2012).
Dijkstra and Louwerse (2010) provide an overview of evidence of various trials with the Road Protection Score and Sustainable Safety Test. Perhaps one of the best and major studies into the relationship between RPS and safety was done in USA (Harwood et al., 2010). Harwood et al. (2010) concluded that there is strong evidence that crash rates for road sections increase as RPS (version usRAP) decrease at two-lane undivided highways, four-lane undivided highways, and four-lane divided non-freeways. This trend was also observed for head-on crashes at two-lane undivided highways, for run-off-road crashes at two-lane undivided highways and six-lane divided freeways, and at two-lane undivided highways in Washington only, and for junction crashes at two-lane undivided highways and four-lane undivided non-freeways. The good correspondence of the RPS crash rates with the US data is likely to be due to a result of the large size of the samples being assessed.
The European Union has launched the directive on road infrastructure safety management (EPandC, 2008). The Sustainable Safety Test and the Road Protection Score (RPS) fit into this directive with respect to two instruments: road safety audit and road safety inspection. Originally these instruments are of a qualitative nature. Incorporating both tests, or incorporating a combination of these tests, will result in instruments with quantitative aspects.
Road network SPI
The road network SPI is based on a rather quantitative method for the assessment of network and design quality aspects of a safe road infrastructure at the regional level presented in a Dutch study of Dijkstra (2003). In the Dutch study, the function of the roads in the investigated network were compared to the theoretical required function of the roads.
The classification method of urban areas in the Dijkstra study originated from the rather descriptive and qualitative method of the German guidelines for road categories (FGSV, 1988). It is recognized that urban areas differ from each other in many ways. These guidelines defined a classification of roads and urban center types in a qualitative way. In the Dutch elaboration, the method of FGSV has been adjusted to a more quantitative method for the assessment of the infrastructure. The

D4.9 Developing a Road Safety Index
61
road network SPI is also a quantitative method. The road network SPI method assesses whether the actual road category meets the road category that should be present given the sizes of the urban areas that it connects. To obtain a road network SPI that allows for international comparison, an internationally harmonized road categorization is proposed. At the moment, there are no direct or indirect SPIs for road networks in use in Europe. The Dutch study on quality aspects of a sustainably safe road infrastructure presented a method to assess network and design quality aspects of a safe road infrastructure. This method could be used to formulate road network SPIs. However, the method is not commonly used yet and needs more development for use in Europe.
Yannis et al. (submitted) applied the road network SPI besides road in the Netherlands to roads in Portugal, Greece and Israel. These authors further explain the rationale behind this SPI as follows: the road network SPI aims to measure whether the right road is on the right location. It is defined as the percentage of appropriate actual road category length, per road category. The basic idea behind the developed SPI is that the amount of traffic determines the type of road required. The SPI then measures to what extent the actual roads in a network are appropriate, given the theoretically required roads. The developed road network SPI is based on four assumptions: 1: Two urban centers that are in each other’s area of influence generate traffic to and from each other; 2: The size of urban centers determines the traffic demand between those centers; 3: All traffic between two centers uses the same road; 4: The traffic demand determines the type of road necessary: more traffic requires a higher-level road. Concerning the first and second assumption, there is a need to quantify the relation between center size and traffic demand.
Conclusions about road SPIs
• Ideal road SPIs: there are a SPIs (indices) for the quality of road design and for the quality of the road network. In both cases, ratings are calculated based on a comparison of the actual situation (design elements or actual function) with the desired situation (desired design elements or function).
• Status: Both indicators need further development and testing for the European situation. Only for road design, there currently exist an international rating method (Road Protection Score), but this method has not yet been applied systematically in all countries and to all road types.
4.9. SPI on trauma management The risk of poor trauma management
Trauma management refers to the system that is responsible for the medical treatment of injuries resulting from road crashes (Hakkert and Gitelman, 2007). It covers the initial medical treatment provided by Emergency Medical Services (EMS), at the scene of the crash and during the transportation to a permanent medical facility, and further medical treatment provided by permanent medical facilities (hospitals, trauma centers). Better performance of the system is associated with shorter response time by EMS, higher level of the EMS staff, standardization of the EMS vehicles, adequate hospital trauma care. The better the post-crash care by emergency and medical services, the larger the chance of survival and, on survival, the quality of life (ETSC, 2001).
The 2003 European action program (CEC, 2003) stated that several thousands of lives could be saved in the EU by improving the response times of the emergency services and other elements of post impact care in the event of road traffic crashes.

D4.9 Developing a Road Safety Index
62
A World Report on Road Traffic Injury Prevention (Peden et al., 2004) indicated the importance of improving medical care delivered after crashes. Panel reviews indicate an average reduction of 50% in medically preventable deaths and population-based studies and trauma registry studies show around a 15%-20% or great reduction in mortality as a result of improvements in the trauma care system (Mann et al., 1999, Simons et al., 1999; Brennan et al., 2002).
The mechanism of post-crash trauma care (or Trauma Management – TM) comprises two types of medical treatment: that provided by emergency medical services (EMS) and that provided by permanent medical facilities (Hakkert, 2007). EMS are those, which normally answer the emergency calls and deal with the next steps, like sending an ambulance to the scene of a crash. EMS staff provides basic medical assistance to injured patients on the scene and during the transportation to a hospital. There are different forms of EMS, which depend on:
• the type of transport means (ambulance, helicopter);
• EMS vehicle equipment (mobile intensive care unit; basic life support unit; regular ambulance);
• medical staff arriving with the vehicle, which may include a physician, a paramedic, a “critical care” nurse, an emergency medical technician.
Further medical treatment can be provided at a regular hospital or at a specially equipped trauma center/ the trauma department of a hospital, whereas minor injuries are usually treated by doctors/ other medical staff outside a hospital. The focus of the TM system is on patients who are hospitalized (Hakkert, 2007).
Ideal trauma management SPIs
Based on the analysis of data available in the countries, a minimum set of the data items to be provided by the countries, was defined. These data enable the calculation of a Minimum set of Trauma Management SPIs that are necessary for an initial characteristic of the performance of the system.
The minimum set of the TM SPIs, which can be estimated using this minimum data set, includes fourteen items as follows:
1. EMS stations per 10,000 citizens
2. EMS stations per 100 km length of rural public roads
3. Percentage of physicians out of the total EMS medical staff
4. Percentage of physicians and paramedics out of the total EMS medical staff
5. EMS medical staff per 10,000 citizens
6. Percentage of MICU out of the total EMS units
7. Percentage of BLSU, MICU and helicopters/ planes out of the total EMS units
8. EMS transportation units per 10,000 citizens
9. EMS vehicles per 100 km road length of total public roads
10.-11. Percentage of EMS responses which meet the demand for response time; to be accompanied by a data item "The demand for a response time, min".
12. Average response time of EMS, min
D4.9 Developing a Road Safety Index
63
13. Percentage of beds in certified trauma centres and trauma departments of hospitals out of the total
14. Number of the total trauma care beds per 10,000 citizens
For the Preparation of the European Road Safety Action Programme 2011-2020, the following measures were mentioned to improve post impact care at European, national and local levels:
• Acknowledge that the quality of the emergency medical system is key to achieving a safe traffic system.
• Review the potential contribution of improved emergency medical response to targets and strategies.
• Measure emergency medical response times between the crash scene and arrival at a medical center against international best practice.
• Promote first responder schemes and in-service training for professional and commercial drivers.
• Promote eCall.
At the moment, there is no systematic dataset within Europe, describing the current situation of trauma management in the European countries.
Conclusions about trauma management SPIs
• Ideal trauma management SPI: this is an index that is compiled from seven indicators, which are combined into fourteen specific estimates.
• Status: This indicator is well developed but in most EU countries, this information is hard to collect on an annual basis.
4.10. Data and choice of indicators for the Road Safety Index
When gathering the available data, it appeared that the most current data which are mostly available, are of 2008. Therefore, this year is taken as the starting point.
As most countries have data of one or more of the required data sources, there was not need to keep one out, except for Iceland who has no single SPI indicators available.
Issues concerning data per SPI:
• As to the SPI for drunk-driving, the ideal indicators are not available for at least 50% of the European countries. This ends up in the choice between leaving the drink-driving indicator out of the SPI index, or using imperfect indicators that are available for (somewhat) more than 50% of the countries. Since a lot of SPI indicators are not available, the drink-driving indicators that are available for more than 50% of the countries were used. These are the amount of alcohol tests per 1000 inhabitants and the proportion of drivers in these test found over the limit.
• For three safety areas, DRL, trauma management, and road infrastructure no systematic indicators are currently available for the countries. Furthermore, the indicators on drug-impaired driving were not selected for the analysis due to data un-availability for the majority of countries.

D4.9 Developing a Road Safety Index
64
• As to speed, percentage of vehicles over the speed limits and average speeds, for three categories of roads - motorways, rural and urban - are the preferred indicators for the analysis. However, these indicators are not available for the majority of countries (see, e.g., ETSC PIN 16).
• Concerning the use of protective systems in cars, seat belt wearing rates on front and rear seats of cars are measured and reported by many countries, and are also widely used for international comparisons (e.g. OECD/ITF, 2011). The indicator of use of child restraints is problematic due to methodological reasons and is also unavailable for most countries.
• Concerning vehicle indicators, indicators of crashworthiness are available (SafetyNet and ETSC PIN-flash 13). However, it is not clear whether this will be updated in the future. The indicator of "Child protection of new passenger cars sold in 2008" was excluded, as no final score per country is available for this measure; three other indicators were kept. The indicator of median age of the passenger car fleet was considered as realizable, i.e. can be estimated annually using UNECE database. The share of (very) old cars was not used because the median age and the renewal rate of passenger cars were already used as indicators. In addition, a common definition for "old" cars is absent. The indicators of vehicle fleet composition - share of goods vehicles and share of powered two-wheelers, were originally suggested to be part of the SPI layer. In this report, it was decided to add these indicators to the "Structure and Culture" layer.
Table 4.1 summarizes ideal SPIs and current status in development and use of each SPI.
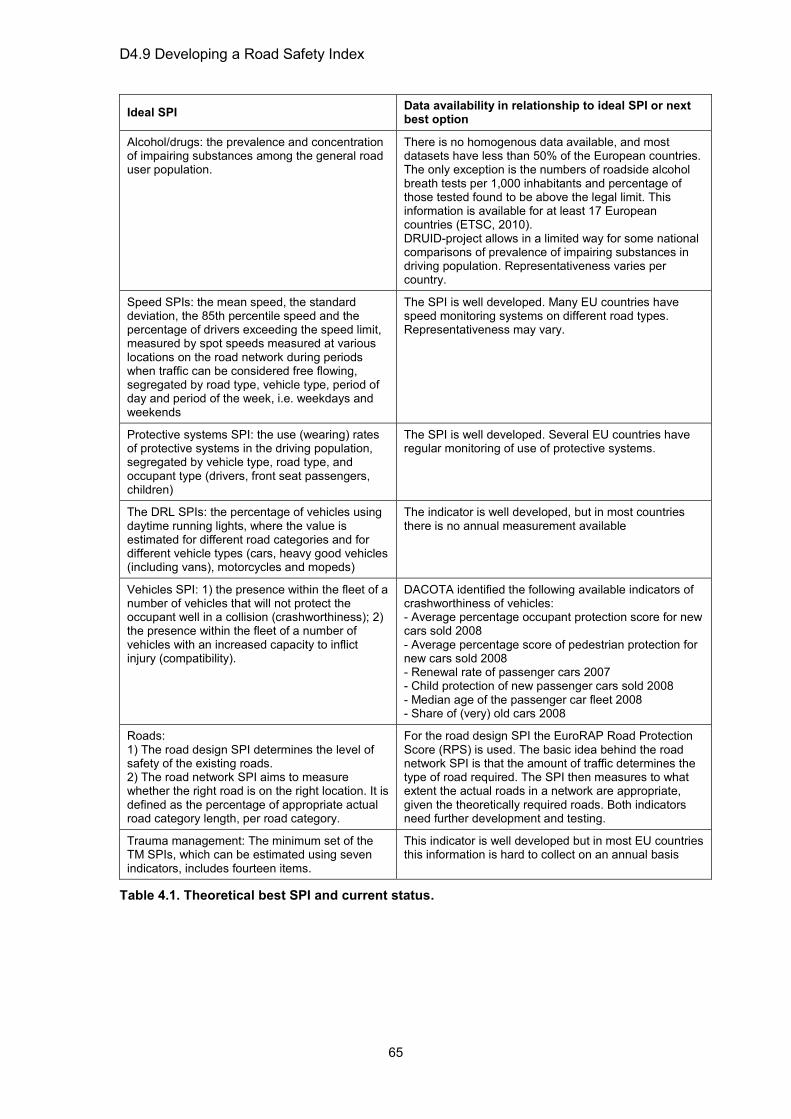
D4.9 Developing a Road Safety Index
65
Ideal SPI Data availability in relationship to ideal SPI or next best option
Alcohol/drugs: the prevalence and concentration of impairing substances among the general road user population.
There is no homogenous data available, and most datasets have less than 50% of the European countries. The only exception is the numbers of roadside alcohol breath tests per 1,000 inhabitants and percentage of those tested found to be above the legal limit. This information is available for at least 17 European countries (ETSC, 2010). DRUID-project allows in a limited way for some national comparisons of prevalence of impairing substances in driving population. Representativeness varies per country.
Speed SPIs: the mean speed, the standard deviation, the 85th percentile speed and the percentage of drivers exceeding the speed limit, measured by spot speeds measured at various locations on the road network during periods when traffic can be considered free flowing, segregated by road type, vehicle type, period of day and period of the week, i.e. weekdays and weekends
The SPI is well developed. Many EU countries have speed monitoring systems on different road types. Representativeness may vary.
Protective systems SPI: the use (wearing) rates of protective systems in the driving population, segregated by vehicle type, road type, and occupant type (drivers, front seat passengers, children)
The SPI is well developed. Several EU countries have regular monitoring of use of protective systems.
The DRL SPIs: the percentage of vehicles using daytime running lights, where the value is estimated for different road categories and for different vehicle types (cars, heavy good vehicles (including vans), motorcycles and mopeds)
The indicator is well developed, but in most countries there is no annual measurement available
Vehicles SPI: 1) the presence within the fleet of a number of vehicles that will not protect the occupant well in a collision (crashworthiness); 2) the presence within the fleet of a number of vehicles with an increased capacity to inflict injury (compatibility).
DACOTA identified the following available indicators of crashworthiness of vehicles: - Average percentage occupant protection score for new cars sold 2008 - Average percentage score of pedestrian protection for new cars sold 2008 - Renewal rate of passenger cars 2007 - Child protection of new passenger cars sold 2008 - Median age of the passenger car fleet 2008 - Share of (very) old cars 2008
Roads: 1) The road design SPI determines the level of safety of the existing roads. 2) The road network SPI aims to measure whether the right road is on the right location. It is defined as the percentage of appropriate actual road category length, per road category.
For the road design SPI the EuroRAP Road Protection Score (RPS) is used. The basic idea behind the road network SPI is that the amount of traffic determines the type of road required. The SPI then measures to what extent the actual roads in a network are appropriate, given the theoretically required roads. Both indicators need further development and testing.
Trauma management: The minimum set of the TM SPIs, which can be estimated using seven indicators, includes fourteen items.
This indicator is well developed but in most EU countries this information is hard to collect on an annual basis
Table 4.1. Theoretical best SPI and current status.

D4.9 Developing a Road Safety Index
66
Table 4.2 provides an overview of the SPI indicators selected for construction of the CI. For each indicator year of data and data source are provided.
Safety area considered
Selected SPI indicator and year of data
Source
Alcohol-impaired driving
1. Percentage of drivers above legal alcohol limit in roadside checks 2008
ETSC PIN 16
2. Roadside police alcohol tests per 1,000 population 2008
ETSC PIN 16
Use of protective systems in cars
3. Daytime seat belt wearing rates on front seats of cars (aggregated for driver and front passenger) 2009
ETSC PIN 16
4. Daytime wearing rates of seat belts on rear seats of cars 2009
ETSC PIN 16
Vehicles: Crashworthiness of the passenger car fleet
5 Average percentage occupant protection score for new cars sold 2008
ETSC PIN 13
6 Average percentage score of pedestrian protection for new cars sold 2008
ETSC PIN 13
7 Renewal rate of passenger cars 2007 ETSC PIN 13
8 Median age of the passenger car fleet 2008 UNECE
Table 4.2. Selected SPI indicators for CI, and year and source of data.
4.11. Concluding remarks Summarizing and concluding this chapter:
• Safety performance indicators (SPIs) are measures (indicators), reflecting those operational conditions of the road traffic system, which influence the system’s safety performance. Basic features of SPIs are their ability to measure unsafe operational conditions of the road traffic system and their regular repeated measurement independent from specific safety interventions.
• SPIs are aimed at serving as assisting tools in assessing the current safety conditions of a road traffic system, monitoring the progress, measuring impacts of various safety interventions, making comparisons, and for other purposes.
• SPIs that seem theoretically at least well developed are SPIs for speed, DRL, protective systems, trauma management.
• SPIs which are in need of further theoretical and empirical development are the SPIs for road design and road network design and vehicle safety.
• Possible areas for the development of new SPIs concern inattentive driving and fatigued driving.
• Ideally for a RS index, it would be preferable to have safety performance indicators on speed, alcohol, use of protective systems drugs, DRL, vehicle safety, roads, trauma management, and perhaps even driver inattention and fatigue.
• Due to data restrictions, indicators were available for alcohol-impaired driving, use of protective systems in cars and vehicles, but not for roads, speeds, drug-impaired driving, trauma management, inattention and fatigue.

D4.9 Developing a Road Safety Index
67
4.12. References Aarts, L., and Van Schagen, I.N.L.G. (2006). Driving speed and the risk of road crashes; A review. Accident Analysis and Prevention, 38 (2), pp. 215-224.
Ablaßmeier, W., et al. (2007). Opportunities for a worldwide compatibility evaluation. Proceedings of the 20th International Technical Conference on Enhanced Safety of Vehicles ESV, 18-21 June 2007, Lyon, France. Paper nr. 07-0323-O. National Highway Traffic Safety Administration NHTSA, Washington D.C.
Assum, T., and Sørensen, M. (2010). Safety Performance Indicator for alcohol in road accidents—International comparison, validity and data quality. Accident Analysis and Prevention, 42, pp. 595–603.
Blomberg, R.D., Peck, R.C., Moskowitz, H., Burns, M., and Fiorentino, D. (2005). Crash risk of alcohol involved driving: A case-control study. Dunlap and Associates, Inc., Stamford.
Brennan, P.W., Everest, E.R., Griggs, W.M., Slater, A., Carter, L., Lee, C. et al. (2002) Risk of death among cases attending South Australian major trauma service after severe trauma: 4 years operation of a state trauma system. The Journal of Trauma, 53, pp. 333-339
Brouwer, R.F.T., Jansen, W.H., Theeuwes, J., Duistermaat, M., and Alferdinck, J.W.A.M. (2004). Do other road users suffer from the presence of cars that have their daytime running lights on? TNO report TM-04-C001. TNO Human Factors, Soesterberg.
Caird, J.K., Willness, C.R., Steel, P., and Scialfa, C. (2008). A meta-analysis of the effects of cell phones on driver performance. Accident Analysis and Prevention, 40 (4), pp. 1282-1293.
Cameron, M.H., Finch, C.F., Newstead, S.V., Le, T.M., Graham, A., Pappas, M., and Haley, J. (1995). Measuring Crashworthiness: Make/Model ratings and the influence of Australian Design Rules for motor vehicle safety. Proceedings Proceedings International Research Council on the Biomechanics of Injury, Gothenborg, Sweden, pp. 297–310.
CEC (2003). European road safety action programme: Halving the number of road accident victims in the European Union by 2010: A shared responsibility. Commission of the European Communities (CEC), Communication from the Commission 2003) 311 final.
Dijkstra, A. (2003). Kwaliteitsaspecten van duurzaam-veilige weginfrastructuur. R-2003-10. SWOV Institute for Road Safety Research, Leidschendam.
EC (2008). Commission directive.../…/EC of […] amending, for the purposes of its adaptation to technical progress, Council Directive 76/756/EEC concerning the installation of lighting and light-signalling devices on motor vehicles and their trailers. Draft Directive. http://ec.europa.eu/enterprise/automotive/tcmv_meetings/0632-08/en.pdf.
Castle, J., Lynam, D., Martin, J., Lawson, S.D., and Klassen, N. (2007). Star rating roads for safety: UK trials 2006-07. IAM Motoring Trust, London.
Commission Directive 2008/89/EC of 24 September 2008 amending, for the purposes of its adaptation to technical progress, Council Directive 76/756/EEC concerning the installation of lighting and light-signalling devices on motor vehicles and their trailers (Text with EEA relevance)
Crisler, M., Brooks, J., Ogle, J., Guirl, C., Alluri, P., and Dixon, K. (2008). Effect of Wireless Communication and Entertainment Devices on Simulated Driving Performance. Transportation Research Record: Journal of the Transportation Research Board, 2069 (1), pp. 48-54.
DfT (1995). Cars: Make and Model: The risk of driver injury and car accident rates in Great Britain: 1993. Transport Statistics Report. Department for Transport, Her Majesty’s Stationery Office, London.
Dibben, N., and Williamson, V.J. (2007). An exploratory survey of in-vehicle music listening. Psychology of Music, 35 (4), pp. 571-589.

D4.9 Developing a Road Safety Index
68
Dijkstra, A., and Louwerse, R. (2010). A procedure to test the safety level of road design elements. 4th International Symposium on Highway Geometric Design. 2-5 June 2010, Valencia, Spain.
DRUID (2011a). Prevalence of alcohol and other psychoactive substances in drivers in general traffic. Part I: General results. Deliverable D.2.2.3. 6th Framework Programme. Project No. TREN-05-FP6TR-S07.61320-518404-DRUID
DRUID (2011b). Risk of injury by driving with alcohol and other drugs. 6th Framework Programme. Deliverable D2.3.5. Project No. TREN-05-FP6TR-S07.61320-518404-DRUID
EC DG-TREN (2010). Technical Assistance in support of the Preparation of the European Road Safety Action Programme 2011-2020. Final Report. European Commission DG-TREN, Brussels.
EPandC (2008). Directive on road infrastructure safety management. Directive 2008/96/EG of the European parliament and of the council. Official Journal of the European Union, pp. L319/59-67, Brussels.
Eksler, V., Allenbach, R., Holló, P., Schoon, C. (2007). Protective systems. In: Hakkert, A.S., Gitelman, V., and Vis, M.A. (Eds.). Road safety performance indicators: Theory. Deliverable D3.6 of the EU FP6 project SafetyNet, pp. 54-73.
Elvik, R., Christensen, P., and Olsen, S.F. (2003). Daytime running lights; A systematic review of effects on road safety. Report 688/2003. Institute of Transport Economics TØI, Oslo.
Elvik, R., and Vaa, T. (2004). The Handbook of Road Safety Measures. Elsevier, Amsterdam.
Elvik, R., Høye, A., Vaa, T., and Sørensen, M. (2009). The handbook of road safety measures. Second Edition. Emerald Group Publishing, Bingley, UK.
ETSC (2001). Transport Safety Performance Indicators. European Transport Safety Council ETSC, Brussels.
ETSC (2010). Tackling the three main killers on the roads. A priority for the forthcoming EU Road Safety Action Programme. PIN Flash n.16. European Transport Safety Council ETSC, Brussels.
Gitelman, V., Hakkert, S., Hasse, A., and Lerner, M. (2007). Methodological fundamentals for safety performance indicators. In: Hakkert, A.S., Gitelman, V., and Vis, M.A. (Eds.). Road safety performance indicators: Theory. Deliverable D3.6 of the EU FP6 project SafetyNet. www.erso.eu.
Gitelman, V., Doveh, E., and Hakkert, S. (2010). Designing a composite indicator for road safety. Safety Science, 48 (9), pp. 1212-1224.
Gustafsson, H., Hagg, A., Krafft, M., Kullgren, A., Malmstedt, B., Nygren, A., and Tingvall, C. (1989). Folksam car model safety rating 1989–90. Folksam Insurance.
Hakkert, S. (2007). Summary and conclusions. In: Hakkert, A.S., Gitelman, V., and Vis, M.A. (Eds.). Road safety performance indicators: Theory. Deliverable D3.6 of the EU FP6 project SafetyNet, pp. 152-157.
Hakkert, A.S., and V. Gitelman (Eds.) (2007). Road safety performance indicators: Manual. Deliverable D3.8 of the EU FP6 project SafetyNet.
Hakkert, A.S, Gitelman, V., and Vis, M.A. (Eds.) (2007). Road safety performance indicators: Theory. Deliverable D3.6 of the EU FP6 project SafetyNet.
Harwood, D.W., Bauer, K.M., Gilmore, D.K., Souleyrette, R., and Hans, Z.N. (2010). Validation of the usRAP Star Rating Protocol for Application to Safety Management of U.S. Roads. Compendium of papers (CD-ROM). 89th Annual Meeting of the Transportation Research Board, 10-14 January 2010, Washington D.C.
D4.9 Developing a Road Safety Index
69
Hauer, E. (1982). Traffic conflicts and exposure. Accident Analysis and Prevention, 14, pp. 359-364.
Hermans, E., Brijs, T., and Wets, G. (2008). Developing a Theoretical Framework for Road Safety Performance Indicators and a Methodology for Creating a Performance Index. RA-MOW-2008-010. Steunpunt Mobiliteit and Openbare Werken – Spoor Verkeersveiligheid, Diepenbeek, Belgium.
Hermans, E., Ruan, D., Brijs, T., Wets, G., and Vanhoof, K. (2010). Road safety risk evaluation by means of ordered weighted averaging operators and expert knowledge. Knowledge-Based Systems, 23 (1), pp. 48-52.
Holló, P., Gitelman,, V., Amelink, B, M., and Schoon, C. (2007). Daytime Running Lights, pp. 74-82. In: Hakkert, A.S., Gitelman, V., and Vis, M.A. (Eds.). Road safety performance indicators: Theory. Deliverable D3.6 of the EU FP6 project SafetyNet.
Horrey, W. J., and Wickens, C. D. (2006). Examining the Impact of Cell Phone Conversations on Driving Using Meta-Analytic Techniques. Human Factors: The Journal of the Human Factors and Ergonomics Society, 48 (1), pp. 196-205.
IRTAD (2003). The availability of hospitalized road user data in OECD countries. IRTAD special report, Organisation for Economic Co-operation and Development OECD, Paris.
IRTAD (2010). IRTAD Database, June 2010 - Risk Indicators. IRTAD, Brussels.
Jeanne Breen Consulting (2009). Car telephone use and road safety. Final report. An overview prepared for the European Commission. Skipton, UK. http://ec.europa.eu/transport/road_safety/specialist/knowledge/mobile/car_telephone_use_and_road_safety.pdf, accessed August 15 2011.
Jost, G., Popolizio, M., Allsop, R., and Eksler, V. (2010). Road Safety Target in Sight: Making up for lost time 4th Road Safety PIN Report. ETSC, Brussels.
Keall, M., Newstead, S., and Jones, W. (2007). Projecting effects of improvements in passive safety of the New Zealand light vehicle fleet. Traffic Injury Prevention, 8 (3), pp. 275-280.
Lynam, D, T., Hummel, T., Barker, J., and Lawson, S.D. (2004). European Road Assessment Programme EuroRAP I Technical Report, AA Foundation for Road Safety Research, Farnborough.
Lynam, D. (2012). Development of Risk Models for the Road Assessment Programme. TRL Report CPR1293. TRL, iRAP, London.
Mann, N., Clay, M.S., Mullins, R.J., MacKenzie, E.J., Jurkovich, G.J., and Mock, C.N. (1999). A systematic review of trauma system effectiveness based on registry comparisons. The Journal of Trauma, 47, pp. 546-555.
Méndez, Á.G., Izquierdo, F.A., and Ramírez, B.A. (2010). Evolution of the crashworthiness and aggressivity of the Spanish car fleet. Accident Analysis and Prevention, 42, pp. 1621–1631.
Meesmann, U., Boets, S., and Tant, M. (2009). MP3 players and traffic safety; "state of the art". Brussels: BIVV, Belgian Road Safety Institute.
Mori, T., Kudo, T., Kosaka, N., and Motojima, H. (2007). The study of the frontal compatibility with consideration of interaction and stiffness. In: Proceedings of the 20th International Technical Conference on Enhanced Safety of Vehicles ESV, 18-21 June 2007, Lyon, France. Paper nr. 07-0105-O. National Highway Traffic Safety Administration NHTSA, Washington D.C.
Nasar, J., Hecht, P., and Wener, R. (2008). Mobile telephones, distracted attention, and pedestrian safety. Accident Analysis and Prevention, 40 (1), pp. 69-75.

D4.9 Developing a Road Safety Index
70
Neider, M.B., McCarley, J.S., Crowell, JA., Kaczmarski, H., and Kramer, A. F. (2010). Pedestrians, vehicles, and cell phones. Accident Analysis and Prevention, 42 (2), pp. 589-594.
Newstead, S.V., Keall, M.D., and Watson, L.M. (2011). Rating the overall secondary safety of vehicles from real world crash data: The Australian and New Zealand total secondary safety index. Accident Analysis and Prevention, 43, pp. 637–645
OECD (2001). Ageing and transport, mobility needs and safety issues. Organisation for Economic Co-operation and Development OECD, Paris.
OECD/ITF (2011). IRTAD annual report 2010. Organisation for Economic Co-operation and Development OECD / International Transport Forum ITF, Paris.
Olson, R.L., Hanowski, R.J., Hickman, J.S., and Bocanegra, J. (2009). Driver distraction in commercial vehicle operations (No. FMCSA-RRR-09-042). U.S. Department of Transportation DOT, Federal Motor Carrier Safety Administration FMCSA, Washington, D.C.
O’Neill, B. (2009). Preventing passenger vehicle occupant injuries by vehicle design; A historical perspective from IIHS. Traffic Injury Prevention, 10 (2), pp. 113-126.
Page, Y. (2001). A statistical model to compare road mortality in OECD countries. Accident Analysis and Prevention, 33, pp. 371–385.
Peden, M., Scurfield, R., Sleet, D., Mohan, D., Hyder, A., Jarawan, E., and Mathers, C. (Eds.) (2004): World report on road traffic injury prevention. World Health Organisation, Geneva.
Rackliff, L., Haddak, M., Page, M., and Vis, M.A. (2007). Vehicles (passive safety. Chapter 8. In: Vis, M.A., and Van Gent, A.L. (Eds.). Road safety performance indicators: Country comparisons. Deliverable D3.7a of the EU FP6 project SafetyNet.
SafetyNet (2008). Traffic safety basic facts 2007: main figures. Deliverable D1.17 of the EU FP6 project SafetyNet.
SafetyNet (2009a). Post impact care. SafetyNet webtext retrieved February14th 2012.
SafetyNet (2009b). Pedestrians and cyclists, retrieved February14th 2012.
Schulze, H., Schumacher, M., Urmeew, R., and Auerbach, K. (2012). Final report: Work performed, main results and recommendations. 6th Framework Programme. Deliverable (0.1.8). BASt, Bergisch Gladbach.
Simons, R., Eliopoulos, V., Laflamme, D., and Brown D.R. (1999). Impact on process of trauma care delivery 1 year after the introduction of a trauma programme in a provincial trauma center. The Journal of Trauma, 46, pp. 811-815.
Stavrinos, D., Byington, K.W., and Schwebel, D.C. (2009). Effect of cell phone distraction on pediatric pedestrian injury risk. Pediatrics, 123 (3), pp.179-185.
Stavrinos, D., Byington, K.W., and Schwebel, D.C. (2011). Distracted walking: cell phones increase injury risk for college pedestrians. Journal of Safety Research, 42, pp. 101-107.
SWOV (2010). Seat belts and child restraint seats. SWOV Fact sheet, December 2010. SWOV Institute for Road safety Research, Leidschendam.
Tapio, J., Pirtala, P., Ernvall, T. (1995). The accident involvement and injury risk rates of car models. University of Oulu, Publications 30.
Vis, M.A., and Van Gent, A.L. (Eds.) (2007). Road safety performance indicators: Country comparisons. Deliverable D3.7a of the EU FP6 project SafetyNet.
Wegman, F., Commandeur, J., Doveh, E., Eksler, V., Gitelman, V., Hakkert, S., Lynam, D., and Oppe, S. (2008). SUNflowerNext: Towards a composite road safety performance index. SWOV Institute for Road Safety Research, Leidschendam.
D4.9 Developing a Road Safety Index
71
Wegman, F., and Oppe, S. (2010). Benchmarking road safety performances of countries. Safety Science, 48 (9), pp. 1203-1211.
Weijermars, W., Gitelman, V., Papadimitriou, E, and Lima de Azevedo, C. (2008). Safety performance indicators for the road network. Association for European Transport and contributors 2008.
Yannis, G., Weijermars, W., Vis, M., Gitelman, V., Chazirisa, A., Papadimitriou, E., Lima de Azevedo, C. (submitted). Road safety performance indicators for the interurban road network. Manuscript submitted to AAP; under review.

D4.9 Developing a Road Safety Index
72
5. ROAD SAFETY POLICY INDICATORS
Paul Wesemann SWOV
Charlotte Bax SWOV
5.1. Introduction This chapter deals with the fourth layer of the pyramid of the target hierarchy in Figure 1.1. (copied in Figure 5.1). It relates to the government activities that are aiming at reducing the damages resulting from road traffic accidents. Or saying it in terms of the pyramid: the policy performance that produces certain outcomes. The pyramid indicates safety measures and programmes as the output of road safety policy; improved Safety Performance Indicators (SPI’s) and less killed and injured persons are indicated as the intermediate and final outcomes resulting from road safety policy. The goal of this part of the composite index study is to define valid and reliable indicators for this road safety policy performance, to collect data on these indicators and to develop a composite index for this layer based on these indicators. This chapter deals with the identification of valid indicators.
Figure 5.1. A target hierarchy for road safety (Koornstra et al., 2002; LTSA, 2000).
This chapter presents in Section 5.2. the setup of this study. Section 5.3 reports on the actual insights into the effectiveness of road safety policy on the basis of available literature. Section 5.4. presents the results of a recently performed investigation by WP 1 on the validation of indicators of policy performance. Section 5.5 concludes on the development of indicators of policy performance and a composite index.
D4.9 Developing a Road Safety Index
73
5.2. Set up of the study
5.2.1. Conceptual framework The concept of policy performance has originally been introduced in a New Zealand policy document on road safety (LTSA,2000). Measures and programmes were defined as the variables that represent the output of this performance (see Figure 5.1).
Building on this concept the variables “measures and programmes” have been operationalized in the SUNflower study (Koornstra et al.,2002). In four casestudies measures and action programmes in the 3 SUN-countries (Sweden, United Kingdom and the Netherlands) were described in great detail. The four following policy areas were selected because of their major potential for road safety: drinking and driving, seat belt and child restraint use, local infrastructural improvements on urban and minor rural roads, and improvements on main inter-urban roads.
The concept of policy performance was modified in the SUNflowerNext study (Wegman, 2008). Instead of the original variables of action plans and individual countermeasures, the conditions to produce this policy output were defined as variables that represent the quality of policy (strategies, programmes, resources, coordination, institutional settings, etc). Five basic indicators were selected for the quality of road safety policies: safety targets, selection of interventions, economic evaluation, monitoring the performance of the programme, ’, and stakeholders within the programme. A number of values (categories) was assigned to each indicator (e.g. 3 values for safety targets: ambitious/ available but not ambitious/not available).
Simultaneously with SUNflowerNext, the Worldbank has elaborated country guidelines for capacity reviews of road safety management (Bliss and Breen, 2009). They refined the layer structure of the pyramid by sub-dividing the layer of policy performance into two levels: Institutional Management Functions and Interventions. Also they added a sub-layer Outputs (i.e. physical quantity of each intervention), forming a link between the Interventions and the resulting (safety) Outcomes.
The layer of Institutional management functions comprised similar variables as the layer that was called the layer of policy conditions inSUNflowerNext: results focus, coordination, legislation, funding and resource allocation, promotion, monitoring and evaluation, RandD and knowledge transfer.
Thus in search for valid indicators for policy performance, many options are open. Firstly we may choose a restricted definition of policy performance or a comprehensive one. A restricted definition does focus on concrete measures and action programmes that are implemented in a country. They can serve as indicators for the quality of policy performance. In order to determine their effectiveness, they should be described in detail, qualitatively and quantitatively. As criteria to validate these indicators, we may choose the effect on intermediate outcomes (SPIs) and/or on final outcomes (killed and injured persons).
A comprehensive definition of policy performance includes in addition also the conditions that determine effective measures and programmes. In fact, we then insert an additional layer of explanatory variables into the pyramid, which is called ‘Institutional management functions’ by (Bliss and Breen, 2009). As criteria to validate these indicators, we may choose the effect on the production of effective measures, on intermediate outcomes (SPIs) and/or on final outcomes (killed and injured persons).

D4.9 Developing a Road Safety Index
74
5.2.2. Needs for knowledge and data In order to define valid indicators of policy performance according to the comprehensive definition, ideally, we have to make the following 3 steps:
1. Choosing hypothetical indicators of the quality of policy performance, both the management functions and the measures
2. a. Data collection on the state of the management functions in many different countries b. Data collection on the measures in these countries c. Data collection on the (intermediate and final) road safety outcomes in these countries
3. a. Analysis of the relations between the (quality of the) management functions on the one hand and the (quality of the) measures and outcomes on the other hand b. Analysis of the relations between the (quality of the) measures on the one hand and the (quality of the) outcomes on the other hand.
If the restricted definition of policy performance is chosen, part of step 1 and the steps 2a and 3a may be omitted. If the comprehensive definition is chosen, step 2b and 3b can hardly be missed. The contribution of the institutional management functions to the production of effective measures is the primary criterion for testing the validity of the indicators of these functions. It is highly improbable that the quality of the policy performance can exclusively be judged by the quality of the management functions, i.e. without taking into account also the quality of the measures and programmes. For statistical association between management functions and (intermediate and/or final) outcomes cannot be understood correctly without knowing the intervening measures. As a consequence, we will also need valid indicators and data on all effective measures in case we would choose the comprehensive definition of policy performance.
We did start with a review of literature covering all these 3 steps. Having identified the gaps in the necessary knowledge and data, we have prioritized the subject and method of our study.
5.3. Knowledge on quality of policy performance The last decade, good practice in road safety policymaking has received much attention, for effective measures as well as for the organization of policies. Recently a series of leading reports on institutional management functionshas been published (OECD, 2002; Koornstra et al., 2002; Peden et al., 2004; Muhlrad, 2005; ETSC, 2006; Wegman et al., 2008; OECD, 2008; Bliss and Breen, 2009). The most recent report (Bliss and Breen, 2009) presents an integral vision partly building on the preceding studies and drawing on various international case studies. Following citation from this report presents in a nutshell the state of the art relating to the institutional management functions:
“Seven institutional management functions provide the foundation of an effective national road safety management system:
• Results focus in its ultimate expression concerns a strategic orientation that links all actual and potential interventions with results, analyses what can be achieved over time, and sets out a performance management framework for the delivery of interventions and their intermediate and final outcomes. It defines the level of safety which a country wishes to achieve expressed in terms of a vision, goals, objectives and related targets.
D4.9 Developing a Road Safety Index
75
• Coordination concerns the orchestration and alignment of the interventions and other related institutional management functions delivered by government partners and related community and business partnerships to achieve the desired focus on results.
• Legislation concerns the legal instruments necessary for government purposes to specify the legitimate bounds of institutions, in terms of their responsibilities, accountabilities, interventions and related institutional management functions to achieve the desired focus on results.
• Funding and resource allocation concerns the financing of interventions and institutional management functions on a sustainable basis using a rational evaluation framework to allocate resources to achieve the desired focus on results.
• Promotion concerns the sustained communication of road safety as a core business for government and society (ie civil society and business entities; pw) and emphasizes the shared societal responsibility to support the delivery of the interventions required to achieve the desired focus on results.
• Monitoring and evaluation concerns the systematic and ongoing measurement of road safety outputs and outcomes (intermediate and final) and the evaluation of interventions to achieve the desired focus on results.
• Research and development and knowledge transfer concerns the systematic and ongoing creation, codification, transfer and application of knowledge that contributes to the improved and efficiency and effectiveness of the road safety management system to achieve the desired focus on results.
Effective road safety management requires shared multisectoral responsibility for results and as highlighted in the World report on road traffic injury prevention (Peden et al., 2004), the establishment of a lead agency is a prerequisite for effective country road safety organization. Within government the lead agency takes on the ownership of road safety and deals with all seven institutional management functions.” (end of citation, p. 69)
Relating to the choice of effective interventions it is stated:
“Interventions are shaped to achieve the desired focus on results. ….These guidelines are designed to draw on the comprehensive findings on interventions presented in the World report (Peden et al., 2004) which they do not attempt to reproduce. For the purposes of specifying country investment strategies and related implementation projects, information on interventions should be sourced from the World report and the comprehensive literature it cites. …The level of safety is ultimately determined by the quality of the delivered interventions, which in turn are determined by the quality of the country’s institutional management functions.” (end of citation, p. 12)
In addition, a shift in road safety management thinking and practices is proposed towards the Safe System approach (like the Dutch Sustainable Safety and the Swedish Vision Zero):
“The tools and accumulated practices used to support the results management framework for the Safe System approach are the same as those used in the past to prepare targeted national plans. Targets are still set as milestones to be achieved on the path to the ultimate goal, but the interventions are now shaped by the level of ambition, rather than vice versa. ….In moving forward, the Safe System approach reinterprets and revitalizes what is already known about road safety, and raises critical issues about the wider adoption of interventions that have proven to be effective in eliminating deaths and serious injuries. The question becomes one of how to introduce these proven safety interventions more comprehensively and rapidly. “ (end of citation, p. 15)

D4.9 Developing a Road Safety Index
76
In search for indicators of both the quality of measures and of management functions, more information can be found in the report Towards zero (OECD, 2008). This report not only presents the management functions of Bliss and Breen, but also an overview of effective measures, in the immediate term and in the longer term. Chapter 3 gives an overview of key interventions for immediate benefits with many references to literature (e.g. various review articles, reports and handbooks; Peden et al., 2004; OECD 2002; Elvik et al., 2009; Supreme, 2007). Chapter 5 recommends the safe system approach for longer term benefits. Traditional methods are expected to show an inevitable levelling off in performance. Although the amount and pace of the benefits of a move towards this new approach are less certain, over the long term, a far greater improvement in performance can be expected then from traditional methods.
All forementioned reports address the responsibility of governments to reduce death and serious injury in traffic on public roads. Recently, an international standard of the International Organization for Standardization (ISO) was released on road traffic safety management systems (ISO 39001, 2012). This standard is applicable to any organization that interacts with the road traffic system, public or private, regardless of size and complexity, for example: a supermarket, a school, transport companies of people (bus, taxi) or goods (haulage providers). The standard identifies elements of good road safety management functions that are taken from the guidelines of Bliss and Breen (2009). Not all elements will apply to any organization and certainly not in a uniform way. The standard addresses management functions and not the quality requirements of goods, people or services. It is expected that organizations will achieve better intermediate or final safety outcomes by adopting this standard.
DacoTa WP 1 has reviewed the literature on policy making factors (Muhlrad et al., 2011) They found little evidence-based findings on the relationship between certain components of the road safety management system (practically synonymous with institutional management functions) and road safety outcomes. It was decided to develop an investigation model with hypotheses of “good practice” and the criteria which characterize them best, making use of the points of convergence in the literature. An extensive questionnaire was constructed to enable in-depth comparisons between countries’ forms of organization and identify “good practice” where it is found. This questionnaire reflects in some sense a state of the art on policy making factors (Appendix 2 in Muhlrad et al., 2011). The questions related to five main areas of Road Safety Management:
1. Institutional organization, coordination and stakeholders’ involvement
2. Policy formulation and adoption
3. Policy implementation and funding
4. Monitoring and evaluation
5. Scientific support and information, capacity building
Our review of literature aims at defining valid indicators for effective measures and effective management functions. The quoted sources do touch upon the subject, but usable results are still far away, especially for management functions.
• The institutional management functions are, almost without exception, described qualitatively and need further operationalization. Moreover, their impact will frequently depend on its quantity or intensity and thus quantitative values (categories) should be assigned to the variables. In the absence of operational
D4.9 Developing a Road Safety Index
77
indicators, of course no country assessments exist on this subject. And last but not least, very little empirical proof exists on the effects of institutional management functions on the choice of effective measures and/or on the safety outcomes. The forementioned general reports build mostly on examples of good practice countries. The qualitative analyses seem convincing and in accordance with certain management theories. But crucial questions still remain to be answered:
• Must all institutional management functions completely be executed to produce sufficient (and what does that mean?) effective measures and reduction of fatalities?; When are functions completely executed?
• Are some functions more important then others and how does this relate to the production of measures and outcomes?;
• Why do countries with similar functions produce different measures and outcomes (and vice versa: with different functions produce similar measures and outcomes)?.
Only the association between target setting and fatality reduction has been established empirically (Wong et al., 2006; Wong and Sze, 2010; Allsop et al., 2011). Another study made an attempt to determine whether there was a relationship between use of ten formal safety management tools (e.g. road safety audit, impact assessment, black spot analysis) in 18 countries and their safety performance (i.e. fatality rate, fatality trend, rate trend, change in rate trend). No strong support was found that more extensive use of these tools improves safety performance, on the contrary (Elvik, 2012). At the start of this DaCoTA WP 4 activity, a third study was ongoing in the framework of WP 1 (Policy) of DaCoTa. It focussed on the effectiveness of policy performance in 30 European countries. This study will be discussed amply in Section 5.4.
The knowledge of effective measures is much more developed than the knowledge of management functions. A voluminous body of evaluation studies does exist and has been reviewed in many publications. However, a checklist of operational indicators to assess the effectiveness of a national road safety program (or a set of major measures) is not yet available. Therefore, the essential characteristics of each measure at the national level must be defined (i.e. qualitative details that determine the effectiveness, the extent of its implementation, the size of the targetgroup) as well as the national conditions on which the effectiveness depends. Essentially this is captured in a so called Crash Modification Function (OECD/ITF, 2012). Fundamental questions relating to the transferability of road safety evaluation studies have to be addressed.
Methods to solve these problems have been proposed (e.g. Gitelman and Hakkert, 2005) but have still to be applied systematically. Important proposals for international cooperation in research and documentation have recently be done to develop Crash Modification Functions and to make the results available in a transnational database. They were published by OECD/ITF in a report titled “Sharing road safety” (OECD/ITF, 2012). This database would form a solid base for a set of valid indicators for effective measures.
Once such a list of valid indicators has been established, we need the relevant data for each country on the current road safety program. Few countries dispose of topical databases that contain this type of information.
Therefore we did conclude that practically none of the 3 research steps in 5.2.2. into the definition of valid indicators of policy performance has been accomplished in
D4.9 Developing a Road Safety Index
78
literature. Only the setting of targets has been proven to contribute to the reduction of fatalities. Much research is needed on this issue. A first start has been made by Dacota WP 1 on policy making factors.
5.4. Results of the DaCoTA WP 1 investigation on policy making factors
5.4.1. Goal and terminology The purpose of the WP1 investigation was to provide in-depth comparisons between countries with different road safety performance and identify the key components of road safety management that contribute most to the reduction of road crashes and injuries (‘good practice’) in these countries.
WP1 has used the term ‘road safety management’ (RSM) instead of ‘policy performance’. This term is roughly defined as: a government area geared at reducing the number of road crashes and victims. RSM is thus justified by its outputs in terms of measures or action programmes implemented to prevent or reduce road crashes and injuries and includes activities (policy-making tasks and transversal processes) as well as the organization necessary for these activities to take place (the Road Safety Management System RSMS). (Muhlrad et al., 2011, p 18)
In this comprehensive definition of policy performance, the term ‘road safety management system’ (RSMS) refers to the institutional management functions. It is defined as: the actors, tasks and institutional structure necessary to perform road safety activities and implement policies.
The investigation of WP1 did concentrate on the components of this RSMS; little or no attention was paid to the other sub-layer of policy performance, the measures and action programmes
5.4.2. Set-up of the investigation Two data sources on the institutional management functions were used: the first was based on the extensive questionnaire that was constructed by WP1 (Muhlrad et al., 2011) (see 5.3) and the second on the less extensive questionnaire that was prepared by ETSC for the 6th PIN report on road safety management systems (Jost et al., 2012). The first questionnaire was taken in 14 European countries, the second in 30 European countries.
The outcomes of the first questionnaire survey will be presented in Section 5.4.3 and the second in Section 5.4.4. All results have been taken from Papadimitriou et al.(2012).
5.4.3. Outcomes of the extensive questionnaire survey This survey has delivered a host of valuable information on the five main areas of road safety management in 14 countries (each area being covered by a part of the questionnaire):
• Institutional organization, coordination and stakeholders’ involvement
• Policy formulation and adoption
• Policy implementation and funding

D4.9 Developing a Road Safety Index
79
• Monitoring and evaluation
• Scientific support and information, capacity building
In addition to a detailed qualitative description and comparison between the countries, correlations and rankings of countries were analysed statistically. A quantitative (clustering) analysis to rank the countries in terms of road safety management turned out to be a very demanding task. It was revealed that all the countries are quite different when road safety management systems are considered as a whole. This makes it impossible to propose a single overall ranking of RSMS. When the 5 parts of the RSMS are considered separately, however, countries can be compared and clustered. But even then, no two countries were found to belong to the exact same ranking.
Also the associations between these partial clusters and final safety outcomes (fatalities per inhabitants) were statistically analysed. Indications were found that some partial clusters do correlate with the fatality rates. However, countries that are known to have the best fatality rates are not ranked systematically at the top of the road safety management components. The results show that similar final road safety outcomes may go with substantially different RSMS.
5.4.4. Outcomes of the PIN/ Dacota questionnaire survey In order to collect data on more countries Dacota collaborated with the European Transport Safety Council who was preparing the 6th PIN report dealing with management systems (Jost et al., 2012). Part of the PIN questionnaire contained questions comparable with the extensive Dacota questionnaire.and were answered by the PIN panel members, each for their own country. This gave a general overview of the RSMS in 30 countries although in much less detail than the Dacota data. These additional data allowed a quantitative analysis on the association between RSMS components and (final and intermediate) road safety outcomes.
Data on RSMS
The data were taken from the common PIN/Dacota questionnaire. In the final analysis, 8 questions have been used. Appendix L explains how these questions were selected from the original PIN questionnaire with 32 questions. The responses are shown in Table 5.1.
PIN/Dacota question code sum of responses1. Has a national road safety vision been set in your country? 1_vision 16,52. Has a national long-term road safety strategy been set in your country? 2_strategy 225a. Is there a budget dedicated to the implementation of your national road safety programme or plan? 5a_budget 98. Does a regular evaluation of the efficiency of the road safety measures or interventions implemented in your country take place? 8_evaluation 15,59. Is there regular reporting on the road safety measures and interventions implemented in your country? 9_reporting 1910a. Are the attitudes of people towards road safety measures being measured nationally? 10a_attitudes_measures 1610b. Are the attitudes of people towards behaviour of road users being measured nationally? 10b_attitudes_behaviour 1610c. Are behaviours of road users being measured nationally? 10c_behaviours 21
scores:1=yes; partly=0.5; no=0 Table 5.1. PIN/Dacota data on road safety management system RSMS
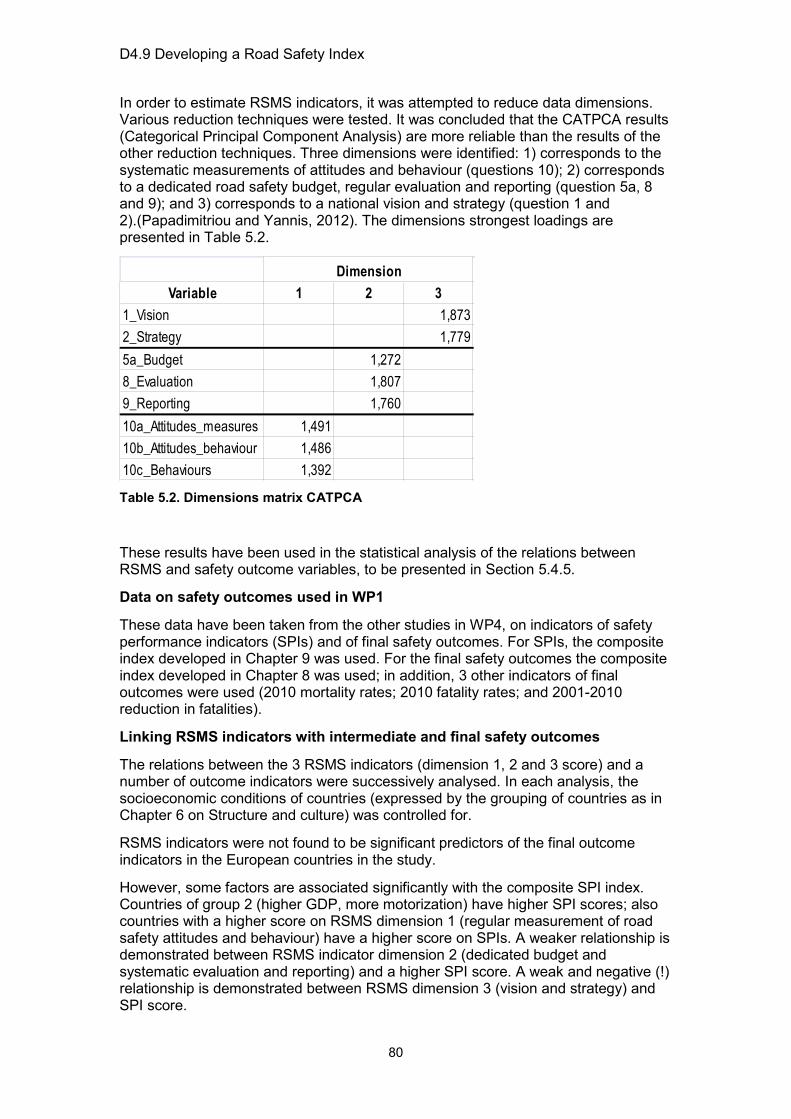
D4.9 Developing a Road Safety Index
80
In order to estimate RSMS indicators, it was attempted to reduce data dimensions. Various reduction techniques were tested. It was concluded that the CATPCA results (Categorical Principal Component Analysis) are more reliable than the results of the other reduction techniques. Three dimensions were identified: 1) corresponds to the systematic measurements of attitudes and behaviour (questions 10); 2) corresponds to a dedicated road safety budget, regular evaluation and reporting (question 5a, 8 and 9); and 3) corresponds to a national vision and strategy (question 1 and 2).(Papadimitriou and Yannis, 2012). The dimensions strongest loadings are presented in Table 5.2.
DimensionVariable 1 2 3
1_Vision 1,8732_Strategy 1,7795a_Budget 1,2728_Evaluation 1,8079_Reporting 1,76010a_Attitudes_measures 1,49110b_Attitudes_behaviour 1,48610c_Behaviours 1,392 Table 5.2. Dimensions matrix CATPCA
These results have been used in the statistical analysis of the relations between RSMS and safety outcome variables, to be presented in Section 5.4.5.
Data on safety outcomes used in WP1
These data have been taken from the other studies in WP4, on indicators of safety performance indicators (SPIs) and of final safety outcomes. For SPIs, the composite index developed in Chapter 9 was used. For the final safety outcomes the composite index developed in Chapter 8 was used; in addition, 3 other indicators of final outcomes were used (2010 mortality rates; 2010 fatality rates; and 2001-2010 reduction in fatalities).
Linking RSMS indicators with intermediate and final safety outcomes
The relations between the 3 RSMS indicators (dimension 1, 2 and 3 score) and a number of outcome indicators were successively analysed. In each analysis, the socioeconomic conditions of countries (expressed by the grouping of countries as in Chapter 6 on Structure and culture) was controlled for.
RSMS indicators were not found to be significant predictors of the final outcome indicators in the European countries in the study.
However, some factors are associated significantly with the composite SPI index. Countries of group 2 (higher GDP, more motorization) have higher SPI scores; also countries with a higher score on RSMS dimension 1 (regular measurement of road safety attitudes and behaviour) have a higher score on SPIs. A weaker relationship is demonstrated between RSMS indicator dimension 2 (dedicated budget and systematic evaluation and reporting) and a higher SPI score. A weak and negative (!) relationship is demonstrated between RSMS dimension 3 (vision and strategy) and SPI score.
D4.9 Developing a Road Safety Index
81
Interpretation of the results
It is difficult to interpret the results of this study. Questions may be raised about the set-up of the investigation, the data on the RSMS and the data on SPIs.
In order to demonstrate the effectiveness of institutional management functions, it would have been more obvious to consider also (or even merely) the relationship with the measures and programmes that are produced by the management functions. After all, the measures are the primary results of the management functions that are prerequisites for all other effects. If we would have known them, they could for example have provided an explanation for the unexpected negative effect of dimension 3 on the SPI score.
Attention is also attracted by the 8 remaining questions (with answer categories yes/partly/no) that provide the data on the institutional management functions. They represent a small and rather accidental selection of the many management functions that have been put forward by Bliss and Breen. In our view, the key elements of the RSMS could be covered better than by these questions.
Lastly, also the composite SPI index has its deficiencies. Important indicators are lacking (e.g. speed-indicators) and one of the alcohol indicators (number of police tests) is in fact a countermeasure. So one should be cautious when the index is used to test the effectiveness of the management functions.
In addition, Papadimitriou et al (2012) make some marginal notes on the results of the statistical analysis. The latter are indicative of a relationship between RSMS and the SPI score. However, they feel that they are not sufficient to support a strong relationship. Moreover, they are based on a small sample of countries, which is another reason to consider the results with caution.
Therefore we conclude that the validity of the chosen RSMS indicators is insufficiently established in this investigation to use them for a RS composite index.
5.5. Concluding remarks At the moment, very little knowledge is readily available on valid indicators for policy performance, neither for institutional management functions nor for measures. Operational definitions are lacking as well as data on the topical occurrence of these conditions in the countries of Europe. Just one exception from literature can be mentioned, the effect of target setting on fatality reduction. Thus, for the time being, it will not be possible to construct a composite index for the quality of policy performance of a country and to value European countries in terms of this index.
Further research into the effectiveness and efficiency of policy performance is recommended. This may aim at the valuation of either a country’s measures and programmes or of its institutional management functions, or both.
The development of indicators for effective measures can build on a voluminous body of knowledge. The creation of a transnational database of Crash Modification Functions (CMF’s) (OECD/ITF, 2012) seems feasible on the short term and would form a solid base for a set of indicators.
The development of indicators for effective management functions requires more and different research. It can make use of the comparative data from the extensive Dacota questionnaire on 14 countries. They describe in detail many aspects of road safety management. What is needed firstly are criteria for the effectiveness of these functions. The relations with the (final and intermediate) outcomes has been explored by WP1, with little success however. It is recommended to use the quality of the
D4.9 Developing a Road Safety Index
82
measures as criteria for the validation of the management indicators. It seems logical to judge the quality of management in the first place by its direct output. Ideally the indicators for effective measures based on the CMF’s should be used for this purpose. On the short term rough indicators for effective measures could be derived from existing reviews.
5.6. References Allsop, R.E., Sze, N.N., and Wong, S.C. (2011). An update on the association between setting quantified road safety targets and road fatality reduction; short communication. Accident Analysis and Prevention, 43, pp. 1279-1283.
Bliss, T., and Breen, J. (2009). Country guidelines for the conduct of road safety management capacity reviews and the specification of lead agency reforms, investment strategies and safe system projects. Washington, D.C., The World Bank.
Elvik, R. (1993). Quantified road safety targets: a useful tool for policy making? Accident Analysis and Prevention, 25, pp. 569-583
Elvik, R., Høye, A., Vaa, T., and Sørensen, M. (2009). The handbook of road safety measures. Second Edition. Emerald Group Publishing, Bingley, UK.
Elvik, R. (2012). Does the use of formal tools for road safety management improve safety performance? Proceedings of the TRB 2012 Annual Meeting. Transportation Research Board, Washington DC
ETSC (2006). A methodological approach to national road safety policies. European Transport Safety Council, Brussels.
Gitelman, V., and Hakkert, S. (2005). Knowledge and data. In: Hakkert, S., and Wesemann, P. (Eds.). The use of efficiency assessment tools: solutions to barriers. Workpackage 3 of theEuropean research project ROSEBUD. R-2005-2. SWOV Institute for Road Safety Research, Leidschendam.
ISO 39001 (2012). Road traffic safety (RTS) management systems- requirements with guidance for use. International Standard ISO 39001:2012. Internet site www.iso.org.
Jost, G., Allsop, R., and Steriu, M. (2012). A challenging start towards the EU 2020 Road Safety Target: 6th road safety Performance Index PIN report. European Transport Safety Council ETSC, Brussels.
Koornstra, M., Lynam, D., Nilsson, G., Noordzij, P., Petterson, H.-E., Wegman, F., and Wouters, P. (2002). SUNflower: a comparative study of the development of road safety in Sweden, the United Kingdom, and the Netherlands. SWOV Institute for Road Safety Research / Transport Research Laboratory TRL / Swedish National Road and Transport Research Institute VTI. Leidschendam / Crowthorne / Linköping.
LTSA (2000). Road safety strategy 2010. A consultation document. National Road Safety Committee, Land Transport Safety Authority LTSA, Wellington.
Muhlrad, N. (2005). Integrated road safety management; intersectoral policies and institutional organization. In: Tiwari, G., Mohan, D., and Muhlrad, N. (Eds.). The way forward; transportation planning and road safety. Macmillan India Ltd.
Muhlrad, N., Gitelman, V., and Buttler, I. (Ed.) (2011). Road safety management investigation model and questionnaire. Deliverable 1.2 of the EC FP7 project DaCoTa.
OECD (2002). Road safety: what’s the vison? Organisation for Economic Co-operation and Development OECD, Paris.
OECD (2008). Towards zero; ambitious road safety targets and the safe system approach. Organisation for Economic Co-operation and Development OECD, Paris.

D4.9 Developing a Road Safety Index
83
OECD/ITF (2012). Sharing road safety; developing an international framework for crash modification functions. Organisation for Economic Co-operation and Development OECD / International Transport Forum ITF, Paris.
Papadimitriou, E., Yannis G., Muhlrad N., Gitelman V., Butler I., and Dupont E. (Eds.) (2012). Analysis of road safety management in the European countries. Deliverable 1.5. Vol II of the EC FP7 project DaCoTa.
Peden, M., Scurfield, R., Sleet, D., Mohan, D., Hyder, A., Jarawan, E., and Mathers, C. (Eds.) (2004). World report on road traffic injury prevention. World Health Organisation, Geneva.
Supreme (2007). Best practices in road safety; handbook for measures at the country level. Internet site http://ec.europa.eu/transport/supreme/index en.htm, European Commission, Brussels. Also published as: Schagen, I.N.L.G. van and Machata, K. (2011). Publications Office of the European Communities Eur-OP, Luxembourg.
Wegman, F., Commandeur, J., Doveh, E., Eksler, V., Gitelman, V., Hakkert, S., Lynam, D., and Oppe, S. (2008). SUNflowerNext: towards a composite road safety performance index. SWOV Institute for Road Safety Research, Leidschendam.
Wong, S.C., Sze, N.N., Yip, H.F., Loo, B.P.Y., Hung, W.T., and Lo, H.K. (2006). Association between setting quantified road safety targets and road fatality reduction. Accident Analysis and Prevention, 38, pp. 997-1005.
Wong, S.C., and Sze, N.N. (2010). Is the effect of quantified road safety targets sustainable? Safety Science, 48, pp. 1182-1188.
D4.9 Developing a Road Safety Index
84
6. STRUCTURE AND CULTURE
Charlotte Bax SWOV
6.1. Introduction The bottom of the pyramid of road safety pyramid is formed by the layer Structure and culture. This layer contains indicators regarding the physical and social structure of countries and indicators regarding the culture of countries.
This lowest level of the pyramid was not very well defined in the SUNflower approach. The SUNflower approach has even been criticized for not including the role of spatial and demographic factors (IIHS, 2006) and organizational and cultural factors (Delorme and Lassarre, 2005) in their model. In general, also today, the influence of these factors on road safety have been explored to a much lesser extent than the data on more directly safety related policies, such as accident outcomes, safety performance indicators and policy inputs. However, there is empirical evidence to show that structural and cultural indicators influence road safety outcomes. SUNflower added an extra layer to the model as developed in New Zealand (LTSA, 2000) for two reasons. Firstly, to provide an essential background for all the observations and indicators at a higher level of the pyramid. Progress and variation among countries in road safety outcomes cannot be fully understood or can even be misinterpreted when these backgrounds are unknown or ignored. This layer can flag up structural and basic cultural differences between countries, that might influence the ability to implement road safety policies successfully. Secondly, it is easier and more effective to transfer findings of benchmarking and to learn from experiences and results abroad while having a clear and extensive picture of the background of results and measures (Wegman et al., 2008; Wegman and Oppe, 2010).
The indicators in this bottom layer have two important characteristics. Firstly, they are chosen because they influence the road safety level of countries. Physical and social characteristics influence the road safety performances of countries, as does the national culture in terms of values and norms. A second characteristic of the structure and culture indicators are that they are not (or hardly) directly influenced by the road safety policy of countries. Some are stationary factors, which cannot be influenced by any policy, other are influenced by policies other than road safety, such as income policies, economic policies, demographic policies, environmental policies or traffic and transport policies. Indicators that can be influenced by road safety policies are included in other layers of the road safety pyramid.
The aim of the layer Structure and culture is to group countries in comparable classes. Comparable classes are constructed because it can be expected that countries learn more and more easily from similar countries than from countries which differ on physical and social characteristics. Also, countries might be more motivated to improve themselves if being the ‘best-in-class’ is considered to be within reach (Wegman and Oppe, 2010; Wegman et al., 2008). Countries could for example be grouped in groups with the same economical, historical and geographical background, and/or the same level of motorization and safety development.

D4.9 Developing a Road Safety Index
85
6.2. Characteristics of the structural and cultural background
The level is split into two types of background indicators. The structural indicators consist of physical and social indicators which form the physical and functional structure of countries. The cultural indicators consist of norms and values in countries which determine the cultural background of a country.
These background indicators form an almost endless list of factors that can be of influence on road safety performances. Therefore, it is impossible to point out all factors, not only because of the large number of factors, but more importantly because there has not been much research in the effects of background factors on road safety. Despite this lack of research, for many factors an effect on road safety performances can be assumed on the basis of common sense. In the Road Safety Composite Index, we have chosen to only use background factors which can count on general agreement in the road safety world. Therefore, we do not aim to present an exhaustive list of background factors, but will only review a gross list of most obvious factors. If research is available, we indicate which influence these background factors have on road safety.
In the present section, we present a list of theoretically interesting indicators for the structure and culture layer of the pyramid, in principle useful for grouping countries in comparable classes. In addition, we also mention whether the availability of data forms a problem for using the indicators in practice. If necessary, alternative indicators are proposed. At the end of the section, a summary table of indicators to be used in the Road Safety Index is given.
6.2.1. Structural indicators Structural background: physical indicators
The physical structure of a country contains of a large number of factors that determine the physical appearance of a country and influence road safety outcomes. Two groups of structural factors can be distinguished: 1) stationary factors – factors that remain stable and do not changing over time (e.g. geographic and climate conditions) and 2) dynamic factors – factor that evolve or change over time (e.g. demography, road topology, and urbanization) (Wegman et. al., 2008).
Stationary factors
Stationary factors are of a physical nature, remain stable over time and are largely or fully beyond the influence of policy interventions. Examples of stationary factors that can influence road safety are terrain and climate or weather.
1. Not many studies have been done on the influence of terrain on road safety, although common sense can tell that winding mountain roads might cause more crashes from skidding or falling down, but it might also lower the speed of vehicles, which might balance to some extent. Another possible factor of influence is the fact that roads in hilly terrain are generally built to a lower engineering standard, due to costs.
Theoretically interesting indicators: Not much is known about the effect of terrain on road safety, although an effect seems plausible. Because of the lack of research, we will not include this factor as an indicator.
2. Concerning the weather, more research has been carried out. Weather conditions affect both crash rate and the exposure to traffic hazards. This influence is
D4.9 Developing a Road Safety Index
86
strongest for the conditions of precipitation (including snow and hail), fog, low sun, wind, ice forming, and hot temperatures (SWOV, 2012a).
Research has shown that motorists adjust their road behaviour during showers. They overtake less, drive slower, and increase their following distance (Hogema, 1996; Agarwal et al., 2005). However, the risk of a crash during rain is still larger than in dry weather (Thoma, 1993), due to visibility problems (Terpstra, 1995; Fokkema, 1987; Ellinghaus, 1983) and diminished road friction (Ellinghaus, 1983; Terpstra, 1995; Eisenberg, 2004). Fog can also lead to reduced visibility, which often slows driving speeds, but also shortens following distance, which, in combination increases the risk of crashes (Fokkema, 1987; Oppe, 1988; Terpstra, 1995). Visibility problems can also be caused by sunset and sunrise (Fokkema, 1987). Wind, on the other hand, can cause relatively high vehicles to be pushed off course or even to roll over, for example on bridges and viaducts. Ice and snow can cause a diminishing of friction on roads, resulting in slippery conditions (CROW, 2000; 2006). Lastly, high temperatures have a danger of rising emotions, loss of concentration, sleepiness et cetera (DVR, 2000; Laaidi and Laaidi, 2002).
Literature shows that the crash rate approximately doubles during rain. Less research has been done on crash rates during other weather conditions (Bijleveld and Churchill, 2009; Andrey and Yagar, 1993; Thoma, 1993; Brühning et al., 1978). Snow seems to lower the crash rate because of more careful driving (Fridstrøm et al., 1995). Some examples of possible interactions:
Weather conditions also influence road safety by changes in mobility. However, the influence of weather on the number of vehicle kilometres is generally limited and restricted to rural, recreational traffic (Hogema, 1996; Bijleveld and Churchill, 2009; Kilpeläinen and Summala, 2007). Several studies show a shift in transport mode, resulting for example in less bicycle crashes (Bos, 2001; Ellinghaus, 1983; Bijleveld and Churchill, 2009)
Theoretically interesting indicators: There is more research on the influence of weather on road safety than on terrain. However, the text above shows that there are many different weather factors that can influence road safety. Moreover, weather is very locally determined and therefore it might not be the best option to measure this on a national scale. We therefore will not include weather as an indicator.
Dynamic factors
Dynamic factors often have a socio-demographic or economic character and in a longer term can be influenced by policy measures. Several characteristics can be distinguished (Eksler, 2007a+b).
Population
Distribution of age
It is widely recognized that accident risk varies by age group, with young (under 25) and older (over 75) people having a larger risk than others (OECD, 2006, Davidse 2007, ERSO, 2009). Therefore, the distribution of age within the population is an important indicator for road safety. Eksler (2007a) studied the demography in 25 European countries and found that the differing demographic structures only had a minor influence on road mortality ratios. Difference within countries (regions) could however vary to a larger extent.
Theoretically interesting indicators: Given the higher risks of younger and older people, it would be ideal to include the % of population under 25 and the % of

D4.9 Developing a Road Safety Index
87
population of 75 and up as indicators. However, available data sets in European countries do not offer the % of population over 75. Therefore, we will include the % of the population over 65 as an alternative indictor.
Population density
Population density combines many factors for which figures per country are hard to obtain, such as urbanization, the distance to various kinds of facilities (medical, education, shopping etc.) and the exposure of traffic to different road types. Eksler (2007b), Eksler et al. (2008) and Lassarre and Thomas (2005) mention population density as a very important characteristic. Their studies to compare European regions revealed that population density has a significant influence on road mortality. Overall, a 10% increase in population density appeared to decrease road fatalities by 3.2%.
Theoretically interesting indicators: As various studies see population density as an important and multi/dimensional factor contributing to road safety, we intend to include the population density (defined as inhabitants per square km) as an indicator. In addition to the more general population density, we include the more specific urban density, defined as the % of population living in urban areas (>10.000 inhabitants) to provide a more direct indicator for distance to various facilities.
Mobility/fleet
Mobility has a strong influence on road safety. Exposure to traffic is an important contributing factor to road safety. For this reason, road safety is often measured in traffic risk: the number of fatalities divided by exposure (SWOV, 2012b). Ideally, one would want to measure the overall mobility in a country, and the mobility for certain high-risk types of vehicle, such as powered two-wheelers and goods vehicles. If mobility figures are not available, a diverted measure can be the number of cars, two-wheelers and goods vehicles in a country. Trinca et al. (1988) evaluated the road safety performance of countries in comparison to their motorization rate (motor vehicles/1000 inhabitants). Increasing motorization rates showed decreasing numbers of road deaths per 10,000 vehicles, but the number of deaths per 100,000 inhabitants initially increases. The latter declines only after a particular motorization rate is reached.
Theoretically interesting indicators: Overall, mobility is seen as an important factor for road safety. However, the availability of data is scarce. Therefore, we intend to use information on motorization and fleet composition as an indicator. Specifically, we intend to include the number of cars per 1000 inhabitants, the % of goods vehicles in the fleet and the % of powered two-wheelers in the fleet.
Gross Domestic Product (GDP)
Özkan (2006) (also: Özkan and Lajunen in Porter, 2011) investigated the relationship between GDP and traffic fatalities. He found that the GNP was an important predictor for road safety (measured as traffic fatalities) and a main reason for differences between countries. The GNP per capita was negatively related to traffic fatalities. Studies in Norway and Italy (Fridstrom, 1999, p. 204; La Torre et al., 2007) suggest that in these countries, the employment rate could be a predictor of regional differences in accident rate. This subject might be wothwile to look at on an European level in future studies.
Theoretically interesting indicators: GDP seems to be an important factor for road safety performances. We intend to include the GDP per capita as an indicator in the Road Safety Index.

D4.9 Developing a Road Safety Index
88
Social background
The social background of a country consists of the organization and arrangements of potential actors involved in policy making. The specific arrangements for road safety policy making, the so-called road safety management, is covered in a separate level of the pyramid. This Structure and culture level addresses more general arrangements in policy making.
These general arrangements are mostly contained in the type and structure of the governance of countries. A number of examples:
• Does a country have a predominantly central government or play decentralized governmental bodies an important role?
• Does a country have more or less autonomous regions or not?
• Does a country have a consultation culture or even a consensus culture, for instance the Dutch “polder model”, or does a country has a more competing culture?
• What is the role of influence groups?
• How is the relationship between state, market and society?
• Does a country have an Anglo Saxon economy model, with a limited role for government or a system based in the Rhine capitalism model with a more active role for government or the Nordic model with an extended welfare state?
• Does the government have a tradition of using evidence based policies?
All these characteristics influence for instance governmental budgets, but also the actors that will feel responsible for road safety and take action or are involved in road safety. They also influence the use of scientific knowledge, the organization of road safety management and implementation. However, very little research exists into the exact influence of these characteristics on road safety and their influence will often be indirect.
Theoretically interesting indicators: Although the influence of the above mentioned factors is plausible, not much research has been done carried out on actual effects on road safety. Therefore, we do not include these factors in the Road Safety Index.
6.2.2. Cultural indicators Culture
Culture consists of values and norms in their social context. Values can be regarded as assumptions upon which implementation, in this case of road safety policies, can be based. Sets of consistent values and measures together form a value system, which is subjective and varies across people and across countries. Types of value include ethical/moral values, ideological, social and aesthetic attitudes. Values such as the value of a human life, respect for each other’s rights, etc., are directly reflected in road safety provisions, such as those related to reduction targets. Norms refer to the rules that are socially enforced. Social sanctioning is what distinguishes them from values. They can be viewed as reference standards, or statements that regulate behaviour and act as informal social control. The most typical example is society's attitude towards drink-driving, which differs significantly between countries (Wegman et al., 2008). Social sanctioning is reflected in laws, regulations, types and severity of punishment and as a result affect behavior. Little information is available on these issues and even less on their effects on behavior.

D4.9 Developing a Road Safety Index
89
As this level comprises indicators that are not directly influenced by road safety policies, values and norms directly related to road safety are not included. For example: social and political interest in road safety, social opinions about road safety issues and attitudes towards road safety risks are not part of this level. The structure and culture level focusses on a more general level of norms, values and attitudes which influence road safety, but are not influenced by road safety policies.
Three scientists have developed a scale for measuring culture in various countries. Eysenck and Eysenck (1975) developed the Eysenck Personality Questionnaire. It measures three characteristic pairs extraversion versus introversion, neuroticism versus emotional stability and psychoticism versus ego control. Hofstede (2001) developed five culture dimensions, which include inequality between people (power distance), stress level from unknown future (uncertainty avoidance), individualism versus collectivism, masculinity versus femininity, and the time perspective of individuals (long-term versus short-term). Schwartz (1999) measured three issues: 1) whether people are autonomous or embedded in their group (conservative versus autonomous), 2) the degree of responsible behavior (hierarchy versus egalitarism) and 3) the relationship between individual and environment (mastery versus harmony).
Especially the dimensions of Hofstede have been investigated for their relationship with road safety. Hofstede (2001) himself studied this in 1971 in 14 European countries and found a positive relation between uncertainty avoidance and masculinity on the one hand and traffic fatalities on the other hand. Individualism was negatively related. Others (Lynn and Hampson, 1975; Lester, 2000; Lajunen, 2004) found that traffic crashes were related to extraversion and neuroticism. A recent study by Gaygisiz (2010) in 46 countries showed that Hofstede’s power distance and Schwartz’s embeddedness, hierarchy and mastery were positively related to traffic fatalities. Schwartz’s intellectual autonomy and egalitarism were negatively related to traffic crashes. Ozkan (2006) found that, in line with earlier results, neuroticism, uncertainty avoidance and egalitarism were positively related to traffic fatalities, while conservatism was negatively related. Ozkan (2006) also found a strong correlation between culture and GDP. These findings indicate that culture can influence road safety.
The EU project Sartre also partly measures cultural differences between countries. Recently, the Sartre 4 project is completed (Cestac and Delhomme, 2012). The survey treats questions on the importance of road safety in relation to other societal problems, the perceived safeness of one’s country, opinions on safety measures and self-reported assessment of safe behavior. These results are not used as indicators of cultural differences in this chapter. The reason for that, is that the project partly measures behavior, which in the Road Safety Index is scored in the layer of the road safety performance indicators. Other questions in the Sartre survey focus on opinions which are (partly) influenced by road safety policies (opinion on the importance of road safety, opinion on safety measures, perceived safety of one’s country). As this chapter focusses on more or less independent structural and cultural indicators, which are not influenced by road safety policies, but themselves influence the ability of countries to implement successful road safety policies, these results are not used in this chapter.
Theoretically interesting indicators: The cultural dimensions form Hofstede seem to be internationally accepted as measures for national culture, and some studies found a relation with road safety. Therefore, we intend to include the Hofstede dimensions as indicators in the Road Safety Index.

D4.9 Developing a Road Safety Index
90
6.3. Data considerations and selected indicators for the Road Safety Index
The DACOTA group discussed several issues concerning the structure and culture layer. Below some of the main issues and decisions are summarized:
• A relation is expected between the indicators of motorization level and GDP per capita as they both are typically applied to classify countries into groups of similar level of economic development. However, no reference can be provided concerning the preference of one of them. Thus, it was decided to keep both indicators for grouping countries in the database, which will enable further exploration of their relationship.
• The DACOTA group agreed that the shares of children and elderly in the population structure are essential indicators characterizing the extent of potential risk or vulnerability of the country's population. However, children aged 0-14 are typically associated with pedestrian (or bicycle) problems, whereas the issue of young drivers is left uncovered. It can be mentioned here that, e.g., Page (2001) who developed explanatory models for safety level changes in the 21 OECD countries, found that the percentage of 15-24 years old in the population was among the main variables explaining fatality numbers. Thus, it was decided to apply in the current analysis the indicator of percentage of young population (ages 0-24).
• An uncertainty can be mentioned as to the definition of elderly: should it be over 64 or 74 years old? An examination of elderly-related road safety literature revealed that in a wide sense it covers ages from 55 to 80+; a traditional approach considers ages from 65+, whereas higher vulnerability and greater problems are associated with ages 75+ (e.g. OECD, 2001; Whelan et al., 2006; SWOV, 2008). As the age of 65 is traditionally associated with retirement and changes in traffic patterns, we decided to define elderly as people aged 65 and over. Another main reason is data availability
Based on the above considerations and following final data availability checks in the DaCota Master-Tables, Appendix A presents the updated dataset collected for the 30 countries. Each layer's indicators are given in a separate table, with data sources detailed. The data belongs to year 2008.
It can be seen in Appendix A that some countries have missing values of some indicators. In order the countries with missing values not to be excluded from the statistical analysis, the missing values were imputed. The imputations were done using the MI procedure of SAS 9.2. (See Appendix B v for imputed values)
6.4. Concluding remarks Below, a summarizing table is given of the indicators used in the Structure and culture layer of the road safety pyramid. These indicators, which influence road safety, but are themselves not influenced directly by road safety policies will be used to group countries into comparable classes. The table below presents the indicators and the data sources providing the most complete and most up to date data on the indicator.
The eight indicators presented in Table 6.1 were applied for countries' grouping in the current study. In addition, the dimensions of Hofstede (Website Hofstede, 2010) were examined in this context - see Chapter 7.
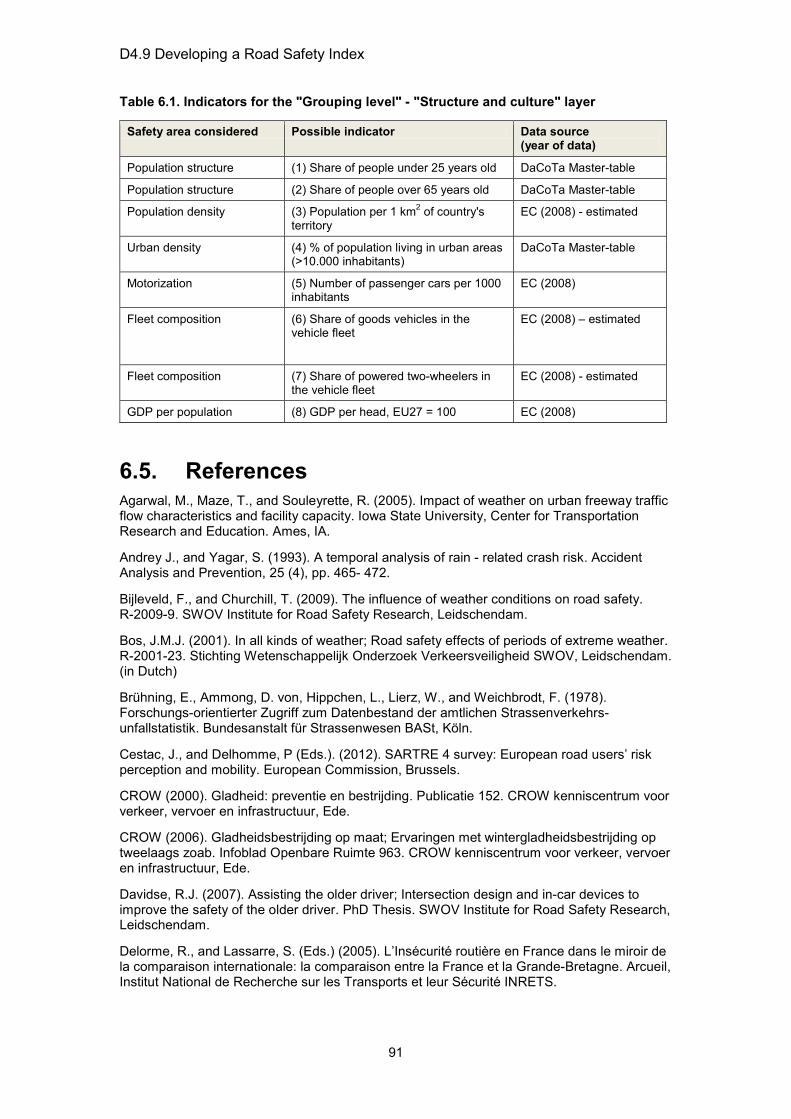
D4.9 Developing a Road Safety Index
91
Table 6.1. Indicators for the "Grouping level" - "Structure and culture" layer
Safety area considered Possible indicator Data source (year of data)
Population structure (1) Share of people under 25 years old DaCoTa Master-table
Population structure (2) Share of people over 65 years old DaCoTa Master-table
Population density (3) Population per 1 km2 of country's territory
EC (2008) - estimated
Urban density (4) % of population living in urban areas (>10.000 inhabitants)
DaCoTa Master-table
Motorization (5) Number of passenger cars per 1000 inhabitants
EC (2008)
Fleet composition (6) Share of goods vehicles in the vehicle fleet
EC (2008) – estimated
Fleet composition (7) Share of powered two-wheelers in the vehicle fleet
EC (2008) - estimated
GDP per population (8) GDP per head, EU27 = 100 EC (2008)
6.5. References Agarwal, M., Maze, T., and Souleyrette, R. (2005). Impact of weather on urban freeway traffic flow characteristics and facility capacity. Iowa State University, Center for Transportation Research and Education. Ames, IA.
Andrey J., and Yagar, S. (1993). A temporal analysis of rain - related crash risk. Accident Analysis and Prevention, 25 (4), pp. 465- 472.
Bijleveld, F., and Churchill, T. (2009). The influence of weather conditions on road safety. R-2009-9. SWOV Institute for Road Safety Research, Leidschendam.
Bos, J.M.J. (2001). In all kinds of weather; Road safety effects of periods of extreme weather. R-2001-23. Stichting Wetenschappelijk Onderzoek Verkeersveiligheid SWOV, Leidschendam. (in Dutch)
Brühning, E., Ammong, D. von, Hippchen, L., Lierz, W., and Weichbrodt, F. (1978). Forschungs-orientierter Zugriff zum Datenbestand der amtlichen Strassenverkehrs-unfallstatistik. Bundesanstalt für Strassenwesen BASt, Köln.
Cestac, J., and Delhomme, P (Eds.). (2012). SARTRE 4 survey: European road users’ risk perception and mobility. European Commission, Brussels.
CROW (2000). Gladheid: preventie en bestrijding. Publicatie 152. CROW kenniscentrum voor verkeer, vervoer en infrastructuur, Ede.
CROW (2006). Gladheidsbestrijding op maat; Ervaringen met wintergladheidsbestrijding op tweelaags zoab. Infoblad Openbare Ruimte 963. CROW kenniscentrum voor verkeer, vervoer en infrastructuur, Ede.
Davidse, R.J. (2007). Assisting the older driver; Intersection design and in-car devices to improve the safety of the older driver. PhD Thesis. SWOV Institute for Road Safety Research, Leidschendam.
Delorme, R., and Lassarre, S. (Eds.) (2005). L’Insécurité routière en France dans le miroir de la comparaison internationale: la comparaison entre la France et la Grande-Bretagne. Arcueil, Institut National de Recherche sur les Transports et leur Sécurité INRETS.
D4.9 Developing a Road Safety Index
92
DVR (2000). Wind und Wetter. Wie das Wetter auf den Menschen wirkt. DVR - Report 2000, nr. 4. pp. 8- 11. Deutscher Verkehrssicherheitsrat e.V., Bonn.
Eisenberg, D. (2004). The mixed effects of precipitation on traffic crashes. Accident Analysis and Prevention, 36 (4), pp. 637- 647.
Eksler, V. (2007a). Road mortality in Europe. How sensitive is it to demographic structure and population dynamics? IATSS research, 31 (1), pp. 80-88.
Eksler, V. (2007b) The role of structural factors in road safety. Paper at Young Researchers Seminar 2007, The Hague.
Eksler, V., Lassarre, S., and Thomas, I. (2008). Regional analysis of road mortality in Europe. Public Health, 122 (9), 826-837.
Ellinghaus, D. (1983). Wetter und Autofahren; Eine Untersuchung über den Einfluss des Wetters auf das unfallgeschehen und die Verkehrssicherheit. Uniroyal Verkehrsuntersuchung, Heft 10. Gesellschaft für angewandte Sozialforschung und Planung, GmbH Köln.
ERSO (2009). Older Drivers. Website, consulted on July, 13th 2012 on http://ec.europa.eu/transport/road_safety/specialist/knowledge/old/index.htm. European Road Safety Observatory ERSO, European Commission, Brussels.
Eysenck, H.J., and Eysenck, S.B.G. (1975). Manual of the Eysenck Personality Questionnaire. London: Hodder and Stoughton.
Fokkema, H.J. (1987). Weersgesteldheid en verkeersveiligheid. Traffic Test in opdracht van Directie Verkeersveiligheid van het Ministerie van Verkeer en Waterstaat, Veenendaal.
Fridstrøm, L. (1999). Econometric models of road use, accidents, and road investment decisions. Volume II. Report 457, Institute of Transport Economics, Oslo.
Fridstrøm, L., Ifver, J., Ingebritsen, S., Kulmala, R., and Krogsgård Thomsen, L. (1995). Measuring the contribution of randomness, exposure, weather and daylight to the variation in road accident counts. Accidents Analysis and Prevention, 27 (1), pp. 1-20.
Gaygısız, E. (2010) Cultural values and governance quality as correlates of road traffic fatalities: A nation level analysis. Accident Analysis and Prevention, 42, pp. 1894-1901.
Hofstede, G. (2001). Culture’s consequences: Comparing values, behaviours, institutions, and organizations across nations (2nd ed.). Sage Publications, nc, California.
Hogema, J.H. (1996). Effects of rain on daily traffic volume and on driving behaviour. A study as part of the project Road and weather conditions. Report TNO -TM 1996 - B019. TNO Human Factors Research Institute TM, Soesterberg.
IIHS (2006). Bad statistics lead to misinformation. Insurance Institute for Highway Safety IIHS Status Report, 41 (4). Insurance Institute for Highway Safety IIHS, Arlington, USA.
Kilpeläinen, M., and Summala, H. (2007). Effects of weather and weather forecasts on driver behaviour. Transportation Research Part F, 10 (4), pp. 288-299.
Laaidi, K., and Laaidi, M. (2002). Météorologie et sécurité routiere. Via Secura, 56, pp. 22-24.
Lajunen, T. (2004). Social indicators as indexes of neuroticism and extraversion. Personality and Individual Differences, 37, pp. 1543-1550.
Lassarre, S., and Thomas, I. (2005). Exploring road mortality ratios in Europe: national versus regional realities. Journal of the Royal Statistical Society Series A - Statistics in Society, 168, Part 1 (January), pp. 127-144.
La Torre G., Van Beeck, E., Quaranta, G., Mannocci, A., and Ricciardi, W. (2007). Determinants of within-country variation in traffic accident mortality in Italy: a geographical analysis. International Journal of Health Geographics 2007; 6, 49.
D4.9 Developing a Road Safety Index
93
Lester, D. (2000). National differences in neuroticism and extraversion. Personality and Individual Differences, 28, pp. 35-39.
LTSA (2000). Road safety strategy 2010; A consultation document. National Road Safety Committee, Land Transport Safety Authority LTSA, Wellington, New Zealand.
Lynn, R., and Hampson, S.L. (1975). National differences in extraversion and neuroticism. British Journal of Social and Clinical Psychology, 14, pp. 223-240.
OECD (2006). Young drivers: the road to safety. Joint OECD/ECMT Transport Research Centre, Paris.
Oppe, S. (1988). Verkeersonveiligheid bij mist. R-88-49. Stichting Wetenschappelijk Onderzoek Verkeersveiligheid SWOV, Leidschendam.
Ozkan, T. (2006). The regional difference between countries in traffic safety: A cross-cultural study and Turkish case. Dissertation at the University of Helsinki.
Ozkan, T., and Lajunen, T. (2011). Person and environment: Traffic culture. In: Porter, B.E. Handbook of Traffic Psychology. Elsevier, Amsterdam.
Schoon, C.C., Reurings, M.C.B., and Huijskens, C.G. (2011). Verkeersveiligheidseffecten in 2020 van maatregelen op het gebied van de veiligheid van personenauto's. R-2011-18. Stichting Wetenschappelijk Onderzoek Verkeersveiligheid SWOV, Leidschendam.
Schwartz, S.H. (1999). A theory of cultural values and some implications for work. Applied Psychology: An International Review, 48 (1), pp. 23-47.
SWOV (2008). The elderly in traffic. SWOV Fact sheet, January 2008. SWOV Institute for Road Safety Research, Leidschendam.
SWOV (2012a). The influence of weather on road safety. SWOV Fact sheet, february 2012. SWOV Institute for Road Safety Research, Leidschendam.
SWOV (2012b). Risk in traffic. SWOV Fact sheet, July 2012. SWOV Institute for Road Safety Research, Leidschendam.
Terpstra, J.M. (1995). Over slecht zicht, bewolking, windstoten en gladheid. Koninklijk Nederlands Meteorologisch Instituut, De Bilt.
Thoma, J. (1993). Geschwindigkeitsverhalten und Risiken bei verschiedenen Strassenzuständen, Wochentagen und Tageszeiten. Schweizerische Beratungsstelle für Unfallverhütung BfU, Bern.
Trinca, G.W., Johnstone. I.R., and Campbell, B.J. (1988). Reducing traffic injury, a global challenge. Royal Australasian College of Surgeons, Melbourne.
Wegman, F., Commandeur, J., Doveh, E., Eksler, V., Gitelman, V., Hakkert, S., Lynam, D., and Oppe, S. (2008). SUNflowerNext: Towards a composite road safety performance index. SWOV Institute for Road Safety Research, Leidschendam.
Wegman, F.C.M., and Oppe, S. (2010). Benchmarking road safety performances of countries. Safety Science, 48 (9), pp. 1203-1211.
Whelan, M., Langford J., Oxley J., Koppel S., and Charlton, J. (2006). The elderly and mobility: a review of the literature. Report 255, Monash University Accident Research Centre, Melbourne.


D4.9 Developing a Road Safety Index
PART II: COMPOSING THE ROAD SAFETY INDEX

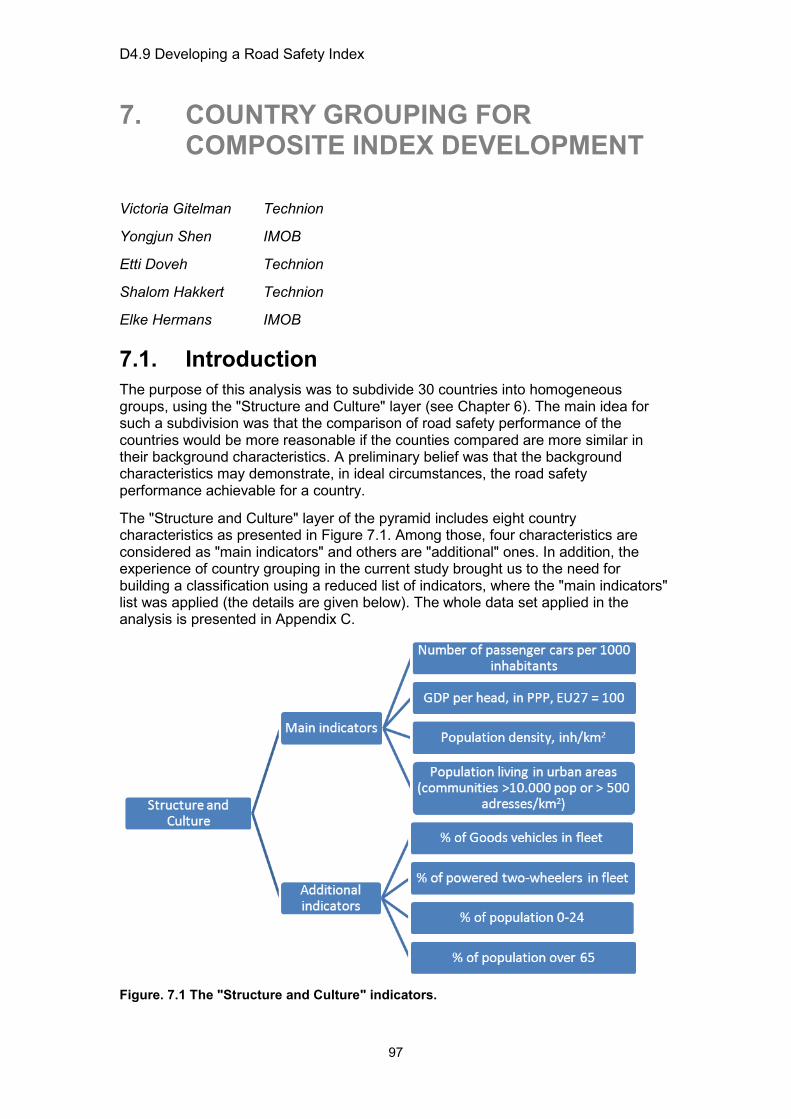
D4.9 Developing a Road Safety Index
97
7. COUNTRY GROUPING FOR COMPOSITE INDEX DEVELOPMENT
Victoria Gitelman Technion
Yongjun Shen IMOB
Etti Doveh Technion
Shalom Hakkert Technion
Elke Hermans IMOB
7.1. Introduction The purpose of this analysis was to subdivide 30 countries into homogeneous groups, using the "Structure and Culture" layer (see Chapter 6). The main idea for such a subdivision was that the comparison of road safety performance of the countries would be more reasonable if the counties compared are more similar in their background characteristics. A preliminary belief was that the background characteristics may demonstrate, in ideal circumstances, the road safety performance achievable for a country.
The "Structure and Culture" layer of the pyramid includes eight country characteristics as presented in Figure 7.1. Among those, four characteristics are considered as "main indicators" and others are "additional" ones. In addition, the experience of country grouping in the current study brought us to the need for building a classification using a reduced list of indicators, where the "main indicators" list was applied (the details are given below). The whole data set applied in the analysis is presented in Appendix C.
Figure. 7.1 The "Structure and Culture" indicators.
D4.9 Developing a Road Safety Index
98
The subdivision of countries into homogeneous groups was explored using two general methods: common factor analysis (FA) and direct cluster analysis (CA). The idea under the FA is to account for the highest possible variation in the set of indicators using the smallest possible number of factors (Nardo et al., 2005). The correlation structure of the data is examined in order to identify a certain number of latent factors, smaller than the initial number of variables (indicators), representing the data. Factor scores are estimated for each entity (country) and then, clustering techniques (e.g. the Ward method) are applied for the countries' grouping. In the last step of the countries' grouping, in general, various methods are applicable for defining the amount of groups required and the countries' subdivision into the groups. Consequently, following FA, various results can be received depending on the set of initial indicators considered and the evaluation methods applied (e.g. equal or unequal weighting of the factors).
The purpose of a direct CA is similar, i.e. to divide observations in a dataset into subsets, where objects in the same subset are similar to each other with respect to a certain similarity measure. Over the past decades, a large number of clustering methods such as hierarchical clustering, k-means clustering, spectral clustering, etc., have been developed and successfully applied in a wide range of fields, such as biology, geography, climate, psychology, medicine, and business (see e.g., Anderberg, 1973; Everitt et al., 2001).
The direct clustering is based on the standardized data, where the raw data are first normalized by converting them into standard scores (i.e. the value minus sample mean, subdivided by sample standard deviation). Sometimes, a variable interrelationship is considered, where highly correlated variables are removed from further analysis. Finally, a certain clustering method is applied for the objects (countries) grouping, e.g. the hierarchical cluster analysis. Similarly to the aforementioned comment as to the results of FA, applying a direct clustering, various results can be attained as to the countries grouping, depending on the variables considered and the clustering technique selected.
As the current analysis aimed to recognize homogeneous groups of countries, which should be accounted for in further evaluation of the countries' safety performance, multiple answers were undesirable. Moreover, in general, our interest is to recognize stable country groups which would be reasonable for external judgment. However, as mentioned above, various results are possible where different classification methods are applied and particularly, using various lists of basic indicators, where, in principle, no technical criterion can be suggested to define which subdivision is the best. On the other hand, once several analyses provide similar results, a certain level of confidence that a stable classification was found appears to be justified.
The problem of multiple answers (various countries groupings) was widely experienced in the current analysis. At the beginning, the countries classification was produced using the whole set of eight country characteristics aspiring to recognize three to four country groups. However, the results of the FA versus a direct CA were different, indicating that a stable classification was not found. At the same time, examining the differences between the country groups obtained by the various methods, we observed that major differences between them can be seen in the main country characteristics, where the additional indicators demonstrated close mean values for the different groups. Thus, it was decided to further explore the topic in two directions: (1) to consider recognizing two country groups based on the whole set of eight indicators; (2) to consider creating two country groups based on the four main indicators (i.e. GDP per head, number of passenger cars per 1000 inhabitants, population density and population living in urban areas), only.
D4.9 Developing a Road Safety Index
99
Exploring the first direction was disappointing since, similarly to the initial analysis, the results of the FA versus a direct CA were different, meaning that stable country groups were not attained using all the background characteristics. Moreover, this analysis demonstrated, again, that major differences between the country groups are associated with the main country characteristics.
However, exploring the second option - recognizing two country groups based on the four main indicators, did produce similar results both by factor analysis and a direct clustering of the countries. Therefore, in the current study, this solution was adopted for the countries subdivision into homogeneous groups.
The remainder of the chapter is structured as follows. Section 7.2 provides the results of the initial countries' classification which considered the complete set of eight country characteristics, trying to recognize three to four country groups. Section 7.3 discusses the results of the further analysis which considered the countries' subdivision into two groups still based on the eight indicators. Section 7.4 demonstrates the results of countries classification into two groups based on the four main indicators.
In addition to the analysis of background country characteristics as presented in Figure 7.1, Hofstede cultural dimensions of countries were examined exploring the possibility of countries classification using these data. Results of this analysis are given in Appendix F, with a summary presented in Section 7.5.
The chapter is closed with a summary of the applicable findings of the main analysis in Section 7.6.
7.2. Exploring initial countries classification using the complete set of indicators
Initially, three to four country groups were sought, based on the complete set of eight country characteristics.
7.2.1. Factor analysis The analysis included the following steps:
1. Factor Analysis, to reduce the data dimensions, create more general factors and receive country estimates using those factors, including a weighted value for the factors.
2. Create and explore country classifications, which are built using the factors, by means of several methods.
3. Summary analysis of the countries groups recognized.
The initial data analysis demonstrated that:
• An outlying value of "Population density" exists for Malta (MT). Hence, MT was excluded from factoring, but was added to the final country classification demonstrating MT position related to other countries.
• The initial FA required a four factors solution, where "% of Goods vehicles in fleet" should be loaded by a separate factor. This is due to its low correlation with all the other variables, which does not allow reducing dimensionality. Thus, this variable was excluded from the analysis, where FA continued with the remaining seven variables.

D4.9 Developing a Road Safety Index
100
For the data remaining, a three factors solution was fitted as follows1:
Factor1 which mainly loaded on: • % of population over 65 • % of powered two-wheelers in fleet • % of population 0-24
Factor2 mainly loaded on:
• GDP per head, in PPP • Number of passenger cars per 1000 inhabitants
Factor3 mainly loaded on:
• Population living in urban areas • Population density (inh./km2).
Further exploring of correlation among the variables demonstrated that:
• As expected, variables of GDP and motorization level are highly correlated and compose one factor (Factor2);
• Variables of population density and percentage of urban population are highly correlated as well, and compose another factor (Factor3);
• All other variables which can be considered as secondary ones for country comparisons compose the third factor (Factor1), i.e. percentage of young population and of elderly, and % of powered two-wheelers in fleet.
The standardized scoring coefficients associated with the solution, demonstrated the way of factors estimation using basic variables. Appendix D presents the FA outputs, including factors weights, mean and standard deviation of each variable (which are required as FA works with standardized values of variables) and final country scores.
Based on the factors' values estimated, various country groupings (clustering) are possible. We applied three methods:
1. the Ward method with Euclidian distances, considering three factors separately;
2. the Ward method with Euclidian distances, with weighted sum of factors;
3. the Ward method for weighted Euclidian distances.
Resulting classification trees are given in Figure 7.2, where a broken vertical line, in each case, enables us to see four groups of countries. The classification results were as follows:
1We applied a rotated factor pattern with orthogonal rotation which assumes factors' independence. A non-orthogonal (oblique) rotation was explored as well demonstrating the results identical to the orthogonal rotation. Concerning the quality of the solution created, it should be mentioned that a commonly used rule for factor's loading is that there should be at least three variables per factor. In the current analysis, the amount of variables was small and, thus, the rule could not be satisfied. This was one of the reasons for the quite low Kaiser’s Measure of Sampling Adequacy (MSA), which, in the current analysis, was below the commonly acceptable level of 0.6, although some studies claim for minimal level of 0.5 to be satisfactory, which was nearly fulfilled in our analysis.

D4.9 Developing a Road Safety Index
101
• Country clustering using the Ward method, with three factors separately, provided four groups of countries, with 12, 10, 7 countries, respectively, and Malta as a separate group;
• Country clustering using the Ward method, with a weighted sum of factors, provided four groups of countries, with 9, 6, 12 and 3 countries, respectively;
• Country clustering using the Ward method, with weighted2 Euclidian distances for countries, provided four groups of countries, with 9, 5, 15 countries and Malta separately.
As the three clustering results were not identical (see Figure 7.2), a further summary consideration was required. It was done comparing the countries groupings and providing a summary category for each country – Table 7.1. For each country, a summary category was sought for using a "majority" criterion, i.e. recognizing a leading category among the three groupings. This way, a final category was stated for 24 countries, including MT, for which a separate category was kept. However, six countries were left with inconsistent classifications such as: SK, PT, LU, FI, NO, SE. For Slovakia and Portugal a final classification was found applying a "similarity" criterion, i.e. considering the final classification of the country's closest neighbors in separate countries' groupings (see the trees in Figure 7.2). In this sense, SK was similar to CY, FR, DK, LT, PL; where PT was like CZ, SI.
The remaining countries, i.e. Luxembourg, Sweden, Norway and Finland, did not demonstrate a stable similarity with other countries except for themselves (where in the third classification these countries presented a quite separate sub-group - see Figure 7.2; thus, in Table 7.1 they were indicated as "2A" category). It was decided to keep them together as it was received by the third clustering method (weighted Euclidian distances for countries). Therefore, in final classification, four groups of countries were recognized: Cluster 1 with 9 countries, Cluster 2 with 15 countries, Cluster 3 with 5 countries and Cluster 4 with Malta.
2 The weights applied were the factors' weights - see Appendix B
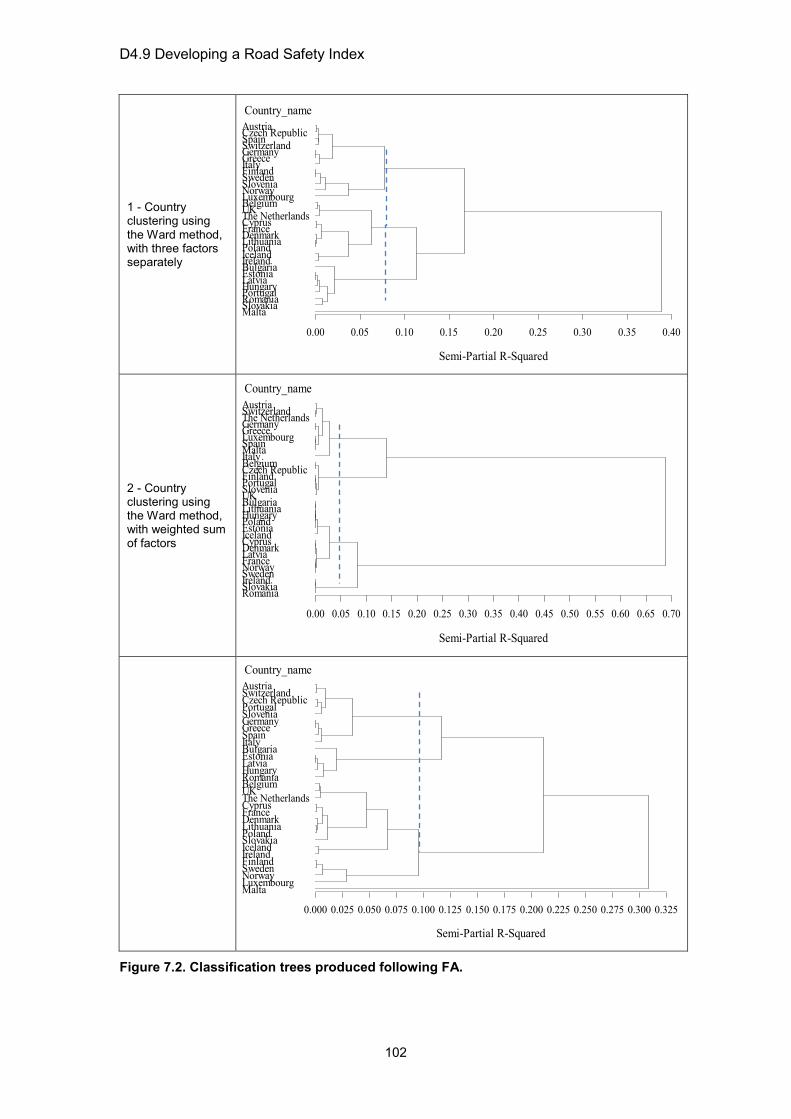
D4.9 Developing a Road Safety Index
102
1 - Country clustering using the Ward method, with three factors separately
Country_name
MaltaSlovakiaRomaniaPortugalHungaryLatviaEstoniaBulgariaIrelandIcelandPolandLithuaniaDenmarkFranceCyprusThe NetherlandsUKBelgiumLuxembourgNorwaySloveniaSwedenFinlandItalyGreeceGermanySwitzerlandSpainCzech RepublicAustria
Semi-Partial R-Squared
0.00 0.05 0.10 0.15 0.20 0.25 0.30 0.35 0.40
2 - Country clustering using the Ward method, with weighted sum of factors
Country_name
RomaniaSlovakiaIrelandSwedenNorwayFranceLatviaDenmarkCyprusIcelandEstoniaPolandHungaryLithuaniaBulgariaUKSloveniaPortugalFinlandCzech RepublicBelgiumItalyMaltaSpainLuxembourgGreeceGermanyThe NetherlandsSwitzerlandAustria
Semi-Partial R-Squared
0.00 0.05 0.10 0.15 0.20 0.25 0.30 0.35 0.40 0.45 0.50 0.55 0.60 0.65 0.70
Country_name
MaltaLuxembourgNorwaySwedenFinlandIrelandIcelandSlovakiaPolandLithuaniaDenmarkFranceCyprusThe NetherlandsUKBelgiumRomaniaHungaryLatviaEstoniaBulgariaItalySpainGreeceGermanySloveniaPortugalCzech RepublicSwitzerlandAustria
Semi-Partial R-Squared
0.000 0.025 0.050 0.075 0.100 0.125 0.150 0.175 0.200 0.225 0.250 0.275 0.300 0.325
Figure 7.2. Classification trees produced following FA.

D4.9 Developing a Road Safety Index
103
Table 7.1. Comparison of the three clustering results and final classification of the countries*
Country
Cluster 1: Ward, separate three
factors
Cluster 2: Ward, weighted factor
Cluster 3: Ward, weighted Euclidian
distance
Final classification
AT 1 1 1 1 CZ 1 2 1 1 DE 1 1 1 1 EL 1 1 1 1 IT 1 1 1 1 PT 3 2 1 1 SI 1 2 1 1 ES 1 1 1 1 CH 1 1 1 1 BE 2 2 2 2 CY 2 3 2 2 DK 2 3 2 2 FI 1 2 2A 2 FR 2 3 2 2 IS 2 3 2 2 IE 2 4 2 2 LT 2 3 2 2 LU 1 1 2A 2 NO 1 3 2A 2 PL 2 3 2 2 SK 3 4 2 2 SE 1 3 2A 2 NL 2 1 2 2 UK 2 2 2 2 BG 3 3 3 3 EE 3 3 3 3 HU 3 3 3 3 LV 3 3 3 3 RO 3 4 3 3 MT 4 1 4 4
*Country groups are indicated by different numbers and colors
Figure 7.3 provides a three-dimensional picture of the final country classification. It can be noted that MT is close to Cluster 2.

D4.9 Developing a Road Safety Index
104
-1.87
-0.40
1.08
2.55
Factor2-2.07
-0.74
0.59
1.93
Factor1
-1.50
1.12
3.74
6.36
Factor3
Remark: Cluster 1 is given in blue; Cluster 2 - in green; Cluster 3 - in red, MT - in black.
Figure 7.3. A three-dimensional picture of the final countries' classification.
7.2.2. Direct clustering In this analysis, the raw data were first normalized by converting all of the values for a variable i to standard scores (or z-scores) as follows:
ii
x xzsd−
=
(1)
where x denotes the sample mean, and sd the sample standard deviation. The standardized data are presented in Appendix E.
A case is generally considered as an outlier if its z-score exceeds 3.0 in absolute value (Schiffler, 1988). Based on this principle, two outliers were identified from Appendix E, i.e. the GDP of LU and the population density of MT; their raw values (276 and 1309, respectively) are extremely high relative to the other countries.
Based on the standardized data, the eight variables were clustered to show their interrelationship. By applying the hierarchical CA in SPSS3, the dissimilarity matrix was set up using the Ward linkage method with squared Euclidian distance (e.g., Johnson and Wichern, 2002). In the beginning, there were eight clusters, i.e. each variable represented one cluster. In the first stage of the clustering process the two variables with the lowest coefficient (i.e., Pop_den and Pop_urb) were grouped. Next, the variables with the second lowest coefficient were grouped, and so on, until one cluster containing all the eight variables was obtained. For hierarchical CA, the distances at which clusters are combined can be used as a criterion. This information can be obtained from the dendrogram as in Figure 7.4.
According to Figure 7.4, variables of motorization level and GDP, variables of population density and percentage of urban population, and variables of percentage of powered two-wheelers and percentage of population over 65 are close to each other, and can be grouped into one cluster, respectively. This finding was verified by calculating the Pearson correlation coefficients among these eight variables, in which
3 SPSS Inc., 2007
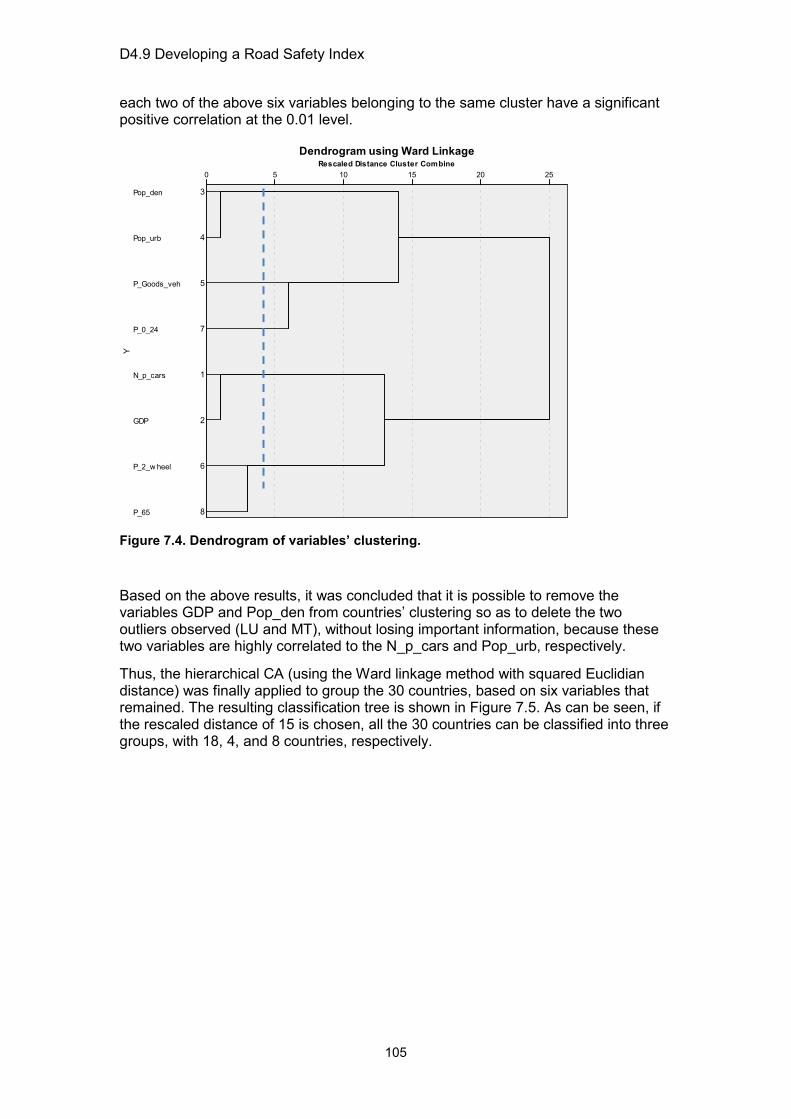
D4.9 Developing a Road Safety Index
105
each two of the above six variables belonging to the same cluster have a significant positive correlation at the 0.01 level.
Figure 7.4. Dendrogram of variables’ clustering.
Based on the above results, it was concluded that it is possible to remove the variables GDP and Pop_den from countries’ clustering so as to delete the two outliers observed (LU and MT), without losing important information, because these two variables are highly correlated to the N_p_cars and Pop_urb, respectively.
Thus, the hierarchical CA (using the Ward linkage method with squared Euclidian distance) was finally applied to group the 30 countries, based on six variables that remained. The resulting classification tree is shown in Figure 7.5. As can be seen, if the rescaled distance of 15 is chosen, all the 30 countries can be classified into three groups, with 18, 4, and 8 countries, respectively.

D4.9 Developing a Road Safety Index
106
Figure 7.5. Classification tree produced following a direct CA.
7.2.3. Comparison of the results Figure 7.6a presents the mean values of the background variables for the country groups received by the FA, where Figure 7.6b demonstrates similar mean values for the country groups received by the direct CA.
Concerning the groups of countries in Figure 7.6a, it can be seen that:
• Clusters 1 and 2 are close, where Cluster 2 has a higher value of GDP but motorization level is slightly higher in Cluster 1 than in Cluster 2.
• Cluster 3 is different from Cluster 1 and 2, it has lower values of development level (GDP, motorization level), lower population density and lower percent of urban population.
• Cluster 1 has the highest value of percentage of powered two-wheelers. In contrast, Cluster 2 has a slightly lower percentage of elderly and slightly higher percentage of young population.
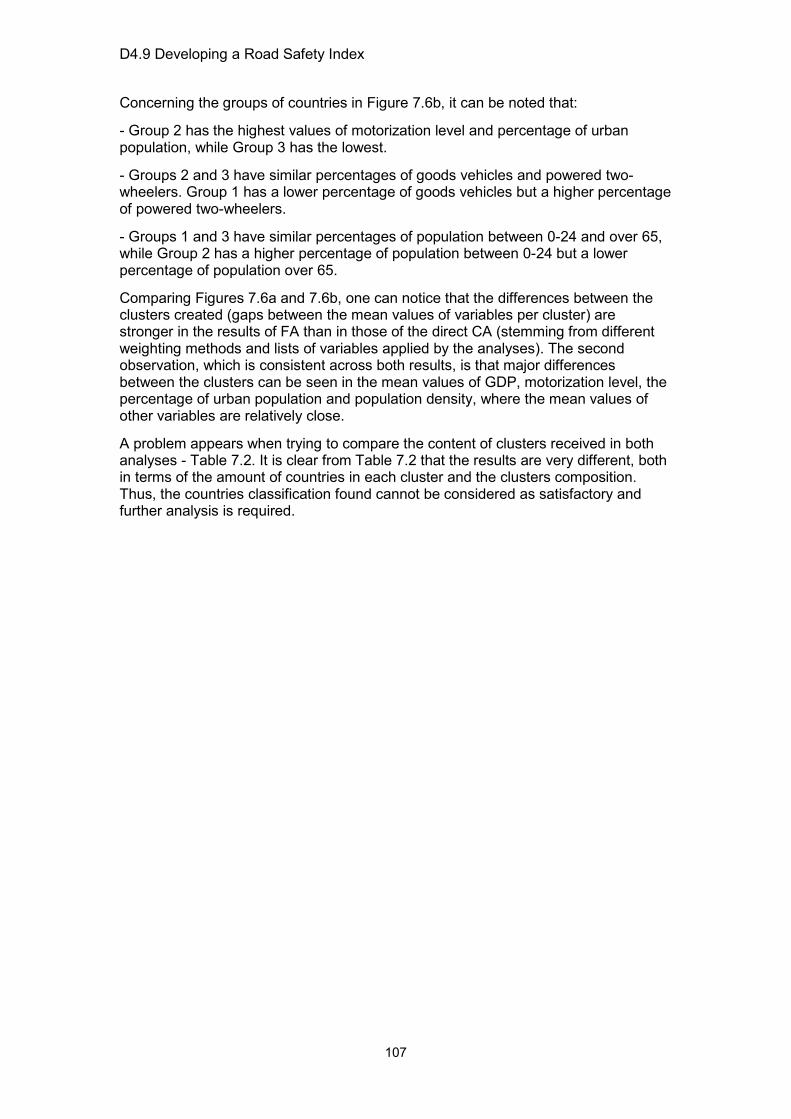
D4.9 Developing a Road Safety Index
107
Concerning the groups of countries in Figure 7.6b, it can be noted that:
- Group 2 has the highest values of motorization level and percentage of urban population, while Group 3 has the lowest.
- Groups 2 and 3 have similar percentages of goods vehicles and powered two-wheelers. Group 1 has a lower percentage of goods vehicles but a higher percentage of powered two-wheelers.
- Groups 1 and 3 have similar percentages of population between 0-24 and over 65, while Group 2 has a higher percentage of population between 0-24 but a lower percentage of population over 65.
Comparing Figures 7.6a and 7.6b, one can notice that the differences between the clusters created (gaps between the mean values of variables per cluster) are stronger in the results of FA than in those of the direct CA (stemming from different weighting methods and lists of variables applied by the analyses). The second observation, which is consistent across both results, is that major differences between the clusters can be seen in the mean values of GDP, motorization level, the percentage of urban population and population density, where the mean values of other variables are relatively close.
A problem appears when trying to compare the content of clusters received in both analyses - Table 7.2. It is clear from Table 7.2 that the results are very different, both in terms of the amount of countries in each cluster and the clusters composition. Thus, the countries classification found cannot be considered as satisfactory and further analysis is required.
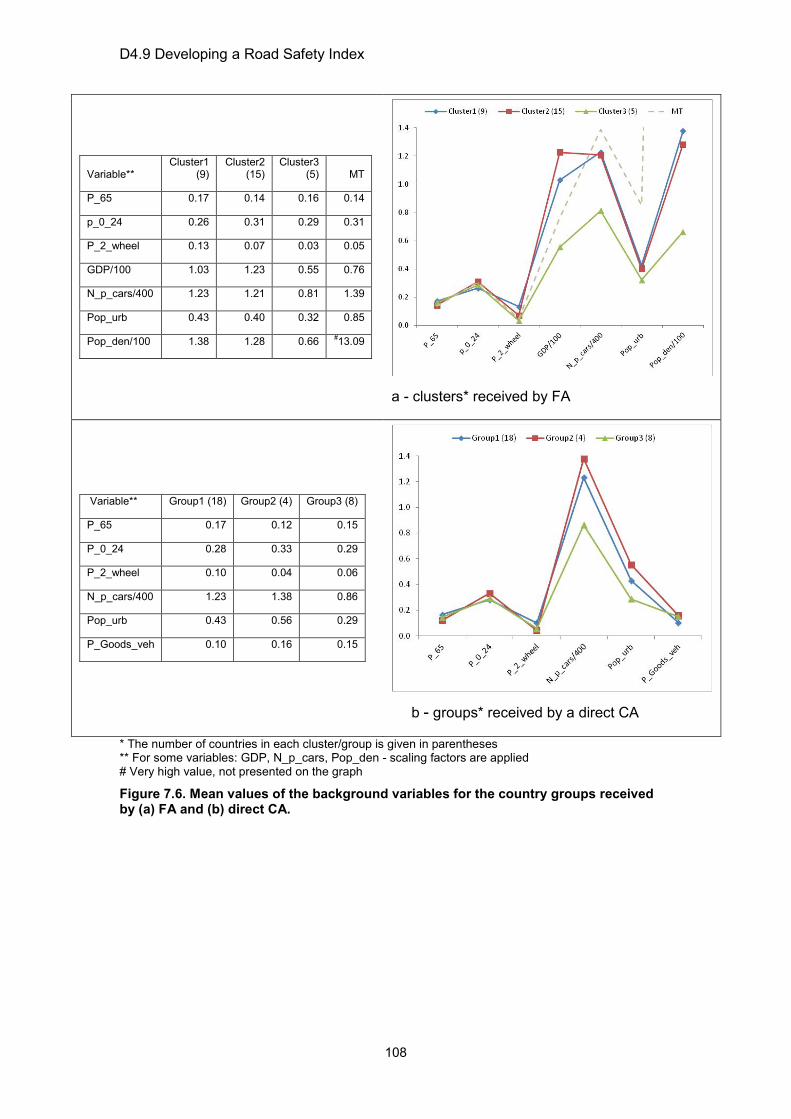
D4.9 Developing a Road Safety Index
108
Variable** Cluster1
(9) Cluster2
(15) Cluster3
(5) MT
P_65 0.17 0.14 0.16 0.14
p_0_24 0.26 0.31 0.29 0.31
P_2_wheel 0.13 0.07 0.03 0.05
GDP/100 1.03 1.23 0.55 0.76
N_p_cars/400 1.23 1.21 0.81 1.39
Pop_urb 0.43 0.40 0.32 0.85
Pop_den/100 1.38 1.28 0.66 13.09#
a - clusters* received by FA
Variable** Group1 (18) Group2 (4) Group3 (8)
P_65 0.17 0.12 0.15
P_0_24 0.28 0.33 0.29
P_2_wheel 0.10 0.04 0.06
N_p_cars/400 1.23 1.38 0.86
Pop_urb 0.43 0.56 0.29
P_Goods_veh 0.10 0.16 0.15
b - groups* received by a direct CA
* The number of countries in each cluster/group is given in parentheses ** For some variables: GDP, N_p_cars, Pop_den - scaling factors are applied # Very high value, not presented on the graph
Figure 7.6. Mean values of the background variables for the country groups received by (a) FA and (b) direct CA.

D4.9 Developing a Road Safety Index
109
Table 7.2. Comparison of clusters received by FA versus direct CA, with three country groups as a result.
Country Clusters acc. to FA Clusters acc. to direct CA AT 1 1 CZ 1 1 DE 1 1 EL 1 1 IT 1 1 SI 1 1 ES 1 1 CH 1 1 BE 2 1 FI 2 1 FR 2 1 LT 2 1 LU 2 1 SE 2 1 NL 2 1 UK 2 1 EE 3 1 LV 3 1 CY 2 2 IS 2 2 IE 2 2 MT 4, close to 2 2 PT 1 3 DK 2 3 NO 2 3 PL 2 3 SK 2 3 BG 3 3 HU 3 3 RO 3 3
7.3. Exploring a two-country-groups classification based on the complete set of indicators
As the initial country subdivision into three groups did not provide satisfactory results, it was decided to consider the possibility of creating two country groups, still based on the whole set of eight country characteristics.
Concerning the results of the FA, the two country groups can be recognized using the bottom tree in Figure 7.2 (which is identical to the final classification in Table 7.1): Clusters 1 and 3 should be combined to provide a new combined group (with 14 countries), where Cluster 2 remains as it is and provides the second group (with 16 countries).
To provide two country groups using a direct CA, the eight country variables were re-analysed by applying the hierarchical CA, where the dissimilarity matrix is set up
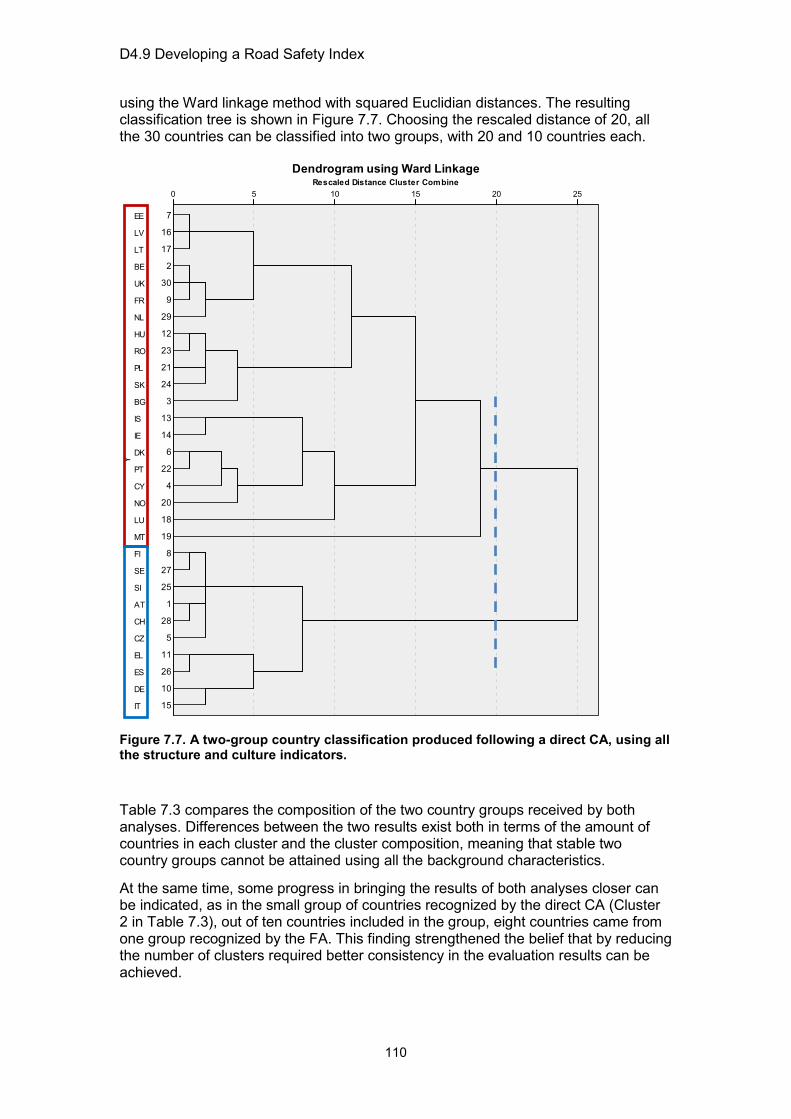
D4.9 Developing a Road Safety Index
110
using the Ward linkage method with squared Euclidian distances. The resulting classification tree is shown in Figure 7.7. Choosing the rescaled distance of 20, all the 30 countries can be classified into two groups, with 20 and 10 countries each.
Figure 7.7. A two-group country classification produced following a direct CA, using all the structure and culture indicators.
Table 7.3 compares the composition of the two country groups received by both analyses. Differences between the two results exist both in terms of the amount of countries in each cluster and the cluster composition, meaning that stable two country groups cannot be attained using all the background characteristics.
At the same time, some progress in bringing the results of both analyses closer can be indicated, as in the small group of countries recognized by the direct CA (Cluster 2 in Table 7.3), out of ten countries included in the group, eight countries came from one group recognized by the FA. This finding strengthened the belief that by reducing the number of clusters required better consistency in the evaluation results can be achieved.

D4.9 Developing a Road Safety Index
111
Table 7.3. Comparison of clusters received by FA versus direct CA, with two country groups recognized
Country Clusters acc. to FA Clusters acc. to direct CA BG A 1 EE A 1 HU A 1 LV A 1 PT A 1 RO A 1 BE B 1 CY B 1 DK B 1 FR b 1 IE b 1 IS b 1 LT b 1 LU b 1 MT b 1 NL b 1 NO b 1 PL b 1 SK b 1 UK b 1 AT a 2 CZ a 2 DE a 2 EL a 2 IT a 2 SI a 2 ES a 2 CH a 2 FI b 2 SE b 2
Figures 7.8a, b, present the mean values of the background variables for the country groups received by the FA and by the direct CA, respectively.
Comparing Figures 7.8, a, b, one can notice that the differences between the clusters created (gaps between the mean values of variables per cluster) are more consistent in the results of FA than in the results of direct CA. In the FA results, one of the groups has higher values of mean GDP, motorization level and population density than another group, while in the groups of direct CA, two values are higher and one is lower.
Similarly to previous findings, across both results, the main differences between the two clusters can be seen mostly in the mean values of GDP, motorization level and the percentage of urban population, indicating that final classification of the countries should be carried out with a smaller amount of variables.

D4.9 Developing a Road Safety Index
112
Variable** cluster1
(14) cluster 2 (16)
N_p_cars/400 1.08 1.22
GDP/100 0.86 1.20
Pop_den/100 1.12 2.02
Pop_urb 0.39 0.43
P_Goods_veh 0.11 0.13
P_2_wheel 0.10 0.07
p_0_24 0.27 0.31
P_65 0.17 0.14
a - clusters* received by FA
Variable** cluster1
(20) cluster 2 (10)
N_p_cars/400 1.11 1.24
GDP/100 1.02 1.09
Pop_den/100 1.82 1.16
Pop_urb 0.42 0.38
P_Goods_veh 0.14 0.10
P_2_wheel 0.06 0.13
p_0_24 0.30 0.27
P_65 0.15 0.17
b - clusters* received by a direct CA
* The number of countries in each cluster is given in parentheses. ** For some variables: GDP, N_p_cars, Pop_den - scaling factors are applied
Figure 7.8. Mean values of the background variables for the two country groups received by: (a) FA and (b) direct CA.
7.4. Recognizing two country groups based on four main structure and culture indicators
Finally, a possibility of creating two country groups was examined, based on the reduced set of four main country characteristics, which are: GDP per head, number of passenger cars per 1000 inhabitants, population density and population living in urban areas.
7.4.1. Direct clustering The four main country variables were analysed by applying the hierarchical CA, using the Ward linkage method with squared Euclidian distances, to recognize two groups of countries. The resulting classification tree is shown in Figure 8.9. Choosing the rescaled distance of 20, all the countries, except for MT, can be classified into two groups, with 10 and 19 countries each.

D4.9 Developing a Road Safety Index
113
Figure 7.9. A two-groups classification produced following a direct CA, based on the main indicators.
7.4.2. Factor analysis A factor analysis was carried out on the data set including four main indicators. Due to outlying values of some variables for MT and LU, these countries were excluded from the factoring, but were added later to the final country classification demonstrating their position related to other countries.
The initial data analysis demonstrated a high correlation4 between pairs of variables: motorization level and GDP, as well as population density and the percentage of population living in urban areas, demonstrating a possibility for creating two factors, where each one is loaded by a pair of correlated variables. To improve visualization of the results, it was decided to build two new variables, where each one presents a standardized average of the pair of original characteristics that would enable plotting the countries on a two-dimensional map of country characteristics. 4 According to Pearson correlation coefficients, a significant positive correlation at the 0.005 level.
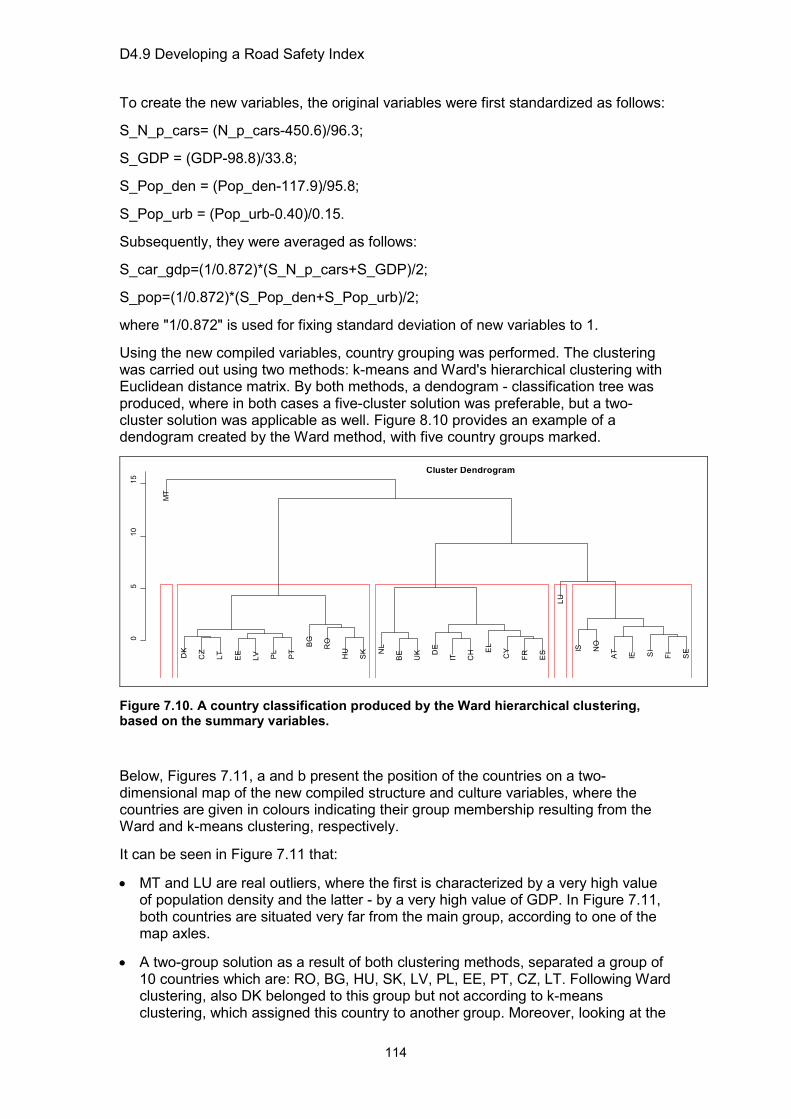
D4.9 Developing a Road Safety Index
114
To create the new variables, the original variables were first standardized as follows:
S_N_p_cars= (N_p_cars-450.6)/96.3;
S_GDP = (GDP-98.8)/33.8;
S_Pop_den = (Pop_den-117.9)/95.8;
S_Pop_urb = (Pop_urb-0.40)/0.15.
Subsequently, they were averaged as follows:
S_car_gdp=(1/0.872)*(S_N_p_cars+S_GDP)/2;
S_pop=(1/0.872)*(S_Pop_den+S_Pop_urb)/2;
where "1/0.872" is used for fixing standard deviation of new variables to 1.
Using the new compiled variables, country grouping was performed. The clustering was carried out using two methods: k-means and Ward's hierarchical clustering with Euclidean distance matrix. By both methods, a dendogram - classification tree was produced, where in both cases a five-cluster solution was preferable, but a two-cluster solution was applicable as well. Figure 8.10 provides an example of a dendogram created by the Ward method, with five country groups marked.
MT
DK
CZ
LT EE
LV PL
PT
BG
RO
HU
SK N
L
BE
UK D
E
IT CH E
L
CY
FR ES
LU
IS NO
AT
IE SI
FI SE
05
1015
Cluster Dendrogram
Figure 7.10. A country classification produced by the Ward hierarchical clustering, based on the summary variables.
Below, Figures 7.11, a and b present the position of the countries on a two-dimensional map of the new compiled structure and culture variables, where the countries are given in colours indicating their group membership resulting from the Ward and k-means clustering, respectively.
It can be seen in Figure 7.11 that:
• MT and LU are real outliers, where the first is characterized by a very high value of population density and the latter - by a very high value of GDP. In Figure 7.11, both countries are situated very far from the main group, according to one of the map axles.
• A two-group solution as a result of both clustering methods, separated a group of 10 countries which are: RO, BG, HU, SK, LV, PL, EE, PT, CZ, LT. Following Ward clustering, also DK belonged to this group but not according to k-means clustering, which assigned this country to another group. Moreover, looking at the

D4.9 Developing a Road Safety Index
115
plot of the countries (see Figure 7.11), it can be concluded that attributing DK to the aforementioned group of countries would need adding EL as well, where in both classifications EL was consistently associated with another group.
Thus, based on the results of the two clustering procedures, a stable country group was identified. The subdivision of the countries into two groups can be visualized using a vertical dotted line in Figure 7.11, a and b, which actually subdivides the countries in accordance with the summary value of GDP and motorization level (the line passes slightly below "0", i.e. near the average value of the variables). To note, a similar horizontal line cannot be proposed as these compiled values of population density with the percentage of population in urban areas are mixed across various country groups.
-2 -1 0 1 2 3 4
-20
24
68
Ward Hierarchical Clustering
AT
BE
BG
CYCZ DKEE
FI
FR
DEEL
HU ISIE
IT
LV LTLU
MT
NO
PL PTRO
SK SI
ES
SE
CH
NL
UK
a
-2 -1 0 1 2 3 4
-20
24
68
K-means
AT
BE
BG
CYCZ DKEE
FI
FR
DEEL
HU ISIE
IT
LV LTLU
MT
NO
PL PTRO
SK SI
ES
SE
CH
NL
UK
b
Figure notes: S_car_gdp is a summary variable (standardized average) of motorization level and GDP per capita; S_pop is a summary variable (standardized average) of population density and the percentage of population living in urban areas.
Figure 7.11. Country positions on a two-dimensional map of the new compiled structure and culture variables with five clusters identified using: (a) Ward hierarchical clustering, and (b) k-means clustering.
S_car_gdp
S_pop
S_car_gdp
S_pop
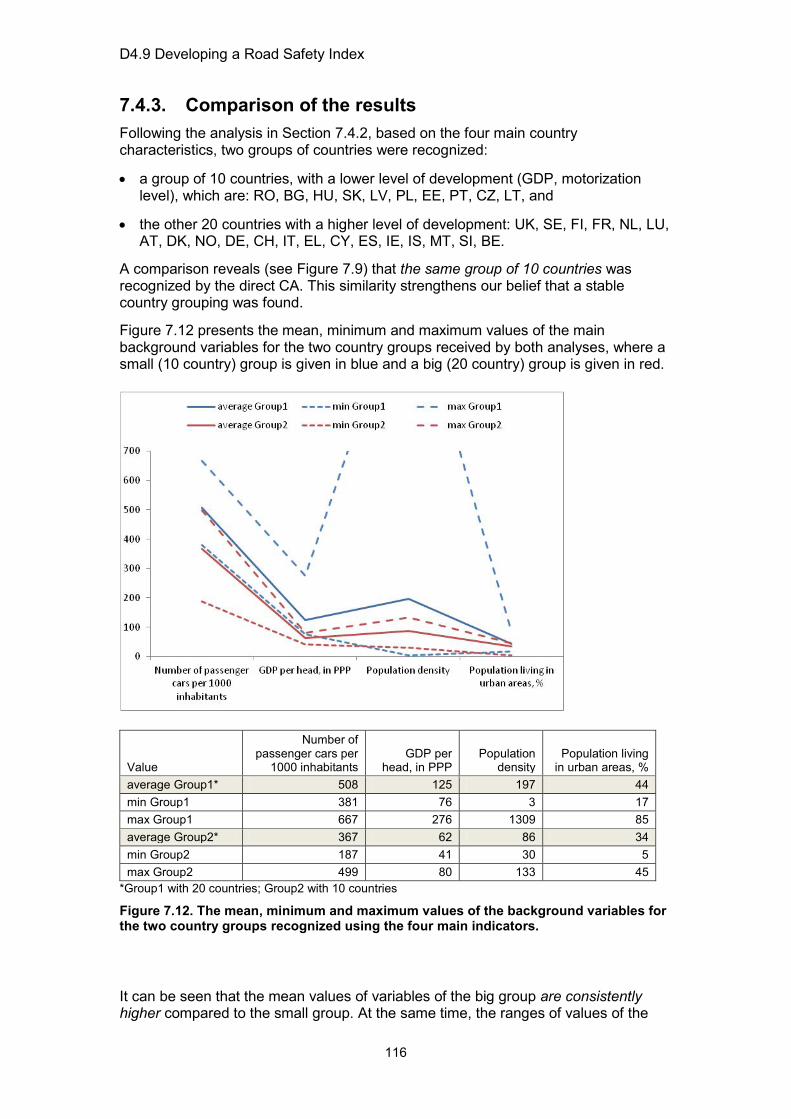
D4.9 Developing a Road Safety Index
116
7.4.3. Comparison of the results Following the analysis in Section 7.4.2, based on the four main country characteristics, two groups of countries were recognized:
• a group of 10 countries, with a lower level of development (GDP, motorization level), which are: RO, BG, HU, SK, LV, PL, EE, PT, CZ, LT, and
• the other 20 countries with a higher level of development: UK, SE, FI, FR, NL, LU, AT, DK, NO, DE, CH, IT, EL, CY, ES, IE, IS, MT, SI, BE.
A comparison reveals (see Figure 7.9) that the same group of 10 countries was recognized by the direct CA. This similarity strengthens our belief that a stable country grouping was found.
Figure 7.12 presents the mean, minimum and maximum values of the main background variables for the two country groups received by both analyses, where a small (10 country) group is given in blue and a big (20 country) group is given in red.
Value
Number of passenger cars per
1000 inhabitants GDP per
head, in PPP Population
density Population living
in urban areas, % average Group1* 508 125 197 44 min Group1 381 76 3 17 max Group1 667 276 1309 85 average Group2* 367 62 86 34 min Group2 187 41 30 5 max Group2 499 80 133 45
*Group1 with 20 countries; Group2 with 10 countries
Figure 7.12. The mean, minimum and maximum values of the background variables for the two country groups recognized using the four main indicators.
It can be seen that the mean values of variables of the big group are consistently higher compared to the small group. At the same time, the ranges of values of the

D4.9 Developing a Road Safety Index
117
two groups overlap, meaning that some countries from one group may have values of certain variables resembling countries from another group.
7.5. Considering Hofstede cultural scores As introduced in Chapter 6, Hofstede cultural dimensions seem to be promising for the development of Road Safety Composite Index.
Hofstede (2001) developed five culture dimensions, such as: inequality between people (power distance), individualism versus collectivism, stress level from unknown future (uncertainty avoidance), time perspective of individuals (long-term versus short-term) and indulgence versus restraint. Previous studies, e.g. Hofstede (2001), Gaygisiz (2010), demonstrated positive relations between some cultural indices and traffic fatalities. In addition, some studies, e.g. Ozkan (2006), found a correlation between some culture values and GDP. Based on the literature survey it was assumed that culture can influence road safety and, thus, it would be interesting to explore the use of Hofstede's cultural scores for grouping countries.
Thus, in addition to the analysis of the "Structure and Culture" characteristics as presented above, Hofstede cultural dimensions were examined aiming to recognize similar country groups.
Results of this analysis are presented in Appendix F. It was found that the country classification based on Hofstede cultural scores was different from that based on the "Structure and Culture" indicators. Such a result is generally expected as using different characteristics various country classifications can be provided. Due to essential differences between the country groups defined on the basis of "Structure and Culture" indicators versus those created using Hofstede's measures, both results were not mixed in the current analysis. The development of Road Safety Composite Index in the current study was continued with the two groups of countries recognized using the "Structure and Culture" indicators (see Section 7.4).
7.6. Concluding remarks Having explored various forms of country grouping based on the indicators of the "Structure and Culture" layer, two groups of countries were recognized. The two groups were stable across various classification methods, where the country grouping is based on the four main country characteristics: GDP per head, motorization level, population density and the percentage of population living in urban areas.
The key characteristics subdividing the countries into two groups were the indicators of motorization level and GDP per capita which are commonly known as characteristics of the level of a country's economic development.
The first group includes 10 countries: RO, BG, HU, SK, LV, PL, EE, PT, CZ, LT, and, on average, is characterized by lower values of economic development. The second group includes the remaining 20 countries, that score generally higher, but also more diverse on the background country characteristics.
The differences between the two country groups are visualized with the help of a two-dimensional map as presented in Figure 7.11. Moreover, using the map, the position of each one of the countries, related to the two groups can be clarified.

D4.9 Developing a Road Safety Index
118
7.7. References Anderberg, M.R. (1973). Cluster analysis for applications. Academic Press, New York.
Everitt, B.S., Landau, S., and Leese, M. (2001). Cluster analysis. Arnold Publishers, London, 4th edition.
Gaygısız, E. (2010). Cultural values and governance quality as correlates of road traffic fatalities: A nation level analysis. Accident Analysis and Prevention, 42, pp. 1894-1901.
Hofstede, G. (2001). Culture’s consequences: Comparing values, behaviours, institutions, and organizations across nations (2nd ed.). Sage Publications, Inc., California.
Johnson, R.A., and Wichern, D.W. (2002). Applied multivariate statistical analysis. Pearson Education, New Jersey.
Nardo, M., Saisana, M., Saltelli, A., and Tarantola, S. (2005). Handbook on constructing composite indicators: Methodology and user guide. OECD Statistics Working Papers, STD/DOC(2005)3. Organisation for Economic Co-operation and Development OECD, Paris.
Ozkan, T. (2006). The regional difference between countries in traffic safety: A cross-cultural study and Turkish case. PhD Thesis, University of Helsinki.
Schiffler, R.E. (1988). Maximum Z score and outliers. The American Statistician, 42 (1), pp. 79-80.
SPSS Inc. (2007). SPSS statistics base 17.0 user’s guide. http://www.spss.com.
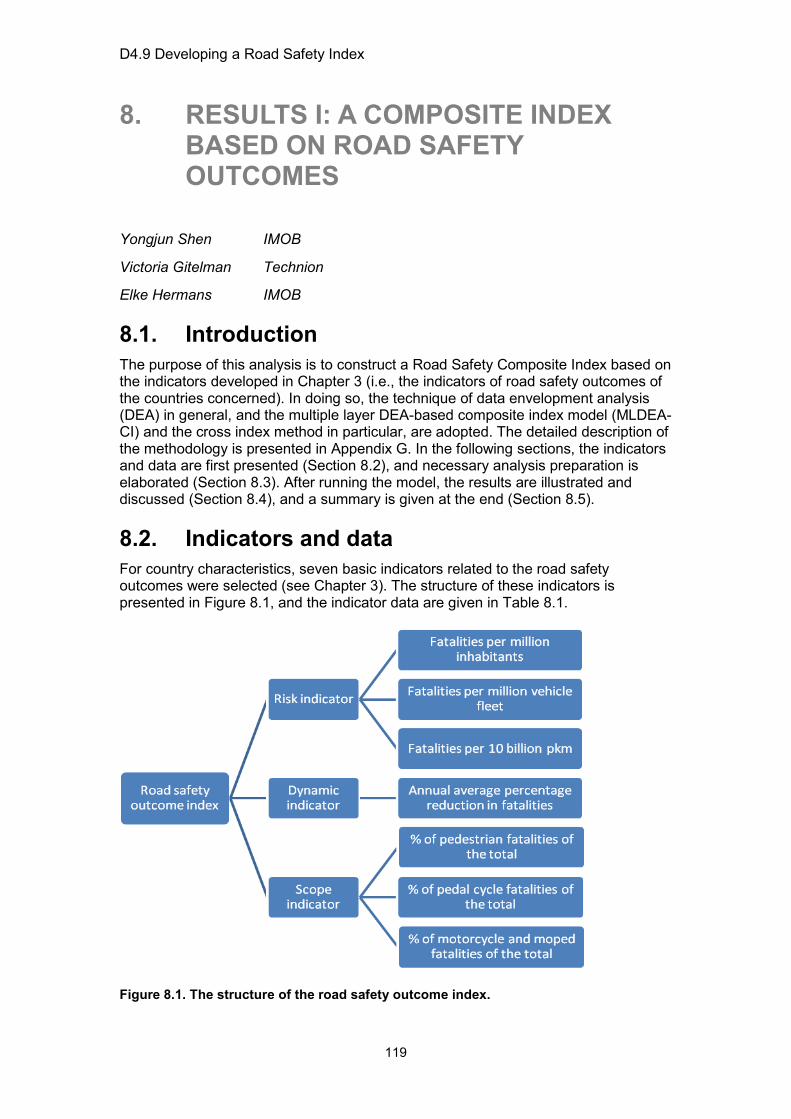
D4.9 Developing a Road Safety Index
119
8. RESULTS I: A COMPOSITE INDEX BASED ON ROAD SAFETY OUTCOMES
Yongjun Shen IMOB
Victoria Gitelman Technion
Elke Hermans IMOB
8.1. Introduction The purpose of this analysis is to construct a Road Safety Composite Index based on the indicators developed in Chapter 3 (i.e., the indicators of road safety outcomes of the countries concerned). In doing so, the technique of data envelopment analysis (DEA) in general, and the multiple layer DEA-based composite index model (MLDEA-CI) and the cross index method in particular, are adopted. The detailed description of the methodology is presented in Appendix G. In the following sections, the indicators and data are first presented (Section 8.2), and necessary analysis preparation is elaborated (Section 8.3). After running the model, the results are illustrated and discussed (Section 8.4), and a summary is given at the end (Section 8.5).
8.2. Indicators and data For country characteristics, seven basic indicators related to the road safety outcomes were selected (see Chapter 3). The structure of these indicators is presented in Figure 8.1, and the indicator data are given in Table 8.1.
Figure 8.1. The structure of the road safety outcome index.
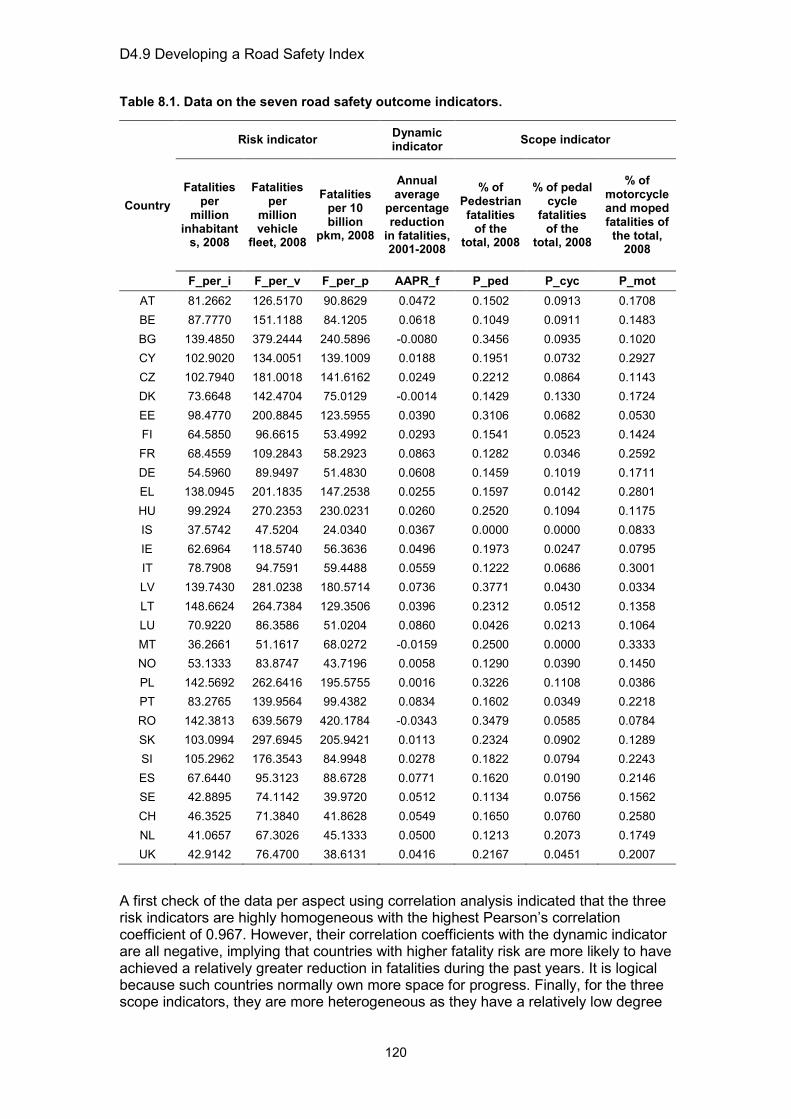
D4.9 Developing a Road Safety Index
120
Table 8.1. Data on the seven road safety outcome indicators.
Country
Risk indicator Dynamic indicator Scope indicator
Fatalities per
million inhabitant
s, 2008
Fatalities per
million vehicle
fleet, 2008
Fatalities per 10 billion
pkm, 2008
Annual average
percentage reduction
in fatalities, 2001-2008
% of Pedestrian fatalities
of the total, 2008
% of pedal cycle
fatalities of the
total, 2008
% of motorcycle and moped fatalities of
the total, 2008
F_per_i F_per_v F_per_p AAPR_f P_ped P_cyc P_mot AT 81.2662 126.5170 90.8629 0.0472 0.1502 0.0913 0.1708 BE 87.7770 151.1188 84.1205 0.0618 0.1049 0.0911 0.1483 BG 139.4850 379.2444 240.5896 -0.0080 0.3456 0.0935 0.1020 CY 102.9020 134.0051 139.1009 0.0188 0.1951 0.0732 0.2927 CZ 102.7940 181.0018 141.6162 0.0249 0.2212 0.0864 0.1143 DK 73.6648 142.4704 75.0129 -0.0014 0.1429 0.1330 0.1724 EE 98.4770 200.8845 123.5955 0.0390 0.3106 0.0682 0.0530 FI 64.5850 96.6615 53.4992 0.0293 0.1541 0.0523 0.1424 FR 68.4559 109.2843 58.2923 0.0863 0.1282 0.0346 0.2592 DE 54.5960 89.9497 51.4830 0.0608 0.1459 0.1019 0.1711 EL 138.0945 201.1835 147.2538 0.0255 0.1597 0.0142 0.2801 HU 99.2924 270.2353 230.0231 0.0260 0.2520 0.1094 0.1175 IS 37.5742 47.5204 24.0340 0.0367 0.0000 0.0000 0.0833 IE 62.6964 118.5740 56.3636 0.0496 0.1973 0.0247 0.0795 IT 78.7908 94.7591 59.4488 0.0559 0.1222 0.0686 0.3001 LV 139.7430 281.0238 180.5714 0.0736 0.3771 0.0430 0.0334 LT 148.6624 264.7384 129.3506 0.0396 0.2312 0.0512 0.1358 LU 70.9220 86.3586 51.0204 0.0860 0.0426 0.0213 0.1064 MT 36.2661 51.1617 68.0272 -0.0159 0.2500 0.0000 0.3333 NO 53.1333 83.8747 43.7196 0.0058 0.1290 0.0390 0.1450 PL 142.5692 262.6416 195.5755 0.0016 0.3226 0.1108 0.0386 PT 83.2765 139.9564 99.4382 0.0834 0.1602 0.0349 0.2218 RO 142.3813 639.5679 420.1784 -0.0343 0.3479 0.0585 0.0784 SK 103.0994 297.6945 205.9421 0.0113 0.2324 0.0902 0.1289 SI 105.2962 176.3543 84.9948 0.0278 0.1822 0.0794 0.2243 ES 67.6440 95.3123 88.6728 0.0771 0.1620 0.0190 0.2146 SE 42.8895 74.1142 39.9720 0.0512 0.1134 0.0756 0.1562 CH 46.3525 71.3840 41.8628 0.0549 0.1650 0.0760 0.2580 NL 41.0657 67.3026 45.1333 0.0500 0.1213 0.2073 0.1749 UK 42.9142 76.4700 38.6131 0.0416 0.2167 0.0451 0.2007
A first check of the data per aspect using correlation analysis indicated that the three risk indicators are highly homogeneous with the highest Pearson’s correlation coefficient of 0.967. However, their correlation coefficients with the dynamic indicator are all negative, implying that countries with higher fatality risk are more likely to have achieved a relatively greater reduction in fatalities during the past years. It is logical because such countries normally own more space for progress. Finally, for the three scope indicators, they are more heterogeneous as they have a relatively low degree
D4.9 Developing a Road Safety Index
121
of correlation among them, which means that these countries have quite a different situation on the shares of vulnerable road user fatalities.
8.3. Analysis preparation: data normalization and assigning weight restrictions
In this study, the technique of data envelopment analysis (DEA) in general, and the multiple layer DEA-based composite index model (MLDEA-CI) in particular, is used to construct the road safety outcome index for the countries concerned. Afterwards, the cross index method is adopted to effectively rank all these countries (for the detailed description of the methodology, please refer to Appendix G). Generally speaking, the most attractive feature of DEA, relative to the other methods in developing CIs is that, each country obtains its own best possible indicator weights, and DEA assesses the relative performance of a particular country by taking the performance of all other countries into account. In this way, key problems can be identified for each country separately, and policymakers could not complain about unfair weighting, because each country is put in its most favorable light, and any other weighting scheme would generate a lower composite score. In other words, if a country turns out to be underperforming based on the most favorable set of weights, its poor performance cannot be traced back to an inappropriate evaluation process (Shen, 2012). To use DEA for this study, in particular, to reflect the layered hierarchy of the indicators (see Figure 8.1), the MLDEA-CI model developed by Shen et al. (2012) has to be adopted (see also Appendix G). In doing so, data normalization and weight restrictions are two aspects that need to be specified before applying the model.
8.3.1. Data normalization Prior to the application of the MLDEA-CI model, the raw data should first be normalized so as to eliminate the scale differences of the indicators and the effects of the measurement unit. Moreover, we need to ensure that all the indicators are expressed in the same direction with respect to their expected road safety impact, i.e., a higher indicator value should always correspond to a better road safety level. Table 8.2 shows the rescaled indicator values, in which the worst indicator value is transformed into 0.15 while the best indicator value obtains a rescaled score of 1. All rescaled values therefore lie within this interval.
8.3.2. Weight restrictions In addition to the data normalization, weight restrictions should also be specified before applying the MLDEA-CI model so as to guarantee the obtainment of realistic and acceptable indicator weights. In this study, the indicators belonging to the same category (i.e., the three risk indicators and the three scope indicators) are considered to be of similar importance. Thus, we obligate the weights of these indicators to vary at most with a 20% variability of their average weights.
With regard to the higher layer, i.e., the three different types of indicators – risk indicator (R), dynamic indicator (D), and scope indicator (S) – a virtual weight (or share) restriction is assigned, i.e., > >R D SShare Share Share , indicating the importance ordering of these three components in the combined index score.
5 A rescaled range of [0.1, 1] is derived in order to avoid an indicator value of 0.

D4.9 Developing a Road Safety Index
122
Table 8.2. Rescaled data set of the road safety outcome indicators.
Country F_per_i F_per_v F_per_p AAPR_f P_ped P_cyc P_mot
AT 0.6397 0.8799 0.8482 0.7085 0.6415 0.6036 0.5876 BE 0.5875 0.8425 0.8635 0.8167 0.7497 0.6045 0.6552 BG 0.1735 0.4957 0.5080 0.2966 0.1750 0.5941 0.7942 CY 0.4664 0.8685 0.7386 0.4962 0.5343 0.6824 0.2220 CZ 0.4673 0.7971 0.7329 0.5415 0.4721 0.6248 0.7572 DK 0.7005 0.8557 0.8842 0.3457 0.6590 0.4227 0.5829 EE 0.5019 0.7669 0.7738 0.6471 0.2587 0.7040 0.9411 FI 0.7732 0.9253 0.9331 0.5750 0.6323 0.7729 0.6728 FR 0.7422 0.9061 0.9222 1.0000 0.6941 0.8497 0.3225 DE 0.8532 0.9355 0.9376 0.8093 0.6519 0.5579 0.5868 EL 0.1846 0.7664 0.7201 0.5462 0.6189 0.9385 0.2597 HU 0.4953 0.6614 0.5320 0.5497 0.3985 0.5250 0.7478 IS 0.9895 1.0000 1.0000 0.6299 1.0000 1.0000 0.8502 IE 0.7884 0.8920 0.9266 0.7263 0.5292 0.8930 0.8618 IT 0.6595 0.9282 0.9195 0.7731 0.7083 0.7022 0.1996 LV 0.1714 0.6450 0.6444 0.9054 0.1000 0.8135 1.0000 LT 0.1000 0.6698 0.7607 0.6518 0.4482 0.7775 0.6927 LU 0.7225 0.9410 0.9387 0.9972 0.8984 0.9076 0.7810 MT 1.0000 0.9945 0.9001 0.2373 0.4033 1.0000 0.1000 NO 0.8649 0.9447 0.9553 0.3994 0.6921 0.8307 0.6651 PL 0.1488 0.6730 0.6103 0.3683 0.2302 0.5192 0.9845 PT 0.6236 0.8595 0.8287 0.9779 0.6177 0.8485 0.4348 RO 0.1503 0.1000 0.1000 0.1000 0.1696 0.7462 0.8650 SK 0.4648 0.6197 0.5867 0.4400 0.4454 0.6085 0.7135 SI 0.4472 0.8042 0.8615 0.5635 0.5650 0.6552 0.4272 ES 0.7487 0.9273 0.8531 0.9312 0.6134 0.9174 0.4563 SE 0.9470 0.9596 0.9638 0.7376 0.7295 0.6720 0.6316 CH 0.9192 0.9637 0.9595 0.7657 0.6062 0.6701 0.3261 NL 0.9616 0.9699 0.9521 0.7291 0.7105 0.1000 0.5754 UK 0.9468 0.9560 0.9669 0.6663 0.4827 0.8042 0.4979
8.4. Results The MLDEA-CI model can now be applied to combine the seven normalized indicator values into a composite index score for 30 countries by selecting the best possible country-specific indicator weights under the imposed restrictions. The results are presented in the following sections.
8.4.1. Index scores By applying the MLDEA-CI model, the optimal index score can be computed for each of the 30 countries. Best-performing countries can then be distinguished from underperforming ones. Moreover, to effectively rank all these countries, the cross
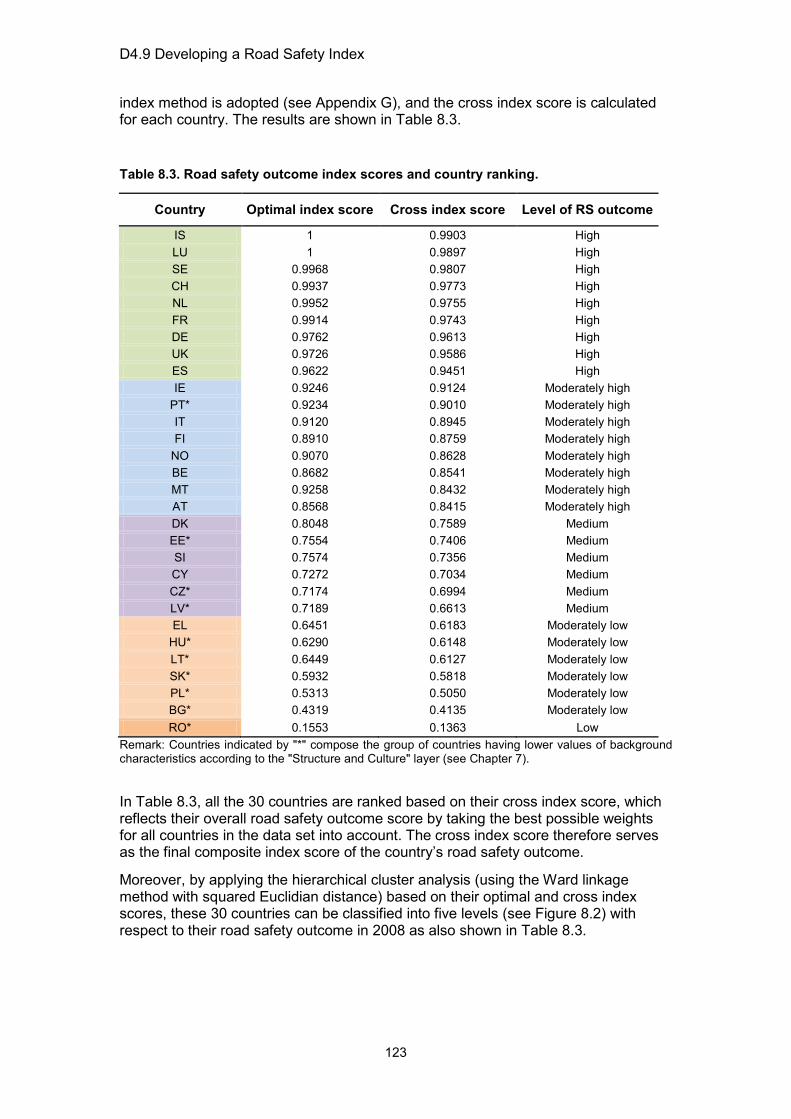
D4.9 Developing a Road Safety Index
123
index method is adopted (see Appendix G), and the cross index score is calculated for each country. The results are shown in Table 8.3.
Table 8.3. Road safety outcome index scores and country ranking.
Country Optimal index score Cross index score Level of RS outcome
IS 1 0.9903 High LU 1 0.9897 High SE 0.9968 0.9807 High CH 0.9937 0.9773 High NL 0.9952 0.9755 High FR 0.9914 0.9743 High DE 0.9762 0.9613 High UK 0.9726 0.9586 High ES 0.9622 0.9451 High IE 0.9246 0.9124 Moderately high
PT* 0.9234 0.9010 Moderately high IT 0.9120 0.8945 Moderately high FI 0.8910 0.8759 Moderately high
NO 0.9070 0.8628 Moderately high BE 0.8682 0.8541 Moderately high MT 0.9258 0.8432 Moderately high AT 0.8568 0.8415 Moderately high DK 0.8048 0.7589 Medium EE* 0.7554 0.7406 Medium SI 0.7574 0.7356 Medium CY 0.7272 0.7034 Medium CZ* 0.7174 0.6994 Medium LV* 0.7189 0.6613 Medium EL 0.6451 0.6183 Moderately low
HU* 0.6290 0.6148 Moderately low LT* 0.6449 0.6127 Moderately low SK* 0.5932 0.5818 Moderately low PL* 0.5313 0.5050 Moderately low BG* 0.4319 0.4135 Moderately low RO* 0.1553 0.1363 Low
Remark: Countries indicated by "*" compose the group of countries having lower values of background characteristics according to the "Structure and Culture" layer (see Chapter 7).
In Table 8.3, all the 30 countries are ranked based on their cross index score, which reflects their overall road safety outcome score by taking the best possible weights for all countries in the data set into account. The cross index score therefore serves as the final composite index score of the country’s road safety outcome.
Moreover, by applying the hierarchical cluster analysis (using the Ward linkage method with squared Euclidian distance) based on their optimal and cross index scores, these 30 countries can be classified into five levels (see Figure 8.2) with respect to their road safety outcome in 2008 as also shown in Table 8.3.

D4.9 Developing a Road Safety Index
124
Figure 8.2. Classification tree using hierarchical cluster analysis.
The results demonstrate that:
• IS and LU are the two best-performing countries since they obtain an optimal index score of 1, and can be set as benchmark for other countries, while the others have a score below that. In total, nine countries belong to the high level of road safety outcome, including also SE, CH, NL, FR, DE, UK and ES.
• Eight countries are recognized as having a moderately high level of road safety outcome, six countries with a medium level, another six countries with a moderately low level and one country (RO) with a real low level in 2008.
• If the country groups are considered that were identified using the characteristics of the "Structure and Culture" layer (see Chapter 7), one can note that most of the countries in the group characterized by lower values of the background characteristics belong to the last three levels of road safety outcome, i.e., medium,

D4.9 Developing a Road Safety Index
125
moderately low, or low. These countries are EE, CZ, LV, HU, LT, SK, PL, BG, and RO; Only PT has a moderately high safety outcome. In Table 8.3, the group of countries with lower background characteristics is indicated by "*".
• Regarding the remainder of countries, i.e., the 20 countries having higher values of the background characteristics (as identified in Chapter 7), most of them belong to a high or moderately high level of road safety outcome, where three countries have a medium level (DK, SI, and CY) and one country (EL) belongs to the moderately low outcome level.
Moreover, Appendix H shows the composite index scores estimated for each of the two country groups separately. For the first country group (10 countries with lower values of the background characteristics), PT is considered as the benchmark country. In this group, the index score for all other countries has increased to a certain extent due to the fact that they are closer to the new benchmark country. In other words, once a more comparable country group is considered separately, also including fewer countries than the whole group, for most countries it is easier to become a better- or best-performing country.
For the second country group (20 countries with higher values of the background characteristics), the results of separate estimation were similar to that obtained in the analysis of the whole country set, i.e., the index scores of countries in Appendix H are close to those presented in Table 8.3, where IS and LU are the two best performing countries and can serve as benchmark countries for the situation in 2008. However, slight differences can be noted in the results. For example, in the separate group estimation, LU is ranked in third place, whereas in the complete set analysis this country has the second position. Such changes in country ranking are expected as, when a different number of countries is considered in a benchmarking study, the cross index score for each country changes accordingly.
In general, we can notice that the country rankings obtained by the two analyses – the whole country set versus two separate groups – are very close. With a very few exceptions, the order of countries ranked in accordance with the cross index score in the two separate groups in fact reproduces the order of countries received for the whole country set (as presented in Table 8.3). In other words, changing the set of countries with which they are compared and the consequent benchmark country, especially for those countries in group one, doesn't alter their ranking a lot.
8.4.2. Weight allocation Based on the principle of the MLDEA-CI model, an indicator will be assigned a high weight if the country performs relatively well on that aspect, compared to other countries. Conversely, low weights associated with certain basic indicators provide valuable information about the aspects requiring most action for improvement. In Table 8.4, the assigned weights for the seven indicators based on the MLDEA-CI model are presented for the case of Austria.
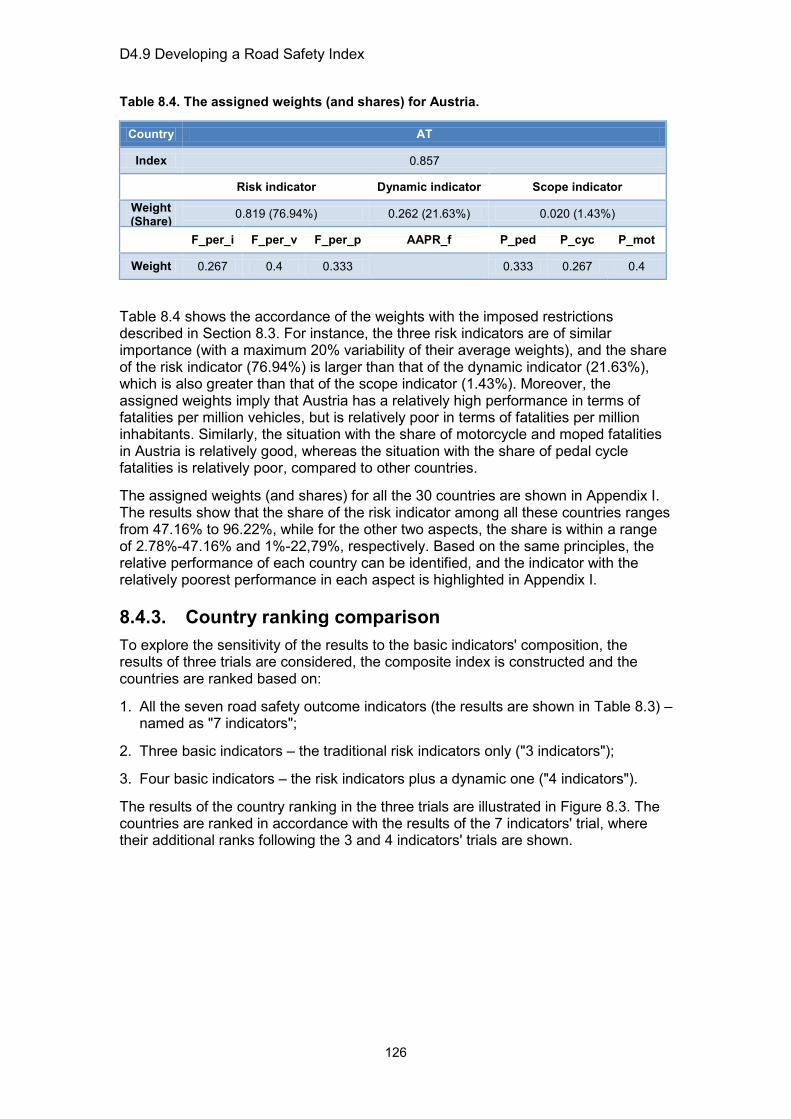
D4.9 Developing a Road Safety Index
126
Table 8.4. The assigned weights (and shares) for Austria.
Country AT
Index 0.857
Risk indicator Dynamic indicator Scope indicator Weight (Share) 0.819 (76.94%) 0.262 (21.63%) 0.020 (1.43%)
F_per_i F_per_v F_per_p AAPR_f P_ped P_cyc P_mot
Weight 0.267 0.4 0.333 0.333 0.267 0.4
Table 8.4 shows the accordance of the weights with the imposed restrictions described in Section 8.3. For instance, the three risk indicators are of similar importance (with a maximum 20% variability of their average weights), and the share of the risk indicator (76.94%) is larger than that of the dynamic indicator (21.63%), which is also greater than that of the scope indicator (1.43%). Moreover, the assigned weights imply that Austria has a relatively high performance in terms of fatalities per million vehicles, but is relatively poor in terms of fatalities per million inhabitants. Similarly, the situation with the share of motorcycle and moped fatalities in Austria is relatively good, whereas the situation with the share of pedal cycle fatalities is relatively poor, compared to other countries.
The assigned weights (and shares) for all the 30 countries are shown in Appendix I. The results show that the share of the risk indicator among all these countries ranges from 47.16% to 96.22%, while for the other two aspects, the share is within a range of 2.78%-47.16% and 1%-22,79%, respectively. Based on the same principles, the relative performance of each country can be identified, and the indicator with the relatively poorest performance in each aspect is highlighted in Appendix I.
8.4.3. Country ranking comparison To explore the sensitivity of the results to the basic indicators' composition, the results of three trials are considered, the composite index is constructed and the countries are ranked based on:
1. All the seven road safety outcome indicators (the results are shown in Table 8.3) – named as "7 indicators";
2. Three basic indicators – the traditional risk indicators only ("3 indicators");
3. Four basic indicators – the risk indicators plus a dynamic one ("4 indicators").
The results of the country ranking in the three trials are illustrated in Figure 8.3. The countries are ranked in accordance with the results of the 7 indicators' trial, where their additional ranks following the 3 and 4 indicators' trials are shown.
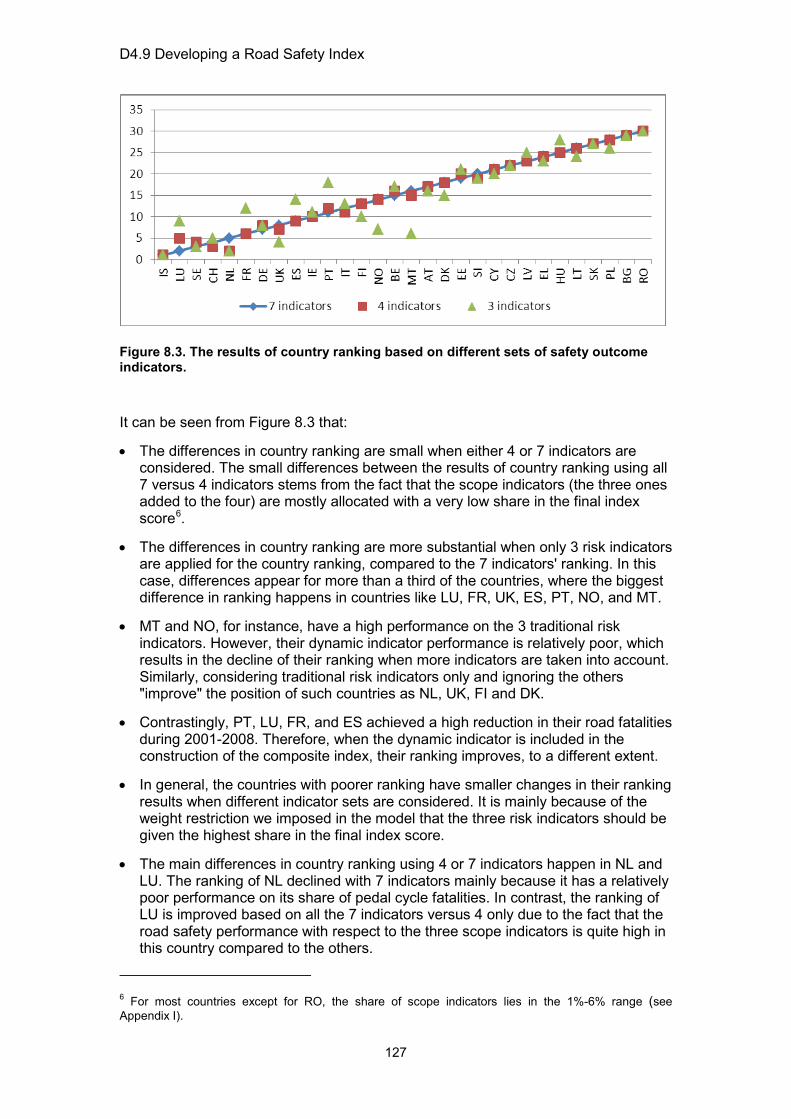
D4.9 Developing a Road Safety Index
127
Figure 8.3. The results of country ranking based on different sets of safety outcome indicators.
It can be seen from Figure 8.3 that:
• The differences in country ranking are small when either 4 or 7 indicators are considered. The small differences between the results of country ranking using all 7 versus 4 indicators stems from the fact that the scope indicators (the three ones added to the four) are mostly allocated with a very low share in the final index score6.
• The differences in country ranking are more substantial when only 3 risk indicators are applied for the country ranking, compared to the 7 indicators' ranking. In this case, differences appear for more than a third of the countries, where the biggest difference in ranking happens in countries like LU, FR, UK, ES, PT, NO, and MT.
• MT and NO, for instance, have a high performance on the 3 traditional risk indicators. However, their dynamic indicator performance is relatively poor, which results in the decline of their ranking when more indicators are taken into account. Similarly, considering traditional risk indicators only and ignoring the others "improve" the position of such countries as NL, UK, FI and DK.
• Contrastingly, PT, LU, FR, and ES achieved a high reduction in their road fatalities during 2001-2008. Therefore, when the dynamic indicator is included in the construction of the composite index, their ranking improves, to a different extent.
• In general, the countries with poorer ranking have smaller changes in their ranking results when different indicator sets are considered. It is mainly because of the weight restriction we imposed in the model that the three risk indicators should be given the highest share in the final index score.
• The main differences in country ranking using 4 or 7 indicators happen in NL and LU. The ranking of NL declined with 7 indicators mainly because it has a relatively poor performance on its share of pedal cycle fatalities. In contrast, the ranking of LU is improved based on all the 7 indicators versus 4 only due to the fact that the road safety performance with respect to the three scope indicators is quite high in this country compared to the others.
6 For most countries except for RO, the share of scope indicators lies in the 1%-6% range (see Appendix I).
D4.9 Developing a Road Safety Index
128
Summing up the comparison, we can state that the final country ranking depends on the aspects selected for consideration. The main point in selecting the basic indicators and, consequently, resulting country ranking concerns the inclusion or exclusion of the dynamic indicator – the annual average percentage reduction in fatalities, over a period. As it is a recent tendency in the international comparisons is to consider a dynamic change as well, in addition to the traditional risk indicators, we prefer to keep this indicator in the set. Accounting for the stability of the results received based on the whole set of 7 indicators versus 4 only (risk indicators plus a dynamic one), it seems that further CI development with respect to road safety outcome can continue to be based on the whole set of 7 indicators.
8.5. Concluding remarks This chapter presented the results of an analysis which aimed at constructing a composite index based on road safety outcome indicators. By applying the multiple layer data envelopment analysis based composite index model (MLDEA-CI), the seven basic indicator values were combined into a composite index score for 30 countries. Moreover, by obtaining the cross index score for each country, the countries were ranked and classified into five levels with respect to their road safety outcome. The final results of the analysis are presented in Table 8.3.
In total, nine countries were found to belong to the high level of road safety outcome, which are IS, LU, SE, CH, NL, FR, DE, UK, and ES, in which IS and LU are the two best-performing countries. Eight countries - IE, PT, IT, FI, NO, BE, MT, and AT - were recognized as having a moderately high level of road safety outcome. In addition, six countries belonged to a medium level, another six countries to a moderately low level and one country (RO) to a low level.
Further re-estimation of the CI scores for two separate country groups that were recognized earlier based on the background country characteristics (i.e., "Structure and Culture" layer) provided country rankings similar to those obtained in the initial analysis of the whole country set. With a few exceptions, the order of countries ranked in accordance with the CI in the two separate groups mostly reproduced the order of countries received for the whole country set. However, once a more comparable country group was considered separately, a more realistic benchmark country could be identified for the remaining countries in the group, which in this study was PT for the country group with lower values of the background characteristics.
Considering the weight allocation provided by the MLDEA-CI model, for each country, the characteristics of relatively good and poor performance compared to other countries, can be identified (see Appendix I), thus providing a basis for planning road safety improvement efforts.
The sensitivity of the CI estimation and country ranking results was considered where three or four basic indicators served as a basis for the analysis versus the whole set of seven indicators originally applied. The three indicators were the traditional risk indicators only, whereas four indicators included the risk indicators plus a dynamic one (i.e., the annual average percentage reduction in fatalities). It was found that a considerable difference in the countries' ranking appeared mostly depending on the inclusion or exclusion of the dynamic indicator, whereas the addition of scope indicators (i.e., the shares of vulnerable road user fatalities) did not change the countries' ranking significantly.
Taking into account the impact of the dynamic outcome indicator and the similarity of the results observed when including the additional scope indicators, it is
D4.9 Developing a Road Safety Index
129
recommended to further apply a composite index with respect to road safety outcome based on the whole set of seven indicators.
8.6. References Shen, Y. (2012). International benchmarking of road safety performance and development using indicators and indexes: Data envelopment analysis-based approaches. PhD Thesis, Hasselt University.
Shen, Y., Hermans, E., Brijs, T., and Wets, G. (2012). Data envelopment analysis for composite indicators: A multiple layer model. Social Indicators Research. DOI: 10.1007/s11205-012-0171-0.
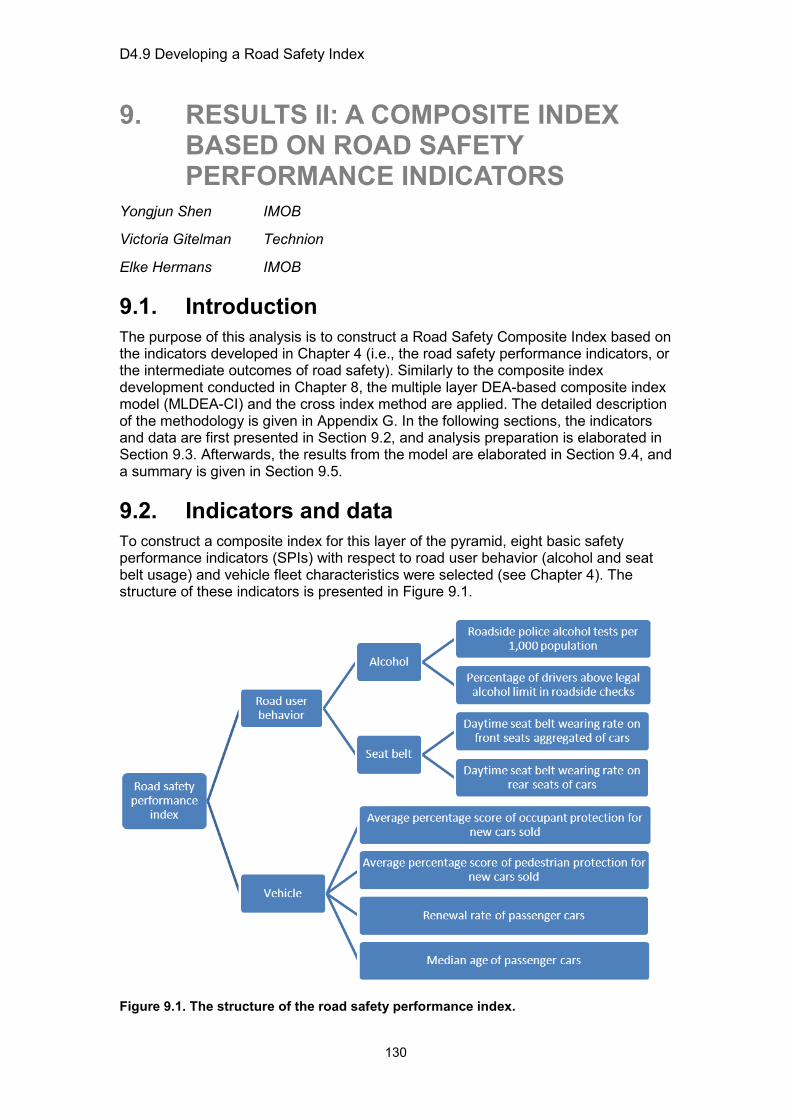
D4.9 Developing a Road Safety Index
130
9. RESULTS II: A COMPOSITE INDEX BASED ON ROAD SAFETY PERFORMANCE INDICATORS
Yongjun Shen IMOB
Victoria Gitelman Technion
Elke Hermans IMOB
9.1. Introduction The purpose of this analysis is to construct a Road Safety Composite Index based on the indicators developed in Chapter 4 (i.e., the road safety performance indicators, or the intermediate outcomes of road safety). Similarly to the composite index development conducted in Chapter 8, the multiple layer DEA-based composite index model (MLDEA-CI) and the cross index method are applied. The detailed description of the methodology is given in Appendix G. In the following sections, the indicators and data are first presented in Section 9.2, and analysis preparation is elaborated in Section 9.3. Afterwards, the results from the model are elaborated in Section 9.4, and a summary is given in Section 9.5.
9.2. Indicators and data To construct a composite index for this layer of the pyramid, eight basic safety performance indicators (SPIs) with respect to road user behavior (alcohol and seat belt usage) and vehicle fleet characteristics were selected (see Chapter 4). The structure of these indicators is presented in Figure 9.1.
Figure 9.1. The structure of the road safety performance index.

D4.9 Developing a Road Safety Index
131
The SPI data are given in Table 9.1, for 29 countries (IS was excluded from the SPI analysis as no SPI value was available for this country).
Table 9.1. Data on the eight road safety performance indicators.
Country
Road user behavior Vehicle
Alcohol Seat belt
Road-side
police alcohol
tests per 1,000
popula-tion,
2008
% of drivers above
legal alcohol limit in road-side
checks, 2008
Daytime seat belt wearing rates on
front seats
aggre-gated of
cars, 2009
Daytime wearing rates of
seat belts on
rear seats of
cars, 2009
Average % occu-
pant protect-
tion score for new cars
sold in 2008
Average % score
of pedes-
trian protect-tion for
new cars sold in
2008
Renewal rate of
passen-ger cars in 2007
Median age of
passen-ger cars,
2008
Alc_ tests
P_alc Belt_ front
Belt_ rear
Prot_ occ
Prot_ ped Renewal Age
AT 87.0 5.8 87 65 0.89 0.36 0.07 6.7 BE 103.0 5.0 80 61 0.90 0.34 0.11 6.5 BG 33.4 3.0 85 49 0.84 0.35 0.02 11.3 CY 182.3 5.9 80 21 0.94 0.43 0.10 8.7 CZ 114.0 1.8 89 51 0.86 0.39 0.04 11.5 DK 36.0 8.3 92 71 0.87 0.38 0.08 6.7 EE 95.0 1.1 87 63 0.90 0.38 0.06 11.5 FI 385.0 1.3 92 87 0.92 0.39 0.05 9.0 FR 189.8 3.3 98 82 0.90 0.36 0.07 7.5 DE 141.3 9.7 97 88 0.90 0.34 0.08 7.5 EL 135.0 3.1 75 23 0.86 0.38 0.07 9.6 HU 129.5 3.1 79 49 0.87 0.40 0.06 8.5 IE 128.0 3.2 90 78 0.93 0.39 0.10 5.9 IT 23.5 7.7 65 30 0.83 0.35 0.07 4.7 LV 93.1 4.7 83 21 0.90 0.37 0.04 13.3 LT 40.0 1.7 82 47 0.89 0.37 0.02 14.0 LU 0.4 8.3 81 72 0.91 0.33 0.09 4.1 MT 80.4 6.2 96 28 0.78 0.40 0.04 11.7 NO 337.8 1.6 92 85 0.94 0.39 0.06 9.1 PL 46.6 9.5 80 50 0.88 0.38 0.02 12.6 PT 63.1 5.9 86 49 0.91 0.37 0.05 10.1 RO 0.0 10.4 77 34 0.75 0.29 0.03 7.7 SK 172.4 4.9 80 33 0.85 0.40 0.04 11.1 SI 200.4 5.8 88 57 0.89 0.36 0.07 7.9 ES 112.4 1.8 85 81 0.91 0.38 0.07 6.7 SE 287.0 0.8 96 80 0.92 0.37 0.07 7.3 CH 139.8 2.1 87 68 0.89 0.36 0.07 7.5 NL 188.9 6.1 95 81 0.88 0.37 0.07 7.8 UK 10.0 16.3 95 89 0.89 0.35 0.08 5.3

D4.9 Developing a Road Safety Index
132
A first check of the data per aspect using correlation analysis indicated that the two alcohol indicators are highly negatively correlated with the Pearson’s correlation coefficient of -0.539 (statistically significant), implying that countries with a higher frequency of roadside alcohol tests usually have a lower percentage of drivers driving above the legal alcohol limit. Moreover, the two seat belt indicators are also highly correlated with the Pearson’s correlation coefficient of 0.678 (statistically significant). With regard to the vehicle aspect, the first two indicators (i.e., occupant protection score and pedestrian protection score) are positively correlated, but not statistically significant, whereas the last two indicators (i.e., renewal rate and median age) are highly negatively correlated with the Pearson’s correlation coefficient of -0.769 (statistically significant), which shows the fact that countries with a higher passenger car renewal rate normally have a lower median age of passenger cars.
9.3. Analysis preparation: data normalization and assigning weight restrictions
As indicated also in Chapter 8, to apply the MLDEA-CI model for CI development, data normalization and weight restrictions are two aspects that need to be specified beforehand (see also Shen et al., 2012).
9.3.1. Data normalization Prior to the application of the MLDEA-CI model, the raw data should be normalized so as to eliminate the scale differences of the indicators and the effects of the measurement unit. In addition, all the indicators should be expressed in the same direction with respect to their expected road safety impact, i.e., a higher indicator value should correspond to a lower crash/injury risk. Table 9.2 shows the normalized SPI values, using the same method as in Chapter 8.
9.3.2. Weight restrictions Apart from data normalization, weight restrictions should also be specified before applying the MLDEA-CI model. In this study, the indicators belonging to the same category (i.e., the two alcohol indicators, the two seat belt related indicators, the four vehicle indicators, and the two road user behavior aspects) are considered to be of similar importance. Similarly to the outcome indicators' analysis as in Chapter 8, we obligate the weights of these indicators to vary within a range from 0.8 to 1.2 of their average weights.
With regard to the two risk factors, i.e., the road user behavior (B) and the vehicle fleet characteristics (V), a virtual weight (or share) restriction is assigned, i.e.,
10%B VShare Share> > , indicating that the road user behavior plays a more important role than the vehicle fleet characteristics in producing the combined index score.
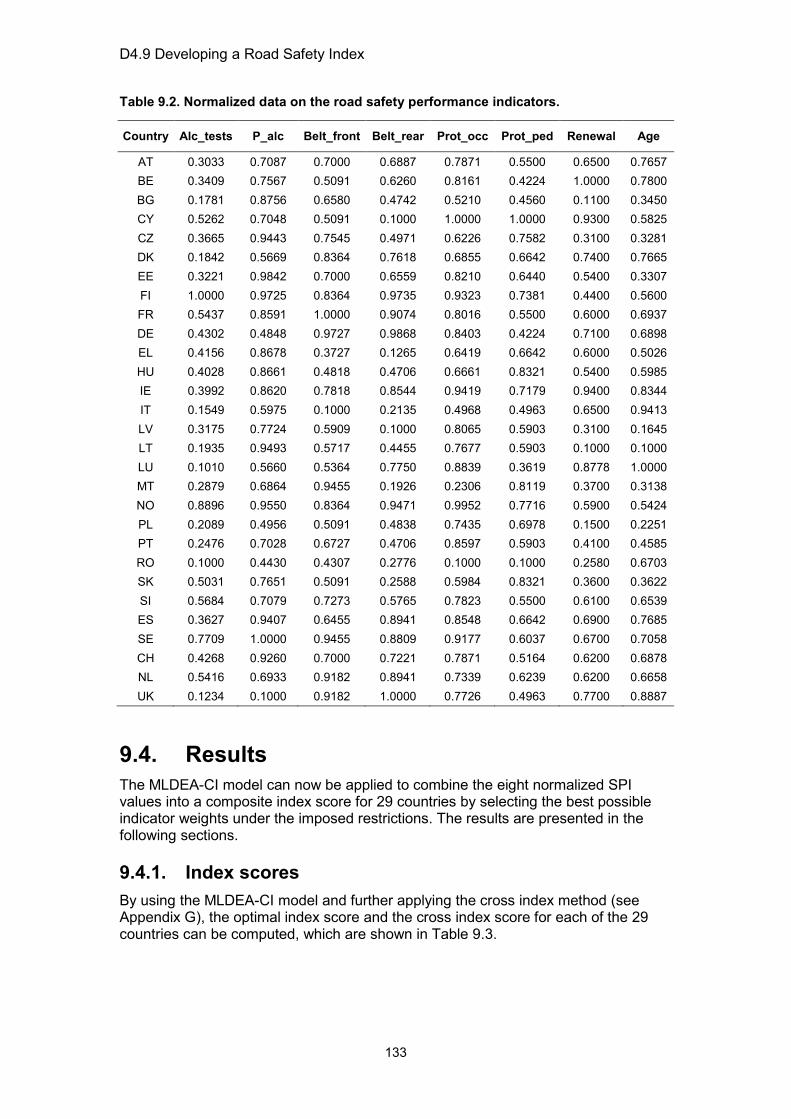
D4.9 Developing a Road Safety Index
133
Table 9.2. Normalized data on the road safety performance indicators.
Country Alc_tests P_alc Belt_front Belt_rear Prot_occ Prot_ped Renewal Age
AT 0.3033 0.7087 0.7000 0.6887 0.7871 0.5500 0.6500 0.7657 BE 0.3409 0.7567 0.5091 0.6260 0.8161 0.4224 1.0000 0.7800 BG 0.1781 0.8756 0.6580 0.4742 0.5210 0.4560 0.1100 0.3450 CY 0.5262 0.7048 0.5091 0.1000 1.0000 1.0000 0.9300 0.5825 CZ 0.3665 0.9443 0.7545 0.4971 0.6226 0.7582 0.3100 0.3281 DK 0.1842 0.5669 0.8364 0.7618 0.6855 0.6642 0.7400 0.7665 EE 0.3221 0.9842 0.7000 0.6559 0.8210 0.6440 0.5400 0.3307 FI 1.0000 0.9725 0.8364 0.9735 0.9323 0.7381 0.4400 0.5600 FR 0.5437 0.8591 1.0000 0.9074 0.8016 0.5500 0.6000 0.6937 DE 0.4302 0.4848 0.9727 0.9868 0.8403 0.4224 0.7100 0.6898 EL 0.4156 0.8678 0.3727 0.1265 0.6419 0.6642 0.6000 0.5026 HU 0.4028 0.8661 0.4818 0.4706 0.6661 0.8321 0.5400 0.5985 IE 0.3992 0.8620 0.7818 0.8544 0.9419 0.7179 0.9400 0.8344 IT 0.1549 0.5975 0.1000 0.2135 0.4968 0.4963 0.6500 0.9413 LV 0.3175 0.7724 0.5909 0.1000 0.8065 0.5903 0.3100 0.1645 LT 0.1935 0.9493 0.5717 0.4455 0.7677 0.5903 0.1000 0.1000 LU 0.1010 0.5660 0.5364 0.7750 0.8839 0.3619 0.8778 1.0000 MT 0.2879 0.6864 0.9455 0.1926 0.2306 0.8119 0.3700 0.3138 NO 0.8896 0.9550 0.8364 0.9471 0.9952 0.7716 0.5900 0.5424 PL 0.2089 0.4956 0.5091 0.4838 0.7435 0.6978 0.1500 0.2251 PT 0.2476 0.7028 0.6727 0.4706 0.8597 0.5903 0.4100 0.4585 RO 0.1000 0.4430 0.4307 0.2776 0.1000 0.1000 0.2580 0.6703 SK 0.5031 0.7651 0.5091 0.2588 0.5984 0.8321 0.3600 0.3622 SI 0.5684 0.7079 0.7273 0.5765 0.7823 0.5500 0.6100 0.6539 ES 0.3627 0.9407 0.6455 0.8941 0.8548 0.6642 0.6900 0.7685 SE 0.7709 1.0000 0.9455 0.8809 0.9177 0.6037 0.6700 0.7058 CH 0.4268 0.9260 0.7000 0.7221 0.7871 0.5164 0.6200 0.6878 NL 0.5416 0.6933 0.9182 0.8941 0.7339 0.6239 0.6200 0.6658 UK 0.1234 0.1000 0.9182 1.0000 0.7726 0.4963 0.7700 0.8887
9.4. Results The MLDEA-CI model can now be applied to combine the eight normalized SPI values into a composite index score for 29 countries by selecting the best possible indicator weights under the imposed restrictions. The results are presented in the following sections.
9.4.1. Index scores By using the MLDEA-CI model and further applying the cross index method (see Appendix G), the optimal index score and the cross index score for each of the 29 countries can be computed, which are shown in Table 9.3.
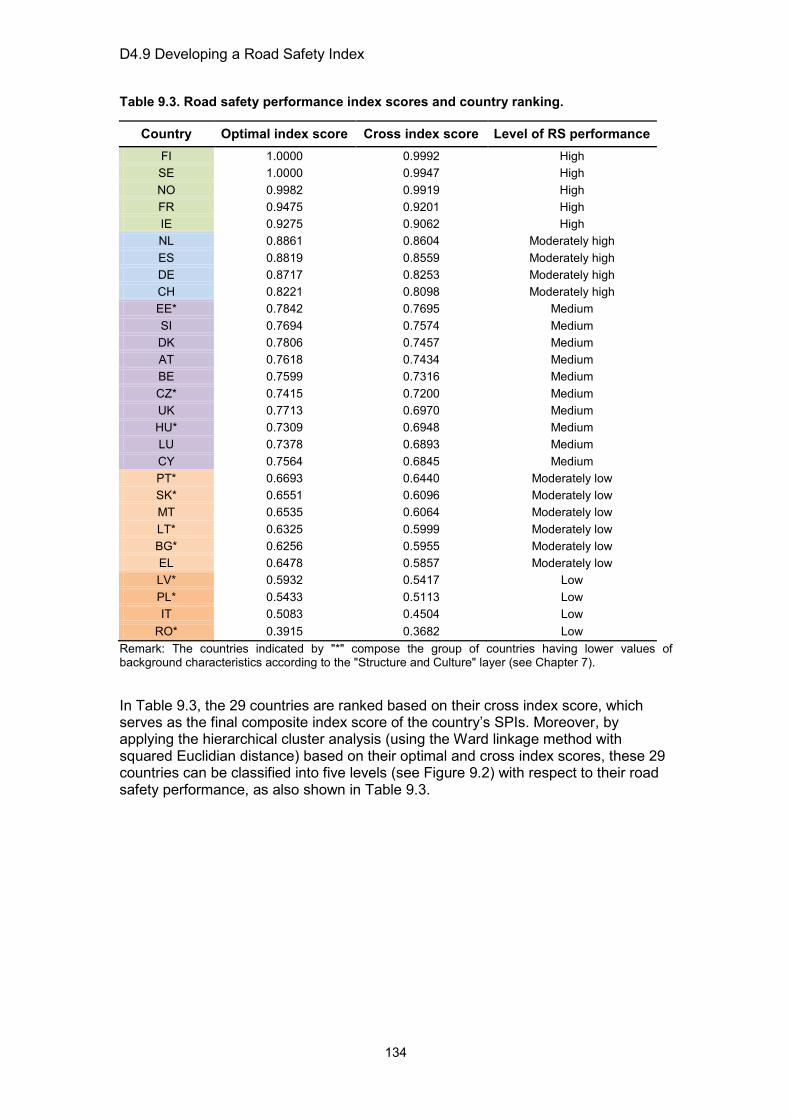
D4.9 Developing a Road Safety Index
134
Table 9.3. Road safety performance index scores and country ranking.
Country Optimal index score Cross index score Level of RS performance FI 1.0000 0.9992 High SE 1.0000 0.9947 High NO 0.9982 0.9919 High FR 0.9475 0.9201 High IE 0.9275 0.9062 High NL 0.8861 0.8604 Moderately high ES 0.8819 0.8559 Moderately high DE 0.8717 0.8253 Moderately high CH 0.8221 0.8098 Moderately high EE* 0.7842 0.7695 Medium SI 0.7694 0.7574 Medium DK 0.7806 0.7457 Medium AT 0.7618 0.7434 Medium BE 0.7599 0.7316 Medium CZ* 0.7415 0.7200 Medium UK 0.7713 0.6970 Medium HU* 0.7309 0.6948 Medium LU 0.7378 0.6893 Medium CY 0.7564 0.6845 Medium PT* 0.6693 0.6440 Moderately low SK* 0.6551 0.6096 Moderately low MT 0.6535 0.6064 Moderately low LT* 0.6325 0.5999 Moderately low BG* 0.6256 0.5955 Moderately low EL 0.6478 0.5857 Moderately low LV* 0.5932 0.5417 Low PL* 0.5433 0.5113 Low IT 0.5083 0.4504 Low
RO* 0.3915 0.3682 Low Remark: The countries indicated by "*" compose the group of countries having lower values of background characteristics according to the "Structure and Culture" layer (see Chapter 7).
In Table 9.3, the 29 countries are ranked based on their cross index score, which serves as the final composite index score of the country’s SPIs. Moreover, by applying the hierarchical cluster analysis (using the Ward linkage method with squared Euclidian distance) based on their optimal and cross index scores, these 29 countries can be classified into five levels (see Figure 9.2) with respect to their road safety performance, as also shown in Table 9.3.
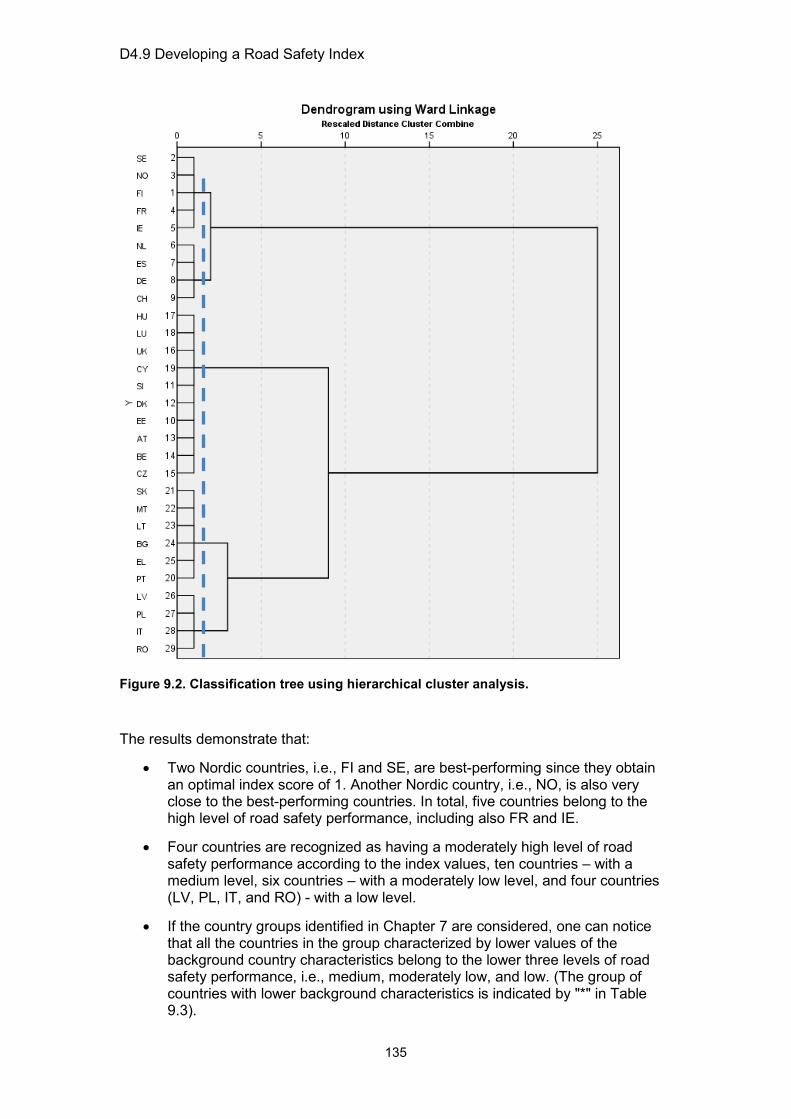
D4.9 Developing a Road Safety Index
135
Figure 9.2. Classification tree using hierarchical cluster analysis.
The results demonstrate that:
• Two Nordic countries, i.e., FI and SE, are best-performing since they obtain an optimal index score of 1. Another Nordic country, i.e., NO, is also very close to the best-performing countries. In total, five countries belong to the high level of road safety performance, including also FR and IE.
• Four countries are recognized as having a moderately high level of road safety performance according to the index values, ten countries – with a medium level, six countries – with a moderately low level, and four countries (LV, PL, IT, and RO) - with a low level.
• If the country groups identified in Chapter 7 are considered, one can notice that all the countries in the group characterized by lower values of the background country characteristics belong to the lower three levels of road safety performance, i.e., medium, moderately low, and low. (The group of countries with lower background characteristics is indicated by "*" in Table 9.3).
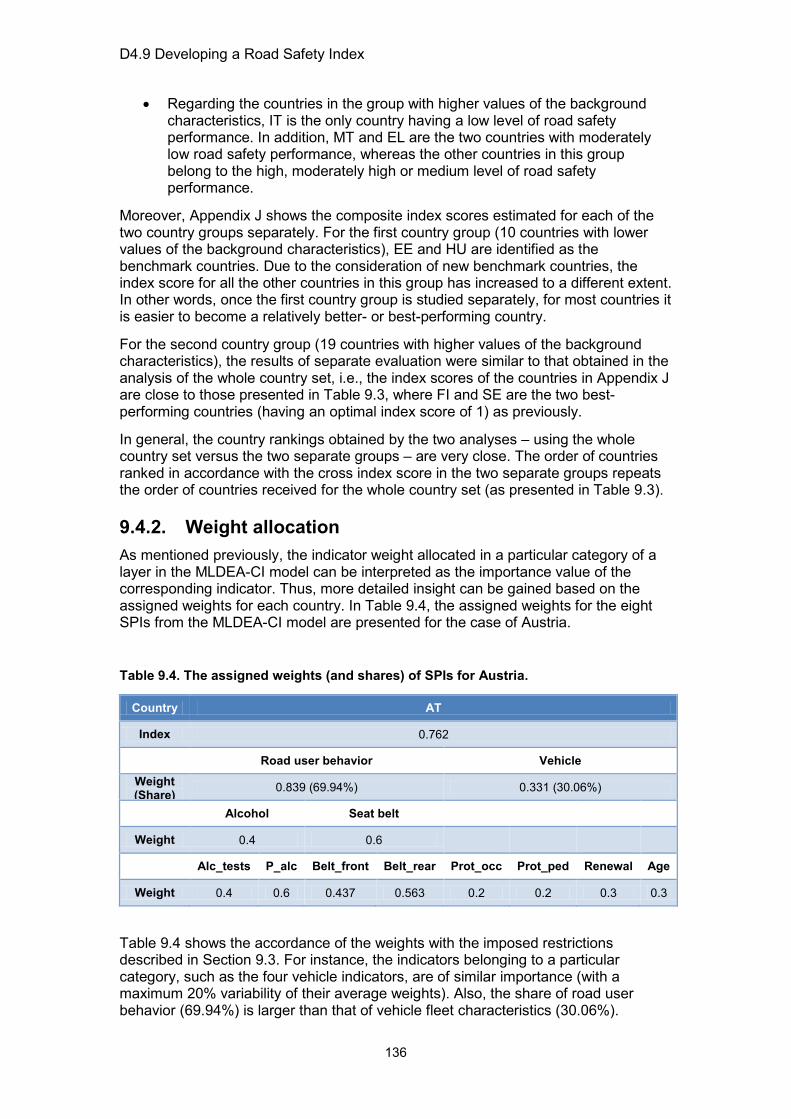
D4.9 Developing a Road Safety Index
136
• Regarding the countries in the group with higher values of the background characteristics, IT is the only country having a low level of road safety performance. In addition, MT and EL are the two countries with moderately low road safety performance, whereas the other countries in this group belong to the high, moderately high or medium level of road safety performance.
Moreover, Appendix J shows the composite index scores estimated for each of the two country groups separately. For the first country group (10 countries with lower values of the background characteristics), EE and HU are identified as the benchmark countries. Due to the consideration of new benchmark countries, the index score for all the other countries in this group has increased to a different extent. In other words, once the first country group is studied separately, for most countries it is easier to become a relatively better- or best-performing country.
For the second country group (19 countries with higher values of the background characteristics), the results of separate evaluation were similar to that obtained in the analysis of the whole country set, i.e., the index scores of the countries in Appendix J are close to those presented in Table 9.3, where FI and SE are the two best-performing countries (having an optimal index score of 1) as previously.
In general, the country rankings obtained by the two analyses – using the whole country set versus the two separate groups – are very close. The order of countries ranked in accordance with the cross index score in the two separate groups repeats the order of countries received for the whole country set (as presented in Table 9.3).
9.4.2. Weight allocation As mentioned previously, the indicator weight allocated in a particular category of a layer in the MLDEA-CI model can be interpreted as the importance value of the corresponding indicator. Thus, more detailed insight can be gained based on the assigned weights for each country. In Table 9.4, the assigned weights for the eight SPIs from the MLDEA-CI model are presented for the case of Austria.
Table 9.4. The assigned weights (and shares) of SPIs for Austria.
Country AT
Index 0.762
Road user behavior Vehicle Weight (Share) 0.839 (69.94%) 0.331 (30.06%)
Alcohol Seat belt Weight 0.4 0.6
Alc_tests P_alc Belt_front Belt_rear Prot_occ Prot_ped Renewal Age
Weight 0.4 0.6 0.437 0.563 0.2 0.2 0.3 0.3
Table 9.4 shows the accordance of the weights with the imposed restrictions described in Section 9.3. For instance, the indicators belonging to a particular category, such as the four vehicle indicators, are of similar importance (with a maximum 20% variability of their average weights). Also, the share of road user behavior (69.94%) is larger than that of vehicle fleet characteristics (30.06%).

D4.9 Developing a Road Safety Index
137
Considering the assigned weights for the SPIs related to road user behavior, we find that Austria is doing relatively well (compared to other countries) in seat belt usage, especially when the rear seat belt wearing rate is concerned. On the other hand, more policy attention should be paid to the risk aspect of alcohol, in which increasing the frequency of roadside police alcohol tests is most needed. Following the same principle, road safety priorities with respect to the vehicle fleet characteristics in Austria can be identified as well, which are to improve both the occupant protection score and the score of pedestrian protection for new passenger cars sold.
The assigned weights (and shares) for all the 29 countries are illustrated in Appendix K. Following similar lines as in the example above, specific road safety priorities for each of the 29 countries can be formulated, and the indicator with the highest priority in each aspect is highlighted in Appendix K.
9.5. Concluding remarks This chapter presented the results of an analysis which aimed at constructing a composite index based on road safety performance indicators (intermediate outcomes) of European countries.
By applying the multiple layer data envelopment analysis based composite index model (MLDEA-CI), eight basic safety performance indicator values were combined into a composite index score for 29 countries (IS was excluded from the analysis due to lacking SPI data). Moreover, by obtaining the cross index score for each country, the countries were ranked and further classified into five levels with respect to their road safety performance. The results of the SPIs' analysis are presented in Table 9.3.
Based on the safety performance index values, five countries were found to belong to the high level of road safety performance, which are FI, SE, NO, FR and IE, in which FI and SE are the two best-performing ones. Four countries - NL, ES, DE, and CH - were recognized as having a moderately high level of road safety performance. In addition, ten countries belonged to a medium level of road safety performance, six countries to a moderately low level and four countries (LV, PL, IT, and RO) to a low level.
Further re-estimating the composite index scores for the two separate country groups that were recognized earlier based on the background country characteristics in Chapter 7, country rankings were identical to those obtained in the initial analysis of the whole country set. The order of countries ranked in accordance with the safety performance index in the two separate groups repeated the order of countries received for the whole country set. However, once a more comparable country group was considered separately, a more realistic set of benchmark countries could be identified, especially for the country group with a lower level of the background characteristics, which in this study was EE and HU.
Considering the weight allocation provided by the MLDEA-CI model, for each country, the issues of relatively good and poor performance, compared to other countries, can be recognized, providing policy makers with a basis for formulating road safety priorities for each country.
Finally, it is important to note that the selection of appropriate safety performance indicators requires periodic revisions. Apart from the SPIs developed in this study, other risk factors that have a strong relationship with road safety or a large contribution to road crashes and casualties, such as speed, road infrastructure, and trauma management, could also be incorporated in the future index research and corresponding indicators developed and data collected.

D4.9 Developing a Road Safety Index
138
9.6. References Shen, Y., Hermans, E., Brijs, T., and Wets, G. (2012). Data envelopment analysis for composite indicators: A multiple layer model. Social Indicators Research. DOI: 10.1007/s11205-012-0171-0.
D4.9 Developing a Road Safety Index
139
10. AN INDEX IN TWO DIMENSIONS
Victoria Gitelman Technion
Yongjun Shen IMOB
Paul Wesemann SWOV
Charlotte Bax SWOV
10.1. Introduction In the previous chapters two Composite Indices, based on Road Safety Outcome Indicators and on Road Safety Performance Indicators, were constructed. It turned out that the construction of an index for Policy performance was not feasible at the moment. This chapter will discuss whether it is feasible and desirable to combine these two indices into one overall Road Safety Composite Index (RSCI). The objective of this RSCI is to enable a comparison between countries with respect to their road safety situation in a broad sense, including both final and intermediate safety outcomes and –if possible- policy performance. We believe that using the term “road safety performance index” of a country (as suggested by Wegman and Oppe, 2010; Jost et al., 2012), would be slightly confusing because of the resemblance with the term “safety performance indicator” (SPI). To avoid possible misunderstandings we prefer here the term RSCI.
We build on the general methodology for constructing Composite Indices, reviewed in the OECD Handbook (Nardo et al., 2008). This handbook uses the term composite indicator as a synonym of our term composite index. General criteria and requirements for the construction of a useful overall RSI are discussed in Section 10.2. In Section 10.3 we evaluate the two available indices on intermediate and final outcomes and their mutual relations. In Section 10.4 we discuss a method to rank the countries, based on the available indices. In Section 10.5 we will conclude on the use of this ranking method by policymakers and on the possible development of an overall RSCI.
10.2. Methodology of a composite index Part of the methodology, perhaps the most important part of it, for constructing a composite index relates to the construction of the composing indicators (which are in this case also composite indices). These issues have been dealt with amply in the preceding chapters. The main focus here is on the added value of combining two (or more) indices, and the associated problems.
The objective of a composite index is to reveal the relative position of countries in a given area (a ranking). A composite index should ideally measure multidimensional concepts which cannot be captured by a single indicator, e.g. competitiveness, sustainability, knowledge-based society. The composite index is formed when individual indicators are compiled into a single index on the basis of an underlying model or theoretical framework (Nardo et al., 2008). Whether this will be feasible depends on technical (data and computational) requirements; to be useful the composite index has to be theoretically meaningful and relevant for the phenomenon being measured.

D4.9 Developing a Road Safety Index
140
The phenomenon being measured is in our case the road safety situation in a broad sense. The road safety target hierarchy (represented in the pyramid of Figure 1.1) forms the theoretical framework. This explains why a composite index including indicators for all layers is relevant for the measurement of the road safety situation. Whether the RSCI is meaningful depends primarily on the quality of the layer-indicators. Valid and reliable data on implemented measures, SPI’s and accidents are useful for an assessment of a country’s road safety situation. Computations to boil down all these data into some key figures are useful to enable comparisons but they do not add information on safety. This information is contained in the layer-indicators; or, being composite indices themselves, in the composing indicators of these layer-CI’s. Thus, having assessed the country ranking, one should always fall back on all these composing indicators to understand its strong or weak performance and to find clues for possible improvements.
One could raise the question whether these layer-indicators are ‘multidimensional concepts which cannot be captured by a single indicator’. After all, causal relations between the layers have always been emphasized in the literature on the road safety target hierarchy and in particular on the selection of safety performance indicators. If we would have managed to find the ideal indicators at each level, the top-level of accidents and injuries would be fully explained by the lower levels. If so, the final outcomes would be the one and only indicator and there would be no need for a composite index. In Section 10.3 we will take a closer look at the available indicators for intermediate and final road safety outcomes and their mutual relation.
10.3. Relations between two outcome indices As introduced in Chapters 8 and 9, a composite index was constructed separately for two layers of the road safety pyramid: the road safety final outcome layer and the SPI (intermediate outcome) layer. In this section we will investigate if their correlation is so strong that they measure practically the same concept (so that a composite index would be superfluous).
It should be noticed that especially the SPI composite index deserves a number of major improvements: speed and road infrastructure are risk factors that are currently missing in the index, a better alcohol indicator should ideally be included, etc. Still, we feel it might be useful to test the feasibility of a Road Safety Composite Index; however, a possible result should not be interpreted as a final product but more as a specimen.
The composite index scores are presented in Table 10.1. Each figure indicates the ranking of a country on a continuous scale between zero and one, with a higher value indicating a better performance. These figures have been calculated with the Data Envelopment Analysis (DEA) method (see Chapter 9-10) for each layer separately, processing input data on different indicators for each layer. This method determines the relative performance of a country compared with all other countries in the dataset.
The scores on both indices have been divided in 5 ‘country performance’ classes, based on the hierarchical cluster analysis. The results are shown in the last two columns of Table 10.1.
As the index values are scores on metrical scales (i.e. the distance between 0.2 and 0.3 equals the distance between 0.5 and 0.6), some statistical tests of correlation are applicable.
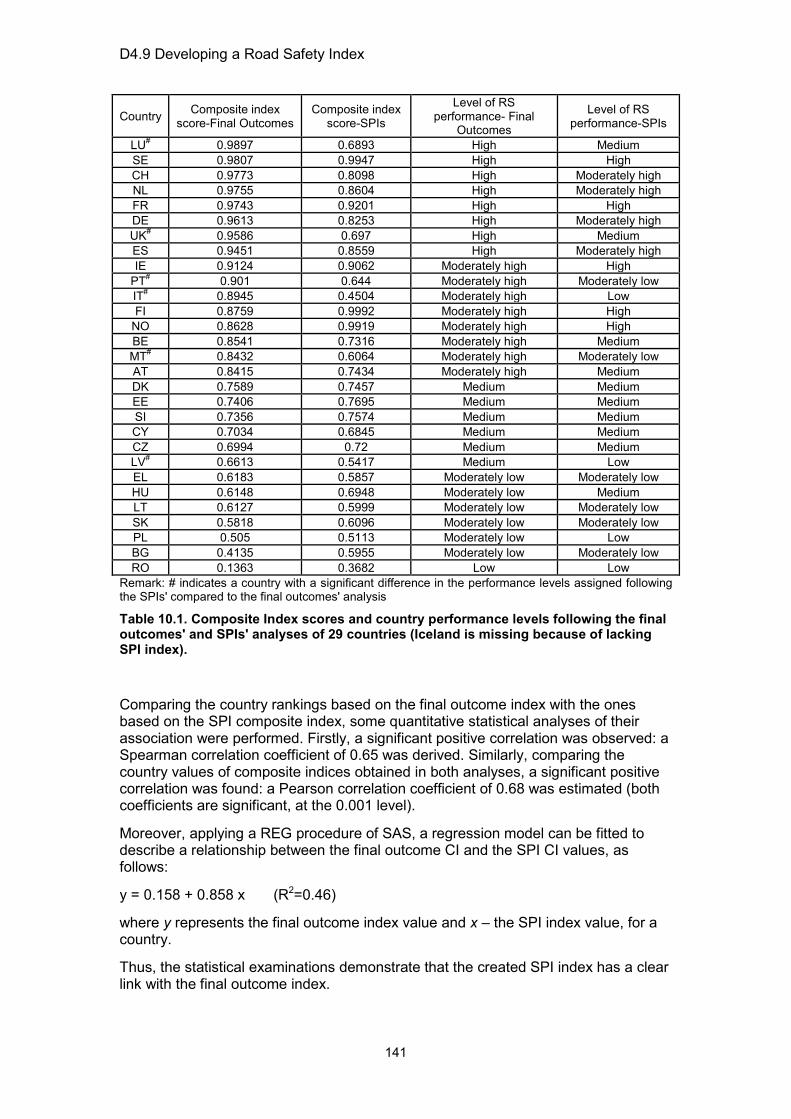
D4.9 Developing a Road Safety Index
141
Country Composite index score-Final Outcomes
Composite index score-SPIs
Level of RS performance- Final
Outcomes
Level of RS performance-SPIs
LU# 0.9897 0.6893 High Medium SE 0.9807 0.9947 High High CH 0.9773 0.8098 High Moderately high NL 0.9755 0.8604 High Moderately high FR 0.9743 0.9201 High High DE 0.9613 0.8253 High Moderately high UK# 0.9586 0.697 High Medium ES 0.9451 0.8559 High Moderately high IE 0.9124 0.9062 Moderately high High
PT# 0.901 0.644 Moderately high Moderately low IT# 0.8945 0.4504 Moderately high Low FI 0.8759 0.9992 Moderately high High
NO 0.8628 0.9919 Moderately high High BE 0.8541 0.7316 Moderately high Medium MT# 0.8432 0.6064 Moderately high Moderately low AT 0.8415 0.7434 Moderately high Medium DK 0.7589 0.7457 Medium Medium EE 0.7406 0.7695 Medium Medium SI 0.7356 0.7574 Medium Medium CY 0.7034 0.6845 Medium Medium CZ 0.6994 0.72 Medium Medium LV# 0.6613 0.5417 Medium Low EL 0.6183 0.5857 Moderately low Moderately low HU 0.6148 0.6948 Moderately low Medium LT 0.6127 0.5999 Moderately low Moderately low SK 0.5818 0.6096 Moderately low Moderately low PL 0.505 0.5113 Moderately low Low BG 0.4135 0.5955 Moderately low Moderately low RO 0.1363 0.3682 Low Low
Remark: # indicates a country with a significant difference in the performance levels assigned following the SPIs' compared to the final outcomes' analysis
Table 10.1. Composite Index scores and country performance levels following the final outcomes' and SPIs' analyses of 29 countries (Iceland is missing because of lacking SPI index).
Comparing the country rankings based on the final outcome index with the ones based on the SPI composite index, some quantitative statistical analyses of their association were performed. Firstly, a significant positive correlation was observed: a Spearman correlation coefficient of 0.65 was derived. Similarly, comparing the country values of composite indices obtained in both analyses, a significant positive correlation was found: a Pearson correlation coefficient of 0.68 was estimated (both coefficients are significant, at the 0.001 level).
Moreover, applying a REG procedure of SAS, a regression model can be fitted to describe a relationship between the final outcome CI and the SPI CI values, as follows:
y = 0.158 + 0.858 x (R2=0.46)
where y represents the final outcome index value and x – the SPI index value, for a country.
Thus, the statistical examinations demonstrate that the created SPI index has a clear link with the final outcome index.
D4.9 Developing a Road Safety Index
142
Notwithstanding this statistical correlation, the ranking according to the final outcome index score cannot be simply replaced by the ranking according to the SPI index score, or vice versa, because they differ considerably frequently. This can qualitatively be illustrated by comparing the country performance levels in columns 4 and 5 of Table 10.1.
• Countries like SE and FR have a high performance both according to the final outcomes' and the SPIs' composite index values. However, for countries such as CH, NL, DE, ES a high performance in accordance with the final outcomes is accompanied by a moderately high performance with regard to SPIs, where for countries like LU and UK with a high performance on the road safety final outcomes, the SPI performance level is only medium. It can be noted here, for example, that the medium level of the SPI composite index for LU is associated with a low frequency of the roadside police alcohol tests, where UK has a moderately poor performance on both alcohol indicators (see Chapter 9, Table 9.1.).
• On the other hand, countries like FI and NO have a high level of SPIs, where their performance with respect to the final outcomes is moderately high. In addition, there are countries such as DK, EE, SI, CY, CZ, which are characterized by a medium level of both final outcomes' and SPs' composite index.
So most countries are classified into the same or a neighboring category of final outcome and SPI performance with six exceptions (marked # in Table 10.1). This implies that, in the gross the two indices show a consistent ranking. If our objective, however, is to enable a more precise country ranking and to compare a country with the ‘best of class’ (e.g. the three best performing countries according to each index), the result might diverge between the two indices.
Based on the preceding comparisons between the two rankings we would conclude that the available SPI composite index does not sufficiently explain the final outcomes index. That is not so much surprising. Firstly, from a theoretical viewpoint such a result is to be expected (e.g. Tingvall et al., 2010). A perfect SPI will explain certain types of accidents to some extent, but not fully because always other factors do contribute (Hakkert et al., 2007), whereas even a complete set of SPI’s will relate to many but not all accident factors. Secondly, the available SPI index has a number of shortcomings as is amply illustrated in ch 4 (with respect, e.g., to speed, road infrastructure and alcohol). Thus, further development of the SPI index is required, where higher similarity between the results of the two rankings would be expected with an improved SPI index but also remaining differences.
So, falling back on the definition of a composite index in Section 10.2, we are dealing with “concepts which cannot be captured by a single indicator”. Constructing a composite index would thus make sense. However, the correlations that have been found between the two layer-indices, need to be considered in order to prevent double counting (Nardo et al., 2008). A combination of the two indices would require a sound weighting procedure.
10.4. Ranking on two dimensions As explained in the previous section, the construction of a composite index would pose some serious theoretical and practical problems, which were not solved yet. Therefore, we have explored the possibility to rank countries based on their two index scores with a more simple method than constructing a composite index. First, we present the data for all countries and then for the two country groupings developed in Chapter 7.

D4.9 Developing a Road Safety Index
143
Figure 10.1 plots the country positions of all countries in accordance with their SPIs' and final outcomes' composite index values. Both index values are cross-index scores received by the DEA analysis, which lie between 0 and 1.
Figure 10.1. Countries plotted in accordance with their SPIs' and outcomes' composite index values.
The figure demonstrates what has been concluded in Section 10.3: a number of countries with similar Index scores for final outcomes have different index scores for SPI’s (e.g. SE and LU), and vice versa (e.g. LU and HU).
The dotted green lines indicate the boundaries of "moderately high" safety performance levels, according to the results of both analyses, thus, subdividing the area into four quadrants. The countries in the 2nd green quadrant (top right) are best performing on both indices, the countries in the other quadrants are less performing, on both indices (4th quadrant, bottom left) or only on the SPI index (1st quadrant, top left).The 3rd quadrant (bottom right) is empty.
This figure enables any country outside the 2nd quadrant to compare itself with the best (moderately high) performing countries. A better final outcomes and/or SPI index value would allow them to move to the best quadrant. Further comparisons of the indicators composing the layer-index make clear on which SPI(s) and/or on which final outcome(s) one should improve.
In general, it is possible to use a two-dimensional index for country comparisons, where countries are ranked simultaneously on the basis of the final outcome index and the SPI composite index.
However, this method does not offer the possibility to rank countries that are better on the one and worse on the other index. For example, it does not show the final
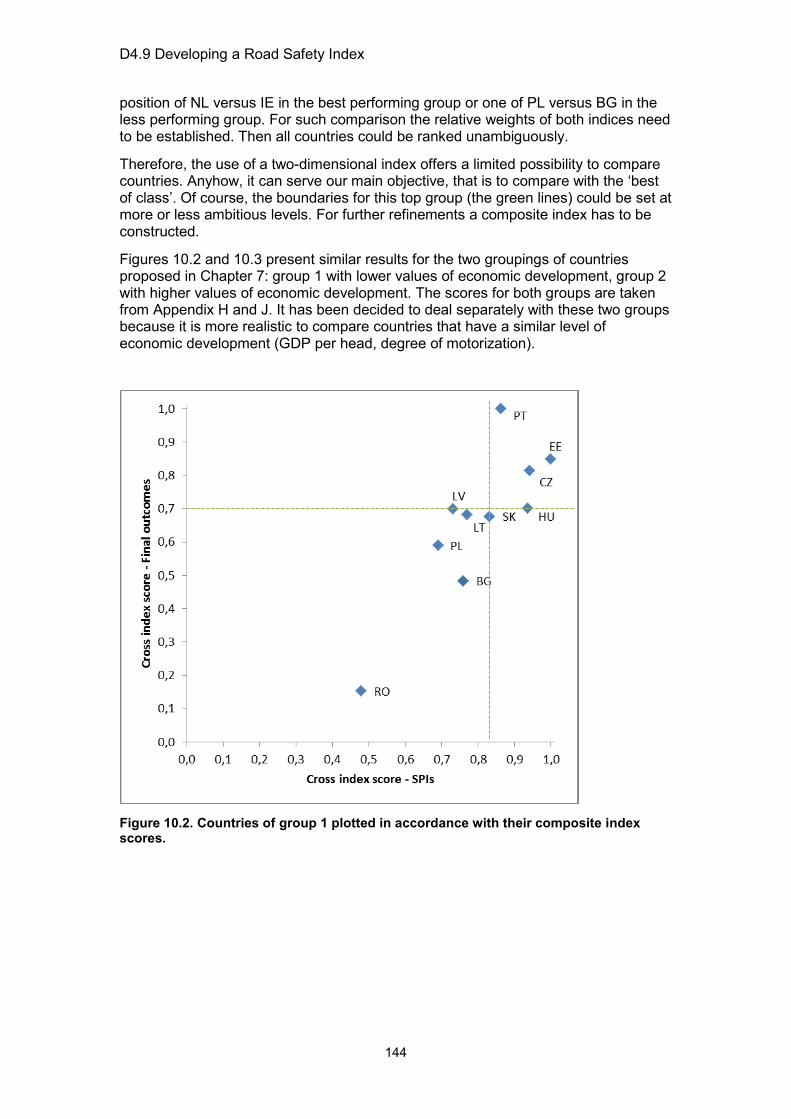
D4.9 Developing a Road Safety Index
144
position of NL versus IE in the best performing group or one of PL versus BG in the less performing group. For such comparison the relative weights of both indices need to be established. Then all countries could be ranked unambiguously.
Therefore, the use of a two-dimensional index offers a limited possibility to compare countries. Anyhow, it can serve our main objective, that is to compare with the ‘best of class’. Of course, the boundaries for this top group (the green lines) could be set at more or less ambitious levels. For further refinements a composite index has to be constructed.
Figures 10.2 and 10.3 present similar results for the two groupings of countries proposed in Chapter 7: group 1 with lower values of economic development, group 2 with higher values of economic development. The scores for both groups are taken from Appendix H and J. It has been decided to deal separately with these two groups because it is more realistic to compare countries that have a similar level of economic development (GDP per head, degree of motorization).
Figure 10.2. Countries of group 1 plotted in accordance with their composite index scores.
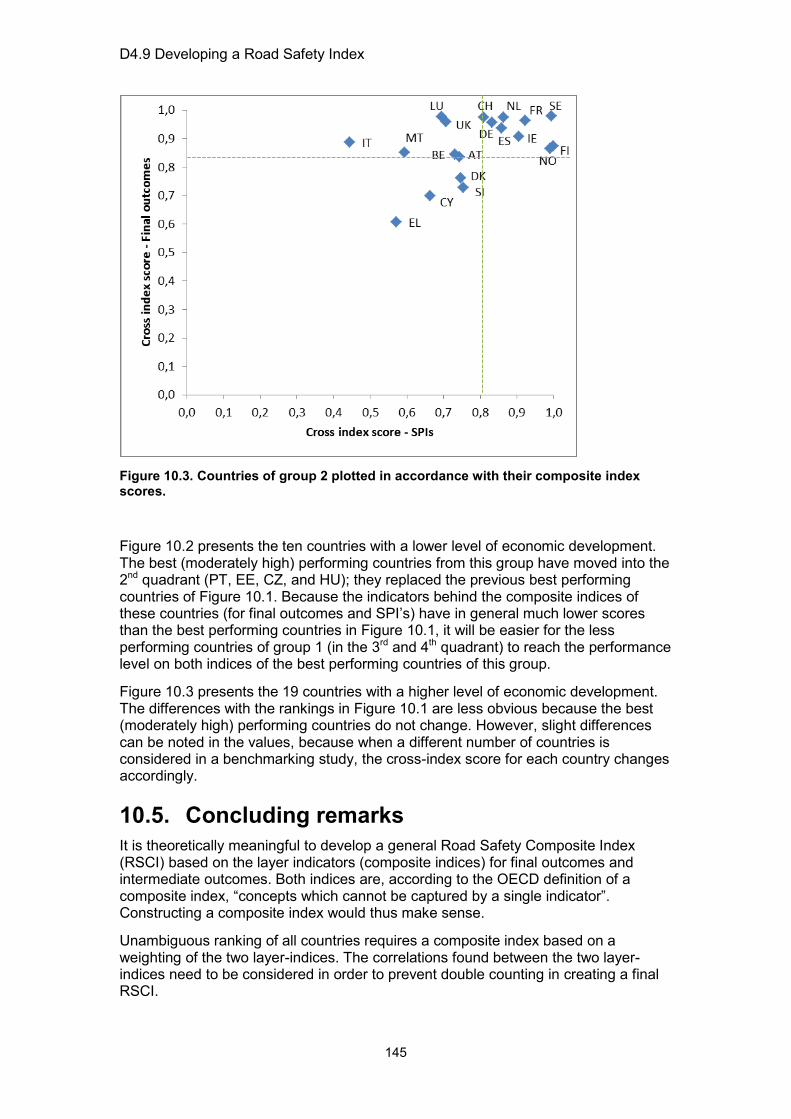
D4.9 Developing a Road Safety Index
145
Figure 10.3. Countries of group 2 plotted in accordance with their composite index scores.
Figure 10.2 presents the ten countries with a lower level of economic development. The best (moderately high) performing countries from this group have moved into the 2nd quadrant (PT, EE, CZ, and HU); they replaced the previous best performing countries of Figure 10.1. Because the indicators behind the composite indices of these countries (for final outcomes and SPI’s) have in general much lower scores than the best performing countries in Figure 10.1, it will be easier for the less performing countries of group 1 (in the 3rd and 4th quadrant) to reach the performance level on both indices of the best performing countries of this group.
Figure 10.3 presents the 19 countries with a higher level of economic development. The differences with the rankings in Figure 10.1 are less obvious because the best (moderately high) performing countries do not change. However, slight differences can be noted in the values, because when a different number of countries is considered in a benchmarking study, the cross-index score for each country changes accordingly.
10.5. Concluding remarks It is theoretically meaningful to develop a general Road Safety Composite Index (RSCI) based on the layer indicators (composite indices) for final outcomes and intermediate outcomes. Both indices are, according to the OECD definition of a composite index, “concepts which cannot be captured by a single indicator”. Constructing a composite index would thus make sense.
Unambiguous ranking of all countries requires a composite index based on a weighting of the two layer-indices. The correlations found between the two layer-indices need to be considered in order to prevent double counting in creating a final RSCI.
D4.9 Developing a Road Safety Index
146
In this chapter we presented a more simple method to rank countries based on their two index scores. Preliminary results (for all countries and for the two groupings of countries) demonstrate that this method offers some possibility to compare countries. It can serve our main objective to compare a country with the ‘best of class’. This comparison makes clear which layer-index has to be improved in order to reach the performance level of the best performing countries. Further comparisons of the indicators composing the layer-indices reveal on which SPI(s) and/or on which final outcome(s) one should focus.
However, it is advised to use the presented rankings of countries with caution since the SPI composite index is a preliminary one (based on currently available indicators) and still needs to be improved.
10.6. References Jost, G., Allsop, R., and Steriu, M. (2012). A challenging start towards the EU 2020 road safety target; 6th road safety performance index PIN report + Methodological note. European Transport Safety Council ETSC, Brussels.
Nardo, M., Saisana, M., Saltelli, A., Tarantola, S., Hoffmann, A., and Giovanni, E. (2008). Handbook on constructing composite indicators: Methodology and user guide. OECD Publishing, Paris.
Tingvall, C., Stigson, H., Eriksson, L., Johansson, R., Krafft, M., and Lie, A. (2010). The properties of safety performance indicators in target setting, projections and safety design of the road transport system. Accident Analysis and Prevention, 42, pp. 372-376.
Wegman, F., and Oppe, S. (2010). Benchmarking road safety performances of countries. Safety Science, 48, pp. 1203-1211.

D4.9 Developing a Road Safety Index
PART III: FINAL WORDS


D4.9 Developing a Road Safety Index
149
11. DISCUSSION AND CONCLUSIONS
Paul Wesemann SWOV
Charlotte Bax SWOV
11.1. Introduction This study aimed at providing an instrument that facilitates easy comparisons of the overall road safety situation between countries. Ideally, sets of indicators, describing the road safety outcomes and road safety policy performance are combined in one figure, a composite index. In this study, we refer to this as the overall Road Safety Composite Index (RSCI) of a country. The RSCI integrates performances on three levels of the target hierarchy for road safety (Figure 11.1): 1) final outcomes (injuries and crashes) 2) intermediate outcomes (safety performance indicators such as drink driving, speeding, car safety) and 3) policy output (safety measures and programmes). In doing so, also the structural and cultural differences between countries should be taken into account as they form a different starting point for clustering the countries.
Figure 11.1. A target hierarchy for road safety (Koornstra et al., 2002; LTSA, 2000).
In order to develop such instrument, the study focused on the following tasks:
− Select valid indicators for each of the three layers of the pyramid − Collect reliable data on these indicators − Develop a method to take into account structural and cultural differences
between countries when comparing them on the preceding indices − Develop a method to combine the indicators of each layer in one composite
index − Calculate the composite index for each layer from the available data − Investigate the feasibility and desirability of combining the composite layer-
indices in one overall Road Safety Composite Index − Visualize the results for a set of European countries

D4.9 Developing a Road Safety Index
150
This chapter will summarize in Section 11.2 the results that have been achieved for each layer of the pyramid. Outcomes of practical use for policymakers will be emphasized, more than issues of technical or theoretical importance. However, matters that could not or only partially be achieved will be mentioned as well.
Section 11.3 deals with recommendations of two kinds. On the one hand, we will put forward suggestions to enhance the practical use of the results. On the other hand, we will discuss the goals that could not be realized and will propose further research.
11.2. Main findings and conclusions
11.2.1. Composite index of final outcomes Indicators
The indicators and data to describe the final outcomes layer have been selected by a special working group within DaCoTA. Choices were based on reasons of validity (to reflect various aspects of the damage inflicted by road traffic accidents) and of data availability. Chapter 3 reports on these considerations in detail. Appendix B presents the final dataset on 7 indicators that was used to calculate the composite index of final outcomes for 30 countries. These basic data are shown for an arbitrary sample of countries in Table 11.1.
Country Fatalities
per million inhabitants
2008
Fatalities per
million vehicle
fleet 2008
Fatalities per 10 billion
pkm 2008
Annual average
percentage reduction in
fatalities 2001-2008
Pedestrian as % of
total fatalities
2008
Pedal cycle as
% of total fatalities
2008
Motorcycle and moped
as % of total fatalities
2008
Belgium BE 88 151 84 0.06 0.10 0.09 0.15
Denmark DK 74 142 75 0.00 0.14 0.13 0.17
Spain ES 68 95 89 0.08 0.16 0.02 0.21
Table 11.1. Seven indicators of final outcomes for 3 countries (2008).
This table illustrates the problem of ranking these countries on all indicators simultaneously. One country performs best on the one indicator (e.g. Spain on fatalities per million inhabitants), another country on the other (e.g. Denmark on fatalities per 10 billion pkm) and a third country on still another indicator (e.g. Belgium on pedestrians as a percentage of total fatalities).
A composite index
Complex computational techniques exist to calculate an overall score per country which can subsequently be used for ranking countries. Different methods are employed to weight the indicators. In this study, the technique of Data Envelopment Analysis (DEA) has been selected to construct a composite index. Generally speaking, the most attractive feature of DEA, relative to other possible methods in developing CIs, is that each country obtains its own best possible indicator weights, and DEA assesses the relative performance of a particular country by taking the performance of all other countries into account. In Chapter 2 this technique is amply explained. Using the basic data set of Appendix B the composite index scores are

D4.9 Developing a Road Safety Index
151
calculated for 30 countries in Chapter 8. Table 11.7 at the end of this chapter summarizes the results, the cross index score for each country being the composite index value with respect to the final outcomes-layer. This table is useful to compare countries; but the information from which it has been derived (the composing indicators) has to be used as well. This will be illustrated with an example.
Suppose that Denmark and Hungary (again just an arbitrary sample) want to know if they perform good enough on the final outcomes indicators and if not, on which indicator they should improve in the first place. To this end, they may compare themselves with the top three of Europe: Iceland, Luxemburg and Sweden (Table 8.3). The large differences between their cross index scores (0.9903; 09897; 0.9807 vs 0.7589 and 0.6148) suggest that both DK and HU could improve considerably. Further comparison of the basic data on the composing indicators may provide further insight. These data (taken from Appendix B) are presented in Table 11.2.
Country Fatalities
per million inhabitants
2008
Fatalities per
million vehicle
fleet 2008
Fatalities per 10 billion
pkm 2008
Annual average
percentage reduction in
fatalities 2001-2008
Pedestrian as % of
total fatalities
2008
Pedal cycle as
% of total fatalities
2008
Motorcycle and moped
as % of total fatalities
2008
Iceland IS 38 48 24 0.04 0.00 0.00 0.08
Luxemburg LU 71 86 51 0.09 0.04 0.02 0.11
Sweden SE 43 74 40 0.05 0.11 0.08 0.16
Denmark DK 74 142 75 0.00 0.14 0.13 0.17
Hungary HU 99 270 230 0.03 0.25 0.11 0.12
Table 11.2. Seven indicators of final outcomes for 5 countries (2008).
It turns out that Denmark performs clearly less on all indicators compared to the top three countries. Improvement might require a broad range of measures. Still larger differences are observed for Hungary on most indicators.
Two groups of countries
The question may rise whether it is relevant for a country like Hungary to compare itself with countries like Iceland, Luxemburg and Sweden. As said before, structural and cultural differences between countries have to be taken into account. This is expressed in the pyramid of road safety target hierarchy (Figure 11.1) by the bottom-layer ‘Structure and culture’. This layer contains indicators regarding the physical and social structure of countries and indicators regarding the culture of countries. In Chapter 6, a set of valid indicators and available data have been derived from literature. These data have been analysed in Chapter 7 in order to group countries in comparable classes. Comparable classes are constructed because it can be expected that countries learn more, and more easily, from similar countries than from countries which differ on physical and social characteristics. Also, countries might be more motivated to improve themselves if being the ‘best-in-class’ is considered to be within reach. From the analyses it was concluded that two groups of countries can be recognized. The key characteristics subdividing the countries into two groups were the indicators of motorization level and GDP (Gross Domestic Product) per capita
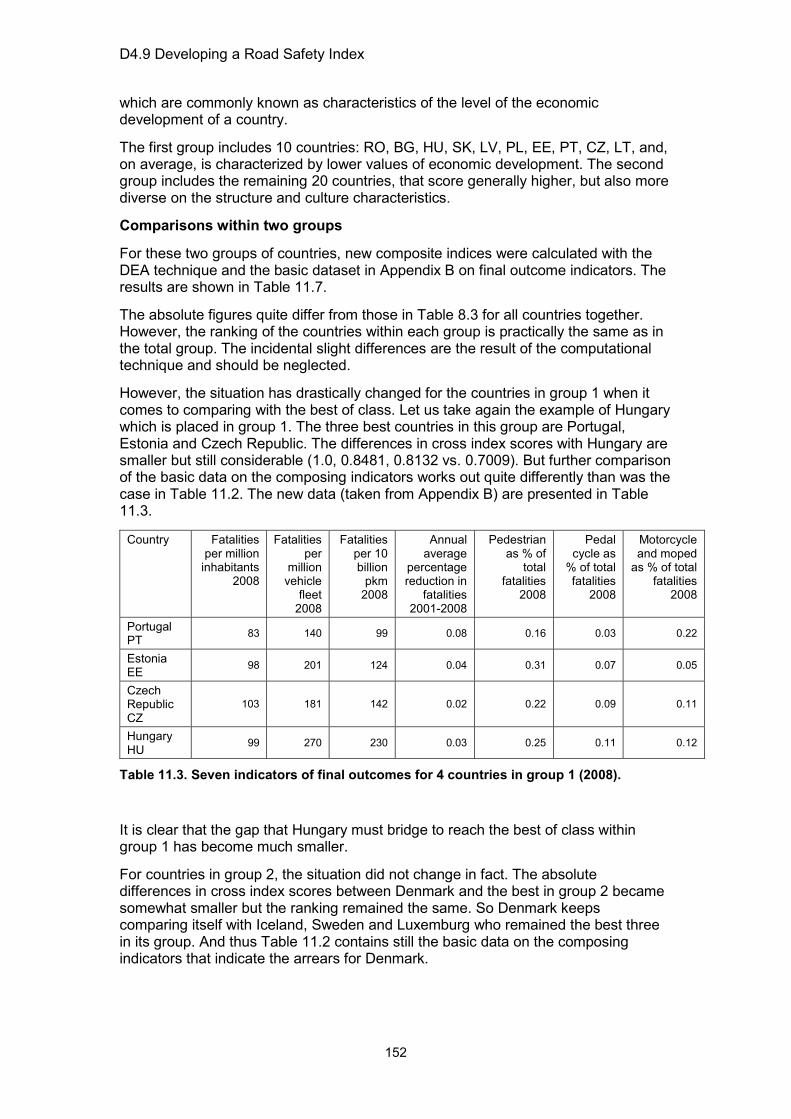
D4.9 Developing a Road Safety Index
152
which are commonly known as characteristics of the level of the economic development of a country.
The first group includes 10 countries: RO, BG, HU, SK, LV, PL, EE, PT, CZ, LT, and, on average, is characterized by lower values of economic development. The second group includes the remaining 20 countries, that score generally higher, but also more diverse on the structure and culture characteristics.
Comparisons within two groups
For these two groups of countries, new composite indices were calculated with the DEA technique and the basic dataset in Appendix B on final outcome indicators. The results are shown in Table 11.7.
The absolute figures quite differ from those in Table 8.3 for all countries together. However, the ranking of the countries within each group is practically the same as in the total group. The incidental slight differences are the result of the computational technique and should be neglected.
However, the situation has drastically changed for the countries in group 1 when it comes to comparing with the best of class. Let us take again the example of Hungary which is placed in group 1. The three best countries in this group are Portugal, Estonia and Czech Republic. The differences in cross index scores with Hungary are smaller but still considerable (1.0, 0.8481, 0.8132 vs. 0.7009). But further comparison of the basic data on the composing indicators works out quite differently than was the case in Table 11.2. The new data (taken from Appendix B) are presented in Table 11.3.
Country Fatalities per million
inhabitants 2008
Fatalities per
million vehicle
fleet 2008
Fatalities per 10 billion
pkm 2008
Annual average
percentage reduction in
fatalities 2001-2008
Pedestrian as % of
total fatalities
2008
Pedal cycle as
% of total fatalities
2008
Motorcycle and moped
as % of total fatalities
2008
Portugal PT 83 140 99 0.08 0.16 0.03 0.22
Estonia EE 98 201 124 0.04 0.31 0.07 0.05
Czech Republic CZ
103 181 142 0.02 0.22 0.09 0.11
Hungary HU 99 270 230 0.03 0.25 0.11 0.12
Table 11.3. Seven indicators of final outcomes for 4 countries in group 1 (2008).
It is clear that the gap that Hungary must bridge to reach the best of class within group 1 has become much smaller.
For countries in group 2, the situation did not change in fact. The absolute differences in cross index scores between Denmark and the best in group 2 became somewhat smaller but the ranking remained the same. So Denmark keeps comparing itself with Iceland, Sweden and Luxemburg who remained the best three in its group. And thus Table 11.2 contains still the basic data on the composing indicators that indicate the arrears for Denmark.
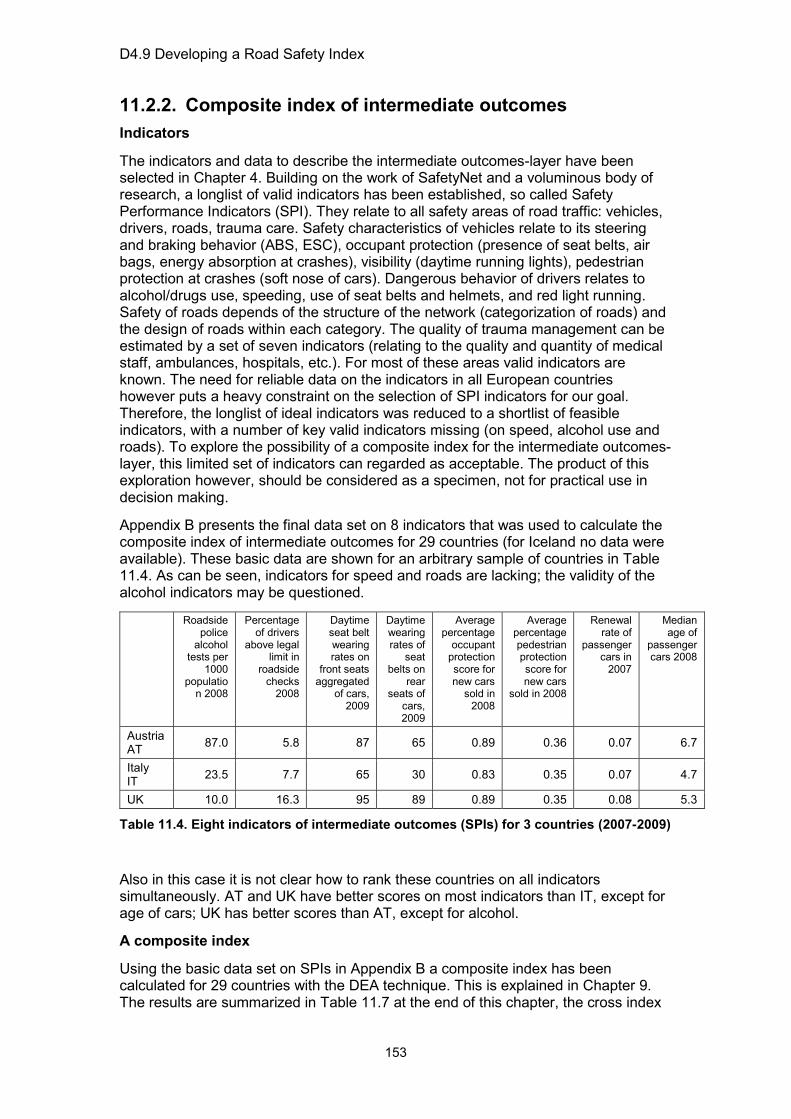
D4.9 Developing a Road Safety Index
153
11.2.2. Composite index of intermediate outcomes Indicators
The indicators and data to describe the intermediate outcomes-layer have been selected in Chapter 4. Building on the work of SafetyNet and a voluminous body of research, a longlist of valid indicators has been established, so called Safety Performance Indicators (SPI). They relate to all safety areas of road traffic: vehicles, drivers, roads, trauma care. Safety characteristics of vehicles relate to its steering and braking behavior (ABS, ESC), occupant protection (presence of seat belts, air bags, energy absorption at crashes), visibility (daytime running lights), pedestrian protection at crashes (soft nose of cars). Dangerous behavior of drivers relates to alcohol/drugs use, speeding, use of seat belts and helmets, and red light running. Safety of roads depends of the structure of the network (categorization of roads) and the design of roads within each category. The quality of trauma management can be estimated by a set of seven indicators (relating to the quality and quantity of medical staff, ambulances, hospitals, etc.). For most of these areas valid indicators are known. The need for reliable data on the indicators in all European countries however puts a heavy constraint on the selection of SPI indicators for our goal. Therefore, the longlist of ideal indicators was reduced to a shortlist of feasible indicators, with a number of key valid indicators missing (on speed, alcohol use and roads). To explore the possibility of a composite index for the intermediate outcomes-layer, this limited set of indicators can regarded as acceptable. The product of this exploration however, should be considered as a specimen, not for practical use in decision making.
Appendix B presents the final data set on 8 indicators that was used to calculate the composite index of intermediate outcomes for 29 countries (for Iceland no data were available). These basic data are shown for an arbitrary sample of countries in Table 11.4. As can be seen, indicators for speed and roads are lacking; the validity of the alcohol indicators may be questioned.
Roadside police
alcohol tests per
1000 populatio
n 2008
Percentage of drivers
above legal limit in
roadside checks
2008
Daytime seat belt wearing rates on
front seats aggregated
of cars, 2009
Daytime wearing rates of
seat belts on
rear seats of
cars, 2009
Average percentage
occupant protection score for new cars
sold in 2008
Average percentage pedestrian protection score for new cars
sold in 2008
Renewal rate of
passenger cars in
2007
Median age of
passenger cars 2008
Austria AT 87.0 5.8 87 65 0.89 0.36 0.07 6.7
Italy IT 23.5 7.7 65 30 0.83 0.35 0.07 4.7
UK 10.0 16.3 95 89 0.89 0.35 0.08 5.3
Table 11.4. Eight indicators of intermediate outcomes (SPIs) for 3 countries (2007-2009)
Also in this case it is not clear how to rank these countries on all indicators simultaneously. AT and UK have better scores on most indicators than IT, except for age of cars; UK has better scores than AT, except for alcohol.
A composite index
Using the basic data set on SPIs in Appendix B a composite index has been calculated for 29 countries with the DEA technique. This is explained in Chapter 9. The results are summarized in Table 11.7 at the end of this chapter, the cross index
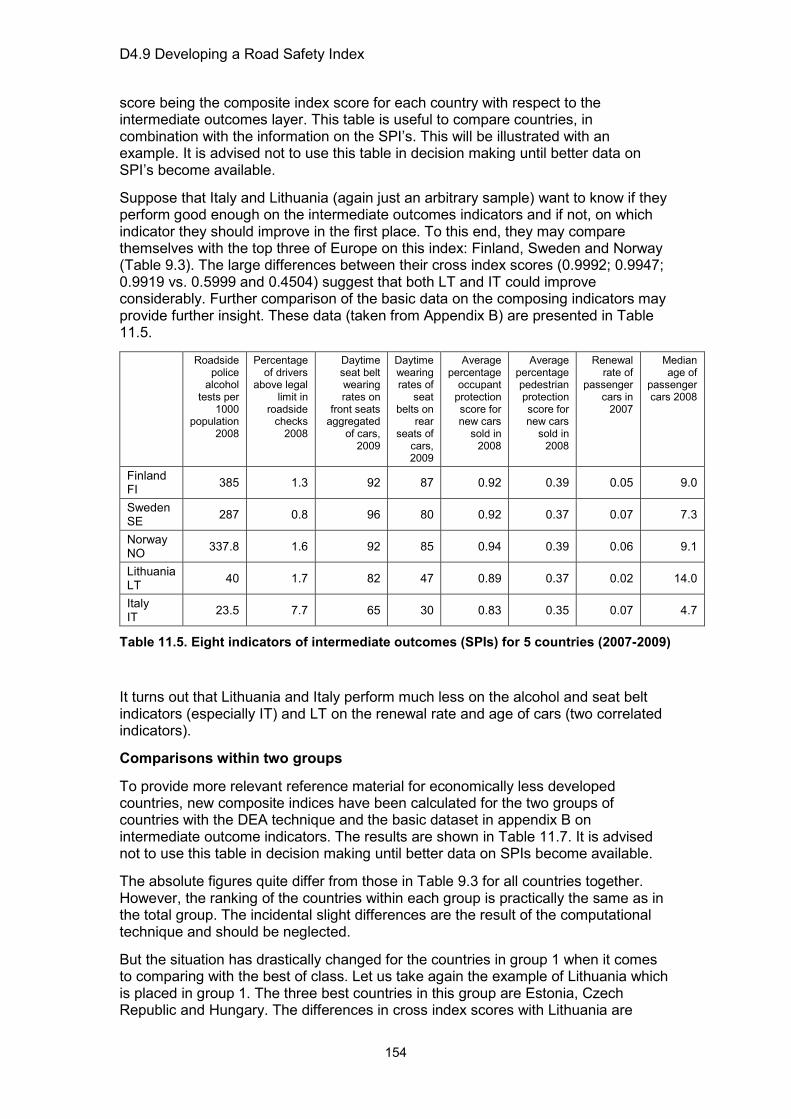
D4.9 Developing a Road Safety Index
154
score being the composite index score for each country with respect to the intermediate outcomes layer. This table is useful to compare countries, in combination with the information on the SPI’s. This will be illustrated with an example. It is advised not to use this table in decision making until better data on SPI’s become available.
Suppose that Italy and Lithuania (again just an arbitrary sample) want to know if they perform good enough on the intermediate outcomes indicators and if not, on which indicator they should improve in the first place. To this end, they may compare themselves with the top three of Europe on this index: Finland, Sweden and Norway (Table 9.3). The large differences between their cross index scores (0.9992; 0.9947; 0.9919 vs. 0.5999 and 0.4504) suggest that both LT and IT could improve considerably. Further comparison of the basic data on the composing indicators may provide further insight. These data (taken from Appendix B) are presented in Table 11.5.
Roadside police
alcohol tests per
1000 population
2008
Percentage of drivers
above legal limit in
roadside checks
2008
Daytime seat belt wearing rates on
front seats aggregated
of cars, 2009
Daytime wearing rates of
seat belts on
rear seats of
cars, 2009
Average percentage
occupant protection score for new cars
sold in 2008
Average percentage pedestrian protection score for new cars
sold in 2008
Renewal rate of
passenger cars in
2007
Median age of
passenger cars 2008
Finland FI 385 1.3 92 87 0.92 0.39 0.05 9.0
Sweden SE 287 0.8 96 80 0.92 0.37 0.07 7.3
Norway NO 337.8 1.6 92 85 0.94 0.39 0.06 9.1
Lithuania LT 40 1.7 82 47 0.89 0.37 0.02 14.0
Italy IT 23.5 7.7 65 30 0.83 0.35 0.07 4.7
Table 11.5. Eight indicators of intermediate outcomes (SPIs) for 5 countries (2007-2009)
It turns out that Lithuania and Italy perform much less on the alcohol and seat belt indicators (especially IT) and LT on the renewal rate and age of cars (two correlated indicators).
Comparisons within two groups
To provide more relevant reference material for economically less developed countries, new composite indices have been calculated for the two groups of countries with the DEA technique and the basic dataset in appendix B on intermediate outcome indicators. The results are shown in Table 11.7. It is advised not to use this table in decision making until better data on SPIs become available.
The absolute figures quite differ from those in Table 9.3 for all countries together. However, the ranking of the countries within each group is practically the same as in the total group. The incidental slight differences are the result of the computational technique and should be neglected.
But the situation has drastically changed for the countries in group 1 when it comes to comparing with the best of class. Let us take again the example of Lithuania which is placed in group 1. The three best countries in this group are Estonia, Czech Republic and Hungary. The differences in cross index scores with Lithuania are

D4.9 Developing a Road Safety Index
155
smaller but still considerable (1.0, 0.9417, 0.9364 vs, 0.7695). But further comparison of the basic data on the composing indicators works out quite differently than from Table 11.5. The new data (taken from Appendix B) are presented in Table 11.6.
Roadside police
alcohol tests per
1000 populatio
n 2008
Percentage of drivers
above legal limit in
roadside checks
2008
Daytime seat belt wearing rates on
front seats aggregated
of cars, 2009
Daytime wearing rates of
seat belts on rear
seats of cars, 2009
Average percentage
occupant protection score for new cars
sold in 2008
Average percentage pedestrian protection score for new cars
sold in 2008
Renewal rate of
passenger cars in
2007
Median age of
passenger cars 2008
Estonia EE 95 1.1 87 63 0.90 0.38 0.06 11.5
Czech Republic CZ
114 1.8 89 51 0.86 0.39 0.04 11.5
Hungary HU 129.5 3.1 79 49 0.87 0.40 0.06 8.5
Lithuania LT 40 1.7 82 47 0.89 0.37 0.02 14.0
Table 11.6. Eight indicators of intermediate outcomes (SPIs) for 4 countries in group 1 (2007-2009).
It is clear that the gap that Lithuania must bridge to reach the best of class within group 1 has become much smaller.
For countries in group 2, the situation did not change in fact. The absolute differences in cross index scores between Italy and the best in group 2 remained the same as did the ranking. So Italy keeps comparing itself with Finland, Sweden and Norway who remained the best three in its group. And thus Table 11.5. contains still the basic data on the composing indicators that indicate the arrears for Italy.
11.2.3. Composite index of policy performance This layer of the pyramid (Figure 11.1) relates to the government activities that are aiming at reducing the damage resulting from road traffic crashes. The pyramid indicates safety measures and programmes as the output of road safety policy; improved SPIs and less killed and injured persons are indicated as the intermediate and final outcomes resulting from road safety policy. Our first task was to define valid and reliable indicators for this road safety policy performance. In search for valid indicators literature has been reviewed; also analyses of recent survey-data by another DaCoTA Work Package (WP 1 on policy making) have been studied.
Literature on policy performance
Originally, the quality of policy performance referred to the effectiveness of the concrete measures and action programmes that are implemented in a country. Later, also the conditions that determine effective measures and programmes were included. In fact, an additional layer of explanatory variables was inserted into the pyramid, called Institutional management functions. We focused on these functions and did not go into indicators for effective measures.
The last decade, good practice in institutional management of road safety has received much attention. A series of leading reports have been published on the subject. They did describe the institutional management functions almost without exception qualitatively. For our purpose they need further operationalization.

D4.9 Developing a Road Safety Index
156
Moreover, their impact will frequently depend on its quantity or intensity; this requires the assignment of quantitative values (categories). In the absence of operational indicators of course no country assessments exist on this subject. And last but not least, although the qualitative analyses seem convincing and in accordance with certain management theories, very little empirical proof exists on the effects of institutional management functions. The relevant general reports just build on examples of good practice countries.
Results of WP 1
Also another DaCoTA workpackage (WP 1 on Policy) has undertaken efforts to underpin prevailing theories of effective road safety management. An extensive questionnaire was constructed to collect data on the availability of components of various management functions. This questionnaire at first was used in 14 countries. The results showed interesting indications on the availability of certain features. It was felt however that the outcomes were too complex to enable a selection of simple applicable indicators for the characteristics of road safety management.
Simultaneously, data were collected by ETSC preparing the 6th PIN report that would cover the road safety management system in 30 European countries. A limited number of items turned out to be relevant for our purpose and was analysed by WP 1. This investigation could neither sufficiently establish the validity of indicators for effective management.
Therefore, we have to conclude that, at this moment, it is not feasible to select valid indicators for road safety policy performance of a country, neither for effective measures nor for effective institutional management functions. Consequently, an index with respect to policy performance could not be composed.
11.2.4. Overall Road Safety Composite Index The objective of this overall Road Safety Composite Index (RSCI) is to enable a comparison between countries with respect to their road safety situation in a broad sense, including final and intermediate safety outcomes. This may be done by constructing a composite index based on the two composite indices we presented above (based on the combination of final and intermediate outcomes). According to the methodology of composite indices, this would not be justified if these two indices would correlate so strong that they measure practically the same concept; in that case, a composite index would be superfluous. An investigation into the associations between the two indices revealed indeed a correlation between the SPI index and the final outcome index. But still, the index scores differ in so many instances that a composite index would make sense provided that corrections are made for the correlations.
Ideally, an overall Road Safety Composite Index (the RSCI) would provide an unambiguous ranking of all countries, taking into account all indicators of safety outcomes. However, we came across some serious theoretical and practical problems when developing such RSCI. It can be concluded that further research with respect to the weighting of layer-indexes is needed In this report, we opted to visualize the two constructed layer-indices in a graph (with four quadrants) in order to enable a country to compare itself with the ‘best of class’. This will be illustrated for the two groups of countries. For each group, a graph with two dimensions is composed, representing the score of each country on both composite indices. The dotted green lines indicate the boundaries of "moderately high" safety performance levels, according to the results of both analyses. Thus the countries in the 2nd green quadrant (positioned in the upper right corner) are considered to be the best of class.

D4.9 Developing a Road Safety Index
157
Figure 11.2. Countries of group 1 plotted in accordance with their composite index scores.
Figure 11.3. Countries of group 2 plotted in accordance with their composite index scores.
D4.9 Developing a Road Safety Index
158
These figures enable any country outside the upper right corner to compare itself with the best performing countries. A better final outcomes and/or SPI index value would allow them to move to the best quadrant. Further comparisons of the indicators composing the relevant layer-index (like we have illustrated in Sections 11.2.1 and 11.2.2) make clear on which SPI(s) and/or on which final outcome(s) indicator one should focus.
This method does not offer the possibility to compare countries that are better on the one and worse on the other index. For example PL and BG in group 1, or IT and BE in group 2. For such comparison, the relative weight of both indices need to be established. Then, all countries could be ranked unambiguously.
It is advised not to use the presented rankings for decision making given the data restrictions encountered in the selection of SPI indicators.
11.3. Recommendations A number of our WP 4 objectives have been achieved; some of these results can be applied in practice. They should be disseminated and discussed with stakeholders. These actions can be taken on short term.
Some objectives have not or not fully been realized. This is not surprising because of the complexity of this relatively new field of research. This first exploration however makes it possible to define more precisely what knowledge is needed and how we can acquire it. These recommendations require actions on the long term.
11.3.1. Short term recommendations The main results that have been achieved are following:
• Indicators of final and intermediate road safety outcomes have been defined and currently available data have been collected for 30 European countries; the indicators on intermediate outcomes need further improvement;
• The technique of Data Envelopment Analysis (DEA) has been selected to construct a composite index; for each of the two layers of both final and intermediate outcomes, a composite index has been constructed by using DEA;
• A method has been developed to compare a country with the best of class according to the two composite indices in combination
These results should be made public and discussed with stakeholders (policy makers at the national and EU level, interest groups, industry, road safety organizations NGO, researchers and consultants). They should evaluate the relevance of this information for decision making and express their need for improvements and further research. The composite indices and the data on the indicators should be updated annually.
11.3.2. Long term recommendations Three areas for further research are recommended. The first and second area can be explored simultaneously, the third area will be relevant after achieving the others.
1. Improve the indicators of intermediate safety outcomes. This is necessary because a number of key valid indicators are missing (on speed, alcohol use and roads).

D4.9 Developing a Road Safety Index
159
2. Develop indicators and a composite index for effective and efficient policy performance. This research may aim at the valuation of either a country’s measures and programmes or of its institutional management functions, or both. Furthermore, it may aim at evaluating the opportunities within countries to be able to execute road safety measures and policies succesfully, the actual realization of the measures, programmes and policies and the effect on safety performance indicators and crashes and casualties.
3. Construct an overall Road Safety Composite Index based on the three composite indices for the two layers of safety outcomes and the third layer of policy performance. This will require a method to establish relative weights for the three layer-indices. The inclusion of the policy performance layer is important, because the achievements of countries on road safety can not only be measured by outcome indicators. Ranking countries and comparing them with the best in class will create competition and increase political attention. An overall Road Safety Composite Index can indicate for individual countries which improvements are possible, given the structure and culture of a country, by tracing vertical paths through the pyramid: from strategy, through implementation of the strategy into safety performance indicators, to the prevention of casualties, crashes and costs.
The development of indicators for effective measures can build on a voluminous body of knowledge. The creation of a transnational database of Crash Modification Functions (CMF’s) seems feasible on the short term and would form a solid base for a set of indicators.
The development of indicators for effective management functions requires different research than has been attempted up till now. It can make use of the comparative data from the extensive Dacota questionnaire on 14 countries. They describe in detail many aspects of road safety management. What is needed firstly are criteria for the effectiveness of these functions. The relations with the (final and intermediate) outcomes has been explored by WP1, with little success however. It is recommended to use the quality of the measures as criteria for the validation of the management indicators. It seems logical to judge the quality of management in the first place by its direct output. Ideally the indicators for effective measures based on the CMF’s should be used for this purpose. On the short term rough indicators for effective measures could be derived from existing reviews.
Once indicators for policy performance have been established and data have been collected in all European countries, a composite index can be constructed making use of the technique of DEA.

D4.9 Developing a Road Safety Index
160
All countries
Cross index score - SPIs
Cross index score - Final
Outcomes
Group 1 Cross index score - SPIs
Cross index score - Final
Outcomes
AT 0.7434 0.8415
BG 0.7600 0.4835
BE 0.7316 0.8541
CZ 0.9417 0.8132
BG 0.5955 0.4135
EE 1.0000 0.8481
CH 0.8098 0.9773
HU 0.9364 0.7009
CY 0.6845 0.7034
LT 0.7695 0.6814
CZ 0.7200 0.6994
LV 0.7311 0.6996
DE 0.8253 0.9613
PL 0.6902 0.5904
DK 0.7457 0.7589
PT 0.8632 1.0000
EE 0.7695 0.7406
RO 0.4795 0.1530
EL 0.5857 0.6183
SK 0.8320 0.6769
ES 0.8559 0.9451
FI 0.9992 0.8759
Group 2 Cross index score - SPIs
Cross index score - Final
Outcomes FR 0.9201 0.9743
HU 0.6948 0.6148
AT 0.7428 0.8347
IE 0.9062 0.9124
BE 0.7313 0.8442
IT 0.4504 0.8945
CH 0.8092 0.9748
LT 0.5999 0.6127
CY 0.6638 0.6978
LU 0.6893 0.9897
DE 0.8324 0.9564
LV 0.5417 0.6613
DK 0.7469 0.7606
MT 0.6064 0.8432
EL 0.5718 0.6065
NL 0.8604 0.9755
ES 0.8580 0.9356
NO 0.9919 0.8628
FI 0.9996 0.8737
PL 0.5113 0.5050
FR 0.9225 0.9640
PT 0.6440 0.9010
IE 0.9059 0.9072
RO 0.3682 0.1363
IT 0.4448 0.8873
SE 0.9947 0.9807
LU 0.6939 0.9778
SI 0.7574 0.7356
MT 0.5944 0.8523
SK 0.6096 0.5818
NL 0.8633 0.9748
UK 0.6970 0.9586
NO 0.9911 0.8656
IS 0.9903
SE 0.9943 0.9787
SI 0.7536 0.7286
UK 0.7068 0.9582
IS 0.9900
Table 11.7. Summary table of composite indices of Final outcomes and SPI’s, 30 countries (total and in 2 groupings).
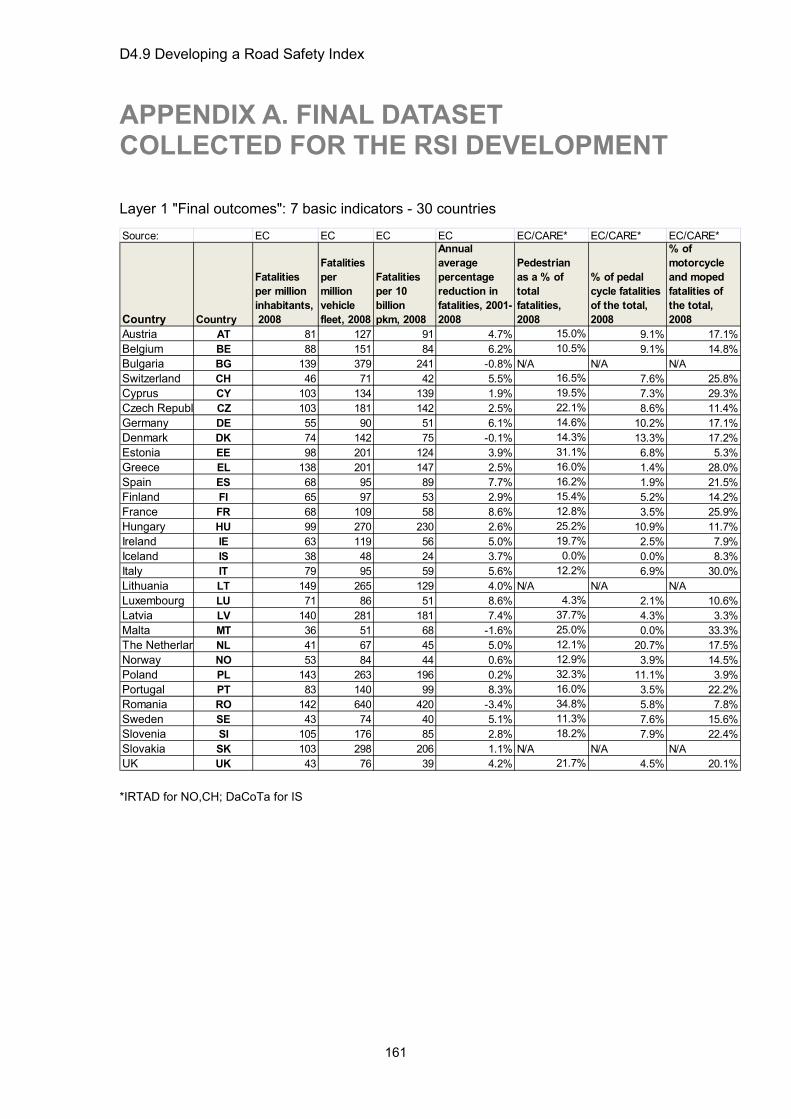
D4.9 Developing a Road Safety Index
161
APPENDIX A. FINAL DATASET COLLECTED FOR THE RSI DEVELOPMENT
Layer 1 "Final outcomes": 7 basic indicators - 30 countries
Source: EC EC EC EC EC/CARE* EC/CARE* EC/CARE*
Country Country
Fatalities per million inhabitants, 2008
Fatalities per million vehicle fleet, 2008
Fatalities per 10 billion pkm, 2008
Annual average percentage reduction in fatalities, 2001-2008
Pedestrian as a % of total fatalities, 2008
% of pedal cycle fatalities of the total, 2008
% of motorcycle and moped fatalities of the total, 2008
Austria AT 81 127 91 4.7% 15.0% 9.1% 17.1%Belgium BE 88 151 84 6.2% 10.5% 9.1% 14.8%Bulgaria BG 139 379 241 -0.8% N/A N/A N/ASwitzerland CH 46 71 42 5.5% 16.5% 7.6% 25.8%Cyprus CY 103 134 139 1.9% 19.5% 7.3% 29.3%Czech Republ CZ 103 181 142 2.5% 22.1% 8.6% 11.4%Germany DE 55 90 51 6.1% 14.6% 10.2% 17.1%Denmark DK 74 142 75 -0.1% 14.3% 13.3% 17.2%Estonia EE 98 201 124 3.9% 31.1% 6.8% 5.3%Greece EL 138 201 147 2.5% 16.0% 1.4% 28.0%Spain ES 68 95 89 7.7% 16.2% 1.9% 21.5%Finland FI 65 97 53 2.9% 15.4% 5.2% 14.2%France FR 68 109 58 8.6% 12.8% 3.5% 25.9%Hungary HU 99 270 230 2.6% 25.2% 10.9% 11.7%Ireland IE 63 119 56 5.0% 19.7% 2.5% 7.9%Iceland IS 38 48 24 3.7% 0.0% 0.0% 8.3%Italy IT 79 95 59 5.6% 12.2% 6.9% 30.0%Lithuania LT 149 265 129 4.0% N/A N/A N/ALuxembourg LU 71 86 51 8.6% 4.3% 2.1% 10.6%Latvia LV 140 281 181 7.4% 37.7% 4.3% 3.3%Malta MT 36 51 68 -1.6% 25.0% 0.0% 33.3%The Netherlan NL 41 67 45 5.0% 12.1% 20.7% 17.5%Norway NO 53 84 44 0.6% 12.9% 3.9% 14.5%Poland PL 143 263 196 0.2% 32.3% 11.1% 3.9%Portugal PT 83 140 99 8.3% 16.0% 3.5% 22.2%Romania RO 142 640 420 -3.4% 34.8% 5.8% 7.8%Sweden SE 43 74 40 5.1% 11.3% 7.6% 15.6%Slovenia SI 105 176 85 2.8% 18.2% 7.9% 22.4%Slovakia SK 103 298 206 1.1% N/A N/A N/AUK UK 43 76 39 4.2% 21.7% 4.5% 20.1%
*IRTAD for NO,CH; DaCoTa for IS

D4.9 Developing a Road Safety Index
162
Layer 2 "Intermediate outcomes (SPIs)": 8 basic indicators - 29 countries (IS excluded)
Source: ETSC PIN 16 ETSC PIN 16 ETSC PIN 16 ETSC PIN 16 ETSC PIN 13 ETSC PIN 13 ETSC PIN 13 UNECE
Country Country
Roadside police alcohol tests per 1,000 population, 2008
Percentage of drivers above legal alcohol limit in roadside checks, 2008
Daytime seat belt wearing rates on front seats aggregated of cars, 2009
Daytime wearing rates of seat belts on rear seats of cars, 2009
Average percentage occupant protection score for new cars sold in 2008
Average percentage score of pedestrian protection for new cars sold in 2008
Renewal rate of passenger cars in 2007
Median age of passenger cars, 2008
Austria AT 87 5.8 87 65 89.3% 36.1% 7.0% 6.7Belgium BE n/a n/a 80 n/a 89.9% 34.2% 10.5% 6.5Bulgaria BG n/a n/a n/a n/a 83.8% 34.7% 1.6% n/aSwitzerland CH n/a n/a 87 68 89.3% 35.6% 6.7% 7.5Cyprus CY 182 5.9 80 21 93.7% 42.8% 9.8% 8.7Czech Republ CZ n/a n/a 89 51 85.9% 39.2% 3.6% 11.5Germany DE n/a n/a 97 88 90.4% 34.2% 7.6% 7.5Denmark DK 36 n/a 92 71 87.2% 37.8% 7.9% 6.7Estonia EE 95 1.1 87 63 90.0% 37.5% 5.9% 11.5Greece EL 135 3.1 75 23 86.3% 37.8% 6.5% n/aSpain ES 112 1.8 85 81 90.7% 37.8% 7.4% 6.7Finland FI 385 1.3 92 87 92.3% 38.9% 4.9% 9.0France FR 190 3.3 98 82 89.6% 36.1% 6.5% 7.5Hungary HU 130 3.1 79 49 86.8% 40.3% 5.9% 8.5Ireland IE 128 3.2 90 78 92.5% 38.6% 9.9% 5.9Italy IT 23 n/a 65 n/a 83.3% 35.3% 7.0% 4.7Lithuania LT 40 1.7 n/a n/a 88.9% 36.7% 1.5% 14.0Luxembourg LU 0.4 n/a 81 72 91.3% 33.3% n/a 4.1Latvia LV n/a n/a 83 21 89.7% 36.7% 3.6% 13.3Malta MT n/a n/a 96 28 77.8% 40.0% 4.2% 11.7The Netherlan NL n/a n/a 95 81 88.2% 37.2% 6.7% 7.8Norway NO 338 n/a 92 85 93.6% 39.4% 6.4% 9.1Poland PL 47 9.5 80 50 88.4% 38.3% 2.0% 12.6Portugal PT 63 5.9 86 49 90.8% 36.7% 4.6% n/aRomania RO n/a n/a n/a n/a 75.1% 29.4% n/a n/aSweden SE 287 0.8 96 80 92.0% 36.9% 7.2% 7.3Slovenia SI 200 5.8 88 57 89.2% 36.1% 6.6% 7.9Slovakia SK n/a n/a 80 33 85.4% 40.3% 4.1% n/aUK UK 10 16.3 95 89 89.0% 35.3% 8.2% 5.3

D4.9 Developing a Road Safety Index
163
Grouping level - "Structure and culture": 8 indicators - 30 countries
Source: EC EC EC DaCoTa EC EC DaCoTa DaCoTa
Country Country
Number of passenger cars per 1000 inhabitants, 2008
GDP per head, in
PPP, EU27 =
100, 2008
Population density, inh/km2, 2008
Population living in urban areas (communities >10.000 pop or > 500 adresses/km2), 2008
% of Goods vehicles in fleet, 2008
% of powered two-wheelers in fleet, 2008
% of population 0-24, 2008
% of population over 65, 2008
Austria AT 513 123 100 35.0% 7.1% 12.9% 27.6% 17.1%Belgium BE 477 115 352 56.0% 11.4% 6.2% 29.0% 17.0%Bulgaria BG 311 41 69 4.6% 10.7% 3.8% 26.2% 17.4%Switzerland CH 518 141 187 44.0% 6.5% 12.7% 27.4% 16.4%Cyprus CY 557 96 86 55.0% 19.9% 7.1% 31.8% 13.0%Czech Republ CZ 423 80 133 35.0% 10.2% 15.0% 27.2% 14.6%Germany DE 504 116 230 48.0% 5.1% 11.8% 25.3% 20.1%Denmark DK 381 120 128 34.0% 18.6% 7.2% 30.1% 15.6%Estonia EE 412 67 30 44.0% 12.7% 2.7% 30.0% 17.2%Greece EL 446 94 85 64.0% 16.7% 18.0% 25.2% 18.7%Spain ES 483 103 91 51.0% 16.6% 15.1% 25.8% 16.6%Finland FI 507 117 16 26.0% 11.9% 11.8% 29.3% 16.5%France FR 498 108 115 44.0% 13.3% 6.9% 31.3% 16.4%Hungary HU 305 64 108 31.0% 12.8% 3.8% 28.1% 14.9%Ireland IE 439 135 63 34.0% 14.9% 1.7% 34.7% 10.9%Iceland IS 657 121 3 n/a 12.6% 3.6% 35.6% 11.5%Italy IT 601 102 199 43.0% 9.1% 18.4% 24.2% 20.0%Lithuania LT 499 62 51 42.0% 8.0% 2.4% n/a n/aLuxembourg LU 667 276 191 33.0% 8.5% 9.9% 29.8% 14.0%Latvia LV 413 57 35 45.0% 11.5% 4.6% 29.3% 17.2%Malta MT 555 76 1309 85.0% 16.4% 4.9% 30.5% 13.6%The Netherlan NL 458 134 397 63.0% 10.2% 14.7% 30.0% 14.7%Norway NO 458 191 15 19.0% 17.2% 9.7% n/a n/aPoland PL 422 56 122 39.0% 14.1% 7.8% 31.0% 13.5%Portugal PT 415 76 115 44.0% 21.3% 8.7% 27.4% 16.0%Romania RO 187 48 90 37.0% 13.5% 1.5% 29.5% 14.9%Sweden SE 462 120 21 17.0% 9.5% 10.3% 29.8% 17.5%Slovenia SI 514 91 100 19.0% 6.9% 6.8% 26.2% 16.3%Slovakia SK 285 72 110 22.0% 13.3% 3.8% 31.1% 12.0%UK UK 475 116 253 66.0% 11.2% 3.8% 31.1% 15.5%

D4.9 Developing a Road Safety Index
164
APPENDIX B. FINAL DATASET WITH THE VALUES IMPUTED
Layer 1 "Final outcomes": 7 basic indicators - 30 countries
Country Country
Fatalities per million inhabitants, 2008
Fatalities per million vehicle fleet, 2008
Fatalities per 10 billion pkm, 2008
Annual average percentage reduction in fatalities, 2001-2008
Pedestrian as a % of total fatalities, 2008
% of pedal cycle fatalities of the total, 2008
% of motorcycle and moped fatalities of the total, 2008
Country F_per_i F_per_v F_per_p AAPR_f P_Ped P_cyc p_motAustria AT 81 127 91 0.05 0.15 0.09 0.17Belgium BE 88 151 84 0.06 0.10 0.09 0.15Bulgaria BG 139 379 241 -0.01 0.35 0.09 0.10Cyprus CY 103 134 139 0.02 0.20 0.07 0.29Czech RepCZ 103 181 142 0.02 0.22 0.09 0.11Denmark DK 74 142 75 0.00 0.14 0.13 0.17Estonia EE 98 201 124 0.04 0.31 0.07 0.05Finland FI 65 97 53 0.03 0.15 0.05 0.14France FR 68 109 58 0.09 0.13 0.03 0.26Germany DE 55 90 51 0.06 0.15 0.10 0.17Greece EL 138 201 147 0.03 0.16 0.01 0.28Hungary HU 99 270 230 0.03 0.25 0.11 0.12Iceland IS 38 48 24 0.04 0.00 0.00 0.08Ireland IE 63 119 56 0.05 0.20 0.02 0.08Italy IT 79 95 59 0.06 0.12 0.07 0.30Latvia LV 140 281 181 0.07 0.38 0.04 0.03Lithuania LT 149 265 129 0.04 0.23 0.05 0.14LuxembouLU 71 86 51 0.09 0.04 0.02 0.11Malta MT 36 51 68 -0.02 0.25 0.00 0.33Norway NO 53 84 44 0.01 0.13 0.04 0.15Poland PL 143 263 196 0.00 0.32 0.11 0.04Portugal PT 83 140 99 0.08 0.16 0.03 0.22Romania RO 142 640 420 -0.03 0.35 0.06 0.08Slovakia SK 103 298 206 0.01 0.23 0.09 0.13Slovenia SI 105 176 85 0.03 0.18 0.08 0.22Spain ES 68 95 89 0.08 0.16 0.02 0.21Sweden SE 43 74 40 0.05 0.11 0.08 0.16SwitzerlanCH 46 71 42 0.05 0.17 0.08 0.26The NetheNL 41 67 45 0.05 0.12 0.21 0.17UK UK 43 76 39 0.04 0.22 0.05 0.20
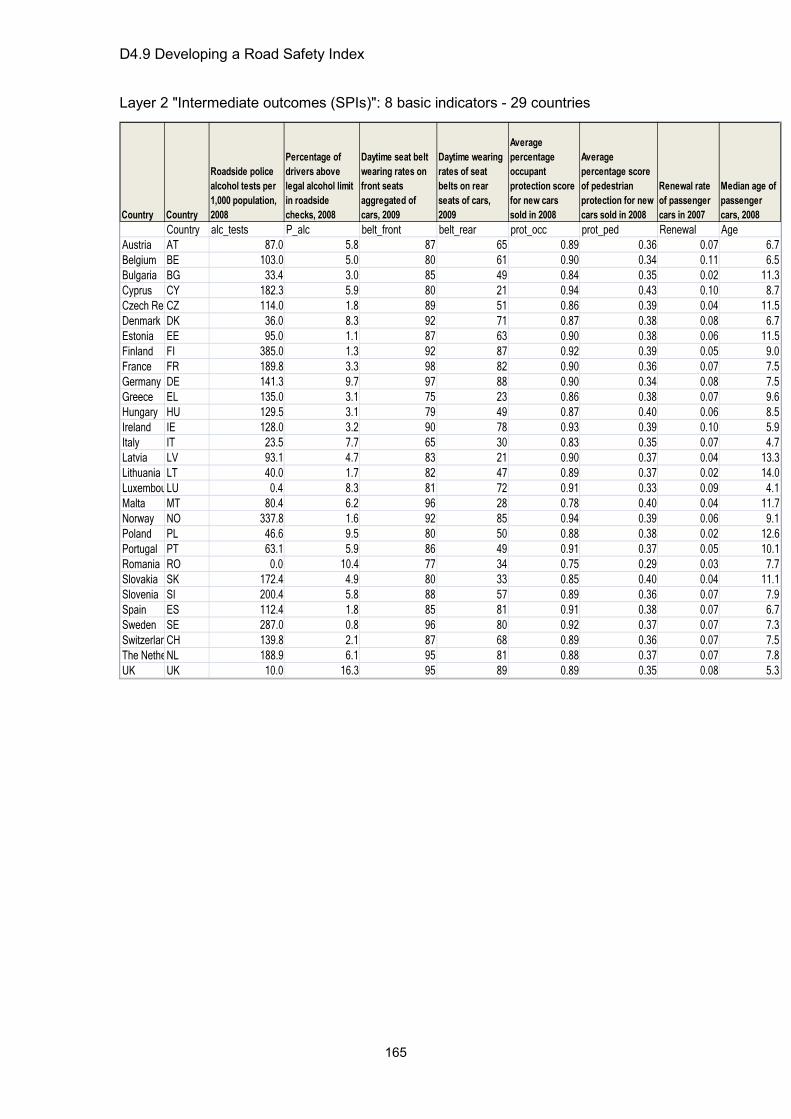
D4.9 Developing a Road Safety Index
165
Layer 2 "Intermediate outcomes (SPIs)": 8 basic indicators - 29 countries
Country Country
Roadside police alcohol tests per 1,000 population, 2008
Percentage of drivers above legal alcohol limit in roadside checks, 2008
Daytime seat belt wearing rates on front seats aggregated of cars, 2009
Daytime wearing rates of seat belts on rear seats of cars, 2009
Average percentage occupant protection score for new cars sold in 2008
Average percentage score of pedestrian protection for new cars sold in 2008
Renewal rate of passenger cars in 2007
Median age of passenger cars, 2008
Country alc_tests P_alc belt_front belt_rear prot_occ prot_ped Renewal AgeAustria AT 87.0 5.8 87 65 0.89 0.36 0.07 6.7Belgium BE 103.0 5.0 80 61 0.90 0.34 0.11 6.5Bulgaria BG 33.4 3.0 85 49 0.84 0.35 0.02 11.3Cyprus CY 182.3 5.9 80 21 0.94 0.43 0.10 8.7Czech RepCZ 114.0 1.8 89 51 0.86 0.39 0.04 11.5Denmark DK 36.0 8.3 92 71 0.87 0.38 0.08 6.7Estonia EE 95.0 1.1 87 63 0.90 0.38 0.06 11.5Finland FI 385.0 1.3 92 87 0.92 0.39 0.05 9.0France FR 189.8 3.3 98 82 0.90 0.36 0.07 7.5Germany DE 141.3 9.7 97 88 0.90 0.34 0.08 7.5Greece EL 135.0 3.1 75 23 0.86 0.38 0.07 9.6Hungary HU 129.5 3.1 79 49 0.87 0.40 0.06 8.5Ireland IE 128.0 3.2 90 78 0.93 0.39 0.10 5.9Italy IT 23.5 7.7 65 30 0.83 0.35 0.07 4.7Latvia LV 93.1 4.7 83 21 0.90 0.37 0.04 13.3Lithuania LT 40.0 1.7 82 47 0.89 0.37 0.02 14.0LuxembouLU 0.4 8.3 81 72 0.91 0.33 0.09 4.1Malta MT 80.4 6.2 96 28 0.78 0.40 0.04 11.7Norway NO 337.8 1.6 92 85 0.94 0.39 0.06 9.1Poland PL 46.6 9.5 80 50 0.88 0.38 0.02 12.6Portugal PT 63.1 5.9 86 49 0.91 0.37 0.05 10.1Romania RO 0.0 10.4 77 34 0.75 0.29 0.03 7.7Slovakia SK 172.4 4.9 80 33 0.85 0.40 0.04 11.1Slovenia SI 200.4 5.8 88 57 0.89 0.36 0.07 7.9Spain ES 112.4 1.8 85 81 0.91 0.38 0.07 6.7Sweden SE 287.0 0.8 96 80 0.92 0.37 0.07 7.3SwitzerlanCH 139.8 2.1 87 68 0.89 0.36 0.07 7.5The NetheNL 188.9 6.1 95 81 0.88 0.37 0.07 7.8UK UK 10.0 16.3 95 89 0.89 0.35 0.08 5.3
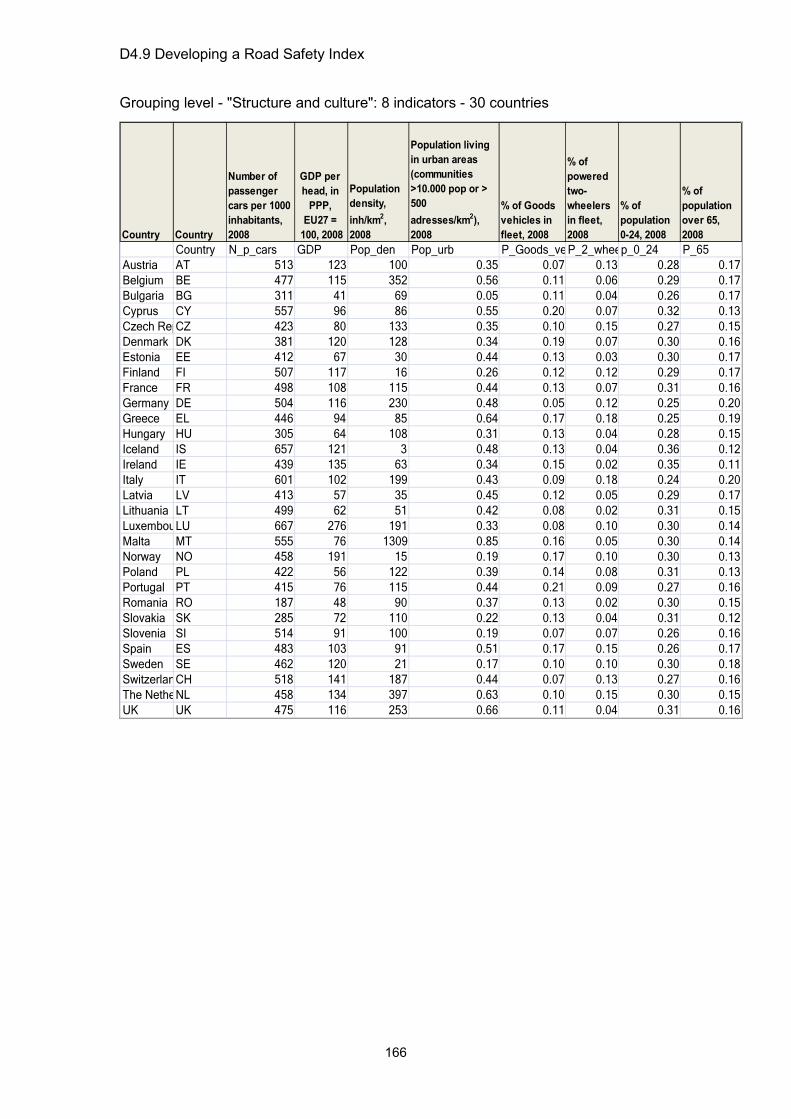
D4.9 Developing a Road Safety Index
166
Grouping level - "Structure and culture": 8 indicators - 30 countries
Country Country
Number of passenger cars per 1000 inhabitants, 2008
GDP per head, in
PPP, EU27 =
100, 2008
Population density, inh/km2, 2008
Population living in urban areas (communities >10.000 pop or > 500 adresses/km2), 2008
% of Goods vehicles in fleet, 2008
% of powered two-wheelers in fleet, 2008
% of population 0-24, 2008
% of population over 65, 2008
Country N_p_cars GDP Pop_den Pop_urb P_Goods_veP_2_wheep_0_24 P_65Austria AT 513 123 100 0.35 0.07 0.13 0.28 0.17Belgium BE 477 115 352 0.56 0.11 0.06 0.29 0.17Bulgaria BG 311 41 69 0.05 0.11 0.04 0.26 0.17Cyprus CY 557 96 86 0.55 0.20 0.07 0.32 0.13Czech RepCZ 423 80 133 0.35 0.10 0.15 0.27 0.15Denmark DK 381 120 128 0.34 0.19 0.07 0.30 0.16Estonia EE 412 67 30 0.44 0.13 0.03 0.30 0.17Finland FI 507 117 16 0.26 0.12 0.12 0.29 0.17France FR 498 108 115 0.44 0.13 0.07 0.31 0.16Germany DE 504 116 230 0.48 0.05 0.12 0.25 0.20Greece EL 446 94 85 0.64 0.17 0.18 0.25 0.19Hungary HU 305 64 108 0.31 0.13 0.04 0.28 0.15Iceland IS 657 121 3 0.48 0.13 0.04 0.36 0.12Ireland IE 439 135 63 0.34 0.15 0.02 0.35 0.11Italy IT 601 102 199 0.43 0.09 0.18 0.24 0.20Latvia LV 413 57 35 0.45 0.12 0.05 0.29 0.17Lithuania LT 499 62 51 0.42 0.08 0.02 0.31 0.15LuxembouLU 667 276 191 0.33 0.08 0.10 0.30 0.14Malta MT 555 76 1309 0.85 0.16 0.05 0.30 0.14Norway NO 458 191 15 0.19 0.17 0.10 0.30 0.13Poland PL 422 56 122 0.39 0.14 0.08 0.31 0.13Portugal PT 415 76 115 0.44 0.21 0.09 0.27 0.16Romania RO 187 48 90 0.37 0.13 0.02 0.30 0.15Slovakia SK 285 72 110 0.22 0.13 0.04 0.31 0.12Slovenia SI 514 91 100 0.19 0.07 0.07 0.26 0.16Spain ES 483 103 91 0.51 0.17 0.15 0.26 0.17Sweden SE 462 120 21 0.17 0.10 0.10 0.30 0.18SwitzerlanCH 518 141 187 0.44 0.07 0.13 0.27 0.16The NetheNL 458 134 397 0.63 0.10 0.15 0.30 0.15UK UK 475 116 253 0.66 0.11 0.04 0.31 0.16
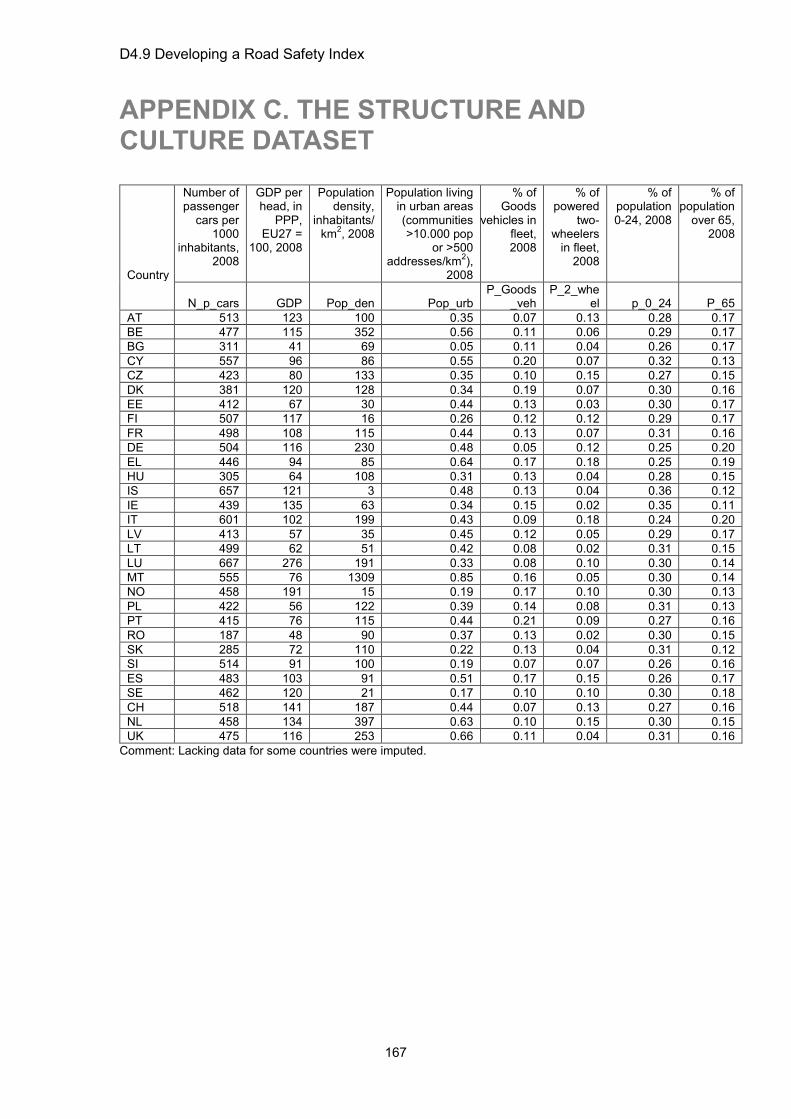
D4.9 Developing a Road Safety Index
167
APPENDIX C. THE STRUCTURE AND CULTURE DATASET
Country
Number of passenger
cars per 1000
inhabitants, 2008
GDP per head, in
PPP, EU27 =
100, 2008
Population density,
inhabitants/km2, 2008
Population living in urban areas (communities >10.000 pop
or >500 addresses/km2),
2008
% of Goods
vehicles in fleet, 2008
% of powered
two-wheelers
in fleet, 2008
% of population 0-24, 2008
% of population
over 65, 2008
N_p_cars GDP Pop_den Pop_urb
P_Goods_veh
P_2_wheel p_0_24 P_65
AT 513 123 100 0.35 0.07 0.13 0.28 0.17 BE 477 115 352 0.56 0.11 0.06 0.29 0.17 BG 311 41 69 0.05 0.11 0.04 0.26 0.17 CY 557 96 86 0.55 0.20 0.07 0.32 0.13 CZ 423 80 133 0.35 0.10 0.15 0.27 0.15 DK 381 120 128 0.34 0.19 0.07 0.30 0.16 EE 412 67 30 0.44 0.13 0.03 0.30 0.17 FI 507 117 16 0.26 0.12 0.12 0.29 0.17 FR 498 108 115 0.44 0.13 0.07 0.31 0.16 DE 504 116 230 0.48 0.05 0.12 0.25 0.20 EL 446 94 85 0.64 0.17 0.18 0.25 0.19 HU 305 64 108 0.31 0.13 0.04 0.28 0.15 IS 657 121 3 0.48 0.13 0.04 0.36 0.12 IE 439 135 63 0.34 0.15 0.02 0.35 0.11 IT 601 102 199 0.43 0.09 0.18 0.24 0.20 LV 413 57 35 0.45 0.12 0.05 0.29 0.17 LT 499 62 51 0.42 0.08 0.02 0.31 0.15 LU 667 276 191 0.33 0.08 0.10 0.30 0.14 MT 555 76 1309 0.85 0.16 0.05 0.30 0.14 NO 458 191 15 0.19 0.17 0.10 0.30 0.13 PL 422 56 122 0.39 0.14 0.08 0.31 0.13 PT 415 76 115 0.44 0.21 0.09 0.27 0.16 RO 187 48 90 0.37 0.13 0.02 0.30 0.15 SK 285 72 110 0.22 0.13 0.04 0.31 0.12 SI 514 91 100 0.19 0.07 0.07 0.26 0.16 ES 483 103 91 0.51 0.17 0.15 0.26 0.17 SE 462 120 21 0.17 0.10 0.10 0.30 0.18 CH 518 141 187 0.44 0.07 0.13 0.27 0.16 NL 458 134 397 0.63 0.10 0.15 0.30 0.15 UK 475 116 253 0.66 0.11 0.04 0.31 0.16
Comment: Lacking data for some countries were imputed.
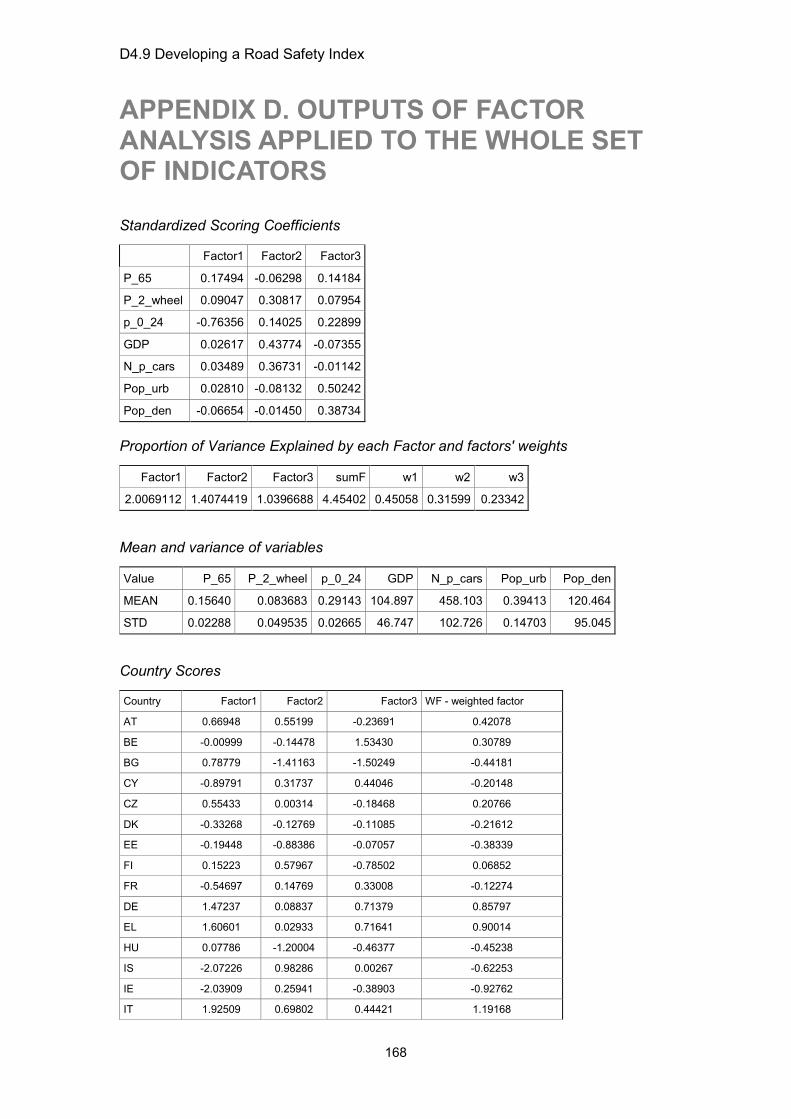
D4.9 Developing a Road Safety Index
168
APPENDIX D. OUTPUTS OF FACTOR ANALYSIS APPLIED TO THE WHOLE SET OF INDICATORS
Standardized Scoring Coefficients
Factor1 Factor2 Factor3
P_65 0.17494 -0.06298 0.14184
P_2_wheel 0.09047 0.30817 0.07954
p_0_24 -0.76356 0.14025 0.22899
GDP 0.02617 0.43774 -0.07355
N_p_cars 0.03489 0.36731 -0.01142
Pop_urb 0.02810 -0.08132 0.50242
Pop_den -0.06654 -0.01450 0.38734 Proportion of Variance Explained by each Factor and factors' weights
Factor1 Factor2 Factor3 sumF w1 w2 w3
2.0069112 1.4074419 1.0396688 4.45402 0.45058 0.31599 0.23342
Mean and variance of variables
Value P_65 P_2_wheel p_0_24 GDP N_p_cars Pop_urb Pop_den
MEAN 0.15640 0.083683 0.29143 104.897 458.103 0.39413 120.464
STD 0.02288 0.049535 0.02665 46.747 102.726 0.14703 95.045
Country Scores
Country Factor1 Factor2 Factor3 WF - weighted factor
AT 0.66948 0.55199 -0.23691 0.42078
BE -0.00999 -0.14478 1.53430 0.30789
BG 0.78779 -1.41163 -1.50249 -0.44181
CY -0.89791 0.31737 0.44046 -0.20148
CZ 0.55433 0.00314 -0.18468 0.20766
DK -0.33268 -0.12769 -0.11085 -0.21612
EE -0.19448 -0.88386 -0.07057 -0.38339
FI 0.15223 0.57967 -0.78502 0.06852
FR -0.54697 0.14769 0.33008 -0.12274
DE 1.47237 0.08837 0.71379 0.85797
EL 1.60601 0.02933 0.71641 0.90014
HU 0.07786 -1.20004 -0.46377 -0.45238
IS -2.07226 0.98286 0.00267 -0.62253
IE -2.03909 0.25941 -0.38903 -0.92762
IT 1.92509 0.69802 0.44421 1.19168

D4.9 Developing a Road Safety Index
169
Country Factor1 Factor2 Factor3 WF - weighted factor
LV 0.02648 -0.89974 -0.02570 -0.27838
LT -0.54092 -0.53900 -0.10317 -0.43813
LU -0.17791 2.55073 -0.24873 0.66779
MT -1.32703 -0.44724 6.36365 0.74615
NO -0.46730 1.16541 -1.31783 -0.14990
PL -0.74719 -0.46674 0.08600 -0.46408
PT 0.50237 -0.52913 0.06859 0.07517
RO -0.40609 -1.86796 -0.21019 -0.82231
SK -1.02066 -0.91223 -0.70168 -0.91194
SI 0.84913 -0.08581 -1.00474 0.12096
ES 1.19905 0.23014 0.15609 0.64943
SE 0.02878 0.40113 -0.99309 -0.09209
CH 0.62458 0.67885 0.33153 0.57332
NL -0.32669 0.56149 2.00387 0.49797
UK -0.69542 -0.17698 1.52044 -0.01437
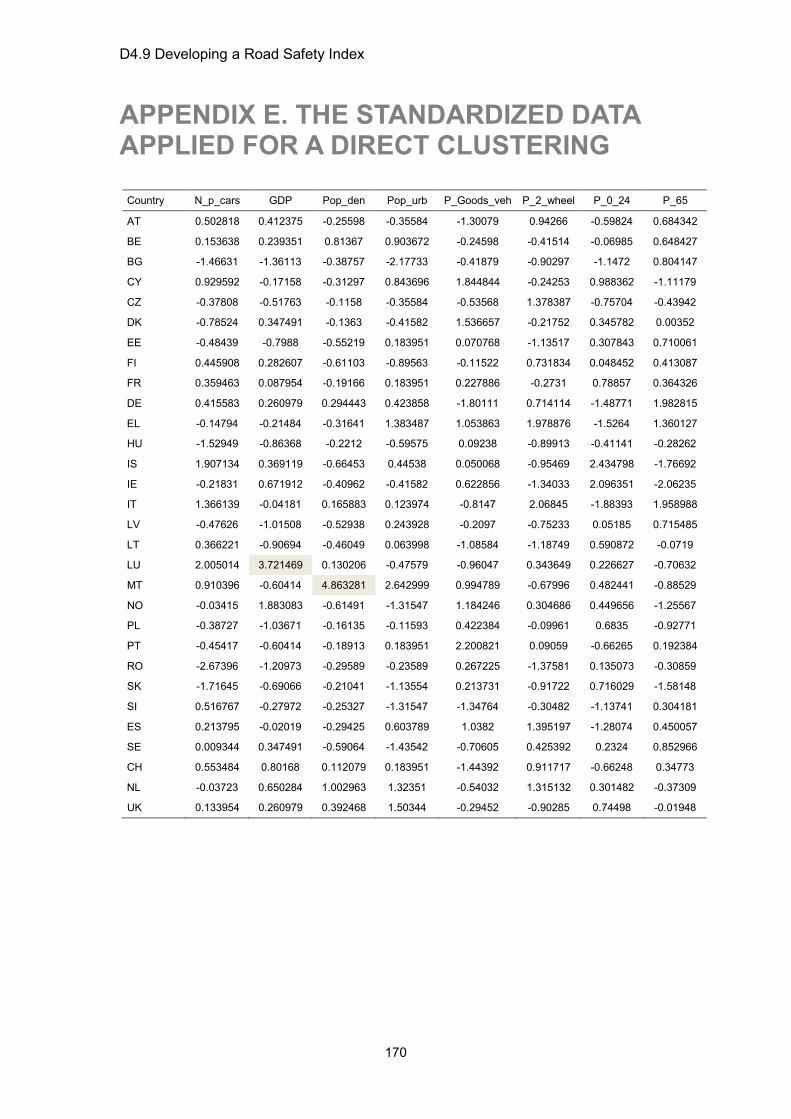
D4.9 Developing a Road Safety Index
170
APPENDIX E. THE STANDARDIZED DATA APPLIED FOR A DIRECT CLUSTERING
Country N_p_cars GDP Pop_den Pop_urb P_Goods_veh P_2_wheel P_0_24 P_65
AT 0.502818 0.412375 -0.25598 -0.35584 -1.30079 0.94266 -0.59824 0.684342
BE 0.153638 0.239351 0.81367 0.903672 -0.24598 -0.41514 -0.06985 0.648427
BG -1.46631 -1.36113 -0.38757 -2.17733 -0.41879 -0.90297 -1.1472 0.804147
CY 0.929592 -0.17158 -0.31297 0.843696 1.844844 -0.24253 0.988362 -1.11179
CZ -0.37808 -0.51763 -0.1158 -0.35584 -0.53568 1.378387 -0.75704 -0.43942
DK -0.78524 0.347491 -0.1363 -0.41582 1.536657 -0.21752 0.345782 0.00352
EE -0.48439 -0.7988 -0.55219 0.183951 0.070768 -1.13517 0.307843 0.710061
FI 0.445908 0.282607 -0.61103 -0.89563 -0.11522 0.731834 0.048452 0.413087
FR 0.359463 0.087954 -0.19166 0.183951 0.227886 -0.2731 0.78857 0.364326
DE 0.415583 0.260979 0.294443 0.423858 -1.80111 0.714114 -1.48771 1.982815
EL -0.14794 -0.21484 -0.31641 1.383487 1.053863 1.978876 -1.5264 1.360127
HU -1.52949 -0.86368 -0.2212 -0.59575 0.09238 -0.89913 -0.41141 -0.28262
IS 1.907134 0.369119 -0.66453 0.44538 0.050068 -0.95469 2.434798 -1.76692
IE -0.21831 0.671912 -0.40962 -0.41582 0.622856 -1.34033 2.096351 -2.06235
IT 1.366139 -0.04181 0.165883 0.123974 -0.8147 2.06845 -1.88393 1.958988
LV -0.47626 -1.01508 -0.52938 0.243928 -0.2097 -0.75233 0.05185 0.715485
LT 0.366221 -0.90694 -0.46049 0.063998 -1.08584 -1.18749 0.590872 -0.0719
LU 2.005014 3.721469 0.130206 -0.47579 -0.96047 0.343649 0.226627 -0.70632
MT 0.910396 -0.60414 4.863281 2.642999 0.994789 -0.67996 0.482441 -0.88529
NO -0.03415 1.883083 -0.61491 -1.31547 1.184246 0.304686 0.449656 -1.25567
PL -0.38727 -1.03671 -0.16135 -0.11593 0.422384 -0.09961 0.6835 -0.92771
PT -0.45417 -0.60414 -0.18913 0.183951 2.200821 0.09059 -0.66265 0.192384
RO -2.67396 -1.20973 -0.29589 -0.23589 0.267225 -1.37581 0.135073 -0.30859
SK -1.71645 -0.69066 -0.21041 -1.13554 0.213731 -0.91722 0.716029 -1.58148
SI 0.516767 -0.27972 -0.25327 -1.31547 -1.34764 -0.30482 -1.13741 0.304181
ES 0.213795 -0.02019 -0.29425 0.603789 1.0382 1.395197 -1.28074 0.450057
SE 0.009344 0.347491 -0.59064 -1.43542 -0.70605 0.425392 0.2324 0.852966
CH 0.553484 0.80168 0.112079 0.183951 -1.44392 0.911717 -0.66248 0.34773
NL -0.03723 0.650284 1.002963 1.32351 -0.54032 1.315132 0.301482 -0.37309
UK 0.133954 0.260979 0.392468 1.50344 -0.29452 -0.90285 0.74498 -0.01948

D4.9 Developing a Road Safety Index
171
APPENDIX F. EXPLORING COUNTRY CLASSIFICATION BASED ON HOFSTEDE’S CULTURAL SCORES
The purpose of this analysis was to explore the country classification into homogeneous groups, using Hofstede's cultural scores (see Section 7.5).
Data
The data on Hofstede's cultural values of European countries were taken from the site: http://geert-hofstede.com/countries.html.
The data collected from the site are presented in Table F.1. Those are scores in the range of 0-100. No information was available for four countries: CY, LT, LV, IS; thus, the dataset included information on 26 countries only.
Table F.1. The dataset with Hofstede's cultural scores of European countries
Country
Hofstede power distance
Hofstede individualism versus collectivism
Hofstede uncertainty avoidance
Hofstede long-term versus short-term orientation
Hofstede indulgence versus restraint
Hof_pd Hof_ind Hof_un Hof_or --
AT 11 55 79 70 31 BE 65 75 54 94 38 BG 70 30 40 85 no score CH 34 68 70 58 40 CZ 57 58 57 74 13 DE 35 67 66 65 31 DK 18 74 16 23 46 EE 40 60 30 60 no score EL 60 35 57 112 no score ES 57 51 42 86 19 FI 33 63 26 59 41 FR 68 71 43 86 39 HU 46 80 88 82 50 IE 28 70 68 35 43 IT 50 76 70 75 34 LU 40 60 50 70 no score MT 56 59 47 96 no score NL 38 80 14 53 44 NO 31 69 8 50 44 PL 68 60 64 93 32 PT 63 27 31 104 30 RO 90 30 42 90 no score SE 31 71 5 29 20 SI 71 27 19 88 no score SK 104 52 110 51 38 UK 35 89 66 35 25
The index of "indulgence versus restraint" was dropped from the analysis due to a high number of missing values.

D4.9 Developing a Road Safety Index
172
Analysis
A factor analysis was carried out on the dataset. Due to outlying values of some variables, MT, LU and SK were excluded from the factoring (but later added to the final country classification).
The initial data analysis demonstrated a high correlation7 between three variables: "power distance", "individualism versus collectivism" and "long-term versus short-term orientation", where "individualism versus collectivism" was negatively correlated with two other variables and a positive correlation was observed between "power distance" and "long-term versus short-term orientation".
In addition, a high correlation was found between the aforementioned three measures and GDP, where a correlation with GDP was negative for "power distance" and "long-term versus short-term orientation" variables (at 0.005 level of significance) and positive for "individualism versus collectivism" measure (at 0.05 level of significance).
In contrast, the "uncertainty avoidance" measure was not correlated with other variables and with GDP.
The factor analysis demonstrated a possibility of loading the four measures by two factors, where the first factor is loaded by three variables: "power distance", "individualism versus collectivism" and "long-term versus short-term orientation", and the second factor by one variable - "uncertainty avoidance". Due to a negative correlation between "individualism versus collectivism" and other two variables that can be loaded by the same factor, a reverse value of this variable was further applied.
To improve visualization of the results of country grouping - final plotting the countries on a two-dimensional map of country characteristics, based on the conclusions of the factor analysis, two new Hofstede variables were created.
To create the new variables the original variables were standardized and then averaged as follows:
S_Hof_pd = (Hof_pd - 47.78)/19.74; S_Hof_ind_R = (Hof_ind_R - 39.74)/18.56; S_Hof_or = (Hof_or - 69.83)/24.39; S_Hof_un = (Hof_un - 45.87)/23.98; S_Hof_1 = (1/0.88)*mean of (S_Hof_pd, S_Hof_ind_R, S_Hof_or); S_Hof_2 = S_Hof_un; Where:
"1/0.88" is used for setting the standard deviation of new variables to "1";
Hof_pd is "power distance", Hof_ind_R is an inverse value of "individualism versus collectivism", Hof_or is "long-term versus short-term orientation", Hof_un is "uncertainty avoidance";
"S_" addition indicates a standardized value;
"mean" is the average of three values;
S_Hof_1 and S_Hof_2 are the new Hofstede variables. 7 According to Pearson correlation coefficients, at the 0.005 level.

D4.9 Developing a Road Safety Index
173
Using the new variables, country grouping (clustering) was performed. The clustering was carried out using two methods: k-means and Ward's hierarchical clustering with Euclidean distance matrix. By both methods, a three-cluster solution was selected.
Results
Figure F.1 presents, for example, a dendogram - classification tree created by the Ward method, with three country groups indicated.
EE
FID
KS
EN
LN
OS
KIE U
K IT CH
DE AT
HU S
IR
OB
GP
T EL
PL
MT
ES
FRLU
BE
CZ
02
46
810
12
Cluster Dendrogram
Hei
ght
Figure F.1. Countries' classification tree produced by the Ward hierarchical clustering, based on the new Hofstede variables.
Figure F.2 demonstrates the countries' positions on a two-dimensional map of the new Hofstede variables, where the countries are given in colours indicating their belonging to different groups. Reference lines are added at S_Hof_1=0 and S_Hof_2=0.8, underlying the differences between the groups. It can be seen that:
Group 1 (in black) includes 8 countries and is characterized by a moderate value of the first variable (a combination of "power distance" or inequality between the people, "long-term versus short-term orientation" and the inverse of "individualism versus collectivism") and a highest value of the second variable ("uncertainty avoidance");
Group 2 (in red) includes 12 countries and is characterized by a highest value of the first variable and a medium value of the second one;
Group 3 (in green) includes 6 countries and is characterized by a moderate value of the first variable and a lowest value of the second one.
The composition of the groups received based on Hofstede cultural indices is different from those received based on the countries' background characteristics (see Section 7.4 of the report body), where, for example, the group of ten countries with lower level of economic development, defined by the main analysis, is actually "dispersed" across various country groups in Figure F.2.
A combined consideration of several cultural indices does not produce results consistent with countries' subdivision in accordance with their background characteristics (the "Culture and Structure" indicators). Yet, a separate consideration of some cultural indices may provide results going in line with some background
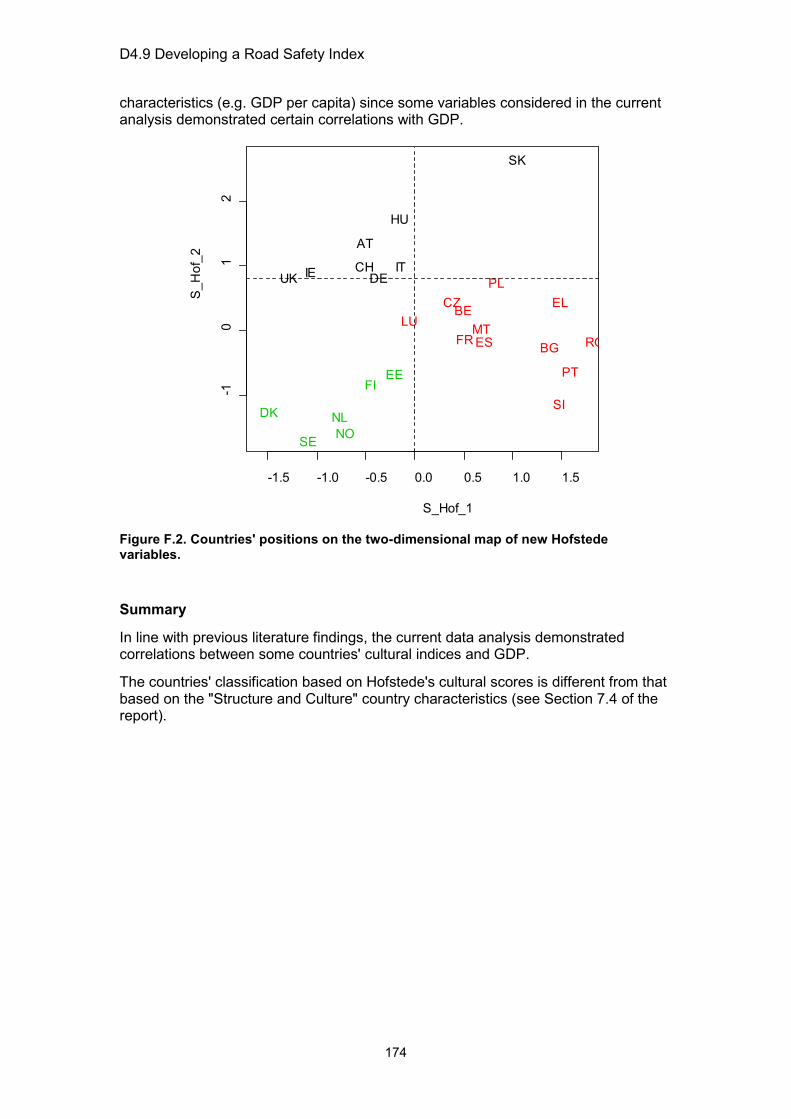
D4.9 Developing a Road Safety Index
174
characteristics (e.g. GDP per capita) since some variables considered in the current analysis demonstrated certain correlations with GDP.
-1.5 -1.0 -0.5 0.0 0.5 1.0 1.5
-10
12
S_Hof_1
S_H
of_2
AT
BE
BG
CH
CZ
DE
DK
EE
EL
ES
FI
FR
HU
IE IT
LU MT
NLNO
PL
PT
RO
SE
SI
SK
UK
Figure F.2. Countries' positions on the two-dimensional map of new Hofstede variables.
Summary
In line with previous literature findings, the current data analysis demonstrated correlations between some countries' cultural indices and GDP.
The countries' classification based on Hofstede's cultural scores is different from that based on the "Structure and Culture" country characteristics (see Section 7.4 of the report).

D4.9 Developing a Road Safety Index
175
APPENDIX G. USING DEA FOR COMPOSITE INDEX CONSTRUCTION
Data envelopment analysis (DEA) initially developed by Charnes, Cooper and Rhodes (1978) is a frontier analysis technique that employs linear programming tools to estimate the relations between multiple inputs and multiple outputs by constructing an efficient production frontier and to assess the so-called relative efficiency of a homogeneous set of decision making units (DMUs), or countries in this study. Since its first introduction in 1978, DEA has been quickly recognized as a powerful analytical research tool for modeling operational processes in terms of performance evaluation, benchmarking, and decision making, and it has been successfully applied to a host of different types of entities engaged in a wide variety of activities in many contexts (e.g., Cooper et al., 2004; Emrouznejad et al., 2008; Cook and Seiford, 2009). In recent years, DEA has also received considerable attention in the construction of composite indices due to its prominent advantages over other traditional methods (see e.g., Hermans et al., 2008). In the following sections, the basic DEA model, the DEA-based CI model, as well as the models which are used in this study, i.e., the multiple layer DEA-based CI model and the cross index method, are elaborated, respectively.
G.1. Basic DEA model Consider an n-DMUs set, each consuming m different inputs to produce s different outputs. The relative efficiency of a DMU is defined as the ratio of its total weighted output to its total weighted input, subjected to lie between zero and unity (with a higher value indicating a better relative performance). Mathematically, the efficiency score of a particular DMU0 can be obtained by solving the following so-called CCR (Charnes–Cooper–Rhodes) model:
01
0
01
1
1
max
. . 1, 1, ,
, 0, 1, , , 1, ,
=
=
=
=
=
≤ =
≥ = =
∑
∑
∑
∑
s
r rr
m
i iis
r rjr
m
i iji
r i
u yE
v x
u ys t j n
v x
u v r s i m
(1)
where yrj and xij are the rth output and ith input, respectively of the jth DMU, ur is the weight given to the rth output, vi is the weight given to the ith input. This fractional program is computed separately for each DMU to determine its best possible input and output weights. In other words, the weights in the objective function are chosen automatically from the model with the purpose of maximizing the value of DMU0’s efficiency ratio and meanwhile respecting the less than unity constraint for all the DMUs. Furthermore, such a fractional program can be converted into a linear program as follows:

D4.9 Developing a Road Safety Index
176
0 01
01
1 1
max
. . 1,
0, 1, ,
, 0, 1, , , 1, ,
=
=
= =
=
=
− ≤ =
≥ = =
∑
∑
∑ ∑
s
r rr
m
i iis m
r rj i ijr i
r i
E u y
s t v x
u y v x j n
u v r s i m
(2)
The transformation is completed by constraining the efficiency ratio denominator (i.e., the weighted sum of inputs) in (1) to a value of one. Thus the weighted sum of outputs will be maximized. In general, a DMU is considered to be efficient if it obtains a score of one whereas a score less than one implies that it is inefficient.
G.2. DEA-based CI model To use DEA for composite index construction, i.e., aggregating a set of individual indicators into one overall index, however, only inputs or outputs of the DMUs will be taken into account in the model. Mathematically, the DEA-based CI model can be realized by converting the basic DEA model in (2) into the following linear program problem, which is also known as the CCR model with constant inputs.
0 01
1
max
. . 1, 1, ,
0, 1, ,
s
r rr
s
r rjr
r
CI u y
s t u y j n
u r s
=
=
=
≤ =
≥ =
∑
∑
(3)
The n DMUs are now to be evaluated by combining s different outputs (or indicators) with higher values indicating better performance. This linear program is run n times to identify the optimal index score for all DMUs by selecting their best possible indicator weights separately, and the best-performing ones are those with an index score of one, while the others are underperforming.
G.3. Multiple layer DEA-based CI model In the basic DEA-based CI model, all the indicators are equally treated as they belong to the same layer. It is more acceptable when a low number of indicators is considered. As the amount grows, especially when a layered hierarchy is established (such as in this study), the hierarchical information on the indicators cannot be ignored arbitrarily. Consequently, a multiple layer DEA-based CI model (MLDEA-CI) should be applied, which is shown as follows (Shen et al., 2012):
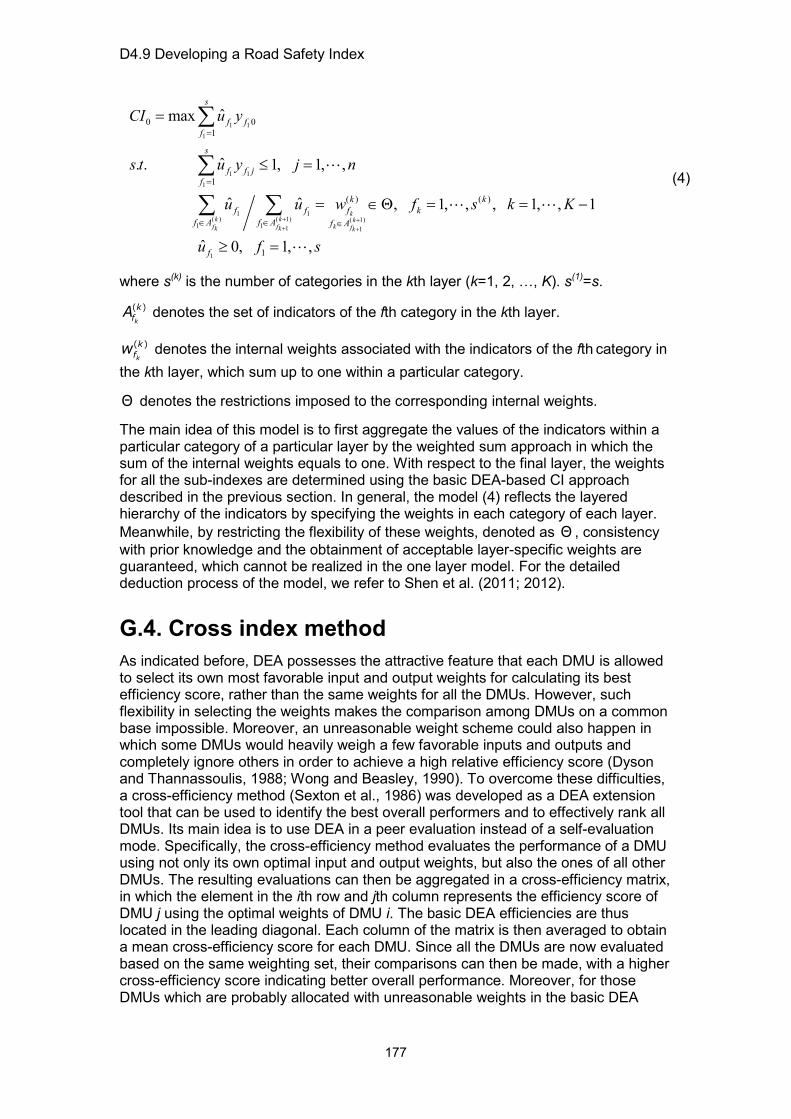
D4.9 Developing a Road Safety Index
177
1 1
1
1 1
1
1 1( ) ( 1) ( 1)
1 1 1 1
1
0 01
1
( ) ( )
1
ˆmax
ˆ. . 1, 1, ,
ˆ ˆ , 1, , , 1, , 1
ˆ 0, 1, ,
+ ++ +
=
=
∈ ∈ ∈
=
≤ =
= ∈Θ = = −
≥ =
∑
∑
∑ ∑
kk k k
kf f fk k k
s
f ff
s
f f jf
k kf f f k
f A f A f A
f
CI u y
s t u y j n
u u w f s k K
u f s
(4)
where s(k) is the number of categories in the kth layer (k=1, 2, …, K). s(1)=s. ( )k
kfA denotes the set of indicators of the fth category in the kth layer.
( )k
kfw denotes the internal weights associated with the indicators of the fth category in
the kth layer, which sum up to one within a particular category.
Θ denotes the restrictions imposed to the corresponding internal weights.
The main idea of this model is to first aggregate the values of the indicators within a particular category of a particular layer by the weighted sum approach in which the sum of the internal weights equals to one. With respect to the final layer, the weights for all the sub-indexes are determined using the basic DEA-based CI approach described in the previous section. In general, the model (4) reflects the layered hierarchy of the indicators by specifying the weights in each category of each layer. Meanwhile, by restricting the flexibility of these weights, denoted as Θ , consistency with prior knowledge and the obtainment of acceptable layer-specific weights are guaranteed, which cannot be realized in the one layer model. For the detailed deduction process of the model, we refer to Shen et al. (2011; 2012).
G.4. Cross index method As indicated before, DEA possesses the attractive feature that each DMU is allowed to select its own most favorable input and output weights for calculating its best efficiency score, rather than the same weights for all the DMUs. However, such flexibility in selecting the weights makes the comparison among DMUs on a common base impossible. Moreover, an unreasonable weight scheme could also happen in which some DMUs would heavily weigh a few favorable inputs and outputs and completely ignore others in order to achieve a high relative efficiency score (Dyson and Thannassoulis, 1988; Wong and Beasley, 1990). To overcome these difficulties, a cross-efficiency method (Sexton et al., 1986) was developed as a DEA extension tool that can be used to identify the best overall performers and to effectively rank all DMUs. Its main idea is to use DEA in a peer evaluation instead of a self-evaluation mode. Specifically, the cross-efficiency method evaluates the performance of a DMU using not only its own optimal input and output weights, but also the ones of all other DMUs. The resulting evaluations can then be aggregated in a cross-efficiency matrix, in which the element in the ith row and jth column represents the efficiency score of DMU j using the optimal weights of DMU i. The basic DEA efficiencies are thus located in the leading diagonal. Each column of the matrix is then averaged to obtain a mean cross-efficiency score for each DMU. Since all the DMUs are now evaluated based on the same weighting set, their comparisons can then be made, with a higher cross-efficiency score indicating better overall performance. Moreover, for those DMUs which are probably allocated with unreasonable weights in the basic DEA
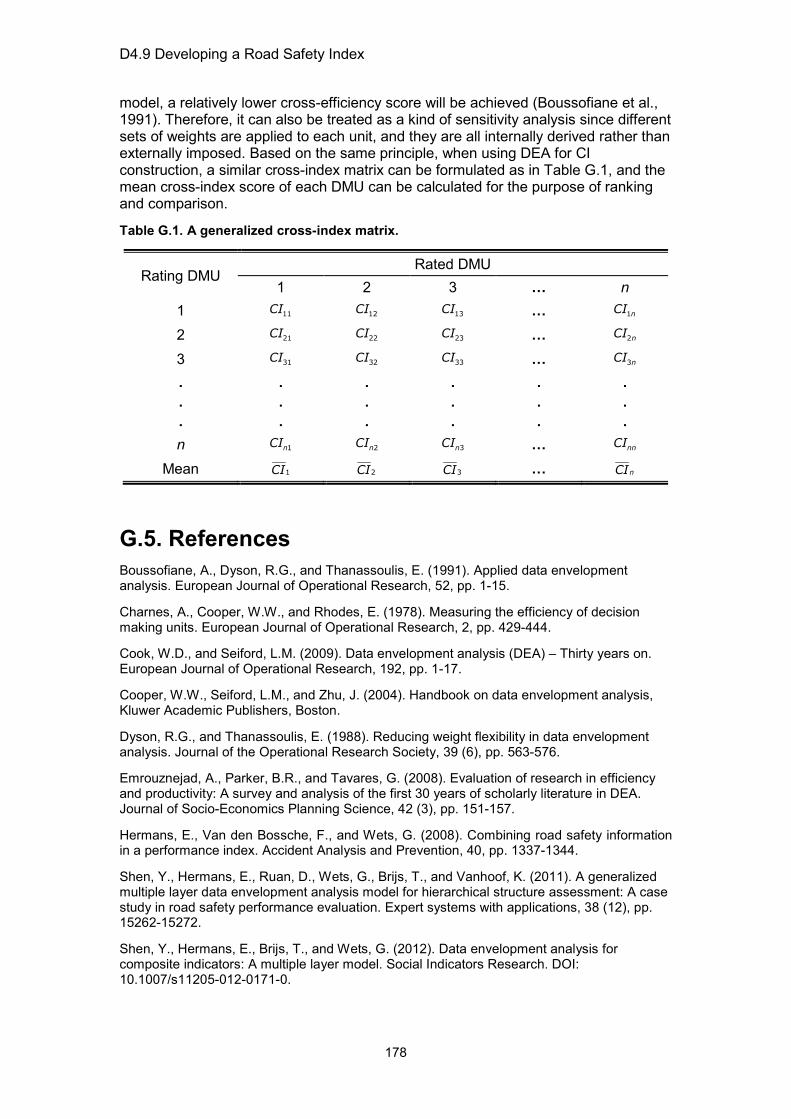
D4.9 Developing a Road Safety Index
178
model, a relatively lower cross-efficiency score will be achieved (Boussofiane et al., 1991). Therefore, it can also be treated as a kind of sensitivity analysis since different sets of weights are applied to each unit, and they are all internally derived rather than externally imposed. Based on the same principle, when using DEA for CI construction, a similar cross-index matrix can be formulated as in Table G.1, and the mean cross-index score of each DMU can be calculated for the purpose of ranking and comparison.
Table G.1. A generalized cross-index matrix.
Rating DMU Rated DMU
1 2 3 … n 1 11CI 12CI 13CI … 1nCI 2 21CI 22CI 23CI … 2nCI 3 31CI 32CI 33CI … 3nCI . . .
.
.
.
.
.
.
.
.
.
.
.
.
.
.
. n 1nCI 2nCI 3nCI … nnCI
Mean 1CI 2CI 3CI … nCI
G.5. References Boussofiane, A., Dyson, R.G., and Thanassoulis, E. (1991). Applied data envelopment analysis. European Journal of Operational Research, 52, pp. 1-15.
Charnes, A., Cooper, W.W., and Rhodes, E. (1978). Measuring the efficiency of decision making units. European Journal of Operational Research, 2, pp. 429-444.
Cook, W.D., and Seiford, L.M. (2009). Data envelopment analysis (DEA) – Thirty years on. European Journal of Operational Research, 192, pp. 1-17.
Cooper, W.W., Seiford, L.M., and Zhu, J. (2004). Handbook on data envelopment analysis, Kluwer Academic Publishers, Boston.
Dyson, R.G., and Thanassoulis, E. (1988). Reducing weight flexibility in data envelopment analysis. Journal of the Operational Research Society, 39 (6), pp. 563-576.
Emrouznejad, A., Parker, B.R., and Tavares, G. (2008). Evaluation of research in efficiency and productivity: A survey and analysis of the first 30 years of scholarly literature in DEA. Journal of Socio-Economics Planning Science, 42 (3), pp. 151-157.
Hermans, E., Van den Bossche, F., and Wets, G. (2008). Combining road safety information in a performance index. Accident Analysis and Prevention, 40, pp. 1337-1344.
Shen, Y., Hermans, E., Ruan, D., Wets, G., Brijs, T., and Vanhoof, K. (2011). A generalized multiple layer data envelopment analysis model for hierarchical structure assessment: A case study in road safety performance evaluation. Expert systems with applications, 38 (12), pp. 15262-15272.
Shen, Y., Hermans, E., Brijs, T., and Wets, G. (2012). Data envelopment analysis for composite indicators: A multiple layer model. Social Indicators Research. DOI: 10.1007/s11205-012-0171-0.

D4.9 Developing a Road Safety Index
179
Sexton, T.R., Silkman, R.H., and Hogan, A.J. (1986). Data envelopment analysis: critique and extensions. In: Silkman, R.H. (Ed.). Measuring Efficiency: An Assessment of Data Envelopment Analysis. Jossey-Bass, San Francisco, pp. 73-104.
Wong, Y.H.B., and Beasley, J.E. (1990). Restricting weight flexibility in data envelopment analysis. Journal of the Operational Research Society, 41 (9), pp. 829-835.
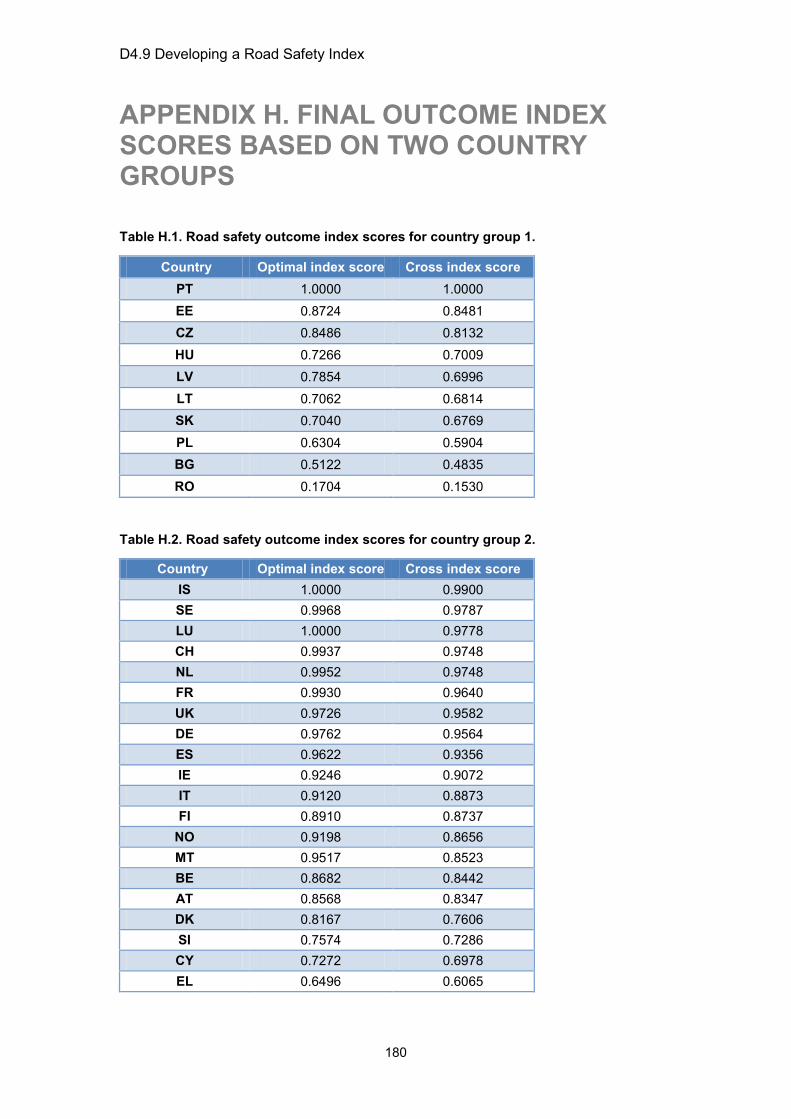
D4.9 Developing a Road Safety Index
180
APPENDIX H. FINAL OUTCOME INDEX SCORES BASED ON TWO COUNTRY GROUPS
Table H.1. Road safety outcome index scores for country group 1.
Country Optimal index score Cross index score PT 1.0000 1.0000 EE 0.8724 0.8481 CZ 0.8486 0.8132 HU 0.7266 0.7009 LV 0.7854 0.6996 LT 0.7062 0.6814 SK 0.7040 0.6769 PL 0.6304 0.5904 BG 0.5122 0.4835 RO 0.1704 0.1530
Table H.2. Road safety outcome index scores for country group 2.
Country Optimal index score Cross index score IS 1.0000 0.9900 SE 0.9968 0.9787 LU 1.0000 0.9778 CH 0.9937 0.9748 NL 0.9952 0.9748 FR 0.9930 0.9640 UK 0.9726 0.9582 DE 0.9762 0.9564 ES 0.9622 0.9356 IE 0.9246 0.9072 IT 0.9120 0.8873 FI 0.8910 0.8737
NO 0.9198 0.8656 MT 0.9517 0.8523 BE 0.8682 0.8442 AT 0.8568 0.8347 DK 0.8167 0.7606 SI 0.7574 0.7286 CY 0.7272 0.6978 EL 0.6496 0.6065
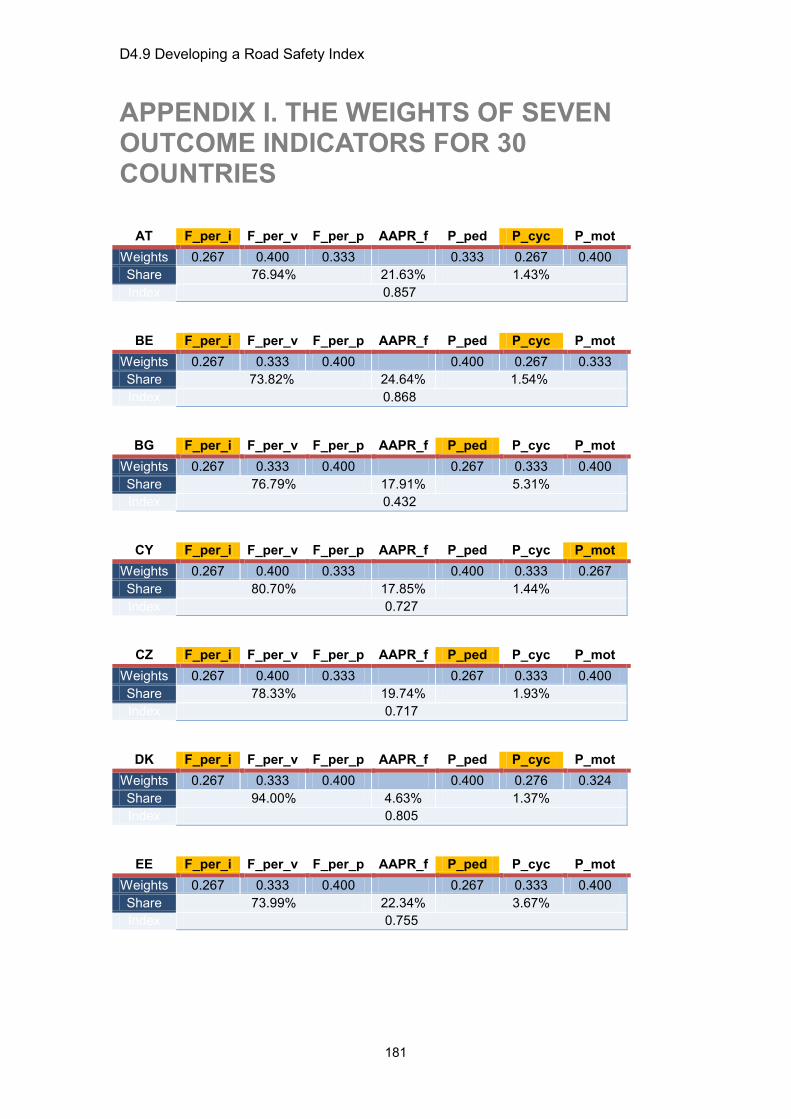
D4.9 Developing a Road Safety Index
181
APPENDIX I. THE WEIGHTS OF SEVEN OUTCOME INDICATORS FOR 30 COUNTRIES
AT F_per_i F_per_v F_per_p AAPR_f P_ped P_cyc P_mot Weights 0.267 0.400 0.333 0.333 0.267 0.400 Share 76.94% 21.63% 1.43% Index 0.857
BE F_per_i F_per_v F_per_p AAPR_f P_ped P_cyc P_mot Weights 0.267 0.333 0.400 0.400 0.267 0.333 Share 73.82% 24.64% 1.54% Index 0.868
BG F_per_i F_per_v F_per_p AAPR_f P_ped P_cyc P_mot Weights 0.267 0.333 0.400 0.267 0.333 0.400 Share 76.79% 17.91% 5.31% Index 0.432
CY F_per_i F_per_v F_per_p AAPR_f P_ped P_cyc P_mot Weights 0.267 0.400 0.333 0.400 0.333 0.267 Share 80.70% 17.85% 1.44% Index 0.727
CZ F_per_i F_per_v F_per_p AAPR_f P_ped P_cyc P_mot Weights 0.267 0.400 0.333 0.267 0.333 0.400 Share 78.33% 19.74% 1.93% Index 0.717
DK F_per_i F_per_v F_per_p AAPR_f P_ped P_cyc P_mot Weights 0.267 0.333 0.400 0.400 0.276 0.324 Share 94.00% 4.63% 1.37% Index 0.805
EE F_per_i F_per_v F_per_p AAPR_f P_ped P_cyc P_mot Weights 0.267 0.333 0.400 0.267 0.333 0.400 Share 73.99% 22.34% 3.67% Index 0.755

D4.9 Developing a Road Safety Index
182
FI F_per_i F_per_v F_per_p AAPR_f P_ped P_cyc P_mot Weights 0.267 0.333 0.400 0.333 0.267 0.400 Share 81.56% 16.90% 1.54% Index 0.891
FR F_per_i F_per_v F_per_p AAPR_f P_ped P_cyc P_mot Weights 0.400 0.267 0.333 0.400 0.333 0.267 Share 61.87% 36.79% 1.35% Index 0.991
DE F_per_i F_per_v F_per_p AAPR_f P_ped P_cyc P_mot Weights 0.400 0.267 0.333 0.400 0.267 0.333 Share 72.94% 25.84% 1.23% Index 0.976
EL F_per_i F_per_v F_per_p AAPR_f P_ped P_cyc P_mot Weights 0.267 0.400 0.333 0.333 0.400 0.267 Share 73.46% 22.05% 4.49% Index 0.645
HU F_per_i F_per_v F_per_p AAPR_f P_ped P_cyc P_mot Weights 0.333 0.400 0.267 0.267 0.333 0.400 Share 71.01% 24.89% 4.11% Index 0.629
IS F_per_i F_per_v F_per_p AAPR_f P_ped P_cyc P_mot Weights 0.333 0.267 0.400 0.400 0.276 0.324 Share 91.36% 6.79% 1.85% Index 1.000
IE F_per_i F_per_v F_per_p AAPR_f P_ped P_cyc P_mot Weights 0.267 0.333 0.400 0.267 0.333 0.400 Share 77.59% 20.56% 1.84% Index 0.925
IT F_per_i F_per_v F_per_p AAPR_f P_ped P_cyc P_mot Weights 0.267 0.400 0.333 0.400 0.333 0.267 Share 76.51% 22.18% 1.31% Index 0.912
LV F_per_i F_per_v F_per_p AAPR_f P_ped P_cyc P_mot Weights 0.267 0.333 0.400 0.267 0.333 0.400 Share 47.16% 47.16% 5.68% Index 0.719

D4.9 Developing a Road Safety Index
183
LT F_per_i F_per_v F_per_p AAPR_f P_ped P_cyc P_mot Weights 0.267 0.333 0.400 0.267 0.400 0.333 Share 56.13% 37.80% 6.07% Index 0.645
LU F_per_i F_per_v F_per_p AAPR_f P_ped P_cyc P_mot Weights 0.267 0.400 0.333 0.333 0.267 0.400 Share 59.71% 38.66% 1.63% Index 1.000
MT F_per_i F_per_v F_per_p AAPR_f P_ped P_cyc P_mot Weights 0.400 0.333 0.267 0.400 0.280 0.320 Share 96.22% 2.78% 1.00% Index 0.926
NO F_per_i F_per_v F_per_p AAPR_f P_ped P_cyc P_mot Weights 0.267 0.333 0.400 0.400 0.276 0.324 Share 93.71% 4.74% 1.55% Index 0.907
PL F_per_i F_per_v F_per_p AAPR_f P_ped P_cyc P_mot Weights 0.267 0.400 0.333 0.267 0.333 0.400 Share 77.13% 18.06% 4.81% Index 0.531
PT F_per_i F_per_v F_per_p AAPR_f P_ped P_cyc P_mot Weights 0.267 0.400 0.333 0.333 0.400 0.267 Share 57.49% 40.95% 1.57% Index 0.923
RO F_per_i F_per_v F_per_p AAPR_f P_ped P_cyc P_mot Weights 0.400 0.267 0.333 0.267 0.333 0.400 Share 54.42% 22.79% 22.79% Index 0.155
SK F_per_i F_per_v F_per_p AAPR_f P_ped P_cyc P_mot Weights 0.267 0.400 0.333 0.267 0.333 0.400 Share 76.51% 19.32% 4.17% Index 0.593
SI F_per_i F_per_v F_per_p AAPR_f P_ped P_cyc P_mot Weights 0.267 0.333 0.400 0.400 0.267 0.333 Share 79.10% 19.49% 1.41% Index 0.757

D4.9 Developing a Road Safety Index
184
ES F_per_i F_per_v F_per_p AAPR_f P_ped P_cyc P_mot Weights 0.400 0.333 0.267 0.333 0.400 0.267 Share 68.24% 30.10% 1.66% Index 0.962
SE F_per_i F_per_v F_per_p AAPR_f P_ped P_cyc P_mot Weights 0.400 0.267 0.333 0.400 0.267 0.333 Share 75.59% 23.06% 1.35% Index 0.997
CH F_per_i F_per_v F_per_p AAPR_f P_ped P_cyc P_mot Weights 0.400 0.333 0.267 0.400 0.267 0.333 Share 74.95% 23.99% 1.06% Index 0.994
NL F_per_i F_per_v F_per_p AAPR_f P_ped P_cyc P_mot Weights 0.400 0.333 0.267 0.400 0.267 0.333 Share 76.19% 22.81% 1.00% Index 0.995
UK F_per_i F_per_v F_per_p AAPR_f P_ped P_cyc P_mot Weights 0.400 0.267 0.333 0.333 0.267 0.400 Share 77.46% 21.35% 1.19% Index 0.973

D4.9 Developing a Road Safety Index
185
APPENDIX J. SAFETY PERFORMANCE INDEX SCORES BASED ON TWO COUNTRY GROUPS
Table J.1. Road safety performance index scores for country group 1.
Country Optimal index score Cross index score EE 1.0000 1.0000 CZ 0.9800 0.9417 HU 1.0000 0.9364 PT 0.9038 0.8632 SK 0.8980 0.8320 LT 0.8314 0.7695 BG 0.8206 0.7600 LV 0.7776 0.7311 PL 0.7344 0.6902 RO 0.5267 0.4795
Table J.2. Road safety performance index scores for country group 2.
Country Optimal index score Cross index score FI 1.0000 0.9996 SE 1.0000 0.9943 NO 0.9982 0.9911 FR 0.9480 0.9225 IE 0.9275 0.9059 NL 0.8861 0.8633 ES 0.8819 0.8580 DE 0.8717 0.8324 CH 0.8221 0.8092 SI 0.7694 0.7536 DK 0.7806 0.7469 AT 0.7618 0.7428 BE 0.7599 0.7313 UK 0.7713 0.7068 LU 0.7378 0.6939 CY 0.7564 0.6638 MT 0.6535 0.5944 EL 0.6478 0.5718 IT 0.5083 0.4448

D4.9 Developing a Road Safety Index
186
APPENDIX K. THE WEIGHTS OF EIGHT SPI’S FOR 29 COUNTRIES
AT Alc_ tests P_alc Belt_
front Belt_ rear
Prot_ occ
Prot_ ped Renewal Age
Weight 0.40 0.60 0.44 0.56 0.20 0.20 0.30 0.30 0.40 0.60
Share 69.94% 30.06% Index 0.762
BE Alc_ tests P_alc Belt_
front Belt_ rear
Prot_ occ
Prot_ ped Renewal Age
Weight 0.40 0.60 0.40 0.60 0.20 0.20 0.30 0.30
0.60 0.40 Share 61.33% 38.67% Index 0.760
BG Alc_ tests P_alc Belt_
front Belt_ rear
Prot_ occ
Prot_ ped Renewal Age
Weight 0.40 0.60 0.60 0.40 0.20 0.30 0.20 0.30 0.40 0.60
Share 90.00% 10.00% Index 0.626
CY Alc_ tests P_alc Belt_
front Belt_ rear
Prot_ occ
Prot_ ped Renewal Age
Weight 0.40 0.60 0.60 0.40 0.20 0.30 0.30 0.20 0.60 0.40
Share 54.07% 45.93% Index 0.756
CZ Alc_ tests P_alc Belt_
front Belt_ rear
Prot_ occ
Prot_ ped Renewal Age
Weight 0.40 0.60 0.60 0.40 0.20 0.30 0.30 0.20 0.60 0.40
Share 73.28% 26.72% Index 0.741
DK Alc_ tests P_alc Belt_
front Belt_ rear
Prot_ occ
Prot_ ped Renewal Age
Weight 0.40 0.60 0.52 0.48 0.20 0.30 0.30 0.20 0.40 0.60
Share 68.72% 31.28% Index 0.781

D4.9 Developing a Road Safety Index
187
EE Alc_ tests P_alc Belt_
front Belt_ rear
Prot_ occ
Prot_ ped Renewal Age
Weight 0.40 0.60 0.60 0.40 0.30 0.20 0.30 0.20 0.59 0.41
Share 70.57% 29.43% Index 0.784
FI Alc_ tests P_alc Belt_
front Belt_ rear
Prot_ occ
Prot_ ped Renewal Age
Weight 0.60 0.40 0.40 0.60 0.20 0.30 0.20 0.30 0.60 0.40
Share 88.67% 11.33% Index 1.000
FR Alc_ tests P_alc Belt_
front Belt_ rear
Prot_ occ
Prot_ ped Renewal Age
Weight 0.40 0.60 0.60 0.40 0.20 0.24 0.26 0.30 0.40 0.60
Share 87.46% 12.54% Index 0.947
DE Alc_ tests P_alc Belt_
front Belt_ rear
Prot_ occ
Prot_ ped Renewal Age
Weight 0.40 0.60 0.44 0.56 0.20 0.20 0.30 0.30 0.40 0.60
Share 74.47% 25.53% Index 0.872
EL Alc_ tests P_alc Belt_
front Belt_ rear
Prot_ occ
Prot_ ped Renewal Age
Weight 0.40 0.60 0.60 0.40 0.20 0.30 0.30 0.20 0.60 0.40
Share 63.58% 36.42% Index 0.648
HU Alc_ tests P_alc Belt_
front Belt_ rear
Prot_ occ
Prot_ ped Renewal Age
Weight 0.40 0.60 0.60 0.40 0.20 0.30 0.30 0.20 0.60 0.40
Share 64.72% 35.28% Index 0.731
IE Alc_ tests P_alc Belt_
front Belt_ rear
Prot_ occ
Prot_ ped Renewal Age
Weight 0.40 0.60 0.44 0.56 0.20 0.20 0.30 0.30 0.40 0.60
Share 69.17% 30.83% Index 0.927

D4.9 Developing a Road Safety Index
188
IT Alc_ tests P_alc Belt_
front Belt_ rear
Prot_ occ
Prot_ ped Renewal Age
Weight 0.40 0.60 0.40 0.60 0.20 0.20 0.30 0.30 0.60 0.40
Share 50.00% 50.00% Index 0.508
LV Alc_ tests P_alc Belt_
front Belt_ rear
Prot_ occ
Prot_ ped Renewal Age
Weight 0.40 0.60 0.60 0.40 0.30 0.30 0.20 0.20 0.60 0.40
Share 66.42% 33.58% Index 0.593
LT Alc_ tests P_alc Belt_
front Belt_ rear
Prot_ occ
Prot_ ped Renewal Age
Weight 0.40 0.60 0.60 0.40 0.30 0.30 0.20 0.20 0.60 0.40
Share 72.58% 27.42% Index 0.632
LU Alc_ tests P_alc Belt_
front Belt_ rear
Prot_ occ
Prot_ ped Renewal Age
Weight 0.40 0.60 0.40 0.60 0.20 0.20 0.30 0.30 0.40 0.60
Share 63.38% 36.62% Index 0.738
MT Alc_ tests P_alc Belt_
front Belt_ rear
Prot_ occ
Prot_ ped Renewal Age
Weight 0.40 0.60 0.60 0.40 0.20 0.30 0.30 0.20 0.40 0.60
Share 76.11% 23.89% Index 0.654
NO Alc_ tests P_alc Belt_
front Belt_ rear
Prot_ occ
Prot_ ped Renewal Age
Weight 0.40 0.60 0.48 0.52 0.30 0.20 0.30 0.20 0.40 0.60
Share 74.64% 25.36% Index 0.998
PL Alc_ tests P_alc Belt_
front Belt_ rear
Prot_ occ
Prot_ ped Renewal Age
Weight 0.40 0.60 0.60 0.40 0.30 0.30 0.20 0.20 0.40 0.60
Share 68.23% 31.77% Index 0.543
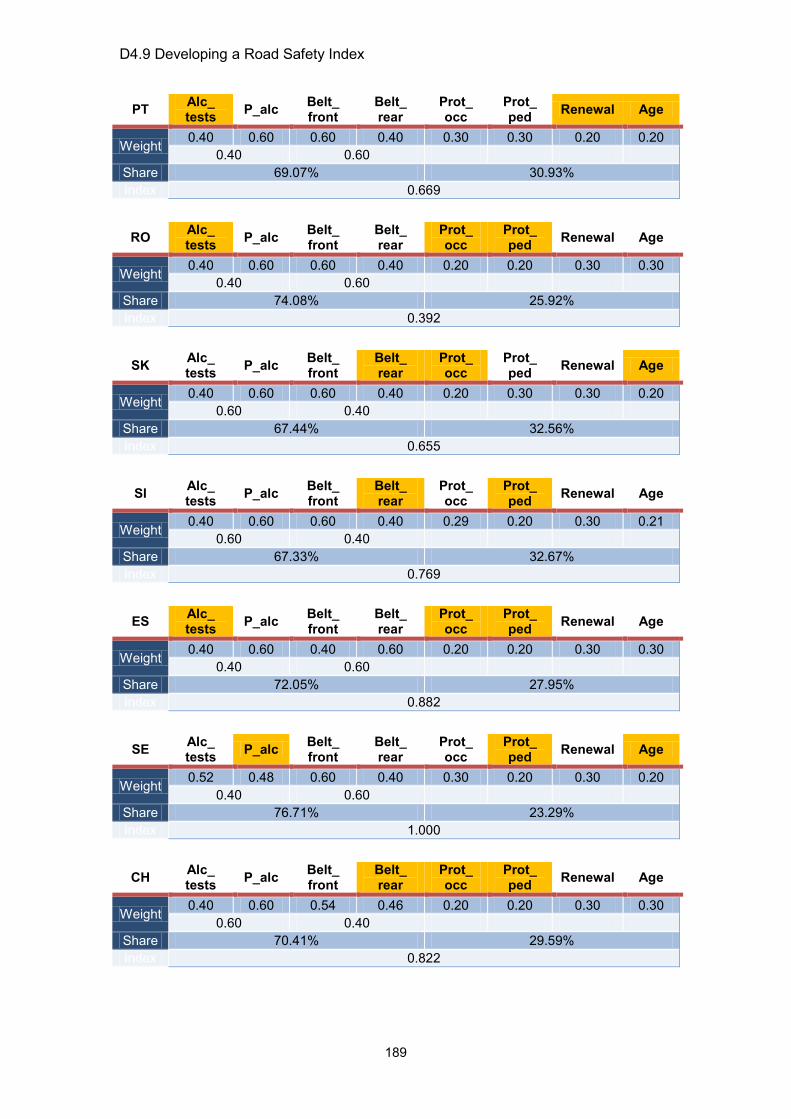
D4.9 Developing a Road Safety Index
189
PT Alc_ tests P_alc Belt_
front Belt_ rear
Prot_ occ
Prot_ ped Renewal Age
Weight 0.40 0.60 0.60 0.40 0.30 0.30 0.20 0.20 0.40 0.60
Share 69.07% 30.93% Index 0.669
RO Alc_ tests P_alc Belt_
front Belt_ rear
Prot_ occ
Prot_ ped Renewal Age
Weight 0.40 0.60 0.60 0.40 0.20 0.20 0.30 0.30 0.40 0.60
Share 74.08% 25.92% Index 0.392
SK Alc_ tests P_alc Belt_
front Belt_ rear
Prot_ occ
Prot_ ped Renewal Age
Weight 0.40 0.60 0.60 0.40 0.20 0.30 0.30 0.20 0.60 0.40
Share 67.44% 32.56% Index 0.655
SI Alc_ tests P_alc Belt_
front Belt_ rear
Prot_ occ
Prot_ ped Renewal Age
Weight 0.40 0.60 0.60 0.40 0.29 0.20 0.30 0.21 0.60 0.40
Share 67.33% 32.67% Index 0.769
ES Alc_ tests P_alc Belt_
front Belt_ rear
Prot_ occ
Prot_ ped Renewal Age
Weight 0.40 0.60 0.40 0.60 0.20 0.20 0.30 0.30 0.40 0.60
Share 72.05% 27.95% Index 0.882
SE Alc_ tests P_alc Belt_
front Belt_ rear
Prot_ occ
Prot_ ped Renewal Age
Weight 0.52 0.48 0.60 0.40 0.30 0.20 0.30 0.20 0.40 0.60
Share 76.71% 23.29% Index 1.000
CH Alc_ tests P_alc Belt_
front Belt_ rear
Prot_ occ
Prot_ ped Renewal Age
Weight 0.40 0.60 0.54 0.46 0.20 0.20 0.30 0.30 0.60 0.40
Share 70.41% 29.59% Index 0.822

D4.9 Developing a Road Safety Index
190
NL Alc_ tests P_alc Belt_
front Belt_ rear
Prot_ occ
Prot_ ped Renewal Age
Weight 0.40 0.60 0.52 0.48 0.20 0.30 0.30 0.20 0.40 0.60
Share 74.71% 25.29% Index 0.886
UK Alc_ tests P_alc Belt_
front Belt_ rear
Prot_ occ
Prot_ ped Renewal Age
Weight 0.40 0.60 0.40 0.60 0.20 0.20 0.30 0.30 0.40 0.60
Share 67.60% 32.40% Index 0.771

D4.9 Developing a Road Safety Index
191
APPENDIX L. SELECTION QUESTIONS PIN-QUESTIONNAIRE
PIN/Dacota questionnaire of WP 1
The original PIN questionnaire contained 32 questions. This set of questions aims to cover the main elements of effective road safety management (RSM) (Jost et al., 2012). 18 of these questions were selected by WP 1 for the purpose of validating.
PIN / Dacota question Coding for RSM31. Has a national road safety vision been set in your country? 1_Vision2. Has a national long-term road safety strategy been set in your country? 2_Strategy
3a. Has a national quantitative road safety target been set in your country for reducing the number of deaths? 3a_Target_fatalities
3b.Has a national quantitative road safety target been set in your country for reducing the number of people seriously injured? 3b_Target_seriousinj
3c. Have any other quantitative road safety targets been set in your country? 3c_Target_other
4.Has a national road safety programme or plan been formulated and adopted in your country? 4_Programme_plan
5a.Is there a budget dedicated to the implementation of your national road safety programme or plan? 5a_Budget
5b.Is the budget seen as being adequate to make your country’s targets achievable? 5b_Budget_adequate
5c. Have there been any changes since 2009 to the budget allocated to roads policing in your country? 5c_Budget_changes
6a. Is there a lead agency or structure bearing responsibility for road safety policy-making in your country? 6a_LeadAgency_PolicyMaking
6b.
Is there a lead agency that is empowered to co-ordinate the road safety activities of the main actors involved in advancing road safety in your country? 6b_LeadAgency_Coordination
7a.Does regular quantitative monitoring of your country’s road safety performance take place? 7a_Monitoring
7b. Are the results of this monitoring published periodically? 7b_Monitoring_published
8.Does a regular evaluation of the efficiency of the road safety measures or interventions implemented in your country take place? 8_Evaluation
9.Is there regular reporting on the road safety measures and interventions implemented in your country? 9_Reporting
10a.Are the attitudes of people towards road safety measures being measured nationally? 10a_Attitudes_measures
10b.Are the attitudes of people towards behaviour of road users being measured nationally? 10b_Attitudes_behaviour
10c. Are behaviours of road users being measured nationally? 10c_Behaviours
Table L.1. PIN/Dacota common questions on road safety management Source: Papadimitriou et al. (2012).
PIN panellists from each country have been asked to fill out the PIN questionnaire with closed questions, offering 3 answer categories (yes/partly/no). Answers have been received from 29 out of 30 countries. A data file was created with the following variable coding: 1=yes;0.5=no; 0=no; 9999=unknown. A number of the questions have been excluded from the analysis for 3 reasons:

D4.9 Developing a Road Safety Index
192
• To much missing (“unknown”) answers (so called unusable questions)
• To little variability in the answers (so called consensus questions)
• A priori invalid questions (3b and 3c: very recently adopted targets, not yet implemented in the RSM)
The results of this selection is shown in Table L.2.
Table L.2: Identification of ‘consensus’ and unusable questions in the PIN data Source: Papadimitriou et al. (2012).
As a consequence 8 questions remained for the validation analysis.