Embed Size (px)
Citation preview

1
Developing a Predictive Model for Asthma-Related Hospital Encounters in Patients with Asthma in a Large, Integrated Health Care System: Secondary Analysis
Gang Luo1, PhD; Claudia L Nau2, PhD; William W Crawford3, MD; Michael Schatz2,4, MD, MS; Robert S Zeiger2,4, MD, PhD; Emily Rozema2, MPH; Corinna Koebnick2, PhD 1Department of Biomedical Informatics and Medical Education, University of Washington, UW Medicine South Lake Union, 850 Republican Street, Building C, Box 358047, Seattle, WA 98195, USA 2Department of Research & Evaluation, Kaiser Permanente Southern California, 100 S. Los Robles, 6th Floor, Pasadena, CA 91101, USA
3Department of Allergy and Immunology, Kaiser Permanente South Bay Medical Center, 25825 S Vermont Ave, Harbor City, CA 90710 4Department of Allergy, Kaiser Permanente Southern California, 7060 Clairemont Mesa Blvd, San Diego, CA 92111, USA [email protected], [email protected], [email protected], [email protected], [email protected], [email protected], [email protected] Corresponding author: Gang Luo, PhD Department of Biomedical Informatics and Medical Education, University of Washington, UW Medicine South Lake Union, 850 Republican Street, Building C, Box 358047, Seattle, WA 98195, USA Phone: 1-206-221-4596 Fax: 1-206-221-2671 Email: [email protected]

2
Abstract Background: Asthma causes numerous hospital encounters including emergency department visits and hospitalizations annually. To improve patient outcomes and cut the number of these encounters, predictive models are widely used to prospectively pinpoint high-risk patients with asthma for preventive care via care management. But, the prior models do not have adequate accuracy to achieve this goal well. Adopting the modeling guideline of checking extensive candidate features, we recently constructed a machine learning model on Intermountain Healthcare data to predict asthma-related hospital encounters in patients with asthma. Although this model is more accurate than the prior models, it remains unknown whether our modeling guideline is generalizable to other healthcare systems. Objective: This study aims to assess our modeling guideline’s generalizability to Kaiser Permanente Southern California (KPSC). Methods: The patient cohort included a random sample of 70.00% (397,858/568,369) of patients with asthma who were enrolled in a KPSC health plan for any duration between 2015 and 2018. Via secondary analysis of 987,506 KPSC data instances from 2012 to 2017 and checking 337 candidate features, we produced a machine learning model to project asthma-related hospital encounters in the succeeding 12-month period in patients with asthma. Results: Our model reached an area under the receiver operating characteristic curve of 0.820. When the cutoff point for doing binary classification was put at the top 10.00% (20,474/204,744) of patients with asthma having the largest predicted risk, our model achieved an accuracy of 90.08% (184,435/204,744), a sensitivity of 51.90% (2,259/4,353), and a specificity of 90.91% (182,176/200,391). Conclusions: Our modeling guideline exhibited acceptable generalizability to KPSC and resulted in a model that is more accurate than those formerly built by others. After further enhancement, our model could be used to guide asthma care management. International Registered Report Identifier (IRRID): PRR2-10.2196/5039 Keywords: Asthma; forecasting; machine learning; patient care management; risk factors Introduction Background
About 8.4% of people in the U.S. have asthma [1], which causes over three thousand deaths, around five hundred thousand hospitalizations, and over two million emergency department (ED) visits each year [1,2]. To improve patient outcomes and cut the number of asthma-related hospital encounters including ED visits and hospitalizations, predictive models are widely used to prospectively pinpoint high-risk patients with asthma for preventive care via care management. This is, e.g., the case with healthcare systems like University of Washington Medicine, Kaiser Permanente Northern California [3], and Intermountain Healthcare, as well as with other health plans in nine of 12 metropolitan communities [4]. Once a patient is identified as high risk and placed into a care management program, a care manager will call the patient periodically to assess asthma control, adjust asthma medications, and make appointments for needed care or testing. Successful care management can help patients with asthma obtain better outcomes and thereby avoid up to 40% of their future hospital encounters [5-8].
A care management program has a limited service capacity and usually enrolls ≤3% of patients [9] with a given condition, which places a premium on enrolling at-risk patients. Therefore, the adopted predictive model’s accuracy (or lack thereof) puts an upper bound on the program’s effectiveness. Before us, multiple researchers have developed several models for projecting asthma-related hospital encounters in patients with asthma [3,10-22]. Each of these models considered only a few features, would miss more than half of patients who will have future asthma-related hospital encounters, and would incorrectly project future asthma-related hospital encounters for many other patients with asthma [23]. These errors lead to suboptimal patient outcomes including hospital encounters, as well as unnecessary healthcare costs due to unneeded care management program enrollment. When building machine learning models on non-medical data, people often follow the modeling guideline of checking extensive candidate features to boost model accuracy [24-27]. Adopting this modeling guideline to the medical domain, we recently constructed a machine learning model on Intermountain Healthcare data to project asthma-related hospital encounters in the succeeding 12-month period in patients with asthma [23]. Compared with the prior models, our model boosts the area under the receiver operating characteristic curve (AUC) by at least 0.049 to 0.859. Although this is encouraging, it remains unknown whether our modeling guideline is generalizable to other healthcare systems. Objectives
This study aims to assess our modeling guideline’s generalizability to Kaiser Permanente Southern California (KPSC). Like our Intermountain Healthcare model [23], our KPSC model uses administrative and clinical data to project asthma-related hospital encounters (ED visits and hospitalizations) in patients with asthma. The categorical dependent variable has two

3
possible values: whether the patient with asthma will have asthma-related hospital encounters in the succeeding 12-month period or not. This report describes the construction and evaluation of our KPSC model.
Methods
The methods adopted in this study are similar to those used in our previous paper [23]. Ethics approval and study design
In this study, we performed a secondary analysis of computerized administrative and clinical data. This study was approved by University of Washington Medicine’s and KPSC’s institutional review boards. Patient population
As shown in Figure 1, our patient cohort was based on the patients with asthma who were enrolled in a KPSC health plan for any duration between 2015 and 2018. Owing to internal regulatory processes, the patient cohort was restricted to a random sample of 70.00% (397,858/568,369) of eligible patients. This sample size is the maximum one that KPSC allows for sharing its data with an institution outside of Kaiser Permanente for research. As the largest integrated healthcare system in Southern California with 227 clinics and 15 hospitals, KPSC offers care to approximately 19% of Southern California residents [28]. A patient was deemed to have asthma in a particular year if in that year, the patient had one or more diagnosis codes of asthma (International Classification of Diseases, Tenth Revision [ICD-10]: J45.x; International Classification of Diseases, Ninth Revision [ICD-9]: 493.0x, 493.1x, 493.8x, 493.9x) recorded in the encounter billing database [11,29,30]. The exclusion criterion is that the patient died during that year. If a patient had no diagnosis code of asthma in any subsequent year, the patient was deemed to have no asthma in that subsequent year.
Figure 1. The patient cohort selection process. Prediction target (a.k.a. the dependent variable)
For each patient identified as having asthma in a particular year, the outcome is whether the patient had any asthma-related hospital encounter in the succeeding year. An asthma-related hospital encounter is an ED visit or hospitalization with asthma as the principal diagnosis (ICD-10: J45.x; ICD-9: 493.0x, 493.1x, 493.8x, 493.9x). For every patient with asthma, the patient’s data up to the end of every calendar year were used to project the patient’s outcome in the succeeding year, as long as the patient was deemed to have asthma in the former year and was also enrolled in a KPSC health plan at the end of the former year. Data set
For the patients in our patient cohort, we used their entire electronically available patient history at KPSC. At KPSC, various kinds of information on its patients has been recorded in the electronic medical record system since 2010. In addition, we had electronic records of the patients’ diagnosis codes starting from 1981, regardless of whether they were stored in the electronic medical record system. From KPSC’s research data warehouse, we retrieved an administrative and clinical data set including information regarding our patient cohort’s encounters and medication dispensing at KPSC during 2010-2018 and diagnosis codes at KPSC during 1981-2018. Owing to regulatory and privacy concerns, the data set is not publicly available.
Features (a.k.a. independent variables)
We examined two types of candidate features: basic ones and extended ones. A basic feature and its corresponding extended features differ only in the year of the data used for feature computation. We considered 307 basic candidate features listed in Table 1 of Multimedia Appendix 1. Covering a wide range of characteristics, these basic candidate features were computed from the structured attributes in our data set. In Tables 1 and 2 of Multimedia Appendix 1, unless the word different shows up, every mention of the number of a given type of items like medications counts multiplicity. As defined in our previous paper
Patients with asthma (N=568,369)
Patients who were enrolled in a KPSC health plan for any duration between 2015 and 2018 (N=6,153,402)
Our patient cohort (N=397,858)
Excluded: 30% not chosen during the random selection process (N=170,511)
Excluded: patients who never had asthma during 2015-2018 (N=5,585,033)

4
[23], major visits for asthma include ED visits and hospitalizations with an asthma diagnosis code, as well as outpatient visits having a primary diagnosis of asthma. Outpatient visits with a secondary but no primary diagnosis of asthma are regarded as minor visits for asthma.
Every input data instance to the model targets a unique (patient, index year) pair and is employed to forecast the patient’s outcome in the succeeding year. For the (patient, index year) pair, the patient’s primary care provider (PCP), age, and home address were computed as of the end of the index year. The basic candidate features of bronchiolitis, the number of years since the first asthma-coded encounter in the data set, premature birth, family history of asthma, and the number of years since the first encounter for chronic obstructive pulmonary disease in the data set were computed using the data from 1981 to the index year. All of the allergy features and the features derived from the problem list were computed using the data from 2010 to the index year. One basic candidate feature was computed using the data in the index and pre-index years: among all of the patient’s PCP’s patients with asthma in the pre-index year, the proportion who had asthma-related hospital encounters in the index year. The other 277 basic candidate features were computed using the data in the index year.
Besides the basic candidate features, we also checked extended candidate features. Our Intermountain Healthcare model [23] was built using the extreme gradient boosting (XGBoost) machine learning classification algorithm [31]. As detailed in Hastie et al. [32], XGBoost automatically computes every feature’s importance value as the feature’s fractional contribution to the model. Previously, we showed that ignoring those features with importance values <0.01 led to a little drop in model accuracy [23]. Using the basic candidate features and the model construction method described below, we built an initial XGBoost model on KPSC data. Since a patient’s demographic features rarely change over time, no extended candidate feature was formed for any of the basic demographic features. For each basic candidate feature that was non-demographic, was computed on the data in the index year, and had an importance value 0.01 in the initial XGBoost model, we computed two related extended candidate features, one using the data in the pre-index year and another using the data in the pre-pre-index year. The only difference between the extended candidate features and the basic feature is the year of the data used for feature computation. For instance, for the basic candidate feature “number of ED visits in 2016,” the two related extended candidate features are the number of ED visits in 2015 and the number of ED visits in 2014. In brief, we formed extended candidate features for only those suitable and important basic candidate features. Our intuition is that among all possible ones that could be formed, these extended candidate features are most promising with regard to additional predictive power. For the other basic candidate features with lower importance values, those extended candidate features that could possibly be formed for them tend to have little extra predictive power and can be ignored. Given the finite data instances available for model training, this feature extending approach avoids a large rise in the number of candidate features, which may cause sample size issues. We considered all of the basic and extended candidate features when building our final predictive model.
Data analysis Data preparation
Peak expiratory flow values are available in our KPSC data set, but not in the Intermountain Healthcare data set used in our previous paper [23]. Based on the upper and lower bounds given by our team’s medical expert (MS), all peak expiratory flow values >700 were regarded as biologically implausible. Using this criterion and the same data preparation method adopted in our previous paper [23], we normalized data, identified biologically implausible values, and set them to missing. Since the outcomes were from the succeeding year and the extended candidate features were computed using the data from up to two years before the index year, our data set contained 6 years of effective data (2012-2017) over totally 9 years (2010-2018). In clinical practice, a model is trained on historical data and then applied to future years’ data. To mirror this, the 2012-2016 data were used as the training set for model training. The 2017 data were employed as the test set to gauge model performance. Performance metrics
As displayed in the formulas below and Table 1, we adopted six standard metrics to assess model performance: accuracy, specificity, sensitivity, negative predictive value (NPV), positive predictive value (PPV), and AUC.
𝑎𝑐𝑐𝑢𝑟𝑎𝑐𝑦 𝑇𝑃 𝑇𝑁 / 𝑇𝑃 𝑇𝑁 𝐹𝑃 𝐹𝑁 , 𝑠𝑝𝑒𝑐𝑖𝑓𝑖𝑐𝑖𝑡𝑦 𝑇𝑁/ 𝑇𝑁 𝐹𝑃 , 𝑠𝑒𝑛𝑠𝑖𝑡𝑖𝑣𝑖𝑡𝑦 𝑇𝑃/ 𝑇𝑃 𝐹𝑁 , 𝑛𝑒𝑔𝑎𝑡𝑖𝑣𝑒 𝑝𝑟𝑒𝑑𝑖𝑐𝑡𝑖𝑣𝑒 𝑣𝑎𝑙𝑢𝑒 𝑇𝑁/ 𝑇𝑁 𝐹𝑁 , 𝑝𝑜𝑠𝑖𝑡𝑖𝑣𝑒 𝑝𝑟𝑒𝑑𝑖𝑐𝑡𝑖𝑣𝑒 𝑣𝑎𝑙𝑢𝑒 𝑇𝑃/ 𝑇𝑃 𝐹𝑃 .
We did 1,000-fold bootstrap analysis [33] to compute these performance measures’ 95% confidence intervals. We plotted the receiver operating characteristic curve to show the tradeoff between sensitivity and specificity.
Table 1. The error matrix.
Outcome class Asthma-related hospital encounters in the succeeding year
No asthma-related hospital encounter in the succeeding year

5
Projected asthma-related hospital encounters in the succeeding year
True positive (TP) False positive (FP)
Projected no asthma-related hospital encounter in the succeeding year
False negative (FN) True negative (TN)
Classification algorithms
We employed Waikato Environment for Knowledge Analysis (Weka) Version 3.9 [34] to build machine learning models. As a major open-source toolkit for machine learning and data mining, Weka integrates many classic feature selection techniques and machine learning algorithms. We examined the 39 native machine learning classification algorithms in Weka shown in our prior paper’s [23] online appendix, and the XGBoost classification algorithm [31] realized in the XGBoost4J package [35]. As an ensemble of decision trees, XGBoost implements gradient boosting in a scalable and efficient way. Since XGBoost takes only numerical features as its inputs, we converted every categorical feature to one or more binary features through one-hot encoding before giving the feature to XGBoost. We employed our formerly developed automatic and efficient machine learning model selection method [36] and the 2012-2016 training data to automatically choose, among all of the applicable ones, the classification algorithm, feature selection technique, hyper-parameter values, and data balancing method for managing imbalanced data. On average, our method runs 28 times faster and achieves an 11% lower model error rate than the Auto-WEKA automatic model selection method [36,37]. Assessing our Intermountain Healthcare model’s generalizability to KPSC
This study mainly assessed our modeling guideline’s generalizability to KPSC, by using the KPSC training set to train several models and assessing their performance on the KPSC test set. In addition, we assessed our Intermountain Healthcare model’s [23] generalizability to KPSC. Using the Intermountain Healthcare data set and the top 21 features with an importance value computed by XGBoost ≥0.01 there, we formerly built a simplified Intermountain Healthcare model [23]. The simplified model retained almost all of the predictive power of our full Intermountain Healthcare model. Our KPSC data set included these 21 features, but not all of the 142 features used in our full Intermountain Healthcare model. We assessed our simplified Intermountain Healthcare model’s performance on the KPSC test set twice, once after retraining the model on the KPSC training set and once using the model trained on the Intermountain Healthcare data set without retraining the model on the KPSC training set. Results Our patient cohort’s clinical and demographic characteristics
Every data instance targets a unique (patient, index year) pair. Table 2 displays the clinical and demographic characteristics of our patient cohort during the time periods of 2012-2016 and 2017. The set of characteristics during 2012-2016 is similar to that during 2017. During 2012-2016 and 2017, 2.42% (18,925/782,762) and 2.13% (4,353/204,744) of data instances were associated with asthma-related hospital encounters in the succeeding year, respectively.
Table 2. Clinical and demographic characteristics of our patient cohort.
Characteristic Time period 2012-2016 2017
Data instances (N=782,762), n
(%)
Data instances linking to
asthma-related hospital
encounters in the succeeding year (N=18,925), n
(%)
Data instances linking to no
asthma-related hospital
encounter in the succeeding year (N=763,837), n
(%)
Data instances (N=204,744), n
(%)
Data instances linking to
asthma-related hospital
encounters in the succeeding year (N=4,353),
n (%)
Data instances linking to no
asthma-related hospital
encounter in the succeeding year (N=200,391), n
(%) Age <6 53,744 (6.87) 3,041 (16.07) 50,703 (6.64) 11,834 (5.78) 610 (14.01) 11,224 (5.60) 6 to <18 193,622 (24.74) 5,039 (26.63) 188,583 (24.69) 44,868 (21.91) 1,012 (23.25) 43,856 (21.89)18 to 65 424,446 (54.22) 8,557 (45.22) 415,889 (54.45) 112,021 (54.71) 2,052 (47.14) 109,969 (54.88)65+ 110,950 (14.17) 2,288 (12.09) 108,662 (14.23) 36,021 (17.59) 679 (15.60) 35,342 (17.64)Gender Male 328,762 (42.00) 8,335 (44.04) 320,427 (41.95) 84,249 (41.15) 1,871 (42.98) 82,378 (41.11)Female 454,000 (58.00) 10,590 (55.96) 443,410 (58.05) 120,495 (58.85) 2,482 (57.02) 118,013 (58.89)

6
Race American Indian or Alaska native
3,831 (0.49) 86 (0.45) 3,745 (0.49) 1,018 (0.50) 31 (0.71) 987 (0.49)
Asian 70,063 (8.95) 1,282 (6.77) 68,781 (9.00) 18,874 (9.22) 319 (7.33) 18,555 (9.26) Black or African American
115,851 (14.80) 4,982 (26.33) 110,869 (14.51) 27,939 (13.65) 1,075 (24.70) 26,864 (13.41)
Native Hawaiian or other Pacific islander
7,922 (1.01) 230 (1.22) 7,692 (1.01) 1,952 (0.95) 42 (0.96) 1,910 (0.95)
White 487,582 (62.29) 10,040 (53.05) 477,542 (62.52) 126,816 (61.94) 2,302 (52.88) 124,514 (62.14)Unknown or unreported
97,513 (12.46) 2,305 (12.18) 95,208 (12.46) 28,145 (13.75) 584 (13.42) 27,561 (13.75)
Ethnicity Hispanic 307,371 (39.27) 8,131 (42.96) 299,240 (39.18) 80,021 (39.08) 1,868 (42.91) 78,153 (39.00)Non-Hispanic 460,372 (58.81) 10,577 (55.89) 449,795 (58.89) 119,211 (58.22) 2,410 (55.36) 116,801 (58.29)Unknown or unreported
15,019 (1.92) 217 (1.15) 14,802 (1.94) 5,512 (2.69) 75 (1.72) 5,437 (2.71)
Insurance Commercial (employer-paid)
532,412 (68.02) 11,311 (59.77) 521,101 (68.22) 130,144 (63.56) 2,420 (55.59) 127,724 (63.74)
Exchange (a.k.a. marketplace)
39,785 (5.08) 735 (3.88) 39,050 (5.11) 17,946 (8.77) 269 (6.18) 17,677 (8.82)
Public 223,789 (28.59) 7,469 (39.47) 216,320 (28.32) 66,631 (32.54) 1,904 (43.74) 64,727 (32.30)Self-paid plan 106,703 (13.63) 2,224 (11.75) 104,479 (13.68) 34,405 (16.80) 647 (14.86) 33,758 (16.85)Other 271,328 (34.66) 6,064 (32.04) 265,264 (34.73) 84,783 (41.41) 1,675 (38.48) 83,108 (41.47)High deductible plan 81,819 (10.45) 1,426 (7.54) 80,393 (10.52) 25,003 (12.21) 356 (8.18) 24,647 (12.30)# of years since the first asthma-coded encounter in the data set ≤3 331,913 (42.40) 8,006 (42.30) 323,907 (42.41) 85,843 (41.93) 1,737 (39.90) 84,106 (41.97)>3 450,849 (57.60) 10,919 (57.70) 439,930 (57.59) 118,901 (58.07) 2,616 (60.10) 116,285 (58.03)Asthma medication fill Inhaled corticosteroid 336,997 (43.05) 11,841 (62.57) 325,156 (42.57) 80,806 (39.47) 2,586 (59.41) 78,220 (39.03)Inhaled corticosteroid and long-acting beta-2 agonist combination
92,822 (11.86) 3,975 (21.00) 88,847 (11.63) 29,731 (14.52) 1,151 (26.44) 28,580 (14.26)
Leukotriene modifier 89,424 (11.42) 4,125 (21.80) 85,299 (11.17) 28,095 (13.72) 1,099 (25.25) 26,996 (13.47)Long-acting beta-2 agonist
35,270 (4.51) 1,694 (8.95) 33,576 (4.40) 11,810 (5.77) 467 (10.73) 11,343 (5.66)
Mast cell stabilizer 20 (0.00) 0 (0.00) 20 (0.00) 0 (0.00) 0 (0.00) 0 (0.00) Short-acting, inhaled beta-2 agonist
553,684 (70.73) 16,242 (85.82) 537,442 (70.36) 140,819 (68.78) 3,742 (85.96) 137,077 (68.40)
Systemic corticosteroid
247,083 (31.57) 10,837 (57.26) 236,246 (30.93) 67,475 (32.96) 2,597 (59.66) 64,878 (32.38)
Comorbidity Allergic rhinitis 168,709 (21.55) 4,673 (24.69) 164,036 (21.48) 40,933 (19.99) 1,084 (24.90) 39,849 (19.89)Anxiety or depression 164,950 (21.07) 4,231 (22.36) 160,719 (21.04) 47,300 (23.10) 1,124 (25.82) 46,176 (23.04)Bronchopulmonary dysplasia
263 (0.03) 22 (0.12) 241 (0.03) 30 (0.01) 1 (0.02) 29 (0.01)
Chronic obstructive pulmonary disease
28,387 (3.63) 999 (5.28) 27,388 (3.59) 7,591 (3.71) 285 (6.55) 7,306 (3.65)
Cystic fibrosis 138 (0.02) 3 (0.02) 135 (0.02) 42 (0.02) 2 (0.05) 40 (0.02) Eczema 85,369 (10.91) 2,944 (15.56) 82,425 (10.79) 21,159 (10.33) 638 (14.66) 20,521 (10.24)Gastroesophageal reflux
103,958 (13.28) 2,778 (14.68) 101,180 (13.25) 33,259 (16.24) 797 (18.31) 32,462 (16.20)
Obesity 176,442 (22.54) 4,776 (25.24) 171,666 (22.47) 49,738 (24.29) 1,190 (27.34) 48,548 (24.23)Premature birth 17,297 (2.21) 690 (3.65) 16,607 (2.17) 4,513 (2.20) 132 (3.03) 4,381 (2.19)

7
Sinusitis 115,173 (14.71) 2,832 (14.96) 112,341 (14.71) 29,882 (14.59) 680 (15.62) 29,202 (14.57)Sleep apnea 21,040 (2.69) 575 (3.04) 20,465 (2.68) 13,144 (6.42) 333 (7.65) 12,811 (6.39) Smoking status Current smoker 157,288 (20.09) 4,170 (22.03) 153,118 (20.05) 40,093 (19.58) 973 (22.35) 39,120 (19.52)Former smoker 136,326 (17.42) 2,870 (15.17) 133,456 (17.47) 36,743 (17.95) 717 (16.47) 36,026 (17.98)Never smoker or unknown
489,148 (62.49) 11,885 (62.80) 477,263 (62.48) 127,908 (62.47) 2,663 (61.18) 125,245 (62.50)
Table 3 shows for each clinical or demographic characteristic, the statistical test results on whether the data instances linking
to future asthma-related hospital encounters and those linking to no future asthma-related hospital encounter had the same distribution. These two sets of data instances had the same distribution when the P value is ≥.05, and distinct distributions when the P value is <.05. In Table 3, all of the P values <.05 are marked in bold.
Table 3. For each clinical or demographic characteristic, the statistical test results on whether the data instances linking to future asthma-related hospital encounters and those linking to no future asthma-related hospital encounter had the same
distribution. Characteristic P value for the 2012-2016
data P value for the 2017
data Statistical test
Age <.001 <.001 Cochran-Armitage trend test [38]Gender <.001 .01 χ2 two-sample test Race <.001 <.001 χ2 two-sample test Ethnicity <.001 <.001 χ2 two-sample test Insurance category <.001 <.001 χ2 two-sample test # of years since the first asthma-coded encounter in the data set
.78 .006 Cochran-Armitage trend test
Asthma medication fill Inhaled corticosteroid <.001 <.001 χ2 two-sample test Inhaled corticosteroid and long-acting beta-2 agonist combination
<.001 <.001 χ2 two-sample test
Leukotriene modifier <.001 <.001 χ2 two-sample test Long-acting beta-2 agonist <.001 <.001 χ2 two-sample test Mast cell stabilizer >.99 >.99 χ2 two-sample test Short-acting, inhaled beta-2 agonist <.001 <.001 χ2 two-sample test Systemic corticosteroid <.001 <.001 χ2 two-sample test Comorbidity Allergic rhinitis <.001 <.001 χ2 two-sample test Anxiety or depression <.001 <.001 χ2 two-sample test Bronchopulmonary dysplasia <.001 >.99 χ2 two-sample test Chronic obstructive pulmonary disease <.001 <.001 χ2 two-sample test Cystic fibrosis >.99 .52 χ2 two-sample test Eczema <.001 <.001 χ2 two-sample test Gastroesophageal reflux <.001 <.001 χ2 two-sample test Obesity <.001 <.001 χ2 two-sample test Premature birth <.001 <.001 χ2 two-sample test Sinusitis .33 .06 χ2 two-sample test Sleep apnea .003 <.001 χ2 two-sample test Smoking status <.001 <.001 χ2 two-sample test
Classification algorithm and features used Before building our final model, the basic candidate features’ importance values were computed once on our initial XGBoost
model. They led us to examine 30 extended candidate features in addition to the 307 basic candidate features. With these 337 basic and extended candidate features as its inputs, our automatic model selection method [36] picked the XGBoost classification algorithm [31]. As an ensemble of decision trees, XGBoost can handle missing feature values naturally. Our final

8
predictive model was built using XGBoost and the 221 features shown in descending order of importance value in Table 2 of Multimedia Appendix 1. The other features had no additional predictive power and were automatically dropped by XGBoost. Performance measures reached by our final KPSC model
On the KPSC test set, our final model achieved an AUC of 0.820 (95% CI: 0.813-0.826). Figure 2 displays the receiver operating characteristic curve of our final model. Table 4 displays the performance measures of our final model when various top percentages of patients having the largest predicted risk were adopted as the cutoff point for doing binary classification. When this percentage was at 10.00% (20,474/204,744), our final model achieved an accuracy of 90.08% (184,435/204,744; 95% CI: 89.95-90.21), a sensitivity of 51.90% (2,259/4,353; 95% CI: 50.44-53.42), a specificity of 90.91% (182,176/200,391; 95% CI: 90.78-91.03), a PPV of 11.03% (2,259/20,474; 95% CI: 10.59-11.46), and an NPV of 98.86% (182,176/184,270; 95% CI: 98.81-98.91). Table 5 gives the correspondent error matrix of our final model.
Figure 2. Our final predictive model’s receiver operating characteristic curve.
Table 4. The performance measures of our final predictive model when various top percentages of patients having the largest predicted risk were adopted as the cutoff point for doing binary classification. Top percentage of patients having
the largest predicted risk (%) Accuracy (%) Sensitivity (%) Specificity (%) PPV (%) NPV (%)
1 97.55 15.94 99.32 33.90 98.19 2 96.88 23.57 98.47 25.06 98.34 3 96.14 29.66 97.58 21.02 98.46 4 95.33 34.28 96.66 18.22 98.54 5 94.49 38.11 95.72 16.21 98.62 6 93.64 41.47 94.77 14.69 98.68 7 92.76 44.34 93.81 13.47 98.73 8 91.88 47.23 92.85 12.55 98.78 9 90.98 49.41 91.88 11.67 98.82
10 90.08 51.90 90.91 11.03 98.86 15 85.42 59.98 85.98 8.50 99.00 20 80.71 66.74 81.02 7.09 99.12 25 75.94 72.20 76.03 6.14 99.21
Table 5. The error matrix of our final predictive model when the top 10.00% (20,474/204,744) of patients having the largest predicted risk were adopted as the cutoff point for doing binary classification.
Outcome class Asthma-related hospital encounters in the succeeding year
No asthma-related hospital encounter in the succeeding year
1specificity
Sen
sitiv
ity

9
Projected asthma-related hospital encounters in the succeeding year
2,259 18,215
Projected no asthma-related hospital encounter in the succeeding year
2,094 182,176
When we excluded the extended candidate features and considered only the basic candidate features, the model’s AUC
dropped to 0.809. Several basic candidate features, such as the number of years since the first asthma-coded encounter in the data set, need over one year of past data to calculate. When we further excluded these multi-year candidate features and considered only those basic candidate features calculated on one year of past data, the model’s AUC dropped to 0.807.
Without precluding any feature from being considered, the model trained on data from both children (age < 18) with asthma and adults (age ≥ 18) with asthma gained an AUC of 0.815 in children with asthma and an AUC of 0.817 in adults with asthma. In comparison, the model trained only on data from children with asthma gained an AUC of 0.811 in children with asthma. The model trained only on data from adults with asthma gained an AUC of 0.818 in adults with asthma.
If we adopted only the top 25 features shown in Table 2 of Multimedia Appendix 1 with an importance value ≥0.01 and removed the other 312 features, the model’s AUC dropped from 0.820 to 0.800 (95% CI: 0.793-0.808). When the top 10.00% (20,474/204,744) of patients having the largest predicted risk were adopted as the cutoff point for doing binary classification, the model’s accuracy dropped from 90.08% (184,435/204,744) to 89.96% (184,185/204,744; 95% CI: 89.83-90.08), sensitivity dropped from 51.90% (2,259/4,353) to 49.02% (2,134/4,353; 95% CI: 47.71-50.55), specificity dropped from 90.91% (182,176/200,391) to 90.85% (182,051/200,391; 95% CI: 90.72-90.97), PPV dropped from 11.03% (2,259/20,474) to 10.42% (2,134/20,474; 95% CI: 10.03-10.86), and NPV dropped from 98.86% (182,176/184,270) to 98.80% (182,051/184,270; 95% CI: 98.75-98.85). Performance measures reached by our simplified Intermountain Healthcare model
When applying our simplified Intermountain Healthcare model trained on the Intermountain Healthcare data set [23] to the KPSC test set without retraining the model on the KPSC training set, the model gained an AUC of 0.751 (95% CI: 0.742-0.759). When the top 10.00% (20,474/204,744) of patients having the largest predicted risk were adopted as the cutoff point for doing binary classification, the model achieved an accuracy of 89.64% (183,531/204,744; 95% CI: 89.51-89.77), a sensitivity of 41.51% (1,807/4,353; 95% CI: 40.14-42.97), a specificity of 90.68% (181,724/200,391; 95% CI: 90.55-90.81), a PPV of 8.83% (1,807/20,474; 95% CI: 8.44-9.23), and an NPV of 98.62% (181,724/184,270; 95% CI: 98.57-98.67).
After using the KPSC training set to retrain our simplified Intermountain Healthcare model [23], the model gained on the KPSC test set an AUC of 0.779 (95% CI: 0.772-0.787). When the top 10.00% (20,474/204,744) of patients having the largest predicted risk were adopted as the cutoff point for doing binary classification, the model achieved an accuracy of 89.85% (183,953/204,744; 95% CI: 89.71-89.97), a sensitivity of 46.36% (2,018/4,353; 95% CI: 44.89-47.84), a specificity of 90.79% (181,935/200,391; 95% CI: 90.65-90.91), a PPV of 9.86% (2,018/20,474; 95% CI: 9.45-10.25), and an NPV of 98.73% (181,935/184,270; 95% CI: 98.68-98.78).
Discussion Principal results
We used KPSC data to develop a model to forecast asthma-related hospital encounters in the succeeding 12-month period in patients with asthma. Table 6 shows that, compared with the models formerly built by others [3,10-22], our final KPSC model gained a higher AUC. That is, our modeling guideline of checking extensive candidate features to boost model accuracy exhibited acceptable generalizability to KPSC. After further enhancement to automatically explain its predictions [39,40] and to raise its accuracy, our model could be used to direct asthma care management to help improve patient outcomes and cut healthcare costs.
Table 6. Our final KPSC model in comparison with several previous models for forecasting hospitalizations and ED visits in
patients with asthma. “-” indicates that the original paper presenting the model did not report the performance measure. Model Prediction target # of
features the model used
# of data instances
Classification algorithm
The undesirable outcome’s prevalence rate in the whole data set (%)
AUC Sensitivity (%)
Specificity (%)
PPV (%)
NPV (%)
Our final KPSC model
Asthma-related hospital encounters
221 987,506 XGBoost 2.36 0.820 51.90 90.91 11.03 98.86

10
Our Intermountain Healthcare model [23]
Asthma-related hospital encounters
142 334,564 XGBoost 3.63 0.859 53.69 91.93 22.65 97.83
Miller et al. [15]
Asthma-related hospital encounters
17 2,821 Logistic regression
8.5 0.81 - - - -
Loymans et al. [10]
Asthma exacerbation
7 611 Logistic regression
13 0.8 - - - -
Lieu et al. [3] Asthma-related hospitalization
7 16,520 Proportional-hazards regression
1.8 0.79 - - - -
Schatz et al. [11]
Asthma-related hospitalization in children
5 4,197 Logistic regression
1.4 0.781 43.9 89.8 5.6 99.1
Yurk et al. [17]
Lost day or asthma-related hospital encounters
11 4,888 Logistic regression
54 0.78 77 63 82 56
Eisner et al. [12]
Asthma-related ED visit
3 2,415 Logistic regression
18.3 0.751 - - - -
Forno et al. [22]
Severe asthma exacerbation
17 615 Scoring 69.6 0.75 - - - -
Schatz et al. [11]
Asthma-related hospitalization in adults
3 6,904 Logistic regression
1.2 0.712 44.9 87.0 3.9 99.3
Lieu et al. [3] Asthma-related ED visit
7 16,520 Proportional-hazards regression
6.4 0.69 - - - -
Eisner et al. [12]
Asthma-related hospitalization
1 2,858 Logistic regression
32.8 0.689 - - - -
Sato et al. [13]
Severe asthma exacerbation
3 78 Classification and regression tree
21 0.625 - - - -
Schatz et al. [20]
Asthma-related hospital encounters
4 14,893 Logistic regression
6.5 0.614 25.4 92.0 22.0 93.2
Lieu et al. [19]
Asthma-related hospital encounters
4 7,141 Classification and regression tree
6.9 - 49.0 83.6 18.5 -
Asthma affects adults and children differently. Our final model gained a lower AUC in children than in adults. Additional
work is required to understand the difference and to boost the prediction accuracy in children. We examined 337 basic and extended candidate features. Around 65.6% (221/337) of them were used in our final model.
Many of the unused features were correlated with the outcome variable, but provided no additional predictive power on the KPSC data set beyond those used in our final model.
In Table 2 of Multimedia Appendix 1, the eight most important features and several others within the top 25 features reflect loss of asthma control. This loss of asthma control could be due to the severity of the patient’s asthma. It could also relate to management practices, treatment non-adherence, or socioeconomic factors for which we had no data.
When using our simplified Intermountain Healthcare model [23] without retraining it on the KPSC training set, the model achieved an AUC of 0.751 on the KPSC test set. Despite being 0.069 lower than our final KPSC model’s AUC, this AUC is higher than the AUCs of many previous models for predicting hospitalizations and ED visits in patients with asthma (see Table 6). Therefore, we regard our simplified Intermountain Healthcare model to have acceptable generalizability to KPSC.

11
Comparison with the prior work Multiple researchers have built models to forecast ED visits and hospitalizations in patients with asthma [3,10-23]. Table 6
compares our final KPSC model with those models, which encompass all pertinent models covered in Loymans et al.’s systematic review [18]. With the exception of our Intermountain Healthcare model [23], every model formerly built by others [3,10-22] gained a lower AUC than our final KPSC model. Instead of being for all patients with asthma, Miller et al.’s model [15] targets adults with difficult-to-treat or severe asthma, 8.5% of whom had future asthma-related hospital encounters. Loymans et al.’s model [10] predicts asthma exacerbations with a prevalence rate of 13%. These two prevalence rates of the undesirable outcome are much higher than that in our KPSC data set. Also, the target patient population and/or the prediction target of these two models are not comparable with those in our KPSC model. Except for these two models, each of the other models formerly built by others had an AUC ≤0.79, which is at least 0.030 lower than that of our KPSC model.
Compared with other models, Yurk et al.’s model [17] gained a larger PPV and sensitivity mainly due to using a distinct prediction target: hospital encounters or one or more days lost due to missed work or reduced activities for asthma. This prediction target was easier to predict, as it occurred in 54% of the patients with asthma. If Yurk et al.’s model [17] were used to predict asthma-related hospital encounters that occurred on ~2% of the patients with asthma, we would expect the model to gain a lower sensitivity and PPV.
Excluding Yurk et al.’s model [17], all of the other models formerly built by others had a sensitivity ≤49%, which is smaller than what our final KPSC model gained: 51.90%. Sensitivity provides, among all of the patients with asthma who will have future asthma-related hospital encounters, the proportion the model pinpoints. As the population of patients with asthma is large, for every 1% rise in the identified proportion of patients with asthma who would have future asthma-related hospital encounters, effective care management could help improve patient outcomes and thereby avoid up to 7,200 more ED visits and 1,970 more hospitalizations in the U.S. annually [1,5-8].
The PPV depends substantially on the undesirable outcome’s prevalence rate [41]. In our KPSC test data set, 2.13% (4,353/204,744) of patients with asthma had future asthma-related hospital encounters. When the top 10.00% (20,474/204,744) of patients having the largest predicted risk were adopted as the cutoff point for doing binary classification, the maximum possible PPV that a perfect model could obtain is 21.26% (4,353/20,474). Our final KPSC model gained a PPV of 11.03% (2,259/20,474), which is 51.90% of the maximum possible PPV. In comparison, in our Intermountain Healthcare test data set, 4.22% of patients with asthma had future asthma-related hospital encounters [23]. Our Intermountain Healthcare model gained a PPV of 22.65% [23], which is 53.69% of the maximum possible PPV that a perfect model could obtain there. On a data set in which 6.5% of patients with asthma had future asthma-related hospital encounters, Schatz et al.’s model gained a PPV of 22.0% [20]. On a data set in which 6.9% of patients with asthma had future asthma-related hospital encounters, Lieu et al.’s model gained a PPV of 18.5% [19]. Except for these PPVs and the PPV in Yurk et al. [17], none of the previously reported PPVs is >5.6%.
Despite being built using the same modeling guideline, our final KPSC model gained a lower AUC than our Intermountain Healthcare model [23]. This is largely because the percentage of data instances in the test set linking to future asthma-related hospital encounters differs greatly at Intermountain Healthcare and at KPSC: 4.22% (812/19,256) vs. 2.13% (4,353/204,744). The rarer the undesirable outcome, the harder it is to accurately predict it.
The top features with an importance value ≥0.01 in our final KPSC model are similar to those in our Intermountain Healthcare model [23]. In both our final KPSC and our Intermountain Healthcare models, many top features involve asthma medications and prior ED visits. When building our Intermountain Healthcare model, we had not thought of several basic candidate features. They turned out to be top features in our final KPSC model, and impacted the importance values and ranks of the other top features there.
When building our Intermountain Healthcare model, we did not incorporate any extended candidate feature. Several such features appeared as top features in our final KPSC model. Their inclusion boosted model accuracy on our KPSC data set. It is possible that including extended candidate features could also boost model accuracy on our Intermountain Healthcare data set. This could be explored in future work.
Schatz et al. showed that in two Southern California cities, 6.5% of patients with asthma at KPSC had asthma-related hospital encounters in 2000 [20]. In comparison, 2.08% (4,353/208,959) of patients with asthma at KPSC had asthma-related hospital encounters in 2018. This suggests that compared with two decades ago, KPSC manages patients with asthma better now.
Considerations about potential clinical use
Although more accurate than those formerly built by others, our final KPSC model still gained a somewhat low PPV of 11.03% (2,259/20,474). Yet, our model could be clinically useful: (1) A PPV of 11.03% is acceptable for pinpointing high-risk patients with asthma to apply low-cost preventive interventions.
Examples of such interventions include: giving the patient a peak flow meter for self-monitoring at home and showing the patient how to use it, instructing the patient on the correct use of an asthma inhaler, asking a nurse to follow up on the patient with extra phone calls, and training the patient to write a diary on environmental triggers.

12
(2) As explained above, due to the low prevalence rate of the undesirable outcome used in this study, even a perfect model would gain a small PPV. For this outcome, sensitivity matters more than PPV for judging the model’s possible clinical impact. Our final KPSC model gained a higher sensitivity than all of the models that were formerly built by others and use a comparable prediction target.
(3) To allocate care management resources, healthcare systems like University of Washington Medicine, Kaiser Permanente Northern California [3], and Intermountain Healthcare are using proprietary models whose performance measures are akin to those of the models previously built by others. Our final KPSC model is more accurate than these models.
Our final KPSC model used 221 features. Cutting this number could facilitate clinical deployment of the model. In this regard, if one could bear a small drop in prediction accuracy, one could adopt the top features having an importance value ≥, e.g., 0.01 and remove the others. A feature’s importance value changes across healthcare systems. Ideally, before deciding which features to keep, one should first compute the importance values of the features on a data set from the intended healthcare system.
Most of the attributes that we used to compute the features adopted in our final KPSC model, particularly the top features, are routinely collected by electronic medical record systems these days. For future work, to make it easy for other healthcare systems to reuse our final KPSC model, we can resort to the Observational Medical Outcomes Partnership (OMOP) common data model [42]. This data model and its linked standardized terminologies [43] standardize administrative and clinical attributes from at least 10 large U.S. healthcare systems [44,45]. We can extend this data model to include the attributes that are used in our final KPSC model, but missed by the original data model. We rewrite our feature construction and model building code based on the extended OMOP common data model, and post our code and the related data schema on a public Web site. Then after converting its data into our extended OMOP common data model format based on this data schema, a healthcare system can rerun our code on its data to obtain a simplified version of our final KPSC model tailored to its data. Hopefully, most of the predictive power of our final KPSC model can be retained, like what this paper showed for our Intermountain Healthcare model.
It is hard to interpret an XGBoost model employing many features globally, as is the case with many other involved machine learning models. As an interesting topic for future work, we plan to use our formerly proposed method [39,40] to automatically explain our final KPSC model’s predictions on each patient with asthma.
Our final KPSC model was an XGBoost model [31]. When classifying two unbalanced classes, XGBoost employs a hyper-parameter scale_pos_weight to balance their weights [46]. To maximize our KPSC model’s AUC, our automatic model selection method [36] changed scale_pos_weight from its default value to balance the two classes of having future asthma-related hospital encounters or not [47]. As a side effect, this greatly shrank the model’s projected probabilities of having future asthma-related hospital encounters and made them differ greatly from the actual probabilities [47]. This does not affect identifying the top few percent of patients with asthma who have the largest projected risk to receive care management or other preventive interventions. We could keep scale_pos_weight at its default value of one and not balance the two classes. This would avoid the side effect, but drop the model’s AUC from 0.820 to 0.817 (95% CI: 0.810-0.824).
Limitations
This study has three limitations, which all provide interesting areas for future work: (1) Besides those examined in this study, other features could also help raise model accuracy. Our KPSC data set does not
include some potentially relevant features, such as characteristics of the patient’s home environment and features computed on the data gathered by monitoring sensors attached to the patient’s body. It would be worthwhile to identify new predictive features from various data sources.
(2) Our study used only non-deep learning machine learning algorithms and structured data. Using deep learning and including features computed from unstructured clinical notes may further boost model accuracy [40,48].
(3) Our study assessed our modeling guideline’s generalizability to only one healthcare system. It would be interesting to evaluate our modeling guideline’s generalizability to other healthcare systems, such as academic healthcare systems that have different properties from KPSC and Intermountain Healthcare. Compared with non-academic healthcare systems, academic healthcare systems tend to care for sicker and more complex patients [49]. To do such an evaluation, we are working on obtaining a data set of patients with asthma from University of Washington Medicine [48].
Conclusions
In its first generalizability assessment, our modeling guideline of examining extensive candidate features to help boost model accuracy exhibited acceptable generalizability to KPSC. Compared with the models formerly built by others, our KPSC model for projecting asthma-related hospital encounters in patients with asthma gained a higher AUC. At present, predictive models are widely used as a core component of a decision support tool to prospectively pinpoint high-risk patients with asthma for preventive care via care management. After further enhancement, our KPSC model could be used to replace the existing

13
predictive models in the decision support tool for better directing asthma care management to help improve patient outcomes and cut healthcare costs. Acknowledgments
We thank Lee J. Barton, Don McCarthy, Xia X. Li, and Michael D. Johnson for useful discussions and helping retrieve the KPSC data set. GL, CLN, MS, RSZ, ER, and CK were partially supported by the National Heart, Lung, and Blood Institute of the National Institutes of Health under Award Number R01HL142503. The funders had no role in study design, data collection and analysis, decision to publish, or preparation of the manuscript. Authors' contributions
GL was mainly responsible for the paper. He conceptualized and designed the study, performed literature review and data analysis, and wrote the paper. CK, CLN, WWC, MS, ER, and RSZ provided feedback on various medical issues, contributed to conceptualizing the presentation, and revised the paper. CK and CLN took part in retrieving the KPSC data set and interpreting its detected peculiarities.
Conflicts of interest
RSZ reports grants from Aerocrine, grants and personal fees from Genentech, grants and personal fees from MedImmune/AstraZeneca, grants and personal fees from Merck, personal fees from Novartis, personal fees from Regeneron Pharmaceuticals, grants and personal fees from GlaxoSmithKline, grants from ALK Pharma, and grants from TEVA outside this study. Abbreviations:
AUC: Area Under the receiver operating characteristic Curve ED: emergency department FN: false negative FP: false positive ICD-9: International Classification of Diseases, Ninth Revision ICD-10: International Classification of Diseases, Tenth Revision KPSC: Kaiser Permanente Southern California NPV: negative predictive value OMOP: Observational Medical Outcomes Partnership PCP: primary care provider PPV: positive predictive value TN: true negative TP: true positive Weka: Waikato Environment for Knowledge Analysis XGBoost: extreme gradient boosting
References 1. Moorman JE, Akinbami LJ, Bailey CM, Zahran HS, King ME, Johnson CA, Liu X. National surveillance of asthma:
United States, 2001-2010. Vital Health Stat 3 2012;(35):1-58. PMID:24252609 2. Nurmagambetov T, Kuwahara R, Garbe P. The economic burden of asthma in the United States, 2008-2013. Ann Am
Thorac Soc 2018;15(3):348-56. PMID:29323930 3. Lieu TA, Quesenberry CP, Sorel ME, Mendoza GR, Leong AB. Computer-based models to identify high-risk children
with asthma. Am J Respir Crit Care Med 1998;157(4 Pt 1):1173-80. PMID:9563736 4. Mays GP, Claxton G, White J. Managed care rebound? Recent changes in health plans’ cost containment strategies. Health
Aff (Millwood). 2004;Suppl Web Exclusives:W4-427-36. PMID:15451964 5. Caloyeras JP, Liu H, Exum E, Broderick M, Mattke S. Managing manifest diseases, but not health risks, saved PepsiCo
money over seven years. Health Aff (Millwood) 2014;33(1):124-31. PMID:24395944 6. Greineder DK, Loane KC, Parks P. A randomized controlled trial of a pediatric asthma outreach program. J Allergy Clin
Immunol 1999;103(3 Pt 1):436-40. PMID:10069877 7. Kelly CS, Morrow AL, Shults J, Nakas N, Strope GL, Adelman RD. Outcomes evaluation of a comprehensive intervention
program for asthmatic children enrolled in Medicaid. Pediatrics 2000;105(5):1029-35. PMID:10790458 8. Axelrod RC, Zimbro KS, Chetney RR, Sabol J, Ainsworth VJ. A disease management program utilizing life coaches for
children with asthma. J Clin Outcomes Manag 2001;8(6):38-42.

14
9. Axelrod RC, Vogel D. Predictive modeling in health plans. Disease Management & Health Outcomes 2003;11(12):779-87. doi:10.2165/00115677-200311120-00003
10. Loymans RJ, Honkoop PJ, Termeer EH, Snoeck-Stroband JB, Assendelft WJ, Schermer TR, Chung KF, Sousa AR, Sterk PJ, Reddel HK, Sont JK, Ter Riet G. Identifying patients at risk for severe exacerbations of asthma: development and external validation of a multivariable prediction model. Thorax 2016;71(9):838-46. PMID:27044486
11. Schatz M, Cook EF, Joshua A, Petitti D. Risk factors for asthma hospitalizations in a managed care organization: development of a clinical prediction rule. Am J Manag Care 2003;9(8):538-47. PMID:12921231
12. Eisner MD, Yegin A, Trzaskoma B. Severity of asthma score predicts clinical outcomes in patients with moderate to severe persistent asthma. Chest 2012;141(1):58-65. PMID:21885725
13. Sato R, Tomita K, Sano H, Ichihashi H, Yamagata S, Sano A, Yamagata T, Miyara T, Iwanaga T, Muraki M, Tohda Y. The strategy for predicting future exacerbation of asthma using a combination of the Asthma Control Test and lung function test. J Asthma 2009;46(7):677-82. PMID:19728204
14. Osborne ML, Pedula KL, O'Hollaren M, Ettinger KM, Stibolt T, Buist AS, Vollmer WM. Assessing future need for acute care in adult asthmatics: the Profile of Asthma Risk Study: a prospective health maintenance organization-based study. Chest 2007;132(4):1151-61. PMID:17573515
15. Miller MK, Lee JH, Blanc PD, Pasta DJ, Gujrathi S, Barron H, Wenzel SE, Weiss ST; TENOR Study Group. TENOR risk score predicts healthcare in adults with severe or difficult-to-treat asthma. Eur Respir J 2006;28(6):1145-55. PMID:16870656
16. Peters D, Chen C, Markson LE, Allen-Ramey FC, Vollmer WM. Using an asthma control questionnaire and administrative data to predict health-care utilization. Chest 2006;129(4):918-24. PMID:16608939
17. Yurk RA, Diette GB, Skinner EA, Dominici F, Clark RD, Steinwachs DM, Wu AW. Predicting patient-reported asthma outcomes for adults in managed care. Am J Manag Care 2004;10(5):321-8. PMID:15152702
18. Loymans RJB, Debray TPA, Honkoop PJ, Termeer EH, Snoeck-Stroband JB, Schermer TRJ, Assendelft WJJ, Timp M, Chung KF, Sousa AR, Sont JK, Sterk PJ, Reddel HK, Ter Riet G. Exacerbations in adults with asthma: a systematic review and external validation of prediction models. J Allergy Clin Immunol Pract 2018;6(6):1942-52.e15. PMID:29454163
19. Lieu TA, Capra AM, Quesenberry CP, Mendoza GR, Mazar M. Computer-based models to identify high-risk adults with asthma: is the glass half empty or half full? J Asthma 1999;36(4):359-70. PMID:10386500
20. Schatz M, Nakahiro R, Jones CH, Roth RM, Joshua A, Petitti D. Asthma population management: development and validation of a practical 3-level risk stratification scheme. Am J Manag Care 2004;10(1):25-32. PMID:14738184
21. Grana J, Preston S, McDermott PD, Hanchak NA. The use of administrative data to risk-stratify asthmatic patients. Am J Med Qual 1997;12(2):113-9. PMID:9161058
22. Forno E, Fuhlbrigge A, Soto-Quirós ME, Avila L, Raby BA, Brehm J, Sylvia JM, Weiss ST, Celedón JC. Risk factors and predictive clinical scores for asthma exacerbations in childhood. Chest 2010;138(5):1156-65. PMID:20472862
23. Luo G, He S, Stone BL, Nkoy FL, Johnson MD. Developing a model to predict hospital encounters for asthma in asthmatic patients: secondary analysis. JMIR Med Inform 2020;8(1):e16080. PMID:31961332
24. Mayfield J, McNamee P, Piatko CD. Named entity recognition using hundreds of thousands of features. In: Proceedings of the Seventh Conference on Natural Language Learning. 2003 Presented at: CoNLL'03; May 31-June 1, 2003; Edmonton, Canada p. 184-7.
25. Cao Y, Yu H, Abbott NL, Zavala VM. Machine learning algorithms for liquid crystal-based sensors. ACS Sens 2018; 3(11):2237-45. doi:10.1021/acssensors.8b00100
26. Zhai Y, Ong Y, Tsang IW. The emerging “big dimensionality.” IEEE Comput Intell Mag 2014;9(3):14-26. doi:10.1109/MCI.2014.2326099
27. Hansson K, Yella S, Dougherty M, Fleyeh H. Machine learning algorithms in heavy process manufacturing. American Journal of Intelligent Systems 2016;6(1):1-13. doi:10.5923/j.ajis.20160601.01
28. Koebnick C, Langer-Gould AM, Gould MK, Chao CR, Iyer RL, Smith N, Chen W, Jacobsen SJ. Sociodemographic characteristics of members of a large, integrated health care system: comparison with US Census Bureau data. Perm J 2012;16(3):37-41. PMID:23012597
29. Desai JR, Wu P, Nichols GA, Lieu TA, O'Connor PJ. Diabetes and asthma case identification, validation, and representativeness when using electronic health data to construct registries for comparative effectiveness and epidemiologic research. Med Care 2012;50 Suppl:S30-5. PMID:22692256
30. Wakefield DB, Cloutier MM. Modifications to HEDIS and CSTE algorithms improve case recognition of pediatric asthma. Pediatr Pulmonol 2006;41(10):962-71. PMID:16871628
31. Chen T, Guestrin C. XGBoost: A scalable tree boosting system. In: Proceedings of the ACM SIGKDD International Conference on Knowledge Discovery and Data Mining. 2016 Presented at: KDD'16; August 13-17, 2016; San Francisco, CA p. 785-94. doi:10.1145/2939672.2939785

15
32. Hastie T, Tibshirani R, Friedman J. The Elements of Statistical Learning: Data Mining, Inference, and Prediction, 2nd ed. New York, NY: Springer; 2016. ISBN:0387848576
33. Steyerberg EW. Clinical Prediction Models: A Practical Approach to Development, Validation, and Updating, 2nd ed. New York, NY: Springer; 2019. ISBN:3030163989
34. Witten IH, Frank E, Hall MA, Pal CJ. Data Mining: Practical Machine Learning Tools and Techniques, 4th ed. Burlington, MA: Morgan Kaufmann; 2016. ISBN:0128042915
35. XGBoost JVM package. 2020. https://xgboost.readthedocs.io/en/latest/jvm/index.html. 36. Zeng X, Luo G. Progressive sampling-based Bayesian optimization for efficient and automatic machine learning model
selection. Health Inf Sci Syst 2017;5(1):2. PMID:29038732 37. Thornton C, Hutter F, Hoos HH, Leyton-Brown K. Auto-WEKA: combined selection and hyperparameter optimization of
classification algorithms. In: Proceedings of the ACM SIGKDD International Conference on Knowledge Discovery and Data Mining. 2013 Presented at: KDD'13; August 11-14, 2013; Chicago, IL p. 847-55. doi:10.1145/2487575.2487629
38. Agresti A. Categorical Data Analysis, 3rd ed. Hoboken, NJ: Wiley; 2012. ISBN:9780470463635 39. Luo G. Automatically explaining machine learning prediction results: a demonstration on type 2 diabetes risk prediction.
Health Inf Sci Syst 2016;4:2. PMID:26958341 40. Luo G. A roadmap for semi-automatically extracting predictive and clinically meaningful temporal features from medical
data for predictive modeling. Glob Transit 2019;1:61-82. PMID:31032483 41. Ranganathan P, Aggarwal R. Common pitfalls in statistical analysis: Understanding the properties of diagnostic tests - Part
1. Perspect Clin Res 2018;9(1):40-43. 42. Observational Medical Outcomes Partnership (OMOP) Common Data Model homepage. 2020. http://omop.org/CDM. 43. Observational Medical Outcomes Partnership (OMOP) vocabularies. 2020. http://omop.org/Vocabularies. 44. Hripcsak G, Duke JD, Shah NH, Reich CG, Huser V, Schuemie MJ, Suchard MA, Park RW, Wong ICK, Rijnbeek PR,
van der Lei J, Pratt N, Norén GN, Li Y, Stang PE, Madigan D, Ryan PB. Observational Health Data Sciences and Informatics (OHDSI): opportunities for observational researchers. Stud Health Technol Inform 2015;216:574-8.
45. Overhage JM, Ryan PB, Reich CG, Hartzema AG, Stang PE. Validation of a common data model for active safety surveillance research. J Am Med Inform Assoc 2012;19(1):54-60.
46. XGBoost parameters. 2020. https://xgboost.readthedocs.io/en/latest/parameter.html. 47. Notes on parameter tuning. 2020. https://xgboost.readthedocs.io/en/latest/tutorials/param_tuning.html. 48. Luo G, Stone BL, Koebnick C, He S, Au DH, Sheng X, Murtaugh MA, Sward KA, Schatz M, Zeiger RS, Davidson GH,
Nkoy FL. Using temporal features to provide data-driven clinical early warnings for chronic obstructive pulmonary disease and asthma care management: protocol for a secondary analysis. JMIR Res Protoc 2019;8(6):e13783. PMID:31199308
49. Liu LL, Forgione DA, Younis MZ. A comparative analysis of the CVP structure of nonprofit teaching and for-profit non-teaching hospitals. J Health Care Finance 2012;39(1):12-38.

16
Appendix
Table 1. The basic candidate features. Feature category Features Patient demographics features Gender; age; ethnicity (Hispanic or non-Hispanic); race; marital status (single, married,
partnered, separated, widowed, or divorced); and language. Features giving properties of the area with the five-digit zip code of the patient’s home address
The area’s percentage of Hispanic black population; percentage of non-Hispanic black population; percentage of Hispanic white population; percentage of non-Hispanic white population; percentage of Hispanic American Indian and Alaska native population; percentageof non-Hispanic American Indian and Alaska native population; percentage of Hispanic Asianpopulation; percentage of non-Hispanic Asian population; percentage of Hispanic native Hawaiian or other Pacific islander population; percentage of non-Hispanic native Hawaiian or other Pacific islander population; percentage of Hispanic other-race population; percentage of non-Hispanic other-race population; percentage of Hispanic population of two or more races;percentage of non-Hispanic population of two or more races; household income level like the median household income; and the proportion having asthma-related hospital encounters out of all patients with asthma in the area. Except for the last one, all of these features were derived from 2010 census data.
Features giving properties of the census block group where the patient lives
The block group’s percentage of population 25 and older with less than 9th grade education;percentage of population 25 and older with 9th-12th grade education; percentage of population 25 and older with a high school diploma; percentage of population 25 and older with college education and no degree; percentage of population 25 and older with an associate’s degree; percentage of population 25 and older with a bachelor’s degree; and percentage of population 25 and older with a graduate or professional degree. All of these features were computed on the five-year rolling averages from the US Census 2013 American Community Survey.
Features on laboratory tests # of laboratory tests; # of days since taking the last laboratory test; # of laboratory tests with abnormal results; the maximum percentage of blood eosinophils; the maximum blood eosinophil count; whether an immunoglobulin E (IgE) test was done; whether the maximum total serum IgE level is abnormally high; and the maximum total serum IgE level.
Features about standard vital signs
The average diastolic blood pressure; the maximum diastolic blood pressure; the average systolic blood pressure; the maximum systolic blood pressure; the average heart rate; the maximum heart rate; the average respiratory rate; the maximum respiratory rate; the average temperature; the maximum temperature; the average peripheral capillary oxygen saturation (SpO2); the minimum SpO2; the average peak expiratory flow; the minimum peak expiratory flow; the average Z-score for length-for-age; the average Z-score for weight-for-age; the average Z-score for weight-for-length; the maximum body mass index (BMI); the relative change of BMI = (the last noted BMI / the first noted BMI - 1) × 100%; and the relative change of weight = (the last noted weight / the first noted weight - 1) × 100%.
Exercise vital sign features The average # of days per week the patient exercises; and the average # of minutes per weekthe patient exercises.
Diagnosis-related features derived from ICD-10 and ICD-9 diagnosis codes only
# of ICD-10 and ICD-9 diagnosis codes; # of years since the first asthma-coded encounter in the data set; # of asthma diagnoses; # of primary or principal asthma diagnoses; whether the last asthma diagnosis is a primary or a principal one; the last asthma diagnosis’ severity; the highest severity of all of the asthma diagnoses; # of diagnoses of asthma with (acute) exacerbation; # of diagnoses of asthma with status asthmaticus; the last asthma diagnosis’ exacerbation severity (uncomplicated, exacerbation, or asthmaticus); the highest exacerbation severity of all of the asthma diagnoses; # of days since having the last asthma diagnosis; # of days since having the last diagnosis of asthma with (acute) exacerbation or status asthmaticus; family history of asthma; chronic obstructive pulmonary disease; # of years since the first encounter for chronic obstructive pulmonary disease in the data set; allergic rhinitis; ischemic heart disease; esophagitis; gastroesophageal reflux; anxiety or depression; sleep apnea; eczema; gastrostomy tube; obesity; Alzheimer’s or Parkinson’s disease; upper respiratory tract infection; bronchopulmonary dysplasia; bronchiolitis; increased tone; decreased tone; cystic fibrosis; premature birth; pneumonia; immunoglobulin A (IgA) deficiency; vocal cord dysfunction; anaphylaxis; psoriasis; cirrhosis; vasculitis; gastrointestinal bleeding;

17
inflammatory bowel disease; breathing abnormality like dyspnea; gastrointestinal obstruction;mental disorder; vitamin D deficiency; pregnancy; myocardial infarction; folate deficiency; peripheral vascular disease; congestive heart failure; dementia; cerebrovascular disease; peptic ulcer disease; rheumatic disease; substance use; diabetes with chronic complication; diabetes without chronic complication; mild liver disease; renal disease; hemiplegia or paraplegia; moderate or severe liver disease; acquired immunodeficiency syndrome; metastatic solid tumor; malignancy; whether the patient had an asthma action plan; and # of diagnoses ofnoncompliance with medication regimen.
Diagnosis-related features derived collectively from Current Procedural Terminology (CPT) and Healthcare Common Procedure Coding System (HCPCS) procedure codes, and ICD-10 and ICD-9 diagnosis codes
Sinusitis; and cataract.
Diagnosis-related feature derived collectively from ICD-10 and ICD-9 procedure codes, and ICD-10 and ICD-9 diagnosis codes
Tracheostomy.
Features derived from the problem list
# of active problems; # of active problems of asthma; # of active problems of asthma with (acute) exacerbations; # of active problems of wheezing; # of active problems of obesity; # of active problems of sleep apnea; # of active problems of atherosclerosis; # of active problems of hyperlipidemia; # of active problems of congestive heart failure; # of active problems ofchronic obstructive pulmonary disease; # of active problems of hypertension; # of active problems of diabetes; # of active problems of gastroesophageal reflux disease; # of active problems of rhinitis; # of active problems of anxiety/depression; # of active problems onsmoking; # of active problems on care management; and the priority of the most recent active problem of asthma.
Features derived from the medical history
# of medical history diagnosis codes; and # of medical history diagnosis codes of asthma.
Features on medications # of medication orders; total copay for medications; total # of medications ordered; total # of different medications ordered; total # of medications filled; total # of units of medicationsfilled; the asthma medication ratio [50]; # of asthma medication orders; total copay for asthma medications; total # of asthma medications ordered; total # of different medications in all of the asthma medication orders; total # of asthma medications filled; total # of units of asthma medications filled; # of days since the last use of asthma medications; # of asthma medications used on the last day; total # of short-acting beta-2 agonists ordered; total # of units of short-acting beta-2 agonists filled; # of fills of short-acting beta-2 agonists; # of days since the last use of short-acting beta-2 agonists; total # of systemic corticosteroids ordered; total # of units of systemic corticosteroids filled; # of fills of systemic corticosteroids; # of days since the last use of systemic corticosteroids; # of asthma reliever orders; total # of asthma relievers filled; total # of asthma relievers ordered; total # of different asthma relievers ordered; total # of units of asthma relievers filled; # of days since the last use of asthma relievers; # of fills of asthma reliever medications that are neither systemic corticosteroids nor short-acting beta-2 agonists;total # of units of asthma reliever medications filled that are neither systemic corticosteroidsnor short-acting beta-2 agonists; # of days since the last use of asthma controllers; # of days of supply of the last asthma controller fill; the strength of each dose of the last asthma controller fill; # of asthma controller orders; total # of asthma controllers filled; total # of asthma controllers ordered; total # of different asthma controllers ordered; total # of units of asthma controllers filled; total # of days of gap in asthma controller use; total # of inhaled corticosteroids ordered; total # of units of inhaled corticosteroids filled; # of fills of inhaled corticosteroids; total dose of inhaled corticosteroids; # of days since the last use of inhaled corticosteroids; total # of mast cell stabilizers ordered; total # of units of mast cell stabilizers

18
filled; # of fills of mast cell stabilizers; whether spacer was used; whether nebulizer was used; # of nebulizer medication orders; total # of fills of nebulizer medications; # of days since the last use of nebulizer medications; total # of nebulizer medications ordered; total # of differentnebulizer medications ordered; and total # of units of nebulizer medications filled.
Features on insurances The patient’s insurance category (commercial, exchange, public, self-paid plan, or other) on the last day.
Features on the patient’s visit types
# of visits; # of outpatient visits; # of outpatient visits to the patient’s PCP; # of outpatient visits having a primary diagnosis of asthma; # of ED visits; # of ED visits on asthma; the average length of stay of an ED visit; the last ED visit’s length of stay; # of hospitalizations; the average length of a hospitalization; the total length of all of the hospitalizations; # of hospitalizations, ED visits, and outpatient visits; whether the patient had any hospitalization, ED visit, or outpatient visit on asthma; # of virtual visits; # of virtual visits by email; # of virtual visits by phone; # of urgent care visits; # of urgent care visits for asthma; # of othertypes of visits (e.g., home health) that are not outpatient visits, ED visits, hospitalizations, or virtual visits; # of admissions to intensive care; # of major visits for asthma; the last visit’s admission type (emergency, urgent, elective, or trauma); the last visit’s type (outpatient visit, ED visit, hospitalization, virtual, or other); # of visits on asthma care management; and the most emergent admission type of all of the visits.
Features about appointment scheduling and visit status
# of cancelled appointments; # of no shows; the day of the week of the last ED visit’s admission time; the last visit’s discharge disposition location (left against medical advice, home, or other non-home location); # of times the patient left against medical advice; for the last visit, the time from making the request to the actual visit indicating the request’s urgency; among all of the visits, the shortest time from making the request to the actual visit; # of visits with same day appointments; # of days since the last hospitalization; whether the last hospitalization was through the ED; # of days since the last ED visit; # of days since the last ED visit on asthma; # of days since the last outpatient visit; # of days since the last outpatient visit on asthma; # of days since the last virtual visit; # of days since the last other type of visitthat is not an outpatient visit, an ED visit, a hospitalization, or a virtual visit; the average length of appointment of an outpatient visit with asthma as the primary diagnosis; and the average length of appointment of an outpatient visit.
Features showing the patient’s care continuity and access to KPSC resources
# of different EDs the patient visited; # of different PCPs of the patient; # of different providers seen in outpatient visits; # of different asthma medication prescribers; # of different medication prescribers; and whether the patient had access to kp.org.
Features on procedures # of ICD-10 and ICD-9 procedure codes; mechanical ventilation indicated by ICD-10 and ICD-9 procedure codes; # of CPT/HCPCS procedure codes; # of HCPCS procedure codes ofhome oxygen therapy; # of CPT/HCPCS procedure codes of influenza vaccination; # of CPT procedure codes of the fractional exhaled nitric oxide (FeNO) test; and # of CPT procedure codes of pulmonary function tests.
Allergy features # of allergies of the patient; indicator of drug or material allergy; the highest severity of the drug or material allergies the patient had; indicator of environmental allergy; the highest severity of the environmental allergies the patient had; indicator of food allergy; and the highest severity of the food allergies the patient had.
Feature on clinical assessments
The average asthma control test score; the minimum asthma control test score; whether asthma control test was done on the patient; the maximum Patient Health Questionnaire-9 (PHQ-9) total score; the average PHQ-9 total score; and whether PHQ-9 assessment was done on the patient. The asthma control test is used to assess the level of asthma control. A larger asthma control test score reflects better asthma control. The PHQ-9 is employed to diagnose, screen, measure the severity of, and monitor depression. A larger PHQ-9 total score reflects more severe depression.
Features on pulmonary function tests
The average pre-bronchodilator forced expiratory volume in 1 second / forced vital capacity (FEV1/FVC) ratio; the minimum pre-bronchodilator FEV1/FVC ratio; the average post-bronchodilator FEV1/FVC ratio; the minimum post-bronchodilator FEV1/FVC ratio; the average pre-bronchodilator FEV1% predicted; the minimum pre-bronchodilator FEV1% predicted; the average post-bronchodilator FEV1% predicted; the minimum post-

19
bronchodilator FEV1% predicted; and whether any pulmonary function test was performed on the patient.
Features on social behavior history
Whether the patient drank alcohol based on the last record; whether the patient was ever recorded of drinking alcohol; # of fluid ounces of alcohol the patient drank per week based on the last record; the average # of fluid ounces of alcohol the patient drank per week across all of the records; # of alcohol drinks the patient had per week based on the last record; the average # of alcohol drinks the patient had per week across all of the records; whether the patient was a smoker based on the last record; whether the patient was a former smoker based on the last record; # of packs of cigarettes the patient smoked per day based on the last record; the average# of packs of cigarettes the patient smoked per day across all of the records; # of years for which the patient had smoked based on the last record; whether the patient used any illicit drugbased on the last record; whether the patient was ever recorded of using an illicit drug; # of times per week the patient used illicit drugs based on the last record; and the average # of times per week the patient used illicit drugs across all of the records.
Provider features The patient’s current PCP is defined as the patient’s PCP known at the last clinic visit. The PCP features include: the PCP’s age; whether the patient and the PCP are of the same gender; # of years for which the PCP had practiced at KPSC; # of patients of the PCP; # of patients with asthma of the PCP; total # of opioid prescriptions the PCP ordered for the PCP’s patients; total # of antibiotic prescriptions the PCP ordered for the PCP’s patients; total # of oral steroidprescriptions the PCP ordered for the PCP’s patients; and among all of the PCP’s patients with asthma in the pre-index year, the proportion who had asthma-related hospital encounters in the index year.
Table 2. The features employed in our final predictive model and their importance values. Rank Feature Importance computed as
the feature’s fractional contribution to the model
1 Total # of units of nebulizer medications filled 0.0819 2 # of asthma reliever orders 0.0794 3 Total # of asthma relievers ordered 0.0655 4 # of days since having the last diagnosis of asthma with (acute) exacerbation or status
asthmaticus 0.0541
5 # of ED visits on asthma 0.0437 6 # of nebulizer medication orders 0.0336 7 # of ED visits 0.0328 8 # of ED visits on asthma in the pre-index year 0.0279 9 Age 0.0264
10 # of primary or principal asthma diagnoses 0.0230 11 # of ED visits in the pre-index year 0.0204 12 Total # of asthma relievers filled 0.0201 13 Total # of units of nebulizer medications filled in the pre-index year 0.0184 14 # of major visits for asthma in the pre-index year 0.0170 15 The highest exacerbation severity of all of the asthma diagnoses in the pre-index year 0.0169 16 # of nebulizer medication orders in the pre-index year 0.0157 17 # of days since the last ED visit on asthma 0.0153 18 # of ED visits on asthma in the pre-pre-index year 0.0143 19 The day of the week of the last ED visit’s admission time 0.0142 20 The highest exacerbation severity of all of the asthma diagnoses 0.0139 21 Total # of short-acting beta-2 agonists ordered 0.0127 22 # of ED visits in the pre-pre-index year 0.0125 23 Whether the patient is black or African American 0.0124 24 Total copay for medications in the pre-pre-index year 0.0101 25 # of primary or principal asthma diagnoses in the pre-index year 0.0101 26 # of asthma reliever orders in the pre-index year 0.0097

20
27 # of active problems of asthma 0.0089 28 # of asthma diagnoses 0.0087 29 # of major visits for asthma 0.0084 30 # of days since the last use of asthma relievers 0.0078 31 Total copay for medications 0.0066 32 The highest exacerbation severity of all of the asthma diagnoses in the pre-pre-index year 0.0063 33 # of primary or principal asthma diagnoses in the pre-pre-index year 0.0063 34 Total # of units of nebulizer medications filled in the pre-pre-index year 0.0060 35 Total # of units of asthma relievers filled in the pre-index year 0.0057 36 Total # of units of medications filled 0.0055 37 # of virtual visits by email 0.0055 38 Whether the patient had access to kp.org 0.0052 39 # of no shows 0.0051 40 # of active problems of asthma with (acute) exacerbations 0.0049 41 The average respiratory rate 0.0045 42 # of visits with same day appointments 0.0045 43 The average heart rate 0.0045 44 The maximum temperature 0.0044 45 # of asthma medication orders in the pre-index year 0.0044 46 The average SpO2 0.0043 47 Whether the last visit’s admission type is elective 0.0043 48 # of asthma reliever orders in the pre-pre-index year 0.0043 49 # of nebulizer medication orders in the pre-pre-index year 0.0043 50 Whether the patient is divorced 0.0042 51 The area’s median household income 0.0042 52 Total copay for medications in the pre-index year 0.0041 53 # of days since having the last asthma diagnosis 0.0039 54 The area’s percentage of household income that is between 150,000 and $199,999 0.0036 55 Whether the most emergent admission type of all of the visits is emergency 0.0035 56 # of years for which the patient had asthma 0.0033 57 Total # of units of short-acting beta-2 agonists filled 0.0031 58 Whether the patient is single 0.0029 59 The maximum percentage of blood eosinophils 0.0028 60 The maximum BMI 0.0025 61 # of asthma medication orders in the pre-pre-index year 0.0024 62 # of asthma diagnoses in the pre-index year 0.0024 63 # of diagnoses of asthma with (acute) exacerbation 0.0023 64 The proportion having asthma-related hospital encounters out of all patients with asthma in
the area 0.0022
65 # of medical history diagnosis codes 0.0022 66 # of virtual visits 0.0022 67 Total # of units of asthma relievers filled 0.0022 68 # of major visits for asthma in the pre-pre-index year 0.0021 69 The relative change of weight 0.0021 70 Whether the patient is Hispanic 0.0021 71 Whether the patient is married 0.0020 72 Total # of asthma relievers ordered in the pre-pre-index year 0.0020 73 Whether the last visit’s admission type is emergency 0.0019 74 Total # of days of gap in asthma controller use 0.0018 75 # of ICD-10 and ICD-9 diagnosis codes 0.0018 76 # of days since the last outpatient visit 0.0017 77 The average Z-score for weight-for-length 0.0017 78 # of days since the last use of asthma medications 0.0017 79 Total # of medications filled 0.0017

21
80 Whether the patient has public insurance on the last day 0.0016 81 Total # of fills of nebulizer medications 0.0016 82 The average # of days per week the patient exercises 0.0016 83 The block group’s percentage of population 25 and older with college education and no
degree 0.0016
84 The area’s percentage of household income that is between $20,000 and $29,999 0.0015 85 # of laboratory tests with abnormal results 0.0015 86 The block group’s percentage of population 25 and older with less than 9th grade
education 0.0015
87 # of active problems of diabetes 0.0015 88 # of days since taking the last laboratory test 0.0015 89 The maximum systolic blood pressure 0.0014 90 The average Z-score for length-for-age 0.0014 91 Total # of units of asthma relievers filled in the pre-pre-index year 0.0014 92 # of days since the last use of short-acting beta-2 agonists 0.0013 93 Total # of units of inhaled corticosteroids filled 0.0013 94 # of days since the last use of inhaled corticosteroids 0.0013 95 # of days since the last virtual visit 0.0012 96 # of urgent care visits 0.0012 97 # of days since the last use of nebulizer medications 0.0012 98 The area’s percentage of household income that is between $75,000 and $99,999 0.0011 99 Breathing abnormality like dyspnea 0.0011
100 The area’s percentage of household income that is between $35,000 and $39,999 0.0011 101 # of outpatient visits 0.0011 102 # of different providers seen in outpatient visits 0.0011 103 # of days since the last other type of visit that is not an outpatient visit, an ED visit, a
hospitalization, or a virtual visit 0.0011
104 # of active problems of obesity 0.0011 105 Total # of nebulizer medications ordered 0.0010 106 The area’s percentage of household income that is between $10,000 and $14,999 0.0010 107 The block group’s percentage of population 25 and older with 9th-12th grade education 0.0010 108 Total # of different medications ordered 0.0010 109 # of years for which the patient had chronic obstructive pulmonary disease 0.0010 110 # of patients with asthma of the PCP 0.0010 111 # of active problems 0.0010 112 # of visits 0.0009 113 # of years for which the patient had smoked based on the last record 0.0009 114 # of medical history diagnosis codes of asthma 0.0009 115 Substance use 0.0009 116 The maximum blood eosinophil count 0.0009 117 Eczema 0.0009 118 Total # of units of asthma medications filled 0.0009 119 # of active problems of anxiety/depression 0.0009 120 # of active problems of chronic obstructive pulmonary disease 0.0009 121 The average peak expiratory flow 0.0009 122 Sinusitis 0.0008 123 The maximum heart rate 0.0008 124 # of active problems of hypertension 0.0008 125 Total # of units of asthma controllers filled 0.0008 126 The area’s percentage of household income that is between $30,000 and $34,999 0.0008 127 The average temperature 0.0008 128 # of days since the last ED visit 0.0008 129 The block group’s percentage of population 25 and older with an associate’s degree 0.0007 130 Whether the patient is a female 0.0007

22
131 The area’s percentage of non-Hispanic black population 0.0007 132 The minimum peak expiratory flow 0.0007 133 Total # of medications ordered 0.0007 134 Among all patients with asthma of the PCP in the pre-index year, the proportion who had
asthma-related hospital encounters in the index year 0.0007
135 Upper respiratory tract infection 0.0007 136 The area’s percentage of household income that is between $40,000 and $44,999 0.0007 137 Total copay for asthma medications 0.0007 138 The minimum SpO2 0.0007 139 # of active problems of asthma in the pre-index year 0.0007 140 # of active problems of atherosclerosis 0.0007 141 Chronic obstructive pulmonary disease 0.0006 142 The area’s percentage of non-Hispanic population of two or more races 0.0006 143 The area’s percentage of non-Hispanic American Indian and Alaska native population 0.0006 144 # of days since the last use of systemic corticosteroids 0.0006 145 The area’s percentage of non-Hispanic other-race population 0.0006 146 # of cancelled appointments 0.0006 147 Whether the patient was a smoker based on the last record 0.0006 148 The area’s percentage of household income that is between $50,000 and $59,999 0.0006 149 # of different medication prescribers 0.0006 150 The area’s percentage of Hispanic population of two or more races 0.0006 151 The average systolic blood pressure 0.0006 152 # of active problems of rhinitis 0.0005 153 The average diastolic blood pressure 0.0005 154 Whether the patient is white 0.0005 155 The average length of stay of an ED visit 0.0005 156 The average length of appointment of an outpatient visit with asthma as the primary
diagnosis 0.0005
157 # of CPT/HCPCS procedure codes 0.0005 158 The highest severity of the drug or material allergies the patient had 0.0005 159 The block group’s percentage of population 25 and older with a high school diploma 0.0005 160 The area’s percentage of non-Hispanic Asian population 0.0005 161 The last ED visit’s length of stay 0.0005 162 # of asthma medication orders 0.0004 163 The area’s percentage of Hispanic American Indian and Alaska native population 0.0004 164 The highest severity of all of the asthma diagnoses 0.0004 165 The block group’s percentage of population 25 and older with a bachelor’s degree 0.0004 166 Total # of oral steroid prescriptions the PCP ordered for the PCP’s patients 0.0004 167 The area’s percentage of non-Hispanic white population 0.0004 168 Whether the patient had any hospitalization, ED visit, or outpatient visit on asthma 0.0004 169 The area’s percentage of household income that is between $125,000 and $149,999 0.0004 170 The area’s percentage of Hispanic black population 0.0004 171 # of fills of systemic corticosteroids 0.0004 172 The maximum respiratory rate 0.0004 173 # of active problems of hyperlipidemia 0.0004 174 The total length of all of the hospitalizations 0.0003 175 # of active problems of asthma in the pre-pre-index year 0.0003 176 The area’s percentage of household income that is <$10,000 0.0003 177 The relative change of BMI 0.0003 178 The area’s percentage of household income that is between $15,000 and $19,999 0.0003 179 Pregnancy 0.0003 180 The maximum diastolic blood pressure 0.0003 181 The average length of appointment of an outpatient visit 0.0003 182 The average # of minutes per week the patient exercises 0.0003
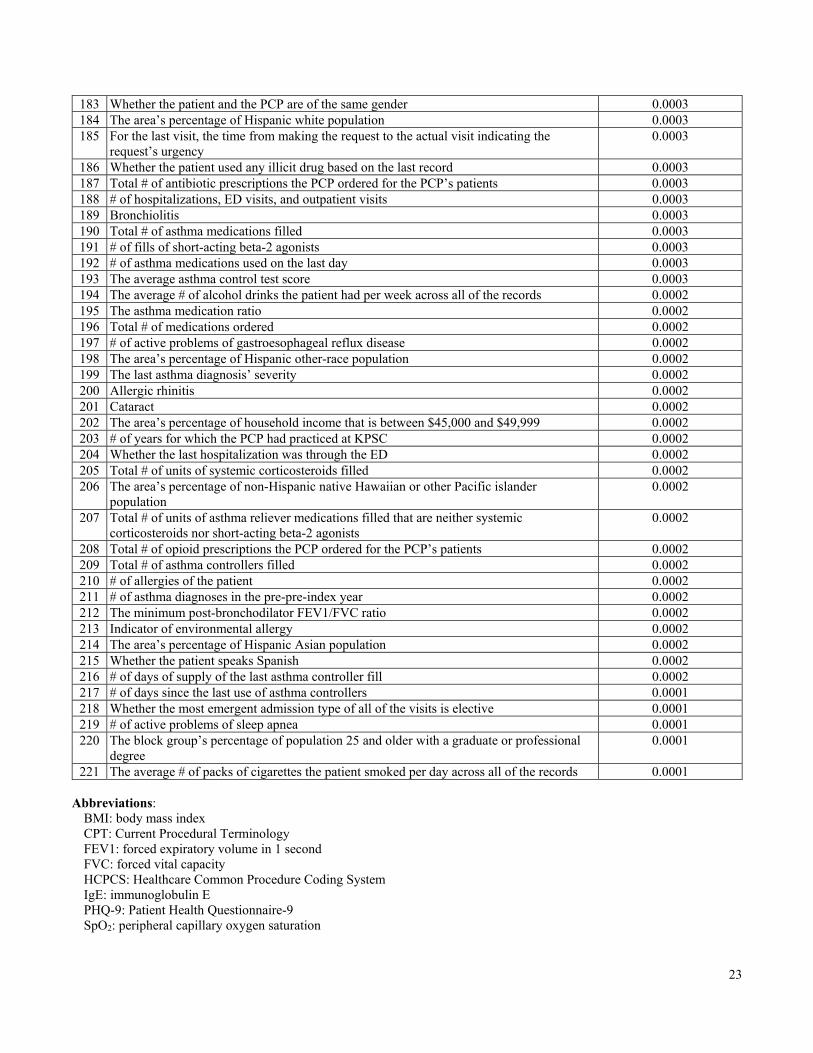
23
183 Whether the patient and the PCP are of the same gender 0.0003 184 The area’s percentage of Hispanic white population 0.0003 185 For the last visit, the time from making the request to the actual visit indicating the
request’s urgency 0.0003
186 Whether the patient used any illicit drug based on the last record 0.0003 187 Total # of antibiotic prescriptions the PCP ordered for the PCP’s patients 0.0003 188 # of hospitalizations, ED visits, and outpatient visits 0.0003 189 Bronchiolitis 0.0003 190 Total # of asthma medications filled 0.0003 191 # of fills of short-acting beta-2 agonists 0.0003 192 # of asthma medications used on the last day 0.0003 193 The average asthma control test score 0.0003 194 The average # of alcohol drinks the patient had per week across all of the records 0.0002 195 The asthma medication ratio 0.0002 196 Total # of medications ordered 0.0002 197 # of active problems of gastroesophageal reflux disease 0.0002 198 The area’s percentage of Hispanic other-race population 0.0002 199 The last asthma diagnosis’ severity 0.0002 200 Allergic rhinitis 0.0002 201 Cataract 0.0002 202 The area’s percentage of household income that is between $45,000 and $49,999 0.0002 203 # of years for which the PCP had practiced at KPSC 0.0002 204 Whether the last hospitalization was through the ED 0.0002 205 Total # of units of systemic corticosteroids filled 0.0002 206 The area’s percentage of non-Hispanic native Hawaiian or other Pacific islander
population 0.0002
207 Total # of units of asthma reliever medications filled that are neither systemic corticosteroids nor short-acting beta-2 agonists
0.0002
208 Total # of opioid prescriptions the PCP ordered for the PCP’s patients 0.0002 209 Total # of asthma controllers filled 0.0002 210 # of allergies of the patient 0.0002 211 # of asthma diagnoses in the pre-pre-index year 0.0002 212 The minimum post-bronchodilator FEV1/FVC ratio 0.0002 213 Indicator of environmental allergy 0.0002 214 The area’s percentage of Hispanic Asian population 0.0002 215 Whether the patient speaks Spanish 0.0002 216 # of days of supply of the last asthma controller fill 0.0002 217 # of days since the last use of asthma controllers 0.0001 218 Whether the most emergent admission type of all of the visits is elective 0.0001 219 # of active problems of sleep apnea 0.0001 220 The block group’s percentage of population 25 and older with a graduate or professional
degree 0.0001
221 The average # of packs of cigarettes the patient smoked per day across all of the records 0.0001
Abbreviations: BMI: body mass index CPT: Current Procedural Terminology FEV1: forced expiratory volume in 1 second FVC: forced vital capacity HCPCS: Healthcare Common Procedure Coding System IgE: immunoglobulin E PHQ-9: Patient Health Questionnaire-9 SpO2: peripheral capillary oxygen saturation

24
References 50. Andrews AL, Simpson AN, Basco WT Jr, Teufel RJ 2nd. Asthma medication ratio predicts emergency department visits
and hospitalizations in children with asthma. Medicare Medicaid Res Rev 2013;3(4):E1-10. PMID:24834366


![Childhood Asthma A triad of atopic eczema, allergic rhinitis and asthma is called atopy.[53] The strongest risk factor for developing asthma is a history](https://img.dokumen.tips/doc/110x75/56649e4b5503460f94b3f101/childhood-asthma-a-triad-of-atopic-eczema-allergic-rhinitis-and-asthma-is.jpg)