Embed Size (px)
Citation preview
DEVELOPMENT OF A MARINE
ENERGY ROADMAP FOR PANAMA
Masters of Mechanical Engineering with
Renewable Energy Individual Project
By: Chris Matthew
31st of March, 2016

i
PERSONAL STATEMENT
The Panamanian government recently begun an investigation into the potential of marine
energy locally. Commissioned by the UK Commonwealth Foreign Office, the Energy Policy,
Economics and Innovation department of the Institute for Energy Systems has focused on
developing a more detailed picture of the potential for marine energy in Panama. This led to
the project description being provided by Henry Jeffrey, the project supervisor along with
Laura Finlay. The outline, along with guidance from the project supervisors, provided the
basic structure of the report in terms of major aspects addressed; namely resource,
technology, infrastructure and supply chain, financial mechanisms and legislation and
regulation.
From this, my work progressed by personal investigation and collation of information for each
of the above aspects in sequence. Weekly meetings with Henry and Laura provided feedback
and, initially, direction, but the review of literature and final recommendations which
constitutes the main body of this report were conducted independently. Given my lack of
prior experience of the marine energy sector, guidance was more pronounced initially, but
subsided as the project progressed with my knowledge and understanding.
Progress in this way was steady, although a lack of fluency in Spanish was problematic at
times whilst investigating Panama, with limited information being available online in English.
I found the only other major difficulty was condensing work down: in my case several months-
of investigation yielded a significant amount of writing, not all of which was relevant to the
final report. In any case, all research was beneficial developing a more comprehensive
understanding of the sector overall which hopefully has been conveyed within.
Thank you for taking the time to read my report.
31st of March, 2016
Date
Signed
(Chris Matthew)

ii
SUMMARY
DEVELOPMENT OF A MARINE ENERGY ROADMAP FOR PANAMA
By Chris Matthew
31st of March, 2016
In this report, a roadmap for marine energy is developed for Panama, to present marine
energy as a yet-unconsidered form of electricity generation and inform strategic decision-
making. Increasing demand for diversified renewable energy in Panama is demonstrated
alongside description of the vast potential energy available in the oceans. The roadmap
structure is then presented as suitable for assessment of Panama: analysis of other
roadmaps and two decision-making tools, PESTLE and the analytic hierarchy process led to
choice of a high-level, PESTLE-style analysis with alternative subheadings given the example
of other marine energy roadmaps.
An understanding of the marine energy sector globally was then developed in terms of
resource, technology, infrastructure and supply chain, finances and legislation and regulation.
This is used to assess Panama relative to these factors, allowing determination of strengths
of and gaps in the local marine energy landscape. Analysis both globally and locally in Panama
is conducted for each subheading, followed by brief discussion of the findings.
Based on this, recommendations are made with respect to what steps would be necessary
for both deployment and development scenarios for marine energy. Certain aspects are
found to be eminently suitable for marine energy, such as the ocean thermal energy
conversion (OTEC) resource, tidal barrage supply chain, infrastructure associated with the
Panama Canal and success with existing wind and solar laws. However, other aspects are
identified as requiring development, including: further investigation of the tidal range and
OTEC resource, development of infrastructure and expansion outwith the canal,
implementing appropriate financial mechanisms and developing a marine spatial plan, a
“one-stop-shop” consenting process and a strategic environmental assessment for OTEC.
These major recommendations are presented graphically to form the main conclusions of
the report.

iii
TABLE OF CONTENTS
1. INTRODUCTION .......................................................................................................................... 1
1.1. Project Motivation ............................................................................................................. 1
1.2. Project Outline ................................................................................................................... 4
2. LITERATURE REVIEW .................................................................................................................. 6
2.1. Technology Roadmaps ..................................................................................................... 6
2.2. Renewable Energy Roadmaps ........................................................................................ 7
2.3. Marine Energy Roadmaps ............................................................................................... 8
2.4. Decision Making Comparison ......................................................................................... 9
2.4.1. PESTLE Analysis Outline ................................................................................... 9
2.4.2. Analytic Hierarchy Process Outline ............................................................. 10
2.4.3. Comparison of Analytic Hierarchy Process and PESTLE ........................ 11
3. METHODOLOGY ...................................................................................................................... 12
4. RESULTS AND DISCUSSION .................................................................................................. 14
4.1. Marine Energy Resource................................................................................................ 14
4.1.1. Resource Case Studies................................................................................... 14
4.1.2. Resource in Panama ....................................................................................... 18
4.1.3. Discussion ......................................................................................................... 23
4.2. Technology, Infrastructure and Supply Chain .......................................................... 24
4.2.1. Available Technology ...................................................................................... 25
4.2.2. Infrastructure and Supply Chain Requirements ...................................... 29
4.2.3. Infrastructure and Supply Chain in Panama ............................................. 31
4.2.4. Discussion ......................................................................................................... 36
4.3. Financial Mechanisms .................................................................................................... 37
4.3.1. The Need for Financial Mechanisms in Renewable Energy ................... 37
4.3.2. Outline of Financial Support Mechanisms ................................................ 39
4.3.3. Financial Mechanisms in Panama ............................................................... 43
4.3.4. Discussion ......................................................................................................... 45

iv
4.4. Legislation and Regulation ............................................................................................ 46
4.4.1. Marine Energy Legislation and Regulation ................................................ 46
4.4.2. Legislation and Regulation in Panama ....................................................... 50
4.4.3. Discussion ......................................................................................................... 53
5. RECOMMENDATIONS ............................................................................................................. 54
5.1. Deployment Scenario ..................................................................................................... 55
5.2. Development Scenario ................................................................................................... 56
6. CONCLUSIONS ........................................................................................................................ 58
REFERENCES ...................................................................................................................................... 60

v
GLOSSARY
AHP : Analytic hierarchy process
AMP : National Marine Authority of Panama [La Autoridad Marítima de
Panamá]
ANAM : National Environment Authority [Autoridad Nacional del Ambiente]
ARAP : Authority on the Aquatic Resources of Panama [Autoridad de los
Recursos Acuáticos de Panamá]
ASEP : National Authority of Public Services [Autoridad Nacional de los
Servicios Publicos]
EEA : European Environment Agency
EIA : Environmental impact assessment
EMEC : European Marine Energy Centre
ETESA : Electricity Transmission Company of Panama [Empresa de Transmisión
Eléctrica, S.A]
FiT : Feed-in-tariff
GIS : Geographic information system
IRENA : International Renewable Energy Agency
LCOE : Levelised cost of electricity
MEF : Ministry of Economy and Finances [Ministerio de Economía y Finanzas]
MHK : Marine hydro-kinetic
MIVIOT : Ministry of Housing and Land Management [Ministerio de Vivienda y
Ordenamiento Territorial]
MSP : Marine spatial plan
NCRE : Non-conventional renewable energy
OES : Ocean Energy Systems
ORECCA : Off-shore Renewable Energy Conversion platforms – Coordination
Action
OTEC : Ocean thermal energy conversion
ROC : Renewable Obligation Certificate
SEA : Strategic environmental assessment
TEC : Tidal energy converter
WEC : Wave energy converter
1
1. INTRODUCTION
1.1. Project Motivation
Panamanian per capita electricity demand has nearly quadrupled since 1971, its population
grew from 1.5 million to 3.8 million over the same period (World Bank, 2015) and electrical
generation capacity increased from 560 MW in 1980 (Energy Information Agency, 2015) to
2,746 MW in May 2015 (Gómez, 2015). This growth is expected to continue, with the
Panamanian National Energy Secretariat [Secretaría Nacional de Energía] estimating
electrical energy consumption will increase from approximately 9,000 GWh in 2015 to 12,000
GWh in 2025, with peak demand roughly doubling to 2,900 MW (National Energy Secretariat ,
2009). As such, there is a clear need in Panama for new electricity generating capacity to
meet this increasing demand.
Existing capacity has been split largely between hydropower and fossil fuels, with
hydroelectric decreasing from 80% of installed capacity in 1996 (National Energy Secretariat ,
2009) to 52% in May 2015 (Gómez, 2015). This dependency on just two main sources of
electricity has been problematic, with the de-rated capacity margin (a metric used to assess
security of supply) falling to 0% in 2010 (National Competitiveness Centre, 2015) and
emergency electricity rationing enforced in 2013 due to a period of drought restricting
hydroelectric capacity (Kriel, 2013). Although as much as 3,040 MW of further potential
hydropower development has been identified (National Energy Secretariat , 2009), this or the
construction of additional fossil fuel plants will only mitigate the underlying problem of
ensuring security and robustness of supply, as Panama has no indigenous fossil fuels (World
Energy Council, 2013a),
Although the causal relation between economic growth and electrical consumption has been
debated (Payne, 2010; Ozturk, 2010), it is apparent that shortages of electricity supply will
negatively affect development. Given the over-reliance on just two sources it is clear that
diversification is the best option, with it generally agreed that diversification and import
dependency contribute positively and negatively respectively towards energy security
(Lesbirel, 2004; Li, 2005; Sovacool & Mukherjee, 2011). Development of local renewable
energy sources will both increase diversity in the electricity supply and also reduces import
dependency. This has already been recognised by the Panamanian government, with goals
of combatting climate change, reducing emissions and diversifying supply outlined in
legislation such as Executive Decree No. 36 of 2007 (National Assembly of Panama, 2007)
and Law No. 45 of 2004 (National Assembly of Panama, 2004).

2
Specific laws have already led to deployment of significant renewable capacity in Panama.
This includes 337 MW of onshore wind (Lewis & Behar, 2015) and 66 MW of solar power
(ETESA: Electricity Transmission Company of Panama, 2014). However, even with these
indications of moving away from traditional capacity, consideration thus far in Panama has
been solely of these two technologies. The most recent National Energy Plan [Plan Nacional
de Energía] for 2009-2023 mentions marine energy as at a “frankly experimental stage” which
will “not contribute measurably to national future energy” (National Energy Secretariat , 2009,
pp. 87, Author's Translation). Despite this, Panama already displays promising suitability for
marine energy technology: possessing 2,500 km of coastline adjacent to both the Pacific
Ocean and Caribbean Sea (Central Intelligence Agency, 2013) and having a strong vested
interest in the oceans, with marine sectors generating roughly 20% of GDP (Ibañez, 2014).
Oceans contain energy in numerous ways, including gravitational potential, kinetic, chemical
and thermal energy. Useful energy that can be converted into electricity can be broken down
into waves, tidal range, tidal currents, open ocean currents, thermal energy differentials and
osmotic potential (Lewis & Estefen, 2011). Of these, technological maturity varies greatly.
Tidal barrage is the most mature, with megawatt scale capacity deployed in 1968 (Bernshtein,
1972). Ocean current, by comparison, remains at a conceptual stage pending improvements
in turbine technology to utilise slower flow rates (Bedard, et al., 2010). In this report, the focus
will be on wave, tidal current, tidal range and ocean thermal energy conversion (OTEC).
Osmotic power and ocean currents are omitted as both sectors are considered too
immature to make an understanding of factors, such as available resource and technology
requirements, too uncertain; rendering further analysis unreliable (Mofor, et al., 2014).
Estimates of the globally available marine energy resource vary considerably, but all concur
that for each of the four types above the potential is significant. One estimate puts the
theoretical potential for all technologies at as high as 7,400 EJ/year (2,055,555 TWh/year)
(Lewis & Estefen, 2011), as much as 15 times greater than global primary energy
consumption in 2013 (Energy Information Agency, 2015). Shown in Figure 1, waves are
estimated to contain 29,000 TWh/year globally, largely confined to latitudes of 30-60° (Mørk,
et al., 2010). OTEC estimates includes 55,000 TWh/year (Lockheed Martin, 2012), with the
complementary distribution at latitudes of less than 30° shown in Figure 2. Energy estimates
for tidal current and tidal range are highly dependent on local topography and other factors,
making global energy estimates problematic, but consideration of both sources gave a total
of 7,800 TWh/year (OES: Ocean Energy Systems, 2011). Distribution of the M2 tidal range (the
principal semidiurnal component) is shown in Figure 3 to indicate the distribution of
significant resource.

3
Figure 1: Global wave power depiction (Cornett, 2008).
Figure 2: Global average temperature difference between 20-1000m water depths (Vega, 2014, p. 20).
Tidal Range (cm)
0
70 35 105 140
Figure 3: Global map of the M2 tidal constituent (OES, 2011).

4
1.2. Project Outline
Given the enormous potential of marine energy and the clear demand for diversified
electricity, marine energy should be given due consideration. Technology or sectoral
roadmapping is widely used in the renewable energy industry as “A future based strategic
planning device” (Winebrake, 2003, p. 1) and is an excellent tool for assessing the potential
for marine energy in Panama. This represents the main aim of this project: to use the
roadmap structure to create a strategic proposal for the potential development and
commercialisation of the marine energy sector in Panama.
This report first examines existing roadmaps in the Literature Review (p. 6); starting with their
general structure, before analysing specific renewable energy and marine energy examples
to determine common features and how to best structure analysis. Two decision making
tools are discussed and compared in detail:
PESTLE: an open ended analysis of the Political, Economic, Social, Technological,
Legal and Environmental aspects.
Analytic Hierarchy Process (AHP): a systematic method of analysing complex
decisions with multiple solutions.
The PESTLE approach was then determined, in the Methodology (p. 12), to be more
appropriate given the nature of the project. However, given the barriers and strategies
outlined in existing marine energy roadmaps, an alternative framework described below was
determined to be more appropriate. The main body of the report is dedicated to the Results
and Discussion (p. 14), where the global case best suited to facilitating marine energy is
determined and compared to conditions in Panama for the following subheadings:
1. Resource, which entails four case studies, one for each energy source, from countries
with some of the most significant resource globally to compare with the Panamanian
example.
2. Technology, infrastructure and supply chain, where examination of current
technology allows understanding of infrastructural and supply chain requirements:
from this Panamanian suitability for developing or deploying each technology is
discussed.
3. Financial Mechanisms, in terms of mechanisms to encourage marine energy, are
outlined and compared to existing general renewable energy measures in Panama.
4. Legislation and regulation for marine energy is considered, leading to identification of
key barriers and how best to reduce these in Panama.

5
From this understanding of the critical factors influencing the marine energy sector both
globally and in Panama, a strategic plan to be outlined as described in the Recommendations
(p. 54). This is based on two scenarios: one, more passive approach, involving deployment of
technologies improved and developed elsewhere globally and the other, more proactive
approach, involving the development of technology locally. The suitability of the existing
landscape in Panama is discussed, with the measures which would need to be enacted
summarised graphically. This enhanced understanding of the potential for marine energy
locally, as well as the steps (and importantly an indication of the level of investment required)
which best facilitate its development, allows for better informed decision making in Panama
regarding developing electricity generation capacity.
6
2. LITERATURE REVIEW
2.1. Technology Roadmaps
Technology roadmaps were formally developed by Motorola in the 1970s, initially for product
planning at a company level (Willard & McClees, 1987). A roadmap can be summarised as “A
future based strategic planning device that outlines the goals, barriers, strategies necessary
for achieving a given vision of technological advancement and market penetrations”
(Winebrake, 2003, p. 1). Generally, roadmaps consider three key points (Amer & Daim, 2010):
1. Determining a vision in terms of targets and goals;
2. Determining the current state of affairs relative to this;
3. Outlining what steps would be necessary to implement the stated vision.
This provides an extended outlook, which identifies critical factors and allows better informed
investment in developing technology (Bray & Garcia, 1997). They also provide a vital tool for
maximising the effectiveness of innovation via systematic analysis of the technology or sector
(Rinne, 2004).
Flexibility in terms of the process and overall structure allows roadmaps to be developed for
a wide range of focuses and scales, from the level of individual companies to globally (Phaal,
et al., 2004). One review identified more than 2,000 public domain roadmaps (Phaal, 2011),
ranging from exploration of the solar system (NASA, 2006) to the medical applications of
nanotechnology (Hartwig, 2006). Roadmap structures vary massively, depending on the
application, context and desired outcomes in terms of planning (Kappel, 2001), but at the
broadest level one review categorised roadmaps as of two main types: “entity level”, which
generally focus on broader scales and themes, and “attribute level”, which examine specific,
quantifiable factors (Kajikawa, et al., 2008). Given the quantitative requirements of “attribute
level” roadmaps, they were observed to occur more for established, mature sectors (Kajikawa,
et al., 2008). Additionally, for all roadmaps some form of multi-layered graphical plan
connecting the technology with market opportunities was also included (Carvalho, et al.,
2012), as shown in Figure 4:

7
Figure 4: Generic technology roadmap architecture (Carvalho, et al., 2012, p. 1419).
Although a flexible and adaptable roadmap structure allows application to a wide variety of
subjects, the lack of a “template” is cited as one reason for difficulty in execution on an
ongoing basis (Phaal, et al., 2004). Similarly, given the predictive and time dependent nature
of roadmaps, keeping them up-to-date with current events as they affect the underlying
assumptions becomes problematic (Lee & Park, 2005). Despite this, the process of creating
a roadmap can be more useful than the finished product, via the dialogue, investigation and
understanding developed (Grossman, 2004).
2.2. Renewable Energy Roadmaps
Roadmaps focusing specifically on renewable energy share the same breadth of format as
general roadmaps. They can be classified as one of three levels: at a national scale, with focus
on energy security, policy and dependence; at a sectoral scale, with focus on common needs,
barriers to development and overall risks; or at an organisational scale, to evaluate and
prioritise research and development towards stated goals (Amer & Daim, 2010). The
European Renewable Energy Council renewable energy roadmap for member states is an
example of the former, providing consumption targets along with plans for increasing the
share of individual technologies (European Renewable Energy Council, 2002). Sector level
roadmaps are generally developed by consortia of companies, research laboratories or
government departments (Amer & Daim, 2010). An example of this type is the Canadian wind
technology roadmap, which helped develop a consensus on key issues and provided
recommendations following from several workshops involving the government, industry and
academia (Natural Resources Canada, 2009). Finally, a roadmap for the hydrogen fuel cells is
an example of an organisational roadmap, making key recommendations for investment
decisions for the Canadian Institute for Fuel Cell Innovation (Sparrow & Whittaker, 2005).
8
Analysis of this classification determined that national level roadmaps were closer to the
“entity level” type, with longer term forecasts befitting to the greater level of uncertainty.
Organisational roadmaps were closer to the “attribute level” end of the spectrum, given the
definite specifications and requirements available, with this type also occurring more
frequently for mature technologies such as wind (Amer & Daim, 2010).
2.3. Marine Energy Roadmaps
For marine energy roadmaps, research identified has several key examples, focusing on the
entire sector at either a national or European Union level. Whilst different in structure, all
contain the same three basic components: a vision (wide-scale deployment of marine energy),
outlining the current state of affairs (particularly barriers facing deployment) and finally
discussing what steps would be required (in terms of how to most effectively overcome these
barriers). Analysis for all of the above mentioned reports was, generally speaking, more
“entity level” than “attribute level” due to the relative immaturity of the sector (ORECCA:
Offshore Renewable Energy Conversion Platform Coordination Action, 2011).
The first outlines the necessary steps to developing a marine energy sector in Chile,
specifically analysing the Chilean landscape relative to the Scottish sector in terms of the
potential resource, the socio-economic benefits of marine energy, the regulatory system and
financial measures (Errázuriz and Asociados Ingenieros, 2012). Based on this comparison,
this report then recommends what steps would be necessary for a “develop” (meaning
technology development and deployment would be adopted locally) or a “deploy” (meaning
deploy devices once improvements internationally render them cost effective) scenario
locally. The second is an ORECCA (a collaborative project aimed at developing deployment
strategies for offshore energy in Europe) roadmap for marine energy and offshore wind
similarly analyses the European-wide barrier to deployment in terms of resource, financial
measures, available technology, infrastructure and regulation and legislation (ORECCA, 2011).
Scottish and Irish analysis of marine energy in respective roadmaps also come to similar
conclusions, covering the same board themes under slightly different headings (Forum for
Renewable Energy Development in Scotland, 2009; Sustainable Energy Authority of Ireland,
2010).
Whilst not specifically roadmaps, several other reports aimed at accelerating the deployment
of marine energy, via analysis of current activity in the sector and future deployment potential,
were identified. These include an International Renewable Energy Agency (IRENA) report,
which highlights technological development, economics, environmental and infrastructure as
barriers to deployment (Mofor, et al., 2014). This is corroborated by a similar investigation of
the future prospects for marine energy in Europe (Magagna & Uihlein, 2015). Likewise, an SI

9
Ocean report (another project towards a common strategy for wave and tidal current
deployment) determined that the major risks affecting deployment are financial,
technological, consenting and infrastructural (Badcock-Broe, et al., 2014). These major
subheadings identified in existing marine energy roadmaps and other reports will be
discussed subsequently in the Methodology to determine the most suitable structure.
2.4. Decision Making Comparison
A major feature of all these roadmaps is the collation information to improve the
effectiveness of decision making. Again, flexibility can be seen as a strength of the loose
structure, allowing incorporation of other management practices such as SWOT analysis, the
Delphi method, quality function deployment, PESTLE analysis and AHP (Amer & Daim, 2010).
In the context of this project and of marine energy in Panama though, not all techniques
would be equally applicable. For example the Delphi technique functions by collating
assessments from experts of the field in question (Hsu & Sandford, 2007) and quality
function deployment was developed towards product refinement at a company level rather
than considering the potential for an entire industry (Govers, 1996). Following
recommendations from both the project supervisors and the project examiner, PESTLE
analysis and AHP are compared here to determine which would be more suitable in
conjunction with the sectoral-scale roadmap structure.
2.4.1. PESTLE Analysis Outline
PESTLE analysis, which stands for “Political, Economic, Social, Technological, Legal and
Environmental”, is where an option is assessed individually in the stated terms (Havas, 2012).
This involves some form of investigation to identify relevant factors and then an assessment
to determine the impact and implications of the findings (Team FME, 2013). A selection of
factors, which could be considered for each section, is shown in Table 1:
Table 1: Non-exhaustive list of generic factors for consideration in a PESTLE analysis (Kolios & Read, 2013) (Team FME,
2013).
Political Government stability, bureaucracy issues, taxation and “green” targets
Economic Financing, technology push and market pull mechanisms
Social Public perceptions, education, demographics and support
Technological Rate of development, deployment, industry standards and supply
chain
Legal Regulatory bodies, consenting process and grid connection
Environmental Environmental impact, legislation, agencies and CO2 abatement

10
PESTLE analysis is widely used in the general analysis of renewable energy: examples include
for risk identification for the tidal industry in the UK (Kolios & Read, 2013), the development
of renewable energy in Malawi (Zalengera, et al., 2014) and analysing the progress of
renewable energy in the most recent EU member states (Patlitzianas & Karagounis, 2011).
Generally speaking, PESTLE analysis is used as “generic orientation tool” (Team FME, 2013, p.
11) to analyse the situation, rather than making absolute conclusions or deciding between
given options.
2.4.2. Analytic Hierarchy Process Outline
AHP is a multi-criteria decision making tool that operates quantitatively not by giving an
absolute answer, but by assessing options relative to each other (Brunelli, 2015). The main
steps are shown below (Saaty, 2008):
1. Definition of the problem and determination of type of answer sought;
2. Structure the decision hierarchy, as shown in Figure 5: with the top being the ultimate
aim and intermediate levels indicating assessment criteria, with the available options
given at the bottom;
Figure 5: Example of a simple AHP for selecting a job based on the main criteria of flexibility, opportunity, security,
reputation and salary (Saaty, 2008, p. 87).
3. Construct pairwise comparison matrices to evaluate each assessment criteria relative
to each other, giving weightings for each;
4. Assessment of each decision which feeds back into the previously determined
weightings to determine the best choice.

11
This process becomes increasingly complex given greater numbers of criteria and options
available (Brunelli, 2015), and so a wide variety of software is available to simplify the AHP
decision making process. Foremost is Expert Choice, developed by the creator of AHP,
Thomas Saaty (Ishizaka & Labib, 2009).
Similarly to PESTLE analysis, AHP is also widely used in the assessment of renewable energy,
including: the assessment of renewable energy alternatives for Istanbul (Kaya & Kahraman,
2010), the prioritisation of risks to tidal energy projects in the UK (Kolios, et al., 2013) and the
ranking of renewable technologies available to implement in Spain (Cristobal, 2011). In these
cases, the assessment was of discrete solutions to a given problem, with absolute solutions.
2.4.3. Comparison of Analytic Hierarchy Process and PESTLE
The main difference between the two methods is that AHP allows the user to decide between
a finite number of discrete and similar solutions whereas PESTLE follows an open-ended
methodology that allows for a more qualitative approach. This is evidenced by the literature
reviewed: AHP decision making tends to be between individual technologies (Kaya &
Kahraman, 2010; Cristobal, 2011) rather than assessment of the potential of a sector (Kolios
& Read, 2013; Zalengera, et al., 2014); the latter being more similar to the purpose of this
project.
In the case of marine energy in Panama, the conclusions drawn are unlikely to be as
completely clear-cut as deciding between which technology type would be best suited for all-
out development and deployment, as the progression of a new electricity generating
technology in a country will be more nuanced than a simple “yes or no” decision. Given the
definition of a roadmap as a tool that “outlines the goals, barriers, strategies necessary for
achieving a given vision of technological advancement and market penetrations” (Winebrake,
2003, p. 1), this report is not aimed to make an absolute judgement on the possibility of
deployment of marine energy but to develop the possibilities and potential for the industry.
Given the inherent uncertainty and immense range of factors influencing the future of an
entire sector, the flexible approach afforded by PESTLE would be more appropriate than a
deterministic, absolute one such as AHP.
12
3. METHODOLOGY
Investigation of general technology roadmaps indicates that as marine energy is a relatively
immature sector it is better suited to an “entity level” analysis given the lack of more specific
“attribute level” information. Review of renewable energy specific roadmaps, particularly at
the sectoral scale, showed that emphasis would be best placed on common needs and
barriers to deployment. This was further corroborated by sectoral marine energy roadmaps
and other reports: generally all focused on identifying barriers to deployment and discussing
how best to remove or reduce these to maximise development and deployment. As such, for
this type of national scale analysis of the marine energy sector in Panama, it can be
determined that a general “entity level” analysis of factors influencing marine energy is more
appropriate, rather than the specific attributes governing it.
PESTLE was determined to be a better suited decision making tool in the case of marine
energy in Panama, however, given the range of issues addressed in other marine energy
roadmaps, a modified structure to PESTLE is more appropriate. Otherwise, crucial
components of successful marine energy sector may be neglected, such as the available
resource and infrastructure requirements. To address the major factors affecting the
development of marine energy in Panama, a PESTLE-style methodology will be used, but with
the following subheadings adapted from marine energy roadmaps. In each case, a review of
the wide range of literature describing the “best practice” for encouraging marine energy
development will be compared to the existing Panamanian landscape.
1. Resource: Focus on developing an understanding of how the characteristics of an
ocean, in terms of wave behaviour, tidal velocities, tidal range and temperature
difference, can be considered significant in terms of energy potential. This is then
be used to assess available information about the potential of each energy type
in Panama.
2. Technology, Infrastructure and Supply Chain: Examination of the current
development of technology of all types will better consideration of the
infrastructure and supply chain requirements across the sector and individually
for specific technologies. This will then determine the adequacy of the existing
landscape for technology development or deployment, so highlighting necessary
areas for development.
3. Financial Mechanisms: Analyse the array of financial support mechanisms best
suited to maximising development and deployment of marine energy; whether by
creating a favourable market via “market pull” or encouraging technological
13
improvements via “technology push”. This is then compared to existing energy
financial mechanisms in place in Panama.
4. Legislation and Regulation: How marine energy fits into existing energy legislation
and regulation, renewable or otherwise; particularly how to expedite the process,
thereby reducing it as a barrier to development. The Panamanian legislative and
regulative outlook will then be analysed to determine which steps would best
encourage marine energy.
Following this investigation of “best practice” and comparison with the case of Panama,
recommendations will be made via two scenarios, similarly to the marine energy
roadmap for Chile (Errázuriz and Asociados Ingenieros, 2012). First is a “deployment”
scenario, which involves delaying deployment of marine energy devices or systems until
global improvements in technology render them cost effective. Although more passive,
this still entails ensuring that the marine energy landscape, with respect to the identified
factors above, is optimised for marine energy deployment. The second of these scenarios
is “development”: namely, taking the active approach of investment in local technology
development, rather than waiting for cost reductions to occur elsewhere. Given that a
graphical plan was identified as a common feature of roadmaps, these steps described
will also be summarised graphically to represent the key recommendations of the project.

14
4. RESULTS AND DISCUSSION
4.1. Marine Energy Resource
This section examines the marine energy resource for wave, tidal current, tidal range and
OTEC in Chile, UK, South Korea and the US respectively, which have all been recognised
globally for their resource. The case in Panama is then examined to determine the relative
significance of the local resource.
4.1.1. Resource Case Studies
A. Wave Energy in Chile
Casual observation of the global wave energy map in Figure 1 (p. 3), confirms that Chile is
“one of the most suitable places in the world for the generation of electrical power from wave
energy” (Monárdez, et al., 2008, p. 8; Errázuriz and Asociados Ingenieros, 2012). Due to this,
several detailed studies have been carried out, foremost of which is summarised in Figure 6
(Monárdez, et al., 2008), in addition to another study (Garrad Hassan, 2009). The wave power
is shown to vary from an annual average of 20-120 kW/m depending on the latitude.
Figure 6: Results of the two main studies of wave energy in Chile (Errázuriz and Asociados Ingenieros, 2012, p. 23).
Chile also displays favourable seasonable variability: shown in Figure 7, which demonstrates
that the available resource remains significant year round, save for in the north. For the
majority of the sites shown in Figure 6 the P90% (the percentage of the time the given power

15
is exceeded, in this case 90%) was always above 10 kW/m, as well as optimum capacity factors
ranging from 50-60%, among the highest in the world (Monárdez, et al., 2008).
Figure 7: Monthly distribution of wave power for the Northern, Central and Southern Chile at a depth of 25m (Monárdez,
et al., 2008, p. 4).
B. Tidal Current in the United Kingdom
The UK is recognised as possessing one of the most significant tidal current resources in the
world (Renewable UK, 2013), with peak mean tidal velocities of 3.8m/s at Kyle Rhea (Black &
Veatch, 2011). Final energy estimates however are sensitive to assumptions required, due to
the lack of large scale generating capacity on which to base energy extraction models (Black
& Veatch, 2005): estimates shown in Table 2 vary by up to three times. Classification of
significant tidal flow also varies: for device cut-in speeds between 0.7 m/s (Crown Estate, 2013)
and 1.5 m/s (Black & Veatch, 2005), with current greater than 2.5 m/s considered necessary
to generate significant energy (Lewis, et al., 2015).
Table 2: List of studies regarding the available energy from tidal current in UK waters.
Study Extractable Resource
European Commission (1996) 30.8 TWh/y
Black & Veatch (2005) 18 TWh/y (±30%)
Black & Veatch (2011) 29 TWh/y (-45%/ +30%)
Crown Estate (2013) 20.9 TWh/y

16
Tidal current resource is usually constrained by coastal topography, occurring most
commonly around features such as narrow straights, headlands and estuaries (Lewis &
Estefen, 2011). This is evidenced by up to 80% of the potential in the UK occurring in just ten
sites (Black & Veatch, 2005); depicted in Figure 8.
Figure 8: Depiction of the location of major tidal current sites across the UK (Crown Estate, 2012, p. 9)
C. Tidal Range in South Korea
Similarly, tidal range energy estimates are dictated by local topography, being dependent on
the available volume of water in addition to the tidal range, making national-scale
assessments less common; instead usually taking the form of site feasibility studies (Tousif &
Taslim, 2011). The irregular coastline and high tidal range brought on by the enclosed Yellow
Sea makes the Western coast of South Korea one of the most promising locations in the
world for tidal range energy (Gunwoo, et al., 2012). As such, numerous feasibility studies have
been conducted since the 1930s: the largest of which, conducted by the Korean Ocean
Research and Development Institute in 1978, identified a total of 6,500 MW across 10 sites
17
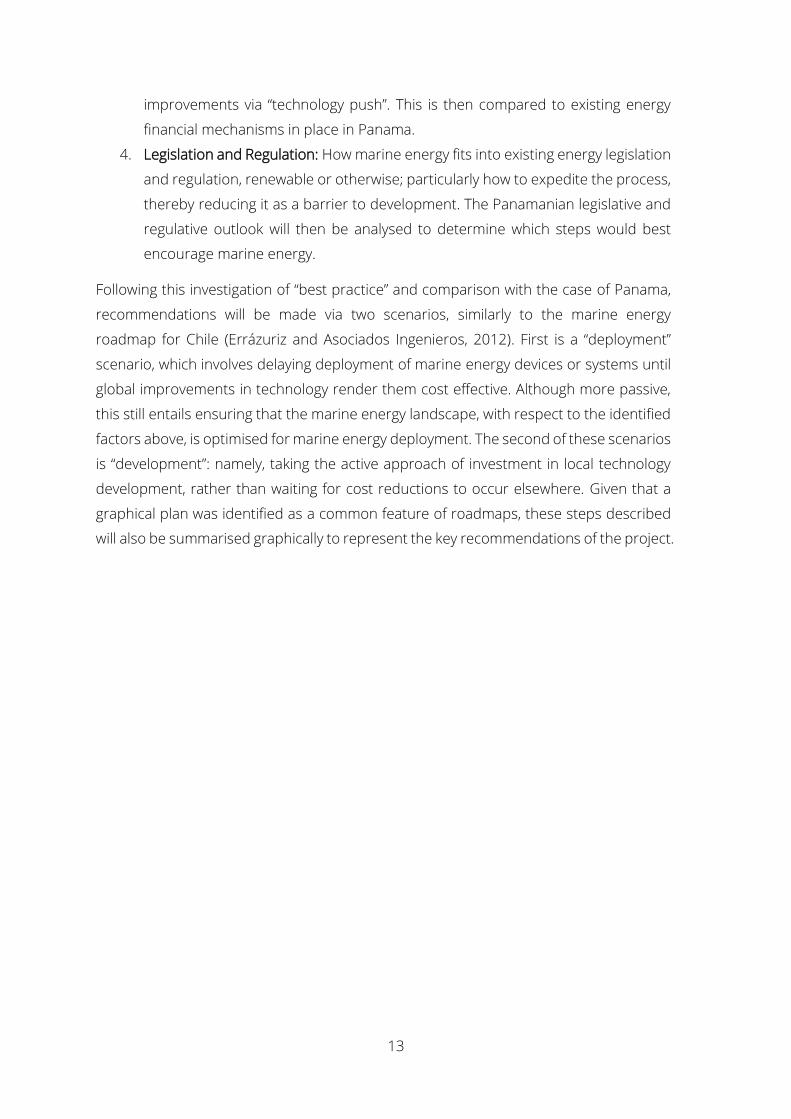
(Gunwoo, et al., 2012). This is summarised in Table 3 to give an indication of the suitable tidal
ranges and the scale of potential capacity. More recent studies have put the figure
conservatively at 2,400 MW (Lee, 2006).
Table 3: Several potential tidal barrage sites in South Korea (Gunwoo, et al., 2012, p. 2283).
Site Spring tidal
range (m)
Basin area
(km2)
Turbine capacity
(MW)
Annual energy
(GWh)
Sihwa 7.8 43 254 553
Garolim 6.7 96 520 950
Incheon 7.7 157 1320 2214
Chonsu 5.9 146 720 1207
TOTAL - 525 3654 6480
D. Ocean Thermal Energy Conversion in the United States of America
Temperature difference between surface and deeper water (800-1000m) is the main metric
for assessing an OTEC resource, with 20°C usually given as the minimum required (Lockheed
Martin, 2012). Estimation of the available energy is more complex though, mainly due to lack
of data regarding plants which have yet to be built at the crucial scale of megawatts (Makai
Ocean Engineering, 2015). One study documents the available energy in US waters based on
a nominal 100 MW plant (Lockheed Martin, 2012): results of this are shown in Table 4. The
sensitivity to plant specification assumptions is illustrated by a previous study which
estimated the potential capacity of the Gulf of Mexico (East coast US) was up to four times
smaller, at 10-30 GWe (Pei, 1980).
Table 4: Estimated power available in several US economic exclusion zones (EEZ; the area of ocean which a state has
sovereignty over) (Lockheed Martin, 2012, p. 44).
Locations within
the US EEZ
Annual
Average Net
Power (GWe)
Net Power (GWe) in
Summer (June-
August)
Net Power (GWe) in
Winter (December-
February)
Yearly
Electricity
TWh/year
East Coast US 39.0 92.3 11.5 342
West Coast US 6.0 10.8 3.3 53
Hawaii 16.3 17.3 16.8 143
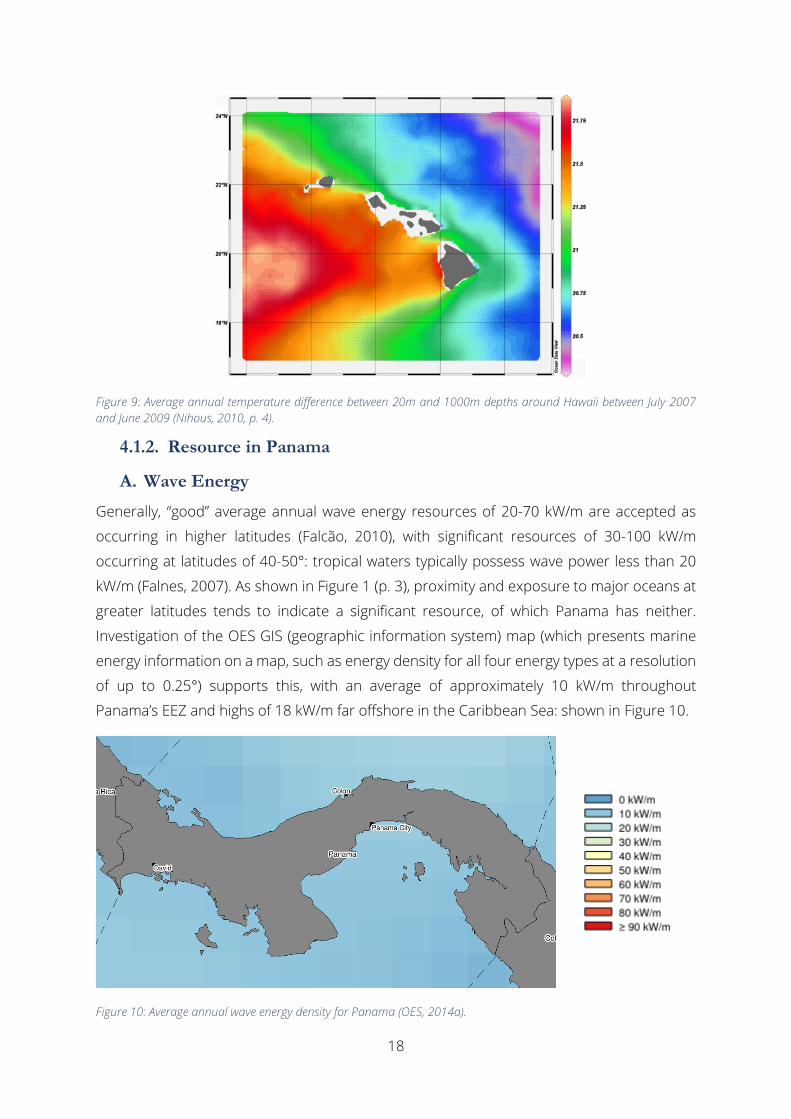
Hawaii is the most attractive US OTEC resource, with a consistent average temperature
difference as shown in Figure 9. The consistency, relative to the variable mainland US (shown
in Table 4), is the main strength, making it more suitable for baseload electricity generation,
which OTEC technology is expected to provide (Rajagopalan & Nihous, 2013). It also has the
advantage of a very steep seabed gradient near-shore due to the volcanic nature of the
islands, making it suitable for more economical land based systems (Nihous, 2010).
18
Figure 9: Average annual temperature difference between 20m and 1000m depths around Hawaii between July 2007
and June 2009 (Nihous, 2010, p. 4).
4.1.2. Resource in Panama
A. Wave Energy
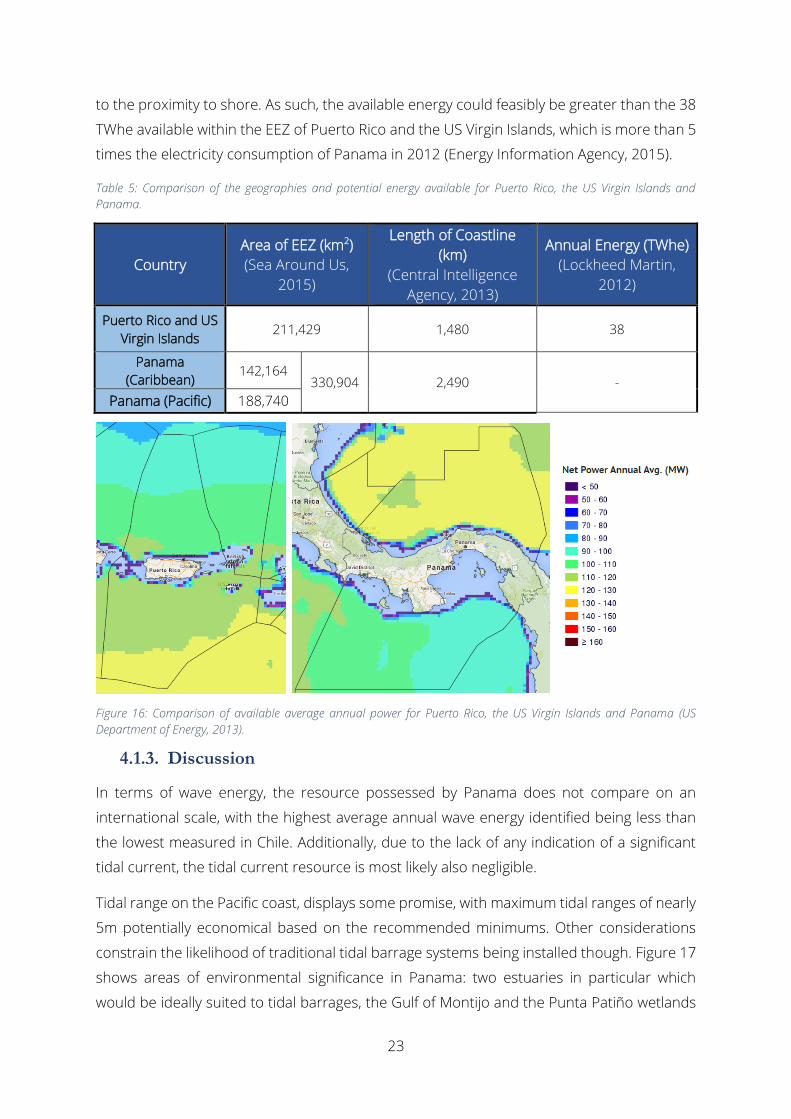
Generally, “good” average annual wave energy resources of 20-70 kW/m are accepted as
occurring in higher latitudes (Falcão, 2010), with significant resources of 30-100 kW/m
occurring at latitudes of 40-50°: tropical waters typically possess wave power less than 20
kW/m (Falnes, 2007). As shown in Figure 1 (p. 3), proximity and exposure to major oceans at
greater latitudes tends to indicate a significant resource, of which Panama has neither.
Investigation of the OES GIS (geographic information system) map (which presents marine
energy information on a map, such as energy density for all four energy types at a resolution
of up to 0.25°) supports this, with an average of approximately 10 kW/m throughout
Panama’s EEZ and highs of 18 kW/m far offshore in the Caribbean Sea: shown in Figure 10.
Figure 10: Average annual wave energy density for Panama (OES, 2014a).

19
Data was also obtained from Stephen Barstow (co-author of the paper which produced
Figure 1; p. 3) of Fugro OCEANOR, a company specialising in environmental monitoring (Fugro
OCEANOR, 2012), which details half-hourly wave data over the course of 2012 for 7°N, 80°W.
This corroborates information given OES GIS map, indicating an average power output of 9.0
kW/m and a P90% of just 3.5 kW/m. As such, relative to the annual averages of 20-120 kW/m
and the P90% of at least 10 kW/m found in Chile, the available wave resource in Panama is
unlikely to warrant attention.
B. Tidal Current
A trial version of the UK Hydrographic Office Total Tide program was obtained from Pisys
Marine, an Aberdeenshire based distributor of marine geographic information systems (Pisys
Marine, 2015). This program contains information on tidal current measurements at selected
ports and over 3,000 points worldwide (UK Hydrographic Office, 2014): there were however
no information points present on either the Caribbean or Pacific coasts of Panama, despite
being one of the busiest shipping routes in the world (American Association of Port
Authorities, 2014). Even though there is a notable tide on the Pacific coast, lack of tidal
current data for the entrance to the Panama Canal at Balboa suggest a lack of any significant
tidal current, especially at the velocities greater than 2.5 m/s which are deemed significant
enough to warrant electricity generation (Lewis, et al., 2015). On the Caribbean coast, tidal
ranges (discussed in detail in the subsequent paragraphs) are minimal, averaging
approximately 0.5m (UK Hydrographic Office, 2014), making it unlikely that there are any tidal
currents at all.
C. Tidal Range
Typically tidal barrage systems are deemed to require a head of at least 5 m to be
economically feasible (Kempener & Neumann, 2014a). However, other tidal barrage systems,
namely tidal lagoons, are generally deemed to require less head than barrages, with 4 m
deemed the minimum criteria in two studies (Crown Estate, 2013; Kempener & Neumann,
2014a).
Observation of the OES GIS map reveals that Panama possesses a notable tidal range (Figure
11), albeit only on the Pacific coast, with a maximum of approximately 5m given in the Gulf
of Panama (OES, 2014a). This was corroborated with Total Tide, which gave averages of less
than 0.5m on the Caribbean coast and an average range of between 3-5m on the Pacific side,
depending on the port (UK Hydrographic Office, 2014). Of the 16 available ports with tidal
range data, Balboa and Rio Chepo, both located in the northernmost aspect of the Gulf of
Panama, were found to possess the greatest average tidal range of 4.7m and 4.6m
respectively: attributable to the favourable basin formed by the Gulf of Panama.

20
Figure 11: Depiction of the maximum calculated tidal ranges for Panama (OES, 2014a).
D. Ocean Thermal Energy Conversion
OTEC is the most immediately obvious potential marine energy source in Panama given its
equatorial proximity: it is widely acknowledged that the OTEC resource is confined between
the Tropics of Cancer and Capricorn (Lewis & Estefen, 2011; Lockheed Martin, 2012; Vega,
2014) . No investigation has been found published exclusively for the Panamanian resource
but information can be extrapolated from two global studies. Firstly, observation of the OES
GIS map shows that Panama has definite potential, with mean annual temperature
differences of up to 25°C, shown in Figure 12 (OES, 2014a). The white areas in this figure
show either where the water depth does not extend to 1,000 m or the temperature
difference is <20°C, which does miss out potential resource in slightly shallower waters
(Lockheed Martin, 2012).
Figure 12: Mean annual temperature difference between 20-1,000 m depth for Panama (OES, 2014a).
Water temperature difference

21
A second, more comprehensive, OTEC resource study carried out by Lockheed Martin
describes Panama in passing as representing an “attractive OTEC resource” (Lockheed Martin,
2012, p. 36). This study includes shallower water resources due to cold water temperature
taken from a depth which maximises annual power by balancing increased pump power
requirements with the increased efficiency from deeper, colder water (see Section 4.2.1 for
description of the technology), as opposed to the OES GIS map which simply assumes the
temperature difference between 20m and 1000m water depths. The findings of this study
are also presented as a GIS Map in the form of the Marine Hydro-Kinetic (MHK) Atlas (US
Department of Energy, 2013): the temperature difference for this is shown in Figure 13. Of
note is the discrepancy in terms of minimum distance to shore on either coasts compared
to the OES Map in Figure 12; due to the inclusion of the shallower water resource.
Figure 13: Mean annual temperature difference for surface water and a depth chosen to maximise power output (US
Department of Energy, 2013).
In addition to a slightly greater temperature difference, the Caribbean coast of Panama has
the advantage of lower seasonal variability between the summer and winter months as
(Figure 14). As OTEC is most commonly assumed to function as baseload plants (Lockheed
Martin, 2012; Vega, 2014), the Caribbean coast would likely be better suited. Furthermore,
the resource on the Caribbean coast is generally closer to shore than on the Pacific as shown
in Figure 15, significantly as the cost of a 10 km underwater power cable is estimated at 10%
of total capital costs for a nominal 50 MW plant (Vega, 2010).

22
Figure 14: Depiction of the seasonal variation in power (given in MW): summer (June-July-August) on the left and winter
(December-January-February) on the right (US Department of Energy, 2013).
Figure 15: Bathymetry around Panama, with 1000m contour highlighted in red (National Centers for Environmental
Information, 2016).
Although mentioning Panama in passing, the Lockheed Martin study does not describe the
resource in any detail: a comparison with Puerto Rico and the US Virgin Islands can however
be made to give an indication of the resource. Table 5 shows that the areas of the Economic
Exclusion Zones (EEZ) for both are the same order of magnitude, with Panama’s half again as
large. Visual comparison of the average annual available power (Figure 16 ) shows them to
be again roughly equivalent, with Panama possesing a possibly greater resource due to the
larger area of yellow (120 - 130 MW) in the Caribbean sea. Panama also possesses a longer
length of coastline, which would likely make the technically extractable resource higher due
23
to the proximity to shore. As such, the available energy could feasibly be greater than the 38
TWhe available within the EEZ of Puerto Rico and the US Virgin Islands, which is more than 5
times the electricity consumption of Panama in 2012 (Energy Information Agency, 2015).
Table 5: Comparison of the geographies and potential energy available for Puerto Rico, the US Virgin Islands and
Panama.
Country
Area of EEZ (km2)
(Sea Around Us,
2015)
Length of Coastline
(km)
(Central Intelligence
Agency, 2013)
Annual Energy (TWhe)
(Lockheed Martin,
2012)
Puerto Rico and US
Virgin Islands 211,429 1,480 38
Panama
(Caribbean) 142,164
330,904 2,490 -
Panama (Pacific) 188,740
Figure 16: Comparison of available average annual power for Puerto Rico, the US Virgin Islands and Panama (US
Department of Energy, 2013).
4.1.3. Discussion
In terms of wave energy, the resource possessed by Panama does not compare on an
international scale, with the highest average annual wave energy identified being less than
the lowest measured in Chile. Additionally, due to the lack of any indication of a significant
tidal current, the tidal current resource is most likely also negligible.
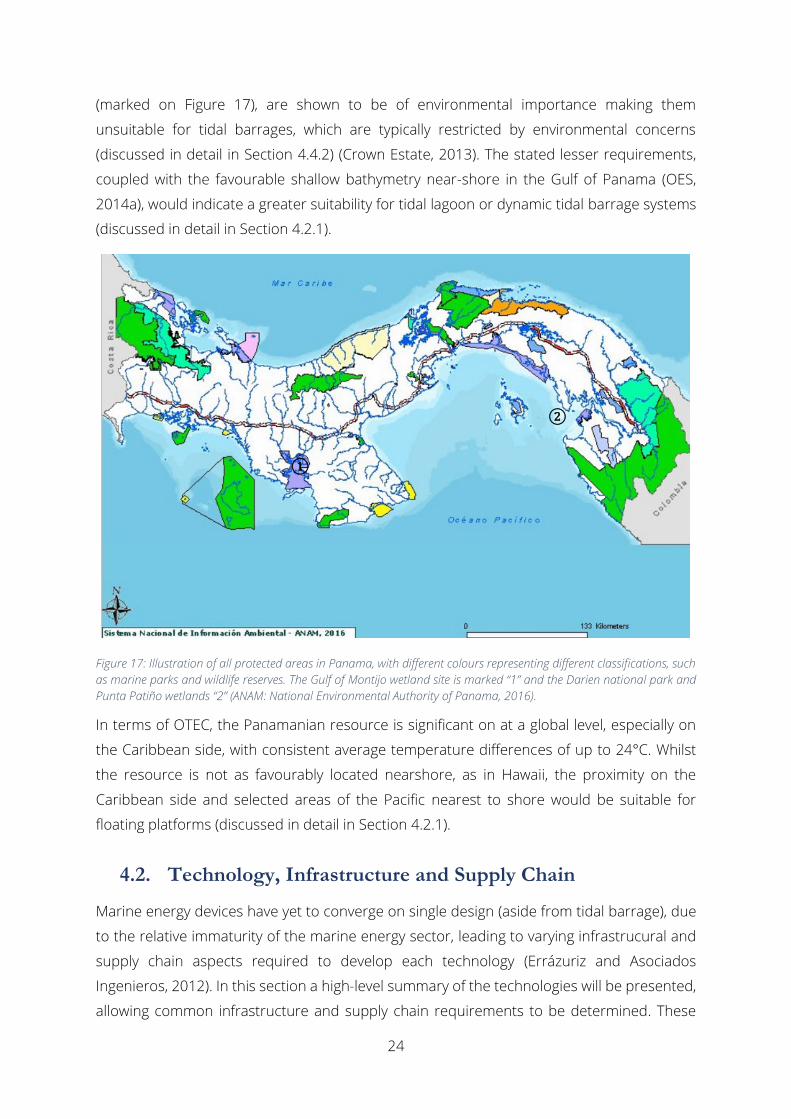
Tidal range on the Pacific coast, displays some promise, with maximum tidal ranges of nearly
5m potentially economical based on the recommended minimums. Other considerations
constrain the likelihood of traditional tidal barrage systems being installed though. Figure 17
shows areas of environmental significance in Panama: two estuaries in particular which
would be ideally suited to tidal barrages, the Gulf of Montijo and the Punta Patiño wetlands
24
(marked on Figure 17), are shown to be of environmental importance making them
unsuitable for tidal barrages, which are typically restricted by environmental concerns
(discussed in detail in Section 4.4.2) (Crown Estate, 2013). The stated lesser requirements,
coupled with the favourable shallow bathymetry near-shore in the Gulf of Panama (OES,
2014a), would indicate a greater suitability for tidal lagoon or dynamic tidal barrage systems
(discussed in detail in Section 4.2.1).
Figure 17: Illustration of all protected areas in Panama, with different colours representing different classifications, such
as marine parks and wildlife reserves. The Gulf of Montijo wetland site is marked “1” and the Darien national park and
Punta Patiño wetlands “2” (ANAM: National Environmental Authority of Panama, 2016).
In terms of OTEC, the Panamanian resource is significant on at a global level, especially on
the Caribbean side, with consistent average temperature differences of up to 24°C. Whilst
the resource is not as favourably located nearshore, as in Hawaii, the proximity on the
Caribbean side and selected areas of the Pacific nearest to shore would be suitable for
floating platforms (discussed in detail in Section 4.2.1).
4.2. Technology, Infrastructure and Supply Chain
Marine energy devices have yet to converge on single design (aside from tidal barrage), due
to the relative immaturity of the marine energy sector, leading to varying infrastrucural and
supply chain aspects required to develop each technology (Errázuriz and Asociados
Ingenieros, 2012). In this section a high-level summary of the technologies will be presented,
allowing common infrastructure and supply chain requirements to be determined. These
①
②

25
contributing factors are used to examine the infrastructure and supply chain in Panama to
develop an understanding of and make recommendations on the current suitability for the
presented technologies.
4.2.1. Available Technology
A. Wave Energy
Of the four sectors, wave energy converters (WEC) exist in the greatest variety, with
numerous studies existing that classify and catalogue more than 50 designs (Drew, et al.,
2009; Khan & Bhuyan, 2009; Errázuriz and Asociados Ingenieros, 2012; US Department of
Energy, 2013). The lack of convergence on a single design stems from the numerous ways in
which energy can be extracted, wheteher the dvice is onshore, near-shore or offshore and
the type of power take-off system used to convert the motion of waves into electricity
(Errázuriz and Asociados Ingenieros, 2012). Examples of several major types are shown in
Figure 18, with one classification system shown in Figure 19. Development of WECs has been
focused for the most part in European nations, with test centres such as the European
Marine Energy Centre (EMEC) in Orkney facilitating this (Lewis & Estefen, 2011). Perhaps one
of the best-known WECs, the 750 kW Pelamis P2 attenuator device (as shown in Figure 18),
was tested there in 2010 (Yemm, et al., 2012).
Figure 18: Major types of WECs (Thresher, et al., 2012, pp. 9-16).

26
Figure 19: Depiction of the ways in which WECs differ (Lewis & Estefen, 2011, p. 905).
B. Tidal Current
Similarly to WECs, tidal energy converters (TEC) come in a wide range of types and again there
is a wide variety of literature classifying this (Khan, et al., 2009; EMEC, 2011; Lewis & Estefen,
2011). Major types of devices are shown in Figure 20; several other unique types also exist,
such as Archimedes screws and tidal kites (Harris, 2013). Devices also differ in other ways,
such as the mooring (devices can be floating or mounted on the seabed), power take-off
equipment (most use some form of generator but some, such as the oscillating hydrofoil, use
pressurised fluids) and so on, as shown in Figure 21 (Khan, et al., 2009).
Figure 20: Primary types of TECs (Thresher, et al., 2012, pp. 9-18).

27
Figure 21: Depiction of the major ways in which tidal current devices differ (Mofor, et al., 2014, p. 20).
Although these can be classified in as many as ten different ways, horizontal or vertical axis
designs have emerged as the most popular, with 58 out of 76 surveyed devices being either
of these types (Khan, et al., 2009). One of the most significant devices is the 1.2 MW SeaGen
device, located in Strangford Lough, Ireland, and installed in 2008 as the first grid-connected
commercial scale turbine the in the UK (Jha, 2008), consisting of twin 600 kW, 16m diameter
rotors mounted on a single pylon on the seabed (RE News, 2016).
C. Tidal Barrage
Tidal barrage technology “represents the oldest and most mature of all the ocean power
technologies” (Khan & Bhuyan, 2009, p. 9), with one of the oldest plants being the 1.7 MW
Kislaya plant in Russia, commissioned in 1968 (Bernshtein, 1972). Systems generally use bi-
directional low-head bulb turbines, with the generator enclosed within, in conjunction with a
civil works to generate sufficient head; usually across an estuary to minimise the length of
barrage required (Clark, 2007).
Figure 22: Image of the lake Sihwa tidal range plant in South Korea (Gunwoo, et al., 2012, p. 2283).
28
The largest tidal barrage in the world is the 254 MW Lake Sihwa plant in South Korea shown
in Figure 22 (Bae, et al., 2010), previously mentioned in Section 4.1.1. This and the 240 MW
La Rance plant in France represent more than 95% of total installed tidal range capacity in
the world (Mofor, et al., 2014). Proposed configurations which have not been developed
include utilising a tidal lagoon, which operates similarly to traditional barrages only enclosing
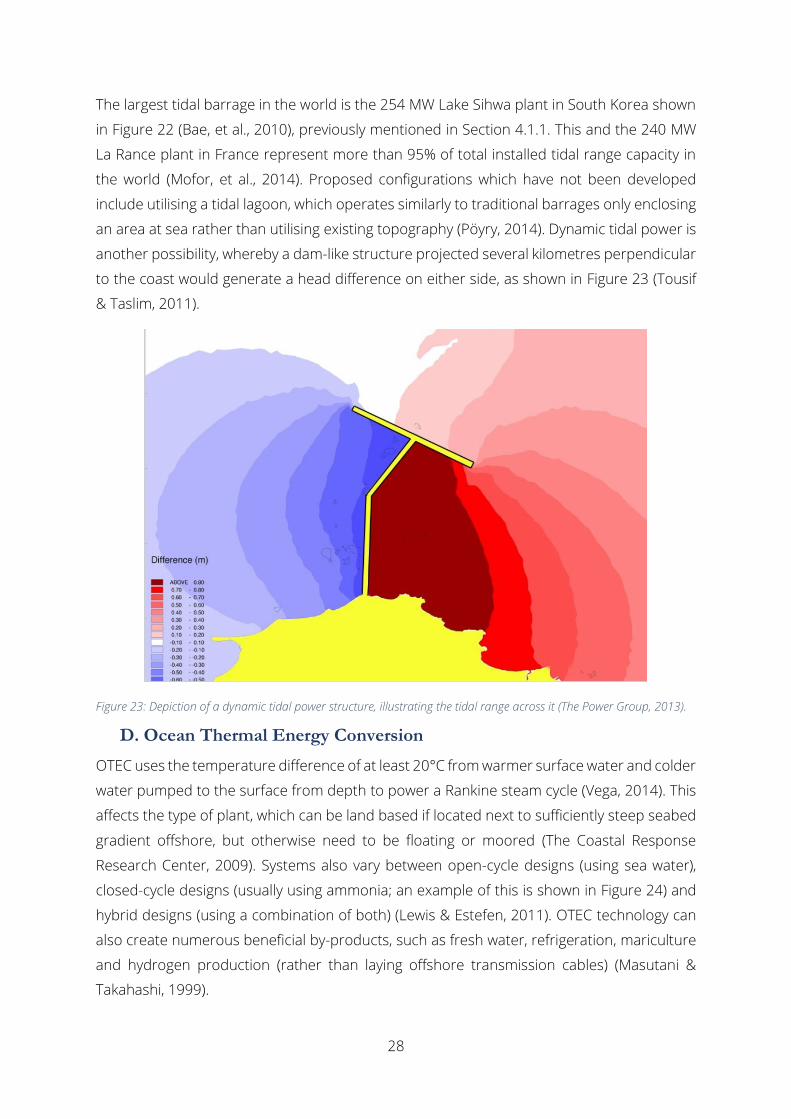
an area at sea rather than utilising existing topography (Pöyry, 2014). Dynamic tidal power is
another possibility, whereby a dam-like structure projected several kilometres perpendicular
to the coast would generate a head difference on either side, as shown in Figure 23 (Tousif
& Taslim, 2011).
Figure 23: Depiction of a dynamic tidal power structure, illustrating the tidal range across it (The Power Group, 2013).
D. Ocean Thermal Energy Conversion
OTEC uses the temperature difference of at least 20°C from warmer surface water and colder
water pumped to the surface from depth to power a Rankine steam cycle (Vega, 2014). This
affects the type of plant, which can be land based if located next to sufficiently steep seabed
gradient offshore, but otherwise need to be floating or moored (The Coastal Response
Research Center, 2009). Systems also vary between open-cycle designs (using sea water),
closed-cycle designs (usually using ammonia; an example of this is shown in Figure 24) and
hybrid designs (using a combination of both) (Lewis & Estefen, 2011). OTEC technology can
also create numerous beneficial by-products, such as fresh water, refrigeration, mariculture
and hydrogen production (rather than laying offshore transmission cables) (Masutani &
Takahashi, 1999).
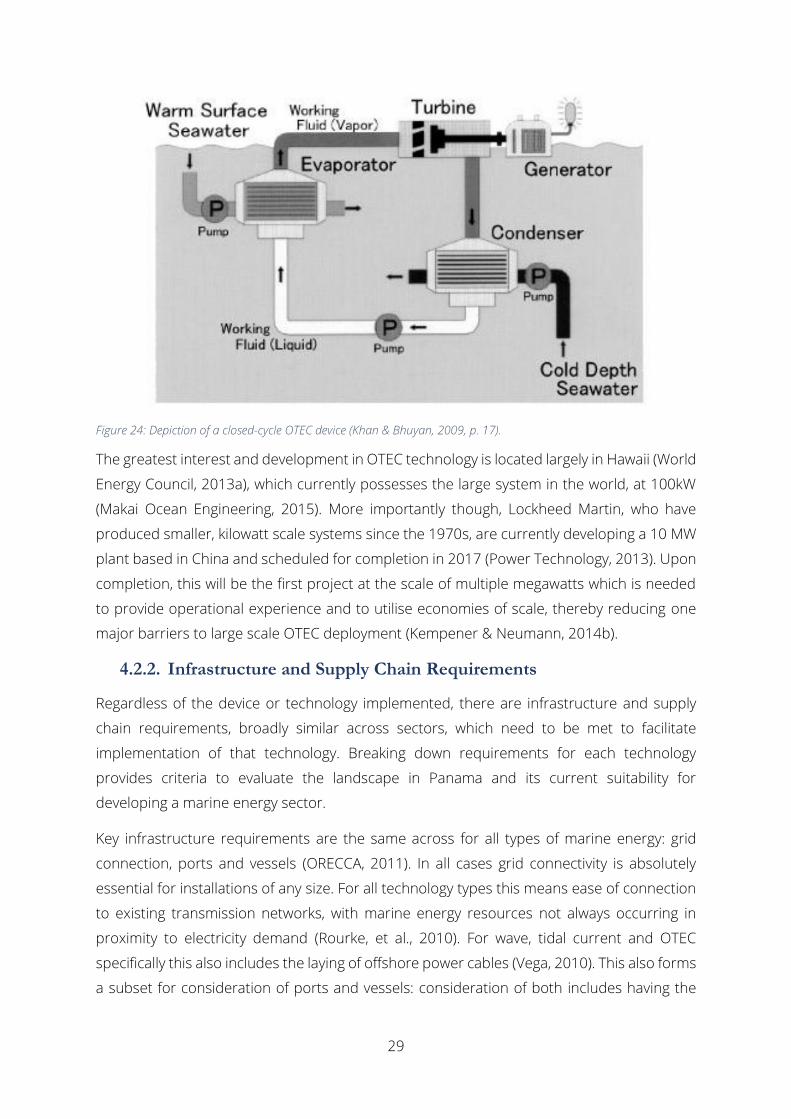
29
Figure 24: Depiction of a closed-cycle OTEC device (Khan & Bhuyan, 2009, p. 17).
The greatest interest and development in OTEC technology is located largely in Hawaii (World
Energy Council, 2013a), which currently possesses the large system in the world, at 100kW
(Makai Ocean Engineering, 2015). More importantly though, Lockheed Martin, who have
produced smaller, kilowatt scale systems since the 1970s, are currently developing a 10 MW
plant based in China and scheduled for completion in 2017 (Power Technology, 2013). Upon
completion, this will be the first project at the scale of multiple megawatts which is needed
to provide operational experience and to utilise economies of scale, thereby reducing one
major barriers to large scale OTEC deployment (Kempener & Neumann, 2014b).
4.2.2. Infrastructure and Supply Chain Requirements
Regardless of the device or technology implemented, there are infrastructure and supply
chain requirements, broadly similar across sectors, which need to be met to facilitate
implementation of that technology. Breaking down requirements for each technology
provides criteria to evaluate the landscape in Panama and its current suitability for
developing a marine energy sector.
Key infrastructure requirements are the same across for all types of marine energy: grid
connection, ports and vessels (ORECCA, 2011). In all cases grid connectivity is absolutely
essential for installations of any size. For all technology types this means ease of connection
to existing transmission networks, with marine energy resources not always occurring in
proximity to electricity demand (Rourke, et al., 2010). For wave, tidal current and OTEC
specifically this also includes the laying of offshore power cables (Vega, 2010). This also forms
a subset for consideration of ports and vessels: consideration of both includes having the
30
capacity and capability to deal with the installation, commissioning and maintenance of
devices, both on and offshore (Errázuriz and Asociados Ingenieros, 2012).
From examining classifications of supply chain requirements for each technology type,
common factors can be identified. For wave and tidal current, this includes steel, concrete,
moorings and expertise (Errázuriz and Asociados Ingenieros, 2012). Certain devices may
have specific requirements, such as hydraulics or alternative power take-off systems, but due
to the extensive variety of devices and therefore requirements, only the above are
investigated. For tidal barrage, the major sectors are materials (largely concrete and other
aggregates), turbines, vessels and skills (Department of Energy and Climate Change, 2010).
Lastly, several OTEC requirements are broadly similar to other sectors, with moorings, steel
and concrete (particularly in the construction of an offshore platform) as for wave and tidal
current (The Coastal Response Research Center, 2009). Comparing other OTEC aspects, such
as the cold water pipe, to other industries would be largely redundant due to a lack of
projects of a relevant scale, as stated in previous sections. Substantial research and
development is needed before properly understanding the complete supply chain demands
of OTEC (The Coastal Response Research Center, 2009).
Rather than exhaustively examining each supply chain requirement individually, only the
aspects shared by all technology types will be examined in detail: namely steel, concrete and
general expertise. Other requirements, such as turbines, steam cycle equipment and the
cold water pipe will be briefly discussed separately. Specific details of quantitative
requirements for each supply chain aspect are scarce, due to the relative immaturity of the
sector (ORECCA, 2011), so the following paragraphs will briefly outline each: detailed analysis
will be carried out subsequently with respect to Panama.
Concrete and Aggregates: Important for all sectors, in especially high volumes for
constructing embankments for tidal range (Department of Energy and Climate Change,
2010) as well as for moorings and the actual structure of the device for the other sectors
(Court, 2008; The Coastal Response Research Center, 2009).
Steel: For wave, tidal current and OTEC this includes for the supports, anchors or
platforms of devices and in the case of wave and tidal current, the devices themselves can
be fabricated from steel (Court, 2008). Less crucial for tidal barrage, where the structure
consists mainly of civil works (Clark, 2007).
General Expertise: As the most general category, it includes personnel to assess, make
decisions, implement and manage projects in all aspects (Errázuriz and Asociados
Ingenieros, 2012).

31
Other Supply Chain Requirements: Two main types of turbines are also required: for tidal
range these are low head bulb turbines (Department of Energy and Climate Change, 2010)
and for tidal current horizontal axis devices, the most common as discussed, the device is
made up largely of turbine and nacelle assemblies (Court, 2008). OTEC also requires other
aspects unique to this type, such as the offshore platform and steam cycle equipment,
including pumps, turbines and heat exchangers (The Coastal Response Research Center,
2009).
4.2.3. Infrastructure and Supply Chain in Panama
Having outlined the general infrastructure and supply chain requirements relevant to each
sector, this section will assess the existing landscape in Panama for suitability of marine
energy deployment or development. Despite the difficulty in assessing maritime capacity
particularly, due to the myriad of often conflicting aspects, especially for a relative immature
sector like marine energy (Wells & McConnell, 2011), this will help to determine what steps,
if any, would need to be taken to best foster marine energy locally.
A. Infrastructure
Ports
In 2013, the Panamanian ports of Balboa and Colón (the Pacific and Caribbean entrances to
the canal respectively) were the second and third busiest ports in Central and South America
in terms of twenty-foot equivalent units (a volumetric term used to assess shipping capacity);
equivalent to 57% of overall Central American volume in the same year (American Association
of Port Authorities, 2014). However, outwith these and excluding Cristobal and Manzanillo
International Terminal, which are both immediately adjacent to Colón, the next largest port
in the country, Almirante, in the Western Bocas Del Toro province, experienced slightly less
than 0.6% the percentage of container volume traffic in 2013 relative to Balboa (American
Association of Port Authorities, 2014). Applying the conditions that any port constructing or
installing marine energy devices (in this case specifically wave or tidal current devices)
requires at least 100m of quay, a minimum 6m of water depth and a 200 tonne capacity or
greater crane (Wells & McConnell, 2011), the only suitable ports are those located at the
Caribbean and Pacific entrances to the canal (Sea Rates, 2010). As such, outwith of the two
hubs at either end of the Panama Canal, there is a lack of port infrastructure suitable for
marine energy. This is not necessarily completely inimical though: analysis of port
requirements for offshore wind categorises them as suitable for manufacturing, construction
or operations and maintenance, with the latter having lesser requirements (Bard &
Thalemann, 2011). Although ports other than those around the canal might be unsuitable
for deploying devices, they could still be sufficiently developed to service existing devices.

32
Developing the capacity of ports to meet the requirements identified above for marine
energy would also be beneficial to Panama’s economy in the long term, as determined in
Ireland, with synergies benefiting other sectors (Wells & McConnell, 2011). The National
Marine Authority of Panama’s [La Autoridad Marítima de Panamá] (AMP) Strategic Marine
Plan [La Estrategia Marítima Nacional] already includes commitment to development of
Panama’s ports: although the focus is on those close to the Panama Canal, as the major
economic hubs, it does state commitment to improving and expanding other existing ports,
as well as constructing new ones (AMP, 2008). This commitment to expansion is also
reiterated in Law 56 of 2008, which governs ports and marine facilities (National Assembly of
Panama, 2008). Although this would largely focus on shipping and logistics capacity, this
capacity has been stated to be analogous to marine energy (ORECCA, 2011) and so would
still be beneficial.
Vessels
In 2014, Panama possessed the largest merchant navy in the world, with 214 million gross
register tonnage (GRT: equivalent to 100 cubic feet) for vessels over 100 GRT, representing
20% of the global total (Department for Transport, 2015). However this gives a false
impression: the majority are not based in Panama, but taking advantage of “open registries”
to avoid local maritime regulations whilst having no other ties with the country (BBC News,
2014).
The country does possess a developing auxiliary maritime services industry, which includes
repair and servicing of vessels and offshore platforms. Analysis of the sector in Panama
determined it was still relatively immature: beginning significant development only in 2000
with the transfer of ownership of the canal to the Panamanian government and with less
than a quarter of ships currently transiting the canal utilising local auxiliary services (Ibañez,
2014). Despite this, strong synergies between this sector and marine energy (Bard &
Thalemann, 2011) would indicate suitability for adaption to deploying and servicing marine
energy devices.
Fishing is also a large contributor to the Panamanian economy, as the second largest export
after bananas (Food and Agriculture Organization of the United Nations, 2007). The most
recent UN Food and Agriculture Organization “Fishery and Aquaculture Profile”, whilst now
likely outdated, identified 260 vessels 15-22m long with tonnages of up to 150 GRT, as well
as 666 “industrial” vessels with a capacity greater than 10 GRT (Food and Agriculture
Organization of the United Nations, 2007). The report also highlights a general decline in the
fishing industry at the time of writing: similarly to the situation in Scotland, which has
prompted interaction with the industry to determine the likelihood of fishing vessels
diversifying into servicing the offshore renewable energy industry (Sea Energy, 2014).

33
Anecdotally, in Ireland, fourteen fishing boats have already been contracted to supply
offshore wind and tidal projects (News Letter, 2014). As such, Panama’s fishing fleet could
also be an opportunity in terms of being repurposed to meet the supply chain needs of a
marine energy industry.
Grid Connectivity
In terms of offshore grid connection for energy generation, research failed to identify any
notable examples in Panama. As an illustration, in the entire Americas, only 30 MW of
offshore wind (the only other technology requiring similar grid connection) capacity currently
exists under construction (Alstom, 2015), relative to 5.4GW of capacity installed globally in
2012 (World Energy Council, 2013a). Supply chain capacity to connect offshore marine
energy devices is unlikely to currently exist in Panama. If an offshore wind sector were to
develop in Panama this would carry significant synergies for marine energy; otherwise
operations and maintenance vessels have been identified as well suited to adaptation for
this type of role (ORECCA, 2011).
In terms of grid infrastructure onshore, the current Panamanian transmission network is
shown in Figure 25. Existing infrastructure follows population centres and generating
capacity, with more than half the population living in the corridor between Colón and Panama
City alongside the canal (National Institute of Statistics and Census [Instituto Nacional de
Estadística y Censo], 2010). This is linked to the cluster of hydroelectric stations in the
Western, mountainous region of the country where the majority of installed hydroelectric
capacity is located (National Energy Secretariat , 2009). This connection is inadequate to meet
demand near the canal and so expansion is planned as shown, with further development
alongside existing lines under consideration (Lewis & Behar, 2015). Aside from the existing
230kV and dual 115kV lines established to Changuinola in the East and Colón at the entrance
to the canal respectively, any large scale power generation on the Caribbean side would
require significantly more investment in transmission lines to connect to the existing
infrastructure. With the grid considerably closer to the sea on the Pacific side, it makes
connecting marine energy systems more feasible and cost effective here. This
notwithstanding, the evidence of planned grid development does indicate that expansion is
feasible if the resource was deemed significant.

34
Figure 25: Current electricity grid of Panama: hydroelectric power stations are denoted as blue triangles and thermal
capacity as red squares (ETESA, 2014, p. 65).
B. Supply Chain
Concrete and Aggregate
A direct comparison to the scale of work required by a tidal barrage system exists in the
soon-to-be completed US$5.25 billion Panama Canal expansion project, with the new Pacific
access channel alone requiring the excavation of 50 million cubic meters of material (Canal
de Panamá, 2014). This makes it of the same scale in terms of estimated volume of aggregate,
if not larger, than a proposed 3.6 GW tidal lagoon project in the Severn estuary described in
a feasibility study (Department of Energy and Climate Change, 2010). The project also
requires the construction of four dams totalling 5.2 km to raise the new channel 9m above
the adjacent lake (Mejia, et al., 2011); again on a comparable scale to the 9km, 30m tall Lake
Sihwa barrage in Korea (Bae, et al., 2010).
Panama’s existing electrical generation capacity also reinforces this suitability, given the
similarities between the high volumes of civil engineering works required for both tidal
barrage and hydroelectric projects: with more than half of its current capacity being
hydroelectric and plans for nearly double this to be constructed (National Energy Secretariat ,
2009). As such, given the multi-billion dollar scale of work carried out in Panama and the
expertise developed, it is likely one of the places better suited in the world to the high
demand of civil engineering works for tidal barrage specifically. Given this, it is unlikely that
the demands of the other marine energy sectors would be problematic relatively.

35
Steel
There is no for iron ore production in Panama: in 2014 imports of iron and steel in all forms
totalled US$400 million, making it the largest net importer in Central America (UN Comtrade,
2014). In terms of apparent use (deliveries and imports minus exports) of finished steel
product, Panama ranked more modestly as third in Central America with roughly 800,000
tonnes in 2014 (World Steel Association, 2015).
There is a lack of local economic large scale steel production capacity. The new gates for the
Panama Canal expansion project were manufactured in Italy rather than locally in Central
America (Canal de Panamá, 2014). However, given that the gates alone make up US$550
million of the total expansion project cost and weigh a total of 51,200 tonnes (Canal de
Panamá, 2014), it is unlikely that marine energy would immediately take off to an extent
requiring a level of steel production which could not be sourced globally. Comparatively, the
Pelamis WEC requires only 430 tonnes of steel (Court, 2008).
General Expertise
In terms of marine energy specific experience, investigation has identified no specific
instances in Panama. The offshore oil and gas industry and offshore wind, which are both
commonly linked to the marine energy supply chain (Court, 2008; OES, 2011, ORECCA, 2011),
additionally have no presence in Panama; (World Energy Council, 2013a). However, the canal
expansion project has led to the development of 30,000 jobs (Canal de Panamá, 2014),
representing a work force already significantly experienced in the civil construction works
that a tidal barrage would require. In addition, existing hydroelectric power stations and plans
to construct further hydroelectric dams (National Energy Secretariat , 2009) support the
presence and availability of local and imported expertise in major civil engineering works
required for tidal barrage projects and the likely demands of other marine energy sectors.
Other Supply Chain Requirements
Research failed to identify any instances of significant manufacturing of turbines of any type
with which comparisons to the marine energy industry could be drawn. With respect to tidal
barrage though, Panama does have a history of development of hydropower projects. For
example, two of the newer stations in the country, the 32 MW Bonyic station in the western
province of Bocas del Toro and the 29 MW Barro Blanco station in the Chiriqui province were
respectively developed by Hidroecologica del Teribe S.A., a local subsidiary of a Columbian
utility company (Harris, 2015), and Generadora del Istmo S. A., a firm based in Panama city
(Generadora del Istmo, S.A., 2014). No examples were found of megawatt-scale
implementation of run-of-the-river, low-head hydroelectric stations which would be best
compared with tidal barrage applications, but the fact that capacity has been developed

36
under local companies indicates a degree of experience and capability that would be
applicable.
The turbines of horizontal axis TEC, which are generally the most common, form a more
integral part of the device than in other systems (Khan & Bhuyan, 2009). This makes indirect
comparisons with other industries harder to justify, especially given that no evidence was
found of any tidal current operations in Panama.
Platforms, pumps and turbines required for OTEC technology are best compared to the
offshore oil and gas industry due to experience in hazardous offshore environments (The
Coastal Response Research Center, 2009). As stated though, this and the offshore wind
industry have no presence in Panama.
4.2.4. Discussion
In terms of infrastructure, Panama already possesses sufficient capacity for marine energy
deployment or development, albeit only selectively. In terms of ports, the two major hubs at
both ends of the Panama Canal are already well equipped due to dealing with the high
volumes of traffic passing through. Aside these though, capacity is likely limited to providing
an operations and maintenance role only. Commitment to expansion and development of
ports in existing legislation does provide a positive indication that this situation will be
improved with further investment.
Despite high volume of shipping traffic passing through the canal, it was determined that few
vessels were actually based out of Panama. Obsolete or declining fishing vessels do
represent potential for conversion to marine energy applications, in addition to the
burgeoning auxiliary marine sector. Given the synergistic nature of this aspect, as discussed,
development (including for ports), whether aimed at marine energy or ship maintenance for
example, would be mutually beneficial.
In terms of grid connectivity, the existing grid favours development on the Pacific coast, due
to proximity to more densely populated areas. Planned expansion will not alter this, as it will
simply follow existing routes. As such, any project on the Caribbean coast would incur
significantly higher transmission costs unless located near to the entrance to the canal and
existing transmission capacity. Development of offshore cable laying capability (as another
feature of the capacity of vessels), being not identified locally, would be necessary for
deploying marine energy.
Finally, in terms of supply chain aspects, existing sectors in Panama showed the strongest
correlation with the requirements of tidal barrage. The multi-billion dollar scale of the
Panama Canal expansion makes it likely one of the best directly comparable projects in the
37
world to a large scale barrage system. This, in addition to the preponderance of hydropower
capacity, would indicate that the supply chain in Panama is well suited to developing tidal
barrage. Outwith this though, no other aspects of local industry, aside from modest steel
manufacturing capacity, were identified as relevant to marine energy. Encouraging the
development of this, particularly for OTEC and to a lesser extent tidal barrage, will be
discussed in the Recommendations.
4.3. Financial Mechanisms
Electricity generation is subsidized the world over, whether through compensating suppliers
for a lower price paid by consumers (as with renewables) or through disregard of the external
costs of environmental damage (as with fossil fuels; such as reducing life expectancy through
air pollution); with this subsidisation costing an estimated US$5.3 trillion globally in 2015
alone (Coady, et al., 2015). In the case of renewables, this subsidisation is vital to make them
competitive with fossil fuels whilst the external costs of fossil fuels are not factored and the
technology is relatively immature. This section will first discuss the main drivers for financial
measures for marine energy specifically, namely cost and associated uncertainty. It will then
examine mechanisms which can be implemented for marine energy, divided into market pull
(measures which create market demand for the technology) and technology push (measures
which help to reduce costs through incentivising technological improvement) (ORECCA, 2011);
focusing on examples in Europe. Finally, financial incentives used in Panama will be examined,
to compare them to the idealised case for marine energy identified.
4.3.1. The Need for Financial Mechanisms in Renewable Energy
A. Levelised Cost of Electricity
Renewable energy technologies are immature relative to thermal energy production, coupled
with competing in a non- “carbon constrained” market (Mallon, 2006a) and requiring higher
levels of “up-front” capital (Nogee, et al., 1999) makes them for the most part more costly.
Improving the cost-competitiveness of renewables is vital to maximising deployment and can
also generate positive feedback of reduced costs, leading to increased deployment and so
greater focus on further reducing costs (International Energy Agency, 2015).
For marine energy, cost remains one of the most crucial barriers to significant deployment,
remaining non-competitive without varying degrees of financial support (ORECCA, 2011). A
range of levelised cost of electricity (LCOE) estimates for each technology type is given in
Table 6, showing that the LCOE for all types of marine energy varies massively from
€0.63/kWh for early wave device arrays to as little as €0.02/kWh for the Lake Sihwa tidal
barrage in Korea. A range for coal, the cheapest traditional electricity source, and onshore

38
wind, the cheapest non-conventional renewable energy (NCRE), are also shown illustratively.
It should be noted that the LCOE of the Sihwa and the La Rance plant in France is so low due
to site specific factors, such as the Sihwa scheme being installed as an after-thought to an
existing seawall (Mofor, et al., 2014). They both however illustrate the potential for marine
energy to be cost-competitive with other electrical generation.
Table 6: Illustration of the wide range of cost estimates for each technology, with sources provided in each case (all costs
converted to Euros at the time of writing).
Technology Type LCOE Estimates (€/kWh)
Wave Early Array: 0.33-0.63 (SI Ocean, 2013) Early Array: 0.40-0.52 (Mofor, et al.,
2014)
Tidal Current Early Array: 0.17-0.47 (Mofor, et al.,
2014) Early Array: 0.24-47 (SI Ocean, 2013)
OTEC 10 MW: 0.40; 100 MW: 0.17
(Vega, 2010)
80 MW: 0.17-0.28; 320 MW: 0.09-0.17
(OES, 2015)
Tidal Barrage Tidal Lagoon: 0.13 (Pöyry, 2014) La Rance: 0.04 – 0.12;
Lake Sihwa: 0.02 (Mofor, et al., 2014)
Coal 0.04-0.14 (not including external costs) (World Energy Council, 2013b)
Onshore Wind 0.05-0.21 (World Energy Council, 2013b)
B. Cost Uncertainty
Reducing cost in itself is only half the picture: uncertainty and therefore inherent risk in
renewable energy projects can make private sector investors reluctant to invest in projects
(Mofor, et al., 2014): factors influencing this are shown in Table 7. This is coupled with general
uncertainty of the pathways to cost reductions: although it is expected that improvements in
technology and economies of scale will bring about reduced costs (ORECCA, 2011), the exact
extent and timescale for reductions in LCOE are unpredictable (Mofor, et al., 2014).
Table 7: Factors influencing the uncertainty for each marine energy technology type (Mofor, et al., 2014, p. 39).
Technology Type
Driver of LCOE Uncertainty
Limited empirical data
on cost
Wide variety in costing
strategies
Important site-specific
factors
Wave Energy
Tidal Current
Tidal Barrage
OTEC
Major driver Medium driver Minor driver
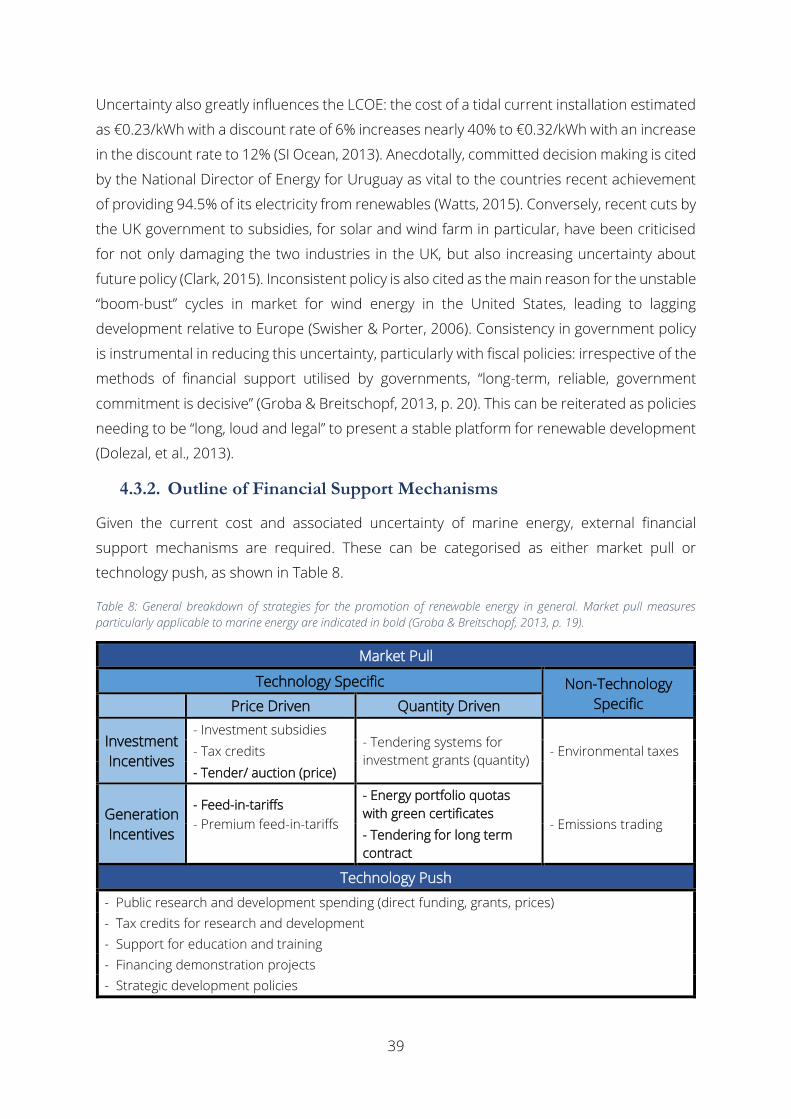
39
Uncertainty also greatly influences the LCOE: the cost of a tidal current installation estimated
as €0.23/kWh with a discount rate of 6% increases nearly 40% to €0.32/kWh with an increase
in the discount rate to 12% (SI Ocean, 2013). Anecdotally, committed decision making is cited
by the National Director of Energy for Uruguay as vital to the countries recent achievement
of providing 94.5% of its electricity from renewables (Watts, 2015). Conversely, recent cuts by
the UK government to subsidies, for solar and wind farm in particular, have been criticised
for not only damaging the two industries in the UK, but also increasing uncertainty about
future policy (Clark, 2015). Inconsistent policy is also cited as the main reason for the unstable
“boom-bust” cycles in market for wind energy in the United States, leading to lagging
development relative to Europe (Swisher & Porter, 2006). Consistency in government policy
is instrumental in reducing this uncertainty, particularly with fiscal policies: irrespective of the
methods of financial support utilised by governments, “long-term, reliable, government
commitment is decisive” (Groba & Breitschopf, 2013, p. 20). This can be reiterated as policies
needing to be “long, loud and legal” to present a stable platform for renewable development
(Dolezal, et al., 2013).
4.3.2. Outline of Financial Support Mechanisms
Given the current cost and associated uncertainty of marine energy, external financial
support mechanisms are required. These can be categorised as either market pull or
technology push, as shown in Table 8.
Table 8: General breakdown of strategies for the promotion of renewable energy in general. Market pull measures
particularly applicable to marine energy are indicated in bold (Groba & Breitschopf, 2013, p. 19).
Market Pull
Technology Specific Non-Technology
Specific Price Driven Quantity Driven
Investment
Incentives
- Investment subsidies - Tendering systems for
investment grants (quantity) - Environmental taxes - Tax credits
- Tender/ auction (price)
Generation
Incentives
- Feed-in-tariffs
- Premium feed-in-tariffs
- Energy portfolio quotas
with green certificates - Emissions trading
- Tendering for long term
contract
Technology Push
- Public research and development spending (direct funding, grants, prices)
- Tax credits for research and development
- Support for education and training
- Financing demonstration projects
- Strategic development policies
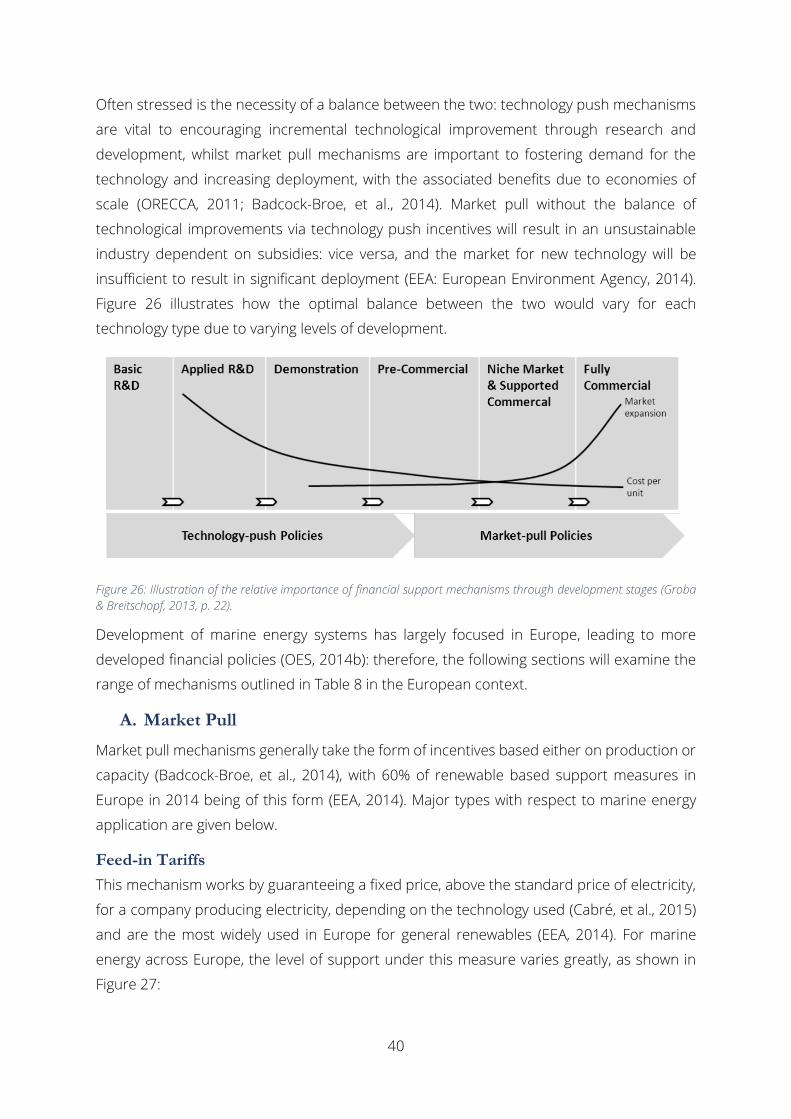
40
Often stressed is the necessity of a balance between the two: technology push mechanisms
are vital to encouraging incremental technological improvement through research and
development, whilst market pull mechanisms are important to fostering demand for the
technology and increasing deployment, with the associated benefits due to economies of
scale (ORECCA, 2011; Badcock-Broe, et al., 2014). Market pull without the balance of
technological improvements via technology push incentives will result in an unsustainable
industry dependent on subsidies: vice versa, and the market for new technology will be
insufficient to result in significant deployment (EEA: European Environment Agency, 2014).
Figure 26 illustrates how the optimal balance between the two would vary for each
technology type due to varying levels of development.
Figure 26: Illustration of the relative importance of financial support mechanisms through development stages (Groba
& Breitschopf, 2013, p. 22).
Development of marine energy systems has largely focused in Europe, leading to more
developed financial policies (OES, 2014b): therefore, the following sections will examine the
range of mechanisms outlined in Table 8 in the European context.
A. Market Pull
Market pull mechanisms generally take the form of incentives based either on production or
capacity (Badcock-Broe, et al., 2014), with 60% of renewable based support measures in
Europe in 2014 being of this form (EEA, 2014). Major types with respect to marine energy
application are given below.
Feed-in Tariffs
This mechanism works by guaranteeing a fixed price, above the standard price of electricity,
for a company producing electricity, depending on the technology used (Cabré, et al., 2015)
and are the most widely used in Europe for general renewables (EEA, 2014). For marine
energy across Europe, the level of support under this measure varies greatly, as shown in
Figure 27:

41
Figure 27: Production based incentives for marine energy across Europe (ORECCA, 2011, p. 52).
Feed-in tariffs (FiT) allow the development of new technologies by using different tariffs
between sources, as well as reducing uncertainty of future revenue (Errázuriz and Asociados
Ingenieros, 2012). However it may create an artificial market which shields producers from
market signals, in addition to placing a greater burden of cost on the end consumer or
government (European Commission, 2013).
Quotas
Quotas set a pre-determined amount of energy to be either sold or produced by electricity
companies or purchased by users (EEA, 2014). In its simplest form, a quotas are often viewed
as unsuitable for developing technologies, forcing electricity producers to utilise the cheapest
available technology (Groba & Breitschopf, 2013). Quota systems can however be set up to
cater to different technologies, as with the renewable obligation certificates (ROCs) system in
Scotland: here tidal current and wave technologies were given five ROCs each as opposed to
one for onshore wind (Ares, 2012), making them more valuable in meeting the quota. This
does leave the system vulnerable to market distortion via the accuracy and representation
of the weightings given.
Auctions
These function by government set targets, typically over a period of 15-25 years, in terms of
pre-determined supply or capacity being met at an auction of electricity suppliers (Lucas, et
al., 2013). Similarly to a quota system, in the case of marine energy this would need to be set
up for specific technologies rather than renewable energy on the whole (Errázuriz and
Asociados Ingenieros, 2012). Uncertainty about whether a project will be selected can also
deter investors, curtailing development (Groba & Breitschopf, 2013).
0.00
0.05
0.10
0.15
0.20
0.25
0.30
0.35
0.40
Denmark France Ireland Italy Portugal UK
Pro
du
cti
on
In
ce
nti
tve
(€
/kW
h)

42
Tax Incentives
A less direct measure to incentivise renewable energy, which includes tax exemptions or
reductions at any stage of the project or other measures such as accelerated depreciation
on equipment. This measure also has the added advantage of reducing upfront investment
costs for projects (Cabré, et al., 2015). This mechanism exclusively would be insufficient to
stimulate a market for marine energy, as it would only encourage the cheapest technology.
None of the identified marine energy roadmaps made reference to this form of incentive, but
in conjunction with other measures it would be effective in reducing the LCOE.
B. Technology Push
As shown in Table 8, technology push mechanisms come in a wider and more general variety,
and so rather than attempt to categorise them, this section will address several major
mechanisms currently in place across Europe and specifically in the UK. Additionally, the
balance of mechanisms depends on the maturity of the technology; tidal barrage therefore,
as the most mature technology, would likely need very few technology push style support
measures, whereas tidal current, wave and OTEC would likely need far more in terms of
incentive to improve on current technology.
Examples in Europe
The NER 300 programme is the largest EU renewable energy funding mechanisms: awarding
more than €2 billion, raised from the sale of 300 million EU emissions trading allowances,
across 42 projects (European Commission, 2016). Among this was €163.4 million spread
between three wave projects, two tidal current projects and one OTEC project (which is set
to receive a maximum of €72 million depending on the performance of the project)
(European Commission, 2012; European Commission, 2014). While there are few measures
providing funding specifically for marine energy projects across Europe, there are a number
of knowledge sharing initiatives. This includes the Ocean Energy Forum, a two-year project
launched by the European Commission in 2014 aimed at bringing together stakeholders to
fully establish shared problems and develop solutions via a roadmap for the sector (OES,
2014b). The EquiMar project is another such example: a research consortium of 23
organisations which, from 2008-2011, developed protocols for unified assessment of wave
and tidal current energy converters (MacDonald, 2012).
Examples in the United Kingdom
Numerous examples of funding measures can be found in the UK for varying aspects of
technologies. This includes the Marine Energy Array Demonstrator scheme, which awarded
£20 million to MeyGen tidal current project in the Pentland Firth (OES, 2014b). The Marine
Renewables Commercialisation Fund is an £18 million fund administered by the Carbon Trust
to again support commercial scale arrays of wave and tidal current devices (Renewable UK,

43
2013), and also awarded £2.8 million to five innovative projects at an earlier stage of
commercialisation (OES, 2014b). Finally, the Marine Energy: Supporting Array Technologies
programme resulted in the investment of £6 million in six projects supporting the
development of wave and tidal arrays, such as subsea electrical hub design and corrosion
preventions (Renewable UK, 2013).
More generally, there are numerous organisations which offer support for research and
development, such as the Research Councils UK, Innovate UK, the Energy Technologies
Institute and the Carbon Trust (OES, 2014b). The UK is also home to the only accredited wave
and tidal current test centre in the world, EMEC, as previously discussed: it also acts as a
forum for knowledge exchange and collaboration (OES, 2015). Funded publically, it is
estimated to have already contributed 4.5 times its initial investment back into the UK
economy through testing devices, as well as offering consultancy services (Renewable UK,
2013).
4.3.3. Financial Mechanisms in Panama
A. Marine Energy Mechanisms
Investigation has failed to identify any instances of financial mechanisms in Panama directed
at marine energy specifically. The most recent national energy plan by the National Energy
Secretariat disregards marine energy entirely (National Energy Secretariat , 2009).
Preliminary reports for a plan currently in development for 2015-2050 also discusses wind
and solar power, failing to mention marine energy in any form (National Energy Secretariat ,
2016), reinforcing that marine energy has been disregarded thus far in Panamanian
renewable energy policy.
B. Renewable Energy Mechanisms
Electricity in Panama, renewable or otherwise, is contracted by a tendering process managed
by the Electricity Transmission Company [Empresa de Transmisión Eléctrica, S.A] (ETESA) and
regulated by the National Authority of Public Services [Autoridad Nacional de los Servicios
Publicos] (ASEP), who also control transmission (National Assembly of Panama, 2015). This is
done without a quota to require any percentage of renewable energy generation or separate
rates for differing technologies (Dolezal, et al., 2013). Similarly, the only numerical renewable
energy target is a target of 706MW of new hydroelectric capacity by 2023 (Cabré, et al., 2015).
The merit of encouraging the development of renewable energy in Panama has been
recognised in several laws, the two most important being Executive Decree No. 36 of 2007
and Law No. 45 of 2004. The former sets general policy goals of emissions reductions,
combatting climate change and diversification of supply (National Assembly of Panama, 2007).

44
The latter establishes two financial policies, both of which would be useful at a smaller scale:
that renewable generation up to 20 MW capacity will not be charged for transmission or
distribution for the first 10 MW in addition to a tax incentive based on the equivalent tonnes
of CO2 emissions prevented during the first 10 years of operation for the same capacity of
20 MW (National Assembly of Panama, 2004).
Whilst not committing to wide-sweeping renewable energy incentives, Panama has
encouraged the deployment of individual renewable technologies. The largest scale
deployment of NCRE thus far in Panama is wind, with three main sites in operation or in the
final stages of construction currently totalling 337 MW (Lewis & Behar, 2015). This is a direct
result of Law No. 44 of 2011, via ETESA purchase agreements LPI-05-11 and LPI-03-13 (ETESA,
2015). This mandated an auction for wind energy up to 5% of national demand at the
discretion of ETESA (this was later altered by Law 18 of 2013 to any percentage deemed
appropriate) and implemented various tax exemptions: importantly it also requires provision
of a performance bond (a form of insurance) to guarantee contractual obligations are met
(National Assembly of Panama, 2011; National Assembly of Panama, 2013a). This has also
occurred to a lesser extent with solar power: Law 37 of 2013 has similar incentives to the
wind law (National Assembly of Panama, 2013b), resulting in an agreement for 66 MW of
capacity, with more granted preliminary permissions (ETESA, 2014). This, coupled with the
governments’ commitment to energy diversification, demonstrates the possibility for
implementing similar measures to deploy marine energy in Panama.
As a party to the United Nations Framework Convention on Climate Change, projects in
Panama demonstrably reducing carbon emissions can be certified under the Clean
Development Mechanism to generate saleable Emissions Reduction Certificates (Cohen &
Aued, 2012). This is. The mechanism has already been used in Panama, indicating the
potential for marine energy: it is regulated under the main renewable energy law, law No. 45
of 2004 (National Assembly of Panama, 2004), with the 198 MW Penonome wind farm
granted a reduction of 381,881 tonnes of CO2 equivalent per year from 2013-2020 (Clean
Development Mechanism, 2013).
Additionally of note is that electricity tariffs are set and smoothed on an ad hoc basis by ASEP;
this is managed by a fund set up in 2004 which pays the difference between tariff and
generation costs to distributors (Dolezal, et al., 2013). This universal subsidy is coupled with
one targeting households below a certain threshold per month, which has been steadily
reduced since 2013; cutting the overall cost of subsidies from 0.8% of GDP in 2011 to 0.3%
of GDP in 2013 (Di Bella, et al., 2015). This policy has contributed to the governments’ long
term commitment to increasing electricity access (National Energy Secretariat , 2009),
particularly in poorer rural areas where the rate of extreme poverty is almost 7 times greater
45
than in urban areas (World Bank, 2015). The cost burden on the Panamanian Government
can be seen as a contributing factor to the lack of more expensive financial incentives such
as FiTs: given that electricity is already subsidised, further costs could not be taken up by the
consumer, as in the UK for example (Department of Energy and Climate Change, 2014), and
would have to be taken up by the government on top of existing tariff reductions.
No manufacturers or developers of renewable energy technology were identified in Panama,
explaining the similar lack of technology push mechanisms. Generally, as evidenced by the
National Energy Plan, it can be said that for renewable energy Panama has taken a
“deployment” rather than “development” stance with renewables (National Energy
Secretariat , 2009), hence the preponderance of market pull over technology push measures.
4.3.4. Discussion
The Panamanian landscape for renewable financial incentives is not ideally suited to marine
energy currently, but could certainly be altered to be more conducive. The form of this would
vary depending on the maturity of the technology though, given the forms of the various
market pull mechanisms discussed. Ideally, this would take the form of introducing a
separate FiT for each technology type, as this was identified as most suitable for incentivising
the overall development and deployment of emerging renewable technologies. Success of
Laws 44 of 2011 and 37 of 2013 for wind and solar power respectively would indicate
potential suitability for implementing similar measures for marine energy: however an
important distinction exists, as both wind and solar are relatively well developed. For tidal
barrage, a similar law could be effective to encourage its deployment, but for immature wave,
tidal current and OTEC technologies this would be unsuitable given the lack of devices and
developers at a commercial stage. To encourage deployment currently, these would require
a fixed price reflective of the current LCOE for each type rather than an auction or tendering
process. As the LCOE falls and the technology becomes competitive in the future, an auction
could become more appropriate.
Whilst the evidence of existing market pull mechanisms was encouraging, lack of technology
push ones in Panama would require alteration if an active development approach was
chosen. Developing technology locally would require significant investment push
mechanisms in order to encourage the driving down of LCOE.
Irrespective of the financial mechanisms implemented, committed policy was deemed to be
critical in ensuring long-term success. This would also apply equally to any aspect of
government policy given the negative effect of uncertainty on investor confidence in projects.
46
4.4. Legislation and Regulation
Legislation and regulation forms the last major aspect of a marine energy sector. Broadly
speaking, legislation represents the higher order governmental control in the form of laws
placed on a sector or industry and regulations are more specific requirements or guidelines
from relevant agencies (World at Work, 2009). Top-down governmental control in both these
senses is vital to the continued operation and development of society in a sustainable fashion,
especially with respect to electricity networks (Department of Energy and Climate Change,
2011).
Historically, electricity generation capacity across the globe has been monolithic, individual
power plants (such as coal, gas, nuclear or large hydropower), leading to a preponderance of
governing regulation which caters to this (as well as a more streamlined process overall) and
often fails to effectively accommodate renewable energy capacity, with a tendency towards
arrays of smaller, individual devices (such as wind, tidal current and wave) (Mallon, 2006b).
Inconsistency and confusion in the consenting and permitting process for renewable energy
are major barriers to development, leading to “long delays and overly complex bureaucratic
processes that increase investment costs and diminish returns on investment, thereby
deterring investors” (Dolezal, et al., 2013, p. 48).
4.4.1. Marine Energy Legislation and Regulation
For marine energy specifically, this becomes even more pertinent: given the immaturity of
the technology and the uniqueness of devices from a regulatory perspective, regulation is
often transposed from other sectors, such as offshore oil and gas, to ineffectively cover
marine energy (Simas, et al., 2013). In the US in 2009 for example, approval of a marine
energy project requires consultation with twenty-three separate agencies, leading to an
extremely convoluted and impeded system (Leary & Esteban, 2009), which acts a barrier to
investment. To make the regulatory and consenting process as efficient as possible, literature
on the subject identifies three main factors: a “one-stop shop” consenting process,
conducting a strategic environmental assessment (SEA) and developing a marine spatial plan
(MSP) (Woolf, 2011; Errázuriz and Asociados Ingenieros, 2012; Badcock-Broe, et al., 2014;
Mofor, et al., 2014). Each of these aspects are explained in detail in the following sections.
Whilst these measures represent the most facilitative legislation and regulation environment
for marine energy, specific inclusion in existing legislation is limited save for the few European
countries pursuing marine energy development, shown in Table 9 (Directorate-General of
Maritime Affairs and Fisheries, 2012). Even in Europe, the extent of development varies: with
Scotland already having each measure in place and France having implemented none of

47
them fully. In the European case, SEAs for tidal barrage and OTEC were neglected as they are
not expected to contribute significantly to electricity generation regionally (ORECCA, 2011).
Table 9: Summary of the varying degrees of the identified measures enacted in Europe (Edwards & Holroyd, 2010; Vivero,
2011; Badcock-Broe, et al., 2014; WavEC, 2015; Marine Scotland, 2016).
Country SEA for Marine Energy
MSP “One-stop-shop”
Consenting Wave Tidal Current
Denmark No No resource Under development Yes
France No No Under development No
Ireland Yes Yes Under development No
Portugal No No Resource Yes Under
development*
Spain No No Resource Under development No
Scotland Yes Yes Yes Yes
* Process is streamlined, but still involves four separate agencies.
A. Consenting Process
Marine energy projects require many different permissions for varying reasons, with the
major categories being use of the seabed, electricity generation, grid connection, sea cables,
navigation, environmental impact and general health and safety (Simas, et al., 2009). Ensuring
that obtaining all consents is as straightforward as possible is widely recognised as helping
to accelerate the development of the sector (ORECCA, 2011; Dolezal, et al., 2013; Simas, et
al., 2013). The best practice can be summed up as needing to “streamline and accelerate…
by removing excessive administrative and cost burdens” (Badcock-Broe, et al., 2014, p. 13)
which arise from overly complex and unclear procedures, which can end up taking years to
process (WavEC, 2015). This is exacerbated by the fact that, as previously stated, regulation
in place is usually adapted from other sectors, such as offshore oil and gas, thereby making
it inefficient for marine energy (Simas, et al., 2013).
To ensure this is removed as a barrier (which also further contributes to project uncertainty,
adversely affecting costs and investor confidence), ideally a “one-stop shop” process should
be implemented (Woolf, 2011). This consists of two main aspects: provision of guidance to
applicants on the relevant laws to comply with legislation and also a single “point of contact”
which guides developers through the process (ORECCA, 2011). Currently in Europe, the
extent of this is mixed, as shown in Table 9: in Spain for example, development of a wave
energy project would require working with 16 separate agencies, taking two years (Badcock-
Broe, et al., 2014; WavEC, 2015). In England, on the other hand, the consenting agency has
in place a performance indicator of 13 weeks for concluding marine energy license
applications (WavEC, 2015).
48
Scotland in particular has taken the initiative with adopting the process, by transferring
administration of several permits, such as electrical generation and environmental protection,
to Marine Scotland (Marine Laboratory, 2010). Following consultation, applicants are advised
on site suitability and what information (what stakeholders to consult and environmental
data for example) will be required: after receiving this, the application is processed, taking 9
around months (ABP Marine Environmental Research, 2012).
B. Strategic Environmental Assessment
Due to the complex nature of devices interacting with the environment and the limited
amount of empirical data, the understanding of possible effects on each aspect of the
environment, as well as the cumulative consequences, are poorly understood (Conley, et al.,
2013). Whilst impacts are generally considered negative, such as reducing biodiversity and
mobilizing sediments (Gill, 2005), there can also be positive effects: increased deposition of
sediment in the estuary of the La Rance tidal barrage plant has led to a widening in the variety
of invertebrates (Kirby & Retière, 2009). OTEC has been identified particularly as needing
further investigation (Comfort & Vega, 2011), as temperature changes of as little 3-4°C have
been known to be deadly to tropical coral and fishes (Etemedi, et al., 2011).
Stringient environmental impact assessment (EIA) regulations, approximated from
established sectors such as offshore oil and gas, tend to be applied to marine energy projects
(Badcock-Broe, et al., 2014). Given the immature nature of marine energy, this places an
unreasonable burden of environmental assessment on projects (Musial, 2008). Flexibility is
often encouraged for EIAs, but also the general marine energy consenting process, resulting
in a “survey, deploy and monitor” approach (ORECCA, 2011; Muñoz Arjona & Olivares, 2012;
Simas, et al., 2013). This includes assessing the risk of proposals compared to the sensitivity
of the site, reducing environmental surveying if the project allows, and can be combined with
an “adaptive management” approach allowing information to be accrued after installation
provided predetermined limits are not exceeded (Badcock-Broe, et al., 2014). Across Europe,
EIA requirements vary, determined on a case-by-case basis in the UK and only required in
environmentally protected areas in Portugal.
More importantly is an SEA in relieving the EIA burden from individual projects: an SEA can
be summarised as a strategic, national level EIA (Simas, et al., 2013). This makes them useful
for “identifying the ‘likely’ significance of ‘potential’ effects” in a given region and therefore
provide a basis for develop site-specific EIAs (ORECCA, 2011, p. 84). In Europe, Scotland in
particular has taken a proactive approach, publishing an SEA for wave and tidal in 2007 which
summarises the main environmental effects of wave and tidal devices in relation to Scottish
waters (Faber Maunsell and Metoc, 2007). Publically available information such as this, in

49
addition to other documents such as “Scotland’s Marine Atlas”, which gathers together a wide
range of environmental data for Scottish waters (Baxter, et al., 2011), is vital to removing
developer uncertainty about environmental implications of projects as a barrier to
deployment (ORECCA, 2011; Muñoz Arjona & Olivares, 2012; WavEC, 2015).
C. Marine Spatial Planning
Deployment of marine energy is in effect the privatisation of a public commodity (as few other
industries require exclusive occupation of the ocean) and so has potential to conflict with
other stakeholders (Wright, 2014). Measures need to be taken to ensure that marine
resources are used efficiently and sustainably by all stakeholders: a well thought-out MSP is
a unified and continuous method for ensuring this occurs equitably (Intergovernmental
Oceanographic Commission, 2015). For marine energy, this helps to foresee and prevent
competition with other uses of the sea (Mofor, et al., 2014).
MSPs generally follow the same structure, with stakeholder engagement intrinsically part of
the process throughout: breaking down a country’s EEZ to appropriately scaled sectors,
determining the desired outcomes and then planning how best to share the resource over
the chosen timescale (Gilliland & Laffoley, 2008). Portuguese experience drafting a MSP
showed that they should be designed on a “case by case basis, recognising temporal and
spatial variations” (Calado, et al., 2010, p. 1341). Plans are for 10-25 years ahead and are
continuously updated based on monitoring, review and continuous stakeholder engagement
(Gilliland & Laffoley, 2008).
Given the cross-sectoral nature of MSPs, the management responsibility varies. In Portugal,
management is by representatives from the Inter-Ministerial Committee for Sea Affairs, the
Portuguese Water Institute and four external consultants, in addition to participation of
several environmental agencies, totalling 17 separate public entities (Santos, et al., 2013).
Conversely, a framework for the Orkneys and the Pentland Firth specifically with reference to
wave and tidal current has been solely developed by Marine Scotland, with the final plan aims
to be completed by the middle of 2016 (Marine Scotland, 2011; The Scottish Government,
2016). Although it would seem preferable, due to being more efficient purely from a marine
energy perspective, to have an MSP managed by a single organisation, analysis of the
Portuguese case indicated that adaptation of present resources to be preferable, with not all
countries capable of sparing resources to create new organisations or completely
restructure existing ones for the purpose (Calado, et al., 2010).
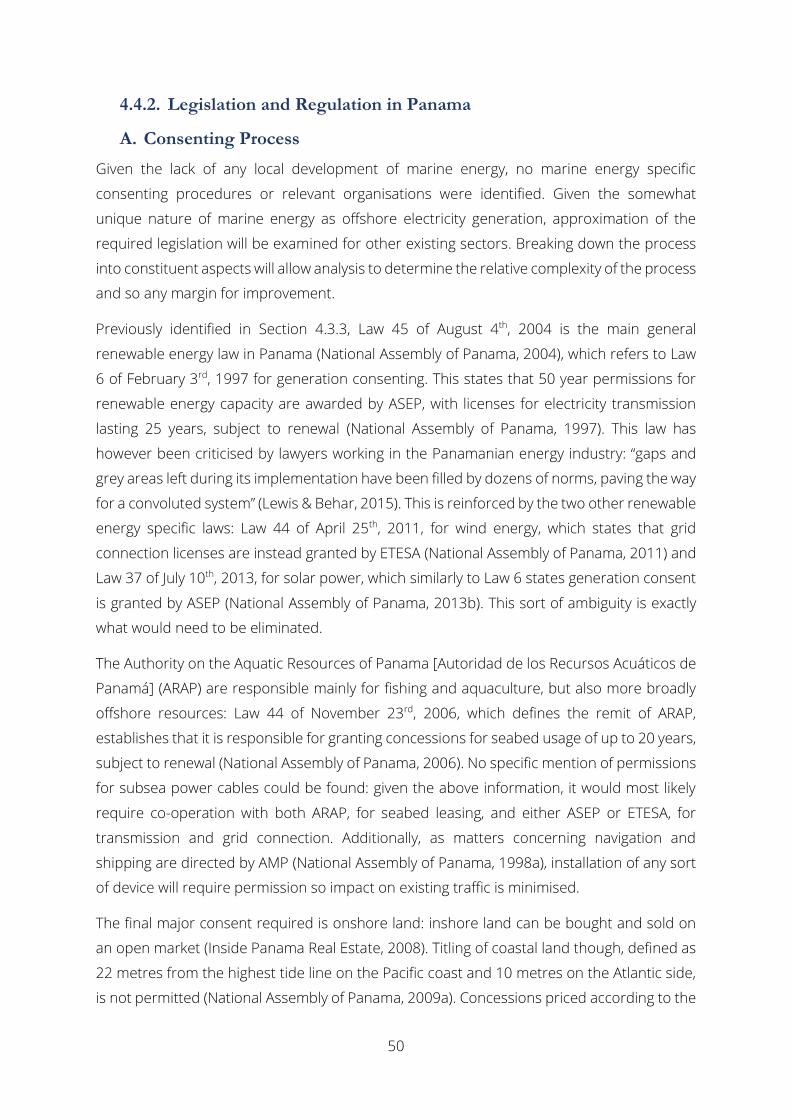
50
4.4.2. Legislation and Regulation in Panama
A. Consenting Process
Given the lack of any local development of marine energy, no marine energy specific
consenting procedures or relevant organisations were identified. Given the somewhat
unique nature of marine energy as offshore electricity generation, approximation of the
required legislation will be examined for other existing sectors. Breaking down the process
into constituent aspects will allow analysis to determine the relative complexity of the process
and so any margin for improvement.
Previously identified in Section 4.3.3, Law 45 of August 4th, 2004 is the main general
renewable energy law in Panama (National Assembly of Panama, 2004), which refers to Law
6 of February 3rd, 1997 for generation consenting. This states that 50 year permissions for
renewable energy capacity are awarded by ASEP, with licenses for electricity transmission
lasting 25 years, subject to renewal (National Assembly of Panama, 1997). This law has
however been criticised by lawyers working in the Panamanian energy industry: “gaps and
grey areas left during its implementation have been filled by dozens of norms, paving the way
for a convoluted system” (Lewis & Behar, 2015). This is reinforced by the two other renewable
energy specific laws: Law 44 of April 25th, 2011, for wind energy, which states that grid
connection licenses are instead granted by ETESA (National Assembly of Panama, 2011) and
Law 37 of July 10th, 2013, for solar power, which similarly to Law 6 states generation consent
is granted by ASEP (National Assembly of Panama, 2013b). This sort of ambiguity is exactly
what would need to be eliminated.
The Authority on the Aquatic Resources of Panama [Autoridad de los Recursos Acuáticos de
Panamá] (ARAP) are responsible mainly for fishing and aquaculture, but also more broadly
offshore resources: Law 44 of November 23rd, 2006, which defines the remit of ARAP,
establishes that it is responsible for granting concessions for seabed usage of up to 20 years,
subject to renewal (National Assembly of Panama, 2006). No specific mention of permissions
for subsea power cables could be found: given the above information, it would most likely
require co-operation with both ARAP, for seabed leasing, and either ASEP or ETESA, for
transmission and grid connection. Additionally, as matters concerning navigation and
shipping are directed by AMP (National Assembly of Panama, 1998a), installation of any sort
of device will require permission so impact on existing traffic is minimised.
The final major consent required is onshore land: inshore land can be bought and sold on
an open market (Inside Panama Real Estate, 2008). Titling of coastal land though, defined as
22 metres from the highest tide line on the Pacific coast and 10 metres on the Atlantic side,
is not permitted (National Assembly of Panama, 2009a). Concessions priced according to the
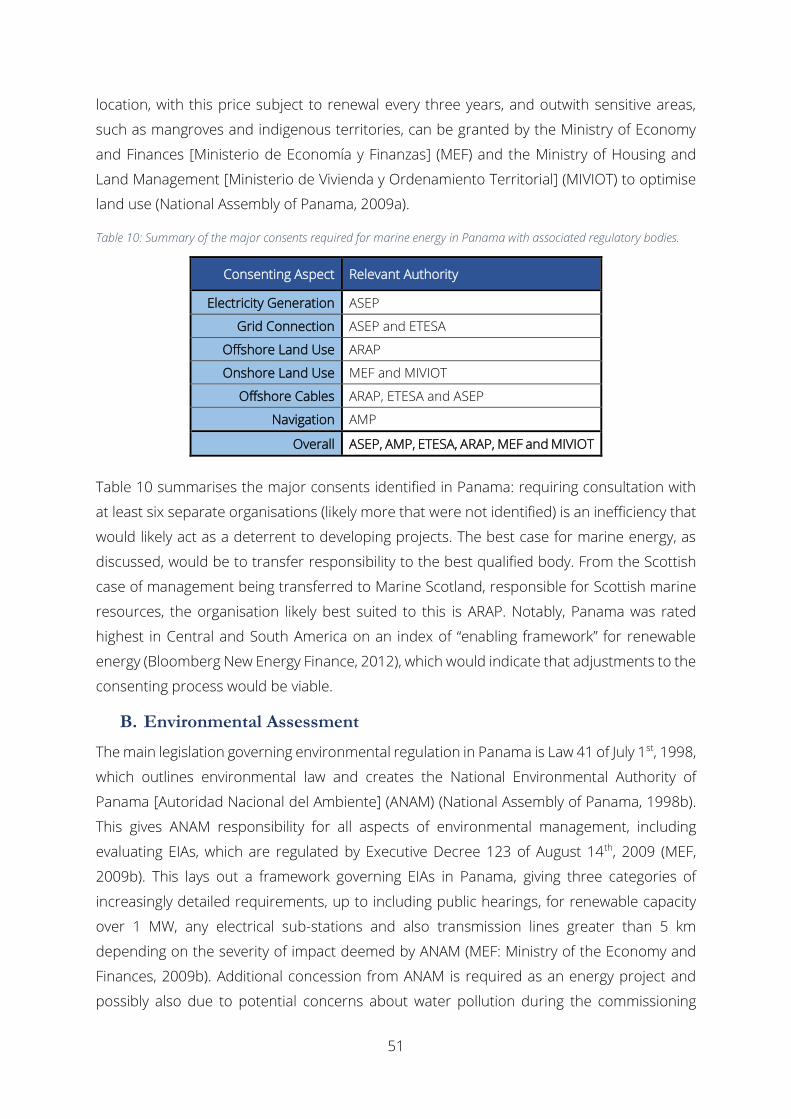
51
location, with this price subject to renewal every three years, and outwith sensitive areas,
such as mangroves and indigenous territories, can be granted by the Ministry of Economy
and Finances [Ministerio de Economía y Finanzas] (MEF) and the Ministry of Housing and
Land Management [Ministerio de Vivienda y Ordenamiento Territorial] (MIVIOT) to optimise
land use (National Assembly of Panama, 2009a).
Table 10: Summary of the major consents required for marine energy in Panama with associated regulatory bodies.
Consenting Aspect Relevant Authority
Electricity Generation ASEP
Grid Connection ASEP and ETESA
Offshore Land Use ARAP
Onshore Land Use MEF and MIVIOT
Offshore Cables ARAP, ETESA and ASEP
Navigation AMP
Overall ASEP, AMP, ETESA, ARAP, MEF and MIVIOT
Table 10 summarises the major consents identified in Panama: requiring consultation with
at least six separate organisations (likely more that were not identified) is an inefficiency that
would likely act as a deterrent to developing projects. The best case for marine energy, as
discussed, would be to transfer responsibility to the best qualified body. From the Scottish
case of management being transferred to Marine Scotland, responsible for Scottish marine
resources, the organisation likely best suited to this is ARAP. Notably, Panama was rated
highest in Central and South America on an index of “enabling framework” for renewable
energy (Bloomberg New Energy Finance, 2012), which would indicate that adjustments to the
consenting process would be viable.
B. Environmental Assessment
The main legislation governing environmental regulation in Panama is Law 41 of July 1st, 1998,
which outlines environmental law and creates the National Environmental Authority of
Panama [Autoridad Nacional del Ambiente] (ANAM) (National Assembly of Panama, 1998b).
This gives ANAM responsibility for all aspects of environmental management, including
evaluating EIAs, which are regulated by Executive Decree 123 of August 14th, 2009 (MEF,
2009b). This lays out a framework governing EIAs in Panama, giving three categories of
increasingly detailed requirements, up to including public hearings, for renewable capacity
over 1 MW, any electrical sub-stations and also transmission lines greater than 5 km
depending on the severity of impact deemed by ANAM (MEF: Ministry of the Economy and
Finances, 2009b). Additional concession from ANAM is required as an energy project and
possibly also due to potential concerns about water pollution during the commissioning
52
phase especially (Cohen & Aued, 2012). Significantly, similar projects in the same area are
directed to refer to previous EIAs, thus relieving some of the burden of evidence: after this,
approved EIAs are then valid for two years until commencement of the project (MEF, 2009b).
A significant area of Panama, as much as 25% of the total land area, is divided between 76
protected areas (Anywhere Panama, 2015). This is governed by Resolution AG-0130-2012 of
April 13th, 2012, which dictates that protected areas should be subject to studies which
include the acceptable limits of environmental change (ANAM, 2012). Depending on the
environmental sensitivity of a given area, any of the areas shown in Figure 17 (p. 24) could be
unsuitable for marine energy depending on their environmental fragility.
Whilst no evidence of marine energy specific EIAs were identified in Panama, Executive
Decree 123 of 2009 does state that any strategic plan at a national scale must include an SEA
(MEF, 2009b). The usefulness in sustainable and effective planning has already been
recognised in Panama, with ANAM running courses on the implementation of SEAs (ANAM,
2015), and guidelines for developing an SEA regionally in Central America existing
(Department of Environmental Policy and Management [Unidad de política y gestión
ambiental], 2007). As stated, developing an SEA would be extremely conducive to removing
the burden of EIAs from individual projects, even taking into account the flexibility of ANAM
towards similar projects.
C. Maritime Spatial Planning
As stated, sectors related to the ocean are significant contributors to Panama’s economy,
making for numerous stakeholders, with maritime industries generating roughly 20% of GDP
(Ibañez, 2014). In 2006, the fishing sector directly employed 195,000 people; 7% of the total
population (Food and Agriculture Organization of the United Nations, 2007). Tourism, driven
in part by Panama’s tropical coastline and islands (Albert & Andreu, 2012), accounted for 6%
of GDP and 6% of the workforce in 2015 (Schwab, et al., 2015). Concessions for the majority
of the Pacific coastline and a significant proportion of the Caribbean have been granted with
the potential to be developed residentially (Vargas, 2007), with as much as 80% of the
population living on and depending on resources of the Pacific coast (Suman, 2002). With 57%
of the total shipping volume in Central America passing through the two Panamanian ports
of Balboa and Colón in 2013 (American Association of Port Authorities, 2014), shipping traffic
is another factor that marine energy would have to contend with.
Given the lack of consideration of marine energy in Panama, no marine spatial plans including
it were identified. Due to the wide variety of stakeholders and their contribution to the
Panamanian economy though, it is unsurprising that marine planning has been carried out.
Foremost of these plans are two integrated coastal management plans (which follow the

53
same planning principle as an MSP, albeit at a more localised scale) for the Darien province
(Suman, 2007) and Bocas Del Toro (Arden & Price Consulting, 2008). However, these have
not been adapted to a national level: recent academic investigation of Panama’s marine
management policy characterised it as possessing a “lack of integration across institutions
and regulations”, attributable partly to transferring responsibility for coastal management
three times between organisations in the last 17 years (Spalding, et al., 2015, p. 166). The
AMP was created in 1998 with the aim of streamlining marine management via co-ordination
of authorities related to the ocean and was initially responsible for management of Panama’s
merchant fleet, fisheries and coastal areas (National Assembly of Panama, 1998a); the latter
two of which have since been transferred to have since been delegated to ARAP and ANAM
respectively, most recently in 2015 (Spalding, et al., 2015). The AMP has published a “National
Maritime Strategy”, most recently in 2009: given its reduced responsibilities, this focuses
solely on developing the ports and auxiliary maritime sectors of Panama (AMP, 2008). This
confusing and sometimes contradictory legislation regarding management of marine
planning and lack of institutional leadership has been a theme since the 1990s (Suman, 2002).
4.4.3. Discussion
At least six separate government organisations were identified as requiring consultation with
to gain consent for marine energy projects, with there likely more that were not recognised.
This represents a clear opportunity for improvement in terms of expediting the process.
Following on from the Scottish example of consenting responsibility being transferred to the
organisation responsible for marine resources, the Panamanian equivalent being ARAP.
Minimising the burden of EIAs for marine energy projects is also considered essential. For
Panama this would include increased clarity on the environmental assessment requirements
for marine energy, given that it is not explicitly covered in existing legislation. Whilst existing
ANAM legislation allows for utilising environmental data from similar projects, the best case
for marine energy would be to develop an SEA to provide a basis for future projects.
Lastly, the importance of an MSP including marine energy was recognised in Panama,
especially give the wide variety of stakeholders identified. Existing marine planning measures
were deemed largely insufficient: for all sectors related to the ocean, developing a national,
unified MSP would be extremely beneficial for sustainably maximising use of marine
resources. Ideally this would come under the remit of a single organisation, but given the
already fragmented nature of marine responsibilities, it would likely be a collaborative effort
between each responsible organisation similarly to the Portuguese example.

54
5. RECOMMENDATIONS
Consideration of the marine energy sector in Panama has been presented, particularly with
respect to major barriers and how to best overcome them. Recommendations necessary to
best facilitate the establishment and advancement of a marine energy sector in Panama are
now described in the form of two scenarios: one entailing marine energy “deployment” and
the other “development”. Each of the major steps required in either scenario for Panama
specifically have been collated in Figure 28. Timescales are given to provide a relative
indication of their temporal importance rather than an exact prediction. As can be seen, most
are largely the same regardless of the approach chosen for two main reasons. Firstly, tidal
barrage technology is mature enough to allow earlier deployment. Secondly, several factors
(such as an MSP and “one-stop-shop” consenting) are beneficial in either case. Given the lack
of resource, wave and tidal current are disregarded.
Figure 28: Author’s depiction of major steps required to encourage a marine energy sector in Panama.
Auction for OTEC
Technology,
Infrastructure
and Supply
Chain
Financial
Mechanisms
Legislation
and
Regulation
Short Term <2years
Medium Term 2-5 years
Long Term >5 years
Improvement and development of port infrastructure
Auction for tidal barrage
Establish and update FiT for OTEC
“One-stop-shop” consenting
Develop, monitor and update MSP inclusive of marine energy
Conduct SEA for OTEC
Expansion of vessel infrastructure and the auxiliary marine sector
Creation of OTEC test centre
Development of OTEC technology and supply chain via financial mechanisms
Potential expansion of grid infrastructure
Investigation of OTEC resource
Tidal barrage feasibility
study Resource
Both Scenarios Development Scenario Deployment Scenario
Government commitment to policy throughout
KEY:

55
5.1. Deployment Scenario
Tidal barrage technology may be suitable for deployment in Panama with few alterations save
to legislation. The apex of the Gulf of Panama, near to Panama City, possesses the greatest
tidal range in Panama, as well as other promising factors making it ideal for a tidal lagoon or
dynamic tidal system: proximity to infrastructure, favourable bathymetry and no identified
environmental constraints. In terms of supply chain, the scale of civil works carried out for
the canal expansion project and preponderance of existing hydroelectric capacity would pre-
eminent for tidal barrage. Given this, further investigation is warranted: as identified in South
Korea, rather than overall resource assessment, a feasibility study is more appropriate.
Dependent on results, the technological maturity of tidal barrage would allow early
deployment. With the successes of Laws 44 of 2011 and 37 of 2013 for wind and solar power
respectively, a similar law mandating auctions and other financial incentives for tidal barrage
could be equally effective and would minimise administrative effort relative to introducing a
new financial incentive system. Other factors could also be implemented which would
encourage the deployment of tidal barrage will be discussed subsequently, as they are
equally beneficial for OTEC.
Further assessment of the OTEC resource is also the first deployment step. This would entail
classification of suitable sites, in terms of water temperature difference, water depth,
distance to shore and ports and grid connection. The most likely favourable resource is the
Caribbean Sea (being greater, more consistent and closer to shore) and given proximity to
the infrastructural hub located at the Caribbean entrance to the Panama Canal, the area near
to Colón would likely be one of the more suitable locations. Superficially, deployment of OTEC
technology would then entail the passive approach of waiting for the LCOE to drop to a
competitive level to enact a similar law encouraging its deployment, dependent on further
investigation of the resource. A similar law would likely be effective once the technology has
been developed (particularly important will be megawatt scale systems such as the soon-to-
be completed Lockheed Martin project in China). Other steps would also be necessary in the
interim though, which would also benefit tidal barrage. One of these more pertinent to OTEC
though is the development of an SEA: the monolithic nature of tidal barrage and so the
localised and stringent environmental assessment criteria makes one unnecessary. ANAM,
the environmental authority, is best placed to conduct this, but given the current lack of data
regarding the environmental impact of OTEC, this may require several years for relevant
information from other projects to accumulate.
Existing port infrastructure is considered adequate at either end of the Panama Canal,
however vessel infrastructure is potentially lagging. Regardless of the suitability for marine
energy deployment though, development of these two aspects would have significant

56
synergies with other marine sectors, which already contribute significantly to GDP. This would
include continued improvement of the shipping hubs at either end of the Panama Canal,
expansion of other ports across the country and encouraging the growth of the burgeoning
auxiliary marine sector. Expansion of the latter should also encourage the development of
vessel infrastructure, which in conjunction with further investigation of the potential for
fishing vessel conversion could be sufficient to meet marine energy demands. The
importance of developing infrastructure has already been recognised in Panamanian
legislation: with marine energy as an added stakeholder, it should be further prioritised.
Additionally, although grid connection was identified as sufficient near to the Canal and on
the Pacific coast, further grid expansion could be necessary, particularly if the OTEC resource
in the Caribbean is considered viable.
Given the wide range of marine-based sectors in Panama and their contribution to the
economy, it is perhaps surprising that a national MSP has not been conducted. This would
be worthwhile for all marine industries in terms of co-ordination and resource management.
Ensuring that marine energy is equitably included in the planning process is essential,
particularly with respect to inclusion of information from more detailed resource
assessments and feasibility studies. Fragmentation of responsibility for marine aspects was
identified as a potential problem, but the case of the Portuguese MSP provides evidence of
success with similar conditions. As a continuous process, it would also be important to keep
an MSP updated as an improved understanding of marine energy locally develops.
The inefficient consenting process was identified as a potential barrier to deployment, with
at least six, if not more, separate organisations requiring consents. Streamlining by
introducing a “one-stop-shop” process, namely transferring all responsibility to one
organisation and publishing guidance on the information and steps required, would be
beneficial to removing this as a barrier to deployment. Likely best suited to this is ARAP, the
marine resources authority, similarly to Marine Scotland.
Finally, committed decision making was identified as essential, particularly with respect to
financial mechanisms, but equally for any government policy. Irrespective of the policies,
investor uncertainty is detrimental to deployment or development, but can be counteracted
by long-term decision making, such as in Uruguay. In this sense, long term planning becomes
essential to ensure that decisions made are as effective and efficient as possible.
5.2. Development Scenario
This proactive scenario is largely similar to the deployment scenario. The crucial difference
would however be to encourage the development of OTEC locally, rather than waiting for the

57
LCOE to be driven down elsewhere. Whilst this would require greater up-front investment
over a timescale of decades, given the international significance of the resource, Panama
could become a global leader in the sector with considerable longer term benefits.
Encouraging technological development is best facilitated by financial mechanisms, both
technology push and market pull. As shown in Figure 26 (p. 40), immature technologies are
best suited to push mechanisms, whilst improvements are achievable, whereas pull
measures are more effective when applied to developed technologies. Therefore to
maximise OTEC development, mechanisms should initially encourage incremental
technological improvement through push measures. Over time, as the technology matures,
focus should expand to include scaling up of projects to the range of >100 MW, the size of
plant considered suitable for wide scale deployment. Dependent on the progress, market
pull measures could be introduced at a point where LCOE is deemed acceptable by the
Panamanian government. Ideally this would take the form of an FiT, which is best suited to
encouraging developing technologies. Care would have to be taken though to ensure the
fixed price was reflective of actual costs, in order to prevent overspending and creation of a
false market. Conducting an auction, as for other renewables, could also be feasible, but
would require a greater level of technological development.
Stimulating the market for OTEC technology and encouraging research and development
through pull and push mechanisms respectively should also help to create an OTEC supply
chain in Panama. Most importantly this will include developing expertise and experience of
installing, operating and maintaining OTEC systems offshore due to the lack of resource near-
shore. Certain aspects, such as pumps, could be easily outsourced, but others, such as the
cold water pipe, will require further development to determine precise requirements.
Additionally, smaller scale demonstration projects would be hindered by strict EIA regulations:
to counter this, in conjunction with developing an SEA, an adaptive management approach
would be suitable. This would allow projects at the scale of a few megawatt scale to go
forward whilst environmental data is still scarce, as is particularly the case with OTEC.
Lastly, setting up a testing facility similar to EMEC would help significantly to develop OTEC
technology. Although it would represent a significant initial investment, the example of the
return on investment for EMEC, coupled with the distribution of an OTEC resource
throughout the Caribbean and along the coast of South America as far as Brazil (Figure 2; p.
3), could make this proposal very attractive. Given a lack of similar facility elsewhere in the
world, developing a testing facility could make Panama a world leader in the technology,
similarly to wave and tidal stream in the UK.
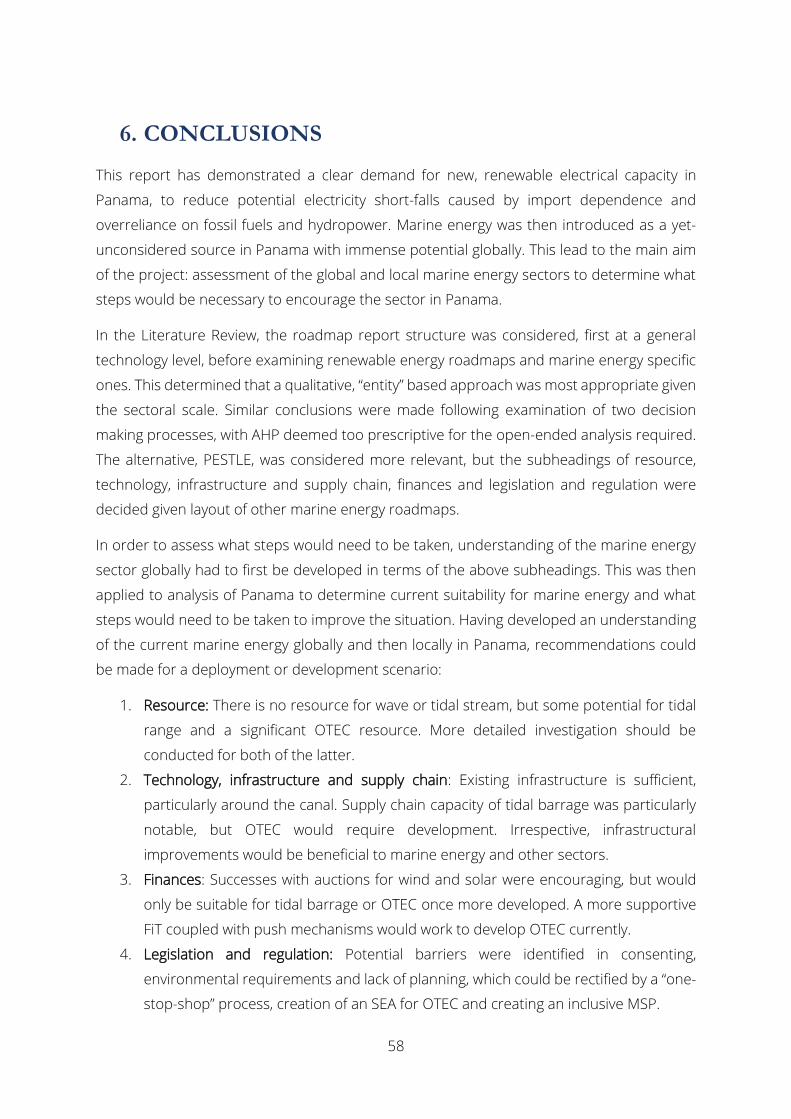
58
6. CONCLUSIONS
This report has demonstrated a clear demand for new, renewable electrical capacity in
Panama, to reduce potential electricity short-falls caused by import dependence and
overreliance on fossil fuels and hydropower. Marine energy was then introduced as a yet-
unconsidered source in Panama with immense potential globally. This lead to the main aim
of the project: assessment of the global and local marine energy sectors to determine what
steps would be necessary to encourage the sector in Panama.
In the Literature Review, the roadmap report structure was considered, first at a general
technology level, before examining renewable energy roadmaps and marine energy specific
ones. This determined that a qualitative, “entity” based approach was most appropriate given
the sectoral scale. Similar conclusions were made following examination of two decision
making processes, with AHP deemed too prescriptive for the open-ended analysis required.
The alternative, PESTLE, was considered more relevant, but the subheadings of resource,
technology, infrastructure and supply chain, finances and legislation and regulation were
decided given layout of other marine energy roadmaps.
In order to assess what steps would need to be taken, understanding of the marine energy
sector globally had to first be developed in terms of the above subheadings. This was then
applied to analysis of Panama to determine current suitability for marine energy and what
steps would need to be taken to improve the situation. Having developed an understanding
of the current marine energy globally and then locally in Panama, recommendations could
be made for a deployment or development scenario:
1. Resource: There is no resource for wave or tidal stream, but some potential for tidal
range and a significant OTEC resource. More detailed investigation should be
conducted for both of the latter.
2. Technology, infrastructure and supply chain: Existing infrastructure is sufficient,
particularly around the canal. Supply chain capacity of tidal barrage was particularly
notable, but OTEC would require development. Irrespective, infrastructural
improvements would be beneficial to marine energy and other sectors.
3. Finances: Successes with auctions for wind and solar were encouraging, but would
only be suitable for tidal barrage or OTEC once more developed. A more supportive
FiT coupled with push mechanisms would work to develop OTEC currently.
4. Legislation and regulation: Potential barriers were identified in consenting,
environmental requirements and lack of planning, which could be rectified by a “one-
stop-shop” process, creation of an SEA for OTEC and creating an inclusive MSP.

59
These steps were largely the same due either to tidal barrage technology being mature or
being measures which could be immediately implemented for the benefit of the entire sector.
The major difference lay in the level of commitment to OTEC development: in the deployment
scenario, it is assumed that improvements elsewhere will drive down the LCOE before
deployment. In the development scenario though, a more proactive approach encouraging
development via financial incentives would be required.
The most significant limitation of this project was stated in the Literature Review: that sector
level roadmaps are generally developed by groups of companies, research laboratories or
government departments to take advantage of the widest array of knowledge and experience
(Amer & Daim, 2010). With a single author of previously limited experience of the marine
energy sector, this report will undoubtedly not be as comprehensive or thorough as if the
above were the case. Similarly, available experience of industry and the renewable energy
sector in Panama would have been invaluable. Correspondence with someone employed in
industry or from a local university would have enabled more complete information gathering
than what is freely available in literature and online. Fluency in Spanish would have also been
beneficial in gathering information about Panama.
In terms of further research, this report represents the highest-level in determining the
potential of marine energy in Panama. Having demonstrated this, next would be to determine
the viability in terms of likely level of investment and resources, in addition to detailed
characterisation of resource, infrastructure and supply chain. This will allow more informed
decision making by the Panamanian government, especially relative to the previous disregard
with respect to marine energy, aiding determination if marine energy development would be
desirable locally.
60
REFERENCES
ABP Marine Environmental Research, 2012. Marine Scotland Licensing and Consents Manual,
Edinburgh: Marine Scotland.
Albert, Y. & Andreu, M., 2012. Planning and mangement of tourism in protected areas of
Panama. The case of the marine national park of Chiriqui [La planificación y gestión del
turismo en las áreas protegidas de Panamá. El caso del Parque Nacional Marino Golfo de
Chiriqui]. Bulletin of the Association of Spanish Geographers [Boletín de la Asociación de
Geógrafos Españoles], Volume 59, pp. 151-172.
Alstom, 2015. Alstom announces a major milestone for Deepwater’s Block Island Offshore Wind
Project. [Online] Available at: http://www.alstom.com/press-centre/2015/3/alstom-
announces-a-major-milestone-for-deepwaters-block-island-offshore-wind-project/
[Accessed 14th January 2016].
American Association of Port Authorities, 2014. Port Industry Statistics. [Online]
Available at: http://www.aapa-ports.org/Industry/content.cfm?ItemNumber=900
[Accessed 15th January 2016].
Amer, M. & Daim, T., 2010. Application of technology roadmaps for renewable energy
sector. Technology Forecasting and Social Change, 77(8), pp. 1355-1370.
AMP: Maritime Authority of Panama, 2008. Resolution No. 55: Approving Updates to the
National Maritime Strategy [Resolucion No. 55: Que Aprieba las Actualizaciones de la Estrategia
Maritima Nacional], Panama City: Maritime Authority of Panama [Autoridad Marítima de
Panamá].
ANAM: National Environmental Authority of Panama, 2012. Resolution AG-0130-2012
(13/4/2012), Panama City: Ministry of the Environment for Panama.
ANAM: National Environmental Authority of Panama, 2015. ANAM taught courses on Strategic
Environmental Assessment (SEA) for making sustainable choices [ANAM dictó cursos sobre
Evaluación Ambiental Estratégica (EAE) para la toma decisiones sostenibles]. [Online]
Available at: http://www.miambiente.gob.pa/index.php/site-map/933-anam-dicto-cursos-
sobre-evaluacion-ambiental-estrategica-eae-para-la-toma-decisiones-sostenibles
[Accessed 12th February 2016].
ANAM: National Environmental Authority of Panama, 2016. Protected Areas [Áreas
Protegidas]. [Online] Available at: http://www.miambiente.gob.pa/index.php/2012-12-10-12-
13-57/mapas-interectivos/mapas-interactivos [Accessed 18 February 2016].

61
Anywhere Panama, 2015. Environmental Issues in Panama. [Online] Available at:
http://www.anywherepanama.com/travel-guide/environmental-issues [Accessed 3rd March
2016].
Arden & Price Consulting, 2008. Progress Report No. 2: Coastal Zone Management Plan of the
Bocas del Toro Province [Informe de Avances No. 2: Plan de Manejo Costero de la Provincia de
Bocas del Toro], Panama: Multiphase Sustainable Development of Bocas del Toro [Multifase
de Desarrollo Sostenible de Bocas del Toro].
Ares, E., 2012. The Renewables Obligation, London: House of Commons.
Badcock-Broe, A. et al., 2014. Wave and tidal energy market deployment strategy for Europe,
Lisbon: SI Ocean.
Bae, Y. H., Kim, K. O. & Choi, B. H., 2010. Lake Sihwa tidal power plant project. Ocean
Engineering, Volume 37, pp. 454-463.
Bard, J. & Thalemann, F., 2011. Offshore Infrastructure: Ports and Vessels, Report from project
ORECCA WorkPackage 4.1 Infrastructure & Innovations, s.l.: ORECCA.
Baxter, J. et al., 2011. Scotland's Marine Atlas: Information for the national marine plan, 2011:
Marine Scotland.
BBC News, 2014. Why so many shipowners find Panama's flag convenient. [Online]
Available at: http://www.bbc.co.uk/news/world-latin-america-28558480 [Accessed 17
January 2016].
Bedard, R. et al., 2010. Overview of Ocean Renewable Energy Technologies. Oceanography,
23(2), pp. 22-31.
Bernshtein, L., 1972. Kislaya Guba Experimental Tidal Power Plant and Problem of the Use of
Tidal Energy. Halifax, Springer US, pp. 215-238.
Black & Veatch, 2005. Phase II UK tidal stream energy resource assessment, s.l.: Carbon Trust.
Black & Veatch, 2011. UK tidal current resources and economics, London: Carbon Trust.
Bloomberg New Energy Finance, 2012. Climate Scope 2012: Assessing the Climate for Climate
Investing in Latin America and the Caribbean. London: Bloomberg Finance.
Bray, O. & Garcia, M., 1997. Technology roadmapping: the integration of strategic and
technology planning for competitiveness. Portland, OR, PICMET, pp. 25-28.
Brunelli, M., 2015. Introduction to the analytical hierarchy process. Aalto: Springer.

62
Cabré, M. et al., 2015. Renewable Energy in Latin America 2015: An Overview of Policies, Abu
Dhabi: International Renewable Energy Agency.
Calado, H. et al., 2010. Marine spatial planning: Lessons learned from the Portuguese
debate. Marine Policy, 34(6), pp. 1341-1349.
Canal de Panamá, 2014. Frequently Asked Questions: Panama Canal Expansion Project.
[Online] Available at: http://micanaldepanama.com/expansion/faq/ [Accessed 13th January
2016].
Carvalho, M., Fleury, A. & Lopes, A., 2012. An overview of the literature on technology
roadmapping (TRM): Contributions and trends. Technological Forecasting and Social Change,
Volume 80, pp. 1418-1437.
Central Intelligence Agency, 2013. Coastline. [Online] Available at:
https://www.cia.gov/library/publications/the-world-factbook/fields/2060.html [Accessed
17th November 2015].
Clark, P., 2015. Top UN scientist attacks UK cuts to renewable energy subsidy. [Online]
Available at: http://www.ft.com/cms/s/0/96ec7b9c-7648-11e5-933d-
efcdc3c11c89.html#axzz3xoLWKstE [Accessed 20 January 2016].
Clark, R., 2007. Elements of Tidal-Electric Engineering. Hoboken(New Jersey): John Wiley and
Sons.
Clean Development Mechanism, 2013. Project 7839 : Penonome Wind Farm, Geneva: Clean
Development Mechanism.
Coady, D., Parry, I., Sears, L. & Shang, B., 2015. IMF Working Paper: How Large Are Global
Energy Subsidies, Washington DC: International Monetary Fund.
Cohen, S. & Aued, F., 2012. Practical Law Multi-Jurisdictional Guide 2011/12: Environment
Panama, London: Practical Law Company.
Comfort, M. & Vega, L., 2011. Environmental Assessment of Ocean Thermal Energy Conversion
in Hawaii, Honolulu: Hawaii National Marine Renewable Energy Centre.
Conley, D. et al., 2013. Deliverable 3.5 – Work Package 3 Final Report: Report on the analysis of
the Environmental Impact Assessment Experience for Wave Energy, Brussels: Sowfia.
Cornett, A., 2008. A global wave energy resource assessment. Sea Technology, 50(4), pp. 59-
68.

63
Court, S., 2008. The mapping of materials supply chains in the UK's power generation sector,
Rotherham: Materials UK.
Cristobal, J., 2011. Multi-criteria decision-making in the selection of a renewable energy
project in spain: The Vikor method. Renewable Energy, Volume 36, pp. 498-502.
Crown Estate, 2012. UK wave and tidal key resource areas project: summary report, London:
Crown Estate.
Crown Estate, 2013. UK wave and tidal key resource areas project: technical methodology
report, London: Crown Estate.
Department for Transport, 2015. World fleet registered vessels (FLE05). [Online]
Available at: https://www.gov.uk/government/statistical-data-sets/fle05-world-fleet-
registered-vessels [Accessed 17 January 2016].
Department of Energy and Climate Change, 2010. Severn Tidal Power: Feasibility Study and
Summary Report, London: Department of Energy and Climate Change.
Department of Energy and Climate Change, 2011. Planning our electric future: a White Paper
for secure, affordable and low-carbon electricity, Norwich: The Stationary Office.
Department of Energy and Climate Change, 2014. Implementing Electricity Market Reform,
London: Department of Energy and Climate Change.
Department of Environmental Policy and Management [Unidad de política y gestión
ambiental], 2007. Guidelines for the application of the Strategic Environmental Assessments
[Lineamientos para la aplicación de la Evaluación Ambiental Estratégica], San José, Costa Rica:
UCIN.
Di Bella, G. et al., 2015. Energy Subsidies in Latin America and the Caribbean: Stocktaking and
Policy Challenges, Washington DC: International Monetary Fund.
Directorate-General of Maritime Affairs and Fisheries, 2012. Initiative on marine/ocean energy
as a follow-up to the Blue Growth Communication, Brussels: European Commission.
Dolezal, A., Majano, A., Ochs, A. & Palencia, R., 2013. The Way Forward for Renewable Energy
in Central America, Washington D.C.: Worldwatch Institute.
Drew, B., Plummer, A. & Sahinkaya, M., 2009. A review of wave energy converter technology.
Proceeedings of the Institution of Mechanical Engineers: Journal of Power and Energy, Volume
223, pp. 887-902.

64
Edwards, S. & Holroyd, S., 2010. Strategic Environmental Assessment (SEA) of the Offshore
Renewable Energy Development Plan (OREDP) in the Republic of Ireland , Dublin: Sustainable
Energy Authority of Ireland.
EEA: European Environment Agency, 2014. Energy support measures and their impact on
innovation in the renewable energy sector in Europe, Brussels: European Environment Agency.
EMEC: European Marine Energy Centre, 2011. Tidal Devices. [Online]
Available at: http://www.emec.org.uk/marine-energy/tidal-devices/ [Accessed 23rd October
2015].
Energy Information Agency, 2015. International Energy Statistics. [Online]
Available at: http://www.eia.gov/beta/international/ [Accessed 28th October 2015].
Errázuriz and Asociados Ingenieros, 2012. Marine energy development: taking steps for
developing the Chilean resource, Santiago: British Embassy in Chile.
Etemedi, A., Emdadi, A., AsefAsfshar, O. & Emami, Y., 2011. Electricity Generation by the
Ocean Thermal Energy. Energy Procedia, Volume 12, pp. 936-943.
ETESA: Empresa de Transmisión Eléctrica, S.A., 2015. Concurrecny Acts for the Purchase of
Energy and/or Power [Actos de Concurrencia para la compra de Energía y/o Potencia]. [Online]
Available at: http://www.etesa.com.pa/compras.php [Accessed 2 February 2016].
ETESA: Empresa de Transmisión Eléctrica, S.A, 2014. Details of Act [Detalles del Acto] LPI -
ETESA 03-14. [Online] Available at: http://www.etesa.com.pa/compras_ver.php?id=27
[Accessed 24th February 2016].
ETESA: Empresa de Transmisión Eléctrica, S.A, 2014. Plan de Expansión del Sistema
Interconectado Nacional 2014 – 2028, Panama City: Empresa de Transmisión Eléctrica, S.A.
European Commission, 1996. Wave energy project results: the exploitation of tidal and marine
currents, Luxembourg: European Commission.
European Commission, 2012. Questions and Answers on the outcome of the first call for
proposals under the NER300 programme. [Online] Available at: http://europa.eu/rapid/press-
release_MEMO-12-999_en.htm [Accessed 22nd January 2016].
European Commission, 2013. Delivering the internal electricity market and making the most of
public intervention, Brussels: European Commission.
65
European Commission, 2014. Questions and Answers on the outcome of the second call for
proposals under the NER 300 programme. [Online] Available at: http://europa.eu/rapid/press-
release_MEMO-14-465_en.htm [Accessed 22nd January 2016].
European Commission, 2016. NER 300 programme. [Online] Available at:
http://ec.europa.eu/clima/policies/lowcarbon/ner300/index_en.htm [Accessed 22 January
2016].
European Renewable Energy Council, 2002. Renewable energy technology roadmap: up to
2020, Brussels: European Renewable Energy Council.
Faber Maunsell and Metoc, 2007. Scottish Marine Renewables Sea SEA; Environmental Report
Section A: Introduction, Background and Methdo, Edinburgh: Scottish Executive.
Falcão, A., 2010. Wave energy utilization: A review of the technologies. Renewable and
Sustainable Energy Reviews, Volume 14, pp. 899-915.
Falnes, J., 2007. A review of wave-energy extraction. Marine Structures, Volume 20, pp. 185-
201.
Food and Agriculture Organization of the United Nations, 2007. Country Profiles for Fishery
and Aquaculture: Republic of Panama [Perfiles sobre la pesca y la acuicultura por países: la
República de Panamá]. [Online] Available at: http://www.fao.org/fishery/facp/PAN/es
[Accessed 17 January 2016].
Forum for Renewable Energy Development in Scotland, 2009. Marine Energy Group (MEG):
Marine Energy Roadmap, Edinburgh: The Scottish Government.
Fugro OCEANOR, 2012. Private Commnunication. s.l.:FUGRO.
Garrad Hassan, 2009. Preliminary site selection- Chilean marine energy resources, Washington:
Inter-American Development Bank.
Generadora del Istmo, S.A., 2014. GENISA: Generadora del Istmo, S.A.. [Online]
Available at: http://www.genisa.com.pa/en/ [Accessed 15th January 2016].
Gill, A., 2005. Offshore renewable energy: ecological implications of generating electricity in
the coastal zone. Journal of Applied Ecology, Volume 42, pp. 605-615.
Gilliland, P. & Laffoley, D., 2008. Key elements and steps in the process of developing
ecosystem-based marine spatial planning. Marine Policy, September, 32(5), pp. 787-796.
Gómez, J., 2015. Central America unites energy agenda [Agenda energética une a
Centroamérica]. [Online]

66
Available at: http://www.capital.com.pa/agenda-energetica-une-a-centroamerica/
[Accessed 28th October 2015].
Govers, C., 1996. What and how about quality function development (QFD). International
Journal of Production Economics, Volume 46-47, pp. 575-585.
Groba, F. & Breitschopf, B., 2013. Impact of renewable energy policy on innovation- a literature
review, Berlin: Deutsches Institut für Wirtschaftsforschung .
Grossman, D. S., 2004. Putting technology on the road. Research-Technology Management,
47(2), pp. 41-46.
Gunwoo, K. et al., 2012. An Overview of ocean renewable energy resources in Korea.
Renewable and Sustainable Energy Reviews, 16(4), pp. 2278-2288.
Harris, A., 2013. Taming the tides. Engineering and Technology, 7(12), pp. 38-41.
Harris, M., 2015. Panama's 32-MW Bonyic hydropower plant begins commercial operations.
[Online] Available at: http://www.hydroworld.com/articles/2015/02/panama-s-32-mw-
bonyic-hydropower-plant-begins-commercial-operations.html [Accessed 15 January 2016].
Hartwig, K., 2006. Impact of Nanotechnology in Health and Medical Systems, Berlin: VDI/ VDE-
IT.
Havas, A., 2012. National innovation system and national PESTLE and SWOT analysis,
Budapest: South East Europe.
Hsu, C. & Sandford, B., 2007. The Delphi technique: making sense of consensus. Practical
Assessment, Research and Evaluation, August, 12(10), pp. 1-7.
Ibañez, I., 2014. Analysis of Auxillary Maritime Industries in Panama [Análisis de las Industrias
Marítimas Auxiliares en Panamá], Barcelona: Nautical Faculty of Barcelona [Facultat de
Nàutica de Barcelona].
Inside Panama Real Estate, 2008. Property Laws in Panama. [Online]
Available at: http://panama.angloinfo.com/housing/buying-property/property-laws/
[Accessed 12th March 2016].
Intergovernmental Oceanographic Commission, 2015. Marine Spatial Planning (MSP).
[Online] Available at: http://www.unesco-ioc-marinesp.be/marine_spatial_planning_msp
[Accessed 26 January 2016].

67
International Energy Agency, 2015. Medium-Term Renewable Energy Market Report 2015,
Paris: Organisation for Economic Co-operation and Development/ International Energy
Agency.
Ishizaka, A. & Labib, A., 2009. Analytic hierarcy process and Expert Choice: benefits and
limitations. Operational Research Insight, 22(4), pp. 201-220.
Jha, A., 2008. First tidal power turbine gets plugged in. [Online] Available at:
http://www.theguardian.com/environment/2008/jul/17/waveandtidalpower.renewableenerg
y [Accessed 27 February 2016].
Kajikawa, Y. et al., 2008. Structure of knowledge in the science and technology roadmaps.
Technological Forecasting and Social Change, Volume 75, pp. 1-11.
Kappel, T., 2001. Perspectives on roadmaps: how organisations talk about the future. The
Journal of Product Innovation Management, Volume 18, pp. 39-50.
Kaya, T. & Kahraman, 2010. Multicriteria renewable energy planning using an integrated
fuzzy VIKOR & AHP methodology: The case of Istanbul. Energy, Volume 35, pp. 2517-2517.
Kempener, R. & Neumann, F., 2014a. Tidal Energy Technology Brief, Abu Dhabi: International
Renewable Energy Agency.
Kempener, R. & Neumann, F., 2014b. Ocean Thermal Energy Conversion: Technology Brief, Abu
Dhabi: International Renewable Energy Agency.
Khan, J. & Bhuyan, G., 2009. Ocean energy: global technology development status, Lisbon:
Ocean Energy Systems.
Khan, M., Bhuyan, G., Iqbal, M. & Quaicoe, J., 2009. Hydrokinetic energy conversion systems
and assessment of horizontal and vertical axis turbines for river and tidal applications: A
technology status review. Applied Energy, Volume 86, pp. 1823-1833.
Kirby, R. & Retière, C., 2009. Comparing environmental effects of Rance and Severn
barrages. Maritime Engineering, Volume 162, pp. 11-26.
Kolios, A. & Read, G., 2013. A Political, Economic, Social, Technology, Legal and
Environmental (PESTLE) Approach for Risk Identification of the Tidal Industry in the United
Kingdom. Energies, September, Volume 6, pp. 5023-5045.
Kolios, A., Read, G. & Ioannou, A., 2013. Application of multi-criteria decision-making to risk
prioritisation in tidal energy developments. International Journal of Sustainable Energy,
December, 35(1), pp. 59-74.
68
Kriel, L., 2013. Drought-stricken Panama orders power rationing, closes schools. [Online]
Available at: http://www.reuters.com/article/2013/05/08/panama-electricity-
idUSL2N0DP04H20130508 [Accessed 28th October 2015].
Leary, D. & Esteban, M., 2009. Climate Change and Renewable Energy from the Ocean and
Tides: Calming the Sea of Regulatory Uncertainty. The International Journal of Marine and
Coastal Law, Volume 24, pp. 617-651.
Lee, K.-S., 2006. Tidal and Tidal Current Power Study in Korea, Seoul: KORDI.
Lee, S. & Park, Y., 2005. Customization of technology roadmaps according to road
mappingpurposes: Overall process and detailed modules. Technological Forecasting and
Social Change, Volume 72, pp. 567-583.
Lesbirel, S., 2004. Diversification and energy security risks: the Japanese case. Japanese
Journal of Political Science, 5(1), pp. 1-22.
Lewis, A. & Estefen, S., 2011. Ocean Energy. In: A. Abdulla, J. Moreno & Y. You, eds. IPCC
Special Report on Renewable Energy Sources and Climate Change Mitigation. Cambridge:
Cambridge University Press, pp. 497-533.
Lewis, C. & Behar, S., 2015. The Panamanian Energy Market. [Online]
Available at: http://www.iflr1000.com/NewsAndAnalysis/The-Panamanian-energy-
market/Index/3287 [Accessed 2 February 2016].
Lewis, M., Neill, S., Robins, P. & Hashemi, M., 2015. Resource assessment for future
generations of tidal-stream energy arrays. Energy, Volume 83, pp. 403-415.
Li, X., 2005. Diversification and localization of energy systems for sustainable development
and energy security. Energy Policy, 33(17), pp. 2237-2243.
Lockheed Martin, 2012. Ocean Thermal Extractable Energy Visualisation, s.l.: Lockheed Martin.
Lucas, H., Ferroukhi, R. & Hawila, D., 2013. Renewable Energy Auctions in Developing Countries,
Abu Dhabi: International Renewable Energy Agency.
MacDonald, S., 2012. Equitable Testing and Evaluation of Marine Energy Extraction Devices in
terms of Performance, Cost and Environmental Impact. [Online] Available at:
https://www.wiki.ed.ac.uk/display/EquiMarwiki/EquiMar;jsessionid=E74D286B9C35837A252
BD33B4836D848 [Accessed 22 January 2016].
Magagna, D. & Uihlein, A., 2015. Ocean energy development in Europe: Current status and
future perspectives. International Journal of Marine Energy, Volume 11, pp. 84-104.

69
Makai Ocean Engineering, 2015. Makai Connects World’s Largest Ocean Thermal Plant to U.S.
Grid. [Online] Available at: http://www.makai.com/makai-
news/2015_08_29_makai_connects_otec/ [Accessed 23rd October 2015].
Mallon, K., 2006a. Ten Features of Successful Renewable Markets. In: Renewable Energy
Policy and Politics. London: Earthscan, pp. 35-84.
Mallon, K., 2006b. Myths, Pitfalls and Oversights. In: Renewable Energy Policy and Politics.
London: Earthscan, pp. 5-34.
Marine Laboratory, 2010. Marine Renewables Licensing in Scotland, Edinburgh: Marine
Scotland.
Marine Scotland, 2011. Pentland Firth and Orkney Waters Marine Spatial Plan Framework, s.l.:
Scottish Government.
Marine Scotland, 2016. National Maritime Plan Online. [Online] Available at:
http://www.gov.scot/Topics/marine/seamanagement/national [Accessed 26 January 2016].
Masutani, S. & Takahashi, P., 1999. Ocean Thermal Energy Conversion (OTEC), s.l.: Wiley
Encyclopedia of Electrical and Electronics Engineering.
MEF: Ministry of the Economy and Finances, 2009b. Executive Decree 123 [Decreto Ejecutivo
123] (14/8/2009), Panama City: Ministry of the Economy and Finances.
Mejia, L. et al., 2011. Design of the Dams of the Panama Canal Expansion. San Diego, CA, U.S.
Society on Dams, pp. 117-129.
Mofor, L., Goldsmith, J. & Jones, F., 2014. Ocean energy: technology readiness, patents,
deployment status and outlook, Abu Dhabi: International Renewable Energy Agency.
Monárdez, P., Acuña, H. & Scott, D., 2008. Evaluation of the potential of wave energy in Chile.
Estoril, American Society of Mechanical Engineers.
Mørk, G., Barstow, S., Kabuth, A. & Pontes, T., 2010. Assessing the global wave energy potential.
Shanghai, ASME.
Muñoz Arjona, E. & Olivares, C., 2012. Deliverable D2.4: Interim report on barriers, accelerators
and lessons learned, Brussels: SOWFIA.
Musial, W., 2008. Status of Wave and Tidal Power Technologies for the United States, Golden,
Colorado: National Renewable Energy Laboratory.
NASA, 2006. Solar System Exploration, Washington: NASA.

70
National Assembly of Panama, 1997. Law 6 [Ley 6] (3/2/1997), Panama City: National
Assembly of Panama.
National Assembly of Panama, 1998a. Law 7 (10/2/1998), Panama City: National Assembly of
Panama.
National Assembly of Panama, 1998b. Law No. 41 (1/7/1998), Panama City: National
Assembly of Panama.
National Assembly of Panama, 2004. Law No. 45 (4/8/2004), Panama City: National Assembly
of Panama.
National Assembly of Panama, 2006. Law No. 44 (23/11/2006), Panama City: National
Assembly of Panama.
National Assembly of Panama, 2007. Executive Decree 36 [Decreto Ejecutivo 36] (1/3/2007),
Panama City: National Assembly of Panama.
National Assembly of Panama, 2008. Law 56 (6/8/2008), Panama City: National Assembly of
Panama.
National Assembly of Panama, 2009a. Law 80 (31/12/2009), Panama City: National Assembly
of Panama.
National Assembly of Panama, 2011. Law 44 (25/4/2011), Panama City: National Assembly of
Panama.
National Assembly of Panama, 2013a. Law No. 18 (26/3/2013), Panama City: National
Assembly of Panama.
National Assembly of Panama, 2013b. Law No. 37 (10/7/2013), Panama City: National
Assembly of Panama.
National Assembly of Panama, 2015. Law 6 (3/2/1997), Panama City: National Assembly of
Panama.
National Centers for Environmental Information, 2016. Bathymetry. [Online] Available at:
http://maps.ngdc.noaa.gov/viewers/bathymetry/ [Accessed 28 March 2016].
National Competitiveness Centre [Centro Nacional de Competitividad], 2015. Challenges of
the Electricity Sector in Panama [Desafíos del sector eléctrico en Panamá], Panama City:
Natoinal Competitiveness Centre .

71
National Energy Secretariat , 2009. National Energy Plan [Plan Nacional de Energía], Panama
City: Republic of Panama Ministry of the Presidency [República de Panamá Ministerio de la
Presidencia].
National Energy Secretariat , 2016. Plan Energético Nacional - Informes. [Online]
Available at: http://www.energia.gob.pa/Plan_Energetico_Nacional
National Institute of Statistics and Census [Instituto Nacional de Estadística y Censo], 2010.
Vital Statistics- Summary [Estadísticas Vitales - Resumen], Panama City: National Institute of
Statistics and Census.
Natural Resources Canada, 2009. Wind Technology Roadmap, Toronto: Pricewaterhouse
Coopers LLP.
News Letter, 2014. Offshore wind farms blow new energy into Kilkeel fishing fleet’s sails.
[Online] Available at: http://www.newsletter.co.uk/news/ni-business-news/offshore-wind-
farms-blow-new-energy-into-kilkeel-fishing-fleet-s-sails-1-5806543
Nihous, G., 2010. Mapping available Ocean Thermal Energy Conversion resources around
the main Hawaiian Islands with state-of-the-art tools. Journal of Renewable and Sustainable
Energy, Volume 2, pp. 1-9.
Nogee, A., Clemmer, B., Paulos, B. & Haddad, B., 1999. Powerful Solutions: Seven Ways to
Switch America to Renewable Electricity. Cambridge(Massachusetts): Union of Concerned
Scientists.
OES: Ocean Energy Systems, 2011. An International Vision for Ocean Energy, Lisbon: Ocean
Energy Systems.
OES: Ocean Energy Systems, 2014a. GIS Map Page. [Online] Available at: http://www.ocean-
energy-systems.org/ocean-energy-in-the-world/gis-map/ [Accessed 2nd November 2015].
OES: Ocean Energy Systems, 2014b. 2014 Annual Report, Lisbon: The Executive Committee
of Ocean Energy Systems.
OES: Ocean Energy Systems, 2015. International Levelised Cost Of Energy for Ocean Energy
Technologies, Lisbon: Ocean Energy Systems.
ORECCA: Off-shore Renewable Energy Conversion platforms – Coordination Action, 2011.
European Offshore Renewable Energy Roadmap, s.l.: ORECCA Coordinated Action Project.
Ozturk, I., 2010. A literature survey on energy-growth nexus. Energy Policy, 38(1), pp. 340-
349.

72
Patlitzianas, K. & Karagounis, K., 2011. The progress of RES environment in the most recent
member states of the EU. Renewable Energy, 36(2), pp. 429-436.
Payne, J., 2010. A survey of the electricity consumption-growth literature. Applied Energy,
87(3), pp. 723-731.
Pei, R., 1980. Resource estimate for ocean thermal energy converison (OTEC) in the Gulf of
Mexico, Santa Monica: Rand.
Phaal, R., 2011. Public-Domain Roadmaps, Cambridge: University of Cambridge.
Phaal, R., Farrukh, C. & Probert, D., 2004. Technology roadmapping—a planning framework
for evolution and revolution. Technological Forecasting & Social Change, 71(1-2), pp. 5-26.
Pisys Marine, 2015. Pisys Marine. [Online] Available at:
http://www.pisysmarine.com/index.html
Power Technology, 2013. Hainan Ocean Thermal Energy Conversion (OTEC) Power Plant, China.
[Online] Available at: http://www.power-technology.com/projects/hainan-ocean-thermal-
energy-conversion-otec-power-plant/ [Accessed 16th February 2016].
Pöyry, 2014. Levelised Costs of Power from Tidal Lagoons, London: Pöyry Management
Consulting.
Rajagopalan, K. & Nihous, G., 2013. Estimates of global Ocean Thermal Energy Conversion
(OTEC) resources using an ocean general circulation model. Renewable Energy, Volume 50,
pp. 532-540.
RE News, 2016. Atlantis to decommission SeaGen. [Online] Available at:
http://renews.biz/101295/atlantis-to-decommission-seagen/ [Accessed 11th March 2016].
Renewable UK, 2013. Wave and tidal energy in the UK: conquering challenges, generating
growth, London: Renewable UK.
Rinne, M., 2004. Technology roadmaps: Infrastructure for innovation. Technological
Forecasting and Social Change, 71(1-2), pp. 67-80.
Rourke, F., Boyle, F. & Reynolds, 2010. Marine current energy devices: Current status and
possible future applications in Ireland. Renewable and Sustainable Energy Reviews, 14(3), pp.
1026-1036.
Saaty, T., 2008. Decision making with the analytic hierarchy process. International Journal of
Services Sciences, Volume 1, pp. 83-98.

73
Santos, C., Almodovar, M., Andrade, F. & Orbach, M., 2013. Challenges in developing the first
Portuguese marine spatial plan. Aveiro, Proceedings of the TWAM2013 International
Conference & Workshops, pp. 1-5.
Schwab, K. et al., 2015. The Travel & Tourism Competitiveness Report 2015, Geneva: World
Economic Forum.
Sea Around Us, 2015. Tools & Data: EEZ Map. [Online] Available at:
http://www.seaaroundus.org/data/#/eez [Accessed 15th November 2015].
Sea Energy, 2014. Fishing Vessels Conversion Study, Glasgow: Scottish Enterprise.
Sea Rates, 2010. Sea Ports of Panama. [Online] Available at:
https://www.searates.com/maritime/panama.html [Accessed 17 January 2016].
SI Ocean, 2013. Ocean Energy: Cost of Energy and Cost Reduction Opportunities, s.l.: s.n.
Simas, T. et al., 2009. Existing legislation, perspectives and evolution of other similar
technologies, Edinburgh: EquiMar.
Simas, T. et al., 2013. Review of consenting processes for ocean energy in different EU Member
States (including feedback analysis from Workshop D), Plymouth: SOWFIA.
Sovacool, B. & Mukherjee, I., 2011. Conceptualizing and measuring energy security: A
synthesized approach. Energy, 36(8), pp. 5343-5355.
Spalding, A., Suman, D. & Mellado, M., 2015. Navigating the evolution of marine policy in
Panama: Current policies and community responses in the Pearl Islands and Bocas del Toro
Archipelagos of Panama. Marine Policy, Volume 62, pp. 161-168.
Sparrow, B. & Whittaker, C., 2005. Technology roadmap and resource allocation methodology
for the Canadian Institute for Fuel Cell Innovation, Burnaby, BC: Simon Fraser University.
Suman, D., 2002. Panama revisited: evolution of coastal management policy. Ocean &
Coastal Management, 45(2-3), pp. 91-120.
Suman, D., 2007. Development of an integrated coastal management plan for the Gulf of
San Miguel and Darien Province, Panama: Lessons from the experience. Ocean & Coastal
Management, 50(8), pp. 634-660.
Sustainable Energy Authority of Ireland, 2010. Ocean Energy Roadmap, Ireland: Sustainable
Energy Authority of Ireland.

74
Swisher, R. & Porter, K., 2006. Renewable Policy Lessons from the US: The Need for
Consistent and Stable Policies. In: Renewable Energy Policy and Politics. London: Earthscan,
pp. 185-198.
Team FME, 2013. PESTLE Analysis: Strategy Skills. s.l.:Free Management eBooks.
The Coastal Response Research Center, 2009. Technical Readiness of Ocean Thermal Energy
Conversion (OTEC), Durham, New Hampshire: University of New Hampshire.
The Power Group, 2013. Downloads. [Online] Available at:
http://www.powerdtp.nl/Downloads/downloads_getfilem.aspx?id=219537 [Accessed 23rd
October 2015].
The Scottish Government, 2016. Pentland Firth & Orkney Waters. [Online] Available at:
http://www.gov.scot/Topics/marine/seamanagement/regional/activity/pentlandorkney
Thresher, R. et al., 2012. Chapter 9: Ocean Energy Technologies. In: Renewable Electricity
Futures Study. Golden(Colorado): National Renewable Energy Laboratory, pp. 9.1-9.36.
Tousif, S. & Taslim, S., 2011. Tidal power: an effective method of generating power.
International Journal of Scientific & Engineering Research, May, Volume 2, pp. 1-5.
UK Hydrographic Office, 2014. Admiralty Total Tide (6.1.5.16) [Computer Program]. Tauton:
Admiralty.
UN Comtrade, 2014. UN Comtrade Database. [Online] Available at:
http://comtrade.un.org/data/ [Accessed 13 January 2015].
US Department of Energy, 2013. Marine and Hydrokinetic Technology Database. [Online]
Available at: http://en.openei.org/wiki/Marine_and_Hydrokinetic_Technology_Database
[Accessed 22nd October 2015].
Vargas, E., 2007. Coastal and Marine Tourism in Costa Rica, Panama and Nicaragua,
Washington DC: Center on Ecotourism and Sustainable Development.
Vega, L., 2010. Economics of Ocean Thermal Energy Conversion (OTEC): An Update. Houston,
Offshore Technology Conference, pp. 1-18.
Vega, L., 2014. Wave energy conversion and thermal energy conversion potential in developing
member countries, Manila: Asian Development Bank.
Vivero, J., 2011. Report on spatial planning systems in Mediterranean countries: Spain, Split:
Priority Actions Programme/Regional Activity Centre.

75
Watts, J., 2015. Uruguay makes dramatic shift to nearly 95% electricity from clean energy.
[Online] Available at: http://www.theguardian.com/environment/2015/dec/03/uruguay-
makes-dramatic-shift-to-nearly-95-clean-energy [Accessed 20 January 2016].
WavEC, 2015. Consenting process for ocean energy on OES member countries, Lisbon: Ocean
Energy Systems.
Wells, N. & McConnell, M., 2011. Assessment of the Irish Ports & Shipping Requirements for the
Marine Renewable Energy Industry, Dublin: Sustainable Energy Authority of Ireland.
Willard, C. & McClees, C., 1987. Motorola’s technology roadmap process. Research
Management, Volume 30, pp. 13-19.
Winebrake, J., 2003. Alternate Energy: Assessment & Implementation Reference Book. Lilburn,
GA: Fairmont Press.
Woolf, D., 2011. Environment, regulation and legislation, s.l.: ORECCA.
World at Work, 2009. Public Policy Tool Kit: The Difference Between Legislation and Regulation,
Scottsdale, AZ: World at Work.
World Bank, 2015. Panama: Overview. [Online] Available at:
http://www.worldbank.org/en/country/panama/overview#1 [Accessed 2 February 2016].
World Bank, 2015. World Development Indicators. [Online] Available at:
http://databank.worldbank.org/data/reports.aspx?source=world-development-
indicators&preview=on [Accessed 28th October 2015].
World Energy Council, 2013a. World Energy Resources. London: World Energy Council.
World Energy Council, 2013b. World Energy Perspective, London: World Energy Council.
World Steel Association, 2015. Steel Statistical Yearbook, Brussels: World Steel Association.
Wright, G., 2014. Rights and Ownership in Marine Spaces, Canberra: Institute for Sustainable
Development and International Relations.
Xia, J., Falconer, R., Lin, B. & Tan, G., 2012. Estimation of annual energy output from a tidal
barrage using two different methods. Applied Energy, Volume 93, pp. 327-336.
Yemm, R., Pizer, D., Retzler, C. & Henderson, R., 2012. Pelamis: experience from concept to
connection. Philosophical Transactions of the Royal Society A, Volume 370, pp. 365-380.
Zalengera, C. et al., 2014. Overview of the Malawi energy situation and A PESTLE analysis for
sustainable development of renewable energy. Renewable and Sustainable Energy Reviews,
Volume 38, pp. 335-347.