Embed Size (px)
Citation preview

Financial Institutions: Banks and Trusts April 15, 2016
Rating Report
Deutsche Bank AG
Ratings
*Under Review with Negative Implications See page 12 for full list of ratings
Rating Considerations
Franchise Strength: Global franchise, supported by its top-tier investment banking and capital markets franchises that are well-entrenched across diverse
businesses, most notably in EMEA and APAC, solid retail and corporate banking capabilities, and a sizable wealth and asset management
franchise.
Earnings Power: Earnings
are below the franchise
potential, with profitability
challenged by legacy conduct
costs, restructuring charges,
and the wind-down/disposal of
legacy portfolios.
Risk Profile: Generally conservative credit
risk and market risk
management. Operational
risk, however, continues to be
a key challenge for the Bank.
Funding and Liquidity: Solid funding position,
underpinned by substantial
deposit base. Sound liquidity
profile.
Capitalization: Capital ratios have fallen to the low
end of the global peer range.
Rating Drivers
Factors with Positive Rating Implications Factors with Negative Rating Implications Given that the rating is currently Under Review with
Negative Implications, positive rating action is
unlikely at this time.
Signs of outsized revenue deterioration, combined with
capital erosion, would likely result in a downgrade.
Any notable pressure on the Bank’s funding and liquidity
profile, evidenced by deposit outflows, a notable reduction
in liquidity reserves or severely challenged funding markets,
could also contribute to a downgrade.
Financial Information
EUR Millions 31/12/2015 31/12/2014 31/12/2013 31/12/2012 31/12/2011
Total Assets 1,629,130 1,708,703 1,611,400 2,022,275 2,164,103
Equity 67,624 73,223 54,966 54,240 54,660
Pre-provision operating income (IBPT) 766 4,582 4,766 4,610 8,515
Net Income -6,772 1,663 666 263 4,132
Net Interest Income / Risk Weighted Assets (%) 4.00% 3.60% 4.94% 4.79% 4.58%
Risk-Weighted Earning Capacity (%) 0.19% 1.20% 1.51% 1.26% 2.53%
Post-provision Risk-Weighted Earning Capacity (%) -0.07% 0.89% 0.83% 0.75% 1.95%
Efficiency Ratio (%) 97.70% 85.55% 84.88% 86.23% 75.07%
Impaired Loans % Gross Loans 1.81% 2.21% 2.57% 2.34% 2.18%
Common Equity Tier 1 (Fully Loaded for 2014 & 2015) 11.12% 11.70% 12.83% 11.38% 9.52%
Issuer Debt Rating Rating Action Trend Deutsche Bank AG Senior Unsecured Debt & Deposits A* UR-Neg. --
Deutsche Bank AG Short-Term Debt & Deposits R-1 (low) Confirmed Stable
Jack Deegan +44 20 7855 6689
Roger Lister +1 212 806 3231
Lisa Kwasnowski +1 212 806 3228
Financial Institutions: Banks and Trusts
April 15, 2016
Rating Report | Deutsche Bank AG
DBRS.COM 2
Issuer Description
Deutsche Bank AG is a global financial services company with a significant capital markets franchise, combined with a retail and corporate
bank that maintains solid market positioning in Germany and across Europe, with other businesses such as transaction banking and asset &
wealth management adding diversity and depth to the franchise. Headquartered in Frankfurt, Deutsche had total assets of EUR 1.6 trillion
at end-2015.
Rating Rationale
DBRS, Inc. (DBRS) rates Deutsche Bank AG (Deutsche, DB or the Bank) at “A” for its Senior Unsecured Long-Term Debt and Deposits
and R-1 (low) for its Short-Term Instruments. The Bank’s Long-Term Critical Obligations Ratings (COR) are AA (low), whilst the Short-
Term COR is at R-1 (middle). On 1 April 2016, DBRS placed the “A” Senior Unsecured Long-Term Debt and Deposits ratings and the
Long-Term COR of AA (low) Under Review with Negative Implications. The R-1 (low) Short-Term Instruments rating and Short-Term
COR of R-1 (middle) were confirmed. As part of the review process, the Intrinsic Assessment (IA) of “A” will also be re-evaluated. The
Bank’s support assessment is SA3, reflecting DBRS’s view that developments in European regulation and legislation mean that there is less
certainty about the likelihood of timely systemic support. As a result, Deutsche’s current ratings are positioned in line with its IA.
In placing the Senior Unsecured Long-Term Debt and Deposits ratings, and Long-Term COR, Under Review with Negative Implications,
DBRS considers the notable challenges faced by Deutsche in improving its internal capital generation ability at a time when the Bank’s
regulatory capital levels have fallen to the lower end of its global peer range.
During the review period, DBRS will assess the Bank’s earnings and capital position. With a very elevated expense base, revenue generation
is of critical importance. Signs of outsized revenue deterioration, combined with capital erosion, would likely result in a downgrade. Given
the relative placement of Deutsche Bank’s long-term ratings, DBRS anticipates that any downward rating pressure resulting from this
review should likely not exceed one notch. DBRS will also monitor investor or customer confidence during the review period, especially if
losses are again to be outsized in 1Q16. Any notable pressure on the Bank’s funding and liquidity profile, evidenced by deposit outflows, a
notable reduction in liquidity reserves or severely challenged funding markets, could therefore contribute to a downgrade.
DBRS will also assess the go-forward prospects for the Bank during the review period. DBRS will look at the execution risks associated
with the implementation of the Bank’s ambitious Strategy 2020 plans, as well as assessing the risk of misconduct, litigation or weaknesses
in operational controls causing damage to the core franchise.
Franchise Strength
Deutsche’s franchise continues to demonstrate resiliency, with strong full-year revenue generation across its core businesses in FY15,
despite the execution challenges associated with its latest strategy. The strength of DB’s franchise, which is supported by its top-tier
investment banking and capital markets franchises that are well-entrenched across diverse businesses, most notably in EMEA and APAC,
solid retail and corporate banking capabilities, and sizeable wealth and asset management franchise, remains a fundamental factor
underpinning its current rating level. Significant challenges persist, especially regarding the execution of its latest strategic plans, as various
restructuring plans have been announced in recent years with insufficient results.
In October 2015, DB provided additional details on its multi-year strategy, titled Strategy 2020. In announcing the additional details, DB
set out a significant further reshaping of its business, including a targeted reduction in risk-weighted assets (RWAs) of approximately EUR
100 billion by 2020 (around 25% of 3Q15 RWAs), excluding anticipated regulatory RWA inflation, driven in part by the re-sizing of Global
Markets, the disposal of Postbank, and the accelerated wind-down of Non-Core Operations Unit (NCOU). The Bank is also targeting an
adjusted cost base (total non-interest expenses less restructuring & severance, litigation, impairment of goodwill and intangibles and
policyholder benefits and claims) of below EUR 22 billion by 2018 (vs. adjusted cost base of EUR 26.5 billion in 2015) to be achieved in
part by exiting operations in 10 countries, reducing clients in Global Markets and Corporate & Investment Banking (CIB) divisions by up
to 50%, reducing the work-force, closing over 200 branches in Germany and reducing the number of retail products offered by
approximately one third; all of which are projected to produce gross cost savings of approximately EUR 3.8 billion, with associated
restructuring and severance costs of approximately EUR 3-3.5 billion. At the same time, the Bank is targeting growth investments, most
notably in its transaction banking business in Germany and Asia-Pacific, its advisory and equity capital market capabilities, and its High-
Net Worth (HNW) and Ultra-HNW (UHNW) businesses in Asia and the Americas.
As part of the investor update, DB also set out a series of updated targets, to be achieved by 2018, including a leverage ratio of at least
4.5%, a common equity tier 1 (CET1) ratio of at least 12.5%, a post-tax return on tangible equity (RoTE) of greater than 10%, an adjusted
cost base of below EUR 22 billion, and a cost-income ratio of approximately 70%. By end-2020, the Bank is targeting a leverage ratio of

Financial Institutions: Banks and Trusts
April 15, 2016
Rating Report | Deutsche Bank AG
DBRS.COM 3
at least 5%, along with a cost-income ratio of approximately 65%. At end-2015, the Bank’s fully-loaded leverage ratio was 3.5%, whilst its
fully-loaded CET1 ratio was 11.1%.
Business Segments
As part of the October 2015 strategy update, DB reorganized its four core operating business divisions (Corporate Banking & Services,
Global Transaction Banking, Private & Business Clients (PBC) and Deutsche Asset & Wealth Management (DeAWM)): Global Markets
now caters solely for the Bank’s sales and trading activities; Corporate & Investment Banking (CIB) combines the Bank’s corporate finance
and global transaction banking activities; Private, Wealth and Commercial Clients (PW&CC) houses the Bank’s German and International
Private and Commercial Clients (PCC) business, in addition to wealth management, which was formerly in DeAWM; and Deutsche Asset
Management (Deutsche AM) is a stand-alone division, providing services for both retail and institutional clients. To reflect the planned
deconsolidation, Postbank (PB) is now presented as a separate segment, combining both core and non-core components, which were
previously recorded in NCOU.
Source: DBRS, Company reports
Global Markets (GM) (Net Revenues1 of EUR 10.7 billion in 2015 – 32% of Total Net Revenues)
GM includes DB’s sales and trading (S&T) related activities, previously housed in CB&S. DB maintains significant market shares within
Fixed Income and Equity S&T, most notably in EMEA and APAC where it held #1 market share in Fixed Income S&T in 2015, according
to Coalition data. DB’s powerful, global GM franchise has traditionally been a key source of growth and earnings diversification for the
Bank. DBRS will continue to monitor this as the Bank undertakes its latest restructuring efforts.
In 2015, revenue generation remained strong within GM, with net revenues excluding CVA/DVA/FVA of EUR 10.7 billion, up 5% year-
on-year (YoY). Profitability was, however, severely impaired by litigation and regulatory costs, resulting in GM reporting a loss before tax,
adjusted for CVA/DVA/FVA and goodwill impairment, of EUR 288 million.
Corporate & Investment Banking (CIB) (Net Revenues of EUR 8 billion in 2015 – 24% of Total Net Revenues)
CIB combines the Corporate Finance business components formerly housed in CB&S, and Global Transaction Banking (GTB) businesses.
DB maintains a strong corporate finance business, offering M&A, equity and debt underwriting, and general corporate finance advice to a
variety of clients. This is reflected in the Bank’s league table rankings, including a top 3 position for EMEA Debt Capital Markets (DCM)
fees in 2015, based on Dealogic data. DB’s global transaction banking business is also strong, providing commercial banking products and
services globally to both corporates and financial institutions, including domestic and cross-border payments, risk mitigation, international
trade finance as well as trust, agency, depositary, custody and related services. As part of the new strategy, DB is targeting growth in its
transaction banking business, through increased penetration of European client segments and profitable growth in Asia and the US.
CIB continued to generate strong levels of revenue in 2015, with net revenues of EUR 8 billion up 5% YoY. Similarly to GM though,
profitability within CIB was impacted by increased litigation costs, as well as higher expenses related to regulatory requirements. As a
result, CIB reported a profit before tax, adjusted for goodwill impairment, of EUR 2 billion in 2015, down 11% YoY.
Private, Wealth & Commercial Clients (PW&CC) (Net Revenues of EUR 7.5 billion in 2015 – 22% of Total Net Revenues)
PW&CC houses the Bank’s German and International Private and Commercial Clients (PCC) businesses formerly included in PBC, along
with the Wealth Management (WM) activities formerly included in DeAWM. With an agreement for the sale of the Bank’s stake in HuaXia
Bank signed, and expected to close in 2Q16, DB now presents revenue generated by HuaXia separately. In a competitive German market
dominated by the German Savings Banks and the Cooperative sector (Volksbanken), DB has a constrained franchise in its home market
with an estimated market share below 10%. Profit before tax, adjusted for goodwill impairment, was down significantly in 2015, as reduced
1 All net revenues calculations exclude CVA/DVA/FVA unless otherwise stated

Financial Institutions: Banks and Trusts
April 15, 2016
Rating Report | Deutsche Bank AG
DBRS.COM 4
revenues in PCC added to an increase in operating expenses.
Deutsche Asset Management (Deutsche AM) (Net Revenues of EUR 3.3 billion in 2015 – 10% of Total Net Revenues)
DB has demonstrated success in growing its asset management franchise in recent years, with invested assets increasing to EUR 777 billion
in 2015, following EUR 18 billion of net new money. Contributing to revenue stability, DeAM generates net revenues ranging from EUR
700 million to EUR 900 million per quarter. DeAWM business provides the Company with an important avenue for leveraging its franchise
and diversifying its business mix. It is also a business of scale, so continued growth in this space is important for continued success.
Postbank (PB) (Net Revenues of EUR 3.1 billion in 2015 – 9% of Total Net Revenues)
PB is now reported separately, combining both core and non-core components, in order to reflect the planned deconsolidation as formulated
in DB’s new strategy.
Non-Core Operations Unit (NCOU) (Net Revenues of EUR 794 million in 2015 – 2% of Total Net Revenues)
The NCOU was established in 4Q12 to include DB’s noncore positions, providing a separation from core activities so as to not distract
management in key businesses, and accelerating the de-risking process. DB has made progress de-risking NCOU, with RWAs down 42%
YoY to EUR 32.9 billion at end-2015. The NCOU does, however, continue to be a significant consumer of capital, and a sizeable drag on
earnings, recording a net loss of EUR 2.7 billion in 2015. DBRS expects the earnings to persist in 2016, as DB looks to materially wind-
down the rest of the division by end-2016.
Source: DBRS, Company reports
Earnings Power
DBRS views DB’s current earnings as below the potential earnings of the franchise. DB’s 2015 results highlight the ongoing challenges
faced by the Bank in generating sufficient and improving returns, whilst also improving its capitalization through retained earnings. DB
reported a net loss of EUR 6.8 billion in 2015, the first annual net loss for the Bank since 2008. Whilst revenues remained strong, up 4%
year-on-year (YoY) to EUR 33.6 billion, bottom line results were impacted by EUR 12 billion of write-downs and charges, relating to the
impairment of goodwill and intangibles (EUR 5.8 billion), litigation charges (EUR 5.2 billion), and restructuring and severance expenses
(EUR 1 billion). (Note: DBRS calculates net revenues excluding CVA/DVA/FVA). Execution risks associated with the remainder of the
Bank’s restructuring plan remain significant, most notably in achieving considerable cost reductions, and managing the potential adverse
impact on the Bank’s businesses and net revenues.
DB continues to generate strong revenues across its core businesses; factors evident in FY15 with net revenue growth reported across GM,
CIB and DeAM, with each reporting YoY increases of 5%, 5% and 15%, respectively. DBRS, however, notes that DB’s quarterly net
revenues decreased 17% YoY in 4Q15, with sharp declines in both CB&S, most noticeably in origination and advisory, and Private &
Business Clients (PBC). DBRS also expects 1Q16 to remain challenging from a revenue generation perspective. With DB’s earnings
generation ability significantly challenged by persistently elevated expense levels, strong revenue generation is critical for the Bank.
Earnings continue to come under significant pressure from an elevated cost base as a result of numerous factors, including 1) systems
enhancements/integrations; 2) regulatory-related spend; 3) litigation-related expenses; and 4) the continued drag from the Non-Core
Operations Unit (NCOU). Despite making some progress with expense reductions, success with this program has so far been masked by
higher costs related to these items. DB’s cost/income ratio remains consistently high, in excess of 100% in 2015. DBRS expects that
expenses will continue to remain elevated through 2016.

Financial Institutions: Banks and Trusts
April 15, 2016
Rating Report | Deutsche Bank AG
DBRS.COM 5
Execution risk associated with the remainder of the Bank’s restructuring plan remains significant, most notably in achieving the considerable
cost reductions, and managing the potential adverse impact on the Bank’s businesses and net revenues. One of the key challenges of two
further years of restructuring is that it potentially puts DB at a competitive disadvantage relative to peers operating in capital markets
businesses. DBRS views DB as having underperformed other capital market peers during 4Q15, and will assess whether this trend continues
in the short- to medium-term. Sales & Trading (S&T) net revenues, for example, were down 27% YoY at DB, compared with a 3% YoY
increase across the U.S. capital market participants. Investment Banking net revenues, which include Financial Advisory, and Debt and
Equity Underwriting, were also down significantly compared to capital market peers, with a 45% YoY decrease noted at DB, compared
with a 5% decrease across the U.S. capital market participants. Over the longer-term, DBRS will monitor whether DB’s restructuring efforts
are able to deliver the necessary timely progress.
Source: DBRS, Company reports
Risk Profile
Effective risk management is a key driver behind the success of strong financial institution. DB benefits from solid risk systems, which
continue to be enhanced and harmonized globally, as a result of both management focus and regulatory pressure. Operational risk, however,
continues to be a key challenge for the Bank.
Importantly, DB’s risk management structure is independent of the operating businesses, with the Chief Risk Officer (CRO) being a member
of the Management Board, which has a direct reporting line to the Supervisory Board. There are also regional CROs and divisional CROs
that report into the Bank CRO. The Bank’s risk management has a 3 line of defence model, with the first line of defence being the business
divisions, the second being risk management oversight and the third being assurance/audit functions, all of which function independently
from one another, but with collaboration. Employees are empowered to manage and escalate risks, supporting DB’s strong risk culture.
Operational Risk
Despite improvements to technology and processes, DB continues to face notable challenges from an operational/reputational risk
perspective. The Bank remains under investigation for a variety of conduct issues, including the mis-selling of U.S. RMBS, FX
manipulation, dark pool activities, and Russia/U.K. equities trading. With the size of litigation/conduct costs increasing, this risk is a
considerable factor in the Bank’s rating level. The Company significantly built up its litigation reserves in 2015 to EUR 5.5 billion at year-
end 2015, up from EUR 3.2 billion at the end of 2014, by taking notable litigation charges of EUR 5.2 billion in the year. The Company
expects that litigation will remain a burden, and guidance is for charges to be below 2015 levels, though DBRS notes that these charges are
lumpy and difficult to predict.
While DB’s strong reputation supports investor confidence, it faces the challenge of headline risk which has the potential to impact the
Company’s reputation and drive negative market perceptions. DBRS views diminished investor confidence as a significant DB-specific risk
given the Bank’s relatively large use of wholesale funding. Events in recent history have highlighted the risk of losing confidence-sensitive
funding as a result of reputational issues.
Market Risk
DBRS views DB’s readiness to take on risk and its ability to manage market risk as an important component of its success with its trading
businesses. Client flows benefit from the ability of its trading desks to execute trades for customers that can result in substantial risk to DB.
When executing flow business on behalf of the client, DB typically holds trading positions in its inventory for a limited period of time. The
persistence of the current challenging operating environment has put pressure on different areas of the Bank and has led DB to be more
cautious in using its risk capacity. Additionally, new capital requirements, including the leverage ratio, have resulted in a more thoughtful
5,390 2,700 2,182 3,563
-238
33,228 33,386 32,561 32,622 33,608
-5,000
0
5,000
10,000
15,000
20,000
25,000
30,000
35,000
40,000
2011 2012 2013 2014 2015
PBT (excl. CVA/DVA/FVA & goodwill impairment)
Net Revenues (excl. CVA/DVA/FVA)
Evolution of Net Revenues & PBT (excl. CVA/DVA/FVA & goodwill impairment)
(EUR million)7,229
2,5353,522
4,250
-5,142
1,839 1,721 2,0651,134 956
25.4%
67.9%58.6%
26.7%
-18.6%
-40%
-20%
0%
20%
40%
60%
80%
-6,000
-4,000
-2,000
0
2,000
4,000
6,000
8,000
2011 2012 2013 2014 2015
IBPT (LHS) Provisions (LHS) Provisions % IBPT (RHS)
Evolution of IBPT and Provision for credit losses (EUR Million)

Financial Institutions: Banks and Trusts
April 15, 2016
Rating Report | Deutsche Bank AG
DBRS.COM 6
approach to balance sheet usage, with an increasing focus on retaining only those assets that are generating the required returns taking into
consideration not only risk exposure, but also regulatory requirements.
Market risk, as measured by regulatory value-at-risk (VaR), has declined significantly from its peak of EUR 126.8 million in 2009, and
now remains relatively stable around EUR 40-50 million. Average daily trading VaR (measured at a 99% confidence interval) was 43.3
million in 2015, against EUR 51.6 million in 2014. When comparing VaR to total shareholders’ equity, the ratio declined to 0.07% in 2015
from 0.35% in 2009, partially reflecting an increased equity capital base. Complementing VaR, DB makes extensive use of stress tests and
scenario analyses to understand the nature and scope of potential risks that can be outside the range of the normal data set.
Another perspective that DBRS uses to evaluate market risk is the distribution of trading results. DB’s 2015 daily trading net revenues
appear consistent with the Bank’s approach to risk/reward, with the majority of trading days in 2015 generating net trading revenues between
EUR 0 and EUR 70 million. DB’s risk appetite does tolerate losses (approximately 16 days in 2015) given the still challenging environment,
although DBRS note that the Bank experienced very few significant losses, with just approximately 3 loss day in excess of EUR 50 million.
DBRS views this as consistent with the Bank’s approach of seeking to achieve above average reward for its risk taking, while remaining
conservative when returns are more moderate relative to risk.
Credit Risk
DB takes a comprehensive approach to credit risk, including counterparty risk. Credit risks are evaluated for individual counterparties, as
well as for concentrations by client type, industry, products, markets and regions or countries, with a focus on large exposures. A key
principle of DB’s credit risk management is client credit due diligence, which is assessed in conjunction with the business divisions (first
line of defense). Credit risk is managed with various tools, including position limits based upon internal credit ratings of counterparties and
concentration limits.
Geographically, the Bank’s main credit exposures are in North America (33%), Western Europe (27%) and Germany (26%). The Bank also
has meaningful exposures in Asia Pacific. By business, CB&S accounts for 51% of credit exposure with EUR 524 billion in exposure, of
which EUR 111 billion is related to repo/matched book transactions and EUR 89 billion to traded bonds. DBRS notes that DB has the
flexibility to reduce both exposures. Also significant is CB&S’s irrevocable lending commitments of EUR 79 billion.
Note: Total exposure of EUR 1,029 billion.
Source: DBRS, Company reports
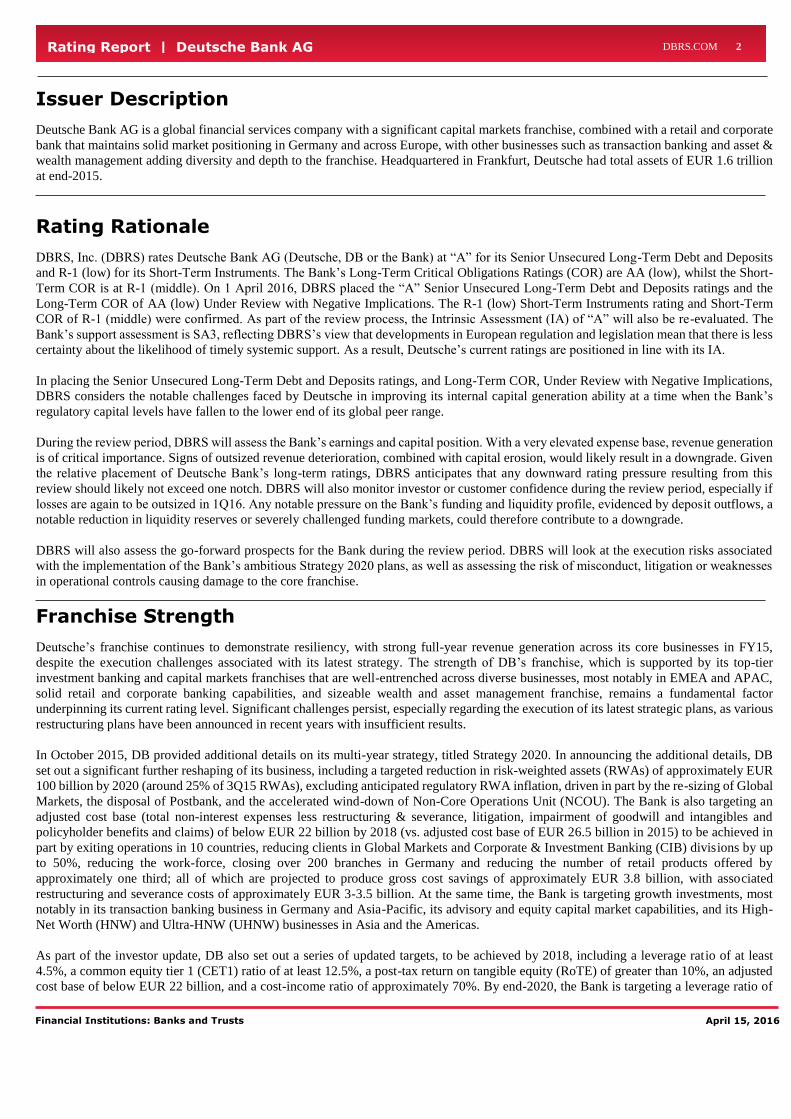
When looking at loan exposures only, DB’s primary source of lending is mortgages (36%), with some meaningful lending in consumer
finance (10%) and commercial real estate (10%) lending. Credit quality is good and improving, with impaired loans continuing to decline
reaching EUR 8.2 billion at year-end 2015, down 13% YoY. Some of this exposure, EUR 2.1 billion, is driven by impaired loans within
the NCOU. The impaired loan ratio remains low at just under 2%. In turn, provisions for credit losses remain low at EUR 956 million in
2015, down from EUR 1.1 billion in 2014.
Financial Institutions: Banks and Trusts
April 15, 2016
Rating Report | Deutsche Bank AG
DBRS.COM 7
Source: DBRS; Company reports
DB is also active in corporate lending/relationship lending, where some of the risk is transferred to third parties in various ways including
sales, single name and portfolio hedging, and securitizations. This transference of risk is managed by the Credit Portfolio Strategies Group
(CPSG), which aims to reduce single name concentrations, particularly in the international investment grade portfolio, the leveraged
portfolio and the German SME portfolio.
Despite the relatively strong performance of DB’s loan portfolio, DBRS notes that the Bank has exposure to the Oil and Gas (EUR 16
billion – o/w EUR 5 billion loans & EUR 8 billion irrevocable commitments) sector, in addition to Metals, Mining & Steel (EUR 10 billion
– o/w EUR 5 billion loans & EUR 3 billion irrevocable commitments) and Shipping (EUR 7 billion – o/w EUR 6 billion loans). Although
collectively accounting for less than 2% of the Bank’s total credit exposure, DBRS views positively DB’s strategy to reduce its exposure to
Metals, Mining and Steel, in light of the elevated risks within the sector, and the fact that less than 10% of the Bank’s Shipping exposure is
to the German ‘KG’ sector, which is non-recourse financing of vessels via closed end funds. Whilst approximately 60% of the Bank’s Oil
and Gas exposure is classified as investment grade, and less than 20% is related to sectors that are highly correlated to commodity price
movements, such as exploration and production, and oil & gas services & equipment, DBRS will continue to monitor the exposure given
the stresses evident within the market.
Funding and Liquidity
DB maintains a sound liquidity profile and has a comprehensive framework in place to manage its liquidity and funding needs. Global
capital markets, however, remain challenged, creating a difficult operating environment for all capital markets institutions. With regard to
DB, the market has concerns related to its ability to make payments on its Additional Tier 1 (AT1) securities, due to regulatory constraints.
Market concerns can at certain times have an impact on the fundamental creditworthiness of institutions. When market confidence materially
declines, this has the potential to impact the Company’s ability to fund itself at competitive pricing, while also having the potential to reduce
its ability to quickly address liquidity challenges. DBRS will continue to monitor how the current market concerns impact DB’s ability to
sustain business operations and maintain its franchise.
DBRS views DB’s substantial customer deposit base, which totaled EUR 447.9 billion (of which approximately EUR 120 billion are in
Postbank) as an anchor for the Bank’s sound funding profile. The Bank’s organic deposit growth has been solid and core deposits readily
fund the Bank’s entire loan portfolio. Deposits are sourced through PBC, as well as through GTB and WM. At the end of 2015, DB’s
wholesale funding reliance (wholesale funding, which DBRS defines as deposits from banks, debt in issue including senior debt and short-
term borrowings, and subordinated debt as a portion of total funding) was 41% and has been declining steadily with leverage exposure
reductions.
Given its sizeable capital markets businesses, the Bank remains reliant on a sizeable amount of wholesale funding to finance these activities.
DB seeks to structure its liabilities to limit refinancing risk by diversifying debt maturities, while also diversifying its funding sources across
geographic markets, currencies, and investor segments. DB has significantly reduced its reliance on short-term funding, through both
reductions in short-term unsecured funding as well as reductions in its matched book activity which decreased overnight secured funding
reliance. Further reductions in unsecured short-term funding would be viewed positively from a ratings perspective given the Bank’s large
capital markets franchise that is dependent upon reliable wholesale funding sources to operate successfully.

Financial Institutions: Banks and Trusts
April 15, 2016
Rating Report | Deutsche Bank AG
DBRS.COM 8
Note: Capital Markets & Equity includes unsecured funding with a maturity greater than one year.
Source: DBRS; Company Reports
Liquidity is essential for DB’s business, as it relies primarily on access to the capital markets to conduct its trading activities and other
businesses, and to fund these capital markets related activities. Liquidity pressure could arise from disruptions in the financial markets or
operational problems affecting DB or third parties that it relies on. DB has access to central bank funding, alleviating some pressures that
could arise from reduced investor confidence or illiquid markets.
The Company’s liquidity risk management framework analyses 3 specific angles: (1) management of intraday exposures, including daily
payments, forecasting cash flows and central bank access; (2) access to secured and unsecured funding sources, and (3) the maturity profile
of all assets/liabilities and issuance strategy. DB’s cash flow reporting system provides daily liquidity risk information to global and local
management. Stress testing and scenario analysis supplement this framework by looking at inventory characteristics under various stress
scenarios and contingent funding requirements for example. Internal stress testing is performed daily and is used to determine short-term
funding limits.
Source: DBRS; Company Reports
At year-end 2015, DB had approximately EUR 302.9 billion of wholesale funding outstanding, with EUR 195.7 billion maturing in less
than a year. DBRS notes that a significant portion of this short term funding (EUR 114 billion) is secured, related to DB’s matched book
activities. This source of funding fluctuates with trading inventory levels and Deutsche Bank has also been focused on reducing its reliance
on secured funding with continued focus on leverage exposure and balance sheet usage. While matched book activities are largely
collateralized by high-quality government and government backed securities, this type of funding is typically short-term, often overnight,
and can be susceptible to disruption. While the Bank attempts to mitigate this risk by diversifying the group of counterparties and the types
of securities, DBRS views the use of overnight repo facilities as a liquidity risk.
DB appropriately maintains substantial excess liquidity, which is intended to pre-fund estimated potential cash and collateral needs during
a liquidity crisis. At end-2015, DB reported liquidity reserves of EUR 215 billion, or approximately 15% of funded assets. The current level
of this pool is well in excess of the Bank’s estimated stressed liquidity needs, indicated by a positive liquidity stress result. Because this
liquidity is intended to be used in a stressed scenario, DBRS remains cognizant that this pool could be reduced quickly in a highly stressed
scenario if DB were constrained in accessing the wholesale funding markets. DBRS notes that markets can be fickle and the level of market
confidence and the Company’s ability to cope with illiquid markets are of critical importance when determining the rating.
Secured Funding &
Shorts 39%
Financing Vehicles 5%
Capital Markets &
Equity* 12%
Retail11%
Transaction Banking 7%
Other 13%
Discretionary Wholesale
13%
Funding Diversificationend-2007
Secured Funding &
Shorts, 11%
Capital Markets &
Equity*, 22%Retail, 25%
Transaction Banking,
20%
Other, 15%
Discretionary Wholesale, 6%
Funding Diversification end-2015

Financial Institutions: Banks and Trusts
April 15, 2016
Rating Report | Deutsche Bank AG
DBRS.COM 9
From a regulatory perspective, DB reported a Liquidity Coverage Ratio (LCR) of 119% at year-end 2015, well above the minimum
requirement of 100%. The impact of Total Loss Absorbing Capacity (TLAC) requirements on issuance plans and earnings is expected to
be manageable, as DB reported estimated TLAC outstanding at 28% of RWAs (20.5% minimum requirement from 2019) and 8% of leverage
exposure (6% minimum requirement by 2019). This corresponds to EUR 26 billion above 2019 TLAC requirements.
Capitalisation
DBRS views DB’s capitalisation as remaining under pressure whilst it implements its new strategic plan. Successful execution of the plan
is an essential component of the rebuild of DB’s capital ratios, which, with fully-loaded Common Equity Tier 1 (CET1) and leverage ratio
of 11.1% and 3.5% respectively at end-2015, remain at the low-end of its global peer group.
DB is targeting a fully-loaded CET1 ratio of greater than 12.5% by 2018, and a leverage ratio of at least 4.5%. The key drivers for this
increase will be the sale of the 19.99% stake in Hua Xia Bank, and the capital release from the run-down of NCOU, as well as the sale /
IPO of the Bank’s stake in Postbank, de-risking and divestments. DBRS considers that the Bank’s capital plan is ambitious. The Bank’s
ability to raise capital, both internally and externally, is extremely limited given the current pressure on earnings, and the two relatively
recent capital raises, in April 2013 (EUR 2.8 billion) and June 2014 (EUR 8.5 billion). In addition, RWAs are expected to remain flat
through 2016, as progress in deleveraging NCOU is expected to be offset by increased Operational Risk RWAs. As a result, the Bank has
limited flexibility to absorb further hits to capital, in the form of further litigation or regulatory developments, and DBRS expects DB to
have to look for further ways to reduce RWAs, at a time when asset sales and further restructurings are challenging.
Other challenges on the horizon include the EBA’s 2016 stress test, and the finalization of EU regulatory requirements. Evolving regulatory
requirements also remain an ongoing challenge as evidenced by the U.S. Federal Reserve (Fed) objecting to DB Trust Corporation, along
with the Bank Holding Company (BHC) of one other foreign bank, 2015 capital plans submitted under the 2015 Comprehensive Capital
Assessment Review (CCAR). Although the Fed’s objection related to qualitative aspects, as opposed to the amount of capital, DBRS notes
that it involved the identification of ‘numerous and significant deficiencies across DB Trust Corporation’s risk-identification, measurement,
and aggregation processes; approaches to loss and revenue projection; and internal controls’. With DB’s broker-dealer activities in the U.S.,
which are housed within Deutsche Bank Securities Inc., due eventually to be moved into the Bank’s U.S. intermediate holding structure,
DBRS views DB as facing further challenges in passing the Fed’s supervisory stress tests. DBRS also views DB’s elevated Supervisory
Review and Evaluation Process (SREP) minimum requirement of 10.25%, which rises to 12.25% at end-2018 once the additional 2% G-
SIB surcharge is fully implemented, as challenging, especially with the Bank only reporting a phased-in CET1 ratio of 12.52% at end-2015.
The pressure on DB’s capital ratios was evident in February 2016, as the CDS spreads on the Bank’s 5 year senior debt widened significantly
on market concerns about DB’s ability to make payments on its Additional Tier 1 (AT1) securities, due to regulatory constraints following
the announcement of the significant FY15 loss. DB’s payment capacity is, however, EUR 1.1 billion, against AT1 coupons of approximately
EUR 0.35 billion in 2016. The estimated pro-forma 2017 payment capacity is approximately EUR 4.3 billion, before the impact of 2016’s
operating results, whilst the Bank also has reserves of approximately EUR 1.9 billion available to offset future losses.
Source: DBRS; Company Reports

Financial Institutions: Banks and Trusts
April 15, 2016
Rating Report | Deutsche Bank AG
DBRS.COM 10
Deutsche Bank AG 31/12/2015 31/12/2014 31/12/2013 31/12/2012 31/12/2011
EUR EUR EUR EUR EUR
EUR Millions IFRS IFRS IFRS IFRS IFRS
Balance Sheet
Cash and deposits w ith central banks 96,940 5.95% 74,482 4.36% 17,155 1.06% 27,877 1.38% 15,928 0.74%
Lending to/deposits w ith credit institutions 27,025 1.66% 32,149 1.88% 101,424 6.29% 120,637 5.97% 162,000 7.49%
Financial Securities* 403,874 24.79% 386,002 22.59% 455,690 28.28% 512,629 25.35% 478,433 22.11%
- Trading portfolio 180,576 11.08% 179,027 10.48% 192,283 11.93% 236,821 11.71% 222,885 10.30%
- At fair value 96,802 5.94% 101,955 5.97% 169,017 10.49% 168,779 8.35% 156,073 7.21%
- Available for sale 70,481 4.33% 61,391 3.59% 46,155 2.86% 46,446 2.30% 42,365 1.96%
- Held-to-maturity 0 0.00% 0 0.00% 0 0.00% 0 0.00% 0 0.00%
- Other 56,015 3.44% 43,629 2.55% 48,235 2.99% 60,583 3.00% 57,110 2.64%
Financial derivatives instruments 518,730 31.84% 634,361 37.13% 508,553 31.56% 776,715 38.41% 867,143 40.07%
- Fair Value Hedging Derivatives 3,136 0.19% 4,403 0.26% 3,963 0.25% 8,362 0.41% 7,561 0.35%
- Mark to Market Derivatives 515,594 31.65% 629,958 36.87% 504,590 31.31% 768,353 37.99% 859,582 39.72%
Gross lending to customers 449,605 27.60% 422,656 24.74% 394,267 24.47% 440,909 21.80% 461,851 21.34%
- Loan loss provisions 5,028 0.31% 5,212 0.31% 5,589 0.35% 4,692 0.23% 4,162 0.19%
Insurance assets NA - NA - NA - NA - NA -
Investments in associates/subsidiaries 1,013 0.06% 4,143 0.24% 3,581 0.22% 3,577 0.18% 3,759 0.17%
Fixed assets 2,846 0.17% 2,909 0.17% 4,420 0.27% 4,963 0.25% 5,509 0.25%
Goodw ill and other intangible assets 10,078 0.62% 14,951 0.87% 13,932 0.86% 14,219 0.70% 15,802 0.73%
Other assets 124,048 7.61% 142,261 8.33% 117,969 7.32% 125,441 6.20% 157,840 7.29%
Total assets 1,629,130 100.00% 1,708,703 100.00% 1,611,400 100.00% 2,022,275 100.00% 2,164,103 100.00%
Total assets (USD) 1,769,447 2,068,397 2,220,171 2,666,853 2,810,523
Loans and deposits from credit institutions 119,065 7.31% 108,350 6.34% 114,176 7.09% NA - NA -
Repo Agreements in Deposits from Customers NA - NA - NA - NA - NA -
Deposits from customers 447,909 27.49% 424,584 24.85% 413,574 25.67% 577,210 28.54% 601,730 27.81%
- Demand 345,569 21.21% 304,905 17.84% 290,284 18.01% 278,958 13.79% 262,665 12.14%
- Time and savings 221,406 13.59% 228,026 13.34% 237,466 14.74% 298,252 14.75% 339,066 15.67%
Issued debt securities 258,053 15.84% 247,786 14.50% 317,036 19.67% 376,620 18.62% 433,423 20.03%
Financial derivatives instruments 500,441 30.72% 615,265 36.01% 484,044 30.04% 756,327 37.40% 843,604 38.98%
- Fair Value Hedging Derivatives 6,365 0.39% 5,063 0.30% 616 0.04% 3,675 0.18% 4,787 0.22%
- Other 494,076 30.33% 610,202 35.71% 483,428 30.00% 752,652 37.22% 838,817 38.76%
Insurance liabilities 8,522 0.52% 8,523 0.50% 8,067 0.50% 7,732 0.38% 7,426 0.34%
Other liabilities 214,081 13.14% 215,352 12.60% 200,031 12.41% 229,270 11.34% 203,475 9.40%
- Financial liabilities at fair value through P/L 44,852 2.75% 37,131 2.17% 90,104 5.59% 110,409 5.46% 118,318 5.47%
Subordinated debt 6,413 0.39% 5,047 0.30% 7,579 0.47% 8,785 0.43% 7,441 0.34%
Hybrid Capital 7,020 0.43% 10,573 0.62% 11,926 0.74% 12,091 0.60% 12,344 0.57%
Equity 67,624 4.15% 73,223 4.29% 54,966 3.41% 54,240 2.68% 54,660 2.53%
Total liabilities and equity funds 1,629,130 100.00% 1,708,704 100.00% 1,611,400 100.00% 2,022,275 100.00% 2,164,103 100.00%
Income Statement
Interest income 25,967 25,001 25,601 31,593 34,366
Interest expenses 10,086 10,729 10,767 15,619 16,921
Net interest income and credit commissions 15,881 47.58% 14,272 45.01% 14,834 47.07% 15,975 47.71% 17,445 51.07%
Net fees and commissions 12,765 38.25% 12,409 39.13% 12,308 39.05% 11,809 35.27% 11,878 34.77%
Trading / FX Income 3,874 11.61% 4,407 13.90% 3,662 11.62% 5,199 15.53% 2,138 6.26%
Net realised results on investment securities (available for sale) 309 0.93% 291 0.92% 455 1.44% 461 1.38% 749 2.19%
Net results from other f inancial instruments at fair value -32 -0.10% -108 -0.34% 155 0.49% 409 1.22% 586 1.72%
Net income from insurance operations -148 -0.44% -148 -0.47% -270 -0.86% -195 -0.58% 7 0.02%
Results from associates/subsidiaries accounted by the equity method 164 0.49% 619 1.95% 369 1.17% 163 0.49% 251 0.73%
Other operating income (incl. dividends) 561 1.68% -33 -0.10% 3 0.01% -339 -1.01% 1,108 3.24%
Total operating income 33,374 100.00% 31,709 100.00% 31,516 100.00% 33,482 100.00% 34,162 100.00%
Staff costs 13,293 40.77% 12,512 46.12% 12,329 46.09% 13,490 46.72% 13,135 51.21%
Other operating costs 18,166 55.71% 13,543 49.92% 13,258 49.56% 14,288 49.49% 11,519 44.91%
Depreciation/amortisation 1,149 3.52% 1,072 3.95% 1,143 4.27% 1,094 3.79% 993 3.87%
Total operating expenses 32,608 100.00% 27,127 100.00% 26,750 100.00% 28,872 100.00% 25,647 100.00%
Pre-provision operating income 766 4,582 4,766 4,610 8,515
Loan loss provisions** 1,062 1,183 2,126 1,881 1,938
Post-provision operating income -296 3,399 2,640 2,729 6,577
Impairment on tangible assets 27 172 379 29 658
Impairment on intangible assets 5,776 111 79 1,886 2
Other non-operating items*** 0 0 -725 0 -527
Pre-tax income -6,097 3,116 1,457 814 5,390
(-)Taxes 675 1,425 775 498 1,064
(-)Other After-tax Items (Reported) 0 0 0 0 0
(+)Discontinued Operations (Reported) 0 0 0 0 0
(-)Minority interest 21 28 15 53 194
Net income -6,772 1,663 666 263 4,132
Net income (USD) -7,541 2,209 884 338 5,753
*Includes derivatives w hen breakdow n unavailable, **LLP includes Impairments on f inancial assets, ***Incl. Other Provisions

Financial Institutions: Banks and Trusts
April 15, 2016
Rating Report | Deutsche Bank AG
DBRS.COM 11
Off-balance sheet and other items 31/12/2015 31/12/2014 31/12/2013 31/12/2012 31/12/2011
Asset under management 1,406,000 1,330,000 1,205,000 1,213,000 1,193,000
Derivatives (notional amount) 41,940,034 52,002,836 54,652,083 55,605,039 59,195,445
BIS Risk-w eighted assets (RWA) 397,382 396,648 300,369 333,605 381,246
No. of employees (end-period) 101,104 98,138 98,254 98,219 100,996
Earnings and Expenses
Earnings
Net interest margin [1] 1.01% 0.96% 0.88% 0.82% 0.98%
Yield on average earning assets 1.65% 1.68% 1.51% 1.62% 1.93%
Cost of interest bearing liabilities 1.20% 1.35% 1.25% 1.60% 1.60%
Pre-provision earning capacity (total assets basis) [2] 0.04% 0.27% 0.25% 0.20% 0.42%
Pre-provision earning capacity (risk-w eighted basis) [3] 0.19% 1.20% 1.51% 1.26% 2.53%
Net Interest Income / Risk Weighted Assets 4.00% 3.60% 4.94% 4.79% 4.58%
Non-Interest Income / Total Revenues 52.42% 54.99% 52.93% 52.29% 48.93%
Post-provision earning capacity (risk-w eighted basis) -0.07% 0.89% 0.83% 0.75% 1.95%
Expenses
Efficiency ratio (operating expenses / operating income) 97.70% 85.55% 84.88% 86.23% 75.07%
All inclusive costs to revenues [4] 97.79% 86.09% 88.38% 86.32% 78.54%
Operating expenses by employee 322,519 276,417 272,254 293,955 253,941
Loan loss provision / pre-provision operating income 138.64% 25.82% 44.61% 40.80% 22.76%
Provision coverage by net interest income 1495.39% 1206.42% 697.74% 849.28% 900.15%
Profitability Returns
Pre-tax return on Tier 1 (excl. hybrids) -13.00% 6.28% 3.79% 2.03% 14.31%
Return on equity -10.09% 2.28% 1.22% 0.49% 7.74%
Return on average total assets -0.38% 0.10% 0.03% 0.01% 0.20%
Return on average risk-w eighted assets -1.64% 0.43% 0.21% 0.07% 1.23%
Dividend payout ratio [5] -15.22% 59.24% 114.79% 264.98% 16.42%
Internal capital generation [6] -12.50% 1.57% -0.23% -1.03% 9.06%
Growth
Loans 6.50% 7.40% -10.90% -4.69% 2.06%
Deposits 5.49% 2.66% -28.35% -4.07% 12.69%
Net interest income 11.27% -3.79% -7.14% -8.43% 11.95%
Fees and commissions 2.87% 0.82% 4.23% -0.58% 11.33%
Expenses 20.20% 1.41% -7.35% 12.57% 12.47%
Pre-provision earning capacity -83.28% -3.86% 3.38% -45.86% 8.25%
Loan-loss provisions -10.23% -44.36% 13.02% -2.94% 39.73%
Net income -508.54% 149.70% 153.23% -93.64% 78.87%
Risks
RWA% total assets 24.39% 23.21% 18.64% 16.50% 17.62%
Credit Risks
Impaired loans % gross loans 1.81% 2.21% 2.57% 2.34% 2.18%
Loss loan provisions % impaired loans 61.69% 55.76% 55.10% 45.40% 41.33%
Impaired loans (net of LLPs) % pre-provision operating income [7] 465.27% 98.84% 104.09% 131.97% 69.38%
Impaired loans (net of LLPs) % equity 5.88% 7.23% 11.53% 14.43% 13.96%
Liquidity and Funding
Customer deposits % total funding 53.87% 54.03% 48.52% 59.96% 57.71%
Total w holesale funding % total funding [8] 46.13% 45.97% 51.48% 40.04% 42.29%
- Interbank % total funding 14.32% 13.79% 13.40% NA NA
- Debt securities % total funding 31.04% 31.53% 37.19% 39.12% 41.57%
- Subordinated debt % total funding 0.77% 0.64% 0.89% 0.91% 0.71%
Short-term w holesale funding % total w holesale funding 48.72% 53.93% 51.50% 40.94% 34.43%
Liquid assets % total assets 32.40% 28.83% 35.64% 32.69% 30.33%
Net short-term w holesale funding reliance [9] -30.96% -24.49% -33.58% -36.98% -33.47%
Adjusted net short-term w holesale funding reliance [10] -41.82% -34.16% -43.72% -36.98% -33.47%
Customer deposits % gross loans 99.62% 100.46% 104.90% 130.91% 130.29%
Capital [11]
Tier 1 14.65% 16.11% 16.88% 15.13% 12.86%
Tier 1 excl. All Hybrids 11.84% 12.40% 12.66% 11.23% 9.52%
Common Equity Tier 1 (Fully Loaded for 2014 & 2015) 11.12% 11.70% 12.83% 11.38% 9.52%
Tangible Common Equity / Tangible Assets 3.25% 3.15% 2.55% 1.98% 1.75%
Total Capital 16.24% 17.22% 18.47% 17.09% 14.49%
Retained earnings % Tier 1 36.38% 45.82% 55.95% 57.84% 61.41%
[1] (Net interest income + dividends)% average interest earning assets.
[2] Pre-provision operating income % average total assets.
[3] Pre-provision operating income % average total risk-w eighted assets.
[4] (Operating & non-op. costs) % (op. & non-op. revenues)
[5] Paid dividend % net income.
[6] (Net income - dividends) % shareholders' equity at t-1.
[7] We take into account the stock of LLPs in this ratio.
[8] Whole funding excludes corporate deposits.
[9] (Short-term w holesale funding - liquid assets) % illiquid assets
[10] (Short-term w holesale funding - liquid assets- loans maturing w ithin 1 year) % illiquid assets
[11] Capital ratios of Interim results exclude profits for the year
* Interim information is annualised w here needed.

Financial Institutions: Banks and Trusts
April 15, 2016
Rating Report | Deutsche Bank AG
DBRS.COM 12
Methodologies
The principal applicable methodology is the Global Methodology for Rating Banks and Banking Organisations (December 2015). Other
applicable methodologies include the DBRS Criteria – Support Assessments for Banks and Banking Organisations (March 2016), DBRS
Criteria: Rating Bank Capital Securities – Subordinated, hybrid, Preferred & Contingent Capital Securities (February 2016) and DBRS
Criteria: Critical Obligations Rating (February 2016).
Ratings
Rating History
Previous Action(s)
DBRS Places Deutsche Bank’s “A” Rating Under Review with Negative Implications, April 1, 2016.
DBRS Assigns Critical Obligations Ratings to 33 European Banking Groups, February 4, 2016.
DBRS Downgrades 31 European Banking Groups due to Removal of Systemic Support Uplift, September 29, 2015
DBRS Initiates Coverage of Deutsche Bank – Senior Long-Term Debt at A (high), Stable Trend, February 27, 2015
Previous Report
Deutsche Bank AG, Rating Report, March 10, 2016
Notes: All figures are in EUR unless otherwise noted.
For the definition of Issuer Rating, please refer to Rating Definitions under Rating Policy on www.dbrs.com.
Generally, Issuer Ratings apply to all senior unsecured obligations of an applicable issuer, except when an issuer has a significant or unique level of secured debt.
© 2016, DBRS Limited, DBRS, Inc. and DBRS Ratings Limited (collectively, DBRS). All rights reserved. The information upon which DBRS ratings and reports are based is obtained by
DBRS from sources DBRS believes to be reliable. DBRS does not audit the information it receives in connection with the rating process, and it does not and cannot independently verify that
information in every instance. The extent of any factual investigation or independent verification depends on facts and circumstances. DBRS ratings, reports and any other information provided by DBRS are provided “as is” and without representation or warranty of any kind. DBRS hereby disclaims any representation or warranty, express or implied, as to the accuracy,
timeliness, completeness, merchantability, fitness for any particular purpose or non-infringement of any of such information. In no event shall DBRS or its directors, officers, employees,
independent contractors, agents and representatives (collectively, DBRS Representatives) be liable (1) for any inaccuracy, delay, loss of data, interruption in service, error or omission or
for any damages resulting therefrom, or(2) for any direct, indirect, incidental, special, compensatory or consequential damages arising from any use of ratings and rating reports or arising from any error (negligent or otherwise) or other circumstance or contingency within or outside the control of DBRS or any DBRS Representative, in connection with or related to
obtaining, collecting, compiling, analyzing, interpreting, communicating, publishing or delivering any such information. Ratings and other opinions issued by DBRS are, and must be
construed solely as, statements of opinion and not statements of fact as to credit worthiness or recommendations to purchase, sell or hold any securities. A report providing a DBRS rating
is neither a prospectus nor a substitute for the information assembled, verified and presented to investors by the issuer and its agents in connection with the sale of the securities. DBRS
receives compensation for its rating activities from issuers, insurers, guarantors and/or underwriters of debt securities for assigning ratings and from subscribers to its website. DBRS is not responsible for the content or operation of third party websites accessed through hypertext or other computer links and DBRS shall have no liability to any person or entity for the
use of such third party websites. This publication may not be reproduced, retransmitted or distributed in any form without the prior written consent of DBRS. ALL DBRS RATINGS ARE
SUBJECT TO DISCLAIMERS AND CERTAIN LIMITATIONS. PLEASE READ THESE DISCLAIMERS AND LIMITATIONS AT http://www.dbrs.com/about/disclaimer. ADDITIONAL
INFORMATION REGARDING DBRS RATINGS, INCLUDING DEFINITIONS, POLICIES AND METHODOLOGIES, ARE AVAILABLE ON http://www.dbrs.com.
Debt Rating Rating Action Trend Senior Unsecured Debt & Deposits A* UR-Neg. --
Short-Term Debt & Deposits R-1 (low) Confirmed Stable
Long Term Critical Obligations Rating AA (low)* UR-Neg. --
Short Term Critical Obligations Rating R-1 (middle) Confirmed Stable
*Under Review with Negative Implications
Current 2015 Senior Unsecured Debt & Deposits A* A
Short-Term Debt & Deposits R-1 (low) R-1 (low)
Long Term Critical Obligations
Rating AA (low)* N/A
Short Term Critical Obligations
Rating R-1 (middle) N/A
*Under Review with Negative Implications


![NR…….806./] March 1, 2018ctptc-airinei.ro/Raport activitati ed sem I.pdfautomatizari/tehnician de telecomunicatii d.a rd seral 212 2 SĂNDUC TATIANA 41 12Bs tehnologică/ tehnic](https://img.dokumen.tips/doc/110x75/5e31b7afbe917c48d84af0ea/nr806-march-1-2018ctptc-activitati-ed-sem-ipdf-automatizaritehnician-de.jpg)