Embed Size (px)
Citation preview

HAL Id: hal-00711443https://hal.archives-ouvertes.fr/hal-00711443
Submitted on 25 Jun 2012
HAL is a multi-disciplinary open accessarchive for the deposit and dissemination of sci-entific research documents, whether they are pub-lished or not. The documents may come fromteaching and research institutions in France orabroad, or from public or private research centers.
L’archive ouverte pluridisciplinaire HAL, estdestinée au dépôt et à la diffusion de documentsscientifiques de niveau recherche, publiés ou non,émanant des établissements d’enseignement et derecherche français ou étrangers, des laboratoirespublics ou privés.
Determining the Number of Zones in a Pick-and-sortOrder Picking System
René B.M. de Koster, Tho Le-Duc, Nima Zaerpour
To cite this version:René B.M. de Koster, Tho Le-Duc, Nima Zaerpour. Determining the Number of Zones in a Pick-and-sort Order Picking System. International Journal of Production Research, Taylor & Francis, 2011,�10.1080/00207543.2010.543941�. �hal-00711443�
For Peer Review O
nly
Determining the Number of Zones in a Pick-and-sort Order
Picking System
Journal: International Journal of Production Research
Manuscript ID: TPRS-2010-IJPR-0583.R1
Manuscript Type: Original Manuscript
Date Submitted by the Author:
02-Nov-2010
Complete List of Authors: De Koster, René; Erasmus University, Rotterdam School of Management Le-Duc, Tho; Unilever Vietnam, Planning/ Supply Chain; RSM Erasmus Universiteit, Dept of Tech and Ops Mgmt Zaerpour, Nima; Erasmus University, Rotterdam School of Management
Keywords: ORDER PICKING METHODS, WAREHOUSE DESIGN, LOGISTICS
Keywords (user): Order fulfillment and distribution, Zone picking
http://mc.manuscriptcentral.com/tprs Email: [email protected]
International Journal of Production Research

For Peer Review O
nly
Determining the Number of Zones in a Pick-and-sort Order Picking System
René B.M. de Koster, Tho Le-Duc, and Nima Zaerpour1
Rotterdam School of Management, Erasmus University, the Netherlands
1 Corresponding author, [email protected]
Page 1 of 34
http://mc.manuscriptcentral.com/tprs Email: [email protected]
International Journal of Production Research
123456789101112131415161718192021222324252627282930313233343536373839404142434445464748495051525354555657585960

For Peer Review O
nly
- 2 - 2
Determining the Number of Zones in a Pick-and-sort Order Picking System
1
2 Abstract
In this study we consider a pick-and-sort order picking system, in which batches of orders are
picked simultaneously from different (work) zones by a group of order pickers. After picking,
the orders are transported by a conveyor to a next station for consolidation and packing. Packing
can only occur when an order has been picked completely. For a given number of workers, each
assigned to a single zone, a larger number of zones reduces pick time (since travel time reduces),
but increases waiting time for completion at the packing stations, because more partial batches
needing assembly arrive at the packing stations. Our aim is to determine the optimal number of
zones such that the total (picking and packing) time to complete a batch is minimized. We solve
this problem by optimally assigning items to pick routes in each zone. We illustrate the method
with data taken from a distribution center of one of the largest online retailers in the Netherlands.
Keywords: Order picking; Zone picking; Warehousing; Logistics; Order fulfillment and
distribution
1. Introduction and literature review
Warehouses play an important role in companies’ supply chains. Among many activities carried
out in a warehouse, order picking - the process of retrieving products from storage in response to
a specific customer request - is the most critical. It has long been identified as a very labor
intensive operation in manual systems, and a very capital intensive operation in automated
systems (Goetschalckx and Ashayeri, 1989). It may consume as much as 60% of all labor
activities in the warehouse, and, for a typical warehouse, the cost of order picking is estimated to
be as much as 55% of the total warehouse operating expense (Tompkins et al., 2003). For these
Page 2 of 34
http://mc.manuscriptcentral.com/tprs Email: [email protected]
International Journal of Production Research
123456789101112131415161718192021222324252627282930313233343536373839404142434445464748495051525354555657585960

For Peer Review O
nly
- 3 - 3
reasons, warehousing professionals consider order picking as the highest-priority activity for
productivity improvements.
We can make a distinction between two types of order picking systems: conventional (manual
picking) and automated picking. In this research we focus on conventional picking systems and
exclude unit load retrieval. Four operational decision problems influencing the performance of
order picking systems have received attention from researchers.
• Storage assignment. Storage assignment methods assign stock keeping units (SKUs) to
storage locations. This assignment affects the order-picking throughput time. The main
storage policies mentioned in the literature are randomized, class-based and dedicated
storage. The easiest storage method is to randomly allocate incoming products to available
storage locations. However, we can reduce the expected travel time of a picking tour by
locating high-demand products near the input/ output (I/O) point (depot) of the warehouse.
There are two ways of doing that: either on group or on item basis. In practice, pick-
frequency class-based storage strategies (see for example, Hausman et al., 1976) are the
most popular. Such a strategy divides products and locations into classes, ranks product
classes in decreasing order of pick frequency, and then assigns them in that order to the
location classes nearest to the I/O point. Within a class, storage is random. A dedicated
storage strategy (see for example Caron et al., 1998, 2000) ranks the items individually to
some criterion (for example pick frequency) and then assigns them in that order to the
locations nearest to the I/O point. The cube-per-order index (COI) rule, which is attributed
to Heskett (1964), is an example of such a dedicated storage strategy. The COI is the ratio
of the space requirement (cube) of a SKU to its turnover rate. Two common types of
assignment of product classes to a low level picker-to-parts warehouse, within-aisle storage
and across-aisle storage, are illustrated by De Koster et al.(2007).
Page 3 of 34
http://mc.manuscriptcentral.com/tprs Email: [email protected]
International Journal of Production Research
123456789101112131415161718192021222324252627282930313233343536373839404142434445464748495051525354555657585960

For Peer Review O
nly
- 4 - 4
• Layout problem. This is the problem of finding a good aisle configuration (i.e. the optimal
number and length of aisles) minimizing order picking time. Little research has been done
in this area. Roodbergen (2001) proposes a non-linear objective function (i.e. average
travel time in terms of number of picks per route and pick aisles) for determining the aisle
configuration for random storage warehouses (including single and multiple blocks) that
minimizes the average tour length. Also considering minimization of the average tour
length as the major objective, Caron et al. (2000) consider 2-block warehouses (i.e., one
middle cross aisle) under the COI-based storage assignment. Parikh and Meller (2008)
develop analytical models to estimate blocking in an order picking system with wide
picking aisles. For small (up to 2-blocks) class-based storage warehouses, Le-Duc and De
Koster (2005) propose a travel time model and a local search procedure for determining
optimal storage zone boundaries as well as the number of storage aisles. Gue and Meller
(2006) propose two innovations in warehouse design, diagonal cross aisles and picking
aisles having different orientations, to increase order picking throughput. For a one-block
warehouse, Roodbergen and Vis (2006) present analytical formulas to show the
relationship between the order picking area and the average length of a picking route. The
effect of pick density and congestion on order picking system performance has been
studied by Gue et al.(2006).
• Routing order pickers. This is the problem of determining the optimal sequence of visits to
pick up a number of requested items as quickly as possible. Optimal methods to route
(order) pickers depend on the warehouse layout and the location of the depot. Optimal
methods for simple warehouse layouts (single or two blocks) are mentioned by Ratliff and
Rosenthal (1983), Goetschalckx and Ratliff (1988), De Koster and Van der Poort (1998),
and Roodbergen and De Koster (2001b). The disadvantage of the exact algorithm is that it
depends on the layout and depot location and the resulting routes may be too complicated
for pickers to follow (see De Koster et al., 1998 and Dekker et al. 2004). For large and
Page 4 of 34
http://mc.manuscriptcentral.com/tprs Email: [email protected]
International Journal of Production Research
123456789101112131415161718192021222324252627282930313233343536373839404142434445464748495051525354555657585960

For Peer Review O
nly
- 5 - 5
more complicated layouts (more than two blocks) several heuristics are documented. The
best routing heuristic known so far is probably the combined heuristic (Roodbergen and De
Koster, 2001a). This method combines two basis methods: either traversing a visited aisle
from one end to the other or entering and leaving the aisle from the same aisle’s end. The
choices are made with dynamic programming. Le-Duc and De Koster (2007) develop a
model to estimate the first and the second moment of travel time for a 2-block warehouse
with S-shape routing policy and random storage method. The estimation enables them to
determine the optimal batch size.
• Batching and zoning. Batching determines which orders are released together (in batch
picking, multiple orders are picked together in one pick tour and need to be sorted by order
later). Order batching reduces the average travel time per order by sharing a pick tour with
other orders. Basically two criteria for batching exist: proximity of pick locations batching
and time-window batching. Proximity batching, the clustering of orders based on retrieval
locations, is studied in, for example, Hwang et al. (1988), Gibson and Sharp (1992),
Elsayed et al. (1993), Rosenwein (1994), Elsayed and Lee (1996), De Koster et al. (1999),
Gademann et al. (2001), and Gademann and Van de Velde (2005). With time-window
batching the number of orders per batch can be fixed or variable. Variable time-window
batching groups all orders that arrive during the same time interval or window. With fixed-
number-of-orders time-window batching, a time window is the variable length until a batch
has a predetermined number of orders (Le-Duc and De Koster, 2003, 2006). Zoning is
closely related to batching; it divides the pick area into sub-divisions (or zones), each with
one or few pickers dedicated to it. The major advantages of zoning are: reduction of the
travel time (because of the smaller traversed area and also the familiarity of the picker with
the zone) and less traffic congestion. Depending on the pick process sequence, zoning can
be further classified as progressive zoning or synchronized zoning. With progressive
zoning, orders are sequentially picked zone by zone (this system is also called pick-and-
Page 5 of 34
http://mc.manuscriptcentral.com/tprs Email: [email protected]
International Journal of Production Research
123456789101112131415161718192021222324252627282930313233343536373839404142434445464748495051525354555657585960

For Peer Review O
nly
- 6 - 6
pass); a batch is finished when all (order) lines of the orders in the batch are picked. In
contrast, in synchronized (or parallel) zoning, pickers in all zones can work on the same
batch at the same time. In this case the picking process has to be followed by an order
assembly process, which is often combined with packing the orders for the customers.
Choe and Sharp (1991) notice that zoning has received little attention in the literature
despite its important impact on the performance of order picking systems. Mellema and
Smith (1988) examine the effects of the aisle configuration, stocking policy and batching
and zoning rules by using a simulation model. They suggest that a combination of batching
and zoning can significantly increase the productivity (pieces per man-hour). Russell and
Meller (2003) provide a design aid for potential automation of the sorting process. Their
model is based on demand levels, labor rates, order sizes, and other factors. Choe et al.
(1993) and Van Nieuwenhuyse and De Koster (2009) study the effects of various order
picking strategies in an aisle-based system (like single-order-pick, sort-while-pick, and
pick-and-sort, pick batch size and the capacity of the picking and sorting operations). They
propose analytical tools for the planner to quickly evaluate various alternatives without
using simulation. Parikh and Meller (2008) focus on the problem of selecting between a
batch picking and a zone picking strategy. For this problem, they propose a cost model to
estimate the cost of each type of picking strategy. Chen et al. (2009) study the effect of
similar combinations and additionally take layout and order due times into account in
design choices.
A largely unsolved problem associated with zoning is to define the zone storage capacity (or
zone borders). More specifically, for a given layout, operational policies (routing, batching
method) and a storage assignment policy, the problem is to divide the picking area into zones
such that a certain objective is maximized or minimized. Example objectives include the system
throughput time (Petersen, 2002) and the load balance between zones (Jane and Laih, 2005, Yu
and De Koster, 2008, 2009 ). If we assume that all aisles are identical and all zones are of the
Page 6 of 34
http://mc.manuscriptcentral.com/tprs Email: [email protected]
International Journal of Production Research
123456789101112131415161718192021222324252627282930313233343536373839404142434445464748495051525354555657585960

For Peer Review O
nly
- 7 - 7
same size (an equal number of identical aisles), then the zone partitioning problem becomes the
problem of determining the optimal number of aisles constituting a zone. It should be mentioned
here that this problem has not been studied in the literature. The most related publication is
Petersen (2002), where the effects on the travel distance within a zone of the number of aisles in
the zone, of storage assignment methods, and of the number of items in the pick list are
investigated (by using simulation). However, the zone storage capacity is fixed (i.e. aisle length
varies with the number of aisles). Therefore, the problem essentially differs from the problem of
determining the number of zones (or zone storage capacity). In this study, we consider the
problem of finding the optimal number of zones to minimize the system throughput time for
batch-order picking and subsequent order sortation and packing (synchronized zone picking).
This system can be found in many companies; one of them serves as an example in the result
section. The rest of the paper is organized as follows. In the next section, we describe the order
picking operation. Then, we present a mathematical model for the problem of optimally
assigning items-to-routes in each zone in Section 3. We apply the model to find the optimal
number of zones for a mail-order company in Section 4. In Section 5 we discuss our model
limitations and extensions. Finally, in Section 6, we conclude and propose further research.
2. Order picking system
The schematic layout of the order picking system that we consider is shown in Figure 1.
Basically, we have two functional areas: one area for picking and one for packing. Items are
stored in rectangular bin-shelving storage racks. Order pickers pick the batched orders
simultaneously in different zones in the picking area. After an order picker has completed a pick
tour, the picked items are deposited on a conveyor and transported to the buffer area. When all
items of an order have been picked, they are sorted and packed.
Page 7 of 34
http://mc.manuscriptcentral.com/tprs Email: [email protected]
International Journal of Production Research
123456789101112131415161718192021222324252627282930313233343536373839404142434445464748495051525354555657585960

For Peer Review O
nly
- 8 - 8
• Batch generation: orders (requests from a customer consist of one or several items2)
arriving within a predetermined time interval are grouped together in one batch for joint
release to the order pickers. Within a batch, orders are spread over the zones based on the
storage locations of their items. They are consolidated later at the packing area.
• Picking operation: all batched items from the same zone are picked by one order picker or
a group of order pickers designated to the zone. An order picker can only be assigned to at
most one zone (zone picking). Because each order picker can only pick a limited number of
items in one pick route (e.g. due to the capacity limitation of the picking cart), the batched
items from a zone may require t pick shifts to be completed, where 1 t τ≤ ≤ , with
{ }maxzones
tτ = . (In the case of a single order picker per zone, the number of pick shifts
required is the number of pick routes.) The order picker starts a batch by obtaining a
picking cart and pick lists (each is a list of items to be picked in one pick route) from a
central location. The order picker then goes to the left-most aisle in the zone (see Figure 1)
to start a pick route. After picking all requested items, the order pickers place them on the
transportation conveyor, and go back to the left-most aisle to start a new pick route. The
transportation conveyor runs continuously to move all picked items to the buffer area.
• Packing operation: incomplete orders (an order is called incomplete if not all of its items
are picked) are buffered on the conveyor. Orders only enter the sorter when they are
complete. A group of packers manually pack the orders. After packing, orders are
transported to the shipping docks for delivery to the customers.
[Insert Figure 1 here]
With a given work force level (the number of workers at both picking and packing stages), the
objective of our study is to minimize the total time to complete a batch of orders (throughput
2 ‘Item’ here means stock keeping unit (SKU), in the literature it is also called ‘order-line.’
Page 8 of 34
http://mc.manuscriptcentral.com/tprs Email: [email protected]
International Journal of Production Research
123456789101112131415161718192021222324252627282930313233343536373839404142434445464748495051525354555657585960

For Peer Review O
nly
- 9 - 9
time). There are two decision problems that may impact the overall time to complete an order
batch.
At the execution level, the problem is to assign items to different routes in each zone (recall that
completion of a batch in one zone may require more than one pick route to be completed). The
item-to-route assignment and resulting sequence in which items are picked in each zone affects
later order consolidation. Assume for example, that we have two picking zones A and B, each
with one order picker, with pick capacity of six items per pick route. We have to complete three
orders: order 1 including five items in zone A and six items in zone B, order 2 including four
items in each zone, and order 3 including two items in zone A and one item in zone B. A pair
(X1� X2, Y1�Y2) denotes that order X1 is picked before order X2 in zone A and order Y1 is
picked before order Y2 in zone B. For this situation we have four possible pick sequences:
(Order1�Order2&3, Order1�Order2&3), (Order1�Order2&3, Order 2&3�Order1),
(Order2&3�Order1, Order1�Order2&3) and (Order 2&3�Order1, Order2&3�Order 1). The
second and third sequence will result in longer throughput times, because there is no order to
pack after the first pick shift. In the general case, when we have a set of orders, a given layout
(number of zones, the size of zones), and a work force level at both the picking and packing area,
we can formulate this problem as a mixed integer-linear program. We will discuss this in the
next section.
At the design level, we have to decide the number of zones into which the overall picking area
should be divided (in other words, how large the zone size should be). A larger number of zones
will result in a shorter picking time and consequently there will be a larger number of unpacked
orders waiting on the sorter to be packed after the last period of picking. Hence, a larger number
of zones reduces the picking time but on the other hand increases the packing time after the last
period of picking. When the zone size increases, the route time (to pick a given number of items)
also increases. Consequently, the throughput time may also increase. However, large zones
reduce the consolidation problem, because orders are spread over fewer zones. This makes it
Page 9 of 34
http://mc.manuscriptcentral.com/tprs Email: [email protected]
International Journal of Production Research
123456789101112131415161718192021222324252627282930313233343536373839404142434445464748495051525354555657585960

For Peer Review O
nly
- 10 - 10
simpler to arrange the pick sequence (item-to-route assignment in each zone) in such a way that
the number of complete orders arriving at the packing area (per time unit) increases. And thus,
the throughput time may be shorter. As an example, consider a warehouse with two aisles: one
with two items of order a and two items of order b, and the other with one item of both orders.
Pick capacity is three items per route. If the warehouse consists of two zones, one order picked in
the second aisle (zone) will always have to wait for completion until the second pick route in the
first aisle has finished. If the warehouse would consist of one zone, two routes can be picked
with complete orders a and b respectively, avoiding waiting for completion. The best zoning
scheme is the one that brings the best compromise between these two opposite effects. Changing
zone sizes and reallocating workers usually does not require investments and is supported in
many warehouse management systems. Therefore, also this problem can be considered short-
term.
Finding an optimal zone size linked with optimal allocation of workers over zones is an
interesting problem and can be encountered in many environments. Many food retail warehouses
employ such a zoned system, with equal zone sizes within a storage system in order to balance
workers. They work on a fixed departure schedule per group of stores and therefore release
orders based on this schedule.
In practice, the number of aisles in a warehouse is limited. Therefore, when we assume zones are
identical, we can choose from only a limited number of possible zone sizes (number of aisles per
zone). For example, if we have 20 aisles then we have the following zone-size possibilities: 1, 2,
4, 5, 10, and 20 aisles (with 20, 10, 5, 4, 2, and 1 zones respectively). Because of that, our
solution strategy is as follows. For each zoning scheme, we first solve the item-to-route
assignment problem. In a next step, we vary the zone sizes and choose the zone size that
provides the shortest overall throughput time. In the next section we formulate a mathematical
model for the item-to-route assignment problem and discuss a solution approach.
Page 10 of 34
http://mc.manuscriptcentral.com/tprs Email: [email protected]
International Journal of Production Research
123456789101112131415161718192021222324252627282930313233343536373839404142434445464748495051525354555657585960

For Peer Review O
nly
- 11 - 11
3. Mathematical model for the item-to-route assignment problem
We make the following assumptions:
• A zone is a set of adjacent entire (identical) aisles (i.e. one aisle can not belong to more
than one zone). All zones have the same number of aisles; this assumption is consistent
with common practice as it makes balancing the workload between zones easier.
• Picking is in batches of a given size. Each order picker picks his or her part of the batch
(that part that falls in the picker’s zone) in a number of routes. After picking, the items
need to be sorted and packed per order. Only complete orders can be packed, incomplete
orders are buffered on the sorter. Its capacity is sufficiently large to buffer all orders
needed.
• We assume the number of items an order picker picks in a pick route is identical for all
order pickers (except possibly for the last route in each zone). In practice, this number
would be determined by the capacity of the picking cart. We do not consider an unequal
allocation of workers to zones as this makes the problem more complex and for many
companies it is not really relevant. Within a given storage system, most companies try to
balance work over the zones. The simplest way to do this is by sizing the zones equally,
having the same number of workers per zone, and giving the zones an identical (on
average) pick profile. If one zone would contain more fast movers than another, an attempt
to balance zones by having more workers in this zone may lead to congestion.
• Order pickers always start from the left-most aisle (of the assigned zones). Within a zone,
the average route length depends only on the number of items per route, the zone size, the
storage assignment, and the routing method. We assume random storage.
• The travel time from one side of the aisle to the other is negligible, meaning that an order
picker can pick items from both sides of the aisles in a single pass. No additional time is
needed to reach the higher-level storage locations in an aisle.
Page 11 of 34
http://mc.manuscriptcentral.com/tprs Email: [email protected]
International Journal of Production Research
123456789101112131415161718192021222324252627282930313233343536373839404142434445464748495051525354555657585960

For Peer Review O
nly
- 12 - 12
• Multiple order pickers can work in one zone at the same time; traffic congestion is
negligible.
• Routes between order pickers in different zones are synchronized; they start
simultaneously. This is caused by the constant, identical number of picks per route, in
combination with deterministic picking and travel speeds. In many companies, such
behavior is enforced by releasing orders in “waves” to the pickers to be able to better
control throughput times.
• The item transportation time on the conveyor ( ct ) between the picking and packing area is
a constant. The packing time per order is also constant.
• Incomplete orders are buffered. The buffer capacity is sufficiently large to buffer all orders
needed. Suppose after the first shift all items belonging to one specific order have not been
picked so far; the picked items of this order cannot yet be packed and have to wait on the
sorter until all the remaining items in that order have been picked.
Data
q the maximum number of items that an order picker can pick in a pick route.
a number of aisles per zone
L length (in travel time units) of a storage aisle
bw centre-to-centre distance (in travel time units) between two consecutive storage aisles
st set-up time of a pick route
ct transportation (conveyor) time
pir picking rate (number of items per time unit that an order picker can pick). It is identical
and constant for all order pickers.
par overall -constant- packing rate (number of orders per time unit). In the experiments, it
varies with the average order size.
Page 12 of 34
http://mc.manuscriptcentral.com/tprs Email: [email protected]
International Journal of Production Research
123456789101112131415161718192021222324252627282930313233343536373839404142434445464748495051525354555657585960

For Peer Review O
nly
- 13 - 13
kN number of order pickers in zone k
, , ,t i o k indices of period, item, order and zone
K set of zones
O set of all orders
oI set of all items in order o
kI set of all items in zone k
I set of all items, o k
o O k K
I I I∈ ∈
= =U U
Intermediate variables
τ the maximum number of required pick shifts in the zones, maxk
k Kk
I
qNτ
∈
=
.
),( aqT expected time needed to finish a pick route of q items (or picks) in a zone containing a
aisles and return to the left-most aisle of the assigned zone. It consists of four
components: travel time, setup time, picking time and correction time. (Note that the
number of items in the last pick route (in each zone) can be less than the route’s
capacity.) If the random storage assignment and the S-shape routing method are used,
then it can be calculated by the following deterministic expression (see Appendix A for
details):
( ) ( ) ( )1
1 1, 1 1 2 1 ,
q q qa
b s
i pi
i i qT q a La w i CR q a t
a a a r=
− = − − + − − + + +
∑ (1)
Decision variables
( )1 if item is picked in period 1...
0 otherwise
i t t τxti
==
1 if order has been completely picked in or before period ( 1... )
0 otherwiseto
o t ty
τ==
toTL total number of items of order o completely picked at the end of period t ( 1... )t τ=
Page 13 of 34
http://mc.manuscriptcentral.com/tprs Email: [email protected]
International Journal of Production Research
123456789101112131415161718192021222324252627282930313233343536373839404142434445464748495051525354555657585960

For Peer Review O
nly
- 14 - 14
tNCO number of newly completed orders in period t ( 1... )t τ=
tUCO number of complete (but unpacked) orders transferred from period t ( 1... )t τ= to period
t+1. In a period of length ctaqT +),( , we can only pack a limited number of complete
orders: ( ): , .c pa
P T q a t r = + .
tPAC Number of orders packed in period t ( 1... )t τ= . PPACt ≤
The whole batch is completed only when all orders have been packed. Therefore, the throughput
time, the overall time (ψ ) to complete a batch, is the summation of time required to pick all
items (the total picking time), the transportation (for all pick shifts) and the time needed to pack
all remaining unpacked orders after the last pick shift. The throughput time can be calculated by:
( ) ( ){ } ( ){ }1 , ,c M c paT q a t T q a t UCO rτψ τ= − + + + + (2)
where ),( aqT M is the longest pick-route time in period τ and Mq is the maximum number of
items which need to be picked from some zone in period τ . ),( aqT , for all periods 1,...,1 −= τt ,
is the time it takes to pick q items in a aisles. In the last period fewer items are picked and
consequently the maximum resulting picking time equals ),( aqT M .
Since the first two components in the objective function and pa
r are constant, minimizing ψ
also means minimizing UCOτ .We now can formulate the item-to-route assignment problem as
follows.
MODEL
Objective Min UCOτ
Such that
1
1ti
t
xτ
=
=∑ ( ), kk K i I∀ ∈ ∈ (3)
k
ti k
i I
x qN∈
≤∑ ( ), 1...k K t τ∀ ∈ = (4)
Page 14 of 34
http://mc.manuscriptcentral.com/tprs Email: [email protected]
International Journal of Production Research
123456789101112131415161718192021222324252627282930313233343536373839404142434445464748495051525354555657585960

For Peer Review O
nly
- 15 - 15
1 o
t
to ji
j i I
TL x= ∈
=∑∑ ( ), 1...o O t τ∀ ∈ = (5)
( )1 1o to toI TL M y− ≤ − ( ), 1...o O t τ∀ ∈ = (6)
1o to toI TL y− + ≤ − ( ), 1...o O t τ∀ ∈ = (7)
1M = { }max oo O
I∈
(8)
1
1 1
t t
t jo jo
o O j o O j
NCO y y−
∈ = ∈ =
= −∑∑ ∑∑ ( )1...t τ∀ = (9)
1 0PAC = (10)
tPAC P≤ ( )2...t τ∀ = (11)
1t tPAC UCO −≤ ( )2...t τ∀ = (12)
1t t t tUCO NCO UCO PAC−= + − ( )1...t τ∀ = (13)
0 0UCO = (14)
0t
UCO ≥ ( )1...t τ∀ = (15)
{ }, 0,1ti tox y ∈ ( ), 1... , ,ko O t i I k Kτ∀ ∈ = ∈ ∈ (16)
Constraint (3) ensures that each item is assigned to exactly one pick route. Constraint (4) is the
capacity constraint. It indicates that the maximum number of items that can be picked from zone
k by kN order pickers in one period cannot exceed the total capacity of the k
N order pickers.
Constraints (5)-(8) indicate that 1to
y = if order o is completed by the end of period t (meaning
that all items belonging to order o have been picked in or before pick shift t), and 0to
y =
otherwise. 1M is a large constant; we have taken the smallest possible value. Constraints (9)-
(15) indicate that the number of complete orders left over at the end of period t equals the
number of newly completed orders during period t plus the number of complete orders left over
from period t-1 minus the number of orders that have been packed in period t. The last constraint
defines the nonnegative and binary property of variables tix and to
y . The model is a mixed
Page 15 of 34
http://mc.manuscriptcentral.com/tprs Email: [email protected]
International Journal of Production Research
123456789101112131415161718192021222324252627282930313233343536373839404142434445464748495051525354555657585960
For Peer Review O
nly
- 16 - 16
integer-linear program. Constraints (5)-(16) keep track of the ‘inventory’ level after each period.
In Appendix B we prove the problem is strongly NP-complete.
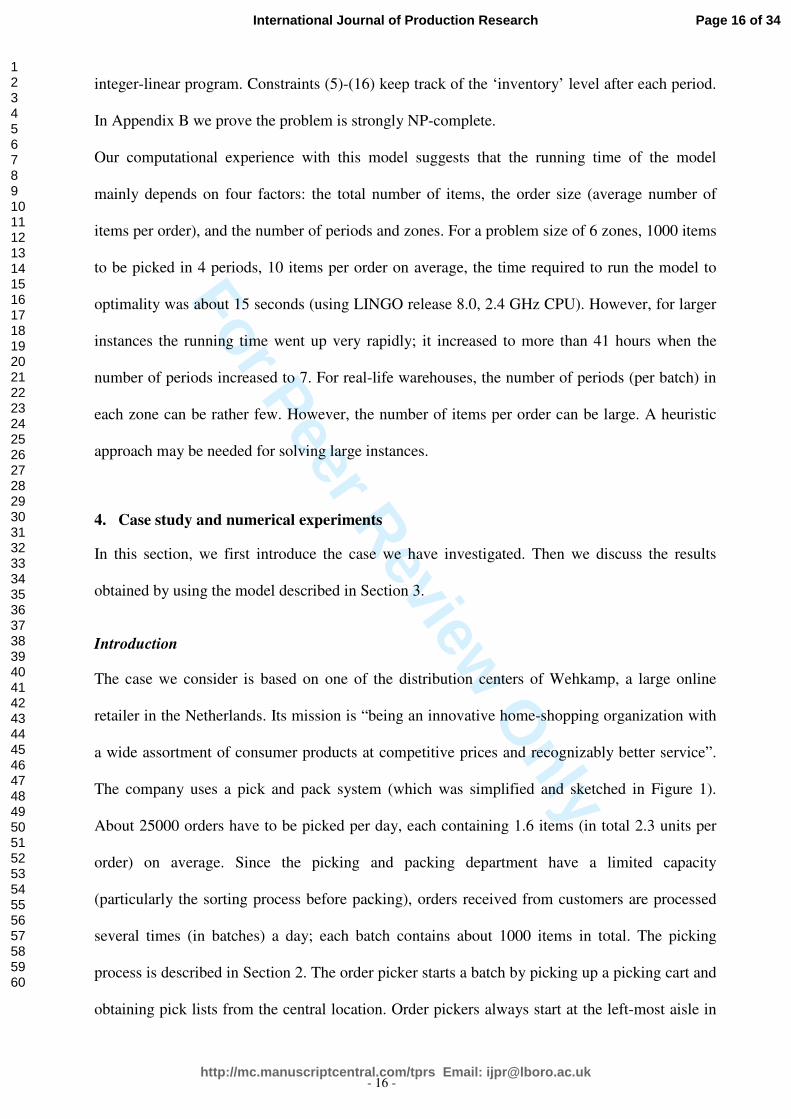
Our computational experience with this model suggests that the running time of the model
mainly depends on four factors: the total number of items, the order size (average number of
items per order), and the number of periods and zones. For a problem size of 6 zones, 1000 items
to be picked in 4 periods, 10 items per order on average, the time required to run the model to
optimality was about 15 seconds (using LINGO release 8.0, 2.4 GHz CPU). However, for larger
instances the running time went up very rapidly; it increased to more than 41 hours when the
number of periods increased to 7. For real-life warehouses, the number of periods (per batch) in
each zone can be rather few. However, the number of items per order can be large. A heuristic
approach may be needed for solving large instances.
4. Case study and numerical experiments
In this section, we first introduce the case we have investigated. Then we discuss the results
obtained by using the model described in Section 3.
Introduction
The case we consider is based on one of the distribution centers of Wehkamp, a large online
retailer in the Netherlands. Its mission is “being an innovative home-shopping organization with
a wide assortment of consumer products at competitive prices and recognizably better service”.
The company uses a pick and pack system (which was simplified and sketched in Figure 1).
About 25000 orders have to be picked per day, each containing 1.6 items (in total 2.3 units per
order) on average. Since the picking and packing department have a limited capacity
(particularly the sorting process before packing), orders received from customers are processed
several times (in batches) a day; each batch contains about 1000 items in total. The picking
process is described in Section 2. The order picker starts a batch by picking up a picking cart and
obtaining pick lists from the central location. Order pickers always start at the left-most aisle in
Page 16 of 34
http://mc.manuscriptcentral.com/tprs Email: [email protected]
International Journal of Production Research
123456789101112131415161718192021222324252627282930313233343536373839404142434445464748495051525354555657585960

For Peer Review O
nly
- 17 - 17
the zone, and follow the S-shape routing method. The picked items are dropped on the
transportation conveyor, which conveys them to the packaging area. At the packaging area,
complete orders are sorted automatically by packing destination station and then manually per
order, while items that belong to incomplete orders are buffered until they are complete (see
Figure 1). In this case, all the buffering takes place at the packing station. When an order at the
packing station is complete, a light indicator turns on to signal the packers that packaging can
start.
As previously discussed, the zone size may strongly influence the system throughput time.
Therefore, it is a crucial decision for the manager to decide how large zones should be, or,
equivalently, how many zones the pick area should be divided into, so that the throughput time
of the system is minimized. In the next section, we will use the model of Section 3 to answer this
question for the case.
Numerical experiments and results
Table 1 shows the current operational data as well as the size of the picking area. The company
has 36 storage aisles and uses 18 order pickers. Therefore, there are 6 possible zoning schemes
(see Table 2). The company uses large, specially designed picking carts that can contain about 40
line items. Arriving orders vary in size, however, the packing rate only depends on the average
order size (average number of items per order) and the average packing time per unit; we
estimated them at 8, 3, 1 and 0.5 order(s) per minute for order sizes of 1.6, 5, 10, and 20 items
respectively.
[Insert Table 1 here]
In order to determine the optimal number of zones, we carried out a number of experiments. We
considered four pick-list sizes (10, 20, 30 and 40 items per pick route), and four order sizes (1.6,
5, 10, and 20 items per order on average). Combining this with 6 zoning schemes, we have 96
scenarios in total, including the current situation (18 zones, 1.6 items per order, maximum 40
items per pick route).
Page 17 of 34
http://mc.manuscriptcentral.com/tprs Email: [email protected]
International Journal of Production Research
123456789101112131415161718192021222324252627282930313233343536373839404142434445464748495051525354555657585960

For Peer Review O
nly
- 18 - 18
[Insert Table 2 here]
An order batch was generated as follows. We fixed the number of items per batch. Next, for each
item, a storage location (in one of the 36 aisles) and an order (to which the item belongs, from 1
toκ ) were randomly drawn from respective uniform distributions. The average order size was
controlled by adjustingκ : ( )[ ]items#111orders# κκ −−≈ . After solving the item-to-route
assignment problem mentioned in Section 3 for each batch-run, we calculated the average
throughput time value for the scenario. The average travel time per pick route can be calculated,
based on the zone size, the number of items per route, and the routing method used. In our case,
the S-shape method is used and the route time is calculated by using formulation (1). The route
times for the different pick-list and zone sizes are tabulated in Appendix C.
We used LINGO (version 8.0) to solve the item-to-route assignment problem (discussed in
Section 3). For each scenario, we generated 10 order batches. Thus, each throughput time in
Table 3 represents the average of 10 runs. We could get optimal solutions in 72 scenarios out of
96, for all 10 runs (2.4 MHz Pentium CPU). For the remaining 24 scenarios, we found the
optimal solutions in 50% of the 10 runs depending on the order batch. It means that for these 24
scenarios each number representing the throughput time in table 3 is the average of both optimal
and truncated solutions.
The gap between the feasible solution and the best lower bound provided by LINGO after about
5 minutes of running is small (less than on average 5% for small, medium, and large order sizes).
10% is the largest gap we found between a feasible solution and the lower bound, meaning the
gap between a feasible solution and the optimal one is smaller. The results of the experiments are
presented in Table 3, where the truncated solutions are printed bold and italic.
[Insert Table 3 here]
Figure 2(a) shows the impact of pick list size on average order throughput time with different
zone settings. It appears from Figure 2 that the average throughput time is a convex function of
Page 18 of 34
http://mc.manuscriptcentral.com/tprs Email: [email protected]
International Journal of Production Research
123456789101112131415161718192021222324252627282930313233343536373839404142434445464748495051525354555657585960

For Peer Review O
nly
- 19 - 19
the pick list size for a fixed number of zones and order size. This result is consistent with
findings of Chew and Tang (1999) and of Le-Duc and De Koster (2007) who considered a
single-block and two-block warehouse respectively. We can explain this behavior as follows.
There are mainly two elements that affect the average throughput time of the system. They are
overall picking time of a batch and the packing time (including waiting). When the pick list size
is small, the overall picking time is small, but the arrival rate of picked but unpacked orders to
the packing area becomes high the cumulative number of complete orders, which have to be
packed in the last period when the picking is completed, will grow (potentially) - leading to high
utilization of servers in packing area and long packing time. In contrast, when the pick list size is
large, the overall traveling time and the resulting picking time of orders are large, but the
packing time in the last period can be small. Thus, there exists a trade-off between picking time
and packing time when increasing the pick-list size. This trade-off indicates that the optimal pick
list size exists.
[Insert Figure 2 here]
Figure 2(b) shows that for a given order size, the average throughput time decreases and then
increases with an increasing pick list size. The reason for this phenomenon can be explained as
follows: with an increasing pick list size the consolidation time decreases sharply at first. Beyond
the minimum point, the increase of traveling and therefore picking time dominates the reduction
of consolidation time, and leads to an increase of average throughput time.
Table 3 shows that for the current demand situation (1.6 items per order on average and pick list
size of 40) the 18-zone configuration gives the shortest throughput time for the system3. In
conclusion, the company already uses the optimal zone configuration, which has been found by
experimentation.
3 the 18-zone option would even become more favorable if we take aisle congestion into account; in an 18-zone
configuration, each zone has only one order picker, thus it is free from the travel congestion.
Page 19 of 34
http://mc.manuscriptcentral.com/tprs Email: [email protected]
International Journal of Production Research
123456789101112131415161718192021222324252627282930313233343536373839404142434445464748495051525354555657585960

For Peer Review O
nly
- 20 - 20
Nevertheless, if the company were not using the optimal configuration, they could move to the
optimal configuration at no cost. Assuming the number of pickers is fixed regardless of the
zoning configuration and also the packing rate is constant, changing the zoning scheme is only a
matter of dividing the pickers to the zones differently and defining a new pick list for each
picker.
The results show that throughput time is not a convex function of the number of zones. However,
as the number of potential zone configurations is small, it is still possible to find the optimal
configuration rapidly, for a given order size and pick list size.
5. Model limitations and extensions
In this section, we discuss some limitations of our model and possible extensions. A first main
limitation of the model is we assume zones are identical. This is usually (approximately) true
within a single storage system (rack system), but sometimes picks come from different storage
systems which operate in different ways. Zones in different systems are not necessarily balanced.
In that respect our model gives an optimistic estimate, as unbalanced systems will have longer
lead times.
In the current situation, random storage and S-shape routing are used. However it is possible to
use other storage and routing strategies as long as routes are synchronized. This will only impact
the travel time ),( aqT to pick a route of q items in a aisles. Closed-form expressions for class-
based storage exist (Le-Duc and De Koster, 2005), however, they are somewhat less accurate
and more complicated. In addition, turnover-based storage or other routing policies do not bring
many advantages if the batch size is relatively large and when a is small. We can compare
),( aqT with the throughput time for class-based storage and S-shape routing using the website
http://www.fbk.eur.nl/OZ/LOGISTICA/ShelfArea.html4.
4 This site only works with Firefox.
Page 20 of 34
http://mc.manuscriptcentral.com/tprs Email: [email protected]
International Journal of Production Research
123456789101112131415161718192021222324252627282930313233343536373839404142434445464748495051525354555657585960

For Peer Review O
nly
- 21 - 21
The results are shown in Table 4. To finish a pick route of q items (with q relatively large; in our
case at least 10 items) the picking time under across-aisle class-based storage is the same or even
longer compared to random storage. For within-aisle class-based storage the total picking time is
shorter in some cases and in some cases it is longer (e.g for q=40, number of aisles/picker=3 the
traveling time of within–aisle class-based storage is longer while for the same pick-cart capacity
and number of aisles/picker=6 it is shorter). In the case company, the zones consist of 2 aisles
and random storage is used in combination with S-shape travel. Table 4 shows other storage
policies do not bring any advantage.
[Insert Table 4 here]
Though we found the optimal solutions for most scenarios investigated, it does not guarantee that
we can find a ‘good’ solution for the item-to-route assignment problem when the problem size
increases (i.e. more aisles, periods, items). We may obtain better quality solutions using
Lagrangean relaxation (LR). The constraints that complicate the solution of the model are
constraints (4), the capacity constraints. By relaxing constraints (4) by introducing a set of non-
negative Lagrange multipliers | |( )tk Kτλ λ ×= we obtain a Lagrangean relaxed model as follows:
1
min ( )k
tk ti k
t k K i I
x qNτ
ψ λ= ∈ ∈
+ −∑∑ ∑,
(17)
subject to Constraints (3) and (5-16).
The question left is how to find | |( ) 0tk Kτλ × ≥ that can provide a good (i.e. close to optimal)
solution. The sub-gradient method may be used here to update | |( ) 0tk Kτλ × ≥ .
The proposed model can also be used to minimize the number of pickers (a good proxy for
operational cost) for a given allowed throughput time and packing rate (i.e. number of packers).
The following algorithm enumerates all possible zone configurations and chooses the
configuration with the smallest number of pickers subject to a given allowed throughput time
(ψmax). S is a set of all possible zoning schemes (assuming all zones have equal size). s
N is the
Page 21 of 34
http://mc.manuscriptcentral.com/tprs Email: [email protected]
International Journal of Production Research
123456789101112131415161718192021222324252627282930313233343536373839404142434445464748495051525354555657585960

For Peer Review O
nly
- 22 - 22
number of pickers in each of the s zones. M is a big number in which a feasible solution is
assured subject to the allowed throughput time for 1s = (i.e. one zone).
* max{ }s S
s s∈
=
*
*
sN M=
for (1...max{ })s S
s S s∈
∈
for 1...s
N M=
if *
* *
s ssN s N<
obtain ( , )s
s Nψ by solving the model
if max( , )s
s Nψ ψ< *
s s←
*
*
ssN N←
end
end
end
end
output *s and *
*
sN .
For instance, for ψmax =120 minutes and the situation with 10 items per order and maximum 20
items per pick route, the result of the algorithm which minimizes the number of pickers (i.e. cost)
is * 6s = and *
6 3N = (see Table 3).
6. Concluding remarks
In this paper, we have elaborated the problem of choosing the right number of zones at a manual
pick-and-sort OP system. At the first phase, we formulated the problem of assigning items to
pick routes in each zone such that the throughput time is minimized, as a mixed-integer-linear
program. At the second phase, we used this problem as a tool for evaluating different zone-size
options to find the optimal one. We illustrated the method with the pick-and-sort order picking of
a distribution center of the one of an online retailer in the Netherlands.
Our results show that for a given order size, the average throughput time decreases and then
increases with an increasing pick list size. The throughput time is not convex in the number of
zones, for a given order size and pick list size. For our case company 18 zones, each consisting
of 2 aisles in combination with S-shape routing appears to yield the best results. In general the
method can easily be applied to companies with identical zones and synchronized batches. In
Page 22 of 34
http://mc.manuscriptcentral.com/tprs Email: [email protected]
International Journal of Production Research
123456789101112131415161718192021222324252627282930313233343536373839404142434445464748495051525354555657585960

For Peer Review O
nly
- 23 - 23
future work it may be interesting to take congestions in the aisles into account, for zones with
more than one order picker. Another interesting problem is to consider the effect of imbalanced
zones and non-synchronized release policies.
Appendix A Picking time estimation
Travel time consists of three components: travel time in the cross-aisles aisles, travel time within
the storage aisles, and travel time back to the left-most aisle of the zone (e.g. to start a new pick
route). As we assume that the order picker always starts a pick route from the left-most aisle of
the zone, the last component equals the cross-aisle travel time. With the S-shape routing method
and random storage, the average travel time within storage aisles can be estimated
by1
1 1
q
Laa
− − +
( ),CR q a , where the term in square brackets is 1 minus the probability that
a certain aisle does not contain pick items. The first term therefore estimates the travel time
within aisles, assuming all aisles are traversed entirely. ( ),CR q a is a correction time; it takes
into account the fact that from the last pick position (in the last visited aisle) the order picker has
to return to the head of the aisle (the transportation conveyor), instead of traversing it entirely.
Such a turn has to be made if and only if the number of visited aisles is odd. ( ),CR q a can be
estimated by (see Roodbergen, 2001):
( ) ( ):
, 2
1
q
g G odd
q
a g gCR q a X g L L
qg a
g
∈
= −
+
∑ ,
where ( )X g is 1 minus the probability that all q items are in less than g aisles
( { }|1 , is oddg G g a g∈ ≤ ≤ ), conditional on the fact that all q items in at most g specific aisles:
( ) ( )1 1
11 1
q
g j
j
g g jX g
g j g
− +
=
−= − − − ∑ .
Page 23 of 34
http://mc.manuscriptcentral.com/tprs Email: [email protected]
International Journal of Production Research
123456789101112131415161718192021222324252627282930313233343536373839404142434445464748495051525354555657585960

For Peer Review O
nly
- 24 - 24
If we number the aisles of a zone from 1 to a (from the left to the right), the cross-aisle travel
time can be estimated by ( )1
11
q qa
b
i
i iw i
a a=
− − −
∑ . Where 1
q qi i
a a
− −
is the probability
that q picks fall in aisles 1,...,i minus the probability that q picks fall in aisles 1,..., 1i − , and bw
is the travel time between two consecutive storage aisles (see Figure 1). Since the picker has to
return to his or her home base, we have to multiply it with a factor 2.
Finally, ( , )T q a is estimated by summing the above parts and adding setup time and pick time
as:
( ) ( ) ( )1
1 1, 1 1 2 1 ,
q q qa
b s
i pi
i i qT q a La w i CR q a t
a a a r=
− = − − + − − + + +
∑ ����
It is possible to derive approximate closed-form expressions for class-based storage and S-shape
routing (Le-Duc and De Koster, 2005 ), or for other routing policies (returns or largest gap).
However, these expressions are more complicated for class-based storage and less accurate in
most cases for non S-shape routing and in view of the rather large number of picks per route in
the case of batch picking, S-shape usually gives shorter routes than these other heuristics. This
can readily be checked by using the website www.fbk.eur.nl/OZ/LOGISTICA
Page 24 of 34
http://mc.manuscriptcentral.com/tprs Email: [email protected]
International Journal of Production Research
123456789101112131415161718192021222324252627282930313233343536373839404142434445464748495051525354555657585960

For Peer Review O
nly
- 25 - 25
Appendix B
In order to show our problem is strongly NP-complete we only consider the objective function
and constraints (3) and (4). If we prove that this adapted problem is strongly NP-complete then
our more complex problem would also be strongly NP-complete. We construct a special case of
the problem with only 1 zone, 3m orders, and 1 order picker. Let the set of orders be
{ }maaaA 321 ,...,,= , the capacity of the picking cart is q≥3, and the number of lines per order s(ai)
is between 4/q and 2/q , and∑ ∈=
Aa ii
mqas )( .
Constraints (3) and (4) now translate into the following question:
Question: Can A be partitioned into m disjoint sets A1, A2,…, Am such that, for mj ≤≤1 ,
∑ ∈=
ji Aa i qas )( (note that each jA must therefore contain exactly three orders from A)?
We need to make two steps:
(1) Show that the problem belongs to NP.
(2) Show that a strongly NP-complete problem reduces to our problem.
To demonstrate (1) it suffices to remark that a nondeterministic algorithm can check in
polynomial time whether a given solution is feasible (i.e. whether ∑ ∈=
ji Aa i qas )( for all j).
To demonstrate (2) we remark the above formulation exactly matches the 3-Partition problem in
the paper by Garey and Johnson (1975), which is known to be strongly NP-complete.
Page 25 of 34
http://mc.manuscriptcentral.com/tprs Email: [email protected]
International Journal of Production Research
123456789101112131415161718192021222324252627282930313233343536373839404142434445464748495051525354555657585960

For Peer Review O
nly
- 26 - 26
Appendix C Average route time (in minutes) with different zone and pick-list sizes
Pick-list
size 1 zone 2 zones 3 zones 6 zones 9 zones 18 zones
1 7.29 5.79 5.29 4.79 4.63 4.46
2 9.65 7.63 6.94 6.22 5.94 5.54
3 11.46 9.13 8.30 7.33 6.88 6.15
4 13.07 10.53 9.59 8.40 7.76 6.61
5 14.52 11.78 10.72 9.30 8.53 7.02
6 15.93 13.00 11.81 10.10 9.18 7.41
7 17.25 14.14 12.82 10.84 9.74 7.79
8 18.54 15.23 13.78 11.53 10.24 8.16
9 19.78 16.28 14.68 12.17 10.70 8.54
10 20.99 17.29 15.54 12.76 11.13 8.92
11 22.16 18.25 16.36 13.32 11.54 9.29
12 23.32 19.19 17.13 13.83 11.94 9.67
13 24.44 20.09 17.88 14.32 12.33 10.04
14 25.54 20.96 18.59 14.78 12.72 10.42
15 26.62 21.80 19.28 15.22 13.10 10.79
16 27.67 22.61 19.94 15.65 13.49 11.17
17 28.71 23.40 20.58 16.06 13.86 11.54
18 29.72 24.17 21.19 16.47 14.24 11.92
19 30.72 24.92 21.79 16.87 14.62 12.29
20 31.69 25.64 22.36 17.26 15.00 12.67
21 32.65 26.35 22.92 17.65 15.37 13.04
22 33.60 27.03 23.47 18.04 15.75 13.42
23 34.52 27.70 24.00 18.42 16.12 13.79
24 35.43 28.35 24.52 18.80 16.50 14.17
25 36.33 28.99 25.03 19.18 16.87 14.54
26 37.21 29.62 25.52 19.56 17.25 14.92
27 38.08 30.22 26.01 19.94 17.62 15.29
28 38.93 30.82 26.48 20.32 18.00 15.67
29 39.77 31.41 26.95 20.70 18.37 16.04
30 40.59 31.98 27.41 21.08 18.75 16.42
31 41.41 32.54 27.85 21.45 19.12 16.79
32 42.21 33.09 28.29 21.83 19.50 17.17
33 43.00 33.63 28.73 22.20 19.87 17.54
34 43.77 34.17 29.16 22.58 20.25 17.92
35 44.54 34.69 29.58 22.96 20.62 18.29
36 45.29 35.21 30.00 23.33 21.00 18.67
37 46.04 35.71 30.41 23.71 21.37 19.04
38 46.77 36.22 30.82 24.08 21.75 19.42
39 47.50 36.71 31.22 24.46 22.12 19.79
40 48.21 37.20 31.62 24.83 22.50 20.17
Page 26 of 34
http://mc.manuscriptcentral.com/tprs Email: [email protected]
International Journal of Production Research
123456789101112131415161718192021222324252627282930313233343536373839404142434445464748495051525354555657585960

For Peer Review O
nly
- 27 - 27
References
Caron, F., Marchet, G. and Perego, A. (1998) Routing policies and COI-based storage policies in
picker-to-part systems. International Journal of Production Research, 36, 713-732.
Caron, F., Marchet, G. and Perego, A. (2000) Optimal layout in low-level picker-to-part systems.
International Journal of Production Research, 38, 101-117.
Chen, C.M., Gong, Y., De Koster, M.B.M. and Van Nunen, J.A.E.E. (2010) A Flexible
Evaluative Framework for Order Picking Systems, Production and Operations
Management, 19(1), 70-82.
Chew, E.P. and Tang, L.C. (1999) Travel time analysis for general item location assignment in a
rectangular warehouse. European Journal of Operational Research, 112, 582-597.
Choe, K. and Sharp, G. P. (1991) Small parts order picking: design and operation.
http://www.isye. gatech.logisticstutorial/order/article.htm (Accessed: May 2005).
Choe, K., Sharp, G.P. and Serfozo, R.S. (1993) Aisle-based order pick systems with batching,
zoning and sorting, in Progress in Material Handling Research: 1992, The Material
Handling Institute of America, Charlotte, NC, pp. 245-276.
De Koster, R., Van der Poort, E.S. and Roodbergen, K.J., (1998) When to apply optimal or
heuristic routing of order pickers, in: Fleischmann, B. et al., Advances in Distribution
Logistics, Springer, Berlin, 375-401
De Koster, R. and Van der Poort, E.S. (1998) Routing order pickers in a warehouse: a
comparison between optimal and heuristic solutions. IIE Transactions, 30, 469-480.
De Koster, R., Van der Poort, E.S. and Wolters, M. (1999) Efficient order batching methods in
warehouse. International Journal of Production Research, 37, 1479-1504.
De Koster, R., Le-Duc, T. and Roodbergen, K. J. (2007). Design and control of warehouse order
picking: a literature review. European Journal of Operational Research, 182(2), 481-501.
Dekker, R., De Koster, R., Roodbergen, K.J. and Van Kalleveen, H. (2004) Improving Order-
Picking Response Time at Ankor's Warehouse. Interfaces, 34, 303-313.
Page 27 of 34
http://mc.manuscriptcentral.com/tprs Email: [email protected]
International Journal of Production Research
123456789101112131415161718192021222324252627282930313233343536373839404142434445464748495051525354555657585960

For Peer Review O
nly
- 28 - 28
Elsayed, E.A. and Lee, M.K. (1996) Order processing in automated storage/retrieval systems
with due dates. International Journal of Production Research, 28, 567-577.
Elsayed, E.A., Lee, M.K., Kim, S. and Scherer, E. (1993) Sequencing and batching procedures
for minimizing earliness and tardiness penalty or order retrievals. International Journal of
Production Research, 31, 727-738.
Gademann, A.J.R.N., van den Berg, J.P. and van der Hoff, H.H. (2001) An order batching
algorithm for wave picking in a parallel-aisle warehouse. IIE Transactions, 33, 385-398.
Gademann, N. and van de Velde, S. (2005) Batching to minimize total travel time in a parallel-
aisle warehouse. IIE Transactions, 37, 63-75.
Garey, M.R. and Johnson, D.S. (1975) Complexity results for multiprocessor scheduling under
resource constraints. SIAM Journal on Computing, 4(4), 397-411.
Gibson, D.R. and Sharp, G.P. (1992) Order batching procedures. European Journal of
Operational Research, 58, 57-67.
Goetschalckx, M. and Ashayeri, J. (1989) Classification and design of order picking systems.
Logistics World, June, 99-106.
Goetschalckx, M. and Ratliff, D.H. (1988) Order picking in an aisle. IIE Transactions, 20, 531-
562.
Gue, K. R., Meller, R. and Skufca, J. D. (2006). The effects of pick density on order picking
areas with narrow aisles. IIE Solutions 38: 859-868.
Hausman, W.H., Schwarz, L.B. and Graves, S.C. (1976) Optimal storage assignment in
automatic warehousing systems. Management Science, 22, 629-638.
Heskett, J.L. (1964) Putting the cube-per-order index to work in warehouse layout. Transport and
Distribution Management, 4, 23-30.
Hwang, H., Baek, W. and Lee, M. (1988) Cluster algorithms for order picking in an automated
storage and retrieval system. International Journal of Production Research, 26, 189-204.
Page 28 of 34
http://mc.manuscriptcentral.com/tprs Email: [email protected]
International Journal of Production Research
123456789101112131415161718192021222324252627282930313233343536373839404142434445464748495051525354555657585960

For Peer Review O
nly
- 29 - 29
Jane, C.C. and Laih, Y.W. (2005) A clustering algorithm for item assignment in a synchronized
zone order picking system. European Journal of Operational Research, 166(2), 489-496.
Le-Duc, T. and De Koster, R. (2003) An approximation for determining the optimal picking
batch size for order picker in single aisle warehouses, in Progress in Material Handling
Research: 2002, The Material Handling Institute of America, Charlotte, North Carolina,
pp. 267-286.
Le-Duc, T. and De Koster, R. (2005) Travel distance estimation and storage zone optimization in
a two-block class-based storage strategy warehouse. International Journal of Production
Research 43(17), 3561-3581.
Le-Duc, T. and De Koster, R. (2007). Travel time estimation and order batching in a 2-block
warehouse. European Journal of Operational Research, 176, 374-388.
Mellema, P.M. and Smith, C.A. (1988) Simulation analysis of narrow-aisle order selection
systems, in Proceedings of the 1988 Winter Simulation Conference, pp. 597-602.
Parikh, P.J. and Meller, R.D. (2008) Selecting between batch and zone order picking strategies in
a distribution center. Transportation Research Part E: Logistics and Transportation
Review, 44E(5), 696-719.
Parikh, P.J. and Meller, R.D. (2009) Estimating picker blocking in wide-aisle order picking
systems, IIE Transactions on Design & Manufacturing, 41(3), 232-246, 2009.
Petersen, C.G. (2002) Considerations in order picking zone configuration. International Journal
of Operations & Production Management, 27, 793-805.
Ratliff, H.D. and Rosenthal, A.S. (1983) Order picking in a rectangular warehouse: a solvable
case of the traveling salesman problem. Operations Research, 31, 507-521.
Roodbergen, K.J. (2001) Layout and routing methods for warehouses. PhD Thesis, RSM
Erasmus University, the Netherlands.
Roodbergen, K.J. and De Koster, R. (2001a) Routing methods for warehouses with multiple
cross aisles. International Journal of Production Research, 39, 1865-1883.
Page 29 of 34
http://mc.manuscriptcentral.com/tprs Email: [email protected]
International Journal of Production Research
123456789101112131415161718192021222324252627282930313233343536373839404142434445464748495051525354555657585960

For Peer Review O
nly
- 30 - 30
Roodbergen, K.J. and De Koster, R. (2001b) Routing order-pickers in a warehouse with a middle
aisle. European Journal of Operational Research, 133, 32-43.
Roodbergen, K. J. and Vis, I. F. A. (2006). A model for warehouse layout. IIE Transactions, 38,
799-811.
Rosenwein, M.B. (1994) An application of cluster analysis to the problem of locating items
within a warehouse. IIE Transactions, 26, 101-103.
Russell, M.L. and Meller, R.D. (2003) Cost and throughput modeling of manual and automated
order fulfillment systems. IIE Transactions on Design & Manufacturing, 35(7), 589-603.
Tompkins, J.A., White, J.A., Bozer, Y.A., Frazelle, E.H. and Tanchoco, J.M.A. (2003) Facilities
Planning, John Wiley & Sons, NJ.
Van Nieuwenhuyse, I. and de Koster, R. (2009), Evaluating order throughput time in 2-Block
warehouses with time window batching. International Journal of Production Economics,
121, 654 - 664.
Yu, M. and De Koster, R. (2008), Performance approximation and design of pick-and-pass order
picking systems. IIE Transactions, 40(11), 1054 - 1069
Yu, M. and De Koster, R. (2009), The impact of order batching and picking area zoning on order
picking system performance. European Journal of Operational Research, 198(2), 480-
490.
Page 30 of 34
http://mc.manuscriptcentral.com/tprs Email: [email protected]
International Journal of Production Research
123456789101112131415161718192021222324252627282930313233343536373839404142434445464748495051525354555657585960

For Peer Review O
nly
List of Figures
Figure 1 A pick and pack OP system
(a)
Page 31 of 34
http://mc.manuscriptcentral.com/tprs Email: [email protected]
International Journal of Production Research
123456789101112131415161718192021222324252627282930313233343536373839404142434445464748495051525354555657585960

For Peer Review O
nly
(b)
Figure 2 The impact of different pick list sizes on average throughput time for (a) different order
sizes and 3 zones and for (b) different number of zones and order size of 5 items
Page 32 of 34
http://mc.manuscriptcentral.com/tprs Email: [email protected]
International Journal of Production Research
123456789101112131415161718192021222324252627282930313233343536373839404142434445464748495051525354555657585960

For Peer Review O
nly
List of Tables
Table 1 Operational data
Operational data System parameters
Average number of items per batch 1000 Number of storage aisles 36
Average number of items per order 1.6
Max. number of items per route Aisle length (L) in seconds 60
(capacity or pick-list size) 40
Number of order pickers 18 Distance between two
Set-up time (s
t ) in seconds 180 consecutive aisles (b
w ) 5
Picking time per item (1pi
r ) in
seconds
5 in seconds
Packing rate (par ): 8, 3, 1 and 0.5 order(s) per 60 seconds for orders with 1.6, 5,
10, and 20 items on average respectively
Table 2 Possible zoning schemes
Number of
zones
Number of storage
aisles per zone
Number of order
pickers per zone
1 36 18
2 18 9
3 12 6
6 6 3
9 4 2
18 2 1
Deleted: order size
Page 33 of 34
http://mc.manuscriptcentral.com/tprs Email: [email protected]
International Journal of Production Research
123456789101112131415161718192021222324252627282930313233343536373839404142434445464748495051525354555657585960

For Peer Review O
nly
- 2 - 2
Table 3 Average throughput time (in minutes)
Order size
(items)
Pick-
list size 1 zone 2 zones 3 zones 6 zones 9 zones
18
zones Mean
10 152.80 133.96 124.94 132.79 113.54 106.37 127.40
20 110.62 105.40 103.62 103.06 97.78 97.00 102.91
30 111.02 110.16 108.14 106.26 100.11 100.68 106.06
40 116.09 114.71 111.64 110.01 103.66 102.73 109.81
Small (1.6)
Mean 122.63 116.06 112.09 113.03 103.77 101.70 111.55
10 153.04 134.36 127.72 106.48 112.72 99.71 122.34
20 110.38 98.41 92.31 85.87 86.04 84.75 92.96
30 98.18 97.22 95.31 88.44 88.79 87.66 92.60
40 103.21 101.69 98.93 92.25 92.36 89.77 96.37
Medium (5)
Mean 116.20 107.92 103.57 93.26 94.98 90.47 101.07
10 157.47 140.76 134.02 117.77 121.99 120.58 132.10
20 127.38 127.24 125.04 117.71 122.57 119.52 123.24
30 132.21 131.62 129.45 120.31 124.31 122.10 126.67
40 136.91 135.42 133.03 124.79 127.06 122.63 129.97
Large (10)
Mean 138.49 133.76 130.38 120.14 123.98 121.21 128.00
10 169.67 157.16 150.27 129.69 144.25 143.02 149.01
20 127.38 127.24 127.41 121.59 125.14 122.29 125.17
30 133.21 131.62 129.41 121.89 126.36 123.88 127.73
40 137.91 135.42 133.03 124.79 128.14 123.93 130.54
Very large
(20)
Mean 142.04 137.86 135.03 124.49 130.97 128.28 133.11
* Bold and italic values mean the truncated solutions
Table 4 Average travel time for different storage policies
Storage
Policy Random Within-aisle class based Across-aisle class based
Pick-
list size
(q)
10 20 30 40 10 20 30 40 10 20 30 40
2 aisles 35.4 35.4 35.4 35.4 35.3 35.4 35.4 35.4 35.4 35.4 35.4 35.4
3 aisles 61.6 66.6 68 68.8 55.3 65.3 68.4 69.6 68 70.1 70.4 70.5 Zone
size 6 aisles 106.3 118.7 119.8 120 90.7 104.6 111.5 116 111.1 119.5 120 120
Note: (1) Input values are as follows: aisle length:10.0, centre distance: 2.4, Cross aisles: 0, depot location: left,
speed inside and outside aisles: 0.7, additional aisle change time: 0.0, number of replications: 1000.
(2) Zone sizes and percentage of picks for within-aisle and across-aisle class based storage systems
are as follows: A items: 10% of the space, 60% of the picks; B items: 30% of the space, 30% of
the picks; C items: 60% of the space, 10% of the picks.
Page 34 of 34
http://mc.manuscriptcentral.com/tprs Email: [email protected]
International Journal of Production Research
123456789101112131415161718192021222324252627282930313233343536373839404142434445464748495051525354555657585960