Embed Size (px)
Citation preview

East Tennessee State UniversityDigital Commons @ East
Tennessee State University
Electronic Theses and Dissertations Student Works
8-2015
Determining the Critical Elements of Evaluation forUniversity Advancement Staff: Quantifiable andNonquantifiable Variables Associated withFundraising SuccessKrystal L. WilsonEast Tennessee State University
Follow this and additional works at: https://dc.etsu.edu/etd
Part of the Educational Leadership Commons
This Dissertation - Open Access is brought to you for free and open access by the Student Works at Digital Commons @ East Tennessee StateUniversity. It has been accepted for inclusion in Electronic Theses and Dissertations by an authorized administrator of Digital Commons @ EastTennessee State University. For more information, please contact [email protected].
Recommended CitationWilson, Krystal L., "Determining the Critical Elements of Evaluation for University Advancement Staff: Quantifiable andNonquantifiable Variables Associated with Fundraising Success" (2015). Electronic Theses and Dissertations. Paper 2565.https://dc.etsu.edu/etd/2565

East Tennessee State UniversityDigital Commons @ East
Tennessee State University
Electronic Theses and Dissertations
8-2015
Determining the Critical Elements of Evaluation forUniversity Advancement Staff: Quantifiable andNonquantifiable Variables Associated withFundraising SuccessKrystal L. Wilson
Follow this and additional works at: http://dc.etsu.edu/etd
This Dissertation - Open Access is brought to you for free and open access by Digital Commons @ East Tennessee State University. It has beenaccepted for inclusion in Electronic Theses and Dissertations by an authorized administrator of Digital Commons @ East Tennessee State University.For more information, please contact [email protected].

Determining the Critical Elements of Evaluation for University Advancement Staff:
Quantifiable and Nonquantifiable Variables Associated with Fundraising Success
A dissertation
presented to
the faculty of the Department of Educational Leadership and Policy Analysis
East Tennessee State University
In partial fulfillment
of the requirements for the degree
Doctor of Education in Educational Leadership
by
Krystal L. Wilson
August 2015
Dr. Hal Knight, Chair
Dr. Richard Manahan
Dr. Bethany Flora
Dr. James Lampley
Keywords: Fundraising success, university fundraising,
ROI, return on investment, fundraising effectiveness

2
ABSTRACT
Determining the Critical Elements of Evaluation for University Advancement Staff:
Quantifiable and Nonquantifiable Variables Associated with Fundraising Success
by
Krystal L. Wilson
As funds dwindle and costs rise university advancement staff have been given higher fundraising
goals to meet the needs. In addition, university advancement staff have received pressure to
review and lower the costs of fundraising to become more efficient (Drezner, 2011). To enable
university advancement staff to attain goals, advocate for resources, or enhance processes,
university advancement staff are challenged to measure their effectiveness. However, the
process of measuring university fundraising success is unclear as there are many variables to
consider and several ways to determine success. For this study the Delphi Technique (Hsu &
Sanford, 2007) was used with 3 rounds of questionnaires. Seventeen experts of fundraising
analytics were asked to identify both quantifiable and nonquantifiable variables that should be
included in a comprehensive model to determine success in university fundraising. Findings
include quantifiable measures such as return on investment, growth in giving reports, new and
recaptured donors, and fundraiser performance and activity metrics. In addition, findings include
nonquantifiable measures such as institutional and environmental forces were identified by the
participants as critical components to comprise in a comprehensive model. Further findings
include a variety of other metrics, both quantifiable and nonquantifiable, that were identified by
the participants as critical components to comprise in a comprehensive evaluation model.

3
Copyright © 2015
Krystal L. Wilson
All Rights Reserved

4
DEDICATION
To my daughter, may you understand that the lifelong journey of knowledge is of no
value unless it is put into practice.

5
ACKNOWLEDGEMENTS
I sincerely express my deepest appreciation to my committee chair Dr. Hal Knight and to
the committee members, Dr. Bethany Flora, Dr. Richard Manahan, and Dr. James Lampley, for
their unwavering guidance, encouragement, patience, and time.
I also would like to thank the participants in this study for the contribution of their
expertise and time. Your contributions made this study possible.
To my family, thank you for your encouragement, support, and sacrifices. Most of all, I
express gratitude to God for providing strength throughout this journey.

6
TABLE OF CONTENTS
Page
ABSTRACT .......................................................................................................................... 2
DEDICATION ...................................................................................................................... 4
ACKNOWLEDGEMENTS .................................................................................................. 5
LIST OF FIGURES .............................................................................................................. 10
Chapter
1. INTRODUCTION ......................................................................................................... 11
Problem Statement ..................................................................................................... 14
Conceptual Framework .............................................................................................. 15
Research Questions .................................................................................................... 16
Significance of the Study ........................................................................................... 17
Definition of Terms.................................................................................................... 18
Delimitations and Limitations.................................................................................... 19
Overview.................................................................................................................... 21
2. LITERATURE REVIEW ............................................................................................. 22
University Funding .................................................................................................... 22
University Fundraising............................................................................................... 23
The Costs ....................................................................................................... 29
The Return ..................................................................................................... 32
Measuring Success..................................................................................................... 33
Gains and Losses............................................................................................ 34
Return on Investment .................................................................................... 35
ROI and Fundraiser Performance .................................................................. 36
ROI and Key Performance Metrics ............................................................... 38

7
Summary .................................................................................................................... 40
3. RESEARCH METHODS .............................................................................................. 42
Purpose Statement ..................................................................................................... 42
Research Questions ................................................................................................... 42
Research Design ........................................................................................................ 43
Sampling ................................................................................................................... 45
Data Collecting and Recording ................................................................................. 46
Validity and Reliability ............................................................................................. 49
Data Presentation ....................................................................................................... 52
4. FINDINGS AND ANALYSIS ...................................................................................... 53
Demographics of the Panel ....................................................................................... 53
Survey Distribution and Response Rate ................................................................... 54
Construction and Methodology of Response Analysis: Round One ........................ 55
Research Question 1 ........................................................................................... 56
Return on Investment .................................................................................... 57
Fundraiser Activity and Performance ........................................................... 57
New and Recaptured Donors ........................................................................ 58
Number of Annual Fund Donors Transitioned to Major Gift Donors .......... 58
Alumni Participation Rate ............................................................................. 58
Research Question 2 ........................................................................................... 59
Research Question 3 ........................................................................................... 60
Research Question 4 ........................................................................................... 63
Research Question 5 ........................................................................................... 64
Research Question 6 ........................................................................................... 64
Summary of Round One ........................................................................................... 65
Construction and Methodology of Response Analysis: Round Two ........................ 66
Research Question 1 ........................................................................................... 66

8
Research Question 2 ........................................................................................... 68
Research Question 3 ........................................................................................... 69
Research Question 4 ........................................................................................... 70
Research Question 5 ........................................................................................... 70
Research Question 6 ........................................................................................... 71
Summary of Round Two ........................................................................................... 72
Construction and Methodology of Response Analysis: Round Three ...................... 72
Research Question 1 ........................................................................................... 73
Research Question 2 ........................................................................................... 73
Research Question 3 ........................................................................................... 73
Research Question 4 ........................................................................................... 74
Research Question 5 ........................................................................................... 74
Research Question 6 ........................................................................................... 75
Summary of Round Three ......................................................................................... 75
5. INTERPRETATION, CONCLUSIONS, AND RECOMMENDATIONS ................... 77
Review of the Study .................................................................................................. 77
Research Question 1 Conclusions ....................................................................... 77
Research Question 2 Conclusions ....................................................................... 78
Research Question 3 Conclusions ....................................................................... 79
Research Question 4 Conclusions ....................................................................... 79
Research Question 5 Conclusions ....................................................................... 80
Research Question 6 Conclusions ....................................................................... 81
Recommendations for Policy .................................................................................... 82
Recommendations for Practice ................................................................................. 82
Quantifiable Metrics ........................................................................................... 82
Nonquantifiable Metrics ..................................................................................... 83
Organization ........................................................................................................ 83

9
Recommendations for Further Research ................................................................... 85
REFERENCES ...................................................................................................................... 87
APPENDICES ....................................................................................................................... 93
Appendix A: Institutional Review Board Approval Letter ....................................... 93
Appendix B: Informed Consent Letter ...................................................................... 95
Appendix C: Round 1 Question 2 Responses ........................................................... 97
Appendix D: Round 1 Question 5 Responses ..................................................................100
Appendix E: Round 2 Question 2 Responses ...................................................................101
Appendix F: Round 2 Question 4 Responses ...................................................................105
Appendix G: Round 2 Question 5 Responses ..................................................................106
Appendix H: Round 2 Question 6 Responses ..................................................................108
Appendix I: Round 3 Question 2 Responses ....................................................................110
Appendix J: Round 3 Question 4 Responses ...................................................................114
Appendix K: Round 3 Question 5 Responses ..................................................................115
Appendix L: Round 3 Question 6 Responses ...................................................................117
VITA ............................................................................................................................................119
10
LIST OF FIGURES
Figure Page
1. Bar graph showing responses to Round 1 Question 1 .............................................. 56
2. Bar graph showing responses to Round 1 Question 3 ............................................... 60
3. Bar graph showing responses to Round 2 Question 1 .............................................. 67
4. Bar graph showing responses to Round 2 Question 3 .............................................. 69
5. Proposed comprehensive model to measure university fundraising effectiveness .... 85

11
CHAPTER 1
INTRODUCTION
Universities are one of the glories of civilization…To solicit funds is not to go, cap-in- hand, begging support for some marginal activity. It is, instead, to invite a friend to share
in the privilege of the greatest partnership of all—the quest for knowledge, on which our
present existence and our future well-being depend (Rhodes, 1997, p. xxiv)
Public universities are continuing to experience budget cuts, and the likelihood of any
improvement is doubtful, at least for any time soon. “States cut funding deeply after the
recession. The average state is spending $2,026 or 23 percent less per student than before the
recession” (Mitchell, Palacious, & Leachman, 2014, p. 1). If and when state funding will return
to its prior levels is uncertain. The American Association of State Colleges and Universities
(2013) suggested that public universities will continue to be fiscally-challenged,
While state revenues are likely to continue rebounding from the recession, state budgets
will continue to face short- and long-term structural imbalances due to growing Medicaid
costs, underfunded state pension programs, federal deficit reduction efforts, narrowing
tax bases, and a host of other demands on state revenues. (p. 3)
Due to the decrease in state funds, universities may become more reliant on other sources
of funding such as tuition. The National Center for Education Statistics (2013) reported that
“Between 2001–02 and 2011–12, prices for undergraduate tuition, room, and board at public
institutions rose 40 percent” (para. 24). However, increasing tuition to remedy the decreasing
state funding has its implications, as continuing to increase tuition could lead to a degree being
unaffordable or even inaccessible for students. As Stuart (2013) noted, “colleges can’t depend
too much on tuition increases with price-sensitive parents and students alike questioning the
value of a degree” (p. 20). Furthermore, because of the decreasing state funds and rising tuition

12
costs, the public university funding model appears to be changing. The previous model included
state and federal support, tuition, and endowments; as those sources have decreased while costs
have increased, universities must determine how to attain the needed funds (Speck, 2010).
Most institutions of higher education are in the do-more-with-less mode. Faculty and
staff have not had raises, and some have been furloughed. Yet the costs of higher
education continue to rise, including fixed costs for expenses like health insurance,
salaries, and the physical plant. So where is this money supposed to come from? For
many institutions, the answer is from private donors. (Drezner, 2011, p. xi)
Therefore, universities may rely more on university advancement staff to raise the money needed
to offset the decrease in state funding and rising operational costs. “Donor dollars can reduce
tuition dependency, enhance fiscal security, provide funding for programs that enhance campus
life and even transform a campus” (Proper, Caboni, Hartley, & Willmer, 2008, p. 35-36). With a
reliance on donations as a source of funding, university advancement staff are challenged to
measure efforts and fundraising effectiveness, to determine ways to increase fundraising success.
“More and more, an institution of higher education’s ability to achieve its vision and goals is
dependent on the state of its endowment, yearly grants (research or otherwise), annual fund
donations, and other development income” (Iarrobino, 2006, p. 141). However, university
advancement offices experience consistent turnover of staff, which causes universities to lose
“resources, not only in costs associated with personnel turnover, but also the loss of valuable
donor-professional relationships and ultimately, in the loss of gifts” (Iarrobino, 2006, p. 141).
University advancement offices need support from university leaders. Instead, nonprofits
often face discrimination in their fundraising success, such as an obsession with low overhead
(Pallotta, 2013). According to Stuart (2013), “trustees and institutional leaders require

13
development departments to employ more businesslike thinking as they help generate much-
needed revenue” (p. 20). WealthEngine (2013) found that fundraising stakeholders want to
measure the return on investment (ROI) of fundraising, given that “transparency is critical to the
cost side of the equation while return serves as a performance measuring stick” (p. 16). To better
communicate results and advocate for university advancement, Collins (2013) suggested using a
return on investment (ROI) report, as ROI reports can “translate fundraising performance data
into a format that many business leaders can readily understand. While they might have
difficulty grasping the nuances between “soft credit” and “solicitor credit,” they are quite
comfortable with information presented in such a fashion” (p. 1). If university leaders do not
understand the variables and results of fundraising, that lack of understanding may cause
university leaders to have unrealistic expectations for university advancement (Gerrity, 2003).
Thus, it is critical for university advancement staff to demonstrate effectiveness to advocate for
resources, funds, or achieve increasing fundraising goals.
The process of measuring fundraising effectiveness is more than ROI, as there are more
benefits in fundraising than the dollars raised (Hiles, 2010). John W. Welty, associate vice
president for advancement at Pennsylvania’s Lehigh University, suggested a more holistic
approach to measure fundraising success using “internal and peer-group performance
comparisons, tracking movement toward multiple targets, and monitoring gift officer progress
along the solicitation process” (as cited in Stuart, 2013, p. 21). Furthermore, according to Levis
and Williams (2011) the Association of Fundraising Professionals developed growth in giving
reports to review the amount of new gifts acquired from new donors, amount of new gifts
recaptured from lapsed donors, and amount of gifts renewed from last year’s donors to determine
fundraising success. “To understand what is really happening in your organization, it is

14
necessary to analyze both the fundraising gains and the fundraising losses from one year to the
next so that you and your organization’s leadership can make growth-oriented decisions about
both fundraising budgets and strategies” (Levis & Williams, 2011, p. 36-37). In addition, to
evaluate fundraising effectiveness and efficiency some institutions such as Johns Hopkins
University use many metrics including ROI (Stuart, 2013). To determine fundraising
effectiveness, there are many variables to consider and a lack of comparable data; therefore,
clarity is needed (Kroll, 2012).
Problem Statement
Public universities continue to see reductions in state support, and the question of when
state funding will return to prior levels of support remains uncertain. Thus, university leaders
depend on other sources of funding such as tuition. Increasing tuition to remedy the decrease in
state funds could lead to a degree becoming more unaffordable or inaccessible for students.
Therefore, universities may be reliant on university advancement to procure charitable donations
for the university to preserve and improve its mission. As funds dwindle and costs rise
university advancement staff may be given higher fundraising goals to meet the needs. In
addition, university advancement staff may receive pressure to review costs and efforts as well as
pressure to lower the costs of fundraising to be more efficient. In order to enable university
advancement staff to attain goals, advocate for resources, or to enhance processes, university
advancement staff are challenged to measure effectiveness. However, the process of measuring
university fundraising success is unclear with multiple variables to consider and several ways to
determine success. With several metrics to choose from and the uncertainty regarding which
metrics are the most relevant, university advancement staff may struggle to capture a complete or
accurate picture of fundraising effectiveness.

15
The purpose of this qualitative study was to determine the critical quantifiable and
nonquantifiable metrics to measure effectiveness of university fundraising and understand how
expert fundraising analysts implement, analyze, and prioritize those metrics. For the purpose of
this study the quantifiable metrics of university fundraising success were defined as return on
investment (WealthEngine, 2013), growth in giving reports (Levis & Williams, 2011), fundraiser
activity and performance (Collins, 2013), number of new and recaptured donors (WealthEngine,
2013), number of annual fund donors transitioned to major gift donors (Stuart, 2013), and alumni
participation rate (Stuart, 2013). Nonquantifiable metrics of university fundraising success were
defined as the four types of intervening variable forces in fundraising: personal forces,
institutional forces, role forces, and environmental forces (Cook & Lasher, 1996). This study
may provide direction for university advancement staff to measure success and consequently
advocate, strategize, and improve processes.
Conceptual Framework
In this study the variables and the process of how expert fundraising analysts implement,
analyze, and prioritize the quantifiable and nonquantifiable metrics of university fundraising
success were explored. For this study the quantifiable metrics were defined as return on
investment (WealthEngine, 2013), growth in giving reports (Levis & Williams, 2011), fundraiser
activity and performance (Collins, 2013), number of new and recaptured donors (WealthEngine,
2013), number of annual fund donors transitioned to major gift donors (Stuart, 2013), and alumni
participation rate (Stuart, 2013). The quantifiable metrics are outlined in Chapter 2 of this study
with the review of literature.
The nonquantifiable metrics of university fundraising success were defined as the four
types of intervening variable forces in fundraising: personal forces, institutional forces, role

16
forces, and environmental forces (Cook & Lasher, 1996). The strengths of these forces,
identified by Cook and Lasher (1996) may change over time, and one of the forces usually
dominates the others that will vary from situation to situation. According to Cook and Lasher
(1996) each force is defined as follows,
Personal: the established habits, leadership styles, personality traits,
administrative and educational experiences, needs, attitudes, values, beliefs,
interpersonal skills, among other things
Role: self-imposed or self-created role expectations, and external expectations
Institutional: the established traditions, history, culture, norms, sanctions, taboos,
rituals, rewards, wealth, constituencies, capabilities, strengths and weaknesses,
market position, size, maturity, prestige, and quality of the governing board,
students, faculty, and alumni
Environmental: the capacity of the donor base; wealth and philanthropic tradition
of the local community, region and state; proclivity of the surrounding area to
natural disasters; unemployment rate; inflation rate; state of the economy; federal
tax policy; competition from other nonprofits; public opinion toward higher
education, etc. (p. 20)
Each of the aforementioned forces could impact and determine the nonquantifiable
variables of university fundraising success, thus may provide a holistic understanding and
determination of university fundraising success.
Research Questions
1. Which quantifiable measures (return on investment, growth in giving reports, fundraiser
activity and performance, number of new and recaptured donors, number of annual fund

17
donors transitioned to major gift donors, and alumni participation rate) do expert
fundraising analysts suggest to include in a comprehensive model to determine success in
university fundraising?
2. What other quantifiable measures do expert fundraising analysts suggest to include in a
comprehensive model to determine success in university fundraising?
3. Which nonquantifiable measures (personal forces, role forces, institutional forces,
environmental forces) do expert fundraising analysts suggest to include in comprehensive
model to determine success in university fundraising?
4. What other nonquantifiable measures do expert fundraising analysts suggest to include in
a comprehensive model to determine success in university fundraising?
5. How do expert fundraising analysts suggest a comprehensive model to determine success
in university fundraising be organized or segmented?
6. What further implications do expert fundraising analysts suggest for a comprehensive
model to determine university fundraising success?
Significance of the Study
This study is significant to university advancement staff and university leaders because
the results of this study may clarify the currently uncertain evaluation process of university
fundraising success. Furthermore, the participants in this study were asked to identify the
metrics, both quantifiable and nonquantifiable, to include in a comprehensive model to measure
university fundraising success. A comprehensive model may increase success of university
advancement staff by enabling a broader review of strengths and weaknesses to determine and
execute efforts to support or improve processes. WealthEngine (2013) noted that measuring
fundraising effectiveness can help those involved identify progress and weakness and explained

18
that by doing so it “makes it easier to make course corrections in a timely manner so that the
organization can maximize its fundraising success” (p. 6).
Definition of Terms
The following definitions were used for the purpose of this study:
1. Campaign: “an organized effort to raise a specific amount of money for a particular
purpose(s) in a specific amount of time” (Association of Fundraising Professionals, 2003,
p. 18)
2. Capacity: “the amount a prospect can give over a five-year pledge” (Grabau, 2012, p. 40).
3. Capital campaign: “an intensive fundraising effort to meet a specific financial goal within
a specified period of time for one or more major projects that are out of the ordinary, such
as the construction of a facility, the purchase of equipment, or the acquisition of
endowment” (Association of Fundraising Professionals, 2003, p. 20).
4. Comprehensive campaign: “integrates capital, annual, and planned gifts”… “and donors
are solicited for support of campaign objectives coinciding with their interests and
capabilities” (Worth, 2010, pg. 6).
5. Cost per dollar raised: “fundraising expenses divided by total contributions” (Association
of Fundraising Professionals, 2008, p. 8)
6. Fundraising Return on Investment: “total contributions divided by fundraising expenses,
multiplied by 100 for the percentage” (Association of Fundraising Professionals, 2008, p.
9).
7. Lapsed donor: “a donor who has given in a prior year, but not in the current year”
(WealthEngine, 2013, p. 19).

19
8. Net revenue: “sum of cash gifts and commitments, minus the amount spent on
fundraising” (WealthEngine, 2010, p. 15).
9. Planned giving: “a way for a donor to give an asset (cash, stock, bonds, real estate, family
business, antiques, etc.) by using a method (unitrust, bequest, deed, contract, etc.) that
will provide benefits to both the donor (in the form of charitable fulfillment, tax savings,
income, asset management, family protection, etc.) and to the institution (in the form of
funds now or in the future)” (Worth, 1993, p. 117).
10. Prospect: “any potential donor whose linkages, giving ability, and interests have been
confirmed” (Association of Fundraising Professionals, 2003, p. 100)
11. Recaptured donor: “a previously lapsed donor who gives again in the current year”
(WealthEngine, 2013, p. 19).
12. Restricted gifts: donations given to “where the donor indicates, usually through a legal
document called a “gift agreement,” how the gifts should be used” (Drezner, 2011, p. 6).
13. Return on investment: a performance measure to evaluate the benefit from an investment.
The formula typically used is
“ ROI = Net Revenue ”
Expense of Investment (WealthEngine, 2010, p. 14).
14. Unrestricted gifts: donations given to “where funds can be used at the university’s
discretion” (Drezner, 2011, p. 5).
Delimitations and Limitations
This study was delimited to the subset of national experts identified as expert fundraising
analysts for the purpose of this study. The expert fundraising analysts in this study were
recognized as experts based on criteria such as:
20
Possessed national recognition for work such as published books within the last
10 years or authored articles in related professional journals such as CURRENTS,
Connections, Philanthropy Journal or available through websites for the Council
for Advancement and Support of Education or the Association of Fundraising
Professionals;
Presented at international and national association conferences (Association of
Prospect Researchers for Advancement, Association of Fundraising Professionals,
DRIVE); or,
Received awards from international or national associations for work in
fundraising analytics.
This study was limited by the extent of expert knowledge represented by the expert
fundraising analysts who participated in this study.
In addition, this study was limited by the reliance on self-reported data from the expert
fundraising analysts. Nonetheless, educational research often uses self-reported data (Gonyea,
2005).
Furthermore, this study was limited by the nature of the Delphi Technique and the ability
to establish reliability. No studies have been conducted to compare if two or more expert panels
with the same criteria would develop the same consensus or result (Williams & Webb, 1994).

21
Overview
Chapter 1 includes an introduction to the study with an explanation of the importance of
measuring success in university fundraising and highlights the idea that there is more to
measuring success in university fundraising than looking at costs and total amount raised. This
chapter also contains the problem statement, significance of the study, research questions, a list
of defined terms, and delimitations and limitations.
In Chapter 2 a review of research is provided on the topics of university funding,
university fundraising, the costs, the return, and measuring success of university fundraising.
Chapter 3 contains a description of the Delphi Technique, as well as explanation for its
applicability to this study. Also, chapter 3 comprises the research questions, instrumentation,
sampling, data collecting and recording, data presentation, and how validity was established.
Chapter 4 contains the analysis of the study, and Chapter 5 includes the findings,
conclusions, and recommendations of the study.

22
CHAPTER 2
LITERATURE REVIEW
University Funding
Public universities are funded by state appropriations, tuition and fees, grants, and
charitable donations (Speck, 2010). Endowment income is also an alternative source of funding
even though public universities may have modest endowments (Barr & McClellan, 2011).
Furthermore, Barr and McClellan (2011) suggested that public universities’ endowments may
increase as state support decreases. Also, with the decline of state funding, tuition and fees have
increased, which may prove to be counterproductive. Speck (2010) noted, “the higher the tuition
and fees, the greater the probability that enrollment will decrease” (p. 9). Nevertheless, tuition is
a primary of funding for many public universities and, therefore, continues to rise. However, the
rise of tuition may be affected as some states have statutory restrictions on the price of tuition to
in-state residents (Barr & McClellan, 2011). In addition, negative trends such as inability to
raise the price of tuition, declining enrollments, and increasing regulatory and political pressure
to maintain or lower tuition are becoming stronger (Moody’s Investor Service, 2013).
Grants are an additional fund source for universities, which may also be limited as well as
competitive. Grants are an example of restricted revenue as they are to be used for a specific
purpose that is determined by the source of the funds (Barr & McClellan, 2011). Grants can be a
considerable source of income for research universities and “nonresearch grants… can benefit all
colleges and universities, but for the most part federal grants based on research productivity are
designed for institutions that produce doctoral students in the sciences” (Speck, 2010, p. 10).
Additionally, universities may use endowment income as an alternative revenue source.
Endowments derive from donations, bequests, investment returns, and invested surpluses from a
university’s operating budget (Johnson, 2010). As Lapovsky (2007) noted, “An endowment

23
offers a hedge against the volatility of other revenue sources and supplies a steady stream of
income to support the college or university” (p. 99). However, many public universities have
modest endowments, and some do not have an endowment at all (Barr & McClellan, 2011). For
those institutions that have endowments, most of them have conservative policies on the
percentage of revenue from their endowment to use toward funding the operating budget (Ernst
& Young, 2009).
Another source of funding is charitable donations, which can be given as unrestricted or
restricted gifts. Unrestricted gifts may be allotted at the discretion of the university, and
restricted gifts are for a certain area, program, or fund determined by the donor (Drezner, 2011).
Primarily, universities use three types of fundraising: annual giving, focused giving for a
particular project, and long-term campaigns for comprehensive university priorities and projects
(Barr & McClellan, 2011). Annual fund gifts are “unspecified gifts to be applied to the area of
most need at the institution” (Berry, 2014, p. 6). Major gifts are gifts of a significant amount that
can make a transforming impact on the organization (Sargeant & Jay, 2014). The comprehensive
campaign should include annual fundraising goals in addition to major gifts for capital projects
(Scales, 2008). Universities can use these gifts to conduct needed building maintenance,
construct new facilities, or overall sustain the mission of the university; all of which the
university might have had to place on hold or rescind due to the decrease in state appropriations
(Drezner, 2011).
University Fundraising
Philanthropy is an essential piece in funding the university. In the colonial period many
donations were given to colleges as “in kind” or what sometimes was called “country pay—
goods and services—simply because there was a lack of hard currency” (Thelin & Trollinger,

24
2014, p. 12). In addition, during this time period notable gifts were given for endowing
professorships such as Thomas Hollis’s endowed chair in divinity at Harvard University
(Drezner, 2011). In 1641 William Hibbens, Hugh Peter, and Thomas Weld journeyed from
Boston to England to raise money for Harvard College, and since then no university has survived
without raising money (Bernstein, 2014). “Philanthropy became increasingly important after the
colonial and revolutionary period because new political allegiances signaled an end to customary
government support from England” (Drezner, 2011, p. 16).
In 1861 Matthew Vassar founded Vassar College, a women’s college, and gave the
financial support to construct the first building (Bernstein, 2014). After the Civil War
philanthropy continued to impact higher education as other all-female colleges were established
such as Spelman College for African American women, and Bennett College, a coeducational
teachers’ college that later became all-female (Bernstein, 2014).
In the late 19th and early 20th centuries new industries formed and brought prosperity to
some individuals and families (Thelin & Trollinger, 2014). The largest gifts to higher education
during that time included:
$20 million from Leland and Jane Stanford in 1885, $3.5 million from Johns Hopkins in
1873, $34.7 million that John D. Rockefeller gave to the University of Chicago, the
Sterling bequest to Yale for $15 million in 1918, and Henry C. Frick’s bequest of $15
million to Princeton in 1919. (p. 20)
In addition, John D. Rockefeller founded the General Education Board in 1902 to support
southern private black colleges, and it became one of the most significant philanthropies in the
beginning of the 20th century (Bernstein, 2014). During this time, “philanthropy reinforced the

25
status quo of racial exclusion, while at the same time providing critical funds to institutions that
would educate new generations to challenge that status quo” (p. 36).
However, in 1917 the burden of federal income taxes began, and by 1920 large individual
gifts dwindled which led to financial challenges for many prominent colleges and universities
which could not meet their fundraising goals (Thelin & Trollinger, 2014). In 1919 Harvard led
in the era of professional fundraising as the institution hired a firm to administer the $15 million
endowment campaign, and then slowly organized fundraising was used in many other
institutions (Drezner, 2011).
Between the two World Wars philanthropy had a vital role as it enabled a selective
number of large private colleges and universities to become premier institutions that taught
leaders for business and government (Bernstein, 2014). For example, from 1923 to 1940, “out of
more than $100 million, approximately 75 percent of all philanthropic dollars went to only
thirty-six colleges and universities” (p. 62). In addition, business corporations began to
contribute to higher education, which was beneficial for all institutions (Thelin & Trollinger,
2014).
After World War II private philanthropy supported scientific and defense-related research
(Thelin & Trollinger, 2014). Furthermore, in 1949 The Rockefeller Foundation funded a
program to study different cultures in an effort to better understand one another and included
universities in the United States, France, Great Britain, Turkey, Canada, Germany, India, and
Japan (The Rockefeller Foundation, 2014). In the 1950s Henry Ford and Andrew Carnegie gave
through their foundations to colleges and universities to improve business and legal education
(Bernstein, 2014). “The 35 million the Ford Foundation invested in reforming business schools
and education between 1956 and 1966 and the findings of the Carnegie report were pivotal in

26
shifting business education toward rationalistic, quantitative research and training for managers”
(Bernstein, 2014, p. 46). In the 1960s and 1970s the Carnegie Corporation funded many
academic studies through the Carnegie Commission on the Future of Higher Education (Gose,
2013). During this “golden era” of higher education philanthropy, “Ford, Carnegie, the U.S.
Department’s Fund for the Improvement of Postsecondary Education, and others typically threw
out a general concept and looked for an accomplished institution or researcher to run with it”
(Gose, 2013, para. 6).
In the 1980s changes in state support led to the spread of large fundraising campaigns at
institutions such as The University of Virginia, which launched its first capital campaign in 1991
(Thelin & Trollinger, 2014). Over the course of the 1970s to the 2000s as needs and
opportunities for higher education expanded, the capital campaign also expanded to become the
comprehensive campaign that includes annual, capital, and planned gifts (Worth, 2010). In
addition, as the 2000s brought a recession, and “increased emphasis on development and private
fund-raising frequently was the favorite solution invoked by presidents and boards of trustees in
such situations where colleges sought to balance budgets, tend to shortfalls, and provide for
future growth” (Thelin & Trollinger, 2014, p. 33). The occurrence and scale of comprehensive
campaigns increased to ease the financial challenges (Worth, 2010). For example, in 2006
Cornell University and Columbia University each announced $4-billion goal for their campaigns;
similarly, University of Virginia announced a $3 billion goal for their campaign (Strout, 2006).
By the end of 2007, 11 public institutions were in campaigns of $1 billion or more (Breslow,
2007).
In 2009 the Obama administration announced strategic policy plans for college
completion, and foundations such as The Bill and Melinda Gates Foundation and The Lumina

27
Foundation emerged as “dominant philanthropic policy player[s] in higher education” with focus
on the process of higher education (Parry, Field, & Supiano, 2013). According to Strickland
(2009) the venture philanthropists are transforming higher education as they transformed the
business world, and “demand for measurable results, efficiency, and transparency” (p. 21). For
example, since 2006 The Bill and Melinda Gates Foundation has invested $472 million to
remake higher education, with goals to graduate more students in a smaller amount of time and
at lower costs (Parry et al., 2013). However, Frederick Hass, director of education policy studies
at the American Enterprise Institute, declared,
But the reality is that these things won’t change without philanthropy. The problems are
too complicated and the politics are too dogmatic at this point. We can’t solve it without
outside intervention. We’ll need smart people to invest in solutions that can help
illuminate the path forward. At its best, that's what philanthropy can do. (New York
Magazine, 2008, p. 6)
The structure of philanthropy in higher education has evolved over the last century.
University fundraising is often administered in the division of university advancement, and many
universities have established institutionally related foundations to guide the process. Hedgespeth
(2000) identified the five shared purposes of college or university foundations as:
To secure private gifts as a resource distinct from state and institutional resources;
To enlist and use key volunteers in philanthropic endeavors on behalf of the institution;
To engage prospective donors in the institution’s dream and aspirations, and steward their
investments of time and money;

28
To provide a vehicle for important college or university activities, ventures, and services,
such as acquiring real estate by gift or purchase that the institution itself cannot pursue (at
least not on a timely basis) because of statutory or regulatory restrictions; and
To strengthen the institution’s public image and create an environment conducive to
philanthropic support. (p. 3)
Furthermore, universities use institutionally related foundations “to facilitate the process of
acquiring, receiving, and processing gifts, and managing and investing those charitable
resources” (Holmes, 2010, p. 27). While some foundations operate as a component of the
institution, others operate autonomously (Holmes, 2010).
The name of the unit within the institution that is focused on university fundraising varies
from institution to institution and is often called university advancement, institutional
advancement, or development. Fundraising is to solicit gifts; however, in the 1920s the process
of fundraising became an on-going practice inclusive of the institution’s strategic goals and
development, thus coined the term development (Worth, 2010). In 1974 the Council for
Advancement Support of Education (CASE) was founded, and “institutional advancement” or
“advancement” was adopted as the accepted name of the university fundraising unit and included
communications and marketing, alumni relations, and other external relations jobs (p. 5). In this
study the term used is university advancement. Additionally, the office of university
advancement may vary at each university in its organizational structure, as some may be
centralized in one division or may be decentralized among each college, school, or program
(Drezner, 2011). University advancement offices may include alumni relations,
communications, cultural affairs, or other areas deemed appropriate by that particular institution.

29
Drezner (2011) concluded that no matter how university advancement is organized, the
fundraising principles remain the same.
University advancement and its foundation may also vary by university in their sources
of funding, as they cannot rely solely on institutional funding. Therefore, to fund and enable
university advancement offices and foundations, one or a combination of the following sources
may be used: gift taxes, management fees, unrestricted giving, revenues from real estate, and
earnings on cash holdings (Holmes, 2010). Each university advancement office, along with its
foundation, should determine the most beneficial sources to fund the costs of fundraising,
considering each office and foundation may have different needs and types of potential support
(Worth, 2010).
An important piece of university fundraising is the ‘campaign’, which is “an organized,
intensive fundraising effort…to secure extraordinary gifts and pledges… for a specific purpose
or programs…during a specific period of time” (Dove, 2000, p. 5). The formal period of a
campaign is 7 to 8 years (Worth, 2010). Capital campaigns were used before the 1970s and
typically, conducted to raise money for the construction of a new building (Worth, 2010).
However, in the 1970s universities “expanded the definition of the campaign to integrate capital,
annual, and planned gifts under one umbrella—the comprehensive campaign” (p. 6).
Comprehensive campaigns include university-wide priorities and often incorporate goals related
to the university’s image (Worth, 2010).
The Costs
In the current economy nonprofits, colleges, and universities are faced with an increased
pressure to improve fundraising operations in efficiency, value, and productivity. Greenfield
(2003) suggested that the costs per dollar raised varied by fundraising technique and vary from

30
$.05 to $1.00 per dollar raised. Furthermore, he recommended that each fundraising method
varies by cost and should be measured against the results it achieved for a more complete review
(2003).
“Organizations must be cognizant of the relationship between their investment in
fundraising and the return on that investment” (WealthEngine, 2010, p. 4). In order to measure
fundraising effectiveness the “investment”, or costs, must be included (WealthEngine, 2010).
However, the costs of fundraising are unclear due to “a lack of consensus around definitions of
which expenditures to include and a lack of comparable data” (Kroll, 2012, p. 10). A clear
structure must be established to track and report expenses (WealthEngine, 2010).
In order to identify fundraising costs Sargeant and Shang (2010) suggested categorizing
fundraising activity expenses as capacity-building and net-income producing. Capacity-building
activities are activities defined as “activities not intended to produce net income” (p. 210).
Examples of capacity-building activities include support activities, donor acquisition, special
events and public relations. In addition, Sargeant and Shang defined net-income activities as
activities intended generate net contributions.
However, the above categories may not account for the operational costs of fundraising.
In 2011 The Council for Advancement and Support of Education (CASE) launched a study,
“Advancement Investment Metrics Study”, to measure fundraising expenses (Kroll, 2012). They
surveyed CASE members, and 144 colleges and universities completed the survey. According to
Kroll (2012) the purpose of the Advancement Investment Metrics Study was to provide “a
practical survey tool that gives members common definitions for what to count and the ability to
select their own variables to compare their expenditures and results—anonymously—with those
of peer institutions at similar stages of development” (p. 10). Institutional variables were type

31
and size of the institution, campaign status, staffing, and state of fundraising program maturity.
This study suggested that all disciplines of advancement should be included as expenditures,
such as fundraising or development, alumni relations or affairs, communications and marketing,
advancement services, institutionally related foundations, and advancement leadership or
management. In addition, “secondary benefits from these activities may also occur, but the
allocation of expenditure to a category should generally be based on the primary purpose” (p.
45). Kroll (2012) outlined expenditures to include and exclude in general and specifically for
each discipline of advancement. For example, general expenditures include all expenditures that
affect the fundraising process. In addition, general expenditures to exclude were defined as
the salaries of the president and heads of academic units (provosts, deans, department
chairs) EVEN IF fundraising, alumni relations, and communications and marketing are
responsibilities included in their job descriptions and they spend significant portions of
their work time on such activities.
overhead costs, such as office space, utilities, insurance, janitorial services, accounting
services, payroll services, audit services, and general institution information technology
support EVEN IF these costs are related to an off-site location. (Kroll, 2012, p. 45)
WealthEngine (2013) also noted that direct expenses, overhead, and other expenses that affect
fundraising should be included as fundraising costs.
Collins (2013) also suggested that operational expenses should be included as fundraising
costs; however, her study is specific to fundraisers and does not include the other disciplines of
advancement. Furthermore, she suggested to segment fundraisers’ costs and benefits by type:
major gifts, corporate and foundation relations, and annual gifts. She concluded that it is
important to review the costs and return by fundraiser type because the variance in the return

32
may depend on the type and its requirements or structure. Similarly, WealthEngine (2013)
segmented costs and benefits by type; however, WealthEngine (2013) also included planned
giving in addition to annual gifts, major gifts, and corporate and foundation relations.
Furthermore, the Council for Advancement and Support of Education (2014) maintains
guidelines on reporting costs and donations. These guidelines are detailed and a summary of the
guidelines is beyond the scope of this study; therefore, refer to the Council for Advancement and
Support of Education’s website (www.case.org) to purchase the guidelines.
The Return
On the surface the total amount of contributions may seem to be the way to determine
fundraising effectiveness (Hiles, 2010). He stated, “at times, organizations stop asking questions
about productivity if the amount of dollars raised continues going up. That is a mistake” (p. 56).
Rather, the costs of fundraising and the total amount of contributions should be compared in
order to understand the true benefit (WealthEngine, 2010). This type of comparison involves
subtracting the costs from the total amount of contributions and is known as the return or net
revenue in fundraising (Association of Fundraising Professionals, 2008).
The return in fundraising can be unclear as certain types of donations may require special
considerations to determine their value (WealthEngine, 2013). Examples of these types of
donations are in-kind, planned, or deferred gifts. In-kind donations are items such as art,
furniture, or construction materials, should be included at fair market value as a benefit (Ciconte,
2007). Fair market value can be determined through an appraisal. “Any gift of property worth
more than $5,000 in the United States requires an authorized appraisal, which should be paid for
by the donor” (Ciconte, 2007, p. 14).

33
Another type of gift that may require special consideration in regards to its value is a
planned or deferred gift, as the value of the gift when it is received could be greater or lower than
at the time of the commitment (Rooney, 1999). According to Rooney’s (1999) work on the costs
and benefits of university fundraising, universities should use “the changes in pledges and
changes in bequest expectancies to more accurately correlate the time periods of effort and
dollars invested” (p. 55). Furthermore, Greenfield (2005) recommended the net present value
calculation based on the donor age(s) and life expectancy in order to estimate the value of a
planned or deferred gift. Likewise, Sargeant and Shang (2010) suggested the use of net present
value. In order to assess the planned gift, the time-value of money must be taken into
consideration, and thus, review the value of the gift at current prices (Sargeant & Shang, 2010).
WealthEngine (2013) also noted that the costs accumulated during the cultivation and
solicitation process of the planned gift may occur years before the gift is received. Further, they
found that “the average time from inception to maturity for a planned gift is 7-10 years” (p. 41).
Therefore, they proposed that the Guidelines for Counting Charitable Gifts and Valuation
Standards for Charitable Planned Gifts from The Partnership for Philanthropic Planning be used
to approximate the value of a planned gift and how it should be reported. However, these
guidelines are only available to members of the association and encompass various types of
nonprofit organizations.
Measuring Success
On the surface fundraising may be considered successful by increase in the total amount
given from year to year, however, for a better understanding of fundraising effectiveness more
analysis is needed (Levis & Williams, 2011). Reviewing dollars raised is a key way to measure
effectiveness; however, “the major drawback is that a university, college, or unit may receive a

34
huge windfall through an estate gift, as an example. The current major gifts team may have done
nothing to make this happen” (Hiles, 2010, p. 51). Metrics such as fundraising gains and losses,
return on investment, fundraiser performance, and numbers of new and recaptured donors, new
donor renewals, repeat donors, and others may show fundraising success. For example, Levis
and Williams (2011) proposed growth-in-giving reports that focus on fundraising gains and
losses to enable leaders to review the areas to improve and can further augment fundraising
effectiveness.
In addition, several researchers, have supported the use of return on investment (ROI) to
determine success in fundraising, such as: Kroll (2012), Collins (2013), and WealthEngine
(2013). However, Collins (2013) and WealthEngine (2013) recommended other methods or
variables in addition to ROI. Collins (2013) supported ROI specific to fundraisers and suggested
fundraiser activities that should be included to measure fundraising success. Also, WealthEngine
(2013) expanded beyond ROI with the inclusion of Collins’s (2013) fundraiser performance ROI
report and further suggested other variables such as new and recaptured donors, total amount of
contributions from new donors, total amount of contributions from repeat donors, as well as
donors who upgraded and downgraded their contributions.
Gains and Losses
Levis and Williams (2011) recommended determining success with a growth in giving
report. The growth in giving report resulted from a study named The Fundraising Effectiveness
Project, which was sponsored by the Association of Fundraising Professionals (Levis &
Williams, 2011). “Suppose your organization realized funding gains of $594,000 last year”…
“is this an accurate picture of your fundraising efforts? It turns out that your organization also
had losses of $503,000. Consequently, your organization achieved a net growth-in-giving of

35
$91,000” (p. 36). Furthermore, gains in giving are gifts by new donors and recaptured lapsed
donors and increases in gift amounts by upgraded donors. Losses are the decreases in gift
amounts by downgraded donors and lost gifts from lapsed new and lapsed repeat donors. “The
net increase (or decrease) is the net of total gains minus total losses” (p. 37). In addition, it may
be useful to track gains and losses for the number of donors to gauge acquisition and outreach.
Levis and Williams (2011) concluded
To understand what is really happening in your organization, it is necessary to analyze
both the fundraising gains and the fundraising losses from one year to the next so that you
and your organization’s leadership can make growth-oriented decisions about both
fundraising budgets and strategies. (p. 36-37)
Return on Investment
Return on investment (ROI) is a measurement tool that has been adapted in many
professions and applications as a way to determine success. ROI is commonly used in business
practices and has been defined as “earnings divided by investment or net benefits divided by
costs” (Phillips & Phillips, 2004, p. 4). According to Avolio, Avey, and Quisenberry (2010),
ROI enables organizations to review which investments are worthy to continue and thus make
informed decisions. For the profession of fundraising the Association of Fundraising
Professionals defined fundraising ROI as “contributions divided by fundraising expenses,
multiplied by 100 for percentage” (2008, p. 9). According to the Association of Fundraising
Professionals (2008) fundraising expenses, number of gifts, and amount of gifts by fundraising
activity should be tracked, then calculate ROI for each activity each year (p. 1). However,
WealthEngine (2013) defined ROI as the net revenue (total amount of contributions –
fundraising expenses) divided by the fundraising expense.

36
According to Kroll (2012) the use of ROI was supported in the Council for Advancement
and Support of Education’s inaugural Advancement Investment Metrics Study (AIMS) to
provide members of the Council for Advancement and Support of Education (CASE) with a
survey tool to anonymously report their expenditures and results. The purpose of this study was
to develop standardized guidelines and a methodology to gather expenditure data. One hundred
forty-four colleges and universities in the United States completed the survey, and the
participants were able to select their type of institution by degree level and if private or public;
the stage of their advancement program by years in existence; and whether or not they were in a
campaign. This allowed participants to identify peers and the ability to benchmark. Because, as
Kroll (2012) noted, a single or correct figure for how much institutions should spend on
fundraising does not exist, the report provided the results in ranges as well as the mean and
median, “in order to allow institutions to benchmark themselves within the range rather than on a
single, absolute figure” (p. 16).
ROI and Fundraiser Performance
Hiles (2010) suggested measuring variables of fundraiser performance such as the
number of calls, moves or contacts, and proposals submitted in order to determine success of
fundraising programs. “If your organization concentrates on proactively building relationships
and engaging donors in conversation about the mutual interests of your organization and theirs,
the dollars given to your organization will grow” (p. 52). Hiles (2010) also recommended to
measure quality solicitations and quality visits. To measure quality solicitations track the
number of solicitations (proposals) by development officer and determine the number that they
close (Hiles, 2010). “Strive for at least a 50 percent success rate on proposal submissions. Data
shows that productive programs average at least a 50 percent closure rate” (p. 56). To measure

37
quality visits review call reports (also called contact reports) with a subjective analysis (Hiles,
2010). Through the review of call reports Hiles (2010) was able to explain to his fundraising
team the content that a call report should contain and suggest ways to improve their solicitation
strategies. Therefore, Hiles (2010) suggested reviewing call reports to measure quality visits
and track the solicitation process.
Collins (2013) also recommended measuring fundraiser performance to increase the
success of fundraising. However, Collins (2013) developed a ROI report that is specific to
fundraiser performance. Activities that should be included in a ROI report are: number of
personal visits, percentage of unique visits, proposals submitted, number of gifts closed, total
amount of gifts closed, assists or shared credits, and multiple of total compensation. “To
calculate the percentage of unique visits, divide the number of prospects visited by the number of
visits made” (p. 2). The percentage of unique visits and others listed above are not a part of the
ROI calculation but should be included in the report “to provide context to the fundraiser’s
performance” (p. 6). Furthermore, Collins (2013) declared that “the actual ROI calculation can
be determined by dividing the dollars raised by the cost of employment” (p. 6). “By
demonstrating that your frontline fundraisers are closing gifts in amounts much larger than it
costs to employ them, you lend credence to the adage that you must spend money to raise
money” (Collins, 2013, p. 1). In addition, Keith Inman, vice president for university
advancement at the University of Louisville, noted the value of fundraiser performance metrics
and saw a substantial productivity increase after implementing metrics. Inman stated, “If you
want to change human behavior, you have to measure it. Metrics are key” (Major Gifts Report,
2013, p. 6).

38
Additionally, Susan Hayes-McQueen, director of advancement research and relationship
management at the University of Washington in Seattle declared that the solicitation is the main
metric to review in measuring fundraisers’ performance (“Fundraiser metrics”, 2014). She
suggested the contact reports should be reviewed, as the contact reports and the solicitation can
foster a “feedback loop” that enables transparency between fundraisers and administrators to
determine how to improve results (“Fundraising metrics”, 2014, p. 2).
ROI and Key Performance Metrics
WealthEngine (2013) included fundraiser performance and Collins’s (2013)
recommendations as a way to determine fundraising success and also reported several other ways
to determine fundraising success. WealthEngine (2013) developed a survey that had 1,126
respondents of various organization types such as education, social and human services,
healthcare, and art/culture/museum. Participants were asked to identify the metrics they use to
determine fundraising return. The responses were: to measure the increase and decrease in
number of gifts (51%), calculate the cost to raise a dollar (48.4%), measure the number of new
and recaptured donors (47.7%), measure the increase and decrease in average size of gifts
(45.4%), measure the number of gifts renewed or maintained (44.7%), calculate the ROI
(33.8%), measure the number of gifts upgraded or downgraded (32.4%), measure the increase
and decrease in size of prospect pool (23%), measure the number of prospects per major gift
secured (20.3%), none (18.8%), measure the number of contacts per prospect to secure a gift
(16.3%), other (8.4%), and measure the increase and decrease in average cultivation time (8.2%)
(WealthEngine, 2013).
In addition, WealthEngine (2013) suggested the key performance metrics of fundraising
that should be tracked, measured, and reported on to determine success in fundraising such as
39
number of prospects under management, increase and decrease in size of the prospect pool,
average time in identifying a prospect to the time the prospect gives a donation, number of
prospect solicited, as well as number of and total dollars raised from new donors, recaptured
donors, new donor renewals (renewing after first gift), repeat donors, upgraded donors (donors
that have increased their giving), regraded donors (donors that have maintained their giving), and
downgraded donors (donors that have decreased their giving). “All of these metrics, taken
individually and combined, can help the organization better understand what is working, and
what needs adjusting, and to determine how changes in strategy can impact overall results” (p.
20).
Barber and Levis (2013) also declared donor retention matters, as focusing on existing
donors to cultivate relationships and build a long-term commitment could result in substantial
donations. Furthermore, they suggested that “The costs associated with finding and processing
new donors are generally higher per donor, than those for maintaining connections with existing
donors” (p. 4). Hopkins (2009) reported the direct mail to new donor acquisition fundraising
ratio is 100%, whereas the donor renewal fundraising ratio is 25%. In addition to differences of
new donors and existing donors, Barber and Levis (2013) noted a difference in retention
performance of small amount donors and large amount donors. Fundraising programs may
cultivate and focus more on donors who have given larger amounts, thus they are more probable
to continue their financial support (p. 4). Barber and Levis (2013) recommended to still pursue
donors who give smaller donations with effective and efficient cultivation and solicitation
strategies as “communication with smaller donors provides an avenue for expanding the
organization’s reach and influence” (p. 4-5).

40
Overall, to determine success of fundraising, researchers have used a variety of metrics
such as ROI, fundraising gains, number of new donors, and combinations of these and others for
a comprehensive approach. John Welty, associate vice president for advancement at
Pennsylvania’s Lehigh University, stated “you never want to rely on a single measure. That
becomes a pass-fail exam. We’d much rather write essays. We want to provide context” (as
cited in Stuart, 2013, p. 20). Including context, such as the university’s mission or strategic plan,
as a measure of fundraising success was introduced in a 1982 article in CURRENTS by Joel
Smith, former vice president for development at Stanford University (as cited in Lajoie, 2002).
According to Lajoie (2002) Smith believed gift utility should be assessed to determine how well
gifts met the identified priorities. Likewise, Barrett (2013) declared that fundraising
effectiveness “should be measured not only by the amount of money raised, but also by the way
it furthers an institution’s mission by raising strategic gifts, nurturing long-term relationships
with donors, and carrying out similar activities” ( p. 6).
Summary
As state funding continues to decline, universities are more reliant on philanthropy as an
alternative revenue source. University advancement staff can raise money to sustain and
enhance the university; however, the university leaders and stakeholders must support university
advancement and enable the division with staff and resources to raise the money. Over the years,
as university advancement has developed, the processes or structure may have changed, but has
the division is still proven to be an essential part of the university.
In order for university leaders to prepare for the future of the university and its funding
needs a review of fundraising effectiveness must be conducted. Reports on fundraising
effectiveness could enable university leaders to review success and determine how to increase

41
fundraising success and thus assist in attaining the university’s funding needs. However, several
metrics to determine fundraising success have been suggested, such as return on investment
(ROI), gains and losses, fundraiser performance metrics, number of new or recaptured donors, or
a combination of these and others for a comprehensive approach. It is unclear which of, or what
combination of, these metrics provides the most accurate picture of fundraising effectiveness.

42
CHAPTER 3
RESEARCH METHODS
Purpose Statement
The purpose of this qualitative study was to determine the critical quantifiable and
nonquantifiable metrics to measure effectiveness of university fundraising, and understand how
expert fundraising analysts implement, analyze, and prioritize those metrics. For the purpose of
this study the quantifiable metrics of university fundraising success were defined as return on
investment (WealthEngine, 2013), growth in giving reports (Levis & Williams, 2011), fundraiser
activity and performance (Collins, 2013), number of new and recaptured donors (WealthEngine,
2013), number of annual fund donors transitioned to major gift donors (Stuart, 2013), and alumni
participation rate (Stuart, 2013). Nonquantifiable metrics of university fundraising success were
defined as the four types of intervening variable forces in fundraising: personal forces,
institutional forces, role forces, and environmental forces (Cook & Lasher, 1996). This study
may provide direction for university advancement staff to measure success and consequently,
advocate, strategize, and improve processes.
Research Questions
1. Which quantifiable measures (return on investment, growth in giving reports, fundraiser
activity and performance, number of new and recaptured donors, number of annual fund
donors transitioned to major gift donors, and alumni participation rate) do expert
fundraising analysts suggest to include in a comprehensive model to determine success in
university fundraising?
2. What other quantifiable measures do expert fundraising analysts suggest to include in a
comprehensive model to determine success in university fundraising?

43
3. Which nonquantifiable measures (personal forces, role forces, institutional forces,
environmental forces) do expert fundraising analysts suggest to include in comprehensive
model to determine success in university fundraising?
4. What other nonquantifiable measures do expert fundraising analysts suggest to include in
a comprehensive model to determine success in university fundraising?
5. How do expert fundraising analysts suggest a comprehensive model to determine success
in university fundraising be organized or segmented?
6. What further implications do expert fundraising analysts suggest for a comprehensive
model to determine university fundraising success?
Research Design
To develop consensus the Delphi Technique was used as its focus correlated with the
purpose of this study, which was to request information that may generate a consensus from the
participants (Hsu & Sandford, 2007, p. 1). For the purpose of this study the expert fundraising
analysts comprised the respondent group to determine a cohesive approach to measure university
fundraising success. “The Delphi Technique, mainly developed by Dalkey and Helmer (1963) at
the Rand Corporation in the 1950s, is widely used and accepted method for achieving
convergence of opinion concerning real-world knowledge solicited from experts within certain
topic areas” (Hsu & Sandford, 2007, p. 1). This convergence of opinion is a result of a series of
iterations. Data were collected from three rounds of questionnaires. The use of several iterations
may cause participants “to offer their opinions more insightfully and to minimize the effects of
noise” (p. 2). Furthermore, the Delphi Technique was chosen as this study met most of the
criteria developed by Linstone and Turoff (1975):

44
1. When the problem does not lend itself to precise analytical techniques, but can benefit
from subjective judgments on a collective basis.
2. When the individuals needed to contribute to the examination represent diverse
backgrounds with respect to experience or expertise.
3. When more individuals are needed than can effectively interact in a face-to-face
exchange.
4. When time and cost make group meetings infeasible.
5. When disagreements are so severe or politically unpleasant that the communication
process must be refereed and confidentially assured.
6. When the heterogeneity of the participants must be preserved to assure validity of the
results and to avoid domination by the strength of certain personalities.
7. When a supplemental group communication process can help the efficiency of face-
to-face meetings. (p. 4)
This study met the majority of the criteria, with the exclusion of the fifth criteria listed
above as severe disagreement was not perceived to be an issue in this study. Considering that all
the other criteria are met, the Delphi Technique was selected for this study. The problem in this
study may benefit from collective input of the participants. Variation in the experience of the
participants exists due to number of years in the field, levels of education, or participation in
professional development. The participants were brought together by written communication
only, and none of the participants knew the identity of the others who participated in this study.
The anonymity between the participants may help increase the internal validity, or credibility, of
this study as the participants’ views will not be adapted due to pressure of another participant’s
identity and expertise (Kennedy, 2004).

45
Sampling
A criterion sampling method was used to identify the participants for the questionnaire
process. Criterion sampling “works well when all individuals studied represent people who have
experienced the phenomenon” (Creswell, 2013, p. 155). A criterion sampling method was
chosen as participants with the criteria of a well-regarded reputation and expertise in fundraising
analytics were needed for this study. According to Baker, Lovell, and Harris (2006) experts are
“representative of their professional group” (p. 62). The participants were recognized as experts
based on the following criteria:
Possessed national recognition for work such as published books within the last
10 years or authored articles in related professional journals such as CURRENTS,
Connections, Philanthropy Journal or available through websites for the Council
for Advancement and Support of Education or the Association of Fundraising
Professionals;
Presented at international and national association conferences (Association of
Prospect Researchers for Advancement, Association of Fundraising Professionals,
DRIVE); or,
Received awards from international or national associations for work in
fundraising analytics.
Hsu and Sanford (2007) suggested that the size of Delphi participants varies, but the
recommended sample size is generally under 50. For this study the maximum of 20 participants
was chosen to ensure response rates. The participants were selected with criterion sampling, and
thus, “selected for a purpose, to apply their knowledge to a certain problem” (Hasson, Keeney, &
McKenna, 2000, p. 1010). The researcher identified 34 individuals meeting the above sampling

46
criteria for the study and posted information about the study on a professional fundraising listerv,
Prospect-L. Twenty expert fundraising analysts responded to the e-mail and agreed to participate
in the study. No responses were received from the listserv post. Two of the 20 participants
withdrew from this study after the distribution of the 1st round questionnaire, and an additional
participant did not respond. Five additional individuals meeting the criteria for the study were
identified and contacted in an attempt to replace the two individuals who withdrew and the
nonresponder; however, none were able to participate. Therefore, 17 expert fundraising analysts
were participants in this study.
Data Collecting and Recording
Upon approval from the East Tennessee State University Institutional Review Board
(IRB), the researcher posted comments on a fundraising professional listserv, Prospect-L, with
the purpose of this study and asked for those meeting the set criteria to contact the researcher via
email (See Appendix A for approval letter). In addition, the researcher identified 34 individuals
as experts based on the sampling criteria for this study.
Each of the 34 individuals identified as experts by the researcher received an e-mail with
an overview of the study and an Informed Consent Document based on the Institutional Review
Board rules and regulations (See Appendix B). The selected individuals were asked to respond
via e-mail indicating agreement to participate.
Twenty expert fundraising analysts responded to the e-mail and agreed to participate in
the study. No responses were received from the listserv post. After the first round, two
participants withdrew, and one did not respond; therefore, 17 expert fundraising analysts
participated in this study.

47
Data were collected using three rounds of questionnaires. “The Delphi method requires a
minimum of two rounds (three if round one is open-ended)” (Thangaratinam & Redman, 2005,
p. 122). The first round was an open-ended questionnaire that “serves as the cornerstone of
soliciting specific information about a content area from the Delphi subjects” (Hsu & Sandford,
2007, p. 2). The following were the questions in the open-ended questionnaire for round one:
1. Which quantifiable measures (return on investment, growth in giving reports, fundraiser
activity and performance, number of new and recaptured donors, number of annual fund
donors transitioned to major gift donors, and alumni participation rate) do you suggest to
include in a comprehensive model to determine success in university fundraising?
2. What other quantifiable measures do expert fundraising analysts suggest to include in a
comprehensive model to determine success in university fundraising?
3. Which nonquantifiable measures (personal forces, role forces, institutional forces,
environmental forces) do expert fundraising analysts suggest to include in comprehensive
model to determine success in university fundraising?
4. What other nonquantifiable measures do expert fundraising analysts suggest to include in
a comprehensive model to determine success in university fundraising?
5. How do expert fundraising analysts suggest a comprehensive model to determine success
in university fundraising be organized or segmented?
6. Do expert fundraising analysts have any further implications to suggest for a
comprehensive model to determine university fundraising success?
The above questions for the round one questionnaire were sent via e-mail to each expert
separately in a PDF form that was password protected. After all responses from the first round

48
were collected, each participant response was reviewed twice and then listed in an excel
spreadsheet to form the comprehensive list of responses.
Each question had a separate sheet for a total of six sheets. Each sheet was named for the
corresponding question number. The first column contained the corresponding question, and
columns B-U contained a participant’s full response. For anonymity the participants were
assigned pseudonyms and the header for columns B-U contained the pseudonym such as Expert
A, Expert B, Expert C, and so forth. After the comprehensive list of responses for each question
was developed, it was reviewed to ensure proper compilation.
During the review of responses for the first round, the researcher made analytic memos
(Birks, Chapman, & Francis, 2008) of fundraising terms that vary and are used interchangeably,
in the case that further clarification was needed to ensure accuracy. In one response from the
first round, a questionable phrase was identified. After the first round review of responses was
complete, this participant was asked to clarify the phrase, resulting in additional explanation,
leading to keeping the initial coding that had been assigned.
The responses from the first round were used to construct the second round questionnaire,
which “is used as the survey instrument for the second round of data collection” (Hsu &
Sandford, 2007, p. 2). Thus, the second round of data collection for this study involved using the
comprehensive list of responses that were verbatim open-ended responses in prose format from
round one. The participants were asked to indicate agreement with each response by writing
‘Yes’ or ‘No’ in the row directly below each response.
Once all responses from the second round were received, the researcher reviewed the
responses twice. No further clarification of the responses was needed. The number of yes’s and
no’s for each response were tallied.

49
For the third round of data collection the participants received a copy of the
confirmability matrix (a comprehensive list of responses for each question) and the number in
percentages of votes for inclusion by expert participant. Each participant also received a copy of
his or her second round responses as a member checking method to aid trustworthiness of the
data (Anfara et al., 2002). In the third round the participants likewise reviewed and confirmed
their responses. A copy of the second round responses was provided to each participant to aid
recall. The percent of yes’s and no’s beside each response were included to enable further
reflection on the second round responses and to encourage consideration for the applicability of
each variable.
Participants were informed that they could change their second round response by
updating the response. If updates were made, participants were asked to include the reason for
the change. In cases where no updates were made, participants were asked to confirm all
existing responses. Next, all third round questionnaires were compiled and reviewed. Each
response was coded in the master list, and was indicated if any of the responses were updated.
Two participants, Expert B and Expert E, updated their second round responses. Expert B
updated 14 responses from “not sure” to “yes”, and Expert E updated nine responses from “no”
to “yes”. According to Donohoe and Needham (2009) a final report of findings should be sent to
the expert panel; therefore, each of the expert fundraising analysts received a final report of the
findings.
Validity and Reliability
According to Anfara, Brown, and Mangione (2002) internal validity and external validity
are the credibility and transferability of research; in addition, reliability and objectivity are the
dependability and confirmability of research.

50
In this study with the nature of the Delphi Technique content validity is present with the
use of experts as the participants (Hasson et al., 2000). Experts provide information that can be
“harnessed to gain opinion” (Baker, Lovell, & Harris, 2006, p. 61). According to Baker et al.
(2006) the use of experts as participants ensures content validity. An expert’s knowledge of the
topic area can be demonstrated through authorship of books or peer-reviewed articles (Baker et
al., 2006). Authorship of books or peer-reviewed articles was one criterion for sample selection
for the study. Furthermore, validity is present with the “successive rounds of the questionnaire
helps to increase the concurrent validity” (Hasson et al., 2000, p. 1013). The iterations allowed
the experts to review their responses to ensure the clarity, relevance, and accuracy of the
responses.
Lincoln and Guba’s (1985) criteria could ensure that credible interpretations of the
findings are presented. These criteria are credibility (truthfulness), fittingness (transferability),
auditability (consistency), and confirmability (Lincoln & Guba, 1985). Credibility or internal
validity can be established through the act of prolonged engagement in the field (Linclon &
Guba, 1985). The researcher has worked in the field of university fundraising for 7 years, thus
understands the interchangeable terms and culture of the profession. Therefore, the researcher
was able to recognize if a distortion in the data occurred and could clarify with the expert panel
member to correct the information in ample time. No distortion in the data occurred in this
study.
Creswell and Miller (2000) recommended using member checking to increase the
credibility of a study, as member checking takes the “data and interpretations back to the
participants in the study so that they can confirm the credibility of the information and narrative
account” (p. 127). In this study the researcher made analytic memos in the review of first round

51
responses to find questionable terms or phrases. One questionable phrase was identified, and the
participant was asked to clarify the phrase, resulting in additional explanation, leading to keeping
the initial coding that had been assigned. Also, member checking was used in the third round of
this study, as the participants were asked to confirm or update their second round responses.
In addition, transferability or external validity exists with the presence of thick
description of all research decisions (Merriam, 1998). To increase transferability of this study, a
description of the expert selection process, response rates for each round, reasoning for the
themes and categories, and figures or lists reflecting the responses in each round (Hasson et al.,
2000).
Furthermore, Anfara et al. (2002) suggested including a table with the research questions
in relation to the interview questions to make the researcher’s process public, and, therefore,
increase validity and reliability. For this study the research questions in relation to the survey
questions are included.
To increase confirmability of a study Krefting (1991) recommended using a code-recode
procedure, which requires the researcher to return to the data 2 weeks after the initial round of
coding to re-code the data, and then, compare the results of the two rounds of coding. For this
study the researcher conducted two rounds of coding. The initial round of coding the data was
completed after the third round of responses. Almost 3 weeks later the researcher returned to the
data, and in a separate Excel workbook, re-coded the data from the third round of responses.
Then, the researcher compared the results, and no differences were found.
According to Anfara et al. (2002) researchers are encouraged to make their process more
public as a way to ensure an ethical study. For ethical consideration of this study the researcher
provided a description of each step taken in each round and in the analysis of the data.

52
Data Presentation
The findings from this study were presented in figures, lists, and text. According to
Hasson et al. (2000) the results in each round should be reported separately. Therefore, the
findings are in a figure or table for each round and include text to highlight pertinent data.

53
CHAPTER 4
FINDINGS AND ANALYSIS
This chapter contains information on the expert panel, the distribution of the Delphi
questionnaires in three rounds, the response rate, and a summary of each round and
questionnaire. Round one was developed from a review of literature, while rounds two and three
emerged from the preceding round’s responses.
Demographics of the Panel
The selection of the expert panel began in April 2015. An exhaustive attempt was made
to identify experts in the field within the United States based on the following criteria:
Possessed national recognition for work such as published books within the last
10 years or authored articles in related professional journals such as CURRENTS,
Connections, Philanthropy Journal or available through websites for the Council
for Advancement and Support of Education or the Association of Fundraising
Professionals;
Presented at international and national association conferences (Association of
Prospect Researchers for Advancement, Association of Fundraising Professionals,
DRIVE); or,
Received awards from international or national associations for work in
fundraising analytics.
Based on the above criteria, 34 individuals were identified. All 34 individuals were contacted
about participating in this study. Five individuals declined, six individuals had e-mails returned
as undeliverable, and three individuals did not respond.

54
The researcher also posted comments on a fundraising professional listserv, Prospect-L,
with the purpose of this study and asked for those meeting the set criteria to contact the
researcher via email. The researcher did not receive any interest from the listserv subscribers.
Of the 34 experts identified, 20 participants agreed to participate in this study, which met
the participant quota for this study in an effort to ensure response rates. After the distribution of
the first round two experts withdrew from this study and one did not respond. In attempt to
replace them five additional individuals meeting the sampling criteria were identified and
contacted. Of those five individuals, none could participate at the time. Therefore, the
researcher proceeded with the study and 17 participants. The panel included 10 male and 7
female participants who reside in different areas of the United States and have various levels of
education and experience.
Survey Distribution and Response Rate
On Friday, May 1st, each participant received an e-mail with the first-round
questionnaire. The questionnaire was in a PDF form and password protected. The e-mail
included instructions and that the deadline to complete the first round was Friday, May 8th,
providing participants 1 week to complete the questionnaire. By May 6th, 14 participants had
submitted responses for round one. On May 7th, the remaining six participants were sent an e-
mail with a deadline reminder and to inquire if more time was needed. Of those six participants,
three submitted responses for round one by May 9th, two withdrew from the study, and one
participant did not respond after a subsequent reminder e-mail sent on May 9th. As a result, this
study had 17 participants.
For the first round all 17 participants responded, which is a 100% response rate. In the
second and third rounds one participant did not respond, which is a 94% response rate.

55
Construction and Methodology of Response Analysis: Round One
Round one was developed from information in a review of the literature. Various
quantifiable metrics have been proposed to determine success in fundraising; therefore, the first
two questions dealt with quantifiable metrics. From the review of literature six metrics were
included in question 1 to determine if and which variables should be included in a
comprehensive model to determine university fundraising success. The second question was
purposefully ambiguous in order to ensure the response range of possible quantifiable metrics.
Questions 3 and 4 dealt with nonquantifiable metrics, as several professionals indicated
in the review of literature that measuring fundraising success is more than one metric and that
context is needed to fully understand the scope of fundraising success. Question 3 included the
nonquantifiable metrics defined by Cook and Lasher (1996) as the four intervening variable
forces in fundraising, to determine if and which variables should be included in a comprehensive
model to determine university fundraising success. Question 4 was purposefully ambiguous to
ensure the response range of possible nonquantifiable metrics.
Question 5 was developed to identify how to organize or segment a comprehensive
model. Question 6 was developed to ascertain any pertinent information for a comprehensive
model that was not addressed by the previous questions.
The responses to the round-one questionnaire were transcribed in a password protected
Excel workbook and reviewed twice to ensure accuracy. Each question was placed in a separate
Excel sheet, categorized by the pseudonyms assigned to the experts to ensure confidentiality (ex:
Expert A, Expert B, Expert C, and so forth). In one response a questionable phrase was
identified. After the first round review of responses was completed, this participant was asked to
clarify the phrase, resulting in additional explanation, leading to keeping the initial coding that

56
had been assigned. This password protected Excel workbook with all round one responses was
sent to each participant for the round two questionnaire. All 17 participants responded to the
first round questionnaire.
Research Question 1
Which quantifiable measures (return on investment, growth in giving reports, fundraiser
activity and performance, number of new and recaptured donors, number of annual fund donors
transitioned to major gift donors, and alumni participation rate) do expert fundraising analysts
suggest to include in a comprehensive model to determine success in university fundraising?
Seventeen participants responded to round one question 1, which is a 100% response rate
for round one question 1. Figure 1 displays the percentage of participants that suggested each
quantifiable metric defined in question 1.
Figure 1. Bar graph showing responses to Round 1 Question 1.
65% 35%
65% 35 %
59% 41%
59% 41%
35% 65%
29% 71%

57
Some of the participants suggested other quantifiable metrics in question 1, which should
have been in response to question 2. Therefore, those responses are listed with question 2 for
proper compilation.
Expert L did not agree that any of the quantifiable metrics were measures of fundraising
success and argued that “the only quantifiable measure that matters in terms of the success of a
fundraising program is how much money they are able to raise, in terms of outright gifts or
commitments for future gifts (pledges and planned gifts).” In addition, some of the participants
further defined the way that the above metrics should be used or measured, and those suggestions
are listed below.
Return on Investment. Expert A suggested determining if “an increase in the number of
frontline fundraisers increases the yield in terms of dollars and number of donors, year over
year.” Expert D suggested “only if it is accurately measured”, and that “it is notoriously hard to
calculate ROI and much harder to compare across institutions.” Expert F noted that “retention
rates are critical to ROI.”
Fundraiser Activity and Performance. Expert B cautioned that fundraiser activity and
performance should only be used “if the fundraising metrics are clearly defined with realistic
expectations.” Expert D suggested the use of “median number of asks and the median amount of
asks.” Expert G suggested fundraiser activity and performance if “reviewing newly managed
prospects and the timeframe for them to make a donation.” Expert I suggested “the number of
managed prospects per managed portfolio, visits by development officer each year, average visits
per prospect, number of asks/proposals.” Expert I further explained that one would need to
measure “a) do you have enough prospects, b) are you seeing them, c) are you asking them.”

58
Expert J suggested “the percent of required visits made, percent of required asks made,
percent of asks closed, etc.” Expert K suggested effort metrics and further defined effort metrics
as “number of personal visits made with rated, assigned prospects as reported in contact reports,
and the number of proposals submitted with proposal date, content and asks amount.”
New and Recaptured Donors. Experts D, H, J, and S each noted to measure the
percentages of new and recaptured donors rather than the number. Expert F stated that, “While
most would focus on total growth of income from philanthropy, it is just as important to make
sure the pipeline is maintained with new donors, upgrades from existing donors and for long
term success, retention of existing donors.” Expert N noted that recaptured donors may take
“negotiation as to how long they [donors] are dormant before they are recaptured.”
Number of Annual Fund Donors Transitioned to Major Gift Donors. Expert B
argued that the number of annual fund donors who transitioned to major gift donors should only
be used “if it was shown within one’s organization that annual fund donors were more likely to
give major gifts than non-annual fund donors.”
Alumni Participation Rate. In addition to alumni participation rate, Expert E
recommended a “constituent participation rate to include the different types within a
constituency (parents, grandparents, alumni, non-alumni donors, corporations, and foundations).”
Experts G, J, and N suggested that alumni participation rate should not be included in a
comprehensive model. Expert G said it is “idiosyncratic to schools and disciplines, and subject
to gimmicks and definitions of what’s counted.” Expert J stated it is a “key value to US News
and World Reports, but it measures absolutely the wrong thing.” In addition, Expert N noted
that it can be counter-productive and explained that “chasing alumni participation can lead to
lower dollar gifts.” Expert K recommended to “supplement the alumni participation rate with

59
total number of donors and total number of alumni donors: these metrics are much easier to grow
than alumni participation.”
Research Question 2
What other quantifiable measures do expert fundraising analysts suggest to include in a
comprehensive model to determine success in university fundraising?
Seventeen participants responded to this question, which is a 100% response rate for
round one question 2. A wide variety of responses resulted from this question for a total of 66
suggested quantifiable measures. The responses were categorized into six themes: donors,
giving, engagement, costs or investment, fundraiser activity and performance, and other.
The theme of donors included responses about the number, percent, or types of donors.
The theme of giving included responses about the types, amounts, percent, or averages of giving.
The engagement theme was comprised of responses about the types of activities, number of
volunteers or attendees, or response rates associated with engagement. The theme of costs or
investment included responses about the institutional investment in fundraising, and the costs of
human resources or infrastructure needed. The fundraiser activity and performance theme was
comprised of responses about the numbers and ratios of various fundraising activity performance
metrics such as “number of major gifts solicited and closed”, “number of face-to-face-visits”, or
“ratio of first-time contacts with a prospect vs. repeat contacts.”
Finally, several quantifiable measures were not related to the other themes nor similar in
context to the remaining measures to develop an additional theme; therefore, the theme of ‘other’
was used. The ‘other’ theme included metrics or variables such as: if “funding was met for
stated goals or areas”, “the prospect pool size (total and in capacity bands)”, if transformational
gifts were acquired, “a donor experience survey”, a review of failures, and if a university was a

60
“good fiduciary of the donations.” The complete list of round one question 2 responses can be
found in Appendix C.
Research Question 3
Which nonquantifiable measures (personal forces, role forces, institutional forces,
environmental) do expert fundraising analysts suggest to include in a comprehensive model to
determine success in university fundraising?
Seventeen participants responded to this question, which is a 100% response rate for
round one question 3. Responses for question 3 are displayed in Figure 2. One participant
responded “not sure”; therefore, this participant’s response was coded as ‘not sure’ in Figure 2.
Figure 2. Bar graph showing responses to Round 1 Question 3.
Note. The percentages in the bar graph do not equal 100% due to rounding.
Personal Forces 71% 24% 6%
Role Forces 65% 29% 6%
Environmental Forces 65% 29% 6%
Institutional Forces 65% 29% 6%
1 5 9 13 17
Suggested Did Not Suggest Not Sure

61
Expert A defined ways to review personal and role forces such as “the tenure of role type
in comparison to the last campaign, and determine the average tenure of a frontline fundraiser,
how that impacted the campaign, and how it will impact the current campaign”; otherwise,
Expert A noted that personal and role forces were too subjective.
Expert F also noted “tenure of development staff” as a way to review personal and role
forces. Expert B suggested that “if personal and role forces were included in a comprehensive
model, then those variables must be reviewed somehow in an objective manner”, and further
argued that “personal and role forces seemed too subjective”.
Expert E listed environmental forces “specifically, the state of the economy, and
comparison of success of similar cohort universities.” Expert G claimed that “In Cook & Lasher
(1996), it’s not clear what the boundary is between personal forces and role forces. The leader
may grow into a role in fundraising, but that role still depends on the personal qualities of the
leader. That growth path itself might, and the expectations the institutions sets in the selection of
its leaders, might be an important part of the model.”
Expert H declared that “We are all about using these metrics to uncover stories that drive
discussions around best practices and coaching tips. Metrics by themselves don’t usually drive
change. The data needs to be used in the context of the people and programs, and be nuanced
and framed in the mindset of it tells us stories that drive discussions.”
Expert I suggested all four forces in various ways. Expert I recommended reviewing the
strength of leaders as personal forces, and role forces are important to create a sense of urgency.
Expert I noted that “environmental forces can shift with time, as one can’t plan on
unemployment rate, for instance, and a pool of donors capable of giving enough to remedy the
needs”.
62
Furthermore, Expert I declared that “institutional forces can be the most important”, as
the institution will need a strong case for support to “overcome institutional weaknesses, such as
a perception of no need, a scandal, and a reputation for lackluster performance.” Expert I noted
that the institutional reputation (institutional forces) is the “intangible unquantifiable linchpin in
successful fundraising.”
Expert I also discussed Jerod Panas’s work that declared the “belief in the mission of the
organization and confidence in leadership of the organization are the top two critical elements
major donors consider as they think about their giving” (personal forces). Expert J argued none
of the forces should be included because the forces are too subjective in nature. Expert L did
agree that the forces are important; however, Expert L argued the “four forces impact success,
rather than determine success.”
Expert Q provided an example of role forces as “the role of the university president or
chancellor plays an essential role in creating and maintaining a vital culture of philanthropy.
Presidents should be a part of the cultivation and solicitation process just as they are when they
present and ask legislature for additional appropriations.”
Expert R listed examples of each force, such as leadership character and suggested
“Kiel’s Return on Character” (personal forces), campus scandals (institutional, role, personal
forces), localized natural disasters (environmental), brand or institutional perceptions (personal,
institutional), constituent sentiment analysis (personal), satisfaction with donor experience
(personal), ability to use donations effectively (role, personal, institutional), and communication
of the gifts impact (institutional, role, personal). Finally, Expert S suggested all of the four
forces “considering that these forces may tell more about the reasons why the quantifiable
variables are at a certain level.”

63
Research Question 4
What other nonquantifiable measures do expert fundraising analysts suggest to include in
a comprehensive model to determine success in university fundraising?
Seventeen participants responded to this question, which is a 100% response rate for
round one question 4. Eight participants responded that they did not know of any other
nonquantifiable measures to suggest at that time. Table 1 displays all the other nonquantifiable
measures suggested by the participants and the associated type of intervening forces.
Table 1
Respondent Suggestions of Other Nonquantifiable Measures and Associated Type of Intervening
Forces
Associated Type of
Intervening Forces
Respondent Suggestions of
Other Nonquantifiable Measures
Institutional
Maturity of fundraising program (new or established)
Evidence of data-driven decision making
Institutional, Environmental Distribution of revenue sources to support advancement
Reputation and brand recognition
Institutional, Personal, Role Quality of volunteer leadership
Institutional, Role Organizational structure
Advancement’s commitment to training gift officers
Teamwork
Personal, Role Donor Experience
Staff Morale and Job Satisfaction
Sentiment Analysis (survey constituency)
Tenure/median of tenure of fundraisers and leaders
The suggested nonquantifiable measure teamwork was further defined by the respondent
as “the way advancement staff work together and how advancement staff work with other

64
colleges or departments within the university.” In addition, the organizational structure should
also include “if the Alumni Association is a part of development, and if there is a separate
foundation.”
Research Question 5
How do expert fundraising analysts suggest a comprehensive model to determine success
in university fundraising be organized or segmented?
Seventeen participants responded to this question, which is a 100% response rate for
round one question 5. A wide variety of responses resulted from this question for a total of 29
ways suggested to organize or segment a comprehensive model.
Some of the responses suggested to organize or segment a comprehensive model by:
“size/type of university”, “organizational structure”, “size of the fundraising team”, “size of the
largest comprehensive campaign”, “Carnegie classification”, “gift level and/or by college or
area,” “ratio of dollars raised to the solicit-able population”, “hierarchically-at the very top is the
dollars raised” proceeded by “all other components”, and “model paradigms (open cultivation,
centralized/decentralized model).” The complete list of responses can be found in Appendix D.
Research Question 6
What further implications do expert fundraising analysts suggest for a comprehensive
model to determine university fundraising success?
Seventeen participants responded to this question, which is a 100% response rate for
round one question 6. Nine participants indicated that they did not have anything further to
suggest. The implications suggested were categorized by: elements needed in order for
university advancement to be effective, variables to measure or note in a comprehensive model,
and considerations before applying a comprehensive model. Four suggestions were noted as

65
elements that are needed in order for university advancement to be effective such as: a favorable
economic climate; a positive image of the university from prospects, strong leadership, capable
staff support, well-defined needs, ample funds, sufficient number of prospects, and committed
volunteer leaders; leaders supportive of change, strategic meetings, leaders and staff willing to
change in order to improve; university advancement must be institutionalized, and include
everyone within the university; and morale must be connected to performance.
Three suggestions were categorized as variables to measure or note in a comprehensive
model, such as: “staff retention and turnover (maybe it’s a good thing that staff don’t stay
forever, but maybe a bad thing that they only stay 18 months. What’s the golden number for
success?” and “donor retention and loss (who loses donors least and why?)”; a “comparison to
current national economics”; and “the extent a university program engages and utilizes
volunteers and alumni, especially in the area of identifying and cultivating new major gift and
endowment prospects.” In addition, three suggestions were noted as implications to consider:
“comparing institutions is hard because of: bad data collection practices, management mandates,
fundraiser practices, disparity of sizes, age of the development programs, and closeness of
alumni Any model that compares and declares best fundraising practices operations must
account for the above factors”; “a comprehensive model should put as much emphasis on long-
term goals, sustainability, and organizational culture as it does on the bottom line”; and
university funding varies by type of institution, therefore cannot be accurately compared to
institutions other than those that are of the same type.
Summary of Round One
Round one began in a discovery and exploratory posture with the review of literature and
developed six questions for the purpose of this study. The responses from round one were

66
collected verbatim and placed into an Excel workbook to form the comprehensive list of
responses.
Each question was listed on a separate sheet for a total of six sheets. Each sheet was
named for the corresponding question number. The first column contained the corresponding
question, and columns B-U contained a participant’s full response.
For anonymity the participants were assigned pseudonyms and the header for columns B-
U each contained the pseudonym such as Expert A, Expert B, Expert C, and so forth. The
comprehensive list of responses was reviewed twice to ensure proper compilation.
Construction and Methodology of Content Analysis: Round Two
The questionnaire in round two used the comprehensive list of responses from round one
to determine the applicability of each response through expert opinion. In the excel workbook,
below each question in the first column, instructions were listed to ask that the participants
indicate whether they agreed or not with each response by writing a ‘Yes’ or ‘No’ in the row
directly below each response. If participants only agreed to a portion of the response, the
participants were asked to clearly indicate the part of the response that they agreed to and the
part of the response that they disagreed to, in the row below each response.
Research Question 1
Which quantifiable measures (return on investment, growth in giving reports, fundraiser
activity and performance, number of new and recaptured donors, number of annual fund donors
transitioned to major gift donors, and alumni participation rate) do expert fundraising analysts
suggest to include in a comprehensive model to determine success in university fundraising?
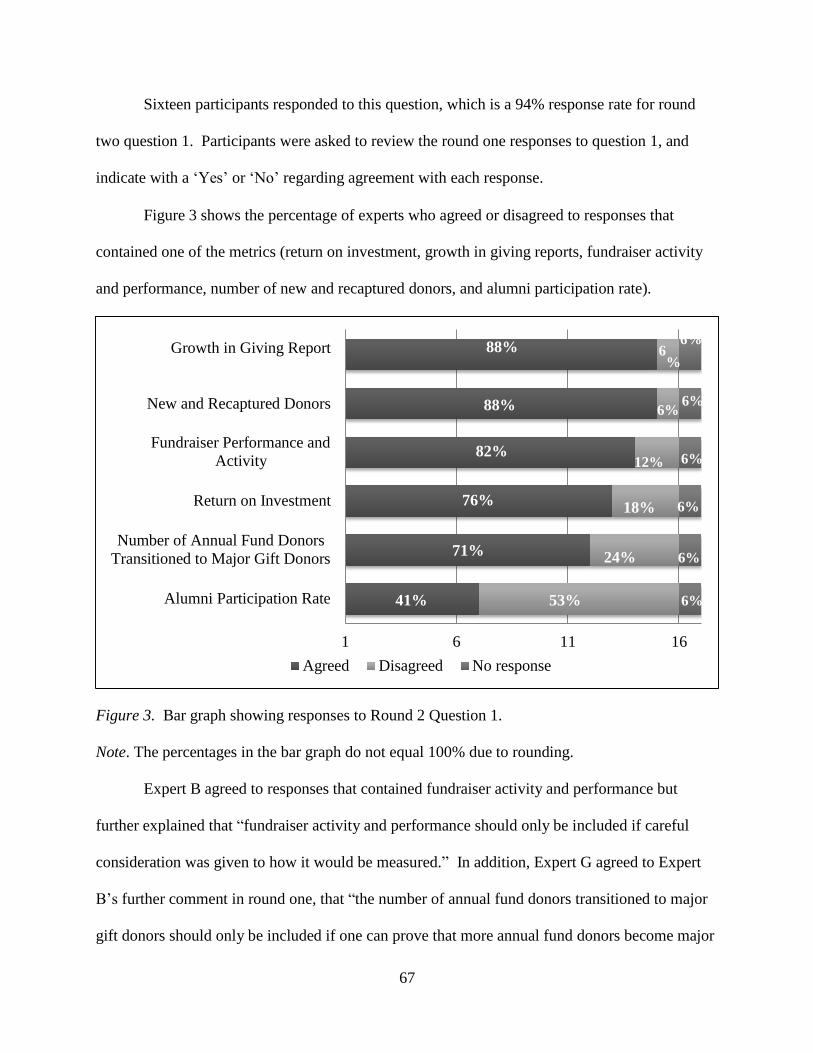
67
Sixteen participants responded to this question, which is a 94% response rate for round
two question 1. Participants were asked to review the round one responses to question 1, and
indicate with a ‘Yes’ or ‘No’ regarding agreement with each response.
Figure 3 shows the percentage of experts who agreed or disagreed to responses that
contained one of the metrics (return on investment, growth in giving reports, fundraiser activity
and performance, number of new and recaptured donors, and alumni participation rate).
Growth in Giving Report 88% 6 6%
New and Recaptured Donors
%
88% 6% 6%
Fundraiser Performance and
Activity 82%
12% 6%
Return on Investment 76% 18% 6%
Number of Annual Fund Donors
Transitioned to Major Gift Donors
71%
24% 6%
Alumni Participation Rate 41% 53% 6%
1 6 11 16
Agreed Disagreed No response
Figure 3. Bar graph showing responses to Round 2 Question 1.
Note. The percentages in the bar graph do not equal 100% due to rounding.
Expert B agreed to responses that contained fundraiser activity and performance but
further explained that “fundraiser activity and performance should only be included if careful
consideration was given to how it would be measured.” In addition, Expert G agreed to Expert
B’s further comment in round one, that “the number of annual fund donors transitioned to major
gift donors should only be included if one can prove that more annual fund donors become major

68
gift donors than non-annual fund donors.” In the first round Expert G suggested the number of
annual fund donors transitioned to major gift donors; however, in this round, after reviewing
Expert B’s response, Expert G disagreed with the inclusion of number of annual fund donors
transitioned to major gift donors.
As mentioned earlier with the round one question 1 analysis, Expert L argued that “none
of the metrics listed in question 1 should be included”, and that “the only measure of success is
total amount raised in outright gifts and commitments of future gifts (pledges and planned
gifts).”
Experts B, I, Q, and S disagreed and further argued that while the total amount raised is
important, there are other metrics needed to determine success, to compare, and to determine
areas of improvement. Furthermore, Expert Q also noted that “university fundraising has more
goals than total amount of gifts and commitments.”
Research Question 2
What other quantifiable measures do expert fundraising analysts suggest to include in a
comprehensive model to determine success in university fundraising?
Sixteen participants responded to this question, which is a 94% response rate for question
2 of round two. In this round participants reviewed the 66 other quantifiable measures that were
suggested in round one and indicated whether they agreed or disagreed.
Some of the measures with the greatest percentage of agreement were: “total amount
raised in outright gifts or commitments of future gifts” (94%); “total amount raised per frontline
development officer or advancement staff member” (88%); “annual fund growth independent of
any special campaigns” (88%); “if average and median giving is increasing over time” (88%);

69
“baseline giving while not in an active campaign” (88%); and “number of face-to-face visits”
(88%). A complete list of responses can be found in Appendix E.
Research Question 3
Which nonquantifiable measures (personal forces, role forces, institutional forces,
environmental) do expert fundraising analysts suggest to include in a comprehensive model to
determine success in university fundraising?
Fifteen participants responded to this question, which is an 88% response rate for
question 3 of round two. One of the participants did not respond to the responses that contained
role forces, hence the increase in ‘no response’ for role forces in the figure below.
Figure 4 shows the percentage of experts who agreed or disagreed to responses that
contained one of the forces (institutional forces, environmental forces, personal forces, and role
forces).
Figure 4. Bar graph showing responses to Round 2 Question 3.
Note. The percentages in the bar graph do not equal 100% due to rounding.
Expert B agreed to responses that contained personal and role forces but further noted
that the agreement was “only if personal and role forces could be measured objectively.”
Role Forces 65% 18% 18%
Personal Forces 71% 18% 12%
Environmental Forces 76% 12% 12%
Institutional Forces 76% 12% 12%
1
Agreed
5
Disagreed
9
No Responses
13 17

70
Research Question 4
What other nonquantifiable measures do expert fundraising analysts suggest to include in
a comprehensive model to determine success in university fundraising?
Sixteen participants responded to this question, which is a 94% response rate for question
4 of round two. A few of the participants did not respond to some of the suggestions, hence the
increase in ‘no response’ on some of the suggestions.
Some of the other nonquantifiable measures that had the greatest amount of agreement
were: “maturity of the development operation” (76%); “teamwork- how advancement staff work
together and how they work with the colleges and other campus departments” (76%);
“organizational structure of the development operation” (76%); and “distribution of revenue
sources to support advancement, as those funding sources vary greatly depending on whether the
institution is public or private” (76%). The complete list of responses can be found in Appendix
F.
Research Question 5
How do expert fundraising analysts suggest a comprehensive model to determine success
in university fundraising be organized or segmented?
Sixteen participants responded to this question, which is a 94% response rate for question
5 of round two. One participant indicated that she was not sure how a comprehensive model
could be organized or segmented to some of the suggestions; therefore, her responses were
included in the ‘not sure’ category on the complete list of responses (See Appendix G).
Some of the suggestions related to the process of organizing or segmenting a
comprehensive model with the greatest amount of agreement were by: “gift level and/or by
college or area” (82%); “organizational structure” (76%); “maturity of program, start-up or

71
established” (76%); “if the university is in a campaign” (76%); “development budget/resource
development (research and analytics) budget” (76%); “number/percentage/ratio of active
volunteer solicitors (if ratio, to paid staff or dollars raised)” (76%); and “dollars raised to solicit-
able population” (76%). The complete list of responses can be found in Appendix G.
Research Question 6
What further implications do expert fundraising analysts suggest for a comprehensive
model to determine university fundraising success?
Sixteen participants responded to this question, which is a 94% response rate for round
one question 6.
Some of the further implications suggested that received the greatest agreement were: “a
reasonably favorable economic climate would be helpful to the success of fundraising” (88%);
“comparing institutions is very hard because of: bad data collection practices, management
mandates, fundraiser practices, disparity of sizes, age of the development programs, closeness of
alumni. Any model that compares and declares best fundraising operations much account for the
above factors” (82%); “Staff retention and turnover (Maybe it's a good thing that staff don't stay
forever, but maybe a bad thing that they only stay 18 months. What's the golden number for
success?). Review donor retention and loss (who loses donors least and why)” (82%); “the
constituents capable of making major gifts have a positive image of the university, strong and
stable internal leadership and capable staff support, a compelling and well-defined case for
support that is clearly understood and accepted by potential donors, ample funds to meet the
institution's campaign goals (represented by a sufficient number of willing potential donors), and
respected, capable volunteer leaders who are available and willing to commit the necessary time,
resources, and talent to the campaign” (82%); and “Senior management must be on board and

72
drive change that comes from this. Meetings and agendas for discussions must be shifted from
the tactical to strategic and be built on the stories that data tells. People must be willing to
change, to adjust to reality that comes from seeing old habits and patterns in new ways.” For a
complete list of responses to question 6 of round two, see Appendix H.
Summary of Round Two
The results of round two reflect the variety of ways to measure success of fundraising,
which were consistent with the review of literature. The responses were collected and added to
the comprehensive list of responses.
The round two responses were tallied to determine the level of agreement and
disagreement for each response from round one. The results were used to develop graphs and
tables for a report of all responses, which was used in round three. The comprehensive list of
responses and the report of all responses (for use in rounds three) were reviewed twice to ensure
proper compilation.
Construction and Methodology of Content Analysis: Round Three
For the third round the participants received a copy of the confirmability matrix (the
comprehensive list of responses for each question), a copy of the first and second round
responses to each unique participant to aid recall, and a report of all responses with graphs and
lists with the number in percentages of votes for inclusion by expert participant. This report
enabled participants to review how many participants agreed or disagreed with each response,
and compare with their own responses. In the third round the participants were asked to review
the second round responses in comparison with all the other responses for further reflection and
encourage consideration for the applicability of each variable. Furthermore, participants were
informed that they could change their second round response by updating the response.

73
If updates were made, participants were asked to include the reason for the change. In
cases where no updates were made participants were asked to confirm all existing responses. In
the third round 16 of the 17 participants responded, which is a 94% response rate for this round.
Research Question 1
Sixteen participants (94%) confirmed their responses for question 1 and had no changes
to their round two responses for question 1.
Research Question 2
Fifteen participants (88%) confirmed their responses for question 2. The remaining
participant who responded, Expert E, updated eight votes of disagreement to agreement, thus
increasing the level of agreement for the following other quantifiable measures suggested in
question 2: “new commitments at the major gift level” (88%), “annual giving response rate and
annual giving average gift size” (65%), “response rates of appeals” (76%), “alumni engagement
score- to replace alumni participation rate (some universities may have their own model)” (76%),
“number face-to-face visits” (88%), “ratio of first-time contacts with a prospect vs. repeat
contacts” (88%), “gift close rate= number of closed gifts/number of solicitations” (76%), and
“size (number) and potential (capacity) of major gift pipeline” (71%).
Due to the changes three of the above suggestions were increased to the level of
consensus. Expert E explained the reason for the changes as they did not agree with the full
responses but did agree with portions of the responses. The partial agreements were not clear in
round two. Therefore, the comprehensive list of responses was updated to reflect these changes.
Research Question 3
Sixteen participants (94%) confirmed responses for question 3, thus no changes were
updated to round two responses for question 3.

74
Research Question 4
Fifteen participants (88%) confirmed their responses for question 4. The remaining
participant who responded, Expert E, updated a vote of disagreement to agreement for “is there
any evidence of data-driven decision making” as a suggested nonquantifiable measure, which
increased the agreement level to 59%.
Expert E explained the reason for the change as they did not agree with the full response,
but did agree with this portion of the response. The partial agreement was not clear in round
two. Therefore, the comprehensive list of responses was updated to reflect the change.
Research Question 5
Fifteen participants (88%) confirmed responses for question 5. The remaining participant
who responded, Expert B, explained that the responses of “not sure” were “dependent upon if a
university was measuring success in comparison to other institutions (thereby, agree) or if a
university was measuring success of itself (thereby, disagree)”. Because the purpose of this
question was to ascertain how experts would suggest a comprehensive model to be organized or
segmented to enable comparison with other institutions, Expert B’s responses of ‘not sure’ were
changed to ‘agree’ in the comprehensive list of responses.
Accordingly, the following percentages of agreement were increased: “maturity of
program (start-up, more established)” (82%); “if the university is in a campaign (y/n)” (82%);
“development budget/resource development (research and analytics) budget/staff” (82%);
“number/percentage/ratio of active volunteer solicitors (if ratio, to paid staff or dollars raised)”
(82%); “dollars raised to solicit-able population” (82%); “size/type of university” (76%); “size of
largest comprehensive campaign” (76%); “size of fundraising operations team/size of frontline
fundraising team” (76%); “cost-of-living index for each region, although with national alumni

75
bases that would not work for all” (76%); “Carnegie classification/awarded degree level/private,
public/ location of university, setting” (71%); “funds raised by FTE student, major gift close rate,
percent of growth over a five year period” (71%); “size of annual fund” (65%); “quantitative and
qualitative metrics” (59%); and “interaction of frontline and advancement support” (35%).
Research Question 6
Sixteen participants (94%) confirmed responses for question 6, thus no changes were
updated to the round two responses for question 6.
Summary of Round Three
Round three provided the participants with the opportunity to further reflect on previous
responses, ensure that the researcher interpreted responses correctly, and update or confirm the
responses from round two. If changes were updated, participants were asked to provide the
reason for the change. As discussed previously within each question’s analysis, Expert E made
updates to responses for questions 2 and 4, and Expert B made updates to responses for question
5. The responses were collected and added to the comprehensive list of responses, and the
percentages of agreement were adjusted accordingly to reflect Expert B’s and Expert E’s
changes.

76
CHAPTER 5
INTERPRETATION, CONCLUSIONS, AND RECOMMENDATIONS
Review of the Study
In Chapter 1 the purpose of the study was introduced as to understand how expert
fundraising analysts implement, analyze, and prioritize quantifiable and nonquantifiable
measures of university fundraising success in order to determine which measures should be
included in a comprehensive model. The chapter also presented the six research questions for
this study. In Chapter 2 the literature in the field of university fundraising and fundraising
metrics was reviewed. In Chapter 3 the Delphi Technique method was presented as the proper
method for the purpose of this study. Chapter 4 included a description of the development of
each round’s questionnaire and an analysis of the responses.
This chapter presents conclusions for the responses to each question and
recommendations for further research. For the purpose of this study the percentage of consensus
is 76%, which is 13 of the 17 participants.
Research Question 1 Conclusions
Which quantifiable measures (return on investment, growth in giving reports, fundraiser
activity and performance, number of new and recaptured donors, number of annual fund donors
transitioned to major gift donors, and alumni participation rate) do expert fundraising analysts
suggest to include in a comprehensive model to determine success in university fundraising?
Of the six measures listed in question 1, four measures reached the consensus level (at
76% or higher), thus concluding that these measures should be included in a comprehensive
model to determine success in university fundraising. These quantifiable measures are: growth-

77
in-giving report (88%), number of new and recaptured donors (88%), fundraiser activity and
performance (82%), and return on investment (76%).
The remaining two measures, alumni participation rate and number of annual fund donors
transitioned to major gift donors did not reach a consensus level. For the number of annual fund
donors transitioned to major gift donors 71% agreed, 24% disagreed, and 6% did not respond,
thus the level of consensus was not reached for inclusion or exclusion. For alumni participation
rate, 47% agreed, 47% disagreed, and 6% did not respond, thus the level of consensus was not
reached for inclusion or exclusion.
Research Question 2 Conclusions
What other quantifiable measures do expert fundraising analysts suggest to include in a
comprehensive model to determine success in university fundraising?
Of the 66 other quantifiable measures suggested in question 2, 40 reached the consensus
level. Some of the other quantifiable measures suggested that reached the consensus level for
agreement were: “total amount raised in outright gifts or commitments” (94%), “total amount
raised per frontline gift officer and per advancement staff member” (88%), “annual fund growth
independent of any special campaigns” (88%), “number of face-to-face visits” (88%), “number
of major gifts solicited and closed” (82%), “donor counts (new, retained, recaptured, renewed,
upgraded, donor longevity)” (82%), “donors by gift band” (82%), “engagement- number
volunteering, serving on boards” (82%), “engagement- prospects RSVPing to events, attending
events, responding to e-mails, etc.” (82%), “if funding was met for stated goals/areas” (82%),
“prospect pool size” (82%), and “institutional investment in fundraising (budget)” (76%). The
remaining 26 did not reach the level of consensus for inclusion or exclusion, and therefore a
conclusion of whether they should or should not be included in a comprehensive model cannot

78
be formed in this study. See Appendix I for the complete list of responses for conclusion of
research question 2.
Research Question 3 Conclusions
Which nonquantifiable measures (personal forces, role forces, institutional forces,
environmental) do expert fundraising analysts suggest to include in a comprehensive model to
determine success in university fundraising?
Of the four forces listed in question 3, two reached the consensus level. Institutional
forces and environmental forces each received consensus level at 76% for agreement, thus
concluding that they should be included in a comprehensive model to determine success in
university fundraising.
The remaining two forces, personal (71% agreed) and role (65% agreed), did not reach
the consensus level for inclusion or exclusion. Therefore, whether personal forces and roles
forces should or should not be included in a comprehensive model cannot be concluded in this
study.
Research Question 4 Conclusions
What other nonquantifiable measures do expert fundraising analysts suggests to include
in a comprehensive model to determine success in university fundraising?
Of the 17 nonquantifiable measures suggested, four reached the consensus level as:
“maturity of the development operation” (76%), “teamwork- how advancement staff work
together and how they work with the colleges and other departments within the university”
(76%), “organizational structure of the development operation” (76%), and “distribution of
revenue sources to support advancement” (76%). The aforementioned measures reached
consensus level, thus concluding that they should be included in a comprehensive model to

79
determine success in university fundraising. The remaining 14 nonquantifiable measures
suggested did not reach consensus level for inclusion and exclusion, thus whether or not they
should be included in a comprehensive model cannot be concluded in this study. See Appendix J
for the complete list of nonquantifiable measures suggested with the percentage of participants
that agreed, disagreed, or did not respond.
Research Question 5 Conclusions
How do expert fundraising analysts suggest a comprehensive model to determine success
in university fundraising be organized or segmented?
Of the 23 suggestions of how a comprehensive model should be organized or segmented,
11 reached the consensus level, such as by: “gift level and/or by college or area” (82%),
“maturity of the program (start-up, more established)” (82%), “if the university is in a campaign”
(82%), “development budget/resource development (research and analytics) budget/staff” (82%),
“number/percentage/ratio of active volunteer solicitors (if ratio, to paid staff or dollars raised)”
(82%), “dollars raised to solicit-able population” (82%), “organizational structure” (76%),
“size/type of the university” (76%), “size of largest comprehensive campaign” (76%), “size of
fundraising operations team/size of frontline fundraising team” (76%), and “cost-of-living index
for each region although with national alumni bases that would not work for all” (76%). The
aforementioned suggestions reached the level of consensus, thus concluding these should be
considered ways that a comprehensive model are to be organized or segmented.
The remaining 12 suggestions did not reach consensus level for inclusion and exclusion,
thus agreement for inclusion in a comprehensive model cannot be concluded in this study. See
Appendix K for the complete list of ways suggested of how to organize or segment a

80
comprehensive model with the percentage of participants who agreed, disagreed, or did not
respond.
Research Question 6 Conclusions
What further implications do expert fundraising analysts suggest for a comprehensive
model to determine university fundraising success?
Of the 11 implications suggested, five reached the consensus level, thus can be concluded
that these implications should be considered with a comprehensive model to determine university
fundraising success. The five implications that reached the consensus level for agreement are:
“to be successful, a reasonably favorable climate would help” (88%); “Comparing institutions is
very hard because of: bad data collection practices, management mandates, fundraiser practices,
disparity of sizes, age of the development programs, closeness of alumni. Any model that
compares and declares best fundraising operations much account for the above factors” (82%);
“staff retention/turnover (maybe it's a good thing that staff don't stay forever, but maybe a bad
thing that they only stay 18 months. What's the golden number for success?) and donor
retention/loss (who loses donors least and why” (82%); to be successful a university will need
“A positive image amount constituents capable of making major gifts, strong and stable internal
leadership and capable staff support, a compelling and well-defined case for support that is
clearly understood and accepted by potential donors, ample funds to meet the institution's
campaign goals represented by a sufficient number of willing potential donors, and respected,
capable volunteer leaders who are available and willing to commit the necessary time, resources,
and talent to the campaign” (82%); and “Senior management must be on board and drive change
that comes from this. Meetings and agendas for discussions must be shifted from the tactical to

81
strategic and be built on the stories the data tells. People must be willing to change, to adjust to
reality that comes from seeing old habits and patterns in new ways” (76%).
The remaining six implications did not reach consensus level for inclusion and
exclusion, thus whether or not they should be included in a comprehensive model cannot be
concluded in this study. See Appendix L for the complete list of further implications suggested
for a comprehensive model with the percentage of experts who agreed, disagreed, or did not
respond.
Recommendations for Policy
As each university is different from others, one university may consider a variable
necessary to measure fundraising success, while another university may not. Universities should
identify the variables of fundraising success that may be specific to their institution, mission, or
goals and develop a policy to set the identified variables as critical to determine fundraising
success.
In addition, a participant declared that university advancement and the practice of
fundraising should be institutionalized. Faculty, staff, friends, alumni, students can all impact
the effectiveness of university advancement; therefore, should define and embrace their role in
the fundraising process.
Recommendations for Practice
From the results of this study the suggestions with the highest level of agreement with
consideration to the review of literature, should frame a comprehensive model to guide
practitioners on measuring university fundraising effectiveness.
The suggested quantifiable metrics are: growth-in-giving report, donor counts, fundraiser
activity and performance, and total amount raised in outright gifts and commitments. The

82
suggested nonquantifiable metrics are the four types of intervening variable forces: personal,
role, institutional, and environmental forces (Cook & Lasher, 1996). In addition, the suggested
ways to organize or segment a model are by gift level and by college or area, organizational
structure, maturity of the program, and if the university is in a campaign (y/n).
Quantifiable Metrics
A growth-in-giving report should be used as Levis and Williams (2011) recommended “it
is necessary to analyze both the fundraising gains and the fundraising losses from one year to the
next so that you and your organization’s leadership can make growth-oriented decisions about
both fundraising budgets and strategies (p. 36-37). Gains in giving are gifts by new donors and
recaptured lapsed donors and increases in gift amounts by upgraded donors. Losses are the
decreases in gift amounts by downgraded donors and lost gifts from lapsed new and lapsed
repeat donors. “The net increase (or decrease) is the net of total gains minus total losses” (p. 37).
Metrics of donor counts should measure the increase and decrease in the percent of new,
recaptured, retained, upgraded, downgraded, and lapsed donors. In addition, metrics of donor
counts should measure the percent of donors by gift and capacity bands.
Fundraiser activity and performance metrics should use the fundraiser return on
investment (ROI) report. Collins (2013) recommended that the following activities should be
included in a ROI report: number of personal visits, percentage of unique visits, proposals
submitted, number of gifts closed, total amount of gifts closed, assists/shared credits, and
multiple of total compensation. “To calculate the percentage of unique visits, divide the number
of prospects visited by the number of visits made” (p. 2). The percentage of unique visits and
others listed above are not a part of the ROI calculation but should be included in the report “to
provide context to the fundraiser’s performance” (p. 6). Furthermore, fundraiser performance

83
ROI can be determined by dividing the total amount raised by the cost of employment (Collins,
2013).
The total amount raised in outright gifts and commitments should also be included in a
comprehensive model. For commitments of planned or deferred gifts practitioners should use
three accounting summaries as defined by Greenfield (1999):
(1) bequests received and the value of planned gifts at maturity, (2) fair market value and
net present value of irrevocable planned gifts in force for which the organization is
trustee, and (3) the same two values for irrevocable planned gifts for which the
organization is not trustee. Other details of value that may be included are the type of
planned gift, initial contribution value, date executed, age of the donor, percentage
payout, and income distribution schedule. (p. 307)
Nonquantifiable Metrics
The suggested nonquantifiable metrics to be included in a comprehensive model are the
four intervening variable forces (Cook & Lasher, 1999). These forces are defined as
Personal: the established habits, leadership styles, personality traits,
administrative and educational experiences, needs, attitudes, values, beliefs,
interpersonal skills, among other things
Role: self-imposed or self-created role expectations, and external expectations
Institutional: the established traditions, history, culture, norms, sanctions, taboos,
rituals, rewards, wealth, constituencies, capabilities, strengths and weaknesses,
market position, size, maturity, prestige, and quality of the governing board,
students, faculty, and alumni

84
Environmental: the capacity of the donor base; wealth and philanthropic tradition
of the local community, region and state; proclivity of the surrounding area to
natural disasters; unemployment rate; inflation rate; state of the economy; federal
tax policy; competition from other nonprofits; public opinion toward higher
education, etc. (p. 20)
Although personal and role forces did not reach the consensus level in this study,
examples of the personal and role forces did reach the consensus level such as “teamwork- how
advancement staff work together and how they work with the colleges and other departments
within the university” (personal and role forces).
Maturity level and organizational structure of the university advancement program and
the distribution of revenue sources to support university advancement all reached the consensus
level at 76% and are examples of institutional forces. Organizational structure may also be an
example of role forces, and the distribution of revenue sources to support university
advancement is also an example of environmental forces.
Organization
The suggested ways to organize or segment a model are by gift level and by college or
area, organizational structure, maturity of the program, and if the university is in a campaign
(y/n). These suggestions may be helpful in comparison with other institutions with the ability to
identify peer university advancement programs that have similar elements. However, if one
university used the model, the suggestions should still be included to provide more context to the
review of fundraising effectiveness.
Finally, the aforementioned suggestions are displayed as a proposed concept map in
Figure 5.

85
Figure 5. Proposed comprehensive model to measure university fundraising effectiveness.
Recommendations for Further Research
This study confirmed several measures that should be included in a comprehensive model
to measure university fundraising success. For example, if University A measured all the metrics
in a comprehensive model, and determined they were successful in 7 of the 12 metrics, it may
helpful to know if they were successful in the most important metrics. This may vary by
institution, as one university may consider certain metrics more important because those metrics
align to and measure the goals or mission of the university. However, it may still be valuable, in
order to establish standards within a comprehensive model.
Although several articles discuss and recommend return on investment as a way to
measure fundraising success, the metric appears to need further clarification of definition, and
implementation. Of the experts in this study that did not suggest return on investment, one noted

86
confusion on the metric as an analyst, in addition to university advancement administrators who
would review the metric. Similarly, two other experts noted that they would agree to the use of
the metric if it was reviewed with the focus on the return and not on the costs. The experts noted
it should not be measured as cost per dollar raised. However, cost per dollar raised is a different
metric; hence, a possible need for further definition.
In addition, future research could include a case study applying the suggested metrics for
a comprehensive model to determine university fundraising effectiveness. Such a study, may
determine if a comprehensive approach could enable the participating university advancement
staff to: understand more about performance and outcome data, increase strategy, and better
advocate to leaders for investment in fundraising.
Within this study a participant noted the importance of staff turnover and stated “maybe
it’s a good thing that they don’t stay forever, but a bad thing that they only stay 18 months,
what’s the golden number of success”. Therefore, future research could seek to determine the
golden number of success in fundraising staff retention.
Furthermore, future research could identify and provide perspective on the impact of
university fundraising within the university, its constituents, and the surrounding community.
This type of study may enlighten university constituents on the impact of university fundraising,
as well as how their roles impact university fundraising.

87
REFERENCES
American Association of State Colleges and Universities. (2013). Top 10 higher education state
policy issues for 2013. Retrieved March 18, 2014, from http://www.aascu.org/policy/
publications/policy-matters/topten2013.pdf
Anfara, V., Brown, K., & Mangione, T. (2002). Qualitative analysis on stage: Making the
research process more public. Educational Researcher, 31(7), 28-38.
Association of Fundraising Professionals. (2003). AFP fundraising dictionary. Retrieved March
18, 2014 from http://www.afpnet.org/files/ContentDocuments/AFP_Dictionary_A-
Z_final_6-9-03.pdf
Association of Fundraising Professionals. (2008). Measuring and reporting fundraising costs:
Guidelines for board members. Retrieved March 19, 2014, from http://www.afpnet.org
/files/AFPChapters/CN4/MeasuringandReportingFundraisingCosts
Avolio, B., Avey, J., & Quisenberry, D. (2010). Estimating return on leadership development
investment. The Leadership Quarterly, 21(4), 633-644.
Baker, J., Lovell, K., & Harris, N. (2006). How expert are the experts? An exploration of the
concept ‘expert’ within Delphi panel techniques. Nurse Researcher, 14(1), 59-70.
Barber, P., & Levis, W. (2013). Donor retention matters. Retrieved May 23, 2015, from
http://www.urban.org/research/publication/donor-retention-matters
Barr, M., & McClellan, G. (2011). Budgets and financial management in higher education. San
Francisco, CA: Jossey-Bass.
Barrett, S. (2013). Assessing and measuring total resource development within college and
university institutional advancement offices. Retrieved December 13, 2014, from
https://www.academia.edu/Assessing_and_Measuring_Total_Resource_Development
Bernstein, A. (2014). Funding the future: Philanthropy’s influence on American higher
education. Lanham, MD: Rowman & Littlefield.
Berry, P. (2014). Annual giving: Recommended practices for universities based on current
literature, conversations with professionals, and personal experience. Honors College
Theses. ScholarWorks at UMASS Boston. Retrieved January 18, 2014, from
http://scholarworks.umb.edu/cgi/viewcontent.cgi?article=1002&context=honors_theses
Birks, M., Chapman, Y., & Francis, K. (2008). Memoing in qualitative research: Probing data
and processes. Journal of Research in Nursing, 13(1), 68-75. doi:
10.1177/1744987107081254

88
Breslow, J. (2007). Updates on billion-dollar campaigns at 31 universities. Chronicle of Higher
Education. Retrieved May 1, 2014 from http://chronicle.com/article/Updates-on-Billion-
Dollar
Ciconte, B. (2007). Developing fundraising policies and procedures. Association of Fundraising
Professionals. Retrieved April 18, 2014, from http://www.afpnet.org/files/Content
Documents/9%20Developing%20Fundraising%20Policies%20and%20Prodedures.pdf
Cook, W., & Lasher, W. (1996). Toward a theory of fund raising in higher education.
Association for the Study of Higher Education. Retrieved January 2, 2015, from
https://muse.jhu.edu/journals/review_of_higher_education/v020/20.1cook.html
Collins, C. (2013). Science behind the art: ROI for frontline fundraisers. Retrieved April 18,
2014, from http://www.supportingadvancement.com/revenue/general/carrie_collins_
science_and_ROI_behind_fundraising.pdf
Creswell, J. (2002). Educational research: Planning, conducting, and evaluating quantitative
and qualitative research. Upper Saddle River, NJ: Merrill Prentice Hall.
Creswell, J. (2013). Qualitative inquiry and research design: Choosing among five approaches.
(3rd ed.). Thousand Oaks, CA: Sage.
Donohoe, H., & Needham, R. (2009). Moving best practice forward: Delphi characteristics,
advantages, potential problems, and solutions. International Journal of Tourism
Research, 11(5), 415-437.
Dove, K. (2000). Conducting a successful capital campaign. (2nd ed.). San Francisco, CA:
Jossey-Bass.
Drezner, N. (Ed.). (2011). Philanthropy and fundraising in American higher education.
Association for the Study of Higher Education Report, 37(2), 1-155.
doi: 10.1002/aehe.3702
Ernst & Young LLP. (2009). 2008 Internal revenue service colleges and universities compliance
questionnaire analysis. Retrieved March 20, 2014, from http://www.nacubo.org/
Documents/BusinessPolicyAreas/AGB_NACUBO_IRS_Compliance.pdf
Fundraising metrics that matter. (2014). The Major Gifts Report, 16(10), 2.
Gerrity, M. (2003). Return on investment in fund raising: Using ROI to your advantage.
Retrieved March 10, 2014, from http://greenmountainfundraising.com/PDFs
/ROIArticleGMF.pdf
Gonyea, R. (2005). Self-reported data in institutional research: Review and recommendations.
New Directions for Institutional Research, 2005(127), 73-89. doi: 10.1002/ir.156

89
Gose, B. (2013). Strategic philanthropy comes to higher education. The Chronicle of Higher
Education. Retrieved June 4, 2014, from http://chronicle.com/article/Strategic-
Philanthropy-Comes/140299/
Grabau, T. (2012). Major gift metrics that matter. Colloquy, 20(2), 36-40.
Greenfield, J. (1999). Fund raising: Evaluating and managing the fund development process.
New York, NY: John Wiley & Sons.
Greenfield, J. (2005). Hardwiring for maximum fundraising return on investment. New
Directions for Philanthropic Fundraising, (49), 61-85.
Hasson, F., Keeney, S., & McKenna, H. (2000). Research guidelines for the Delphi survey
technique. Journal of Advanced Nursing, 32(4), 1008-1015.
Hedgepeth, R. (2000). How public colleges & university foundations pay for fundraising. The
Association of Governing Boards of Universities and Colleges & Council for
Advancement and Support of Education. Retrieved June 9, 2014, from
http://agb.org/sites/agb.org/files/How-Publics-Pay-for-Fundraising.pdf
Hiles, T. (2010). Determining the success of fundraising programs. New Directions for Higher
Education, 2010(149), 51-56. doi: 10.1002/he.38014
Holmes, R. (2010). The challenge of funding fundraising. New Directions for Higher Education,
2010(149), 27-38. doi: 10.1002/he.38014
Hopkins, B. (2009). The law of fundraising. (4th ed.). Hoboken, NJ: John Wiley & Sons. Hsu,
C., & Sandford, B. (2007). The Delphi technique: Making sense of consensus. Practical
Assessment, Research & Evaluation, 12(10), 1-7. Retrieved September 14, 2014, from
http://pareonline.net/pdf/v12n10.pdf
Iarrobino, J. (2006). Turnover in the Advancement profession. International Journal of
Educational Advancement, 6(2), 141-169. doi:10.1057/palgrave.ijea.2150013
Johnson, B. (2010). Sustaining higher learning: Endowment building and financing higher
education. Comparative and Higher Education, 2, 33-36. Retrieved October 22, 2014,
from http://www.higheredsig.org/cihe/Number02-12.pdf
Kennedy, H. (2004). Enhancing Delphi research: Methods and results. Journal of Advanced
Nursing, 45(5), 504-511.
Krefting, L. (1991). Rigor in qualitative research: The assessment of trustworthiness. American
Journal of Occupational Therapy, 45(3), 214-222. doi:10.5014/ajot.45.3.214
Kroll, J. (2012). Benchmarking investments in advancement. Council for Advancement and

90
Support of Education. Retrieved July 13, 2014, from http://www.case.org/Login-
x913.html?redir=http%253A%252F%252Fwww.case.org%252FDocuments%252Fprotec
ted%252Fwhitepapers%252FAIMS_March2012.pdf
Lajoie, S. (2002). Weighing dollars with sense. Council for Advancement and Support of
Education. Retrieved March 13, 2014, from http://www.case.org/Login-
x913.html?redir=http%253A%252F%252Fwww.case.org%252FPublications_and_Produ
cts%252F2002%252FFebruary_2002%252FWeighing_Dollars_with_Sense.html
Lapovsky, L. (2007), Critical endowment policy issues. New Directions for Higher Education,
2007, 99–110. doi: 10.1002/he.284
Levis, W., & Williams, C. (2011). A better measure of success. Advancing Philanthropy, 35-41.
Retrieved April 28, 2014, from http://www.urban.org/sites/default/files/alfresco/
publication-pdfs/1001554-A-Better-Measure-of-Fundraising-Success.PDF
Lincoln, Y., & Guba, E. (1985). Naturalistic inquiry. Newbury Park, CA: Sage.
Linstone, H. A., & Turoff, M. (1975). The Delphi method: Techniques and applications.
Reading, MA: Addison-Wesley.
Merriam, S.B. (1998). Qualitative research and case study applications in education.
San Francisco, CA: Jossey-Bass.
Mitchell, M., Palacious, V., & Leachman, M. (2014). States are still funding higher education
below pre-recession levels. Center on Budget and Policy Priorities. Retrieved December
13, 2014, from http://www.cbpp.org/cms/?fa=view&id=4135
Moody’s Investor Service. (2013). US Higher Education outlook negative in 2013. Retrieved
April 14, 2014, from http://www.marquette.edu/budget/documents/USHigher
EducationOutlookNegativein2013.pdf
National Center for Education Statistics. (2013). Digest of education statistics: 2012. Retrieved
April 14, 2014, from http://nces.ed.gov/programs/digest/d12/ch_3.asp
New York Times Magazine. (2008). How many billionaires does it take to fix a school system?.
Retrieved September 13, 2014, from http://www.nytimes.com/2008/03/09/magazine/
09roundtable-t.html?pagewanted=all
Pallotta, D. (2013, March). The way we think about charity is dead wrong. [Video file].
Retrieved November 8, 2014, from http://www.ted.com/talks/dan_pallotta_the_way_we_
think_about_charity_is_dead_wrong
Parry, M., Field, K., & Supiano, B. (2013). The Gates effect. Chronicle of Higher Education.
Retrieved November 11, 2014, from http://chronicle.com/article/The-Gates-
Effect/140323/

91
Phillips, J., & Phillips, P. (2004). The business case for ROI: Measuring the return on investment
in human resources. ROI Institute. Retrieved April 4, 2014, from http://www.roiinstitute.
net/wp-content/uploads/2014/12/BUSINESS-CASE-IN-HR-Website-12-2004.pdf
Proper, E., Caboni, T., Hartley, H., & Willmer, W. (2009). ‘More bang for the buck’: Examining
influencers of fundraising efficiency and total dollars raised. International Journal of
Educational Advancement 2009(9), 35-41. doi:10.1057/ijea.2009.19
Rhodes, F. (Ed). (1997). Successful fund raising for higher education. Phoenix, AZ: The Oryx
Press.
Rockefeller Foundation. (2014). Moments in time: 1940-1949. Retrieved January 2, 2015, from
http://www.rockefellerfoundation.org/about-us/our-history/1940-1949
Rooney, P. (1999). A better method for analyzing costs and benefits of fundraising at
universities. Nonprofit Management and Leadership, 10(1), 39-56.
Saregeant, A., & Jay, E. (2014). Fundraising management: Analysis, planning, and practice.
Abingdon, VA: Routledge.
Sargeant, A., & Shang, J. (2010). Fundraising principles and practice. San Francisco, CA:
Jossey-Bass.
Scales, J. (2008). Capital and annual giving can work together. Philanthropy Journal. Retrieved
December 12, 2014, from http://news.chass.ncsu.edu/?p=19136
Silverman, D. (Ed.). (2011). Qualitative research. (3rd ed.). Thousand Oaks, CA: Sage.
Speck, B. (2010). The growing role of private giving in financing the modern university. New
Directions for Higher Education, 2010(149), 7-16. doi: 10.1002/he.38014
Stickland, S. (2009). The Kalamazoo promise: A study of philanthropy’s increasing role in the
American economy and education. International Journal of Educational Advancement,
2009(9), 16-34. doi:10.1057/ijea.2009.18
Strout, E. (2006). Cornell U. to announce $4-billion campaign, joining flurry of big new fund
drives. The Chronicle of Higher Education. Retrieved January 5, 2014, from
http://chronicle.com/article/Cornell-U-to-Announce/119326/
Stuart, R. (2013). Like nailing jell-o to the wall. CURRENTS, 39(6), 18-23.
Thangaratinam, S., & Redman, C. (2005). The Delphi technique. Royal College of Obstetricians
and Gynecologists, 7, 120-125.
Thelin, J., & Trollinger, R. (2014). Philanthropy and American higher education. New York,

92
NY: Palgrave Macmillan.
WealthEngine. (2010). Measuring fundraising return on investment and the impact of prospect
research: Factors to consider. Retrieved July 4, 2014, from http://info.wealthengine.com/
Return-on-Investment-May-2010.pdf
WealthEngine. (2013). Measuring fundraising return on investment and the impact of wealth
intelligence. Retrieved August 8, 2014, from http://info.wealthengine.com/measuring
fundraisingroi.html
Williams, P., & Webb, C. (1994). The Delphi technique: A methodological discussion. Journal
of Advanced Nursing, 19(1), 180-186. doi: 10.1111/j.1365-2648.1994.tb01066.x
Worth, M. (1993). Educational fund raising: Principles and practice. Phoenix, AZ: Oryx
Press/American Council on Education.
Worth, M. (2010). Leading the campaign: Advancing colleges and universities. Lanham, MD:
Rowman & Littlefield.
93
APPENDIXES
Appendix A
Institutional Review Board Approval Letter
Office for the Protection of Human Research Subjects Box 70565 Johnson City, Tennessee 37614-1707
Phone: (423) 439-6053 Fax: (423) 439-6060
IRB APPROVAL – Initial Exempt
April 3, 2015
Krystal Wilson
RE: Determining Effectiveness in University Fundraising
IRB#: c0315.21e ORSPA#: ,
On April 2, 2015, an exempt approval was granted in accordance with 45 CFR 46.
101(b)(). It is understood this project will be conducted in full accordance with all
applicable sections of the IRB Policies. No continuing review is required. The exempt
approval will be reported to the convened board on the next agenda.
xform New Protocol Submission; Association/Listserv Permission; Email Script;
Consent (stamped approved 4/2/2015); Survey; CV
Projects involving Mountain States Health Alliance must also be approved by
MSHA following IRB approval prior to initiating the study.
Unanticipated Problems Involving Risks to Subjects or Others must be reported to the
IRB (and VA R&D if applicable) within 10 working days.
Proposed changes in approved research cannot be initiated without IRB review and approval. The only exception to this rule is that a change can be made prior to IRB approval when necessary to eliminate apparent immediate hazards to the research
subjects [21 CFR 56.108 (a)(4)]. In such a case, the IRB must be promptly informed of

94
the change following its implementation (within 10 working days) on Form 109 (www.etsu.edu/irb). The IRB will review the change to determine that it is consistent with ensuring the subject’s continued welfare.
Sincerely,
Stacey Williams, Chair ETSU Campus IRB
Cc:
Accredited since December 2005

95
Appendix B
Informed Consent Letter
Consent for Participation in Questionnaire Research
I volunteer to participate in a research project conducted by Krystal Wilson, a doctoral
candidate at East Tennessee State University. I understand that the project is designed to gather
information about determining university fundraising effectiveness, and that I will be one of
approximately 20 participants for this research.
1. My participation in this project is voluntary. I understand that I will not be paid for my
participation.
2. I understand that my identity will remain anonymous for the purpose of this research, and that
my confidentiality as a participant in this study will remain secure.
3. Participation involves three rounds of questionnaires that will be distributed and collected via
email. Each participant will be emailed separately for anonymity purposes. Each
questionnaire will be due to the researcher within two weeks of distribution. The first round
will include multiple choice and open-ended questions regarding how to determine university
fundraising effectiveness. The second round will include a list of all first round responses. If a
response is listed with a number, then the response was provided by that many participants. In
the second round, I am to decide which items should be included as the response for each
question. For the third round, I will receive a copy of my responses from the second round,
and I will have the opportunity to review those responses, and indicate changes if needed. If I
change my response, I must notate the reason for my change. After the completion of the third
round, the researcher will provide each participant with a report of findings.
4. I understand that there is a potential risk of loss of confidentiality, as security of email cannot
be guaranteed. Emails will include each round’s questionnaire attached as a .PDF form that is
encrypted with a password.
5. I understand the research technique used for this study is designed to reach consensus from an
expert panel of participants. However, if I do not agree to a response, I should notate as so and
state my reasoning. The study’s value will not decrease if full consensus is not reached, rather
may uncover a need for further research.
6. I understand that the selection criteria to be considered an expert fundraising analyst for this
study is as follows:
Have nationally recognized work, such as published books within the last 10
years or articles that have been written in the profession’s journals, such as
CURRENTS, Connections, Philanthropy Journal or available through the Council
for Advancement and Support of Education or the Association of Fundraising
Professionals’ website;

96
Presented at international and national association conferences (Association of
Prospect Researchers for Advancement, Association of Fundraising
Professionals’, DRIVE); or,
Received awards from international or national associations for work in
fundraising analytics.
7. I understand that this research study has been reviewed and approved by the Institutional
Review Board (IRB) for Studies Involving Human Subjects: Behavioral Sciences Committee
at East Tennessee State University. For research problems or questions regarding subjects, the
Institutional Review Board may be contacted through Amber Anderson at 423-439-6002.
8. I have read and understand the explanation provided to me. I have had all my questions
answered to my satisfaction, and I voluntarily agree to participate in this study.
9. I have been given a copy of this consent form.
10. By participating in this study, I understand that I am indicating my consent.
For further information, please contact:
Krystal Wilson

97
Appendix C
Round 1 Question 2 Reponses
Other Quantifiable Measures Suggested by Expert Panel
Donors
“Donor Counts (New, Retained, Recaptured, Renewed, Upgraded, Donor Longevity)”
“Donors by gift band”
“Donor retention”
“Number of donors”
“Growth in different types of donors (new donors, planned giving donors, etc.)”
“Percent of LYBUNTS/SYBUNTS or lapsed donors”
Giving
“Total amount raised in outright gifts or commitments for future gifts”
“Total amount raised (per frontline gift officer, per advancement staff member)”
“Annual Fund Growth independent of any special campaigns”
“Average and median giving (is that increasing over time?)”
“Baseline giving while not in active campaign”
“Distribution of gifts by alumni, non-alumni, corporations, foundations, etc.”
“Generational giving (what did your best current donors do when they were younger in terms
of giving, and how does that compare to current younger donors?)”
“New commitments at major gift level”
“Percent of total dollars from the top 1%, top 5%, top 10%, as a measure of breadth of the
base”
“Yearly comparison of major gift commitments and yearly comparison of major gift
solicitations to determine if the number and amounts are increasing, steady, or decreasing”
“Giving velocity among current donors to measure growth of giving among retained/current
donors (annual fund and major gift)”
“Percentage of cash brought in of the total university revenue”
“Percentage of cash brought in of endowment size”
“Ratio of top 1% of gifts of bottom 99% of gifts”
“Average gift size at major gift level and principal gift level”
“Funds raised per FTE Student”
“Annual giving response rate. Annual giving average gift size”
“Volunteer giving”
Engagement
“Engagement activities- prospects that RSVP to events, attend events, respond to emails, etc.”
“Engagement-number volunteering, promoting-NPS, serving on boards)”
“Engagement- number of unique event attendees, are major gift prospects attending events”

98
Engagement continued
“Engagement: # completed calls for telemarketing, response rates for direct mail, and open
click rates for email solicitations”
“Open and click rates for newsletters”
“Direct mail, call center, email blast, and social media response rates”
“Special event responses (campaign event attendance, one day drives, membership drives,
etc.)”
“Response rates of appeals”
“Alumni engagement score”
“Constituent Participation Rate”
Costs/Investment
“Institutional investment in fundraising (budget). Investment into each organizational function
(operations, major giving, annual giving, etc.)”
“Costs of human resources and infrastructure needed (additional considerations with regard to
ROI)”
Fundraiser Activity and Performance
“Number of major gifts solicited and closed”
“Number of face-to-face visits”
“Ratio of first-time contacts with a prospect vs. repeat contacts”
“Gift Close Rate= # of closed gifts/# of solicitations”
“Ratio of number of visits to number of full time gift officers. Ratio of asks to number of full
time gift officers. Ratio of asks to number of prospects in portfolios”
“Ratio of median gift size to number of full time gift officers”
“S&P bond ratings”
“Number of weekly contacts (phone calls) to donors either to say thank you or to update them
on what their contributions have accomplished”
Other
“Funding met for stated goals/areas”
“Prospect pool size (total and in capacity bands)”
“Where have we failed? Annual reports often focus only on positive”
“Compound annual growth rate”
“Time required to produce certain reports or respond to common requests”
“Outcome Metrics: How much did we raise this year compared to last year? How much did we
raise compared to our plan? How much did we raise compared to our peers?”
“Acquiring transformational gifts”
“Conversion rate of newly identified prospects to donors”
“Percent of alumni with good contact information”
“Good fiduciaries with money we’re given (spending gifts as donor intended, investing
endowed funds wisely)”

99
Other continued
“Two sides of this: a. Major giving
Size of the assigned pool
Expected $$ value of assigned pool, and trend over time
Quality of assigned pool (capacity, and attachment level of prospects assigned)
% of pool penetration (% of assigned prospects that have had meaningful engaged in the last
12 months)
Stage Movement (average time in each prospect stage not exceed standards)
Ask levels relative to expected value of the prospects (is value of sum of all asks at least 3x the
current year expected value; expected value= capacity *attachment* liquidity
Yield rate (actual closed amounts rationed to ask amounts; should be 25%+)
b. Annual giving
$ amounts over time
Participation rate over time
Current donor retention rate over time
Lapsed donor re-acquisition rate over time
Non-donor acquisition rate over time
Appeal yields (# of appeals resulting in a gift/ # appeal sends, by appeal and appeal program;
by message and group)
# Solicitation touches per prospect in last 12 months; subdivide by current, lapsed, and non-
donor groups
% upgrade vs. downgrade, vs. stable (upgrade = up 20% + YTY, downgrade= down 20%+
YTY)”
“Count dollars raised per dollar spent on advancement”
“Size (number) and potential (capacity) of major gift pipeline”
“Number of Lost Alumni”
“Time to process gifts and thank donors”
“Donor Experience Survey (survey-what they like/don’t like about the way we thank,
recognize, steward them)”
“Conversion ratio of rated prospects at a gift level (e.g. 100 prospects rated at $50,000 but only
5% of those donors have given $50,000+ versus 20% "converting at or above their rated level”
“Presence of a medical center, intercollegiate athletics, other substantial non-degree granting
programs or programs with non-alumni constituencies, macro-economics- comparison to
giving trends, regional economic health, etc., business model (centralized, decentralized, open
cultivation, regional major gifts, program-based major gifts, in-house talent management)”
“Staff retention, recruitment, and performance, age of institution, age of advancement
program, salaries of key roles”
“Staff experience in years in role”

100
Appendix D
Round 1 Question 5 Reponses
Suggestions on How to Organize or Segment a Comprehensive Model “Gift Level and/or by College or Area”
“Organizational Structure”
“Maturity of program (start-up, more established)”
“If the university is in a campaign (y/n)”
“Development budget/ Resource development (Research and Analytics) Budget/staff”
“Number/percentage/ratio of active volunteer solicitors (if ratio, to paid staff or dollars raised)”
“Dollars raised to solicit-able population”
“Size of university/ Type of university”
“Size of largest comprehensive campaign”
“Size of fundraising operations team/ Size of frontline fundraising team”
“Cost-of-living index for each region, although with national alumni bases that would not work
for all”
“Carnegie classification/Awarded degree level/Private, Public/ Location of university, setting”
“Funds raised by FTE student, major gift close rate, percent growth over a five year period. Find
those who are doing the best, and measure against those”
“Size of annual fund”
“By gift band (annual giving, major gifts, leadership gifts). Different techniques and measures
for each segment”
“Organize metrics around the behavior you want to see in all of your constituencies”
“Model paradigms- Open cultivation, centralized/decentralized model”
“1) Begin with annual and lifetime production numbers. Followed by comparative breakdowns
by sources and designations. 2) Overview investment/budget, staffing, and business model. 3)
Provide ROI analysis respective 1 & 2. 4) Present data with context of average and outer bounds
overall and respective of like institutions. 5) Present specifics or confounding factors from the
other qualitative/quantitative measures”
“Quantitative and Qualitative metrics”
“Hierarchically- at the very top is dollars raised, and all other components are next level down”
“Centralized but have input from all divisions, schools, and departments. Suggestion for
improvement should be sought from alumni and donors at all levels.”
“Interaction of frontline and advancement support”
“Define the features present in successful programs, and the features absent in less successful
programs”

101
Appendix E
Round 2 Question 2 Responses
Other Quantifiable Measures Suggested by Expert Panel
Agreed
Disagreed No
Response
Donors
“Donor Counts (New, Retained, Recaptured, Renewed,
Upgraded, Donor Longevity)”
82%
12%
6%
“Donors by gift band” 82% 12% 6%
“Donor retention” 76% 18% 6%
“Number of donors” 76% 18% 6%
“Growth in different types of donors (new donors, planned
giving donors, etc.)”
76%
18%
6%
“Percent of LYBUNTS/SYBUNTS or lapsed donors” 71% 24% 6%
Giving
“Total amount raised in outright gifts or commitments for
future gifts”
94%
6%
“Total amount raised (per frontline gift officer, per
advancement staff member)”
88%
6%
6%
“Annual Fund Growth independent of any special
campaigns”
88%
6%
6%
“Average and median giving (is that increasing over time?)” 88% 6% 6%
“Baseline giving while not in active campaign” 88% 6% 6%
“New commitments at major gift level” 82% 12% 6%
“Distribution of gifts by alumni, non-alumni, corporations,
foundations, etc.”
82%
12%
6%
“Percent of total dollars from the top 1%, top 5%, top 10%,
as a measure of breadth of the base”
82%
12%
6%
“Generational giving (what did your best current donors do
when they were younger in terms of giving, and how does
that compare to current younger donors?)”
76%
18%
6%
“Yearly comparison of major gift commitments and yearly
comparison of major gift solicitations to determine if the
number and amounts are increasing, steady, or decreasing”
71%
24%
6%
“Giving velocity among current donors to measure growth of
giving among retained/current donors (annual fund and
major gift)”
71%
24%
6%
“Percentage of cash brought in of the total university
revenue”
71%
24%
6%
“Percentage of cash brought in of endowment size” 71% 24% 6%
“Ratio of top 1% of gifts of bottom 99% of gifts” 71% 24% 6%
“Volunteer Giving” 65% 29% 6%

102
Giving Continued
“Annual giving response rate. Annual giving average gift
size”
59%
35%
6%
“Average gift size at major gift level and principal gift level” 59% 35% 6%
“Funds raised per FTE Student” 59% 35% 6%
Engagement
“Engagement-number volunteering, promoting-NPS, serving
on boards)”
82%
12%
6%
“Open and click rates for newsletters” 82% 12% 6%
“Engagement activities- prospects RSVPing to events,
attending events, responding to emails, etc.”
76%
18%
6%
“Engagement- number of unique event attendees, are major
gift prospects attending events”
76%
18%
6%
“Direct mail, call center, email blast, and social media
response rates”
76%
18%
6%
“Engagement: # completed calls for telemarketing, response
rates for direct mail, and open click rates for email
solicitations”
76%
18%
6%
“Special event responses (campaign event attendance, one
day drives, membership drives, etc.)”
71%
24%
6%
“Alumni engagement score” 71% 24% 6%
“Response rates of appeals” 71% 24% 6%
“Constituent Participant Rate” 35% 59% 6%
Costs/Investment
“Institutional investment in fundraising (budget). Investment
into each organizational function (operations, major giving,
annual giving, etc.)”
76%
18%
6%
“Costs of human resources and infrastructure needed
(additional considerations with regard to ROI)”
76%
18%
6%
Fundraiser Activity and Performance
“Number of face-to-face visits” or “personal visits” 82% 12% 6%
“Number of major gifts solicited and closed” 82% 12% 6%
“Ratio of first-time contacts with a prospect vs. repeat
contacts”
82%
12%
6%
“Gift Close Rate= # of closed gifts/# of solicitations” 71% 24% 6%
“Ratio of number of visits to number of full time gift
officers. Ratio of asks to number of full time gift officers.
Ratio of asks to number of prospects in portfolios.”
71%
24%
6%
“Ratio of median gift size to number of full time gift
officers”
65%
29%
6%
“S&P bond ratings” 47% 47% 6%

103
Fundraiser Activity and Performance continued
“Number of weekly contacts (phone calls) to donors either to
say thank you or to update them on what their contributions
have accomplished”
47%
47%
6%
Other
“Funding met for stated goals/areas” 82% 12% 6%
“Prospect pool size (total and in capacity bands)” 82% 12% 6%
“Compound annual growth rate” 82% 12% 6%
“Time required to produce certain reports or respond to
common requests”
82%
12%
6%
“Outcome Metrics: How much did we raise this year
compared to last year? How much did we raise compared to
our plan? How much did we raise compared to our peers?”
82%
12%
6%
“Where have we failed? Annual reports often focus only on
positive”
76%
18%
6%
“Acquiring transformational gifts” 76% 18% 6%
“Conversion rate of newly identified prospects to donors” 76% 18% 6%
“Count dollars raised per dollar spent on advancement” 76% 18% 6%
“Percent of alumni with good contact information” 71% 24% 6%
“Size (number) and potential (capacity) of major gift
pipeline”
65%
24%
6%
“Good fiduciaries with money we’re given (spending gifts as
donor intended, investing endowed funds wisely)”
65%
24%
12%
“Number of Lost Alumni” 65% 24% 12%
“Time to process gifts and thank donors” 65% 24% 12%
“Donor Experience Survey” 65% 29% 6%
“Two sides of this: a. Major Giving
Size of the assigned pool
Expected $$ value of assigned pool, and trend over time
Quality of assigned pool (capacity, and attachment level of
prospects assigned)
% of pool penetration (% of assigned prospects that have had
meaningful engaged in the last 12 months)
Stage Movement (average time in each prospect stage not
exceed standards)
Ask levels relative to expected value of the prospects (is
value of sum of all asks at least 3x the current year expected
value; expected value= capacity *attachment* liquidity
Yield rate (actual closed amounts rationed to ask amounts;
should be 25%+)
b. Annual giving
$ amounts over time, participation over time,
Current donor retention rate over time
Lapsed donor re-acquisition rate over time
65%
29%
6%

104
Non-donor acquisition rate over time Appeal yields (# of appeals resulting in a gift/ # appeal
sends, by appeal and appeal program; by message and group)
# Solicitation touches per prospect in last 12 months;
subdivide by current, lapsed, and non-donor groups
% upgrade vs. downgrade, vs. stable (upgrade = up 20% +
YTY, downgrade= down 20%+ YTY)”
“Conversion ratio of rated prospects at a gift level (e.g. 100
prospects rated at $50,000 but only 5% of those donors have
given $50,000+ versus 20% "converting at or above their
rated level”
59%
35%
6%
“Presence of a medical center, intercollegiate athletics, other
substantial non-degree granting programs or programs with
non-alumni constituencies, macro-economics- comparison to
giving trends, regional economic health, etc., business model
(centralized, decentralized, open cultivation, regional major
gifts, program-based major gifts, in-house talent
management)”
47%
41%
12%
“Staff retention, recruitment, and performance, age of
institution, age of advancement program, salaries of key
roles”
41%
47%
12%
“Staff experience in years in role” 35% 59% 6%
Note. The percentages may not equal 100% due to rounding.

105
Appendix F
Round 2 Question 4 Responses
Other Nonquantifiable Measures Suggested by
Expert Panel
Agreed
Disagreed
No
Response
“Maturity of Development Operation” 76% 18% 6%
“Team work- how advancement staff work together
and how they work with the colleges and other
departments within the university”
76%
18%
6%
“Organizational structure of development
operation”
76%
18%
6%
“Distribution of revenue sources to support
advancement. Those funding sources vary greatly
depending on whether the institution is public or
private”
76%
18%
6%
“Donor Experience” 71% 12% 18%
“Staff Morale and Job Satisfaction. Is your
university one that is a great place to work? Are
your staff appreciated, motivated, and enthusiastic
about their work? Are they fully committed to the
mission, school, and to help donors feel good about
their involvement? Are they team players or do
they only focus on their goals rather than how they
can help with the overall team effort? Do they
collaborate willingly with other development
departments within the university?”
71%
18%
12%
“Advancement's relationship with other university
areas, advancement's commitment to training gift
officers to show them what success looks like”
71%
24%
6%
“Sentiment Analysis (survey constituency). Could
look at those verbatim with newer tech (big data).”
65%
18%
18%
“Tenure of head of development, median tenure of
full-time development officers”
65%
18%
18%
“Quality of volunteer leadership” 65% 18% 18%
“Is there any evidence of data-driven decision
making”
53%
29%
18%
“Is Alumni Association a part of development, is
there a separate foundation”
53%
29%
18%
“Reputation, brand recognition” 47% 35% 18%
Note. The percentages may not equal 100% due to rounding.

106
Appendix G
Round 2 Question 5 Responses
How to segment or organize comprehensive model
suggestions
Agreed
Disagreed No
response
Not
sure
“Gift Level and/or by College or Area.” 82% 12% 6%
“Organizational Structure” 76% 18% 6%
“Maturity of program (start-up, more established)” 76% 6% 12% 6%
“If the university is in a campaign (y/n)” 76% 6% 12% 6%
“Development budget, resource development
budget/staff”
76%
6%
12%
6%
“Number/percentage/ratio of active volunteer
solicitors (if ratio, to paid staff or dollars raised)
76%
6%
12%
6%
“Dollars raised to solicit-able population 76% 29% 12% 6%
“Size/type of university 71% 6% 18% 6%
“Size of largest comprehensive campaign 71% 6% 18% 6%
“Size of fundraising operations team, size of frontline
fundraising team”
71%
6%
18%
6%
“Cost-of-living index for each region, although with
national alumni bases that would not work for all
71%
12%
12%
6%
“Carnegie classification location of university/setting,
awarded degree level (graduate, UG, associates, non-
degree), private/public”
65%
12%
18%
6%
“Funds raised by FTE student, major gift close rate,
percent growth over a five year period. Find those
who are doing the best, and measure against those”
65%
18%
12%
6%
“Size of annual fund” 59% 18% 18% 6%
“By gift band (annual giving, major gifts, leadership
gifts). Different techniques and measures for each
segment”
59%
29%
12%
“Organize metrics around the behavior you want to
see in all of your constituencies”
59%
24%
18%
“Model paradigms- Open cultivation,
centralized/decentralized model”
59%
24%
18%
“1) Begin with annual and lifetime production
numbers. Followed by comparative breakdowns by
sources and designations. 2) Overview
investment/budget, staffing, and business model. 3)
Provide ROI analysis respective 1 & 2. 4) Present
data with context of average and outer bounds overall
and respective of like institutions. 5) Present
specifics or confounding factors from the other
qualitative/quantitative measures”
59%
18%
24%
“Quantitative and Qualitative metrics” 53% 24% 18% 6%

107
“Hierarchically- at the very top is dollars raised, and
all other components are next level down”
41%
35%
24%
“Centralized but have input from all divisions,
schools, and departments. Suggestion for
improvement should be sought from alumni and
donors at all levels”
29%
59%
12%
“Interaction of frontline and advancement support” 29% 47% 18% 6%
“Define the features present in successful programs,
and the features absent in less successful programs”
24%
47%
29%
Note. The percentages may not equal 100% due to rounding.

108
Appendix H
Round 2 Question 6 Responses
Any further implications suggested
Agreed
Disagreed No
Response
“A reasonably favorable economic climate” 88% 6% 6%
“Comparing institutions is very hard because of:
bad data collection practices, management
mandates, fundraiser practices, disparity of sizes,
age of the development programs, closeness of
alumni. Any model that compares and declares best
fundraising operations much account for the above
factors”
82%
12%
6%
“Staff retention/turnover (Maybe it's a good thing
that staff don't stay forever, but maybe a bad thing
that they only stay 18 months. What's the golden
number for success?)”
82%
12%
6%
“Donor retention/loss (who loses donors least and
why?)”
82%
12%
6%
“A positive image amount constituents capable of
making major gifts. Strong and stable internal
leadership and capable staff support. A compelling
and well-defined case for support that is clearly
understood and accepted by potential donors.
Ample funds to meet the institution's campaign
goals, represented by a sufficient number of willing
potential donors, and Respected, capable volunteer
leaders who are available and willing to commit the
necessary time, resources, and talent to the
campaign”
82%
12%
6%
“Senior management must be on board and drive
change that comes from this. Meetings and agendas
for discussions must be shifted from the tactical to
strategic and be built on the stories the data tells.
People must be willing to change, to adjust to
reality that comes from seeing old habits and
patterns in new ways”
76%
18%
6%
“We have to institutionalize advancement.
Generating private support is the business of
everybody on campus, not just those tasked with
actual gift solicitations”
71%
24%
6%
“Comparison to current national economics” 65% 18% 18%
“A comprehensive model should put as much
emphasis on long term goals, sustainability, and
organizational culture as it does on the bottom line”
65%
24%
12%

109
“There are some very distinct differences in
different types of universities- research and PhD
granting institutions typically get a lot of money
from business and government grants and
investments. These can't be compared to four year
liberal arts institutions that get the majority of
donations from alumni”
65%
24%
12%
“Connect morale with performance” 59% 29% 12%
“the extent a university program engages and
utilizes volunteers and alumni, especially in the
area of identifying and cultivating new major gift
and endowment prospects”
59%
29%
12%
Note. The percentages may not equal 100% due to rounding.
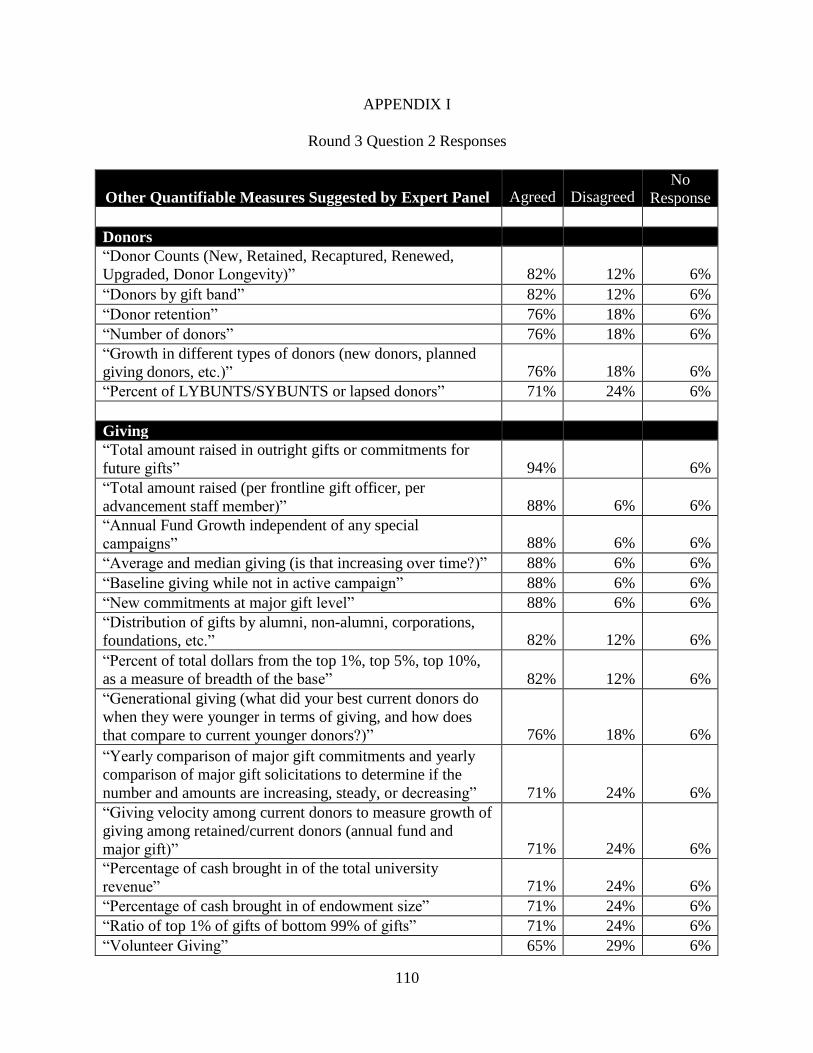
110
APPENDIX I
Round 3 Question 2 Responses
Other Quantifiable Measures Suggested by Expert Panel
Agreed
Disagreed No
Response
Donors
“Donor Counts (New, Retained, Recaptured, Renewed,
Upgraded, Donor Longevity)”
82%
12%
6%
“Donors by gift band” 82% 12% 6%
“Donor retention” 76% 18% 6%
“Number of donors” 76% 18% 6%
“Growth in different types of donors (new donors, planned
giving donors, etc.)”
76%
18%
6%
“Percent of LYBUNTS/SYBUNTS or lapsed donors” 71% 24% 6%
Giving
“Total amount raised in outright gifts or commitments for
future gifts”
94%
6%
“Total amount raised (per frontline gift officer, per
advancement staff member)”
88%
6%
6%
“Annual Fund Growth independent of any special
campaigns”
88%
6%
6%
“Average and median giving (is that increasing over time?)” 88% 6% 6%
“Baseline giving while not in active campaign” 88% 6% 6%
“New commitments at major gift level” 88% 6% 6%
“Distribution of gifts by alumni, non-alumni, corporations,
foundations, etc.”
82%
12%
6%
“Percent of total dollars from the top 1%, top 5%, top 10%,
as a measure of breadth of the base”
82%
12%
6%
“Generational giving (what did your best current donors do
when they were younger in terms of giving, and how does
that compare to current younger donors?)”
76%
18%
6%
“Yearly comparison of major gift commitments and yearly
comparison of major gift solicitations to determine if the
number and amounts are increasing, steady, or decreasing”
71%
24%
6%
“Giving velocity among current donors to measure growth of
giving among retained/current donors (annual fund and
major gift)”
71%
24%
6%
“Percentage of cash brought in of the total university
revenue”
71%
24%
6%
“Percentage of cash brought in of endowment size” 71% 24% 6%
“Ratio of top 1% of gifts of bottom 99% of gifts” 71% 24% 6%
“Volunteer Giving” 65% 29% 6%

111
Giving Continued
“Annual giving response rate. Annual giving average gift
size”
65%
29%
6%
“Average gift size at major gift level and principal gift level” 59% 35% 6%
“Funds raised per FTE Student” 59% 35% 6%
Engagement
“Engagement-number volunteering, promoting-NPS, serving
on boards)”
82%
12%
6%
“Open and click rates for newsletters” 82% 12% 6%
“Engagement activities- prospects RSVPing to events,
attending events, responding to emails, etc.”
76%
18%
6%
“Engagement- number of unique event attendees, are major
gift prospects attending events”
76%
18%
6%
“Direct mail, call center, email blast, and social media
response rates”
76%
18%
6%
“Engagement: # completed calls for telemarketing, response
rates for direct mail, and open click rates for email
solicitations”
76%
18%
6%
“Response rates of appeals” 71% 24% 6%
“Alumni engagement score” 71% 24% 6%
“Special event responses (campaign event attendance, one
day drives, membership drives, etc.)”
71%
24%
6%
“Constituent Participation Rate” 35% 59% 6%
Costs/Investment
“Institutional investment in fundraising (budget). Investment
into each organizational function (operations, major giving,
annual giving, etc.)”
76%
18%
6%
“Costs of human resources and infrastructure needed
(additional considerations with regard to ROI)”
76%
18%
6%
Fundraiser Activity and Performance
“Number of face-to-face visits” 88% 6% 6%
“Ratio of first-time contacts with a prospect vs. repeat
contacts”
88%
6%
6%
“Number of major gifts solicited and closed” 82% 12% 6%
“Gift Close Rate= # of closed gifts/# of solicitations” 76% 18% 6%
“Ratio of number of visits to number of full time gift
officers. Ratio of asks to number of full time gift officers.
Ratio of asks to number of prospects in portfolios.”
71%
24%
6%
“Ratio of median gift size to number of full time gift
officers”
65%
29%
6%
“S&P bond ratings” 53% 41% 6%

112
Fundraiser Activity and Performance continued
“Number of weekly contacts (phone calls) to donors either to
say thank you or to update them on what their contributions
have accomplished”
53%
41%
6%
Other
“Funding met for stated goals/areas” 82% 12% 6%
“Prospect pool size (total and in capacity bands)” 82% 12% 6%
“Compound annual growth rate” 82% 12% 6%
“Time required to produce certain reports or respond to
common requests”
82%
12%
6%
“Outcome Metrics: How much did we raise this year
compared to last year? How much did we raise compared to
our plan? How much did we raise compared to our peers?”
82%
12%
6%
“Where have we failed? Annual reports often focus only on
positive”
76%
18%
6%
“Acquiring transformational gifts” 76% 18% 6%
“Conversion rate of newly identified prospects to donors” 76% 18% 6%
“Count dollars raised per dollar spent on advancement” 76% 18% 6%
“Size (number) and potential (capacity) of major gift
pipeline”
71%
24%
6%
“Percent of alumni with good contact information” 71% 24% 6%
“Good fiduciaries with money we’re given (spending gifts as
donor intended, investing endowed funds wisely)”
65%
24%
12%
“Number of Lost Alumni” 65% 24% 12%
“Time to process gifts and thank donors” 65% 24% 12%
“Donor Experience Survey” 65% 29% 6%
“Two sides of this: a. Major Giving
Size of the assigned pool
Expected $$ value of assigned pool, and trend over time
Quality of assigned pool (capacity, and attachment level of
prospects assigned)
% of pool penetration (% of assigned prospects that have had
meaningful engaged in the last 12 months)
Stage Movement (average time in each prospect stage not
exceed standards)
Ask levels relative to expected value of the prospects (is
value of sum of all asks at least 3x the current year expected
value; expected value= capacity *attachment* liquidity
Yield rate (actual closed amounts rationed to ask amounts;
should be 25%+)
b. Annual giving
$ amounts over time, participation over time,
Current donor retention rate over time
Lapsed donor re-acquisition rate over time
65%
29%
6%
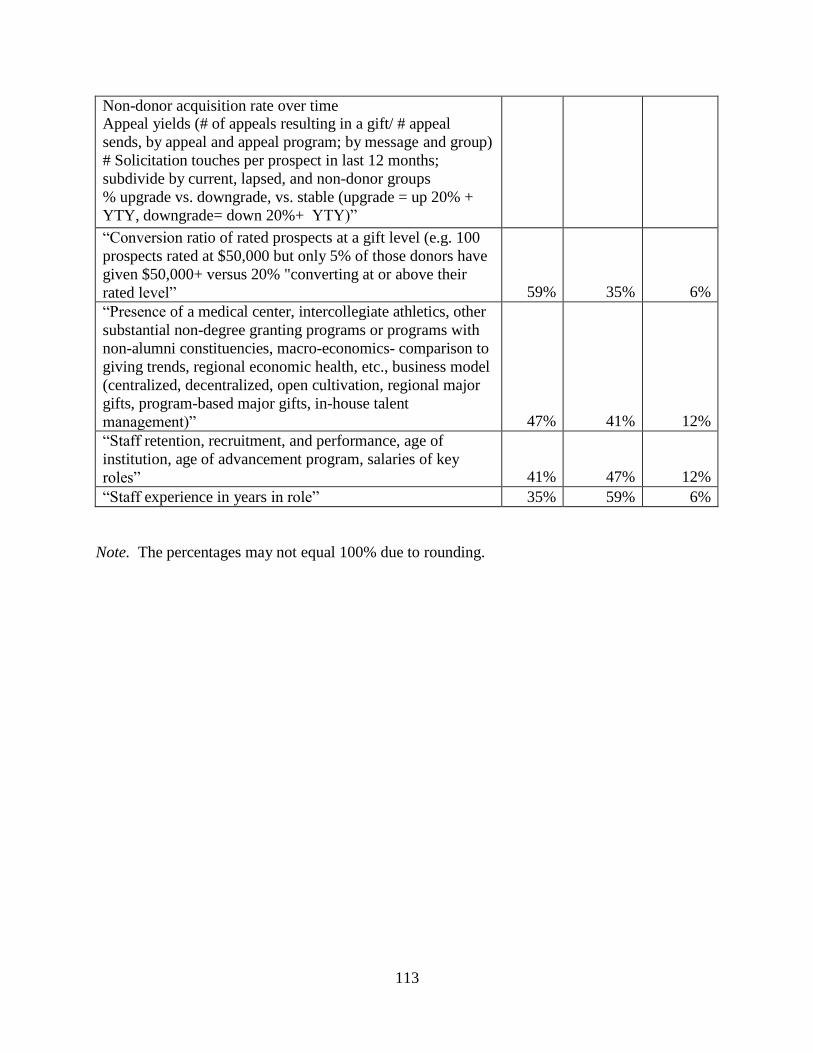
113
Non-donor acquisition rate over time Appeal yields (# of appeals resulting in a gift/ # appeal
sends, by appeal and appeal program; by message and group)
# Solicitation touches per prospect in last 12 months;
subdivide by current, lapsed, and non-donor groups
% upgrade vs. downgrade, vs. stable (upgrade = up 20% +
YTY, downgrade= down 20%+ YTY)”
“Conversion ratio of rated prospects at a gift level (e.g. 100
prospects rated at $50,000 but only 5% of those donors have
given $50,000+ versus 20% "converting at or above their
rated level”
59%
35%
6%
“Presence of a medical center, intercollegiate athletics, other
substantial non-degree granting programs or programs with
non-alumni constituencies, macro-economics- comparison to
giving trends, regional economic health, etc., business model
(centralized, decentralized, open cultivation, regional major
gifts, program-based major gifts, in-house talent
management)”
47%
41%
12%
“Staff retention, recruitment, and performance, age of
institution, age of advancement program, salaries of key
roles”
41%
47%
12%
“Staff experience in years in role” 35% 59% 6%
Note. The percentages may not equal 100% due to rounding.

114
APPENDIX J
Round 3 Question 4 Responses
Other Nonquantifiable Measures Suggested by
Expert Panel
Agreed
Disagreed
No
Response
“Maturity of Development Operation” 76% 18% 6%
“Team work- how advancement staff work together
and how they work with the colleges and other
departments within the university”
76%
18%
6%
“Organizational structure of development
operation”
76%
18%
6%
“Distribution of revenue sources to support
advancement. Those funding sources vary greatly
depending on whether the institution is public or
private”
76%
18%
6%
“Donor Experience” 71% 12% 18%
“Staff Morale and Job Satisfaction. Is your
university one that is a great place to work? Are
your staff appreciated, motivated, and enthusiastic
about their work? Are they fully committed to the
mission, school, and to help donors feel good about
their involvement? Are they team players or do
they only focus on their goals rather than how they
can help with the overall team effort? Do they
collaborate willingly with other development
departments within the university?”
71%
18%
12%
“Advancement's relationship with other university
areas, advancement's commitment to training gift
officers to show them what success looks like”
71%
24%
6%
“Sentiment Analysis (survey constituency). Could
look at those verbatim with newer tech (big data).”
65%
18%
18%
“Tenure of head of development, median tenure of
full-time development officers”
65%
18%
18%
“Quality of volunteer leadership” 65% 18% 18%
“Is there any evidence of data-driven decision
making”
59%
24%
18%
“Is Alumni Association a part of development, is
there a separate foundation”
53%
29%
18%
“Reputation, brand recognition” 47% 35% 18%
Note. The percentages may not equal 100% due to rounding.

115
APPENDIX K
Round 3 Question 5 Responses
How to segment or organize comprehensive model
suggestions
Agreed
Disagreed No
response
Not
sure
“Gift Level and/or by College or Area.” 82% 12% 6%
“Maturity of program (start-up, more established)” 82% 6% 12%
“If the university is in a campaign (y/n)” 82% 6% 12%
“Development budget, Resource development
(research and analytics) budget/staff”
82%
6%
12%
“Number/percentage/ratio of active volunteer
solicitors (if ratio, to paid staff or dollars raised)”
82%
6%
12%
“Dollars raised to solicit-able population” 82% 29% 12%
“Organizational Structure” 76% 18% 6%
“Size/type of university” 76% 6% 18%
“Size of largest comprehensive campaign” 76% 6% 18%
“Size of fundraising operations team, size of frontline
fundraising team”
76%
6%
18%
“Cost-of-living index for each region, although with
national alumni bases that would not work for all”
76%
12%
12%
“Carnegie classification location of university/setting,
awarded degree level (graduate, UG, associates, non-
degree), private/public”
71%
12%
18%
“Funds raised by FTE student, major gift close rate,
percent growth over a five year period. Find those
who are doing the best, and measure against those”
71%
18%
12%
“Size of annual fund” 65% 18% 18%
“By gift band (annual giving, major gifts, leadership
gifts). Different techniques and measures for each
segment”
59%
29%
12%
“Organize metrics around the behavior you want to
see in all of your constituencies”
59%
24%
18%
“Model paradigms- Open cultivation,
centralized/decentralized model”
59%
24%
18%
“1) Begin with annual and lifetime production
numbers. Followed by comparative breakdowns by
sources and designations. 2) Overview
investment/budget, staffing, and business model. 3)
Provide ROI analysis respective 1 & 2. 4) Present
data with context of average and outer bounds overall
and respective of like institutions. 5) Present
specifics or confounding factors from the other
qualitative/quantitative measures”
59%
18%
24%
“Quantitative and Qualitative metrics” 53% 29% 18%

116
“Hierarchically- at the very top is dollars raised, and
all other components are next level down”
41%
35%
24%
“Interaction of frontline and advancement support” 35% 47% 18%
“Centralized but have input from all divisions,
schools, and departments. Suggestion for
improvement should be sought from alumni and
donors at all levels”
29%
59%
12%
“Define the features present in successful programs,
and the features absent in less successful programs”
24%
47%
29%
Note. The percentages may not equal 100% due to rounding.

117
APPENDIX L
Round 3 Question 6 Responses
Any further implications suggested
Agreed
Disagreed No
Response
“A reasonably favorable economic climate” 88% 6% 6%
“Comparing institutions is very hard because of:
bad data collection practices, management
mandates, fundraiser practices, disparity of sizes,
age of the development programs, closeness of
alumni. Any model that compares and declares best
fundraising operations much account for the above
factors”
82%
12%
6%
“Staff retention/turnover (Maybe it's a good thing
that staff don't stay forever, but maybe a bad thing
that they only stay 18 months. What's the golden
number for success?)”
82%
12%
6%
“Donor retention/loss (who loses donors least and
why?)”
82%
12%
6%
“A positive image amount constituents capable of
making major gifts. Strong and stable internal
leadership and capable staff support. A compelling
and well-defined case for support that is clearly
understood and accepted by potential donors.
Ample funds to meet the institution's campaign
goals, represented by a sufficient number of willing
potential donors, and Respected, capable volunteer
leaders who are available and willing to commit the
necessary time, resources, and talent to the
campaign”
82%
12%
6%
“Senior management must be on board and drive
change that comes from this. Meetings and agendas
for discussions must be shifted from the tactical to
strategic and be built on the stories the data tells.
People must be willing to change, to adjust to
reality that comes from seeing old habits and
patterns in new ways”
76%
18%
6%
“We have to institutionalize advancement.
Generating private support is the business of
everybody on campus, not just those tasked with
actual gift solicitations”
71%
24%
6%
“Comparison to current national economics” 65% 18% 18%
“A comprehensive model should put as much
emphasis on long term goals, sustainability, and
organizational culture as it does on the bottom line”
65%
24%
12%

118
“There are some very distinct differences in
different types of universities- research and PhD
granting institutions typically get a lot of money
from business and government grants and
investments. These can't be compared to four year
liberal arts institutions that get the majority of
donations from alumni”
65%
24%
12%
“Connect morale with performance” 59% 29% 12%
“the extent a university program engages and
utilizes volunteers and alumni, especially in the
area of identifying and cultivating new major gift
and endowment prospects”
59%
29%
12%

119
VITA
KRYSTAL L. WILSON
Education: B.S. Communication, Public Relations,
Appalachian State University, Boone, North Carolina 2007
M.A. Higher Education, Administration,
Appalachian State University, Boone, North Carolina 2009
Ed.S. Higher Education, Administration,
Appalachian State University, Boone, North Carolina 2011
Ed.D. Educational Leadership, Post-secondary and Private Sector,
East Tennessee State University, Johnson City, Tennessee
2015
Professional Experience: Alumni Records Associate, Appalachian State University; Boone,
North Carolina, 2007-2008
Alumni Records Coordinator, Appalachian State University;
Boone, North Carolina, 2008-2010
Prospect Research Coordinator, Appalachian State University;
Boone, North Carolina, 2010-2012
Manager of Prospect Development, Appalachian State University;
Boone, North Carolina, 2012-present
Honors and Awards: Distinguished Service Award, Association of Prospect Researchers
for Advancement.
Woman of Influence Award, Appalachian State University.
Student Employee of the Year, Appalachian State University.