Embed Size (px)
Citation preview

ww.sciencedirect.com
b i om a s s a n d b i o e n e r g y 4 5 ( 2 0 1 2 ) 1 7 5e1 8 6
Available online at w
http: / /www.elsevier .com/locate/biombioe
Determining potential locations for biomass valorizationusing a macro screening approach
Miet Van Dael a,*, Steven Van Passel a, Luc Pelkmans b, Ruben Guisson b, Gilbert Swinnen c,Eloi Schreurs a
aResearch Group of Environmental Economics, Centre for Environmental Sciences, Hasselt University, Agoralaan Gebouw D,
3590 Diepenbeek, BelgiumbVITO, Boeretang 200, 2400 Mol, BelgiumcResearch Group of Marketing, Hasselt University, Agoralaan Gebouw D, 3590 Diepenbeek, Belgium
a r t i c l e i n f o
Article history:
Received 7 April 2011
Received in revised form
12 April 2012
Accepted 1 June 2012
Available online 30 June 2012
Keywords:
Macro screening
Biomass
Renewable energy
MCDA
GIS
Site selection
* Corresponding author. Tel.: þ32 (0) 1126874E-mail addresses: miet.vandael@uhasse
(L. Pelkmans), [email protected] (R. Gu0961-9534/$ e see front matter ª 2012 Elsevhttp://dx.doi.org/10.1016/j.biombioe.2012.06.
a b s t r a c t
European policy states that by 2020 at least 20% of final energy consumption should come
from renewable energy sources. Biomass as a renewable energy source cannot be dis-
regarded in order to attain this target. In this study a macro screening approach is devel-
oped to determine potential locations for biomass valorization in a specified region. The
approach consists of five steps: (1) criteria determination, (2) data gathering, (3) weight
assignment, (4) final score, (5) spatial representation. The resulting outcome provides a first
well balanced scan of the possibilities for energy production using regional biomass. This
way policy makers and investors can be supported and motivated to study the possibilities
of building energy production plants at specific locations in more detail, which can be
described as a ‘micro-screening’. In our case study the approach is applied to determine the
potentially interesting locations to establish a biomass project. The region has been limited
to the forty-four communities in the province of Limburg (Belgium). The macro screening
approach has shown to be very effective since the amount of interesting locations has been
reduced drastically.
ª 2012 Elsevier Ltd. All rights reserved.
1. Introduction between zero and satisfying the world energy demand
European policy states that by 2020 at least 20% of final
energy consumption should emanate from renewable sour-
ces. Biomass cannot be disregarded in order to attain this
target. At the same time biomass will enhance energy security
in the EU [1].
Biomass is currently themost abundant and versatile form
of renewable energy in the world [2]. Many studies have been
performed to investigate biomass potentials at different levels
and using multiple methodologies [1,3e7]. Estimations vary
3lt.be (M. Van Dael), stevisson), gilbert.swinnen@uier Ltd. All rights reserved001
multiple times [5]. The potential has been subject to contra-
diction. Firstly, biomass has many more applications than
renewable energy only [2,6,7]. For example, using some
biomass types for energy or biofuels may compete with the
demand for food and feed. Secondly, some authors recom-
mend the import of low cost biomass from outside the EU [8],
although this may cause external costs to society due to long
transportation distances.
Since biomass is often too bulky to ship over long
distances, it should either be pretreated, or more regional
[email protected] (S. Van Passel), [email protected] (G. Swinnen), [email protected] (E. Schreurs)..
b i om a s s an d b i o e n e r g y 4 5 ( 2 0 1 2 ) 1 7 5e1 8 6176
applications of biomass should be preferred. In addition,
minimizing the transport distance could decrease the
production of greenhouse gases. The focus on regionally
available biomass sources will also reduce the production cost
of bio-energy [9]. Allen et al. [10] estimated 20e50% of the
biomass delivered cost to be coming from transport and
handling. Moreover, a regional approach will reduce the
uncertainty concerning the biomass potential. Local circum-
stances can be taken into account, leading to more accurate
estimations [11]. By simultaneously using various types of
biomass the energy production plant’s long-term supply is
ensured and potential problems (e.g. seasonal fluctuations,
price rise) can be circumvented [12]. Furthermore, economies
of scale can be achieved by using multi-biomass energy flows.
Nilsson & Hansson [13] indicate a cost reduction of 15e20%
using two biomass types instead of one. A sound screening
approach to determine optimal localization within
aminimum time span for regional multi-biomass valorization
is needed.
As indicated by Ma et al. [14] locating optimal sites for
biomass conversion is a complex task involving many envi-
ronmental, economic, and social constraints and factors.
Furthermore, biomass projects are typically site-specific.
Therefore, especially when a large area is considered, it is
impractical and pointless to optimize for every possible plant
location [15]. Calvert et al. [16] conclude there is a lack of
baseline information at the agenda-setting stage of public and
private energy planning which prevents decisionmakers from
taking bio-energy seriously. Robust information is the lubri-
cant for decision making and is the only way to minimize the
unintended consequences of those decisions. Ayoub et al. [17]
argue that many decision support systems (DSS) are con-
structed for one type of biomass from a specific point of view
(economical, environmental or social). However, under-
standing the interdependency of these factors is essential
because the failure of one factor can lead to the failure of the
whole project [18]. A method is needed that handles multiple
biomass stakeholders’ objectives and involves different types
of biomass. Sincemany stakeholders of biomass projects have
diverse and often conflicting perspectives, a barrier may arise
which impedes fluent communication. Therefore, an open,
transparent and participatory process is needed to find
a balance between the different stakeholders and to move
towards a more objective method [19]. The transparency of
the method is important since it builds confidence in the
decision making process where multiple stakeholders with
conflicting views are involved [20]. Zubaryeva et al. [21] argue
that the participation of different stakeholders during the
planning phase is fundamental for the smooth territorial
integration of biomass projects at the local scale. Besides the
complexity of biomass systems, another problem is the
limited availability of data [19]. Information can be generated
using interviews and questionnaires with local stakeholders,
but this process is time and cost consuming and hence, not
feasible in a large area.
The use of multi-criteria decision analysis (MCDA) is
widely spread in energy planning [22]. De Lange et al. [23]
conclude that the use of MCDA facilitates the participation
process and that it has an important role in the successful
uptake of policy and management strategies and long-term
planning. Literature reviews by Pohekar & Ramachandran
[24] and Wang et al. [25] showed that the analytical hierarchy
process (AHP) is the most applied technique, followed by
outranking techniques. Moreover, geographical information
systems (GIS) are often used in the context of bio-energy
[26,27], especially for the site selection of a biomass power
plant [14,28,29] and the evaluation of biomass supply
[27,30e33]. Many authors have recognized that the combina-
tion of GIS and MCDA provides a powerful tool for site selec-
tion [14,34,35]. GIS offers a spatial representation of the results
whereas MCDA takes economic, social as well as environ-
mental aspects of the problem into account [36].
This paper will shed its light on how to determine potential
locations for biomass valorization on a regional scale within
a minimum time span. Therefore, a combined MCDA-GIS
approach has been developed, described as a ‘macro
screening’. The screening approach considers different rele-
vant criteria to determine potential locations for biomass
valorization in a specified region. In fact, a macro screening
provides a first well balanced scan of the possibilities for
energy production using regional biomass. The macro
screening answers to most of the above mentioned concerns
and is therefore considered an interesting method. It allows
for policy makers and investors to be supported and moti-
vated to study the possibilities of building energy production
plants at specific locations in more detail. The approach will
be discussed in detail in section two. In the third section it will
be applied to a case study. In the fourth and final section the
method’s strengths and weaknesses will be discussed and our
conclusions summarized.
2. Methodology
The goal of the macro screening is to identify locations that
are deemed ‘highly interesting’ for energy production based
on readily available information. Often, the determination of
a location is based on a single criterion (e.g. potential heat
consumers or available amount of a specific type of biomass).
Our method is more proactive and gives an answer to policy
makers and investors’ demand for a more substantiated
evaluation on site selection. The need for a fast and efficient
way to explore the market has also been recognized in other
domains such as landfill mining [37,38] and sustainable agri-
culture [39]. Up to now this need has not been translated into
an adequate methodology for biomass valorization site
selection. This paper aims at filling this gap. A complementary
approach is needed to perform a final site selection. While the
macro screening significantly reduces the number of loca-
tions, the ‘micro-screening’ subjects the remaining locations
to a more detailed exploration and determines the optimal
one. However, the micro-screening method falls beyond the
scope of this paper.
Macro screening focuses on minimizing the required time
to perform site selection. It is not feasible to investigate every
alternative in detail within a reasonable time frame. The
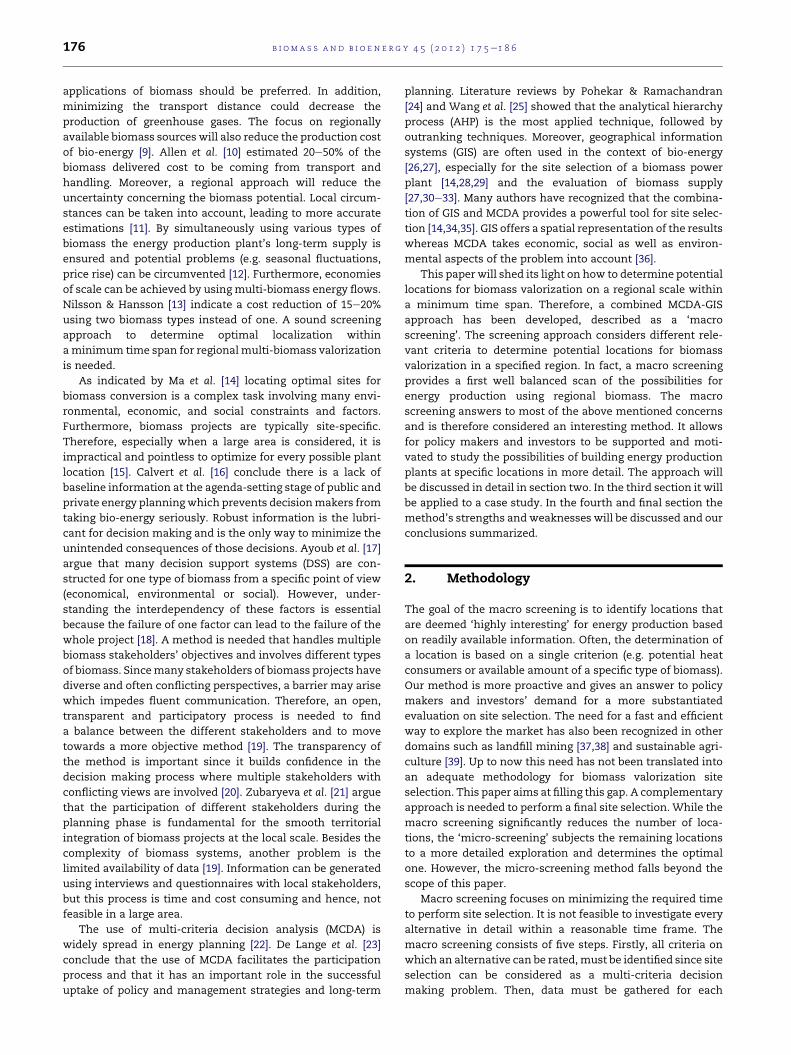
macro screening consists of five steps. Firstly, all criteria on
which an alternative can be rated,must be identified since site
selection can be considered as a multi-criteria decision
making problem. Then, data must be gathered for each
b i om a s s a n d b i o e n e r g y 4 5 ( 2 0 1 2 ) 1 7 5e1 8 6 177
criterion agreed upon to be included in the analysis. These
data provide a score for each alternative. Considering not
every criterion is equally important, in a third step a weight
must also be assigned to each criterion. Fourthly, final scores
are found for every alternative by summing the multiplica-
tions of the scores and the weights per criterion. Finally,
a spatial representation of the weighted criteria can be
obtained by combining the MCDA method with GIS. This
stepwise approach is represented in Fig. 1. Note that these
steps can be performed in parallel and that some stepsmay be
repeated as a result of learning during the process. The macro
screening is performed specifically for biomass site selection
and therefore, takes into account the specificities typical for
biomass.
2.1. Criteria determination
To consistently assess whether a certain area is eligible for
planting an installation, decision making criteria must be
chosen. It is highly recommended to organize an expert panel
discussion to identify a set of criteria. Experts should have
different backgrounds given the value of their differing points
of view. Consequently, a maximal amount of information can
be taken into account. By allowing experts to participate early
on in the process, the probability of acceptance of the final
decision is enhanced. The set of main criteria and their sub-
criteria is, however, only the starting point. During the process
criteria can be added, deleted, substituted and merged in
a follow-up discussion or feedback moment. At any time
during the first two steps a criterionmay respectively turn out
to be useful, impractical, misleading or having a similar
contribution as another criterion. The criteria can be quanti-
tative as well as qualitative. A MCDA method allows for the
processing of both kinds of data [40]. The criteria have to meet
four requirements to be used in a macro screening: (1)
comprehensibility, (2) having predictive value, (3) being
operational (i.e. measurable and meaningful), (4) being quan-
tifiable based on readily available information. It is not
possible to define the exact number of criteria necessary to
adequately evaluate the alternatives since this is highly situ-
ation dependent. On the one hand, too little criteria lead to an
incomplete answer to the problem. On the other hand, too
many criteria make the processing too difficult. A formal way
of knowing whether the set of criteria is sufficiently complete,
other than relying on experience and intuition, does not exist.
Therefore, the involvement of a significant number of experts
from various backgrounds is crucial in this setting. The only
Fig. 1 e Macro screening approach.
rule that must be kept in mind is that the number of sublevels
and the number of criteria per sublevel must be balanced for
every main criterion (see infra, Section 2.3).
Typical for multi-dimensional biomass projects is the
diversity of input streams and techniques. In addition,
biomass projects have an influence on many factors (i.e.
economic, social, environmental). Therefore, it is recom-
mended to consult local biomass experts with various fields of
expertise as they aremost familiar with theworking situation.
However, they are often only experienced with one sort of
biomass and its accompanying conversion process. Hence, it
is advised to invite local experts with different specific
knowledge. The following list of experts is recommended to be
involved when performing a macro screening for biomass
projects: (1) expert(s) from the industry (e.g. wood processing,
food, brewery); (2) expert(s) in forest management; (3) repre-
sentative(s) of agriculture; (4) member(s) of local government;
(5) expert(s) in municipal waste processing; (6) expert(s) in
nature conservation and maintenance; (7) expert(s) from
knowledge institutions; (8) expert(s) from similar projects; (9)
private investors. The list is cross-checked with recommen-
dations from literature [23,37,41e44].
A set of four main criteria, recommended by the experts,
was agreed upon to be sufficiently covering all important
elements influencing the primary, rough location decision for
a biomass project. Furthermore, it is assumed that they can
answer to the need for a more uniform set of criteria for
biomass projects [18,19,45]. The four main level criteria are:
‘input’, ‘output’, ‘installation’ and ‘society’. Input should
contain the different theoretical biomass potentials. The
criterion output should be composed of present heat
consumers. The criterion installation should hold the biomass
installations that are currently installed or planned. Finally
the criterion society should measure the willingness of
communities to accept the project in their area. It is inter-
esting to take the willingness of communities into account
early in the process since other cases have shown that public
opposition is common [46,47]. Some authors even claim that
the leap towards broader biomass utilization for bio-energy is
more psychological than technological [48]. The chosen sub-
criteria can differ depending on the region since a biomass
project is typically site-specific and, hence, requires a unique
screening [14]. A list of advised subcriteria per main level is
presented in the case study.
2.2. Data gathering
The macro screening data is gathered by desk research. The
data sources used must be readily available, e.g. databases,
articles or public data available from research institutes,
regional/national/European authorities, internet, etc. The
researcher must always ask oneself whether the time needed
to collect the information outweighs the additional value it
can provide. Since this entailsmany trade-offs, the found data
will never give a complete representation of reality. However,
this is not a necessity, the information must give an accept-
able indication of reality. Yet, the more information gathered,
the more likely the optimal location will be among the iden-
tified locations. After an initial set of criteria is determined,
data gathering is performed in parallel to step 1.

Fig. 3 e Pairwise comparison matrix.
Table 1 e Nine-point scale [50].
b i om a s s an d b i o e n e r g y 4 5 ( 2 0 1 2 ) 1 7 5e1 8 6178
The collected data provide a value for each criterion for
every alternative. The different units, in which the criteria
may be expressed, do not pose a mathematical problem
because normalization can be performed. By using, for
example, a linear scale transformation, a value xij will be
transformed into a score rij between zero and one by using
equation (1) for criteria positively influencing the goal and
equation (2) for criteria negatively influencing the goal. The
outcome is more favorable as rij approaches one [49,50].
rij ¼xij
maxixij(1)
rij ¼minixij
xij(2)
2.3. Weight assignment
Weights have to be assigned to indicate a criterion’s impor-
tance and should preferably be performed by experts (see
supra, Section 2.1). Methods to assign weights are sensitive to
changes in the number of criteria, the decision maker must
therefore be certain that the set of criteria is final before going
over to the weight assignment. The most popular MCDA
methods are analytical hierarchy process (AHP) and out-
ranking methods [24,25].
The decision making criteria are split into several levels to
form a hierarchical tree (Fig. 2). Using AHP, each criterion is
compared with every other criterion of the same level in their
contribution to the goal in an ‘m � m’ pairwise comparison
matrix (Fig. 3). The same applies for comparing the sublevel
criteria within their own branch. The value in cell aij indicates
the importance of the criterion listed in the left-hand side
column with respect to the criterion on the top row on a nine-
point numerical scale (Table 1). When aij ¼ k, then aji ¼ 1/k
must hold for consistency reasons. Subsequently, the weights
are obtained: firstly by summing each column, secondly by
dividing every cell by its column total and finally by taking the
average of each row [40,51e53]. A consistency ratio (CR) is
calculated to check for inconsistency in the decision maker’s
comparisons. The CR of a pairwise comparison matrix is the
ratio of its consistency index (CI) (i.e. the maximum eigen-
value of the comparisonmatrix) to the corresponding random
index. The CR should not exceed 0.10 for a matrix larger than
‘5 � 5’. Detailed calculations of the CR and CI can be found in
references [52,53].
Using outranking methods, the criteria are ranked per
hierarchical level. A weight wj.assigned to each criterion
depending on the rank order of the criterionusing equation (3).
Fig. 2 e Hierarchical tree.
wj ¼1
kPn
k¼1
1k
(3)
where k is the priority level or ranking of criterion j (k¼ 1:most
important criterion; k ¼ n: least important criterion) [54].
The weights of the main level criteria sum to one hundred
and sublevel criteria’s weight sum to the respective weight of
their main level criterion. For example in Fig. 2, the sum of the
weights of the criteria BeD is one hundred. The weights of the
sublevel criteria B1 and B2 sum to the weight of themain level
criterion B. Here the rule for the number of criteria per
sublevel becomes important (see supra, Section 2.1). Indeed,
the relative share of a criterion belonging to a main criterion
having lots of subcriteria is automatically lower than that of
a criterion belonging to a main criterion having a similar
weight but less subcriteria.
Fischhoff et al. [55] demonstrated that the resulting weights
can be influenced by the MCDA method since participants
generally do not have a clear preference. As every method has
its ownadvantages anddrawbacks, it is not possible to indicate
one method as being more suitable than another [22,42].
Therefore, it is recommended to use more than one MCDA
method to provide comparative information and enhance the
efficacy and empirical validity of the results and to select the
most appropriate tool fora givenproblem[19,22,25,37,45,56,57].
However, Løken [22] concludes that it is not possible to claim
that one of theMCDAmethods is generally more suitable than
the others are. Bell et al. [58] argue that the most appropriate
method depends on the set of assumptions that seems most
valid for a given situation and person. In literature there is
1 Both criteria contribute equally
to the objective
3 Moderately higher contribution
to the objective of row element
(RE) as compared to column
element (CE)
5 Higher contribution to the
objective of RE as compared to CE
7 Much higher contribution to the
objective of RE as compared to CE
9 Complete dominant contribution
to the objective of RE compared to CE
2, 4, 6, 8 Intermediate levels

b i om a s s a n d b i o e n e r g y 4 5 ( 2 0 1 2 ) 1 7 5e1 8 6 179
ample evidence of differences in results and recommendations
between methods [59]. According to Jia & Fischer [60] the
difference between methods becomes larger and more impor-
tant as the number of alternatives and criteria increase.
However,Hobbs&Horn [56] conclude that thesedisagreements
or inconsistencies are inevitable andshouldbewelcomedasan
expression of the different suitability of a method for a partic-
ular situation and a decision maker.
MCDAmethods take objective characteristics aswell as the
preferences of decision makers into account [61]. Since MCDA
methods are subjective, it is thus possible to direct the
outcome into a certain direction. This guidance is by nomeans
unwanted since multi-criteria decision tools have been
developed to assist the decision makers in efficiently and
consistently formulating their true preferences [59,62]. The
effectiveness of the approach is dependent on the interaction
with the participants and the presentation of information in
a way that facilitates active participation to enhance under-
standing, learning and discussion [23]. Also Hobbs et al. [63]
conclude that careful tutoring and close collaboration
between analysts and decision makers are more important
than which method is adopted. Moreover, it is important to
clearly communicate the goal and the impact of theweights to
the experts. To gain more insight into the resulting weights, it
is interesting to have some background information on the
experts.
Some typical characteristics of biomass and its conver-
sion to energy are its complexity, site-specificity, geographic
dispersion, involvement of many diverse stakeholders, and
influence on different factors [2,6,29,64,65]. These charac-
teristics imply some specific drawbacks for using MCDA in
the case of biomass applications. Due to the complexity and
diversity of biomass it is difficult to define criteria such that
stakeholders interpret them all in the same way. Important
is the participatory development of a clear definition for
every criterion with the different stakeholders or the explicit
explanation to the stakeholders before starting the weighting
procedure. Furthermore, the score should be carefully
explained to the stakeholders. The process to come to an
agreement for every criterion can be very time consuming.
Therefore, it is interesting to develop a uniform list of criteria
that can be used as a starting point for every biomass project.
The advised set of criteria in this paper can be a first step to
a needed uniform set of criteria for the primary screening of
potential biomass conversion locations [18,19,45]. Despite
the development of a uniform set of criteria, it is not possible
to make a general clear-cut list that can be transferred
without any adaptation to every region. Another prevalent
drawback for biomass decision making is the large difference
between the involved stakeholders, for example in profes-
sional knowledge, background, as well as educational level.
Therefore, some stakeholders will be more confident in
expressing the importance of indicators, while others will
have difficulties with understanding criteria and/or meth-
odologies. Researchers have to take this into account and
find a balance among all participants [41]. The combination
of the above elements specific for biomass makes it difficult
to find an optimal balance between the method’s complexity
and sufficient coverage of all factors influencing biomass
projects.
2.4. Final score
By summing the multiplication of the scores (step 2) with the
weights (step 3) per criterion, a final score for every alternative
is obtained.Thismethod is basedon theweighted summethod
(WSM) [25], a simple and user-friendly approach to identify the
most preferred alternative [22,50]. The higher the final score,
themore interesting anoption is. Anothermethod to get a final
ranking may be used as well. The resulting rank order merely
gives an indication of the most interesting options. The
advantage of using MCDA methods is that it makes the deci-
sionmaking process traceable and transparent. Based on a GIS
visualization (see infra, Section 2.5) the decision maker can
showwhysomedecisionsweremade that are slightlydiffering
from the final rank order obtained via ourmethod. In the end it
is the decision maker that makes the final decision. It is rec-
ommended that the neighboring areas are taken into account
as well. On the one hand to check for serendipitous synergies,
on the other hand to look for areas that are less attractive due
to their low-score surrounding areas.
After obtaining the final scores, the decision maker can
reflecton the results.Criteriacanbedeletedoradded,however,
in either case the process should be started again from the
beginningbearing inmind thesensitivityofweightassignment
methods for changes in criteria (see supra, Section 2.3).
2.5. Spatial representation
For biomass projects, the use of MCDA alone is not sufficient
to take into account the geographic dispersion of biomass and
the different geographical levels. A geographical information
system (GIS, i.e. the software and hardware needed to display
geographical data in a mapped format [27]) can be applied to
the model’s output for a better grasp on the geographical
context. Furthermore, GIS allows for better data management
on a spatial level [36]. There are many geographical levels (e.g.
province, community, address) on which information can be
found. The geographical level is dependent on the way results
are represented: numerically or spatially. Information can be
numerically ranked (i.e. solely based on the total score, the
result of steps 1e4), which implies grouping on a common
geographical level. However, some criteria can be valued on
a more detailed level than others. For the use of MCDA one
should always aggregate the information to the highest
common level (i.e. least detailed) on which data is available. A
coupling or integration with GIS is necessary, especially for
biomass projects, to comprehensibly present data and/or
results and visualize the data simultaneously on the detailed
levels [21] (adding step 5). This more detailed representation
allows for taking into account a more precise region during
the micro-screening.
2.6. Micro-screening
The micro-screening follows directly after the macro
screening and is not a step of the macro screening itself. The
locations marked as ‘highly interesting’ in the macro
screening should be investigated in more detail, described as
a micro-screening. Relevant agencies, investors, partners,.
are contacted personally and the needed information is
b i om a s s an d b i o e n e r g y 4 5 ( 2 0 1 2 ) 1 7 5e1 8 6180
gathered through questionnaires and interviews. In fact,
a macro screening provides the information (and motivation)
for investors and policy makers where to perform a micro-
screening.
3. Case study
We have chosen to apply the methodology to the case of Lim-
burg, a province in the northeastern part of Belgium. This area
has a total surface of 2422 km2 and is divided into forty-four
communities with a rather high population density. It is
a green province compared to other Flemish provinces, where
renewable energy initiatives receive a lot of attention from
different stakeholders (investors, policy, society, academics,.).
Several projects are ongoing, such as a provincial project that
strives towards a CO2 neutral Limburg by 2020. We apply the
abovementionedmacro screeningmethod to identify themost
promising communities in the province to install a multi-
dimensional biomass project.
3.1. Criteria determination
In the first step expertswere identified to determine the useful
criteria for regional, multi-dimensional biomass projects. In
total ten experts were consulted, all with different profes-
sional backgrounds. Ameetingwas organized to stimulate the
experts in expressing their points of view afterwhich themost
important criteria were deducted. As defined in Section 2.1,
four main criteria were identified. Each criterion consists of
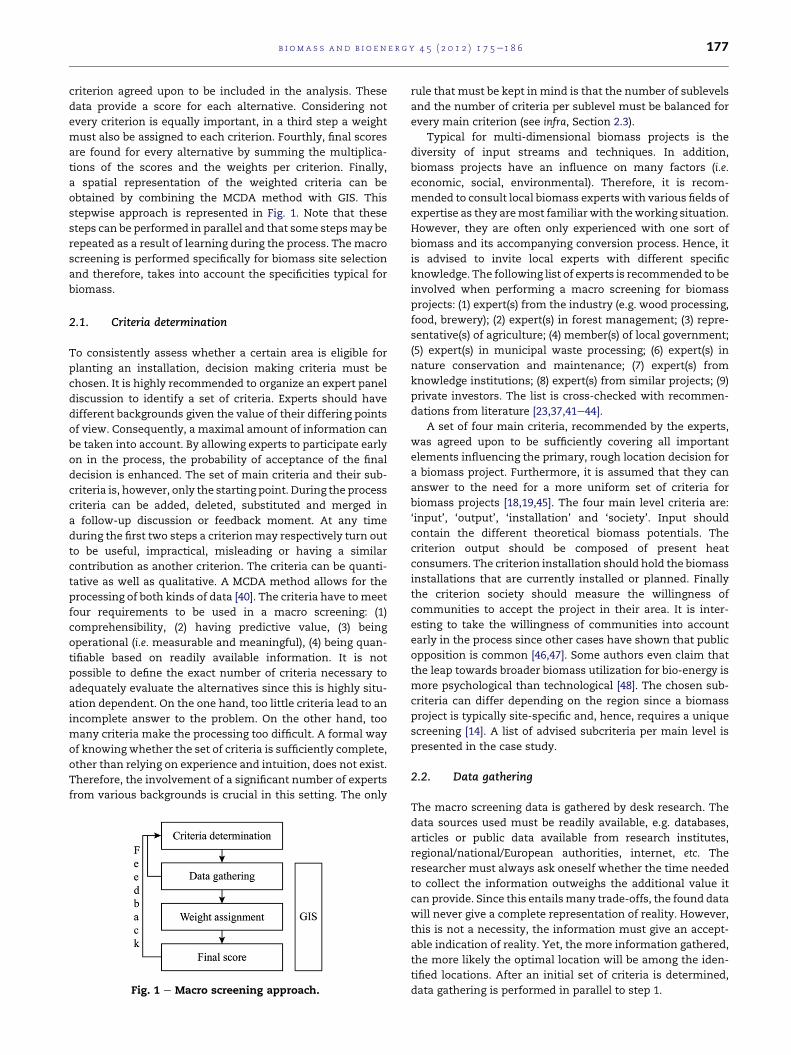
a number of subcriteria (see Fig. 4). The subcriteria used to
estimate the amount of biomass input are selected as such
that they do not compete with food, feed or other high value
applications. Generally spoken one can take into account
Fig. 4 e Selected criteria base
residues from industry, agriculture, forests, communities and
nature. The specific residues are dependent on climate and
soil characteristics and hence differ for every region. However,
since we score for example the residues from agriculture as
the total amount of hectares dedicated to agriculture, this
criterion can be used in every region (see infra, Section 3.2).
Experts agreed that it was not interesting to break the criteria
down for every type of agricultural crop since this wouldmake
the weight assignment too complex. The subcriteria for
‘Society’ are the most difficult to advise a uniform list for,
since these are highly situation dependent. Moreover, it is not
possible to recommend an aggregated level that allows for
sufficient detail.
3.2. Data gathering
In the next step information was gathered for each of the
criteria using desk research. The exact measure used for each
of the criteria is given in Table 2. ‘Input’ contains the biomass
potentials. Different types of potential exist: theoretical,
technical, economic, sustainable, . [64]. In our study the
theoretical potential (i.e. the overall maximum amount of
biomass which can be considered theoretically available
within fundamental bio-physical limits [6]) is used since the
macro screening focuses on minimizing the time needed. It is
however important to keep this difference in mind. In many
situations the economic potential is of interest. In the micro-
screening the restrictions needed to find the economic or
even the sustainable potentials should be provided. In order to
gather these restrictions, one has to perform questionnaires
and/or interviews. Considering the large area that is under
revision for interviewing, it is necessary to narrow the scope
first. To that end the macro screening is a very useful tool.
Note that for the sub criterion ‘wood (forest)’ for instance the
d on expert knowledge.

Table 2 e Criteria measures.
Input
Green wastea Vegetable, fruit and garden waste (ton) Agricultural cropsh Total area dedicated to agricultural
crops (ha)
Verge cuttingsb,c,d Verge cuttings (ton) Manureh,i Manure from pork, cattle and
chicken (ton)
Wood (forest)e,f Total area of forestry (ha) Wastelandh Total area of wasteland (ha)
Wood (industry)g Total amount of carpentries (#)
Output
CO2 emissionsj Total amount of CO2 allowances (ton CO2) Hospitals/Resthomesl,m Total amount of beds in hospitals
and rest homes (#)
Industryk Total amount of breweries, food industry,
furniture industry, drying (#)
Vacation parksn Total amount of cottages (#)
Greenhousesh Total area dedicated to greenhouses (ha) Swimming poolso Total amount of indoor, heated
outdoor and subtropical pools (#)
Installation
Digester/combustor
(existing)pInstalled power from digesters and
combustors (kW)
Other (planned)q Total amount of planned bio-oil,
bio-steam, compost and torrefaction
installations
Digester/combustor
(planned)pPlanned power from digesters and
combustors (kW)
Wood processing
industryg,kTotal amount of carpentries (#)
Other (existing)q Total amount of existing bio-oil, bio-steam,
compost and torrefaction installations
Society
Local Kyoto protocolr Community acknowledgment of the local
Kyoto protocol (yes-no)
Industrial areak Total area of free industrial area (ha)
Licensep Total number of licenses granted for
biomass-to-energy conversion
installations (#)
Accessibilityb,d Total amount of motorways and
waterways (km)
Unemployed job
seekerssTotal amount of unemployed job
seekers (#)
Renewable energyp Total amount of installed power from
renewable energy sources (sun, wind
and biomass)
Sources.
a www.limburg.net
b FOD economie ‘lengte van het wegennet’.
c CMK Uhasselt.
d NV De Scheepvaart.
e AGIV.
f www.bosgroepen.be
g www.handelsgids.be
h FOD economie ‘landbouwenquete’.
i MIRA.
j www.lne.be
k POM limburg.
l website hospitals.
m www.derusthuizen.be
n www.toerismelimburg.be
o http://zwembad.injebuurt.be/injebuurt/city/Limburg
p VREG.
q website installation.
r Bond Beter Leefmilieu.
s VDAB.
b i om a s s a n d b i o e n e r g y 4 5 ( 2 0 1 2 ) 1 7 5e1 8 6 181
total area of forestry is taken into account. Consequently, it
may seem that we have takenwood into account that could be
used for furniture, particleboard, etc. However, on a macro-
level a proxy could just as well have been used to estimate
the amount of wood residues. For example, we could have
used 0.48e2.64 ton/ha/year of woody residues [66,67] of which
a minimum of 45% should stay within the forest for ecological
concerns [68]. However, mathematically no difference in the
final score will be noticeable, since the final score is normal-
ized and thus that level of detail is lost. Still, since the macro
screening is traceable it can be interesting to integrate this
proxy and go back to it afterwards.
3.3. Weight assignment
A new expert meeting with twenty five participants was
organized to agree upon the importance of every criterion
shown in Fig. 4. Within the experts, two different groups can
be distinguished: (1) the project group consisting of project
partners, (2) the sounding board composed of stakeholders

Table 4 e Geometric mean weight per criterion via AHP.
Criterion AHP
Input 41,33%
Output 27,86%
Installation 17,11%
Society 13,70%
Green waste 10,98%
Verge cuttings 8,57%
Wood (forest) 6,21%
Wood (industry) 4,67%
Agricultural crop 4,14%
Manure 3,52%
Wasteland 3,25%
CO2 emissions 2,93%
Industry 7,65%
Greenhouse 6,67%
Hospital/Rest home 4,11%
Vacation park 2,97%
Swimming pool 3,52%
Local Kyoto protocol 1,15%
License 1,48%
Unemployed job seekers 0.76%
Industrial area 3,42%
Accessibility 4,87%
Renewable energy 2,02%
Digester/Combustor (existing) 4,36%
Digester/Combustor (planned) 3,31%
Other (existing) 3,92%
Other (planned) 3,07%
Wood processing industry 2,44%
b i om a s s an d b i o e n e r g y 4 5 ( 2 0 1 2 ) 1 7 5e1 8 6182
who are currently active in related activities (see supra,
Section 2.1). The first group was also used earlier in step 1 (see
Section 3.1) to determine the relevant criteria. The same
criteria were presented to all experts to assign weights, rep-
resenting their opinions and preferences. Every expert
received an equal weight because their viewpoint was
considered equally important. There was no correction for
outliers since there was no reason to consider the opinion of
an expert as being wrong. From every expert some back-
ground information was gathered by asking supplementary
questions at the end of the weight assignment. They were
asked which country they are living in, what their field of
expertise is, which sector they are working in, which function
they have and which biomass type is most related to their
activities. In Table 3 the total number of experts per back-
ground criterion is summarized. This information will be used
to check whether an expert’s background has an influence on
the assigned weights.
Inourwork theweightsareobtainedusing theAHPmethod.
Table 4 summarizes the geometric mean of the weight per
criterion, as recommended by Saaty [69]. To check the robust-
ness of these weights, they are compared with the weights
obtained by direct weighting and ranking. The rank correla-
tions (kendall’s tau) were calculated and are all positive and
significant as shown in Table 5. Thismeans that the rank order
of the weights does not differ much between the methods.
To see whether the expert’s background has an influence
on the assigned weights, a KruskaleWallis test is performed.
The results are summarized in Table 6. The type of biomass
that is most related to the expert’s activities has an influence
on most weights. The KruskaleWallis test indicates a differ-
ence between the groups for four criteria out of twenty-eight
or 14% of the criteria, which is a rather small percentage. It
may be concluded that in our case study the background of the
experts has a negligible influence. The expert meeting to
Table 3 e Total number of experts per backgroundcriterion.
Criterion Sub criterion #
Group Project group 8
Sounding board 17
Country Belgium 20
The Netherlands 5
Expertisea Biological 5
Chemical 3
Economic 5
Technological 9
Sector Industry 4
Environment/Nature 6
Academic 10
Government 5
Function Public servant 6
Docent 4
Researcher 8
Project manager 7
Biomass Wood 6
General 12
No affinity 7
a missing data.
assign weights to the criteria was mainly composed of
different experts compared to the ones determining the
criteria. During the second expert meeting some concern was
expressed because some sounding board members did not
completely agree with the criteria or their definition. It is
therefore important to stimulate the experts to fully share
their opinions while providing sufficient answers to their
questions. Our results show that the group to which an expert
belonged, had an influence on solely two criteria.
3.4. Final score
Combining the scores with the weights resulted in one final
score for every community, seeing that all scores were allo-
cated to this common geographic level. Now, the communities
can be ranked and demonstrated visually (see Fig. 5). The
darker the area, the more interesting communities are to
plant a multi-dimensional biomass project. As mentioned in
Section 2.4, the decisionmakermakes the final decisionwhich
can differ slightly from the final ranking. Themacro screening
Table 5 e Kendall’s tau rank correlation.
Kendall’s tau_b AHP Direct Ranking
AHP 1 0.949** 0.943**
Direct 1 0.960**
Ranking 1
** 0.01.

Table 6 e Summary of KruskaleWallis tests.
Background AHP
# %
Country 2 7
Group 3 11
Function 3 11
Biomass 4 14
Expertise 2 7
Sector 2 7
Total: 28 criteria
b i om a s s a n d b i o e n e r g y 4 5 ( 2 0 1 2 ) 1 7 5e1 8 6 183
gives an indication of the most interesting locations, but
cannot indicate the most preferred one. Once a decision has
been taken, the method helps to create a supportive policy
framework.
Fig. 6 e Spatial representation of weighted criteria.
3.5. Spatial representation
However, for site selection it is interesting to take the different
geographic levels into account and combine them for an
integrated representation of the results. Given that this is hard
to achieve numerically, the weighted criteria should be pre-
sented using GIS (Fig. 6). GIS allows us to display the results
using raster data with a cell size of 500m� 500m. This way, it
is possible to determine the regions, even within communi-
ties, which are particularly suitable for biomass conversion
facilities. For all subcriteria in the criteria ‘Input’ and ‘Society’
we have chosen to use the level of communities. Since heat
cannot be transported over a large distance, it is valuable to
use the exact location of all potential heat customers in the
‘Output’ criterion. The same applies for the ‘Installation’
criterion. Extending a current installation or combining
multiple techniques can only be done at that particular
Fig. 5 e Spatial representation of final score per
community.
location, so only the score of that location (cell) is elevated.
Fig. 6 shows the added value of using MCDA in combination
with GIS. The color scale consists of the weighted scores for
the different criteria. The darker the color of a location, the
higher the score and the more interesting that location will be
for biomass conversion projects.
4. Discussion and conclusion
A macro screening approach was developed and used to
determine the most interesting locations for the Limburg
province within a minimal time span. Starting with an expert
meeting to determine the appropriate criteria is important to
gain their support from the beginning. The weights, assigned
via an AHP method, must also be determined by experts. By
assigning weights, experts can guide the outcome into
a certain direction. This guidance is valuable since it can
generate insight into their different viewpoints. The final score
is obtained by using a simple and traceable MAVTebased
method. In the last phase GIS is used to arrive at a clear, visual
representation of the differentweighted criteria. GIS allows for
an integration on different geographic levels to obtain a more
detailed representation of the results. The macro screening
only gives an indication of the potentially interesting locations
and cannot select the best location among the alternatives.
Therefore, it cannot stand alone as a decision tool and should
be succeeded by a thorough investigation of the best-scoring
locations. The macro screening approach is a supportive and
motivational tool to utilize as input for the micro-screening to
support and motivate partners, investors, policy makers,.
that allows for studying the possibilities of building biomass
conversion plants at specific locations. In a follow-up paper
this micro-screening will be further elaborated on. It will take

b i om a s s an d b i o e n e r g y 4 5 ( 2 0 1 2 ) 1 7 5e1 8 6184
into account the economic biomass potential within a chosen
region. Stakeholder interviews will be done to identify the
interest to participate in the project. Also the transport situa-
tion and economic parameters will be integrated. Our case
study has shown that it was possible to drastically reduce the
potential locations to place a multi-dimensional biomass
project to themost interesting onesusing amacro screening. It
can thereforebeconcluded thatourmethodprovidesa fast and
efficient way to explore the market for biomass valorization
site selection. Moreover the method is generic, so it can be
applied to other domains, such as other renewable energy
projects (sun,wind,.) or for example site selection for schools,
nursinghomes,hospitals or industry. Furthermore, itwould be
interesting to apply themethodology in another regionwith its
own characteristics such as other specific biomass character-
istics, legal environment and economic situation.
In the following some recommendations for further
research are given. Firstly some criteria are rather ambiguous
and can be seen as benefit criteria (synergy) or as cost criteria
(competition). This distinction has an influence on the equa-
tions to use in the normalization step. In our study ‘Installa-
tion’ is an example of such a criterion. The criterion and its
subcriteria are considered as benefit criteria in our model
since the major part of the experts indicated them as such.
However, Table 7 shows that the opinion of the experts were
not that unanimous for all criteria. An additional expert
discussion could provide some clarity.
Secondly our case study indicated that the differences in
attributed weight between the project group and the sounding
board were only significant in 11% of the criteria. During the
second meeting some concern was expressed about the
selected criteria, but the fact that the criteria were determined
by other experts seemed comforting. Further research should
be performed to prove whether this comforting feeling is
really a result of the knowledge that the criteria were deter-
mined by experts or that it is sufficient to determine the
criteria ourselves and to provide the experts with sufficient
information about the choice and definition of criteria. One
can ask oneself what the actual influence ofweighing is. In our
case study the weights only have a limited impact on the top
ten ranked communities. If our goal was to solely indicate
those communities that have the most potential, the same
weight (or even no weight) could have been assigned to all
criteria. Nevertheless, the weights give an insight in the
importance experts attach to criteria and thus indicate how
experts would make their choice if no macro screening was
used. The weights do have an impact on the middle ranked
communities. Hence, one of the advantages of using GIS is
Table 7 e Synergy versus competition.
Criterion Synergy Competition
Digester/Combustor (existing)a 14 9
Digester/Combustor (planned)a 13 10
Other (existing)a 16 6
Other (planned)a 18 4
Wood processing industrya 19 2
a missing data.
that neighboring communities can be taken into account
when making the final decision. Since neighboring commu-
nities may be middle ranked, it is very interesting to assign
weights when using GIS. Note that in other studies the
weights can have an influence on all alternatives.
Thirdly, in our case study an expert’s background does not
have an influence on the assigned weights. Further research
should indicatewhether there are other variables that do have
an impact on the resulting weights.
Finally, in some cases it can be desirable to exclude
a locationwhen the score on one criterion is unacceptably low
or even nonexistent. In other words, the low-score for that
criterion cannot be compensated by a high score for another
criterion.
Acknowledgments
The authors gratefully acknowledge the financial support
from INTERREG and the province of Limburg. Special thanks to
our colleague Thomas Voets for his effort in making the GIS
maps. Moreover, the authors would like to thank the two
anonymous reviewers for their valuable comments.
r e f e r e n c e s
[1] Panoutsou C, Eleftheriadis J, Nikolaou A. Biomass supply inEU27 from 2010 to 2030. Energ Policy 2009;37(12):5675e86.
[2] Valdez-Vazquez I, Acevedo-Benıtez JA, Hernandez-Santiago C. Distribution and potential of bioenergy resourcesfrom agricultural activities in Mexico. Renew Sust Energ Rev2010;14(7):2147e53.
[3] Ericsson K, Nilsson LJ. Assessment of the potential biomasssupply in Europe using a resource-focused approach.Biomass Bioenerg 2006;30(1):1e15.
[4] de Wit M, Faaij A. European biomass resource potential andcosts. Biomass Bioenerg 2010;34(2):188e202.
[5] Thran D, Seidenberger T, Zeddies J, Offermann R. Globalbiomass potentials e resources, drivers and scenario. EnergySustain Dev 2010;14(3):200e5.
[6] Smeets EMW, Faaij APC, Lewandowski IM, TurkenburgWC. Abottom-up assessment and review of global bio-energypotentials to 2050. Prog Energ Combust 2007;33(1):56e106.
[7] Faaij A, Steetskamp I, vanWijk A, Turkenburg W. Explorationof the land potential for the production of biomass for energyin the Netherlands. Biomass Bioenerg 1997;14(5e6):439e56.
[8] Skytte K, Meibom P, Henriksen TC. Electricity from biomassin the European union e with or without biomass import.Biomass Bioenerg 2006;30(5):385e92.
[9] Gan J. Supply of biomass, bioenergy, and carbon mitigation:method and application. Energ Policy 2007;35(12):6003e9.
[10] Allen J, Browne M, Hunter A, Boyd J, Palmer H. Logisticsmanagement and costs of biomass fuel supply. Int J PhysDistrib Logist Man 1998;28(6):463e77.
[11] Schlager P, Krismann A, Schmieder K. Estimating thebiomass potential of wooden landscape components forenergy production in Schwabisch Hall (Germany). In: ISEE:11th Biennial conference of the International Society ofEcological Economics, 22e25 August 2010. Oldenburg-Bremen, Germany; 2010.
[12] Boukis I, Vassilakos N, Kontopoulos G, Karellas S. Policy planfor the use of biomass and biofuels in Greece: part I: available

b i om a s s a n d b i o e n e r g y 4 5 ( 2 0 1 2 ) 1 7 5e1 8 6 185
biomass and methodology. Renew Sust Energ Rev 2009;13(5):971e85.
[13] Nilsson D, Hansson PA. Influence of various machinerycombinations, fuel proportions and storage capacities oncosts for co-handling of straw and reed canary grass todistrict heating plants. Biomass Bioenerg 2001;20(4):247e60.
[14] Ma J, Scott NR, DeGloria SD, Lembo AJ. Siting analysis offarm-based centralized anaerobic digester systems fordistributed generation using GIS. Biomass Bioenerg 2005;28(6):591e600.
[15] Gomez A, Rodrigues M, Montanes C, Dopazo C, Fueyo N. Thepotential for electricity generation from crop and forestryresidues in Spain. Biomass Bioenerg 2010;34(5):703e19.
[16] Calvert K. Geomatics and bioenergy feasibility assessments:taking stock and looking forward. Renew Sustain Energ Rev2011;15(2):1117e24.
[17] Ayoub N, Martins R, Wang K, Seki H, Naka Y. Two levelsdecision system for efficient planning and implementationof bioenergy production. Energ Convers Manage 2007;48(3):709e23.
[18] Buchholz TS, Volk TA, Luzadis VA. A participatory systemsapproach to modeling social, economic, and ecologicalcomponents of bioenergy. Energ Policy 2007;35(12):6084e94.
[19] Buchholz T, Rametsteiner E, Volk TA, Luzadis VA. MultiCriteria Analysis for bioenergy systems assessments. EnergPolicy 2009;37(2):484e95.
[20] Starkl M, Brunner N. Feasibility versus sustainability inurban water management. J Environ Manage 2004;71(3):245e60.
[21] Zubaryeva A, Zaccarelli N, Del Giudice C, Zurlini G. Spatiallyexplicit assessment of local biomass availability fordistributed biogas production via anaerobic co-digestion e
Mediterranean case study. Renew Energ 2012;39(1):261e70.[22] Løken E. Use of multicriteria decision analysis methods for
energy planning problems. Renew Sustain Energ Rev 2007;11(7):1584e95.
[23] De Lange WJ, Stafford WHL, Forsyth GG, Le Maitre DC.Incorporating stakeholder preferences in the selection oftechnologies for using invasive alien plants as a bio-energyfeedstock: applying the analytical hierarchy process. JEnviron Manage 2012;99(0):76e83.
[24] Pohekar SD, Ramachandran M. Application of multi-criteriadecision making to sustainable energy planning e a review.Renew Sustain Energ Rev 2004;8(4):365e81.
[25] Wang JJ, Jing YY, Zhang CF, Zhao JH. Review on multi-criteriadecision analysis aid in sustainable energy decision-making.Renew Sustain Energ Rev 2009;13(19):2263e78.
[26] Iakovou E, Karagiannidis A, Vlachos D, Toka A, Malamakis A.Waste biomass-to-energy supply chain management:a critical synthesis. Waste Manage 2010;30(10):1860e70.
[27] Graham RL, English BC, Noon CE. A geographic informationsystem-based modeling system for evaluating the cost ofdelivered energy crop feedstock. Biomass Bioenerg 2000;18(4):309e29.
[28] Panichelli L, Gnansounou E. GIS-based approach for definingbioenergy facilities location: a case study in Northern Spainbased on marginal delivery costs and resources competitionbetween facilities. Biomass Bioenerg 2008;32(4):289e300.
[29] Shi X, Elmore A, Li X, Gorence NJ, Jin H, Zhang X, et al. Usingspatial information technologies to select sites for biomasspower plants: a case study in Guangdong Province, China.Biomass Bioenerg 2008;32(1):35e43.
[30] Fiorese G, Guariso G. A GIS-based approach to evaluatebiomass potential from energy crops at regional scale.Environ Model Software 2010;25(6):702e11.
[31] Voivontas D, Assimacopoulos D, Koukios EG. Aessessment ofbiomass potential for power production: a GIS based method.Biomass Bioenerg 2001;20(2):101e12.
[32] Fernandes U, Costa M. Potential of biomass residues forenergy production and utilization in a region of Portugal.Biomass Bioenerg 2010;34(5):661e6.
[33] Van Hoesen J, Letendre S. Evaluating potential renewableenergy resources in Poultney, Vermont: a GIS-basedapproach to supporting rural community energy planning.Renew Energ 2010;35(9):2114e22.
[34] Haddad MA, Anderson PF. A GIS methodology to identifypotential corn stover collection locations. Biomass Bioenerg2008;32(12):1097e108.
[35] Joerin F, Musy A. Land management with GIS and multi-criteria analysis. Int Trans Oper Res 2000;7(1):67e78.
[36] Boggia A, Cortina C. Measuring sustainable developmentusing a multi-criteria model: a case study. J Environ Manage2010;91(11):2301e6.
[37] van der Zee DJ, Achterkamp MC, de Visser BJ. Assessing themarket opportunities of landfill mining. Waste Manage 2004;24(8):795e804.
[38] Van Passel S, Dubois M, Eyckmans J, de Gheldere S, Ang F,Jones PT, et al. The Economics of enhanced landfill mining:private and societal performance drivers. J Clean Prod, inpress, doi:10.1016/j.jclepro.2012.03.024.
[39] Vereijken PH, Hermans CML. A quick scan tool to assess therelative prospects of European regions for sustainableagriculture in a liberal market. Land Use Policy 2010;27(2):440e8.
[40] Balana BB, Mathijs E, Muys B. Assessing the sustainability offorest management: an application of multi-criteria decisionanalysis to community forests in northern Ethiopia. J EnvironManage 2010;91(6):1294e304.
[41] Jalilova G, Khadka C, Vacik H. Developing criteria andindicators for evaluating sustainable forest management:a case study in Kyrgyzstan. Forest Pol Econ 2012. http://dx.doi.org/10.1016/j.forpol.202.01.010.
[42] Lahdelma R, Salminen P, Hokkanen J. Using multicriteriamethods in environmental planning and management.Environ Manage 2000;26(6):595e605.
[43] Turcksin L, Macharis C, Lebeau K, Boureima F, Van Mierlo J,Bram S, et al. A multi-actor multi-criteria framework toassess the stakeholder support for different biofuel options:the case of Belgium. Energ Policy 2011;39(1):200e14.
[44] Kowalski K, Stagl S, Madlener R, Omann I. Sustainableenergy futures: methodological challenges in combiningscenarios and participatory multi-criteria analysis. Eur J OperRes 2009;197(3):1063e74.
[45] Ananda J, Herath G. A critical review of multi-criteriadecision making methods with special reference to forestmanagement and planning. Ecol Econ 2009;68(10):2535e48.
[46] Upreti BR, van der Horst D. National renewable energy policyand local opposition in the UK: the failed development ofa biomass electricity plant. Biomass Bioenerg 2004;26(1):61e9.
[47] McCormick K. Communicating bioenergy: a growingchallenge. Biofuel Bioprod Bior 2010;4(5):494e502.
[48] Silveira S. How to realize the bioenergy prospects? In: DrSemida S, editor. Bioenergy e realizing the potential. Oxford:Elsevier; 2005. p. 3e17.
[49] Freudenberg M. Composite indicators of countryperformance: a critical assessment. In: OECD Science,Technol IndustryWorking Papers. Paris, France: OECDPublishing; 13 Nov 2003.
[50] Hwang CL, Yoon K, editors. Multiple attribute decisionmaking e methods and applications. Berlin: Springer-Verlag;1981.
[51] Saaty TL. Decision making with the analytic hierarchyprocess. Int J Serv Sci 2008;1(1):16.
[52] Saaty TL, Sodenkamp M. The analytic hierarchy and analyticnetwork measurement processes: the measurement ofintangibles. In: Zopounidis C, Pardalos PM, editors.

b i om a s s an d b i o e n e r g y 4 5 ( 2 0 1 2 ) 1 7 5e1 8 6186
Handbook of multi-criteria analysis. Berlin: Springer-Verlag;2010. p. 91e166.
[53] Winston WL. Decision making under uncertainty. In:Winston WL, editor. Operations research e applications andalgorithms. California: Duxbury Press; 2003. p. 789e99.
[54] Van Huylenbroeck G, Damasco-Tagarino D. Analysing cropchoice of Philippine vegetable farmers with multi-criteriaanalysis. J Multi-Crit Decis Anal 1998;7(3):160e8.
[55] Fischhoff B, Slovic P, Lichtenstein S. Knowing what you want:measuring labile values. In: Wallsten T, editor. Cognitiveprocesses in choice and decision behavior. Hilssdale, NewYork: Lawrence Erlbaum Associates; 1980. p. 117e41.
[56] Hobbs BF, Horn GTF. Building public confidence in energyplanning: a multimethod MCDM approach to demand-sideplanning at BC gas. Energ Policy 1997;25(3):357e75.
[57] Hobbs BF, Meier P. Energy decisions and the environment:a guide to the use of multicriteria methods. Dordrecht:Kluwer Academic; 2000. p. 272.
[58] BellML,HobbsBF, Elliott EM, EllisH, RobinsonZ.Anevaluationof multicriteria decision-making methods in integratedassessment of climate policy research and practice. In:Haimes YY, Steuer RE, editors. Multiple criteria decisionmaking. Berlin: Springer-Heidelberg; 2000. p. 228e37.
[59] My�siak J. Consistency of the results of differentMCAmethods:a critical review. Environ Plann C 2006;24(2):257e77.
[60] Jia J, Fischer GW. Evaluating multiattribute decision quality:a simulation study. Paper presented ORSA/TIMS Jt Natl MeetChicago; 1993.
[61] Papadopoulos A, Karagiannidis A. Application of the multi-criteria analysis method ELECTRE III for the optimisation ofdecentralised energy systems. Omega 2008;36(5):766e76.
[62] Stewart TJ. A critical survey on the status of multiple criteriadecision making theory and practice. Omega 1992;20(5e6):569e86.
[63] Hobbs BF, Chankong V, Hamadeh W, Stakhiv EZ. Does choiceof multicriteria method matter? an experiment in waterresources planning. Water Resour Res 1992;28(7):1767e79.
[64] Karaj S, Rehl T, Leis H, Muller J. Analysis of biomass residuespotential for electrical energy generation in Albania. RenewSustain Energ Rev 2010;14(1):493e9.
[65] van Dam J, Faaij APC, Lewandowski I, Fischer G. Biomassproduction potentials in Central and Eastern Europe underdifferent scenarios. Biomass Bioenerg 2007;31(6):345e66.
[66] Dagnelie P, Palm R, Rondeux J, Thill A. Tables de cubage desarbres et des peuplements forestiers. Les pressesagronomiques de Gembloux; 1985.
[67] Zianis D, Muukkonen P, Makipaa R, Mencuccini M. Biomassand stem volume equations for tree species in Europe. SilvaFennica Monogr 2005;4:63.
[68] Briedis JI, Wilson JS, Benjamin JG, Wagner RG. Biomassretention following whole-tree, energy wood harvests incentral Maine: adherence to five state guidelines. BiomassBioenerg 2011;35(8):3552e60.
[69] Forman E, Peniwati K. Aggregating individual judgments andpriorities with the analytic hierarchy process. Eur J Oper Res1998;108(1):165e9.