Embed Size (px)
Citation preview

May 25, 2010 Version 1.0
i
UNIVERSITY OF NORTH DAKOTA
Determining Appropriate
Levels of Automation
FITS SRM Automation Management Research
Charles L. Robertson, PhD
May 25, 2010
One of the benchmarks of SRM is automation management. This study determined the best
practice for managing the automation in a Technically Advanced Aircraft (TAA). The study
combined a survey of current TAA users, aircraft and avionics manufacturers, and lab research to
determine the best methods for managing automation during complex and stressful flight
scenarios. The centerpiece event was a series of trials in the UND Technically Advanced Aircraft
Performance (TAAP) lab culminating in suggestions for improved understanding of automation
use, levels of automation, and a set of automation management best practices.
May 25, 2010 Version 1.0
ii
Table of Contents
Table of Contents ii
List of Tables iv
Introduction 1
Background 1
Research Questions 3
Literature 4
Methodology 5
Data Analysis for Data Collection Instrument 6
Data Analysis for Pilot Performance Data 14
Summary of Findings 17
Conclusion 26
Limitations 29
Recommendations and Best Practices 29
Appendix A. Data Collection Instrument 39
Appendix B. Analysis of FITS Verses Non-FITS 44
Appendix C. Analysis of Formal Autopilot Training 51
Appendix D. Summary of Training Analysis 58
Appendix E. Glass Verses Non-Glass Analysis 65
Appendix F. Autopilot and Moving Map Analysis 71
Appendix G. Area Navigation Analysis 78
Appendix H. Analysis of Age Groups 84
Appendix I. Analysis of Flight Hours 87

May 25, 2010 Version 1.0
iii
Appendix J. Levels of Automation Scenario 93

May 25, 2010 Version 1.0
iv
List of Tables
Table 1. Participant Data 7
Table 2. Equipment Data 7
Table 3. Training Data 7
Table 4. Summary of FITS/Non-FITS Training Results 8
Table 5. Summary of Formal Autopilot Training Results 8
Table 6. Summary of Combined Training Experiences 9
Table 7. Summary of Glass Flight Instruments Results 10
Table 8. Summary of Technically advanced aircraft Results 12
Table 9. Summary of Area Navigation Results 12
Table 10. Summary of Age Results 13
Table 11. Summary of Flight Hour Results 14
Table 12. ANOVA for Pilot Performance 15
Table 13. Pilot Performance LSD Post Hoc Test 16
Table 14. Summary of Statistically Significant Analyses 18
Table 15. Summary of Statistically Significant Pilot Performance Data 26
Table 16. FITS Verses Non-FITS Group Statistics for Automation Attitude Variables 44
Table 17. Independent Samples of FITS verses Non-FITS for Automation Attitude Variables 45
Table 18. FITS Verses No FITS Group Statistics for Automation Trust Variables 46
Table 19. Independent Samples of FITS verses Non-FITS for Automation Trust Variables 46
Table 20. FITS Verses No FITS Group Statistics for Automation Competency Variables 47
Table 21. Independent Samples of FITS verses Non-FITS for Automation Competency 48
Table 22. FITS Verses No FITS Group Statistics for Automation Techniques Variables 48

May 25, 2010 Version 1.0
v
Table 23. Independent Samples of FITS verses Non-FITS for Automation Techniques 49
Table 24. FITS Verses No FITS Group Statistics for Levels of Automation Variables 50
Table 25. Independent Samples of FITS verses Non-FITS for Levels of Automation 50
Table 26. Group Statistics for Automation Attitude in Formal Autopilot Trained 51
Table 27. Independent Samples of Automation Attitude in Formal Autopilot Training 52
Table 28. Group Statistics for the Automation Trust in Formal Autopilot Training 52
Table 29. Independent Sample Test for Automation Trust in Formal Autopilot Training 53
Table 30. Group Statistics for Automation Competency for Formal Autopilot Training 54
Table 31. Independent samples Test of Automation Competency in Formal Autopilot Training 54
Table 32. Group Statistics for Automation Techniques in Formal Autopilot Training 55
Table 33. Independent Samples Test of Automation Techniques for Formal Autopilot Training 56
Table 34. Group Statistics for Level of Automation in Formal Autopilot Training 56
Table 35. Independent Samples Test of Level of Automation for Formal Autopilot Training 57
Table 36. Descriptive Data for Automation Attitude in Combined Training Events 58
Table 37. ANOVA of Automation Attitude for Combined Training Events 58
Table 38. Descriptive Data for Automation Trust in Combined Training Events 59
Table 39. ANOVA on Automation Trust for Combined Training Events 60
Table 40. Descriptive Data of Automation Competency for Combined Training Events 61
Table 41. ANOVA on Automation Competency in Combined Training Events 61
Table 42. Post Hoc Analysis of the Automation Competency for Combined Training Events 62
Table 43. Descriptive Data for Level of Automation for the Combined Training Events 63
Table 44. ANOVA on Level of Automation for Combined Training Events 64
Table 45. Group Statistics for Automation Attitude with Glass 65

May 25, 2010 Version 1.0
vi
Table 46. Independent Samples for Automation Attitude with Glass 66
Table 47. Group Statistics for Automation Trust with Glass 66
Table 48. Independent Samples for Automation Trust with Glass 67
Table 49. Group Statistics Automation Competency with Glass 67
Table 50. Independent Samples for Automation Competency with Glass 68
Table 51. Group Statistics for Automation Techniques with Glass 68
Table 52. Independent Samples for Automaton Techniques with Glass 69
Table 53. Group Statistics for Level of Automation with Glass 70
Table 54. Independent Samples for Level of Automation with Glass 70
Table 55. Group Statistics for Automation Attitude with Autopilot and Moving Map 71
Table 56. Independent Sample for Automation Attitude with Autopilot and Moving Map 72
Table 57. Group Statistics for Automation Trust with Autopilot and Moving Map 72
Table 58. Independent Sample for Automation Attitude with Autopilot and Moving Map 73
Table 59. Group Statistics for Automation Competency with Autopilot and Moving Map 74
Table 60. Independent Sample for Automation Competency with Autopilot and Moving Map 74
Table 61. Group Statistics for Automation Techniques with Autopilot and Moving Map 75
Table 62. Independent Sample for Automation Techniques with Autopilot and Moving Map 76
Table 63. Group Statistics for Level of Automation with Autopilot and Moving Map 76
Table 64. Independent Sample for Level of Automation with Autopilot and Moving Map 77
Table 65. Group Statistics for Automation Attitude with RNAV 78
Table 66. Independent Sample for Automation Attitude with RNAV 79
Table 67. Group Statistics for Automation Trust with RNAV 79
Table 68. Independent Sample for Automation Trust with RNAV 80
May 25, 2010 Version 1.0
vii
Table 69. Group Statistics for Automation Competency with RNAV 80
Table 70. Independent Samples for Automation Competency with RNAV 81
Table 71. Group Statistics for Automation Techniques with RNAV 82
Table 72. Independent Samples for Automation Techniques with RNAV 82
Table 73. Group Statistics for Level of Automation with RNAV 83
Table 74. Independent Samples for Level of Automation with RNAV 83
Table 75. Descriptive Data for Automation Attitude by Age 84
Table 76. ANOVA for Automation Attitude by Age 85
Table 77. Post Hoc LSD Test for Automation Attitude by Age 85
Table 78. Descriptive Data for Automation Attitude by Flight Hour 87
Table 79. ANOVA for Automation Attitude by Flight Hour 87
Table 80. Descriptive Data for Automation Trust by Flight Hour 88
Table 81. ANOVA for Automation Trust by Flight Hour 89
Table 82. Descriptive Data for Automation Competency by Flight Hours 90
Table 83. ANOVA for Automation Competency by Flight Hours 91
Table 84. Descriptive Data for Automation Techniques by Flight Hours 91
Table 85. ANOVA for Automation Techniques by Flight Hours 92

Version 1.0 April 28, 2010
Determining Appropriate Levels of Automation
A cultural change in pilot training is needed. Pilots need to become flight managers rather
than strictly stick and rudder manipulators. The instructor community needs to change the
traditional focus of flight training from its almost single focus on “stick and rudder skills” to flight
manager. In this context, a flight manager is a pilot that controls all aspects of flight not just the
controls of an airplane. Currently, the focus in the typical flight-training program is only on the
psychomotor technical skills needed to fly an airplane (K. W. Lovelace, personal communication,
April 16, 2009). This focus does not preclude teaching critical thinking (judgment and decision-
making) and flight management, but historically it does not. In fact, according to the Aviation
Instructor‟s Handbook, “In the past, some students were introduced to ADM [Aeronautical
Decision Making] concepts toward the completion of their training or not at all” (p. 9-9, 1999).
The concept of flight management is beginning to be recognized by the instructor community and
in the research surrounding technically advanced aircraft (TAA) (p. 8-14, Aviation Instructor‟s
Handbook, 2008). Early FAA Industry Training Standards (FITS) research identified a need for
critical thinking and flight management skills to be taught throughout pilot training to improve
general aviation safety.
Background
Why do critical thinking and flight management skills need to be taught? Eighty percent of
the general aviation (GA) accidents are caused by human factors or have human factor as a
contributing factor. Formerly, human factors errors were called “pilot errors” (p. 8-14, Aviation
Instructor‟s Handbook, 2008). Pilot error more clearly communicates the nature of the safety
problem; that is, pilots are making bad decisions or using bad judgment, which leads to accidents.
The results of the FITS studies show significant improvements in pilot performance, situational
May 25, 2010 Version 1.0
2
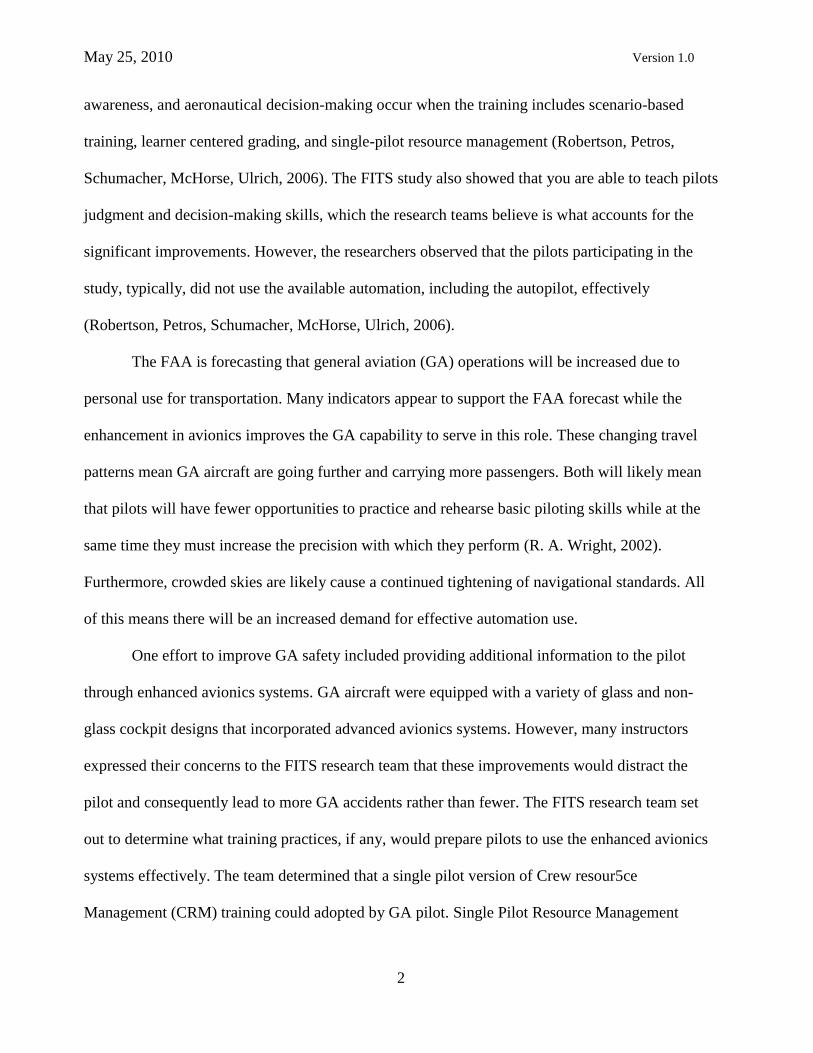
awareness, and aeronautical decision-making occur when the training includes scenario-based
training, learner centered grading, and single-pilot resource management (Robertson, Petros,
Schumacher, McHorse, Ulrich, 2006). The FITS study also showed that you are able to teach pilots
judgment and decision-making skills, which the research teams believe is what accounts for the
significant improvements. However, the researchers observed that the pilots participating in the
study, typically, did not use the available automation, including the autopilot, effectively
(Robertson, Petros, Schumacher, McHorse, Ulrich, 2006).
The FAA is forecasting that general aviation (GA) operations will be increased due to
personal use for transportation. Many indicators appear to support the FAA forecast while the
enhancement in avionics improves the GA capability to serve in this role. These changing travel
patterns mean GA aircraft are going further and carrying more passengers. Both will likely mean
that pilots will have fewer opportunities to practice and rehearse basic piloting skills while at the
same time they must increase the precision with which they perform (R. A. Wright, 2002).
Furthermore, crowded skies are likely cause a continued tightening of navigational standards. All
of this means there will be an increased demand for effective automation use.
One effort to improve GA safety included providing additional information to the pilot
through enhanced avionics systems. GA aircraft were equipped with a variety of glass and non-
glass cockpit designs that incorporated advanced avionics systems. However, many instructors
expressed their concerns to the FITS research team that these improvements would distract the
pilot and consequently lead to more GA accidents rather than fewer. The FITS research team set
out to determine what training practices, if any, would prepare pilots to use the enhanced avionics
systems effectively. The team determined that a single pilot version of Crew resour5ce
Management (CRM) training could adopted by GA pilot. Single Pilot Resource Management
May 25, 2010 Version 1.0
3
(SRM) is the single pilot version of CRM training and it includes the concepts of Aeronautical
Decision Making, (ADM), Risk Management (RM), Task Management (TM), Automation
Management, (AM), Controlled Flight into Terrain (CFIT) Awareness, and Situational Awareness
(Robertson, Petros, Schumacher, McHorse, Ulrich, 2006). Management skills include risk,
automation, and information management. Simply put, specific avionics training means teaching
the particular “glass cockpit” equipment. At this time, there is no standardization of the various
installations of glass cockpits in GA (Robertson, Petros, Schumacher, McHorse, Ulrich, 2006).
The information presented to the pilot and the method to obtain the information is not the same
even within a specific avionics line. For example, various aircraft manufacturers install the Garmin
G-1000 System with different screens, autopilots, sub-systems, and functionality. They each have
unique operating procedures and display information differently (see Garmin and Avidyne user‟s
Manuals).
To meet this challenge, the FITS research teams developed and tested new training
methods. The research studies showed, when using three basic concepts throughout flight training,
significant improvements in pilot performance and aeronautical decision-making resulted
(Robertson, Petros, Schumacher, McHorse, Ulrich, 2006; French, Blickensderfer, Ayers, Connolly,
2005). These three basic concepts are scenario-based training (SBT), learner-centered grading
(LCG), and single pilot resource management (SRM).
Research Questions
To realize actual improvements in GA safety, appropriate use of automation must be
established and trained. This study attempts to answer several research questions (a) why is the
available automation not being used (b) when should the automation be used, (c) how should the
automation be used, (d) why should the automation be used, (e) what are the impediments to

May 25, 2010 Version 1.0
4
effective automation use, and (f) what are the best practices for automation use? To take advantage
of the automation becoming available in GA, it is necessary to include training on how to use the
automation effectively. However, we must first answer the question about what is effective use of
the automation. The answers to these questions should provide guidance on appropriate use of
automation, best practices, and a basis for developing automation training.
Literature Review
Generally speaking, the literature on automation reflect that one or more of four elements
(knowledge, trust, comfort, and bias) determine when and where automation will be used, more so
than capability and reliability of the automation (Scherman, 1997). Determining how to use the
automation more effectively will not be useful until pilots are willing to use the automation. Pilots
base the decision to use the automation on knowledge, trust, comfort, and bias rather than on a
conscious decision to use it. The pilot will need to learn the how to operate and use the new
equipment as he or she would have to with any other new piece of equipment. Using a training
program to acquire the necessary knowledge and skills is typically a more efficient and effective
way to develop expertise in new technology than trial and error. Once basic system and procedural
knowledge in acquired, the operator can practice until they obtain trust and comfort with the new
system. Studies involving complex automated systems clearly indicate the importance of
developing trust before an operator is willing to use the new automation (Scherman, 1997). It is
likely that every pilot that has gone through the introduction of any new technology has
experienced this process for himself or herself or they have seen their student anguish through the
process. The remaining determinate is bias. Bias can include an array of pertinent topics; however,
in the context of this paper, bias will be limited to the macho pilot‟s attitude toward the need to
develop and maintain superior “stick and rudder” skills.

May 25, 2010 Version 1.0
5
The nature of pilot training ingrains bias from the very beginning. A pilot acquires various
pilot certificates and ratings based on meeting the minimum established performance standard
without assistance. Currency and flight review criteria drive the requirement to maintain at least
the minimum “stick and rudder” skills necessary to operate the aircraft safely. Until recently,
judgment and pilot decision training was not an integral part of initial pilot training programs and
practical tests did not fully examine them.
The automation literature provides us with a one possible definition of various levels of
automation. That is, (a) no automation (no autopilot or autopilot off), (b) basic automation
(autopilot in pitch and role hold only), (c) simple automation (autopilot in heading mode with
altitude hold), (d) full automation (autopilot in navigation with altitude or vertical speed hold), and
(e) advanced automation (autopilot in the flight management system [FMS] mode with altitude
select). Observations were made of flight operations in an air carrier that had various aircraft
equipped with three of these autopilots levels. The basic automation (autopilot with only pitch and
role hold) is more common in GA than in today‟s air carrier, so this level is included. Effectively,
the no automation level is present in every aircraft since the automation can be turned off, if
installed.
Methodology
Once the advantages of effective use of the automation, including the autopilot, are
recognized, the questions change to what should we teach the pilot to do with the autopilot so the
pilot has time to use the automation. This study is in two parts, the first part used a data collection
instrument to examine the issues surrounding automation and autopilot use and to determine an
answer to what we should teach, and the second part included pilot performance test with
May 25, 2010 Version 1.0
6
participants using four different levels of automation. The study begins with the issues surrounding
automation and autopilot use.
The literature suggested that knowledge, trust, comfort, and automation bias drives the use
of the automation. The comparisons made in this study assumed and reflected these drivers. The
data collection instrument, see Appendix A, was a questionnaire provide to the general pilot
population. The questionnaire asked question in six categories (a) demographics, (b) automation
attitude, (c) automation trust, (d) automation competency, (e) automation techniques, and (f)
appropriate levels of automation. The study used demographic information to learn about the
participants and to identify comparison groups. Then the study compared the self-reported
agreement with the statement in the data collection instrument for each of the remaining questions
between FITS verses Non-FITS training, Glass verses Non-Glass, Autopilot verses No Autopilot
training, Autopilot and Moving Map verses No Autopilot and no Moving Map, various Age
groups, and various Flight Hour groups. The next section discusses the analyses of the data for the
data collection instrument.
Data Analysis for Data Collection Instrument
One hundred and eighty (N=180) questionnaires were analyzed in the study. Thirteen of the
questionnaires were not complete and were excluded where the necessary data was missing.
Additionally, the participants had the opportunity to respond as not sure (NS) when they were not
sure. This resulted in some comparisons having an N as low as 100. The descriptive data shown
below includes the total number participants and the group size with the respective analysis. Table
1 shows 97% of the participants were men and 3% were women; 85.7% were between the ages of
16 and 24, 10.7% were between the ages of 25 and 34, 3.6% were 35 or older; and 54.8% had 0 to

May 25, 2010 Version 1.0
7
200 flight hours, 32.7% had 200 to 500 total flight hours, and 12.6% had more than 500 flight
hours.
Table 1. Participant Data
Sex Age Hours
Groups Size Percent Groups Size Percent Groups Size Percent
Male n=164 97.0 16-24 n=144 85.7 0-200 n=92 54.8
Female n=5 3.0 25-34 n=18 10.7 200-500 n=55 32.7
35-44 n=2 1.2 500-1000 n=9 5.4
45-60 n=3 1.8 1000-2500 n=5 3.0
>60 n=1 0.6 >2500 n=7 4.2
N=169 N=168 N=168
Missing data not included in the percentages.
Table 2 shows that 60.5% had moving maps and autopilot, and 39.5% did not have a
moving map and autopilot; 19.5% had no glass and 65.9% had glass (PFD, MFD, or Both); and
33.1% had RNAV, 37.3% do not have RNAV, and 29.5% were not sure.
Table 2. Equipment Data
Moving Map Glass Cockpit RNAV
Groups Size Percent Groups Size Percent Groups Size Percent
Yes n=101 60.5 No n=33 19.5 Yes n=55 33.1
No n=66 39.5 PFD n=2 1.2 No n=62 37.3
MFD n=6 3.6 NS n=49 29.5
Both n=103 60.9
NS n=25 14.8
N=167 N=169 N=166
Missing data not included in the percentages. NS=not sure.
Table 3. Training Data
FITS Accepted Formal Autopilot Training
Groups Size Percent Groups Size Percent
Yes n=45 26.8 Yes n=88 52.1
No n=60 35.7 No n=81 47.9
NS n=63 37.5
N=169 N=169
Missing data not included in the percentages. NS=not sure.
Table 3 shows that 26.8% had or were in a FITS accepted training program and 35.7% had
not received FITS accepted training, and 52.1% have had formal autopilot training and 47.9% had
not received formal autopilot training.
The analyses begin with a test of the differences between the means of the participants that
received FITS training, including FITS training in progress, and non-FITS training. T-test analyzed

May 25, 2010 Version 1.0
8
automation attitude, trust, competency, and techniques, and appropriate level of automation. All
test of significance used an alpha level of < .05. Shown in Table 4 is a summary of this analysis.
Shown in Appendix B are the complete results of the analysis. Similarly, summaries of the other
analyses are in this section and the complete results are in Appendixes C, D, E, F, G, H, and I.
Table 4 shows a summary of the significant mean differences between the groups for FITS
verses Non-FITS training. Significant differences were found in questions 13, 18, 20, 21, 22, 24,
28, 29, and 30 (Sig (2-tailed) = .015, .010, .000, .000, .000, .004, .025, .030, and .004,
respectively). Again, the questions are in Appendix A. Table 4 also shows the mean score for
significant results. Question 13, automation attitude, shows Sig (2-tailed) = .015 and the mean =
2.77/3.37 for the FITS verses Non-FITS trained pilot participant. The remaining findings are in a
similar manner and the complete analyses, again, are in Appendix B.
Table 4. Summary of FITS/Non-FITS Training Results t-Test Sig (2-tailed) Mean
Levene's Test Equal Not Equal FITS Non-FITS
Attitude 13 .015 2.77 3.37
Trust 18 .010 4.16 3.52
Competency 20 .000 3.98 3.08
Competency 21 .000 .000 4.41 3.23
Competency 22 .012 .000 3.89 2.60
Competency 24 .004 3.93 3.27
Techniques 28 .025 4.05 3.59
Techniques 29 .030 4.30 3.92
Levels 30 .004 2.55 3.24 Note. Statistical significance is < .05. When Levene‟s Test is significant, use the equal variance not assumed in these cases.
Table 5 shows a summary of the significant differences in means between groups for
formal autopilot training verses no formal autopilot training for questions 15, 18, 19, 20, 21, 22,
23, 24, 26, 28, 29, and 31 (Sig (2-tailed) = .037, .000, .006, .000, .000, .000, .000, .000, .026, .002,
.014, and .030, respectively). This time question 15 is the example. Question 15 shows the results
of the t-test (Sig (2-tailed) = .037, mean = 3.63/3.24). Read the remaining results in Table 5 in a
similar manner and the complete analyses are in Appendix C.

May 25, 2010 Version 1.0
9
Table 5. Summary of Formal Autopilot Training Results
t-Test Sig (2-tailed) Mean
Levene's Test Equal Not Equal A/P Training No-A/P Training
Attitude 15 .000 .037 3.62 3.24
Trust 18 .000 .000 4.10 2.56
Trust 19 .000 .006 2.33 1.71
Competency 20 .000 .000 3.78 2.24
Competency 21 .000 .000 4.22 2.20
Competency 22 .000 .000 3.67 1.80
Competency 23 .000 .000 3.48 1.75
Competency 24 .000 .000 3.90 2.16
Techniques 26 .009 .026 4.30 3.96
Techniques 28 .000 .002 4.02 3.53
Techniques 29 .014 4.16 3.80
Levels 31 .000 .030 3.23 2.79 Note. Statistical significance is < .05. Equal variances cannot be assumed when Levene‟s Test is significant; therefore, the 2-tailed significances for
not equal are used in these cases.
Table 6 summarizes the combined training affect, (a) Group 1 received FITS and formal
autopilot training, (b) Group 2 received only FITS training, (c) Group 3 received only autopilot
training, and (d) Group 4 did not receive FITS or autopilot training. Table 6 shows significant
differences between groups for an ANOVA analyses on questions 13, 18, 20, 21, 22, 23, 24, and
30 (Sig = .030, .001, .000, .000, .001, .000, and .005, respectively). The table also shows the
significant pairs of groups on the Post Hoc LSD test. For example, Groups 1 and 4 were the only
results that had a significant difference on the Post Hoc LSD test between groups was for question
13 (Sig = .003) and the mean scores for these groups were 2.66 and 3.55, respectively. Similarly,
Table 6. Summary of Combined Training Experiences
Post Hoc LSD
ANOVA Significant Between Groups Mean
Sig 1-2 1-3 1-4 2-3 3-4 G1 G2 G3 G4
13 .030 .003 2.66 3.55
18 .001 .004 .021 .000 4.43 3.11 3.73 3.26
20 .000 .008 .004 .000 .025 4.20 3.11 3.40 2.77
21 .000 .016 .000 .002 4.57 3.78 3.77 2.64
22 .000 .004 .001 .000 .001 4.17 2.78 3.13 2.06
23 .001 .000 .004 .003 .049 3.57 1.56 3.27 2.52
24 .000 .027 .000 .022 4.12 3.22 3.67 2.87
30 .005 .042 .000 2.40 3.00 3.45
Note. Statistical significances is <.05.

May 25, 2010 Version 1.0
10
question 18 showed Post Hoc LSD significant differences between Groups 1-2, 1-3, and 1-4 (Sig =
.004, .021, and .000, respectively) with means = 4.43/3.11, 4.43/3.73, and 4.43/3.26, respectively).
That is, Group 1 mean = 4.43 and Group 2 mean = 3.11 and so on. Read the remainder results of
the analysis in a similar manner and the complete analyses are in Appendix D.
Table 7 shows a summary of the significant differences in means for airplanes equipped
with “glass” flight instruments existed in questions 13, 16, 25, 26, 27, and 30 (Sig (2-tailed) =
.007, .039, .007, .001, .037, and .008, respectively). For this study, a glass cockpit has a primary
flight display (PFD), multifunctional display (MFD), or both, while non-glass has neither. Another
question asked if one or more of the airplanes the participants fly are technically advanced aircraft
(TAA). TAA is a broader term that may or may not include glass but it must have a GPS, moving
map, and autopilot. Those findings will be addressed next. Question 16, automation trust, is the
example this time on how to read these results reported in the table. Levene‟s Test was significant
(Sig = .050); therefore, the t-test results must be read under the equal variances not assumed
column (Sig (2-tailed) = .039, mean = 3.55/2.89). The complete analyses are in Appendix E.
Table 7. Summary of Glass Flight Instruments Results t-Test Sig (2-tailed) Mean
Levene's Test Equal Not Equal Non-Glass Glass
Attitude 13 .007 3.55 2.89
Trust 16 .050 .039 3.91 3.44
Techniques 25 .007 3.75 4.25
Techniques 26 .001 3.84 4.38
Techniques 27 .037 4.03 4.36
Levels 30 .008 3.31 2.70 Note. Statistical significances are < .05. * When Levene‟s Test is significant, use the equal variance not assumed result.
Table 8 shows a summary of the significant differences in means for TAA for questions 16,
18, 19, 20, 21, 22, 23, 24, 26, 28, 29, and 31 (Sig (2-tailed)= .016, .000, .015, .000, .000, .000,
.000, .000, .037, .003, .011, and .027, respectively). In this study, define TAA as an airplane
equipped with an autopilot, global positioning system navigational equipment (GPS), and a
moving map display. Using question 16 as the example for reading Table 8, Levene‟s Test (Sig =

May 25, 2010 Version 1.0
11
.000), t-test (Sig = .016), and means = 3.74/3.21. Read the remaining results in the same manner.
The complete results are in Appendix F.

May 25, 2010 Version 1.0
12
Table 8. Summary of Technically advanced aircraft Results
t-Test Sig (2-tailed) Mean
Levene's Test Equal Not Equal TAA Non-TAA
Trust 16 .000 .016 3.74 3.21
Trust 18 .000 .000 3.91 2.53
Trust 19 .000 .015 2.26 1.67
Competency 20 .000 .000 3.59 2.26
Competency 21 .000 .000 4.08 2.00
Competency 22 .000 .000 3.42 1.74
Competency 23 .000 .000 3.19 1.86
Competency 24 .000 .000 3.61 2.27
Techniques 26 .037 4.29 3.98
Techniques 28 .003 3.98 3.48
Techniques 29 .011 4.14 3.76
Levels 31 .000 .027 3.22 2.73 Note. Statistical significances are < .05. Use equal variance not assumed results when Levene‟s Test is significant.
Table 9 shows significant differences in means for area navigation (RNAV) equipped
airplanes for questions 11, 12, 15, 18, 19, 20, 21, 22, 23, and 24 (Sig (2-tailed)= .035, .027, .016,
.000, .010, .000, .000, .000, .000, and .000, respectively). Please read this table like Table 8 and
find the complete results in Appendix G.
Table 9. Summary of Area Navigation Results
t-Test Sig 2-tailed Mean
Levene's Test Equal Not Equal RNAV N/RNAV
Attitude 11 .007 .035 4.30 4.68
Attitude 12 .027 3.89 4.26
Attitude 15 .011 .016 3.72 3.21
Trust 18 .000 .000 4.11 2.81
Trust 19 .000 .010 2.31 1.61
Competency 20 .000 .000 3.78 2.58
Competency 21 .000 .000 4.20 2.58
Competency 22 .000 .000 3.63 2.06
Competency 23 .000 .000 3.40 1.95
Competency 24 .000 .000 3.74 2.53 Note. Statistical significances are < .05. Use the equal variance not assumed results when Levene‟s Test is significant.
Table 10 shows significant differences in the means between the groups for various age
groups. Questions 11, 13, and 15 showed significant differences in the mean scores on the
ANOVA (Sig = .004, .013, and .035, respectively) (see Table 10). Question 11 showed significant
differences in means between groups 1-4 (mean = 4.38/2.75 and Sig = .003), 2-3 (mean =
4.65/3.00 and Sig = .037), and 2-4 (mean = 4.65/2.75 and Sig = .001) on the LSD Post Hoc

May 25, 2010 Version 1.0
13
Table 10. Summary of Age Results
Post Hoc LSD
ANOVA Significant Between Groups Mean
Sig 1-2 1-3 1-4 2-3 2-4 3-4 G1 G2 G3 G4
Attitude 11 .004 .003 .037 .001 4.38 4.65 3.00 2.75
Attitude 13 .013 .016 .043 .043 3.14 2.88 1.00 1.67
Attitude 15 .035 .047 3.34 4.50
Note. Statistical significances are < .05.
analysis. Question 13 showed significant differences in means between groups 1-3 (mean =
3.14/1.00 and Sig = .016), 1- 4 (mean = 3.14/1.75 and Sig = .027), and 2-3 (mean = 2.88/1.00 and
Sig = .043) on the LSD Post Hoc analysis. Question 15 showed significant differences in means
between groups 1- 4 (mean = 3.34/4.50 and Sig = .047) on the LSD Post Hoc analysis. The means
for all significant group differences are in the four columns at the right of the table (see Table 10).
Complete results are in Appendix H.
Table 11 shows significant differences in means for various flight hour groups for nineteen
of the questions asked on the questionnaire. Questions 11, 13, 14, 18, 20, 21, 22, 23, 24, 28, and 29
showed significant differences between the groups on the ANOVA (Sig = .010, .008, .009, .000,
.000, .000, .000, .000, .000, .024, .037, respectively), the significant individual group differences
on the LSD Post Hoc test, and the mean score for each group. Complete results are in Appendix I.
Finally, independent sample t-test analyses were made on the men verses women but there
are no significant differences for any of the questions. The lack of significant differences may be
due to the small number of women participants rather than there not being any differences between
men and women. Nevertheless, there are no statistical findings to report.

May 25, 2010 Version 1.0
14
Table 11. Summary of Flight Hour Results Post Hoc LSD
ANOVA Significant Between Groups Mean
Sig 1-2 1-3 1-4 1-6 2-3 2-4 2-6 3-6 4-6 G1 G2 G3 G4 G6
11 .010 .007 .001 .024 .008 4.27 4.60 4.38 4.80 3.14
13 .008 .002 .005 3.22 3.13 1.71
14 .009 .009 .023 2.48 1.50 1.57
18 .000 .000 .000 .012 .003 2.69 4.04 4.75 4.40 4.43
20 .000 .000 .000 .001 .043 2.49 3.53 4.63 4.80
21 .000 .000 .000 .001 .012 2.46 4.13 4.88 4.80 4.00
22 .000 .000 .000 .000 .010 .044 .039 2.09 3.38 4.50 4.80 3.57
23 .000 .000 .016 .000 .011 2.00 3.48 3.38 4.60 2.29
24 .000 .000 .002 .000 .024 2.44 3.72 4.13 4.80 3.71
28 .024 .001 3.57 4.15
29 .037 .003 3.80 4.27
Note. Statistical significance is < .05.
Now the pilot performance testing and analysis part of the study will be presented.
Data Analysis for Pilot Performance Data
Sixteen scenarios were analyzed in this portion of the study. Each participant flew a
prescribe scenario (see Appendix J) using one of four levels of automation. The four levels of
automation were (a) autopilot on with the flight plan loaded in the navigation equipment, (b)
autopilot off with the flight plan loaded, (c) autopilot on without flight guidance, and (d) autopilot
off without flight guidance. The pilot performance was measured during for each level of
automation using the same scenario. The scenario included a planned portion and an un-planned
portion. The planned portion began with the aircraft taxing into position for takeoff, the takeoff
and climb to the planned en-route altitude, radar vectors to join a victor airway, and navigation
along the airway. The participant was given a weather report (trigger event) that required a
diversion, which began the un-planned portion. This portion included an opportunity to choose the
action the pilot could take followed by instructions for recovery. Consequences of all choices lead
to returning the aircraft back to the departure airport. The instructions included radar vectors to
May 25, 2010 Version 1.0
15
intercept the localizer followed by a clearance to fly the ILS for landing. The next section
discusses the analyses of the pilot performance data.
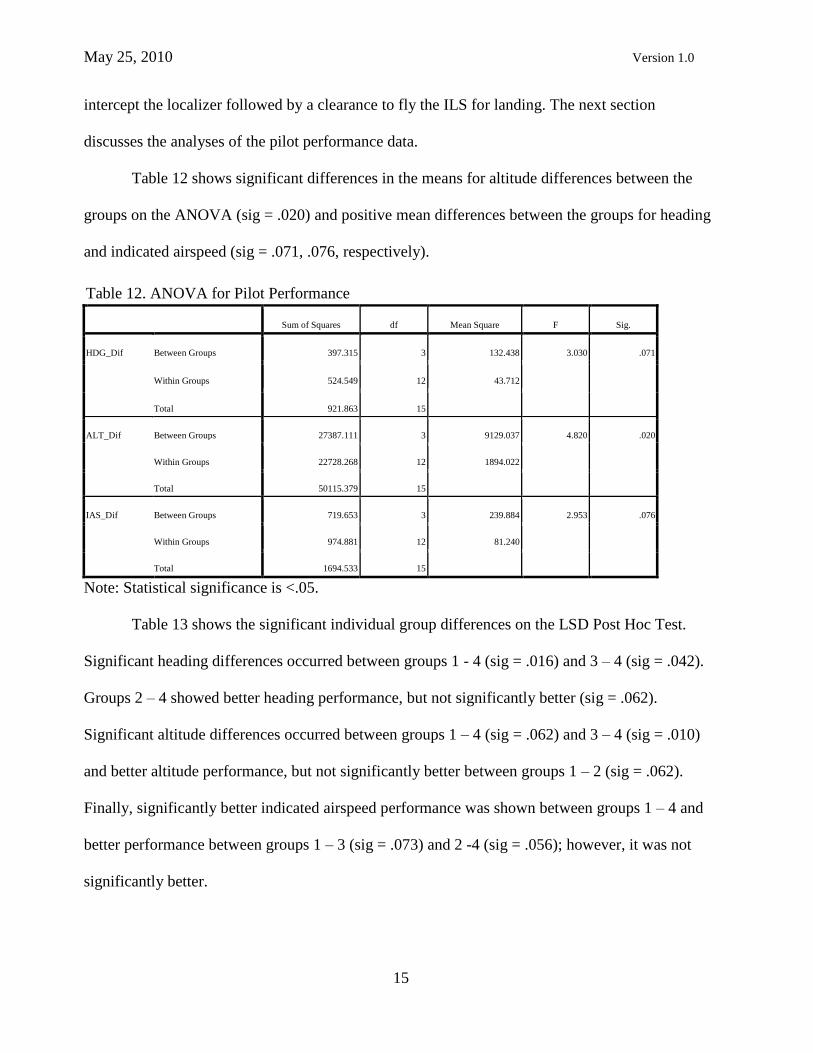
Table 12 shows significant differences in the means for altitude differences between the
groups on the ANOVA (sig = .020) and positive mean differences between the groups for heading
and indicated airspeed (sig = .071, .076, respectively).
Table 12. ANOVA for Pilot Performance
Sum of Squares df Mean Square F Sig.
HDG_Dif Between Groups 397.315 3 132.438 3.030 .071
Within Groups 524.549 12 43.712
Total 921.863 15
ALT_Dif Between Groups 27387.111 3 9129.037 4.820 .020
Within Groups 22728.268 12 1894.022
Total 50115.379 15
IAS_Dif Between Groups 719.653 3 239.884 2.953 .076
Within Groups 974.881 12 81.240
Total 1694.533 15
Note: Statistical significance is <.05.
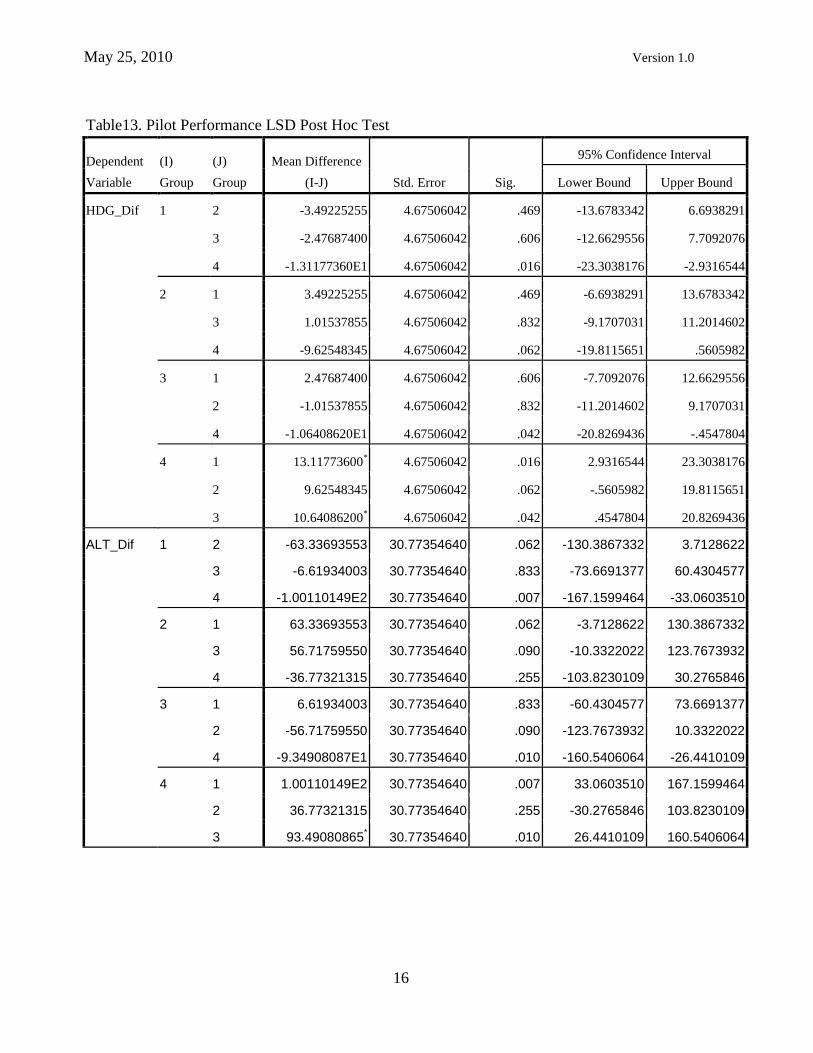
Table 13 shows the significant individual group differences on the LSD Post Hoc Test.
Significant heading differences occurred between groups 1 - 4 (sig = .016) and 3 – 4 (sig = .042).
Groups 2 – 4 showed better heading performance, but not significantly better (sig = .062).
Significant altitude differences occurred between groups 1 – 4 (sig = .062) and 3 – 4 (sig = .010)
and better altitude performance, but not significantly better between groups 1 – 2 (sig = .062).
Finally, significantly better indicated airspeed performance was shown between groups 1 – 4 and
better performance between groups 1 – 3 (sig = .073) and 2 -4 (sig = .056); however, it was not
significantly better.
May 25, 2010 Version 1.0
16
Table13. Pilot Performance LSD Post Hoc Test
Dependent
Variable
(I)
Group
(J)
Group
Mean Difference
(I-J) Std. Error Sig.
95% Confidence Interval
Lower Bound Upper Bound
HDG_Dif 1 2 -3.49225255 4.67506042 .469 -13.6783342 6.6938291
3 -2.47687400 4.67506042 .606 -12.6629556 7.7092076
4 -1.31177360E1 4.67506042 .016 -23.3038176 -2.9316544
2 1 3.49225255 4.67506042 .469 -6.6938291 13.6783342
3 1.01537855 4.67506042 .832 -9.1707031 11.2014602
4 -9.62548345 4.67506042 .062 -19.8115651 .5605982
3 1 2.47687400 4.67506042 .606 -7.7092076 12.6629556
2 -1.01537855 4.67506042 .832 -11.2014602 9.1707031
4 -1.06408620E1 4.67506042 .042 -20.8269436 -.4547804
4 1 13.11773600* 4.67506042 .016 2.9316544 23.3038176
2 9.62548345 4.67506042 .062 -.5605982 19.8115651
3 10.64086200* 4.67506042 .042 .4547804 20.8269436
ALT_Dif 1 2 -63.33693553 30.77354640 .062 -130.3867332 3.7128622
3 -6.61934003 30.77354640 .833 -73.6691377 60.4304577
4 -1.00110149E2 30.77354640 .007 -167.1599464 -33.0603510
2 1 63.33693553 30.77354640 .062 -3.7128622 130.3867332
3 56.71759550 30.77354640 .090 -10.3322022 123.7673932
4 -36.77321315 30.77354640 .255 -103.8230109 30.2765846
3 1 6.61934003 30.77354640 .833 -60.4304577 73.6691377
2 -56.71759550 30.77354640 .090 -123.7673932 10.3322022
4 -9.34908087E1 30.77354640 .010 -160.5406064 -26.4410109
4 1 1.00110149E2 30.77354640 .007 33.0603510 167.1599464
2 36.77321315 30.77354640 .255 -30.2765846 103.8230109
3 93.49080865* 30.77354640 .010 26.4410109 160.5406064

May 25, 2010 Version 1.0
17
IAS_Dif 1 2 -2.75813928 6.37338421 .673 -16.6445506 11.1282720
3 -12.51159743 6.37338421 .073 -26.3980087 1.3748139
4 -1.62545797E1 6.37338421 .025 -30.1409909 -2.3681684
2 1 2.75813928 6.37338421 .673 -11.1282720 16.6445506
3 -9.75345815 6.37338421 .152 -23.6398694 4.1329531
4 -13.49644038 6.37338421 .056 -27.3828517 .3899709
3 1 12.51159743 6.37338421 .073 -1.3748139 26.3980087
2 9.75345815 6.37338421 .152 -4.1329531 23.6398694
4 -3.74298223 6.37338421 .568 -17.6293935 10.1434291
4 1 16.25457965* 6.37338421 .025 2.3681684 30.1409909
2 13.49644038 6.37338421 .056 -.3899709 27.3828517
3 3.74298223 6.37338421 .568 -10.1434291 17.6293935
*. The mean difference is significant at the 0.05 level.
Note:
Group 1 – autopilot on with flight plan loaded.
Group 2 – autopilot off with the flight plan loaded.
Group 3 – autopilot on with no flight plan loaded.
Group 4 – autopilot off with no flight plan loaded.
This section reported summaries of the analyses. A copy of the data collection instrument
and the scenario are in Appendix A and Appendix J with the details of the analyses in Appendix B
through Appendix I. Appendix J contains the scenario for the pilot performance testing. The next
section will present a summary of the significant findings. A discussion of the results, conclusion,
limitations, and recommendation will follow in the last section.
Summary of Findings
Significant differences between group means are in each of the five areas (automation
attitude, automation trust, automation competency, automation techniques, and appropriate level of
automation) for one or more questions in the nine comparisons except combined training, age, and
May 25, 2010 Version 1.0
18
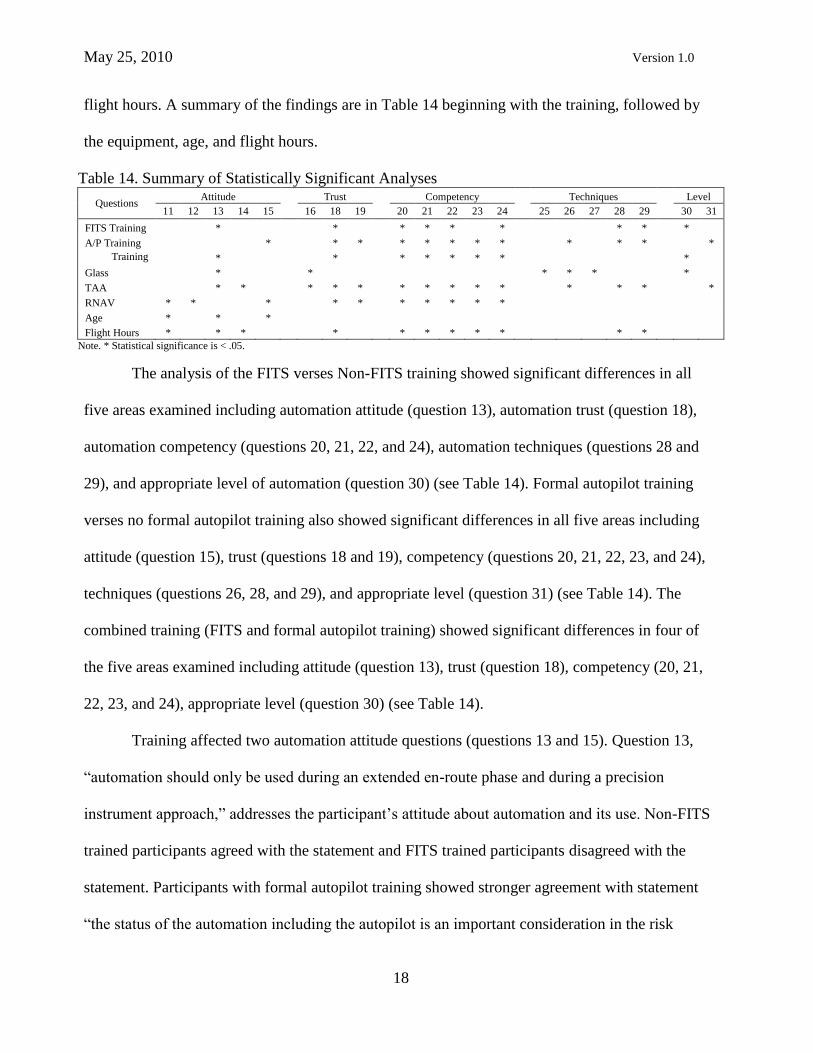
flight hours. A summary of the findings are in Table 14 beginning with the training, followed by
the equipment, age, and flight hours.
Table 14. Summary of Statistically Significant Analyses
Questions Attitude Trust Competency Techniques Level
11 12 13 14 15 16 18 19 20 21 22 23 24 25 26 27 28 29 30 31
FITS Training * * * * * * * * *
A/P Training * * * * * * * * * * * *
Training * * * * * * * *
Glass * * * * * *
TAA * * * * * * * * * * * * * *
RNAV * * * * * * * * * *
Age * * *
Flight Hours * * * * * * * * * * *
Note. * Statistical significance is < .05.
The analysis of the FITS verses Non-FITS training showed significant differences in all
five areas examined including automation attitude (question 13), automation trust (question 18),
automation competency (questions 20, 21, 22, and 24), automation techniques (questions 28 and
29), and appropriate level of automation (question 30) (see Table 14). Formal autopilot training
verses no formal autopilot training also showed significant differences in all five areas including
attitude (question 15), trust (questions 18 and 19), competency (questions 20, 21, 22, 23, and 24),
techniques (questions 26, 28, and 29), and appropriate level (question 31) (see Table 14). The
combined training (FITS and formal autopilot training) showed significant differences in four of
the five areas examined including attitude (question 13), trust (question 18), competency (20, 21,
22, 23, and 24), appropriate level (question 30) (see Table 14).
Training affected two automation attitude questions (questions 13 and 15). Question 13,
“automation should only be used during an extended en-route phase and during a precision
instrument approach,” addresses the participant‟s attitude about automation and its use. Non-FITS
trained participants agreed with the statement and FITS trained participants disagreed with the
statement. Participants with formal autopilot training showed stronger agreement with statement
“the status of the automation including the autopilot is an important consideration in the risk

May 25, 2010 Version 1.0
19
management (go-no go) decision” (question 15) than the group without formal autopilot training.
The combined training effect was only significant in question 13 where the group receiving FITS
and formal autopilot training disagreed while the group that did not receive either type of training
agreed.
Training also affected two automation trust questions (questions 18 and 19). Questions 18,
“I know how to update the navigation program (flight plan) to comply with ATC instruction…,”
addressed the participant‟s trust in the automation. Participants receiving FITS accepted training
reported stronger agreement with the statement than participants that did not receive FITS training.
Participants receiving formal autopilot training agreed with the statement while the participants
that did not receive formal autopilot training disagreed. Participants receiving both FITS and
formal autopilot training, in the combined effect analysis, agreed more strongly than those that
received FITS only, autopilot only, or neither FITS and autopilot. Question 19, “I turn off the
automation if the flight plan changes in-flight rather than reprogramming the RNAV/GPS,” also
addressed the participant‟s trust in the automation. However, question 19 only showed significant
differences on the analysis of the formal autopilot training. In this case, the participants with
formal autopilot training disagreed more strongly than those without.
All of the automation competency questions, except question 23 for the FITS/Non-FITS
training analysis, showed significant differences; (a) question 20, “I know how to use all of the
functions of the navigation and automation equipment…,” (b) question 21, “I am proficient using
the basic functions of the autopilot and navigation equipment,” (c) question 22, “I am proficient
using the advanced functions of the autopilot and navigation equipment,” (d) question 23, “I do not
encounter „automation surprise‟ when I am using the automation,” (e) question 24, “I know
effective techniques to counter complacency.” In the FITS/Non-FITS training analysis, questions
May 25, 2010 Version 1.0
20
20, 21, 22, and 24 showed stronger agreement with the statement, except on question 22 where the
FITS trained group agreed and the Non-FITS group disagreed. For the formal autopilot/no-formal
autopilot training analysis, questions 20 through 24, all participants receiving formal autopilot
training agreed with the statement while those without formal autopilot training disagreed. For the
combined training effect, the same pattern occurred with the FITS and formal autopilot training;
that is, those receiving training stronger agreement with the statement or showed agreement verses
disagreement with the statement. One additional result is worthy of note; that is, the group with
FITS and without formal autopilot training compared to the group without FITS and with formal
autopilot training showed a disagreement verses agreement on question 23. This finding is
discussed further in the conclusion section.
The FITS and formal autopilot training analysis showed significance on questions 28 and
29. Additionally, the formal autopilot training analysis showed significance on question 26.
However, the combined effect of the two events showed no significances in automation
techniques. Examining the questions in sequence, question 25, “approaching a waypoint, the
direction of turn, and the roll out heading should be reviewed to monitor the automated tracking,”
addresses automation technique. In this result, the participants receiving formal autopilot training
agreed more strongly with the statement. In questions 28 and 29; “between waypoints, the aircraft
position should be verified by checking the distance and radial from an off-track NAV aid” and
“when visibility permits, the aircraft position should be verified by checking the visual position
against the moving map position;” respectively; both the FITS and formal autopilot trained
participants agreed more strongly with the automation technique questions than those without the
respective training.
May 25, 2010 Version 1.0
21
Training affected two questions in the final area, appropriate level of automation. Question
30, “the HDG and ALT modes of the autopilot should not be selected until established on a
programmed leg of the flight,” and question, “select the HDG and ALT SEL/HLD (VNA) modes
of the autopilot as soon after takeoff as legally permissible and then selecting the NAV/GPSS
mode as soon as course guidance is available,” FITS training and the combined training events
showed significant differences on question 30 and formal autopilot training showed significant
differences on question 31. On question 30, the FITS and combined trained groups disagreed with
the statement while the groups without FITS and without FITS and formal autopilot training
(combined training events) agreed. On question 31, the group receiving formal autopilot training
agreed with the statement and those without autopilot training disagreed.
In airplane equipped with “glass” flight instrument verses no “glass” only four areas
including attitude (question 13); trust (question 16); techniques (questions 25, 26, 27); and
appropriate level (question 30) showed significant differences between the group means (see Table
14). On question 13, “automation should only be used during extended en-route phase and during a
precision instrument approach,” the participants with glass disagreed with the statement while
those without glass agreed. On question 16, “I trust the automation will accurately and precisely
control the airplane during all phases of flight; except takeoff, initial climb-out, short final, and
landing,” the participants without glass showed stronger support for the statement than those with
glass. On questions 25, 26, and 27 (“before activation a GPS/RNAV flight plan, the flight plan
information should be compared to the NAV log…;” “approaching a waypoint, the direction of
turn and roll out heading should be reviewed…;” and “at the waypoint, the course, distance, and
time to the next waypoint should be cross-checked…; respectively) showed stronger support by the
participants with glass than those without glass. Finally, on question 30, “the HDG and ALT
May 25, 2010 Version 1.0
22
modes of the autopilot should not be selected until established on a programmed leg,” showed
disagreement by the participants with glass, while those without glass agreed.
The analyses of TAA, where TAA is defined as having an autopilot, GPS, and a moving
map, showed significant differences on questions 16, 18, and 19 in trust; questions 20, 21, 22, 23,
24 in competency, questions 26, 28, and 29 in techniques; and question 31 in appropriate level (see
Table 14). On questions 16, “I trust the automation will accurately and precisely control the
airplane during all phases of flight…,” showed stronger support for the statement for the
participants flying TAA than the participants flying non-TAA. On question 19, “I know how to
update the navigation program (flight plan) to comply…,” participants flying TAA showed
agreement for the statement, while participants flying non-TAA disagreed. On question 19, “I turn
off the automation if the flight plan changes in-flight rather than reprogramming…,” participants
flying TAA showed less disagreement with the statement than those flying non-TAA. That is,
when the airplane is equipped with an autopilot and a moving map the participants use the
automation more. On all the automation competency questions, the participants flying TAA agreed
with the statement, while those flying non-TAA disagreed. Respectively, questions 20 through 24
were “I know how to use all of the functions…,” “I am proficient using the basic functions…,“ “I
am proficient using the advanced functions…,” “I do not encounter „automation surprise‟…,” and
“I know effective techniques to counter complacency.” On question 26, 28, and 29; “approaching a
waypoint, the direction of turn and the roll out heading should be reviewed…,” “between
waypoints, the aircraft position should be verified…,” and “when visibility permits, the aircraft
position should be verified…,” respectively; the participants flying TAA more strongly agreed
with the statements than those flying non-TAA. On question 31, “select the HDG and ALT

May 25, 2010 Version 1.0
23
SEL/HLD (VNAV) modes of the autopilot as soon after takeoff as legally permissible…,” the
participants flying TAA agreed with the statement, while those flying non-TAA disagreed.
In the analyses of RNAV verses without RNAV, only automation attitude (questions 11,
12, and 15; automation trust (questions 18 and 19); and competency (questions 20, 21, 22, 23, and
24) showed significant differences (see Table 14). Questions 11 and 12, “obtaining and
maintaining “stick and rudder skills” is paramount…” and “automation should be reduced “one-
level” if the pilot is unsure…,” respectively, showed less agreement with these statements by
participants flying RNAV equipped airplanes than did those flying non-RNAV equipped airplanes.
On question 15, “the status of the automation including the autopilot is an important consideration
in the risk management (go-no go) decision” the participants flying RNAVs agreed more with the
statement than did those flying without RNAVs. Participants flying RNAVs agreed with “I know
how to update the navigation program…,” question 18, while those flying non-RNAV equipped
airplanes disagreed. On question 19, “I turn off the automation if the flight plan changes…,” the
participants flying RNAVs disagreed more strongly. Finally, the participants flying RNAVs agreed
while those flying non-RNAV equipped airplanes disagreed with the automation competency
statements. These questions are (a) question 20, “I know how to use all of the functions of the
navigation…;” (b) question 21, “I am proficient using the basic functions…;” (c) question 22, “I
am proficient using the advanced functions…;” (d) question 23, “I do not encounter „automation
surprise‟…;” and (e) question 24, “I know effective techniques to counter complacency.”
The analyses of the various age groups only showed significant difference in the
automation attitude questions. The significant differences were on questions, 11, 13, and 15, (see
Table 14). On question 11, “obtaining and maintaining „stick and rudder skills‟ is paramount…,”
three age groups had significant differences (a) the participants 16 to 24 years old agreed with the

May 25, 2010 Version 1.0
24
statement while the 45 and older disagreed; (b) participants 25 to 34 agreed while participants 35
to 44 were neutral; and (c) participants 25 to 34 agreed while the 45 and older disagreed. On
question 13, “automation should only be used during an extended enroute phase and during a
precision instrument approach,” again three age groups had significant differences (a) the
participants 16 to 24 years old agreed with the statement while the 35 to 44 year old group strongly
disagreed; (b) participants 16 to 24 years old agreed with the statement while the 45 and older
disagreed; and (c) participants 25 to 34 disagreed while participants 35 to 44 were neutral. On
question 15, “the status of the automation including the autopilot is an important consideration in
the risk management (go – no go) decision,” the participants 16 to 24 years old agreed with the
statement while the 35 to 44 year old group strongly agreed.
Finally, Table 14 shows the significant differences of the various flight hour groups. The
analyses showed four of the five areas had significant differences including attitude (questions 11,
13, and 14); trust (question 18); competency (questions 20, 21, 22, 23, and 24); and techniques
(questions 28 and 29) (see Table 14) for the various flight hour groups. On question 11, “obtaining
and maintaining „stick and rudder skills‟ is paramount…,” four of the five of the groups with 0 to
1,500 flight hours agreed stronger with the statement than the participants with over 2,500 flight
hours. On question 13, “automation should only be used during an extended enroute phase and
during a precision instrument approach,” the 0 to 200-hour and the 200 to 500-hour groups agreed
with the statement while the over 2,500-hour group disagreed. On question 14, “automation is not
a good workload management tool…,” the 0 to 200-hour group disagreed with the statement while
the 500 to 1,000-hour and the over 2,500-hour groups more strongly disagreed. On the automation
trust question 18, “I know how to update the navigation program…,” the 0 to 200-hour group
disagreed with the statement while the 200 to 500-hour, 500 to 1,000-hour, 1,000 to 1,500-hour,

May 25, 2010 Version 1.0
25
and the over 2,500-hour agreed. On question 20 (automation competency), “I know how to use all
of the functions of the navigation and automation equipment…,” the 0 to 200-hour group disagreed
with the statement while the 200 to 500-hour, 500 to 1,000-hour, and 1,000 to 1,500-hour groups
agreed and the 500 to 1,000-hour agreed more strongly than the 200 to 500-hour group. On
question 21, “I am proficient using the basic functions of the autopilot and navigation equipment,”
again the 0 to 200-hour group disagreed while the remaining groups, except the 1,500 to 2,500-
hour group, agreed. On question 22, “I am proficient using the advanced functions…,” the 0 to
200-hour group disagreed while the remaining groups, except the 1,500 to 2,500-hour group,
agreed all so the 500 to 1,000-hour and 1,000 to 1,500-hour groups agreed more strongly than the
200 to 500-hour group. On question 23, “I do not encounter „automation surprise‟…,” the 0 to 200-
hour group disagreed while only the 200 to 500-hour, 500 to 1,000-hour, and 1,000 to 1,500-hour
groups agreed; furthermore, the over 2,500-hour group agreed more strongly than the 1,000 to
1,500-hour group. On question 24, “I know effective techniques to counter complacency,” the 0 to
200-hour group disagreed with the statement while the other group, except the 1,500 to 2,500-hour
group, agreed. Finally, on questions 28 and 29 (automation techniques), “between waypoints, the
aircraft position should be verified…” and “when visibility permits, the aircraft position should be
verified…,” the 200 to 500-hour group agreed more strongly with the statement than the 0 to 200
hour group.
The summary shows significant differences on 20 of the 23 questions asked in the data
collection instrument (see Appendix A) resulting in 65 significant findings (see Table 14). Only
automation trust, question 17, and appropriate level of automation, questions 32 and 33, showed no
significant differences between groups on any of the analyses.
May 25, 2010 Version 1.0
26
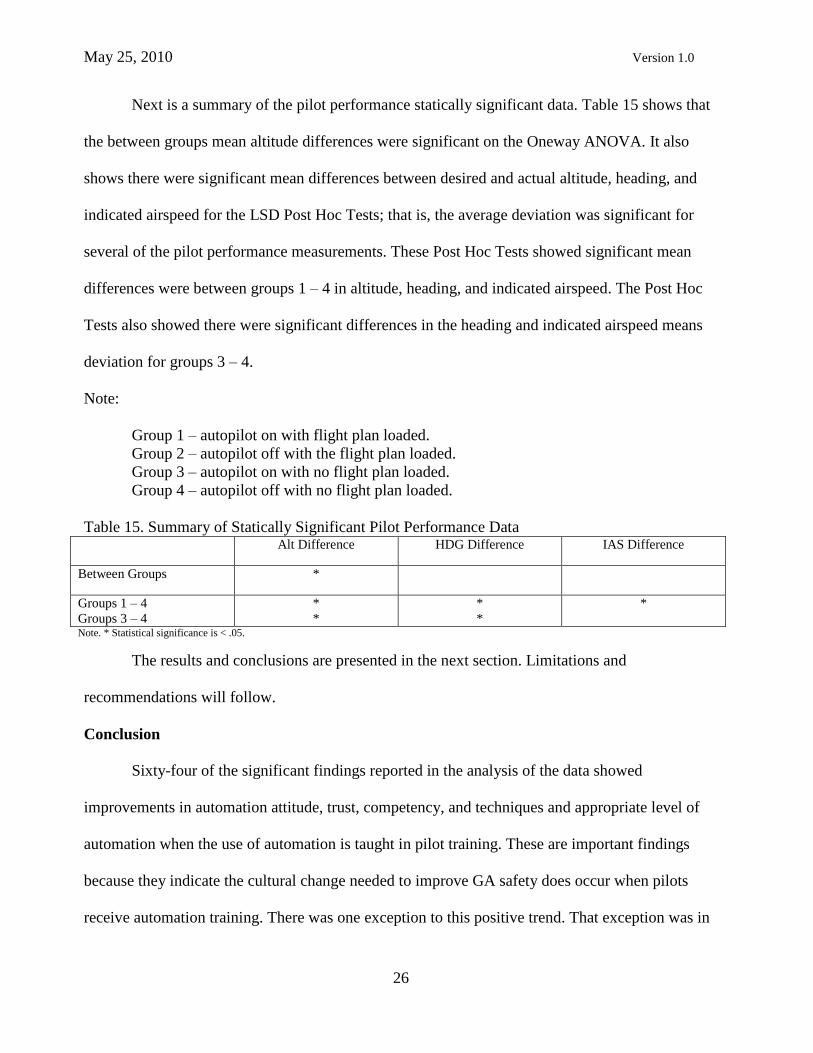
Next is a summary of the pilot performance statically significant data. Table 15 shows that
the between groups mean altitude differences were significant on the Oneway ANOVA. It also
shows there were significant mean differences between desired and actual altitude, heading, and
indicated airspeed for the LSD Post Hoc Tests; that is, the average deviation was significant for
several of the pilot performance measurements. These Post Hoc Tests showed significant mean
differences were between groups 1 – 4 in altitude, heading, and indicated airspeed. The Post Hoc
Tests also showed there were significant differences in the heading and indicated airspeed means
deviation for groups 3 – 4.
Note:
Group 1 – autopilot on with flight plan loaded.
Group 2 – autopilot off with the flight plan loaded.
Group 3 – autopilot on with no flight plan loaded.
Group 4 – autopilot off with no flight plan loaded.
Table 15. Summary of Statically Significant Pilot Performance Data Alt Difference HDG Difference IAS Difference
Between Groups *
Groups 1 – 4
Groups 3 – 4
*
*
*
*
*
Note. * Statistical significance is < .05.
The results and conclusions are presented in the next section. Limitations and
recommendations will follow.
Conclusion
Sixty-four of the significant findings reported in the analysis of the data showed
improvements in automation attitude, trust, competency, and techniques and appropriate level of
automation when the use of automation is taught in pilot training. These are important findings
because they indicate the cultural change needed to improve GA safety does occur when pilots
receive automation training. There was one exception to this positive trend. That exception was in

May 25, 2010 Version 1.0
27
the comparison between glass verses non-glass equipped airplane for question 16 (automation
trust) “I trust the automation will accurately and precisely control the airplane during all phases of
flight; except takeoff, initial climb-out, short final, and landing.” This finding showed a stronger
agreement with the statement for the non-glass group than the glass group. Unfortunately, whether
the lower level of trust reported by the group with glass equipment was due to their lack of
proficiency using glass, a belief that the glass does not provide the accuracy or precision the non-
glass equipment provides, or some other reason is unknown. This question will need additional
research to determine the cause and possible resolution of this trust issue.
A closer look at the 64 significant findings showed significant improvements in (a)
automation attitude, trust, competency, and techniques, and the appropriate level of automation
with FITS training; (b) automation attitude, trust, competency, and the appropriate level of
automation with formal autopilot training; (c) automation attitude, trust, and the appropriate level
of automation with the combined FITS and formal autopilot training; (d) automation attitude and
techniques, and the appropriate level of automation with glass equipped airplanes; (e) automation
attitude, trust, competency, and techniques, and the appropriate level of automation with moving
map and autopilot equipped airplanes; (f) automation attitude, trust, and competency with RNAV
equipped airplanes; (g) automation attitude for different age groups; and (h) automation attitude,
trust, competency, and techniques for various flight hour groups. Collectively, these findings
indicate that the pilot‟s attitude about, trust of, and competency using the installed automation can
be improved with training. The findings also indicate the type of available automation is important.
Furthermore, pilots can be taught effective techniques and appropriate level of automation use.
Training does have a positive effect on the participant‟s attitude about the use of the automation.
All of this is important because effective use of the automation is necessary in today‟s airspace and

May 25, 2010 Version 1.0
28
will likely become required tomorrow. Earlier FITS studies concluded that effective use of the
automation is important to general aviation safety due, in part, to the complexity of today‟s
advanced avionics (Robertson, Petros, Schumacher, McHorse, Ulrich, 2006).
The study also shows that pilot performance is significantly improved when autopilot was
used (group 1‟s heading, altitude, and indicated airspeed was significant better than group 4‟s
control of these measurements). Furthermore, it was observed that the participants did not use the
advanced avionics, accomplish the aircraft checklist, nor update the weather information as they
proceeded to the final destination when the autopilot was not engaged.
This study confirms the suggestion made in the literature and in the earlier FITS studies
that the workload changes with each level of automation. That is, the pilot spends less time
manipulating the flight controls as the level of automation progresses from no automation to full
automation, but spends more time manipulating the automation. For example, when the autopilot is
off the pilot spends his or her time flying the aircraft and when the automation is at the full
automation level, the pilot spends very little time manipulating the controls of the aircraft.
However, the pilot must set up, select, and program the appropriate automation, including the
autopilot. At the advanced automation level, the pilot must program the automation and select the
appropriate modes and only needs to monitor the aircraft. This may be a shift in workload from
controlling the aircraft to controlling the automation. In other words, the workload shifts from
“Stick and rudder” manual flight to automation management. Ultimately, the workload typically
decreases as the pilot moves toward the higher levels of automation, provided the pilot is proficient
in using the automation.
Also, note that the pilot‟s dependency on proficiency shifts as the pilot progresses through
the levels of automation. That is, when the autopilot is not used or not available, the pilot is

May 25, 2010 Version 1.0
29
completely dependent on “stick and rudder” and navigation skills. As the pilot increases the levels
of automation, the pilot becomes less dependent on these manual skills and is more dependent on
the automation. This does mean that the pilot is more dependent on automation proficiency.
Another way to look at this is to consider the loss of pilot proficiency that normally occurs as the
pilot flies less frequently. That is, as pilot proficiency decreases the pilot‟s dependency on the
automation increases, which increases the need for automation proficiency. Pilot proficiency is
vitally important to aviation safety with or without automation; however, in the real world pilot
proficiency varies from time to time; thus, it makes sense to provide the pilot with one more tool to
ensure a safe flight.
Limitations
Note that 87% of the participants were between the ages of 16 to 24 year old and 86% had
fewer than 500 total flight hours. Consequently, we should not assume the participants are
representative of the general aviation pilot population; thus, we should be careful in attempting to
generalize these findings. However, the number of significant findings suggests it is appropriate to
adopt the following recommendations and we should do further research. Nevertheless, participant
population does represent the general pilot population typically involved in pilot training. This is
important because it could be the group where the cultural change can be made that will lead to
improved GA safety.
Finally, the sample size in the pilot performance testing was small; however, significant
differences were found. The differences were consistent with the findings in previous studies
(FITS Effectiveness); therefore, this is an important study.
Recommendations and Best Practices

May 25, 2010 Version 1.0
30
During the FITS effectiveness studies (Ayers, 2005 and Robertson, Petros, Schumacher,
McHorse, & Ulrich, 2006), researchers observed that participants did not use the available
automation. This led the researchers to ask the question “why not?” Attempting to answer this
question led to this study and the search for best practices for automation use. Additionally, the
literature on automation, including aviation automation and non-aviation automation situations,
suggests knowledge, trust, comfort, bias, and choice govern the use of automation. The data
collection instrument in Appendix A obtains data about automation attitude, trust, competency,
techniques, and appropriate level of automation. Ultimately, we must address automation
knowledge, trust, comfort, bias, and choice before automation will be able to use the automation
effectively. Finally, once the pilot is ready to use the automation, how should it be use? That is,
what is an effective way to use the automation? What is the appropriate level of automation? Are
there different levels of appropriate use for different times during the flight? This study attempted
to answer these questions.
Again, during the initial FITS effectiveness studies (Ayers, 2005 and Robertson, et al.,
2006), it was assumed that the participants would use the autopilot to free up the pilot to access the
information provided by the advanced automation. That is, we assumed given the opportunity and
impetus to use the automation the pilots would use it. As mentioned above, the researchers
observed that typically this did not occur, in fact, most participants avoided using the autopilot.
When the participants were asked why they did not use the autopilot, the normal response was that
they did not know they were allow to use it and/or they did really know how to use the autopilot.
The prevailing attitude is to emphasize psychomotor skills in primary pilot training programs and
leave the mastery of the autopilot to a trial and error learning while flying or to the airlines during

May 25, 2010 Version 1.0
31
the line-oriented flight training (LOFT). These observations led to the second training question,
“have you received formal autopilot training?”
Include autopilot training in pilot training and emphasize autopilot training in FITS
accepted training. Teach pilots how to be effective flight managers including how to use the
autopilot to manage the pilot‟s workload is one way to improve general aviation safety. Teach the
pilot that the automation is a tool to improve the pilot‟s management of the flight and safety of
flight. The pilot must become proficient in using all available equipment installed on the airplane.
Glass cockpits increase the complexity of the flight instrument and navigation equipment, thus
increasing the need for information management. That is, so much information is available to the
pilot, in an airplane equipped with a glass cockpit; he/she cannot display it all at the same time.
Consequently, the pilot must choose what information to display and know where to find the other
information. This, in turn, requires the pilot to navigate to the appropriate page to obtain the
necessary/available information. To access the advanced avionics information, typically, the pilot
typically should select an appropriate mode of the autopilot (to be able to free up conscious
memory and maintain precise airplane control). Of course, using an appropriate mode of the
autopilot is not limited to information management and can be effectively used throughout the
flight to control the airplane more precisely.
Based on the results of this study, a panel of experts developed a list of best practices and
answered the question about what should be taught. The panel included Certified Flight Instructors
with total airplane flight hours ranging between less than 1,000 hours and more than 10,000 hours.
The panel maintained that mastering physical flight skills should not be sacrificed during initial
pilot training for automation competency but that pilots need competency in both physical flight
(“stick and rudder”) and automation skills.
May 25, 2010 Version 1.0
32
This study addresses best practices in a normal flight sequence. Accomplish automation
management, like all other tasks the pilot must perform, when the workload permits. Consider a
plan of action for the use of the automation, during the preflight planning phase. The plan of action
should have the flight plan being loaded and stored in the MFD/GPS after engine start and before
takeoff at the latest, and then the flight plan should be updated throughout the flight as changes
occur and workload permits. If the workload does not permit immediate updating, then do it as
soon as practical thereafter. The pilot should consider initiating a delay to permit updating the
flight plan and automation settings if there is no foreseeable or timely opportunity. Such delays are
avoidable when the pilot correctly pre-plans a workflow. Yes, this does sound like the workload
management problem typically discussed in planning a cross-country or instrument flight.
The appropriate mode of the autopilot is often different under varying conditions and
circumstances. That is, the appropriate mode of automation will be different for different
conditions or under circumstances. Again, during the planning phase of flight, the pilot should
determine, when to use and what level of automation to use. This consideration should include
what waypoints to program into the Flight Plan including departure airport, departure procedure,
enroute, arrival procedure, and destination airport. For example, for the enroute waypoints, enter
the NAVAIDS defining the route of flight and intersections along the route of flight in the flight
plan. Why? Because the GPS provides a Great Circle Route course and published routes use a
rhumb line course (p. 3.28, Instrument Procedures Handbook, 2004). The difference between the
two courses is inconsequential when the distance between the waypoints is short. This allows the
GPS to be primary navigation along published routes. Furthermore, intersections provide
convenient entry points along planned routes of flight, if needed. Further discussions are in the
departure phase of flight.
May 25, 2010 Version 1.0
33
The Flight Plan should be loaded whenever electrical power is available to the navigational
equipment. Note; in most cases, the Active Flight Plan is deleted or dumped if the airplane
electrical power is turned off or interrupted. Therefore, store the Flight Plan either after it is loaded
or enter the Flight Plan after the last anticipated power interruption. Nevertheless, it is a best
practice to store the Active Flight Plan after entering. It is also recommended that you should enter
the Flight Plan before takeoff. Circumstances may make it desirable to modify this best practice;
for example, the Air Traffic Control clearance to the destination along a different route than the
one that was planned. When anticipating a different route, ATC advises the pilot to expect a
change to the route of flight, reduce the Flight Plan to the departure airport, initial route of flight,
and the destination airport only. This action clears the Flight Plan of all unwanted entries so that
individual entries do not need to be deleted one at a time and all unintended entries have been
removed. This approach is only usable when time allows the remaining route of flight to be entered
in flight; such as, during legs that are long enough to complete all required/needed duties and still
have time to enter the route; in other words, when the workload permits. Nevertheless, enter
enough of the flight plan to allow easy navigation to the next enroute point, and then enter the
remainder of flight plan when time permits. A word of caution, if the airplane reaches the last entry
on the Flight Plan, the airplane will automatically proceed via a direct course to the destination.
Reestablishing the appropriate/cleared route of flight involves several steps and concentration.
This is poor or mismanagement of the automation; so, avoid this problem by entering the Flight
Plan before takeoff.
Prior to takeoff, the initial heading, cleared altitude, and desired climb rate should be preset
and/or the command bars should be set for takeoff. This provides the pilot with clues/reminders
and it will allow the pilot the option to engage the autopilot as soon as possible after takeoff. It is

May 25, 2010 Version 1.0
34
desirable to have the autopilot fly the airplane in high traffic and high workload areas as much as
possible so the pilot is free to clear for other traffic and attend to other duties. Often the takeoff
clearance will include instruction to takeoff and maintain runway or a specified heading to a lower
than planned altitude. In these cases, the airplane is hand flown through the takeoff to an altitude
where it is safe to turn the autopilot on. A safe altitude for turning the autopilot on will be no lower
than 400‟ AGL, airplane under control and in the proper attitude, and at or above the minimum
altitude for autopilot engagement in a climb (this altitude is either published in the pilot operating
handbook/airplane manual or double the published upset altitude for the specific autopilot). When
the preset items are set, the airplane has reached a safe altitude, and the airplane is under control,
the pilot can engage the autopilot heading, vertical speeds, and altitude select modes.
Now the appropriate mode will depend on departure and/or departure control. Enter and
use new headings and altitudes until cleared to fly a navigated course or the departure procedure
allows a navigation mode. Typically, you need to make heading changes to fly to an assigned
course, to a transition fix, or to join the enroute course. The departure typically presents a
navigation problem because you cannot accurately predict the actual ground track. Most GPS
navigation systems provide a course from the center of the departure airport to a fix, waypoint, or
transition fix. The takeoff normally takes the airplane away from the center of the airport;
consequently, simply selecting the NAV (navigation) mode will cause the airplane to make a hard
turn to intercept the active leg. The pilot must determine an appropriate mode after takeoff to the
en-route course. For example, if the clearance is to join the planned/cleared route, the pilot either
needs to (a) determine a desired intercept heading, set the heading bug, engage the HDG mode of
the autopilot, and then arm the NAV mode or (b) select the appropriate waypoint, select Direct To,
activate the leg, and then select the NAV mode. In the latter case, including intersections along the

May 25, 2010 Version 1.0
35
route of flight provides easy selection of the appropriate waypoint/fix to join the cleared route. In
every case, the pilot must select the appropriate navigation source for the autopilot to follow.
Selecting a navigation source is different for each avionics system. Finally, to use VOR navigation,
the CDI must be set to the desired course before selecting the NAV mode. This step, setting the
CDI to the desired course, is not required when using GPS navigation because the GPS will
automatically set the course. Note you can turn off the GPS function that automatically sets the
course, so ensure this function is set the way you want it to work.
Normally, during the enroute phase of flight, the NAV and ALT (altitude hold) modes are
used. This may lead to complacency. Techniques for avoiding complacency include implementing
a 5P check between waypoints and monitoring the RNAV (area navigation) system by cross
checking the progress of the flight. The GPS is an RNAV system, so the pilot should monitor the
flight‟s progress when using the GPS too. Several techniques can be used to monitor the airplane‟s
position including (a) doing cross checks of the bearing and distance information provided by the
navigation log and the avionics (Flight Plan) (b) at each waypoint or fix along the route of flight
check that the bearing and distance information agree with the navigation log. Additionally, for
legs that are 30-minutes or longer, do a mid-point accuracy check. An accuracy check is
comparing the airplane‟s position as shown on a moving map or RNAV to the ground (visually) or
a ground-based navigational aid, such as a VOR.
Typically, the pilot does not know which runway will be the active until he/she is close to
the destination; therefore, the approach is not selected and loaded during the pre-takeoff phase of
flight. Select and load the appropriate instrument approach during a period when the workload
permits. Often this is after the weather at the airport of intended landing is checked but it should be
before starting the descent checklist and descent.

May 25, 2010 Version 1.0
36
The approach procedure should not be activated until cleared for the approach by ATC or
when it is determined to be appropriate because activating the approach typically changes the
active leg to a direct course to the selected IAF (initial approach fix). In other words, it sets the
active flight plan to a direct course from the airplane‟s present position to the IAF and deletes all
waypoints/fixes between the airplane‟s present position and the IAF. Consequently, the approach
should not be activated until the pilot wants to proceed directly to the IAF or in the case where
vectoring is to be provided, the approach can be activated as soon as vectoring begins and the
HDG mode has been selected.
Next, we will address three additional situations. These situations are adding a departure,
an arrival, and/or an instrument approach procedure to the flight plan. Typically, these procedures
are appended to the of the Active Flight Plan like the instrument approach procedure and may not
automatically provide the correct sequence of waypoint for the intended or desired route of flight.
That is, normally you should enter the flight plan by entering the departure airport first followed by
the route of flight to the destination airport. Adding a departure, arrival, or instrument approach
later, appends the procedure to the end of the Active Flight Plan. That is, added after the
destination airport identifier. This often changes your route of flight. The departure procedure
should follow the departure airport and take the airplane to a transition fix where the enroute
portion begins. Clear the intervening waypoints if they exist or select and activate the appropriate
leg. Similarly, clear or skip intervening waypoints when entering an arrival or an instrument
approach procedure. For the instrument approach, do this by activating the approach. Remember
that the Active Flight Plan changes to “Direct To” routing when activated and skips all intervening
waypoints. The Garmin 430 does not provide an “Activate” the Arrival Procedure option. In this

May 25, 2010 Version 1.0
37
case, the pilot must manually activate the appropriate leg or clear the intervening waypoint in the
Flight Plan.
The appropriate level of automation for these three situations will depend on the how much
time the pilot has to program and activate these procedures. For example, if ATC issues a change
to the clearance that requires a turn away from the entered flight plan course, the HDG mode will
most likely be need to be selected with the heading bug being set for a turn in the proper direction
and then refined as the correct heading is determined, this assumes insufficient time is available to
select and activate the procedure before the turn is needed. Once the procedure is loaded and
activated, you can reset the autopilot to the NAV or APP mode as desired. Remember to check the
flight plan page (FLP) to ensure that the proper leg is active and the proper waypoints are in the
flight plan.
In summary, best practices for cross-country and instrument flights include planning to use
the automation. Using the automation effectively involves planning a workload flow for using the
automation, planning a route of flight with adequate waypoint to accomplish the desired route,
load and save the flight plan, engage the autopilot when able and it is safe to do so, use full
automation when possible. When there is insufficient time to program the automation, use lower
levels of automation, such as HDG and ALT mode or autopilot off, and return to the highest level
of automation practical when it is safe.
The recommendation to use the automation should not be taken to mean that the pilot can
allow his/her “stick and rudder” skills to diminish. Pilots must determine how to maintain their
pilot proficiency and how to effectively control of the airplane on each flight. The pilot‟s
proficiency in controlling the airplane by hand and his proficiency using the automation are
important considerations in the “go no-go” decision. The pilot should always be mindful that the

May 25, 2010 Version 1.0
38
automation may fail and the pilot will be very dependent on his/her pilot skills. The automation
should be an additional tool available to enhance aviation safety not a substitution for pilot skills.
Many safety initiatives have recognized that situational awareness and a good decision
process are necessary to prevent accidents. FITS has suggested that the mental skills supporting the
decision process must also be enhanced (Robertson, Petros, Schumacher, McHorse, Ulrich, 2006).
That is, pilots need better thinking skills. Advanced automation can provide the pilot with better
and more current information but the pilot must be able to access and process this information.
This leads to shifting the pilot‟s role from its psychomotor skills focus to becoming a flight
manager. The flight manager is a pilot that masters his/her piloting and management skills. The
effective flight manager is the pilot that relegated the routine manual manipulation of the airplane
to the autopilot so the pilot can constantly assess the flight situation, access and gather the
appropriate information, and make better decisions. Unfortunately, the old system was not working
as, 80% of the general aviation accidents were due to pilot error or had a pilot error-contributing
factor. Effective use of the automation and better thinking skills are part of the solution (p. 8-14,
Aviation Instructor‟s Handbook, 2008). This study used the term pilot error because it more clearly
identifies the underlying problem than the currently accepted term human factor. Arguable, human
factors more accurately identifies that it is not a single bad decision but rather a series of errors that
lead to an accident. Nevertheless, effective flight management allows the pilot the opportunity to
assess, detect, and correct the error chain; thus, preventing the accident.

May 25, 2010 Version 1.0
39
Appendix A
FITS Automation Data Collection
Instrument
Questions 1 through 33 must be answered to complete the
questionnaire.
Demographic Data - is needed to determine if
there are age, experience, etc. differences in
attitude, trust, and competency.
1. Sex: Male Female
2. Age: 16-24 25-34 35-44 45-60 Over 60
3. Current flying experience (hours): 0 to
200
200 to
500
500 to
1000
1000
to
1500
1500
to
2500
over
2500
4. Certificates held: Prvt Comm CFI ATP CFI/ATP
5. Primary type of flying: Personal Corp/Bus Comm Airline
6. One or more of the aircraft I fly is equipped
with at lease a moving map and an autopilot: Yes No
7. Have you received FITS accepted training
(Yes, No, IP[in progress], or NS [not sure or do
not know]):
Yes No IP NS
8. I have received formal training in the use of
the automation including the autopilot in one or
more aircraft:
Yes No

May 25, 2010 Version 1.0
40
9. Is one or more of the aircraft you fly
equipped with a PFD, MFD, or Both (No, PFD,
MFD, Both, or NS [not sure or do not know]):
No PFD MFD Both NS
10. Is one or more of the aircraft you fly
equipped with an autopilot and an RNAV (Yes,
No, or NS [not sure or do not know]):
Yes No NS
Automation Attitude - indicate your level of
agreement with the following statements
regarding your attitude about aircraft
automation including the autopilot.
N/A Strongly
Agree Agree Neutral Disagree
Strongly
Disagree
11. Obtaining and maintaining “stick and rudder
skills” is paramount, automated flight (using the
autopilot) should not be attempted until the
pilot‟s stick and rudder skills are competent and
proficient.
12. Automation should be reduced “one-level”
if the pilot is unsure about what the automation
is doing. (click here for an explanation of “one-
level” of automation)
13. Automation should only be used during an
extended en-route phase and during a precision
instrument approach.
14. Automation is not a good workload
management tool because it increases the
mental workload imposed on the pilot during
critical phases of flight.
15. The status of the automation including the
autopilot is an important consideration in the
risk management (go – no go) decision.
Automation Trust – indicate your level of
agreement with the following statements
regarding your trust in aircraft automation.
N/A Strongly
Agree Agree Neutral Disagree
Strongly
Disagree
16. I trust the automation will accurately and
precisely control the airplane during all phases
of flight; except takeoff, initial climb-out, short
final, and landing.

May 25, 2010 Version 1.0
41
17. I feel the automation including the autopilot
can be like having another pilot in the aircraft.
18. I know how to update the navigation
program (flight plan) to comply with ATC
instruction, in-flight situations, and other
desired changes to the route of flight.
19. I turn off the automation if the flight plan
changes in-flight rather than reprogramming the
RNAV/GPS.
Automation Competency – indicate your
level of agreement with the following
statements regarding your competency in
using the installed aircraft automation.
N/A Strongly
Agree Agree Neutral Disagree
Strongly
Disagree
20. I know how to use all of the functions of the
navigation and automation equipment installed
in the airplane I fly.
21. I am proficient using the basic functions of
the autopilot and navigation equipment.
22. I am proficient using the advanced functions
of the autopilot and navigation equipment.
23. I do not encounter “automation surprise”
when I am using the automation.
24. I know effective techniques to counter
complacency.
Automation Techniques – indicate your level
of agreement with the following statements
regarding your use of these techniques.
N/A Strongly
Agree Agree Neutral Disagree
Strongly
Disagree
25. Before activating a GPS/RNAV flight plan,
the flight plan information should be compared
to the NAV log and discrepancies are resolved.
26. Approaching a waypoint, the direction of
turn and the roll out heading should be reviewed
to monitor the automated tracking.
27. At the waypoint, the course, distance, and
time to the next waypoint should be cross-
checked against the NAV log.
28. Between waypoints, the aircraft position
should be verified by checking the distance and
radial from an off-track NAV aid.
29. When visibility permits, the aircraft position
should be verified by checking the visual

May 25, 2010 Version 1.0
42
position against the moving map position.
Appropriate Levels of Automation – indicate
your level of agreement with the following
statements regarding the appropriate level of
aircraft automation.
N/A Strongly
Agree Agree Neutral Disagree
Strongly
Disagree
30. The HDG and ALT modes of the autopilot
should not be selected until established on a
programmed leg of the flight.
31. Select the HDG and ALT SEL/HLD (VNA)
modes of the autopilot as soon after takeoff as
legally permissible and then selecting the
NAV/GPSS mode as soon as course guidance is
available.
32. User defined waypoint should be
programmed so the NAV/GPSS and ALT
SEL/HLD (VNAV) modes can be used during
all phases of flight from initial climb to the DH
or MDA.
33. The autopilot and command bars should be
turned off for all traffic pattern and visual work.
The following space is for additional comments, please provide any additional information
you feel will help us improve aircraft automation/autopilot training. Note: additional
comments are not necessary to complete the questionnaire.
Skip this section
Please describe the type of aircraft automation/autopilot training you have received.
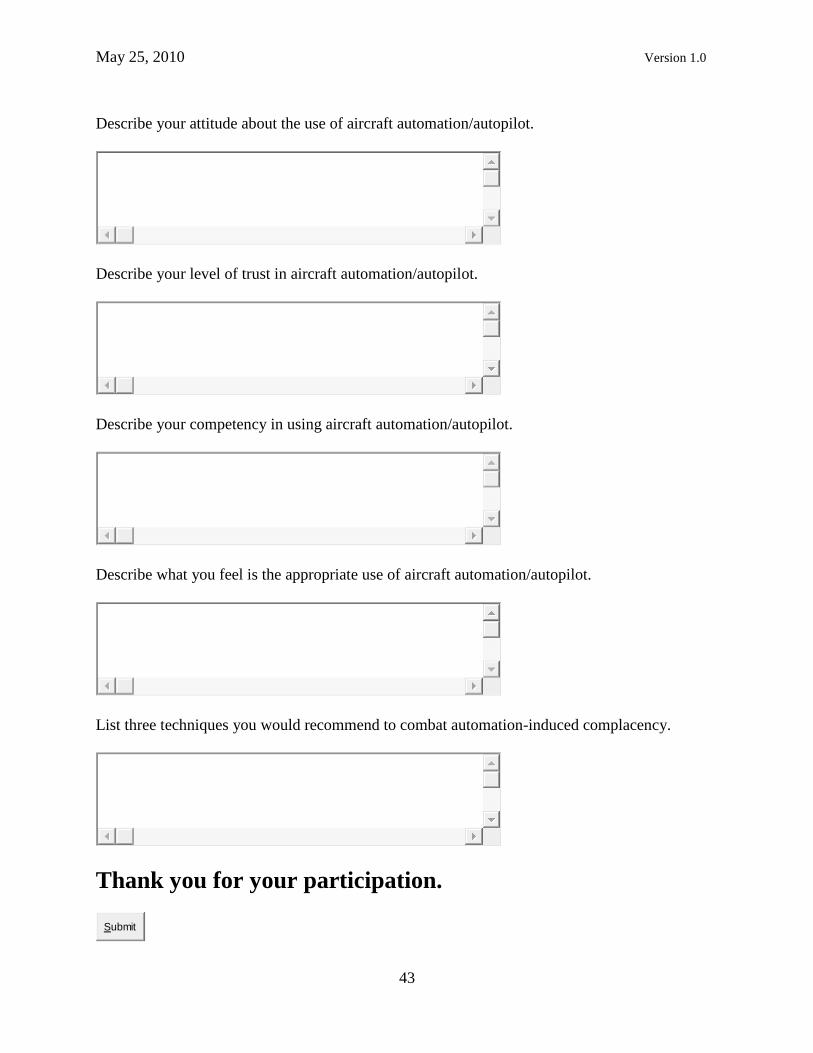
May 25, 2010 Version 1.0
43
Describe your attitude about the use of aircraft automation/autopilot.
Describe your level of trust in aircraft automation/autopilot.
Describe your competency in using aircraft automation/autopilot.
Describe what you feel is the appropriate use of aircraft automation/autopilot.
List three techniques you would recommend to combat automation-induced complacency.
Thank you for your participation.
Submit

May 25, 2010 Version 1.0
44
Appendix B
Analysis of FITS Verses Non-FITS
Tables 16 through 25 show the results of analyses of each question asked on the data
collection instrument. The questions are divided into five groups of related questions. These
groups are automation attitude, trust, competency, and techniques, and appropriate level of
automation. Two tables provide the results of each group of questions. The participant group
statistics including the group size and mean are presented before the associated independent
samples test (t-test). The mean scores of the groups (FITS verses Non-FITS trained) are in the
group statistics table while results of the test of significant differences between the groups are in
the independent samples test table.
Table 16 shows the group statistics for FITS verses Non-FITS trained participants for the
five automation attitude questions (see the questions in Appendix A).
Table 16. FITS Verses Non-FITS Group Statistics for Automation Attitude Variables
FITS Training N Mean Std. Deviation Std. Error
Mean
Attitude 11 Yes 44 4.20 1.193 .180
No 60 4.53 .812 .105
Attitude 12 Yes 44 3.80 1.047 .158
No 60 4.03 .956 .123
Attitude 13 Yes 44 2.77 1.179 .178
No 60 3.37 1.235 .159
Attitude 14 Yes 44 2.09 .960 .145
No 59 2.24 .897 .117
Attitude 15 Yes 44 3.61 1.039 .157
No 60 3.57 1.198 .155
Table 17 shows the independent samples test for FITS verses Non-FITS trained
participants for the automation attitude group of questions. Question 11 shows a significant
finding (Sig = .017) on the Levene‟s test for equality of variances. This means we must use the
equal variances not assumed results for the t-test. In this case, t = -1.580, df = 71.228, Sig. (2-
tailed) = .098, etc. must be used and there is no significant difference between the mean scores of

May 25, 2010 Version 1.0
45
the FITS/Non-FITS groups (FITS mean score = 4.20 and Non-FITS = 4.53 (see Table 16)).
Question 13, on the other hand, shows that there is a significant difference (t = -2.470, df = 102,
Sig (2-tailed) = .015 (see Table 14)) between the mean scores for the FITS and Non-FITS groups
(mean = 2.77/3.37 (see Table 16)). Question 13 (see Appendix A), asks for the participant
agreement or disagreement with the statement “Automation should only be used during an
extended en-route phase and during a precision instrument approach.” There were significant
differences in the mean scores of the participant‟s responses; that is, the FITS trained participants
disagreed with the statement while the Non-FITS participants agreed with the statement. None of
the other automation attitude questions showed significant differences between the group means.
Table 17. Independent Samples of FITS verses Non-FITS for Automation Attitude Variables
Levene's Test for
Equality of Variances t-test for Equality of Means
F Sig. T df Sig.
(2-tailed) Mean
Difference Std. Error Difference
95% Confidence Interval of the Difference
Upper Lower
Attitude 11 Equal variances assumed 5.868 .017 -1.672 102 .098 -.329 .197 -.719 .061
Equal variances not assumed -1.580 71.228 .119 -.329 .208 -.744 .086
Attitude 12 Equal variances assumed .820 .367 -1.204 102 .231 -.238 .198 -.630 .154
Equal variances not assumed -1.187 87.741 .238 -.238 .200 -.636 .160
Attitude 13 Equal variances assumed .396 .531 -2.470 102 .015 -.594 .240 -1.071 -.117
Equal variances not assumed -2.488 95.147 .015 -.594 .239 -1.068 -.120
Attitude 14 Equal variances assumed .008 .931 -.795 101 .429 -.146 .184 -.512 .219
Equal variances not assumed -.787 89.192 .433 -.146 .186 -.516 .223
Attitude 15 Equal variances assumed .306 .582 .209 102 .835 .047 .225 -.399 .493
Equal variances not assumed .213 99.087 .832 .047 .220 -.390 .484
Note. Statistical significance is < .05.

May 25, 2010 Version 1.0
46
Table 18 shows the group statistics for the participants that received FITS (Yes) verses
those that did not receive FITS training (No) for the four automation trust questions. The
question number and training group are in the first column; n (group size) is in the second
column, group mean in the third column, standard deviation in the fourth column, and standard
error of mean in the last column.
Table 18. FITS Verses No FITS Group Statistics for Automation Trust Variables
FITS Training N Mean Std. Deviation Std. Error Mean
Trust 16 Yes 44 3.84 1.055 .159
No 60 3.73 1.006 .130
Trust 17 Yes 44 3.32 1.157 .174
No 60 3.33 1.188 .153
Trust 18 Yes 44 4.16 1.033 .156
No 60 3.52 1.372 .177
Trust 19 Yes 44 2.05 1.140 .172
No 60 2.25 1.480 .191
Table 19. Independent Samples of FITS verses Non-FITS for Automation Trust Variables
Levene's Test for
Equality of Variances t-test for Equality of Means
F Sig. T df Sig.
(2-tailed) Mean
Difference Std. Error Difference
95% Confidence Interval of the
Difference
Upper Lower
Trust 16 Equal variances assumed .085 .771 .528 102 .599 .108 .204 -.297 .512
Equal variances not assumed .524 90.221 .602 .108 .205 -.300 .516
Trust 17 Equal variances assumed .131 .718 -.065 102 .948 -.015 .233 -.478 .448
Equal variances not assumed -.065 94.196 .948 -.015 .232 -.476 .446
Trust 18 Equal variances assumed 3.365 .069 2.610 102 .010 .642 .246 .154 1.131
Equal variances not assumed 2.724 101.911 .008 .642 .236 .175 1.110
Trust 19 Equal variances assumed 7.810 .006 -.765 102 .446 -.205 .267 -.735 .326
Equal variances not assumed -.796 101.723 .428 -.205 .257 -.714 .305
Note. Statistical significance is < .05.

May 25, 2010 Version 1.0
47
Table 19 shows the independent samples test for FITS verses Non-FITS training for the
automation trust questions. Again, this table only shows one question (Trust 18) has a significant
difference between the means on the t-test for equality of means. In this case, the Levene‟s test
for equality of variances is not significant; therefore, assume and use equal variances. The
automation trust, question number 18, shows the means (FITS = 4.16, Non-FITS = 3.52 (see
Table 19)) and the t-test results (t = 2.610, DF = 102, Sig (2-tailed) = .010 (see Table 19))
indicating a significantly stronger agreement with the statement for the FITS trained participants.
Table 20. FITS Verses No FITS Group Statistics for Automation Competency Variables
FITS Training N Mean Std. Deviation Std. Error
Mean
Competency 20 Yes 44 3.98 1.000 .151
No 60 3.08 1.225 .158
Competency 21 Yes 44 4.41 .923 .139
No 57 3.23 1.669 .221
Competency 22 Yes 44 3.89 1.146 .173
No 60 2.60 1.498 .193
Competency 23 Yes 44 3.16 1.684 .254
No 60 2.88 1.508 .195
Competency 24 Yes 43 3.93 1.009 .154
No 60 3.27 1.205 .156
Table 20 shows the group statistics for FITS verses Non-FITS training for the five
automation competency questions. Table 21 shows that four of the five automation competency
questions (questions 20, 21, 22, and 24) had statistically significant differences between the FITS
and Non-FITS trained groups (Sig (2-tailed) = .000, .000, .000. and .004, respectively).
The Levene‟s test for equality of variances is significant for question 21 and 22 (Sig =
.000 and .012, respectively); thus, equal variances cannot be assumed (see Table 21). Therefore,
the equal variances not assumed results for questions 21 and 22 are used (t = 4.521, df = 90.632,
Sig (2-tailed) = .000 and t = 4.961, df = 101.796, Sig (2-tailed) = .000, respectively). All five
questions show a stronger agreement with the statement (FITS/Non-FITS means = 3.98/3.08,
4.41/3.23, 3.89/2.60, 3.16/2.88, and 3.93/3.27, respectively). However, the difference in means

May 25, 2010 Version 1.0
48
between groups was not significant for question 23. Therefore, we will not consider the findings
on automation competency (question 23) further.
Table 21. Independent Samples of FITS verses Non-FITS for Automation Competency
Levene's Test for Equality of
Variances t-test for Equality of Means
F Sig. T df Sig.
(2-tailed) Mean
Difference Std. Error Difference
95% Confidence Interval of the
Difference
Upper Lower
Competency 20 Equal variances assumed 1.963 .164 3.966 102 .000 .894 .225 .447 1.341
Equal variances not assumed 4.091 100.783 .000 .894 .218 .460 1.327
Competency 21 Equal variances assumed 20.204 .000 4.219 99 .000 1.181 .280 .626 1.737
Equal variances not assumed 4.521 90.632 .000 1.181 .261 .662 1.700
Competency 22 Equal variances assumed 6.587 .012 4.763 102 .000 1.286 .270 .751 1.822
Equal variances not assumed 4.961 101.796 .000 1.286 .259 .772 1.801
Competency 23 Equal variances assumed 2.248 .137 .877 102 .383 .276 .314 -.348 .900
Equal variances not assumed .862 86.630 .391 .276 .320 -.360 .912
Competency 24 Equal variances assumed 1.719 .193 2.944 101 .004 .664 .225 .216 1.111
Equal variances not assumed 3.032 98.490 .003 .664 .219 .229 1.098
Note. Statistical significance is < .05.
Table 22. FITS Verses No FITS Group Statistics for Automation Techniques Variables
FITS Training N Mean Std. Deviation Std. Error
Mean
Techniques 25 Yes 44 4.16 .834 .126
No 59 4.02 1.008 .131
Techniques 26 Yes 44 4.30 .701 .106
No 59 4.19 .798 .104
Techniques 27 Yes 44 4.32 .674 .102
No 59 4.10 .959 .125
Techniques 28 Yes 44 4.05 .939 .142
No 59 3.59 1.036 .135
Techniques 29 Yes 44 4.30 .765 .115
No 59 3.92 .934 .122

May 25, 2010 Version 1.0
49
Table 22 shows the group statistics for FITS verses Non-FITS training for the five
automation techniques questions. Table 23 shows the t-test results (independent sample) for the
FITS/Non-FITS automation techniques questions and shows questions 28 and 29 had significant
differences (Sig (2-tailed) = .025 and .030, respectively (see Table 23)). The means were
4.05/3.59 and 4.30/3.92, respectively (see Table 22). Table 23 also shows the automation
techniques questions 28 and 29 had significant differences (Sig (2-tailed) = .025 and .030,
respectively) with mean equal to 4.05/3.59 and 4.30/3.92, respectively (see Table 22).
Table 23. Independent Samples of FITS verses Non-FITS for Automation Techniques
Levene's Test for Equality of Variances t-test for Equality of Means
F Sig. t Df Sig.
(2-tailed) Mean
Difference Std. Error Difference
95% Confidence Interval of the
Difference
Upper Lower
Techniques 25 Equal variances assumed .154 .696 .761 101 .449 .142 .187 -.229 .513
Equal variances not assumed .782 99.876 .436 .142 .182 -.218 .503
Techniques 26 Equal variances assumed .563 .455 .722 101 .472 .109 .151 -.191 .409
Equal variances not assumed .735 98.230 .464 .109 .148 -.185 .403
Techniques 27 Equal variances assumed .029 .865 1.279 101 .204 .216 .169 -.119 .552
Equal variances not assumed 1.344 100.691 .182 .216 .161 -.103 .536
Techniques 28 Equal variances assumed 2.460 .120 2.280 101 .025 .452 .198 .059 .846
Equal variances not assumed 2.313 97.149 .023 .452 .196 .064 .840
Techniques 29 Equal variances assumed .081 .777 2.204 101 .030 .380 .172 .038 .722
Equal variances not assumed 2.269 100.062 .025 .380 .168 .048 .713
Note. Statistical significance is < .05.
Table 24 shows the group statistics for FITS verses No FITS training for the four
appropriate level of automation. Table 25 shows one significant result, question 30, for the FITS
verses Non-FITS trained pilots (Sig (2-tailed) = .004). Table 24 shows the mean = 2.55/3.24 for
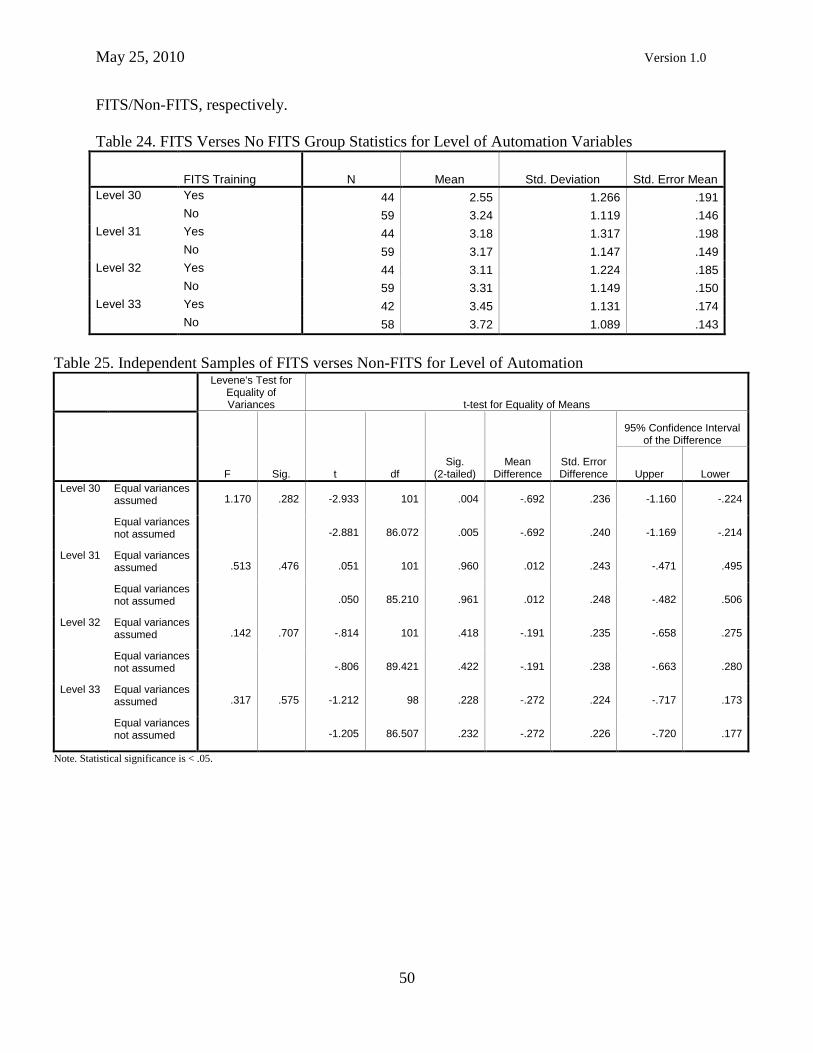
May 25, 2010 Version 1.0
50
FITS/Non-FITS, respectively.
Table 24. FITS Verses No FITS Group Statistics for Level of Automation Variables
FITS Training N Mean Std. Deviation Std. Error Mean
Level 30 Yes 44 2.55 1.266 .191
No 59 3.24 1.119 .146
Level 31 Yes 44 3.18 1.317 .198
No 59 3.17 1.147 .149
Level 32 Yes 44 3.11 1.224 .185
No 59 3.31 1.149 .150
Level 33 Yes 42 3.45 1.131 .174
No 58 3.72 1.089 .143
Table 25. Independent Samples of FITS verses Non-FITS for Level of Automation
Levene's Test for Equality of Variances t-test for Equality of Means
F Sig. t df Sig.
(2-tailed) Mean
Difference Std. Error Difference
95% Confidence Interval of the Difference
Upper Lower
Level 30 Equal variances assumed 1.170 .282 -2.933 101 .004 -.692 .236 -1.160 -.224
Equal variances not assumed -2.881 86.072 .005 -.692 .240 -1.169 -.214
Level 31 Equal variances assumed .513 .476 .051 101 .960 .012 .243 -.471 .495
Equal variances not assumed .050 85.210 .961 .012 .248 -.482 .506
Level 32 Equal variances assumed .142 .707 -.814 101 .418 -.191 .235 -.658 .275
Equal variances not assumed -.806 89.421 .422 -.191 .238 -.663 .280
Level 33 Equal variances assumed .317 .575 -1.212 98 .228 -.272 .224 -.717 .173
Equal variances not assumed -1.205 86.507 .232 -.272 .226 -.720 .177
Note. Statistical significance is < .05.

May 25, 2010 Version 1.0
51
Appendix C
Analysis of Formal Autopilot Training
The results of the analysis of the pilot receiving and not receiving formal autopilot
training are in this appendix. Group statistics and independent samples test (t-test) for each of the
questions follows. The presentation of the results will follow the format used in Appendix B; that
is, the t-test analysis will follow the group statistics and includes tables 26 through 37.
Table 26 shows the group statistics for formal autopilot trained verses no formal autopilot
training for the five automation attitude questions. Table 27 shows the results of the independent
sample (t-test) analysis of the formal autopilot training for automation attitude variables. One
question showed a significant difference in the group mean, question 15. The Levene‟s test for
equality of variances was significant (Sig = .000); consequently, the equal variance cannot be
assumed and the not equal significance must be used. These results showed t = 2.106, df =
127.910, and Sig (2-tailed) = .037, with the mean = 3.62/3.24 for the autopilot trained verses no
autopilot training, respectively.
Table 26. Group Statistics for Automation Attitude in Formal Autopilot Trained
A/P Training N Mean Std. Deviation Std. Error Mean
Attitude 11 Yes 87 4.47 .900 .097
No 80 4.21 1.240 .139
Attitude 12 Yes 87 4.01 .883 .095
No 80 3.80 1.152 .129
Attitude 13 Yes 87 2.94 1.195 .128
No 80 3.19 1.323 .148
Attitude 14 Yes 86 2.21 .959 .103
No 70 2.37 1.119 .134
Attitude 15 Yes 87 3.62 .852 .091
No 80 3.24 1.407 .157
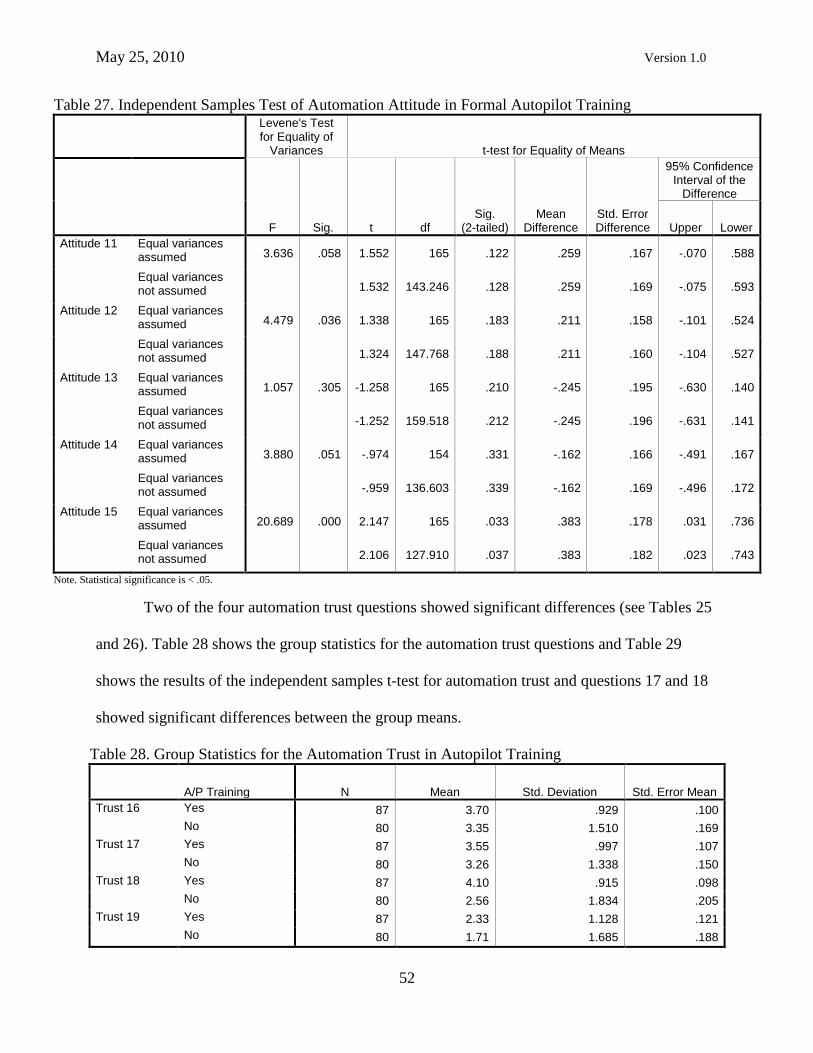
May 25, 2010 Version 1.0
52
Table 27. Independent Samples Test of Automation Attitude in Formal Autopilot Training
Levene's Test for Equality of
Variances t-test for Equality of Means
F Sig. t df Sig.
(2-tailed) Mean
Difference Std. Error Difference
95% Confidence Interval of the
Difference
Upper Lower
Attitude 11 Equal variances assumed 3.636 .058 1.552 165 .122 .259 .167 -.070 .588
Equal variances not assumed 1.532 143.246 .128 .259 .169 -.075 .593
Attitude 12 Equal variances assumed 4.479 .036 1.338 165 .183 .211 .158 -.101 .524
Equal variances not assumed 1.324 147.768 .188 .211 .160 -.104 .527
Attitude 13 Equal variances assumed 1.057 .305 -1.258 165 .210 -.245 .195 -.630 .140
Equal variances not assumed -1.252 159.518 .212 -.245 .196 -.631 .141
Attitude 14 Equal variances assumed 3.880 .051 -.974 154 .331 -.162 .166 -.491 .167
Equal variances not assumed -.959 136.603 .339 -.162 .169 -.496 .172
Attitude 15 Equal variances assumed 20.689 .000 2.147 165 .033 .383 .178 .031 .736
Equal variances not assumed 2.106 127.910 .037 .383 .182 .023 .743
Note. Statistical significance is < .05.
Two of the four automation trust questions showed significant differences (see Tables 25
and 26). Table 28 shows the group statistics for the automation trust questions and Table 29
shows the results of the independent samples t-test for automation trust and questions 17 and 18
showed significant differences between the group means.
Table 28. Group Statistics for the Automation Trust in Autopilot Training
A/P Training N Mean Std. Deviation Std. Error Mean
Trust 16 Yes 87 3.70 .929 .100
No 80 3.35 1.510 .169
Trust 17 Yes 87 3.55 .997 .107
No 80 3.26 1.338 .150
Trust 18 Yes 87 4.10 .915 .098
No 80 2.56 1.834 .205
Trust 19 Yes 87 2.33 1.128 .121
No 80 1.71 1.685 .188

May 25, 2010 Version 1.0
53
Table 29 also shows significant on the Levene‟s test for equality of variances for all four
questions (Sig = .000, .015, .000, and .000, respectively); however, only questions 18 and 19
show a significant mean difference in the t-test results (Sig (2-tailed) = .000 and .005,
respectively). Thus, worthy of further consideration. Since Levene‟s test is significance, the
equal variances not assumed results must be used for question 18 and 19 (t = 6.779, 113.859, Sig
(2-tailed) = .000 and t = 2.773, 136.216, Sig (2-tailed) = .006, respectively (see Table 29)).
Table 29. Independent Samples Test for Automation Trust in Formal Autopilot Training
Levene's Test for Equality of
Variances t-test for Equality of Means
F Sig. T df Sig.
(2-tailed) Mean
Difference Std. Error Difference
95% Confidence Interval of the
Difference
Upper Lower
Trust 16 Equal variances assumed 23.661 .000 1.826 165 .070 .351 .192 -.029 .731
Equal variances not assumed 1.791 129.175 .076 .351 .196 -.037 .739
Trust 17 Equal variances assumed 5.995 .015 1.592 165 .113 .289 .182 -.070 .648
Equal variances not assumed 1.573 145.435 .118 .289 .184 -.074 .653
Trust 18 Equal variances assumed 69.198 .000 6.953 165 .000 1.541 .222 1.103 1.979
Equal variances not assumed 6.779 113.859 .000 1.541 .227 1.091 1.991
Trust 19 Equal variances assumed 40.497 .000 2.818 165 .005 .621 .220 .186 1.056
Equal variances not assumed 2.773 136.216 .006 .621 .224 .178 1.064
Note. Statistical significance is < .05.
The results of the analysis of the automation competency for formal autopilot training
verses no formal autopilot training are in Tables 30 and 31. The results of all five of automation
competency questions are significant (Sig (2-tailed) = .000) (see Table 31). The mean scores are
shown in Table 32 (mean = 3.78/2.24, 4.22/2.20, 3.67/1.80, 3.48/1.75, and 3.90/2.16,
respectively).

May 25, 2010 Version 1.0
54
Table 30. Group Statistics for Automation Competency for Formal Autopilot Training
A/P Training N Mean Std. Deviation Std. Error
Mean
Competency 20 1 87 3.78 .933 .100
2 80 2.24 1.701 .190
Competency 21 1 87 4.22 .945 .101
2 76 2.20 1.898 .218
Competency 22 1 87 3.67 1.031 .110
2 79 1.80 1.659 .187
Competency 23 1 86 3.48 1.114 .120
2 80 1.75 1.775 .198
Competency 24 1 86 3.90 .783 .084
2 80 2.16 1.732 .194
Table 31. Independent Samples Test of Automation Competency in Formal Autopilot Training
Levene's Test for Equality of
Variances t-test for Equality of Means
F Sig. t df Sig.
(2-tailed) Mean
Difference Std. Error Difference
95% Confidence Interval of the
Difference
Upper Lower
Competency 20 Equal variances assumed 39.860 .000 7.352 165 .000 1.544 .210 1.129 1.959
Equal variances not assumed 7.187 120.308 .000 1.544 .215 1.119 1.969
Competency 21 Equal variances assumed 85.772 .000 8.769 161 .000 2.021 .230 1.566 2.476
Equal variances not assumed 8.418 106.674 .000 2.021 .240 1.545 2.497
Competency 22 Equal variances assumed 29.373 .000 8.804 164 .000 1.869 .212 1.450 2.288
Equal variances not assumed 8.617 127.970 .000 1.869 .217 1.440 2.298
Competency 23 Equal variances assumed 70.791 .000 7.562 164 .000 1.727 .228 1.276 2.178
Equal variances not assumed 7.443 131.107 .000 1.727 .232 1.268 2.186
Competency 24 Equal variances assumed 94.102 .000 8.405 164 .000 1.733 .206 1.326 2.140
Equal variances not assumed 8.205 108.240 .000 1.733 .211 1.314 2.151
Note. Statistical significance is < .05.
Table 31 shows Levene‟s tests were significances for all five questions as well. Thus, we
must use the equal variances not assumed results. These results are t = 7.187, df = 120.308, Sig
(2-tailed) = .000; t = 8.418, df = 106.674, Sig (2-tailed) = .000; t = 8.617, df = 127.970, Sig (2-
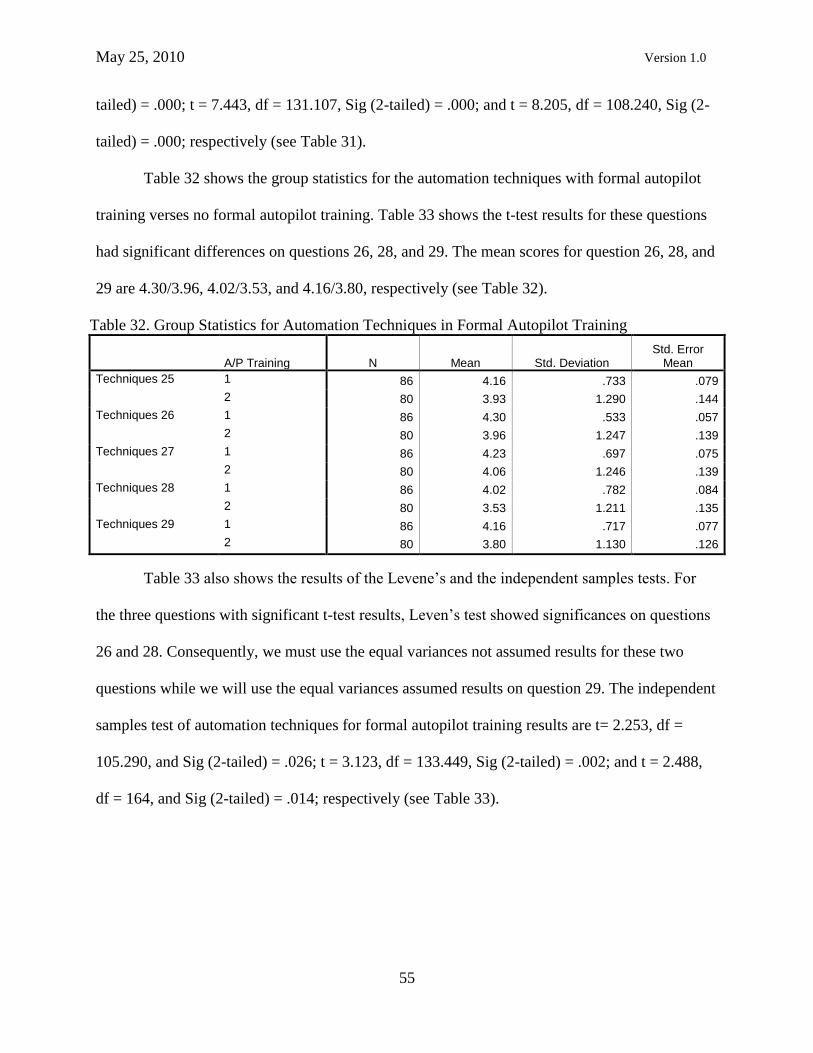
May 25, 2010 Version 1.0
55
tailed) = .000; t = 7.443, df = 131.107, Sig (2-tailed) = .000; and t = 8.205, df = 108.240, Sig (2-
tailed) = .000; respectively (see Table 31).
Table 32 shows the group statistics for the automation techniques with formal autopilot
training verses no formal autopilot training. Table 33 shows the t-test results for these questions
had significant differences on questions 26, 28, and 29. The mean scores for question 26, 28, and
29 are 4.30/3.96, 4.02/3.53, and 4.16/3.80, respectively (see Table 32).
Table 32. Group Statistics for Automation Techniques in Formal Autopilot Training
A/P Training N Mean Std. Deviation Std. Error
Mean
Techniques 25 1 86 4.16 .733 .079
2 80 3.93 1.290 .144
Techniques 26 1 86 4.30 .533 .057
2 80 3.96 1.247 .139
Techniques 27 1 86 4.23 .697 .075
2 80 4.06 1.246 .139
Techniques 28 1 86 4.02 .782 .084
2 80 3.53 1.211 .135
Techniques 29 1 86 4.16 .717 .077
2 80 3.80 1.130 .126
Table 33 also shows the results of the Levene‟s and the independent samples tests. For
the three questions with significant t-test results, Leven‟s test showed significances on questions
26 and 28. Consequently, we must use the equal variances not assumed results for these two
questions while we will use the equal variances assumed results on question 29. The independent
samples test of automation techniques for formal autopilot training results are t= 2.253, df =
105.290, and Sig (2-tailed) = .026; t = 3.123, df = 133.449, Sig (2-tailed) = .002; and t = 2.488,
df = 164, and Sig (2-tailed) = .014; respectively (see Table 33).

May 25, 2010 Version 1.0
56
Table 33. Independent Samples Test of Automation Techniques for Formal Autopilot Training
Levene's Test for Equality of
Variances t-test for Equality of Means
F Sig. t df Sig.
(2-tailed) Mean
Difference Std. Error Difference
95% Confidence
Interval of the Difference
Upper Lower
Techniques 25 Equal variances assumed 6.884 .010 1.472 164 .143 .238 .161 -.081 .557
Equal variances not assumed 1.445 123.266 .151 .238 .165 -.088 .563
Techniques 26 Equal variances assumed 7.075 .009 2.311 164 .022 .340 .147 .049 .630
Equal variances not assumed 2.253 105.290 .026 .340 .151 .041 .639
Techniques 27 Equal variances assumed 4.207 .042 1.095 164 .275 .170 .155 -.137 .477
Equal variances not assumed 1.074 122.110 .285 .170 .158 -.143 .483
Techniques 28 Equal variances assumed 17.973 .000 3.170 164 .002 .498 .157 .188 .809
Equal variances not assumed 3.123 133.449 .002 .498 .160 .183 .814
Techniques 29 Equal variances assumed 3.841 .052 2.488 164 .014 .363 .146 .075 .651
Equal variances not assumed 2.450 132.095 .016 .363 .148 .070 .656
Note. Statistical significance is < .05.
Table 34. Group Statistics for Level of Automation in Formal Autopilot Training
A/P Training N Mean Std. Deviation Std. Error Mean
Level 30 1 86 2.65 1.060 .114
2 80 2.91 1.434 .160
Level 31 1 86 3.23 .978 .105
2 80 2.79 1.548 .173
Level 32 1 86 3.30 1.096 .118
2 80 3.00 1.378 .154
Level 33 1 84 3.51 1.012 .110
2 79 3.38 1.333 .150
Tables 32 and 33 complete the formal verses no formal autopilot training analysis. Table
34 shows the mean scores for the two training groups. Table 35 shows that only questions 30, 31,
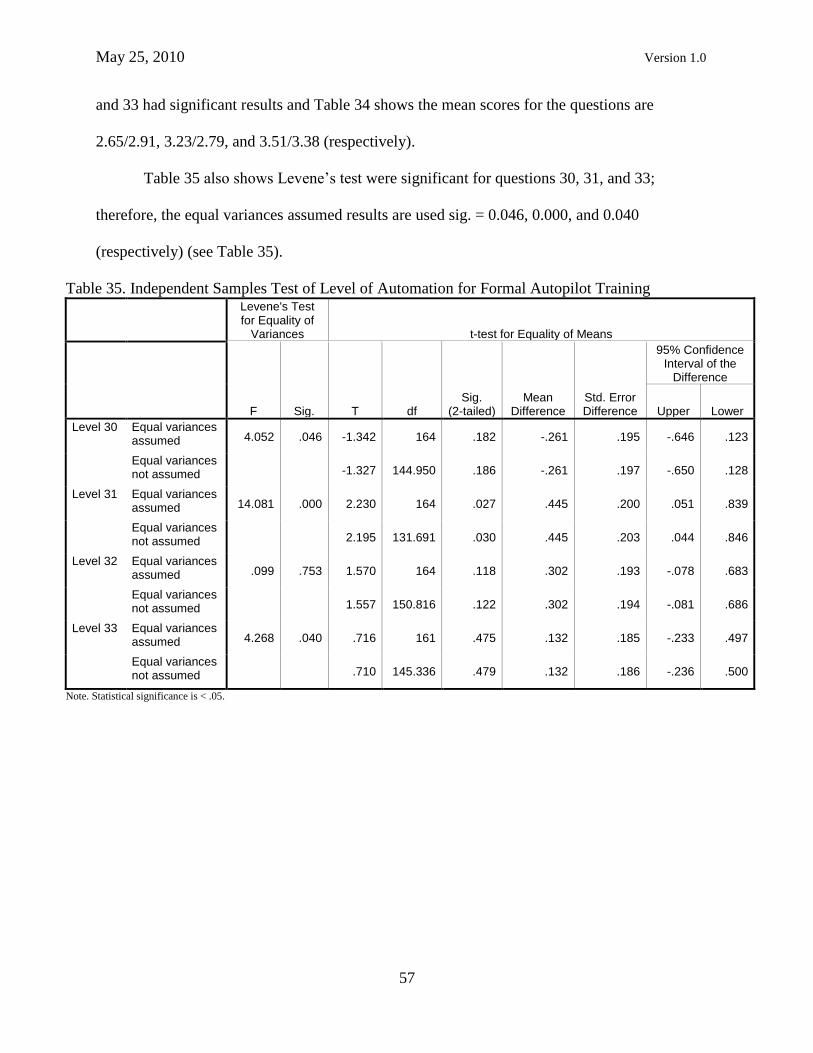
May 25, 2010 Version 1.0
57
and 33 had significant results and Table 34 shows the mean scores for the questions are
2.65/2.91, 3.23/2.79, and 3.51/3.38 (respectively).
Table 35 also shows Levene‟s test were significant for questions 30, 31, and 33;
therefore, the equal variances assumed results are used sig. = 0.046, 0.000, and 0.040
(respectively) (see Table 35).
Table 35. Independent Samples Test of Level of Automation for Formal Autopilot Training
Levene's Test for Equality of
Variances t-test for Equality of Means
F Sig. T df Sig.
(2-tailed) Mean
Difference Std. Error Difference
95% Confidence Interval of the
Difference
Upper Lower
Level 30 Equal variances assumed 4.052 .046 -1.342 164 .182 -.261 .195 -.646 .123
Equal variances not assumed -1.327 144.950 .186 -.261 .197 -.650 .128
Level 31 Equal variances assumed 14.081 .000 2.230 164 .027 .445 .200 .051 .839
Equal variances not assumed 2.195 131.691 .030 .445 .203 .044 .846
Level 32 Equal variances assumed .099 .753 1.570 164 .118 .302 .193 -.078 .683
Equal variances not assumed 1.557 150.816 .122 .302 .194 -.081 .686
Level 33 Equal variances assumed 4.268 .040 .716 161 .475 .132 .185 -.233 .497
Equal variances not assumed .710 145.336 .479 .132 .186 -.236 .500
Note. Statistical significance is < .05.
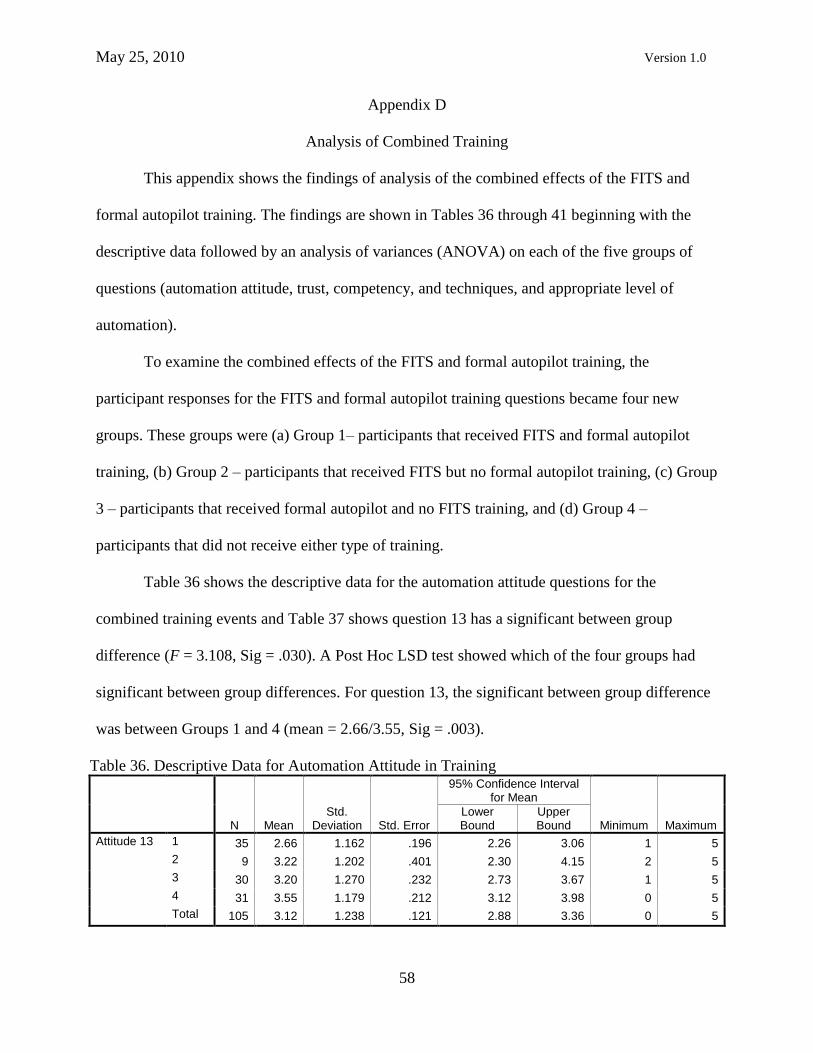
May 25, 2010 Version 1.0
58
Appendix D
Analysis of Combined Training
This appendix shows the findings of analysis of the combined effects of the FITS and
formal autopilot training. The findings are shown in Tables 36 through 41 beginning with the
descriptive data followed by an analysis of variances (ANOVA) on each of the five groups of
questions (automation attitude, trust, competency, and techniques, and appropriate level of
automation).
To examine the combined effects of the FITS and formal autopilot training, the
participant responses for the FITS and formal autopilot training questions became four new
groups. These groups were (a) Group 1– participants that received FITS and formal autopilot
training, (b) Group 2 – participants that received FITS but no formal autopilot training, (c) Group
3 – participants that received formal autopilot and no FITS training, and (d) Group 4 –
participants that did not receive either type of training.
Table 36 shows the descriptive data for the automation attitude questions for the
combined training events and Table 37 shows question 13 has a significant between group
difference (F = 3.108, Sig = .030). A Post Hoc LSD test showed which of the four groups had
significant between group differences. For question 13, the significant between group difference
was between Groups 1 and 4 (mean = 2.66/3.55, Sig = .003).
Table 36. Descriptive Data for Automation Attitude in Training
N Mean
Std. Deviation Std. Error
95% Confidence Interval for Mean
Minimum Maximum Lower Bound
Upper Bound
Attitude 13 1 35 2.66 1.162 .196 2.26 3.06 1 5
2 9 3.22 1.202 .401 2.30 4.15 2 5
3 30 3.20 1.270 .232 2.73 3.67 1 5
4 31 3.55 1.179 .212 3.12 3.98 0 5
Total 105 3.12 1.238 .121 2.88 3.36 0 5

May 25, 2010 Version 1.0
59
Table 37. ANOVA of Automation Attitude for Combined Training Events
Sum of Squares df Mean Square F Sig.
Attitude 11 Between Groups 6.151 3 2.050 2.112 .103
Within Groups 98.991 102 .970
Total 105.142 105
Attitude 12 Between Groups 3.981 3 1.327 1.346 .264
Within Groups 100.557 102 .986
Total 104.538 105
Attitude 13 Between Groups 13.472 3 4.491 3.108 .030
Within Groups 145.919 101 1.445
Total 159.390 104
Attitude 14 Between Groups 3.725 3 1.242 1.437 .237
Within Groups 86.428 100 .864
Total 90.154 103
Attitude 15 Between Groups 1.004 3 .335 .259 .855
Within Groups 130.558 101 1.293
Total 131.562 104
Note. Statistical significance is < .05.
None of the other automation attitude questions showed any significant between group
differences; therefore, they will not be considered further in the combined training events
analysis.
Tables 38 and 39 show the descriptive data and ANOVA results for the automation trust
questions. Question 18 shows significant between group difference (F = 0.404, Sig = .001, see
Table 39). The Post Hoc LSD test shows Groups 1 - 2, 1 - 3, and 1 - 4 (Sig = .004, .021, and
.000, respectively) (mean = 4.43/3.11, 4.43/3.73, and 4.43/3.26, respectively (see Table 38).
Table 38. Descriptive Data for Automation Trust in Combined Training Events
N Mean
Std. Deviation
Std. Error
95% Confidence Interval for Mean
Minimum Maximum Lower Bound
Upper Bound
Trust 18 1 35 4.43 .608 .103 4.22 4.64 3 5
2 9 3.11 1.616 .539 1.87 4.35 0 5
3 30 3.73 1.258 .230 3.26 4.20 0 5
4 31 3.26 1.460 .262 2.72 3.79 0 5
Total 105 3.77 1.280 .125 3.52 4.02 0 5
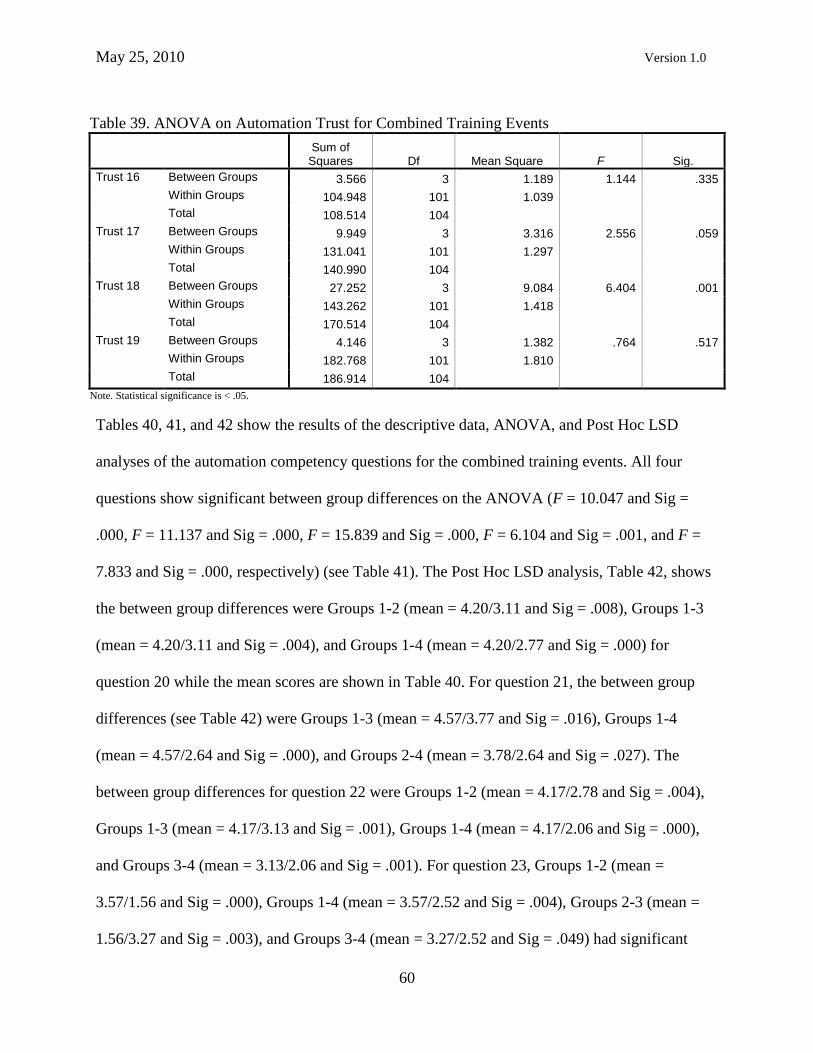
May 25, 2010 Version 1.0
60
Table 39. ANOVA on Automation Trust for Combined Training Events
Sum of
Squares Df Mean Square F Sig.
Trust 16 Between Groups 3.566 3 1.189 1.144 .335
Within Groups 104.948 101 1.039
Total 108.514 104
Trust 17 Between Groups 9.949 3 3.316 2.556 .059
Within Groups 131.041 101 1.297
Total 140.990 104
Trust 18 Between Groups 27.252 3 9.084 6.404 .001
Within Groups 143.262 101 1.418
Total 170.514 104
Trust 19 Between Groups 4.146 3 1.382 .764 .517
Within Groups 182.768 101 1.810
Total 186.914 104
Note. Statistical significance is < .05.
Tables 40, 41, and 42 show the results of the descriptive data, ANOVA, and Post Hoc LSD
analyses of the automation competency questions for the combined training events. All four
questions show significant between group differences on the ANOVA (F = 10.047 and Sig =
.000, F = 11.137 and Sig = .000, F = 15.839 and Sig = .000, F = 6.104 and Sig = .001, and F =
7.833 and Sig = .000, respectively) (see Table 41). The Post Hoc LSD analysis, Table 42, shows
the between group differences were Groups 1-2 (mean = 4.20/3.11 and Sig = .008), Groups 1-3
(mean = 4.20/3.11 and Sig = .004), and Groups 1-4 (mean = 4.20/2.77 and Sig = .000) for
question 20 while the mean scores are shown in Table 40. For question 21, the between group
differences (see Table 42) were Groups 1-3 (mean = 4.57/3.77 and Sig = .016), Groups 1-4
(mean = 4.57/2.64 and Sig = .000), and Groups 2-4 (mean = 3.78/2.64 and Sig = .027). The
between group differences for question 22 were Groups 1-2 (mean = 4.17/2.78 and Sig = .004),
Groups 1-3 (mean = 4.17/3.13 and Sig = .001), Groups 1-4 (mean = 4.17/2.06 and Sig = .000),
and Groups 3-4 (mean = 3.13/2.06 and Sig = .001). For question 23, Groups 1-2 (mean =
3.57/1.56 and Sig = .000), Groups 1-4 (mean = 3.57/2.52 and Sig = .004), Groups 2-3 (mean =
1.56/3.27 and Sig = .003), and Groups 3-4 (mean = 3.27/2.52 and Sig = .049) had significant
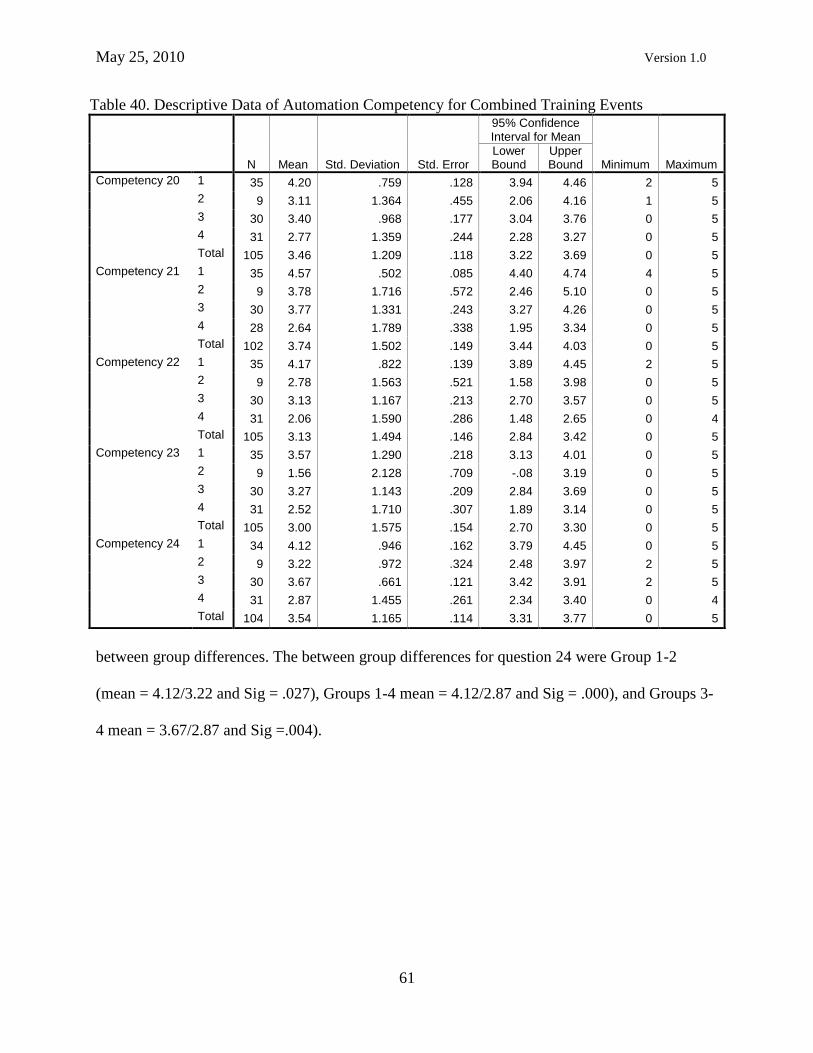
May 25, 2010 Version 1.0
61
Table 40. Descriptive Data of Automation Competency for Combined Training Events N Mean Std. Deviation Std. Error
95% Confidence Interval for Mean
Minimum Maximum Lower Bound
Upper Bound
Competency 20 1 35 4.20 .759 .128 3.94 4.46 2 5
2 9 3.11 1.364 .455 2.06 4.16 1 5
3 30 3.40 .968 .177 3.04 3.76 0 5
4 31 2.77 1.359 .244 2.28 3.27 0 5
Total 105 3.46 1.209 .118 3.22 3.69 0 5
Competency 21 1 35 4.57 .502 .085 4.40 4.74 4 5
2 9 3.78 1.716 .572 2.46 5.10 0 5
3 30 3.77 1.331 .243 3.27 4.26 0 5
4 28 2.64 1.789 .338 1.95 3.34 0 5
Total 102 3.74 1.502 .149 3.44 4.03 0 5
Competency 22 1 35 4.17 .822 .139 3.89 4.45 2 5
2 9 2.78 1.563 .521 1.58 3.98 0 5
3 30 3.13 1.167 .213 2.70 3.57 0 5
4 31 2.06 1.590 .286 1.48 2.65 0 4
Total 105 3.13 1.494 .146 2.84 3.42 0 5
Competency 23 1 35 3.57 1.290 .218 3.13 4.01 0 5
2 9 1.56 2.128 .709 -.08 3.19 0 5
3 30 3.27 1.143 .209 2.84 3.69 0 5
4 31 2.52 1.710 .307 1.89 3.14 0 5
Total 105 3.00 1.575 .154 2.70 3.30 0 5
Competency 24 1 34 4.12 .946 .162 3.79 4.45 0 5
2 9 3.22 .972 .324 2.48 3.97 2 5
3 30 3.67 .661 .121 3.42 3.91 2 5
4 31 2.87 1.455 .261 2.34 3.40 0 4
Total 104 3.54 1.165 .114 3.31 3.77 0 5
between group differences. The between group differences for question 24 were Group 1-2
(mean = 4.12/3.22 and Sig = .027), Groups 1-4 mean = 4.12/2.87 and Sig = .000), and Groups 3-
4 mean = 3.67/2.87 and Sig =.004).
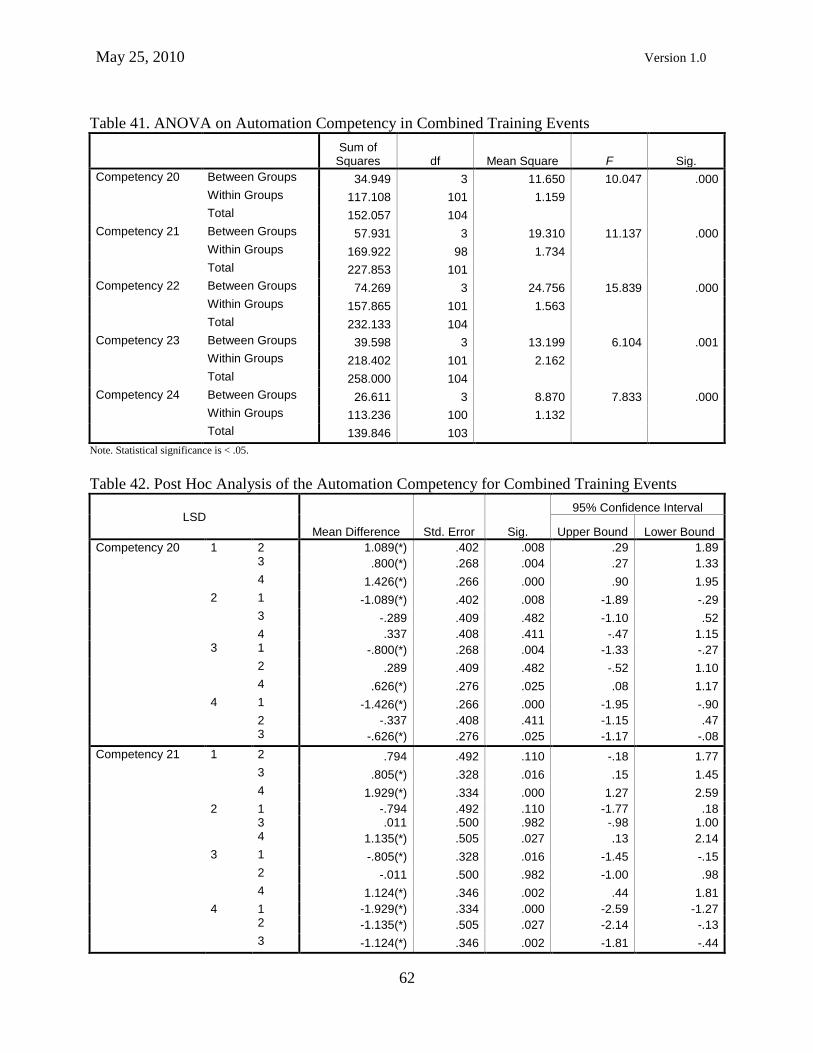
May 25, 2010 Version 1.0
62
Table 41. ANOVA on Automation Competency in Combined Training Events
Sum of
Squares df Mean Square F Sig.
Competency 20 Between Groups 34.949 3 11.650 10.047 .000
Within Groups 117.108 101 1.159
Total 152.057 104
Competency 21 Between Groups 57.931 3 19.310 11.137 .000
Within Groups 169.922 98 1.734
Total 227.853 101
Competency 22 Between Groups 74.269 3 24.756 15.839 .000
Within Groups 157.865 101 1.563
Total 232.133 104
Competency 23 Between Groups 39.598 3 13.199 6.104 .001
Within Groups 218.402 101 2.162
Total 258.000 104
Competency 24 Between Groups 26.611 3 8.870 7.833 .000
Within Groups 113.236 100 1.132
Total 139.846 103
Note. Statistical significance is < .05.
Table 42. Post Hoc Analysis of the Automation Competency for Combined Training Events
LSD
Mean Difference Std. Error Sig.
95% Confidence Interval
Upper Bound Lower Bound
Competency 20 1 2 1.089(*) .402 .008 .29 1.89 3 .800(*) .268 .004 .27 1.33
4 1.426(*) .266 .000 .90 1.95
2 1 -1.089(*) .402 .008 -1.89 -.29
3 -.289 .409 .482 -1.10 .52
4 .337 .408 .411 -.47 1.15 3 1 -.800(*) .268 .004 -1.33 -.27
2 .289 .409 .482 -.52 1.10
4 .626(*) .276 .025 .08 1.17
4 1 -1.426(*) .266 .000 -1.95 -.90
2 -.337 .408 .411 -1.15 .47 3 -.626(*) .276 .025 -1.17 -.08
Competency 21 1 2 .794 .492 .110 -.18 1.77
3 .805(*) .328 .016 .15 1.45
4 1.929(*) .334 .000 1.27 2.59
2 1 -.794 .492 .110 -1.77 .18 3 .011 .500 .982 -.98 1.00 4 1.135(*) .505 .027 .13 2.14
3 1 -.805(*) .328 .016 -1.45 -.15
2 -.011 .500 .982 -1.00 .98
4 1.124(*) .346 .002 .44 1.81
4 1 -1.929(*) .334 .000 -2.59 -1.27 2 -1.135(*) .505 .027 -2.14 -.13
3 -1.124(*) .346 .002 -1.81 -.44

May 25, 2010 Version 1.0
63
LSD
Mean Difference Std. Error Sig.
95% Confidence Interval
Upper Bound Lower Bound
Competency 22 1 2 1.394(*) .467 .004 .47 2.32
3 1.038(*) .311 .001 .42 1.66
4 2.107(*) .308 .000 1.50 2.72 2 1 -1.394(*) .467 .004 -2.32 -.47
3 -.356 .475 .456 -1.30 .59
4 .713 .473 .135 -.23 1.65
3 1 -1.038(*) .311 .001 -1.66 -.42
2 .356 .475 .456 -.59 1.30 4 1.069(*) .320 .001 .43 1.70 4 1 -2.107(*) .308 .000 -2.72 -1.50
2 -.713 .473 .135 -1.65 .23
3 -1.069(*) .320 .001 -1.70 -.43
Competency 23 1 2 2.016(*) .550 .000 .93 3.11
3 .305 .366 .407 -.42 1.03 4 1.055(*) .363 .004 .34 1.77
2 1 -2.016(*) .550 .000 -3.11 -.93
3 -1.711(*) .559 .003 -2.82 -.60
4 -.961 .557 .088 -2.07 .14
3 1 -.305 .366 .407 -1.03 .42 2 1.711(*) .559 .003 .60 2.82
4 .751(*) .377 .049 .00 1.50
4 1 -1.055(*) .363 .004 -1.77 -.34
2 .961 .557 .088 -.14 2.07
3 -.751(*) .377 .049 -1.50 .00 Competency 24 1 2 .895(*) .399 .027 .10 1.69 3 .451 .267 .094 -.08 .98
4 1.247(*) .264 .000 .72 1.77
2 1 -.895(*) .399 .027 -1.69 -.10
3 -.444 .404 .274 -1.25 .36
4 .351 .403 .385 -.45 1.15 3 1 -.451 .267 .094 -.98 .08
2 .444 .404 .274 -.36 1.25
4 .796(*) .273 .004 .26 1.34
4 1 -1.247(*) .264 .000 -1.77 -.72
2 -.351 .403 .385 -1.15 .45 3 -.796(*) .273 .004 -1.34 -.26
Note. * The mean difference is significant at the .05 level.
Next, the automation techniques questions for the combined training events were
analyzed; however, none of the questions had significant between group differences. Therefore,
this analysis is not included in this study.

May 25, 2010 Version 1.0
64
Tables 43 and 44 show the results of the analysis of the appropriate level of automation
questions for the combined training events. Question 30 shows a significant difference between
groups on the ANOVA (F = 4.615 and Sig = .005). Table 43 shows the mean scores and the Post
Hoc LSD analysis shows significant differences between Group 1-3 and 1-4 (mean = 2.40/3.00,
Sig = .042; and mean = 2.40/3.45, Sig = .000; respectively).
Table 43. Descriptive Data for Level of Automation for the Combined Training Events N Mean Std. Deviation Std. Error
95% Confidence Interval for Mean
Minimum Maximum Lower Bound Upper Bound
Level 30 1 35 2.40 1.143 .193 2.01 2.79 0 5
2 9 3.11 1.616 .539 1.87 4.35 0 5
3 29 3.00 1.069 .199 2.59 3.41 0 5
4 31 3.45 1.121 .201 3.04 3.86 0 5
Total 104 2.94 1.221 .120 2.70 3.18 0 5
Table 44. ANOVA on Level of Automation for Combined Training Events
Sum of Squares df Mean Square F Sig.
Level 30 Between Groups 18.688 3 6.229 4.615 .005
Within Groups 134.966 100 1.350
Total 153.654 103
Level 31 Between Groups 4.490 3 1.497 1.022 .386
Within Groups 146.395 100 1.464
Total 150.885 103
Level 32 Between Groups .888 3 .296 .210 .889
Within Groups 141.026 100 1.410
Total 141.913 103
Level 33 Between Groups 9.252 3 3.084 2.649 .053
Within Groups 112.907 97 1.164
Total 122.158 100
Note. Statistical significance is < .05.

May 25, 2010 Version 1.0
65
Appendix E
Glass Verses Non-Glass Analysis
Appendix E shows the findings of analysis of the “glass” verses non-glass airplane
cockpit. “Glass” in this study was defined as having a primary flight display (PFD),
multifunctional display (MFD), or both. The findings are shown in Tables 45 through 54
beginning with the group statistics being presented first and followed by the independent
samples test (t-test) on each of the five groups of questions (automation attitude, trust,
competency, and techniques, and appropriate level of automation).
Table 45 shows the group statistics for the automation attitude questions with glass verses
non-glass equipped airplanes. The independent samples findings follow in Table 46. Again,
question 13 shows a significant between group difference (Sig = .007) (see Table 45) and Table
45 shows the mean scores 3.56/2.89 for the non-glass verses glass, respectively.
No other questions showed significant between group differences in the automation
attitude group of questions. Therefore, we will not consider these questions further.
Table 45. Group Statistics for Automation Attitude with Glass
Glass - Non-glass N Mean Std. Deviation
Std. Error Mean
Attitude 11 1 33 4.55 .938 .163
2 110 4.50 .886 .084
Attitude 12 1 33 3.97 1.104 .192
2 110 4.00 .846 .081
Attitude 13 1 33 3.55 1.371 .239
2 110 2.89 1.144 .109
Attitude 14 1 33 2.42 .902 .157
2 99 2.11 .946 .095
Attitude 15 1 33 3.67 1.164 .203
2 110 3.40 1.110 .106

May 25, 2010 Version 1.0
66
Table 46. Independent Samples for Automation Attitude with Glass
Levene's Test for Equality of
Variances t-test for Equality of Means
F Sig. T df Sig.
(2-tailed) Mean
Difference Std. Error Difference
95% Confidence Interval of the
Difference
Upper Lower
Attitude 11 Equal variances assumed .223 .637 .255 141 .799 .045 .178 -.307 .398
Equal variances not assumed .247 50.331 .806 .045 .184 -.324 .415
Attitude 12 Equal variances assumed 1.564 .213 -.168 141 .867 -.030 .181 -.388 .327
Equal variances not assumed -.145 43.876 .885 -.030 .208 -.450 .390
Attitude 13 Equal variances assumed 3.235 .074 2.749 141 .007 .655 .238 .184 1.125
Equal variances not assumed 2.494 46.169 .016 .655 .262 .126 1.183
Attitude 14 Equal variances assumed .113 .737 1.665 130 .098 .313 .188 -.059 .685
Equal variances not assumed 1.705 57.251 .094 .313 .184 -.055 .681
Attitude 15 Equal variances assumed .000 .990 1.197 141 .233 .267 .223 -.174 .707
Equal variances not assumed 1.167 50.758 .249 .267 .229 -.192 .726
Note. Statistical significance is < .05.
Tables 47 and 48 shows the findings for the automation trust group of questions in the
analysis of the airplanes equipped with glass and those not equipped with glass flight
instruments. Only question 16 showed a significant difference between the groups in the
automation trust group. Question 16 was significant (T = 2.112, df = 57.471, and Sig = .039)
Table 47. Group Statistics for Automation Trust with Glass
Glass - Non-glass N Mean Std. Deviation Std. Error
Mean
Trust 16 1 33 3.91 1.100 .192
2 110 3.44 1.216 .116
Trust 17 1 33 3.55 1.252 .218
2 110 3.43 1.088 .104
Trust 18 1 33 3.09 1.487 .259
2 110 3.63 1.561 .149
Trust 19 1 33 2.39 1.638 .285
2 110 1.91 1.358 .130

May 25, 2010 Version 1.0
67
(see Table 48) with non-glass/glass mean = 3.91/3.44 (see Table 47). The equal variances not
assumed data was used because Levene‟s test was significant (Sig = .050) (see Table 48).
Table 48. Independent Samples for Automation Trust with Glass
Levene's Test for Equality of Variances t-test for Equality of Means
F Sig. T Df Sig.
(2-tailed) Mean
Difference Std. Error Difference
95% Confidence Interval of the
Difference
Upper Lower
Trust 16 Equal variances assumed 3.902 .050 2.001 141 .047 .473 .236 .006 .940
Equal variances not assumed 2.112 57.471 .039 .473 .224 .025 .921
Trust 17 Equal variances assumed 1.383 .242 .528 141 .598 .118 .224 -.324 .560
Equal variances not assumed .490 47.407 .627 .118 .241 -.367 .604
Trust 18 Equal variances assumed .186 .667 -1.749 141 .082 -.536 .307 -1.142 .070
Equal variances not assumed -1.797 54.915 .078 -.536 .299 -1.135 .062
Trust 19 Equal variances assumed 2.524 .114 1.712 141 .089 .485 .283 -.075 1.045
Equal variances not assumed 1.548 45.986 .128 .485 .313 -.146 1.115
Note. Statistical significance is < .05.
Table 49 and 50 show the findings for the automation competency questions for the glass
verses non-glass equipped airplanes. None of the five measurements of automation competency
were significant; therefore, these findings will not be considered further.
Table 49. Group Statistics Automation Competency with Glass
Glass - Non-glass N Mean Std. Deviation Std. Error
Mean
Competency 20 1 33 3.12 1.409 .245
2 110 3.27 1.508 .144
Competency 21 1 29 3.21 1.497 .278
2 110 3.58 1.768 .169
Competency 22 1 33 2.73 1.567 .273
2 110 3.00 1.653 .158
Competency 23 1 33 2.52 1.642 .286
2 109 2.82 1.728 .165
Competency 24 1 33 3.12 1.495 .260
2 109 3.25 1.522 .146

May 25, 2010 Version 1.0
68
Table 50. Independent Samples for Automation Competency with Glass
Levene's Test for Equality of
Variances t-test for Equality of Means
F Sig. T df Sig.
(2-tailed) Mean
Difference Std. Error Difference
95% Confidence Interval of the
Difference
Upper Lower
Competency 20 Equal variances assumed 1.727 .191 -.514 141 .608 -.152 .295 -.735 .432
Equal variances not assumed -.533 55.836 .596 -.152 .284 -.721 .418
Competency 21 Equal variances assumed .709 .401 -1.047 137 .297 -.375 .358 -1.083 .333
Equal variances not assumed -1.153 50.620 .254 -.375 .325 -1.028 .278
Competency 22 Equal variances assumed .082 .775 -.841 141 .402 -.273 .324 -.914 .368
Equal variances not assumed -.866 55.151 .390 -.273 .315 -.904 .359
Competency 23 Equal variances assumed .054 .816 -.888 140 .376 -.301 .339 -.972 .370
Equal variances not assumed -.913 55.215 .365 -.301 .330 -.963 .360
Competency 24 Equal variances assumed .033 .857 -.420 140 .675 -.126 .301 -.722 .469
Equal variances not assumed -.424 53.681 .673 -.126 .298 -.725 .472
Note. Statistical significance is < .05.
The findings for the automation techniques for glass are in Tables 51 and 52. Three of
these findings are significant including questions 25, 26, and 27 (T = -2.749, df = 140, and
Table 51. Group Statistics for Automation Techniques with Glass
Glass - Non-glass N Mean Std. Deviation Std. Error
Mean
Techniques 25 1 32 3.75 1.136 .201
2 110 4.25 .840 .080
Techniques 26 1 32 3.84 1.110 .196
2 110 4.38 .649 .062
Techniques 27 1 32 4.03 .967 .171
2 110 4.36 .726 .069
Techniques 28 1 32 3.72 .991 .175
2 110 3.88 .955 .091
Techniques 29 1 32 3.94 .914 .162
2 110 4.16 .761 .073

May 25, 2010 Version 1.0
69
Sig = .007; T = -3.455, df = 140, and Sig = .001; and T = -2.106, df = 140, and Sig = .037;
respectively (see Table 52). The mean scores for these groups (non-glass/glass) are 3.75/4.25,
3.84/4.38, and 4.03/4.36, respectively (see Table 51).
Table 52. Independent Samples for Automaton Techniques with Glass
Levene's Test for Equality of
Variances t-test for Equality of Means
F Sig. T Df Sig.
(2-tailed) Mean
Difference Std. Error Difference
95% Confidence Interval of the
Difference
Upper Lower
Techniques 25 Equal variances assumed .010 .920 -2.749 140 .007 -.505 .184 -.867 -.142
Equal variances not assumed -2.334 41.345 .025 -.505 .216 -.941 -.068
Techniques 26 Equal variances assumed .052 .820 -3.455 140 .001 -.538 .156 -.846 -.230
Equal variances not assumed -2.614 37.371 .013 -.538 .206 -.955 -.121
Techniques 27 Equal variances assumed .301 .584 -2.106 140 .037 -.332 .158 -.644 -.020
Equal variances not assumed -1.803 41.689 .079 -.332 .184 -.705 .040
Techniques 28 Equal variances assumed .044 .834 -.843 140 .401 -.163 .193 -.546 .219
Equal variances not assumed -.826 48.990 .413 -.163 .198 -.560 .234
Techniques 29 Equal variances assumed .502 .480 -1.413 140 .160 -.226 .160 -.543 .090
Equal variances not assumed -1.277 44.249 .208 -.226 .177 -.583 .131
Note. Statistical significance is < .05.
Table 53 and 54 show one of the level of automation questions with and without glass
was significant, question 30 (T = 2.690, df = 140, and Sig = .008) (see Table 54). Table 53 shows
the group means (non-glass/glass) for this question is 3.31/270. No other questions were
significant; thus, we will not consider them further.

May 25, 2010 Version 1.0
70
Table 53. Group Statistics for Level of Automation with Glass
Glass - Non-glass N Mean Std. Deviation Std. Error
Mean
Level 30 1 32 3.31 1.148 .203
2 110 2.70 1.130 .108
Level 31 1 32 3.22 1.237 .219
2 110 3.05 1.187 .113
Level 32 1 32 3.31 1.120 .198
2 110 3.25 1.119 .107
Level 33 1 32 3.78 1.099 .194
2 108 3.44 1.061 .102
Table 54. Independent Samples for Level of Automation with Glass
Levene's Test for Equality of
Variances t-test for Equality of Means
F Sig. T df Sig.
(2-tailed) Mean
Difference Std. Error Difference
95% Confidence Interval of the
Difference
Upper Lower
Level 30 Equal variances assumed .036 .850 2.690 140 .008 .613 .228 .162 1.063
Equal variances not assumed 2.665 49.791 .010 .613 .230 .151 1.074
Level 31 Equal variances assumed .024 .878 .682 140 .496 .164 .241 -.312 .640
Equal variances not assumed .667 48.834 .508 .164 .246 -.331 .659
Level 32 Equal variances assumed .025 .876 .298 140 .766 .067 .225 -.377 .511
Equal variances not assumed .298 50.398 .767 .067 .225 -.385 .519
Level 33 Equal variances assumed .272 .603 1.607 138 .110 .346 .215 -.080 .772
Equal variances not assumed 1.576 49.396 .121 .346 .220 -.095 .787
Note. Statistical significance is < .05.

May 25, 2010 Version 1.0
71
Appendix F
Autopilot and Moving Map Analysis
Appendix F shows the significant findings for the autopilot and moving map equipped
airplane. Again, the tables show the analyses by the five groups of questions as shown in
Appendix E. The tables showing the automation attitude questions will be presented first
followed by the each of the remaining groups of questions.
Tables 55 and 56 show the findings for the automation attitude questions had significant
between group differences for the autopilot and moving map equipped verses airplanes not
equipped with an autopilot and a moving map. Table 56 shows none of the automation attitude
questions for autopilot and moving map equipped airplanes had any significant differences.
However, note that questions 13 and 14 do appear to show significant differences until the
Levene‟s test is considered. In both cases, the Levene‟s test is significant (Sig = .013 and .007,
respectively) (see Table 56). This means that the equal variances not assumed line must be used
and neither is significant (Sig = .055 and .052, respectively) (see Table 56). Therefore, we will
not consider these questions for autopilot and moving map further.
Table 55. Group Statistics for Automation Attitude with Autopilot and Moving Map
Moving Map N Mean Std. Deviation Std. Error Mean
Attitude 11 1 100 4.46 .989 .099
2 65 4.18 1.211 .150
Attitude 12 1 99 3.96 .936 .094
2 66 3.83 1.158 .143
Attitude 13 1 99 2.89 1.142 .115
2 66 3.29 1.390 .171
Attitude 14 1 98 2.14 .942 .095
2 56 2.50 1.160 .155
Attitude 15 1 99 3.57 .928 .093
2 66 3.24 1.447 .178

May 25, 2010 Version 1.0
72
Table 56. Independent Sample for Automation Attitude with Autopilot and Moving Map
Levene's Test for Equality of
Variances t-test for Equality of Means
F Sig. t df Sig.
(2-tailed) Mean
Difference Std. Error Difference
95% Confidence Interval of the
Difference
Upper Lower
Attitude 11 Equal variances assumed 1.365 .244 1.598 163 .112 .275 .172 -.065 .616
Equal variances not assumed 1.532 117.310 .128 .275 .180 -.081 .631
Attitude 12 Equal variances assumed 3.533 .062 .771 163 .442 .126 .164 -.197 .450
Equal variances not assumed .739 118.970 .461 .126 .171 -.212 .464
Attitude 13 Equal variances assumed 6.272 .013 -2.014 163 .046 -.399 .198 -.790 -.008
Equal variances not assumed -1.937 120.490 .055 -.399 .206 -.807 .009
Attitude 14 Equal variances assumed 7.451 .007 -2.078 152 .039 -.357 .172 -.697 -.018
Equal variances not assumed -1.964 96.463 .052 -.357 .182 -.718 .004
Attitude 15 Equal variances assumed 20.749 .000 1.749 163 .082 .323 .185 -.042 .688
Equal variances not assumed 1.608 100.485 .111 .323 .201 -.076 .722
Note. Statistical significance is < .05.
Table 57 and 58 show the findings for the automation trust questions with autopilot and
moving maps. Questions 16, 18, and 19 show significant differences (t = 2.449, df = 98.359, and
Sig (2-tailed) = .016; t = 5.342, df = 99.017, and Sig (2-tailed) = .000; and t = 2.482, df =
1113.416, and Sig (2-tailed) = .015; respectively) (see Table 58). Note that the equal variances
not assumed was used because Levene‟s test was significant on all three questions (Sig = .000,
.000, and .000, respectively) (see Table 58). The mean scores for the three questions were
3.74/3.21, 3.91/2.54, and 2.26/1.67, respectively (see Table 57).

May 25, 2010 Version 1.0
73
Table 57. Group Statistics for Automation Trust with Autopilot and Moving Map
Moving Map N Mean Std. Deviation Std. Error Mean
Trust 16 1 99 3.74 .965 .097
2 66 3.21 1.554 .191
Trust 17 1 99 3.42 1.126 .113
2 66 3.36 1.260 .155
Trust 18 1 99 3.91 1.170 .118
2 66 2.53 1.866 .230
Trust 19 1 99 2.26 1.258 .126
2 66 1.67 1.658 .204
Table 58. Independent Sample for Automation Attitude with Autopilot and Moving Map
Levene's Test for Equality of
Variances t-test for Equality of Means
F Sig. t df Sig.
(2-tailed) Mean
Difference Std. Error Difference
95% Confidence Interval of the
Difference
Upper Lower
Trust 16 Equal variances assumed 31.001 .000 2.679 163 .008 .525 .196 .138 .912
Equal variances not assumed 2.449 98.359 .016 .525 .214 .100 .951
Trust 17 Equal variances assumed .456 .501 .323 163 .747 .061 .188 -.310 .431
Equal variances not assumed .316 128.418 .753 .061 .192 -.319 .441
Trust 18 Equal variances assumed 38.159 .000 5.833 163 .000 1.379 .236 .912 1.846
Equal variances not assumed 5.342 99.017 .000 1.379 .258 .867 1.891
Trust 19 Equal variances assumed 26.125 .000 2.621 163 .010 .596 .227 .147 1.045
Equal variances not assumed 2.482 113.416 .015 .596 .240 .120 1.072
Note. Statistical significance is < .05.
Tables 59 and 60 show the findings for the automation competency questions for the
autopilot and moving map. Table 60 show all five automation competency questions were
significant (t = 5.465, df = 100.753, and Sig (2-tailed) = .000; t = 7.908, df = 90.688, and Sig (2-
tailed) = .000; t = 6.935, df = 109.296, and Sig (2-tailed) = .000; t = 5.054, df = 115.436, and Sig
(2-tailed) = .000; and t = 5.370, df = 97.802, and Sig (2-tailed) = .000; respectively). Again, the
Levene‟s tests were significant for all five questions (Sig = .000, .000, .000, .000, and .000,

May 25, 2010 Version 1.0
74
Table 59. Group Statistics for Automation Competency with Autopilot and Moving Map
Moving Map N Mean Std. Deviation Std. Error
Mean
Competency 20 1 99 3.59 1.125 .113
2 66 2.26 1.748 .215
Competency 21 1 99 4.08 1.131 .114
2 63 2.00 1.884 .237
Competency 22 1 99 3.42 1.246 .125
2 65 1.74 1.680 .208
Competency 23 1 98 3.19 1.397 .141
2 66 1.86 1.805 .222
Competency 24 1 98 3.61 1.109 .112
2 66 2.27 1.811 .223
Table 60. Independent Sample for Automation Competency with Autopilot and Moving Map
Levene's Test for
Equality of Variances t-test for Equality of Means
F Sig. t df
Sig. (2-
tailed) Mean
Difference Std. Error Difference
95% Confidence
Interval of the Difference
Upper Lower
Competency 20 Equal variances assumed 25.839 .000 5.941 163 .000 1.328 .224 .887 1.770
Equal variances not assumed 5.465 100.753 .000 1.328 .243 .846 1.810
Competency 21 Equal variances assumed 45.071 .000 8.788 160 .000 2.081 .237 1.613 2.548
Equal variances not assumed 7.908 90.688 .000 2.081 .263 1.558 2.604
Competency 22 Equal variances assumed 17.805 .000 7.368 162 .000 1.686 .229 1.234 2.138
Equal variances not assumed 6.935 109.296 .000 1.686 .243 1.204 2.168
Competency 23 Equal variances assumed 25.213 .000 5.309 162 .000 1.330 .251 .835 1.825
Equal variances not assumed 5.054 115.436 .000 1.330 .263 .809 1.852
Competency 24 Equal variances assumed 48.866 .000 5.873 162 .000 1.340 .228 .889 1.790
Equal variances not assumed 5.370 97.802 .000 1.340 .249 .845 1.835
Note. Statistical significance is < .05.
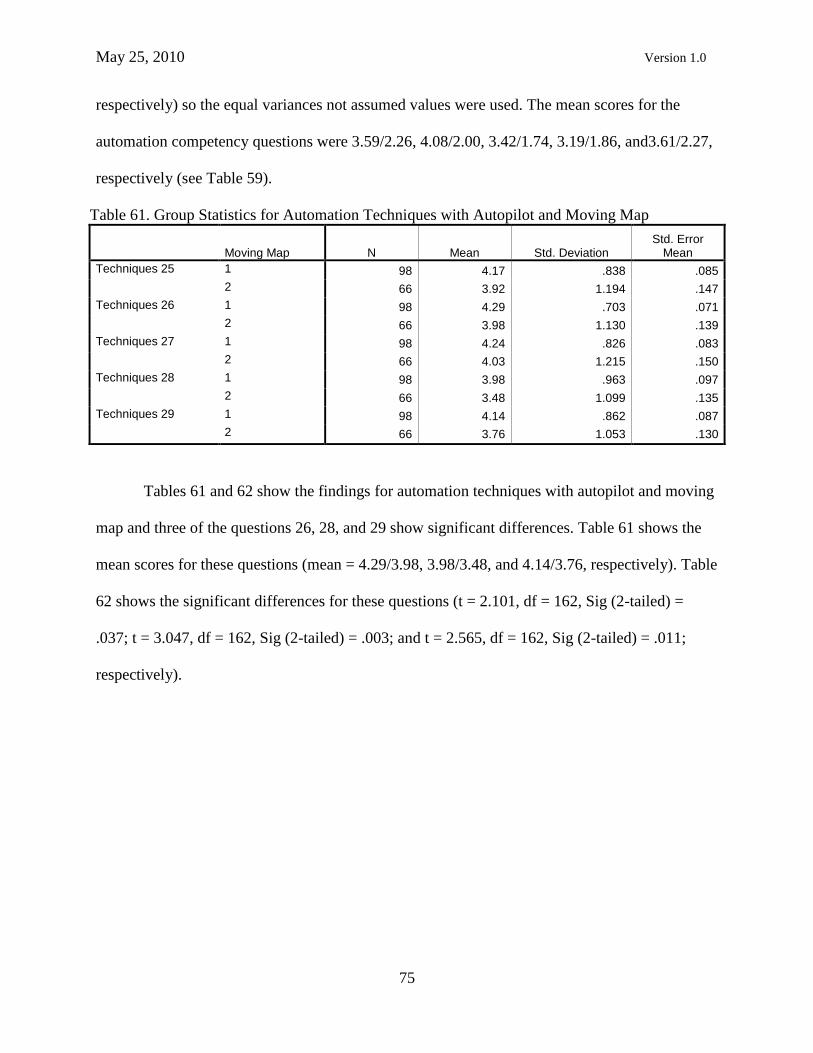
May 25, 2010 Version 1.0
75
respectively) so the equal variances not assumed values were used. The mean scores for the
automation competency questions were 3.59/2.26, 4.08/2.00, 3.42/1.74, 3.19/1.86, and3.61/2.27,
respectively (see Table 59).
Table 61. Group Statistics for Automation Techniques with Autopilot and Moving Map
Moving Map N Mean Std. Deviation Std. Error
Mean
Techniques 25 1 98 4.17 .838 .085
2 66 3.92 1.194 .147
Techniques 26 1 98 4.29 .703 .071
2 66 3.98 1.130 .139
Techniques 27 1 98 4.24 .826 .083
2 66 4.03 1.215 .150
Techniques 28 1 98 3.98 .963 .097
2 66 3.48 1.099 .135
Techniques 29 1 98 4.14 .862 .087
2 66 3.76 1.053 .130
Tables 61 and 62 show the findings for automation techniques with autopilot and moving
map and three of the questions 26, 28, and 29 show significant differences. Table 61 shows the
mean scores for these questions (mean = 4.29/3.98, 3.98/3.48, and 4.14/3.76, respectively). Table
62 shows the significant differences for these questions (t = 2.101, df = 162, Sig (2-tailed) =
.037; t = 3.047, df = 162, Sig (2-tailed) = .003; and t = 2.565, df = 162, Sig (2-tailed) = .011;
respectively).

May 25, 2010 Version 1.0
76
Table 62. Independent Sample for Automation Techniques with Autopilot and Moving Map
Levene's Test for
Equality of Variances t-test for Equality of Means
F Sig. t df Sig.
(2-tailed) Mean
Difference Std. Error Difference
95% Confidence Interval of the
Difference
Upper Lower
Techniques 25 Equal variances assumed 3.297 .071 1.572 162 .118 .249 .159 -.064 .562
Equal variances not assumed 1.470 107.343 .145 .249 .170 -.087 .585
Techniques 26 Equal variances assumed 1.593 .209 2.101 162 .037 .301 .143 .018 .584
Equal variances not assumed 1.926 98.850 .057 .301 .156 -.009 .611
Techniques 27 Equal variances assumed .740 .391 1.347 162 .180 .215 .159 -.100 .529
Equal variances not assumed 1.253 104.921 .213 .215 .171 -.125 .554
Techniques 28 Equal variances assumed 3.367 .068 3.047 162 .003 .495 .162 .174 .815
Equal variances not assumed 2.970 126.887 .004 .495 .167 .165 .824
Techniques 29 Equal variances assumed .555 .457 2.565 162 .011 .385 .150 .089 .682
Equal variances not assumed 2.467 120.388 .015 .385 .156 .076 .694
Note. Statistical significance is < .05.
Table 63. Group Statistics for Level of Automation with Autopilot and Moving Map
Moving Map N Mean Std. Deviation Std. Error Mean
Level 30 1 98 2.71 1.131 .114
2 66 2.88 1.441 .177
Level 31 1 98 3.22 1.031 .104
2 66 2.73 1.594 .196
Level 32 1 98 3.29 1.121 .113
2 66 2.95 1.408 .173
Level 33 1 96 3.41 1.101 .112
2 65 3.51 1.301 .161
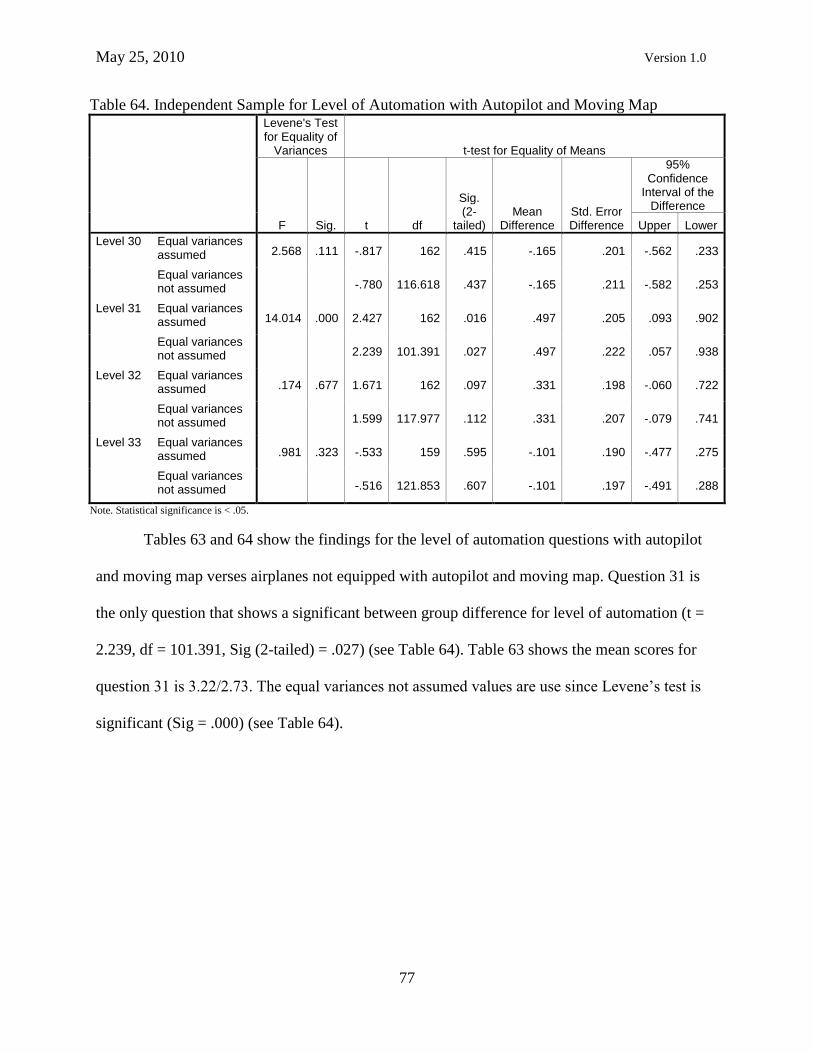
May 25, 2010 Version 1.0
77
Table 64. Independent Sample for Level of Automation with Autopilot and Moving Map
Levene's Test for Equality of
Variances t-test for Equality of Means
F Sig. t df
Sig. (2-
tailed) Mean
Difference Std. Error Difference
95% Confidence
Interval of the Difference
Upper Lower
Level 30 Equal variances assumed 2.568 .111 -.817 162 .415 -.165 .201 -.562 .233
Equal variances not assumed -.780 116.618 .437 -.165 .211 -.582 .253
Level 31 Equal variances assumed 14.014 .000 2.427 162 .016 .497 .205 .093 .902
Equal variances not assumed 2.239 101.391 .027 .497 .222 .057 .938
Level 32 Equal variances assumed .174 .677 1.671 162 .097 .331 .198 -.060 .722
Equal variances not assumed 1.599 117.977 .112 .331 .207 -.079 .741
Level 33 Equal variances assumed .981 .323 -.533 159 .595 -.101 .190 -.477 .275
Equal variances not assumed -.516 121.853 .607 -.101 .197 -.491 .288
Note. Statistical significance is < .05.
Tables 63 and 64 show the findings for the level of automation questions with autopilot
and moving map verses airplanes not equipped with autopilot and moving map. Question 31 is
the only question that shows a significant between group difference for level of automation (t =
2.239, df = 101.391, Sig (2-tailed) = .027) (see Table 64). Table 63 shows the mean scores for
question 31 is 3.22/2.73. The equal variances not assumed values are use since Levene‟s test is
significant (Sig = .000) (see Table 64).

May 25, 2010 Version 1.0
78
Appendix G
Area Navigation (RNAV) Analysis
This appendix presents the analysis of the data collection instrument questions related to
airplanes equipped with RNAV verses without RNAV equipment. Again, the tables show the
analyses by the five groups of questions as shown in Appendix E. The tables showing the
automation attitude questions are first and followed by the each of the remaining groups of
questions.
Tables 65 and 66 show the findings for the automation attitude questions had significant
between group differences for the RNAV equipped verses airplanes not equipped with an
RNAV. Table 65 shows the mean scores for the participants with RNAV equipment, RNAV 1,
and those without RNAVs, RNAV 2. The results for questions 11, 12, and 15 are significant t = -
2.148, df = 83.161, Sig (2-tailed) = .035; t = -2.242, df = 114, Sig (2-tailed) = .027; and t =
2.436, df = 113.880, Sig (2-tailed) = .016; respectively (see Table 66). Note that the Levene‟s
test for equality of variances is significant (Sig = .007 and .011), so the variances not assumed
Table 65. Group Statistics for Automation Attitude with RNAV
RNAV N Mean Std. Deviation Std. Error Mean
Attitude 11 1 54 4.30 1.143 .156
2 62 4.68 .672 .085
Attitude 12 1 54 3.89 1.058 .144
2 62 4.26 .700 .089
Attitude 13 1 54 2.93 1.179 .160
2 62 3.10 1.264 .160
Attitude 14 1 54 2.19 1.011 .138
2 52 2.37 1.067 .148
Attitude 15 1 54 3.72 1.036 .141
2 62 3.21 1.230 .156
results for question 11 and 15, respectively, were used. Table 65 shows the mean scores for
questions 11, 12, and 13 were (Mean = 4.30/4.68, 3.89/4.26, and 3.72/3.21, respectively) for
automation attitude with RNAV.

May 25, 2010 Version 1.0
79
Table 66. Independent Samples for Automation Attitude with RNAV
Levene's Test for Equality of
Variances t-test for Equality of Means
F Sig. t df Sig.
(2-tailed) Mean
Difference Std. Error Difference
95% Confidence
Interval of the Difference
Upper Lower
Attitude 11 Equal variances assumed 7.534 .007 -2.222 114 .028 -.381 .172 -.721 -.041
Equal variances not assumed -2.148 83.161 .035 -.381 .177 -.734 -.028
Attitude 12 Equal variances assumed .137 .712 -2.242 114 .027 -.369 .165 -.695 -.043
Equal variances not assumed -2.182 89.757 .032 -.369 .169 -.705 -.033
Attitude 13 Equal variances assumed 1.460 .229 -.749 114 .455 -.171 .228 -.623 .281
Equal variances not assumed -.753 113.441 .453 -.171 .227 -.620 .279
Attitude 14 Equal variances assumed .663 .417 -.893 104 .374 -.180 .202 -.580 .220
Equal variances not assumed -.892 103.126 .374 -.180 .202 -.581 .220
Attitude 15 Equal variances assumed 6.757 .011 2.408 114 .018 .513 .213 .091 .934
Equal variances not assumed 2.436 113.880 .016 .513 .210 .096 .929
Note. Statistical significance is < .05.
Tables 67 and 68 show the results of the analyses of the automation trust questions for
RNAV. The mean scores for questions 18 and 19 were 4.11/2.81 and 2.31/1.61, respectively (see
Table 67). Table 68 shows only questions 18 and 19 had significantly different means for
Table 67. Group Statistics for Automation Trust with RNAV
RNAV N Mean Std. Deviation Std. Error Mean
Trust 16 1 54 3.65 .935 .127
2 62 3.32 1.457 .185
Trust 17 1 54 3.48 .966 .131
2 62 3.39 1.136 .144
Trust 18 1 54 4.11 1.022 .139
2 62 2.81 1.898 .241
Trust 19 1 54 2.31 1.163 .158
2 62 1.61 1.712 .217

May 25, 2010 Version 1.0
80
the RNAV (t = 4.689, df = 96.111, Sig (2-tailed) = .000 and t = 2.611, df = 107.900, Sig (2-
tailed) = .010, respectively). The equal variances results were used for both questions because
the Levene‟s test was significant (Sig = .000 and .000, respectively) (see Table 68).
Table 68. Independent Samples for Automation Trust with RNAV
Levene's Test for Equality of
Variances t-test for Equality of Means
F Sig. t df Sig.
(2-tailed) Mean
Difference Std. Error Difference
95% Confidence
Interval of the Difference
Upper Lower
Trust 16 Equal variances assumed 16.771 .000 1.408 114 .162 .326 .231 -.132 .784
Equal variances not assumed 1.450 105.222 .150 .326 .225 -.120 .771
Trust 17 Equal variances assumed 1.931 .167 .478 114 .633 .094 .197 -.297 .485
Equal variances not assumed .484 113.943 .630 .094 .195 -.292 .481
Trust 18 Equal variances assumed 43.365 .000 4.513 114 .000 1.305 .289 .732 1.877
Equal variances not assumed 4.689 96.111 .000 1.305 .278 .752 1.857
Trust 19 Equal variances assumed 21.757 .000 2.545 114 .012 .702 .276 .155 1.248
Equal variances not assumed 2.611 107.900 .010 .702 .269 .169 1.235
Note. Statistical significance is < .05.
Tables 69 and 70 show the results of the analyses of the automation competency
questions with RNAV. Table 69 shows the mean scores for question 20, 21, 22, 23, and 24
Table 69. Group Statistics for Automation Competency with RNAV
RNAV N Mean Std. Deviation Std. Error Mean
Competency 20 1 54 3.78 1.003 .137
2 62 2.58 1.788 .227
Competency 21 1 54 4.20 1.155 .157
2 62 2.58 1.963 .249
Competency 22 1 54 3.63 1.218 .166
2 62 2.06 1.764 .224
Competency 23 1 53 3.40 1.276 .175
2 62 1.95 1.877 .238
Competency 24 1 54 3.74 1.067 .145
2 62 2.53 1.799 .228
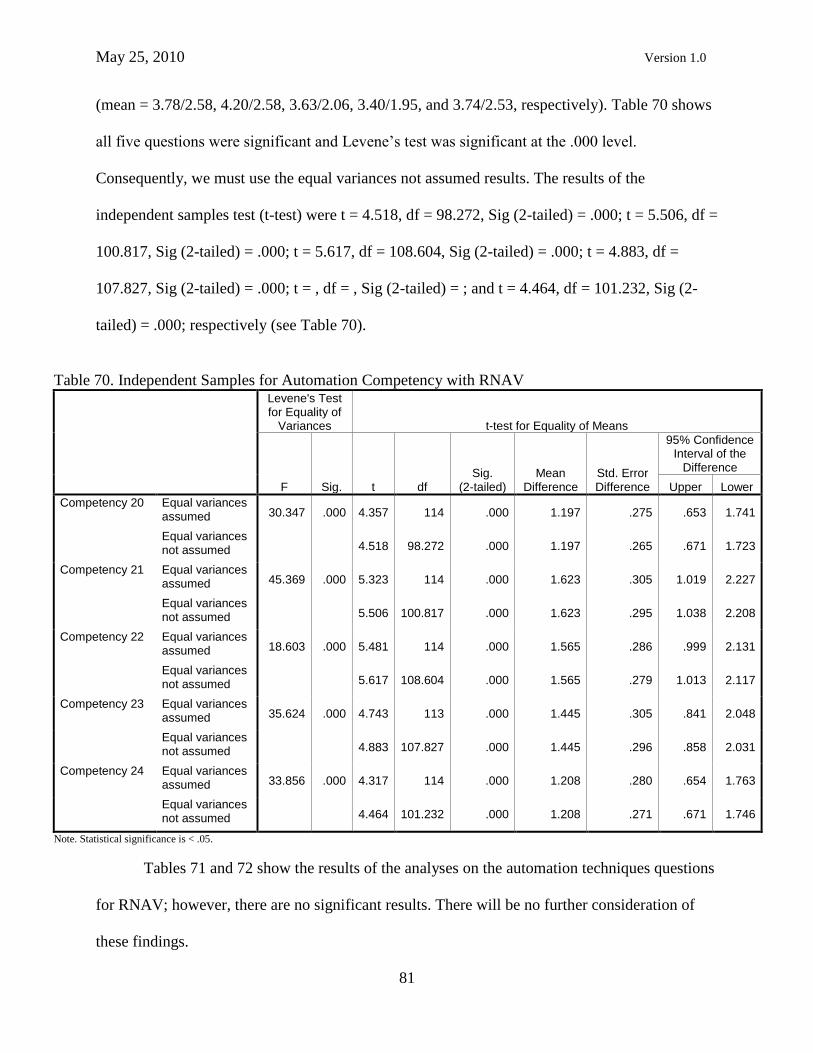
May 25, 2010 Version 1.0
81
(mean = 3.78/2.58, 4.20/2.58, 3.63/2.06, 3.40/1.95, and 3.74/2.53, respectively). Table 70 shows
all five questions were significant and Levene‟s test was significant at the .000 level.
Consequently, we must use the equal variances not assumed results. The results of the
independent samples test (t-test) were t = 4.518, df = 98.272, Sig (2-tailed) = .000; t = 5.506, df =
100.817, Sig (2-tailed) = .000; t = 5.617, df = 108.604, Sig (2-tailed) = .000; t = 4.883, df =
107.827, Sig (2-tailed) = .000; t = , df = , Sig (2-tailed) = ; and t = 4.464, df = 101.232, Sig (2-
tailed) = .000; respectively (see Table 70).
Table 70. Independent Samples for Automation Competency with RNAV
Levene's Test for Equality of
Variances t-test for Equality of Means
F Sig. t df Sig.
(2-tailed) Mean
Difference Std. Error Difference
95% Confidence Interval of the
Difference
Upper Lower
Competency 20 Equal variances assumed 30.347 .000 4.357 114 .000 1.197 .275 .653 1.741
Equal variances not assumed 4.518 98.272 .000 1.197 .265 .671 1.723
Competency 21 Equal variances assumed 45.369 .000 5.323 114 .000 1.623 .305 1.019 2.227
Equal variances not assumed 5.506 100.817 .000 1.623 .295 1.038 2.208
Competency 22 Equal variances assumed 18.603 .000 5.481 114 .000 1.565 .286 .999 2.131
Equal variances not assumed 5.617 108.604 .000 1.565 .279 1.013 2.117
Competency 23 Equal variances assumed 35.624 .000 4.743 113 .000 1.445 .305 .841 2.048
Equal variances not assumed 4.883 107.827 .000 1.445 .296 .858 2.031
Competency 24 Equal variances assumed 33.856 .000 4.317 114 .000 1.208 .280 .654 1.763
Equal variances not assumed 4.464 101.232 .000 1.208 .271 .671 1.746
Note. Statistical significance is < .05.
Tables 71 and 72 show the results of the analyses on the automation techniques questions
for RNAV; however, there are no significant results. There will be no further consideration of
these findings.

May 25, 2010 Version 1.0
82
Table 71. Group Statistics for Automation Techniques with RNAV
RNAV N Mean Std. Deviation Std. Error Mean
Techniques 25 1 53 4.04 .960 .132
2 62 4.19 .902 .115
Techniques 26 1 53 4.21 .817 .112
2 62 4.40 .712 .090
Techniques 27 1 53 4.19 .833 .114
2 62 4.42 .841 .107
Techniques 28 1 53 3.92 .917 .126
2 62 3.85 1.006 .128
Techniques 29 1 53 4.19 .878 .121
2 62 4.06 .787 .100
Table 72. Independent Samples for Automation Techniques with RNAV
Levene's Test for Equality of
Variances t-test for Equality of Means
F Sig. t df Sig.
(2-tailed) Mean
Difference Std. Error Difference
95% Confidence
Interval of the Difference
Upper Lower
Techniques 25 Equal variances assumed 1.441 .232 -.896 113 .372 -.156 .174 -.500 .189
Equal variances not assumed -.892 107.797 .374 -.156 .175 -.502 .191
Techniques 26 Equal variances assumed .392 .533 -1.372 113 .173 -.196 .143 -.478 .087
Equal variances not assumed -1.358 104.042 .177 -.196 .144 -.481 .090
Techniques 27 Equal variances assumed 1.404 .239 -1.473 113 .144 -.231 .157 -.541 .080
Equal variances not assumed -1.474 110.518 .143 -.231 .157 -.541 .079
Techniques 28 Equal variances assumed 4.422 .038 .386 113 .700 .070 .181 -.288 .428
Equal variances not assumed .389 112.515 .698 .070 .179 -.286 .425
Techniques 29 Equal variances assumed .349 .556 .800 113 .426 .124 .155 -.183 .432
Equal variances not assumed .793 105.481 .430 .124 .157 -.186 .435
Note. Statistical significance is < .05.
Tables 73 and 74 show the results of the level of automation questions for RNAV.
However, none of these results was significant and these results will not be considered further.

May 25, 2010 Version 1.0
83
Table 73. Group Statistics for Level of Automation with RNAV
RNAV N Mean Std. Deviation Std. Error Mean
Level 30 1 53 2.70 1.170 .161
2 62 2.92 1.219 .155
Level 31 1 53 3.15 1.116 .153
2 62 2.89 1.344 .171
Level 32 1 53 3.26 1.112 .153
2 62 3.11 1.189 .151
Level 33 1 51 3.33 1.108 .155
2 62 3.50 1.211 .154
Table 74. Independent Samples for Level of Automation with RNAV
Levene's Test for Equality of
Variances t-test for Equality of Means
F Sig. T df Sig.
(2-tailed) Mean
Difference Std. Error Difference
95% Confidence Interval of the
Difference
Upper Lower
Level 30 Equal variances assumed .068 .794 -.988 113 .325 -.221 .224 -.665 .222
Equal variances not assumed -.992 111.460 .324 -.221 .223 -.663 .221
Level 31 Equal variances assumed 1.360 .246 1.133 113 .259 .264 .233 -.197 .725
Equal variances not assumed 1.150 112.915 .253 .264 .229 -.191 .718
Level 32 Equal variances assumed .351 .555 .701 113 .485 .151 .216 -.276 .579
Equal variances not assumed .704 112.060 .483 .151 .215 -.274 .577
Level 33 Equal variances assumed .124 .725 -.756 111 .451 -.167 .220 -.603 .270
Equal variances not assumed -.763 109.726 .447 -.167 .218 -.600 .266
Note. Statistical significance is < .05.
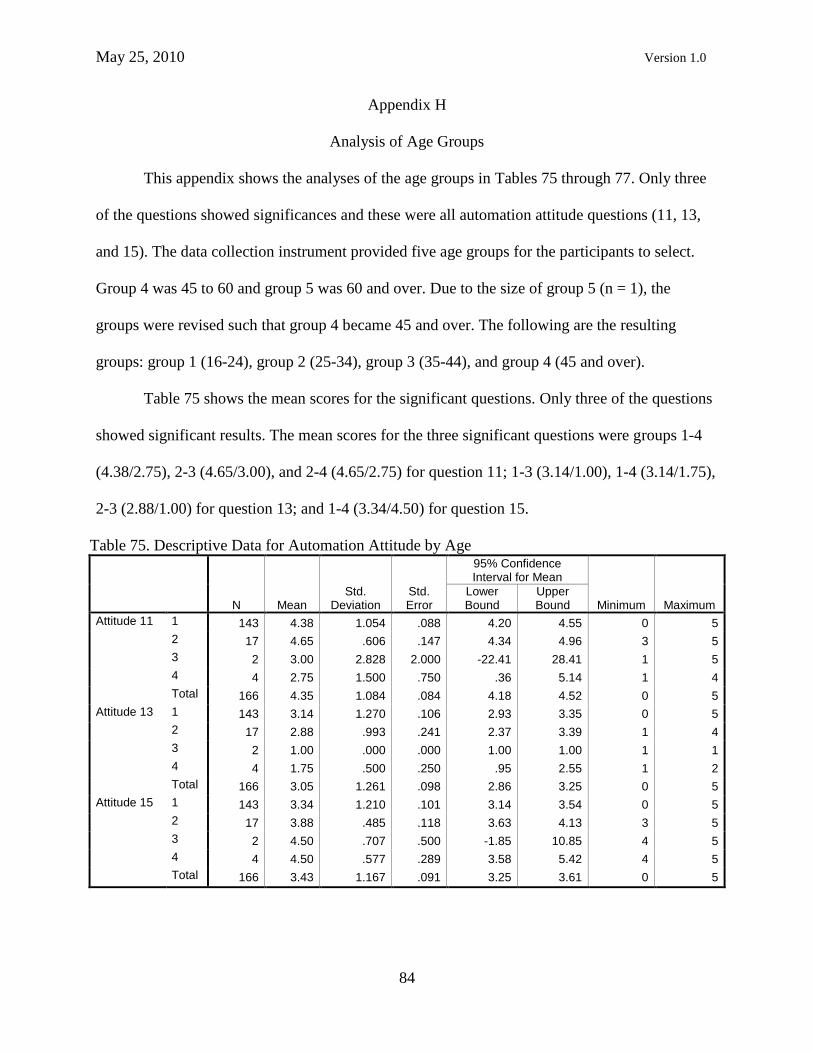
May 25, 2010 Version 1.0
84
Appendix H
Analysis of Age Groups
This appendix shows the analyses of the age groups in Tables 75 through 77. Only three
of the questions showed significances and these were all automation attitude questions (11, 13,
and 15). The data collection instrument provided five age groups for the participants to select.
Group 4 was 45 to 60 and group 5 was 60 and over. Due to the size of group 5 (n = 1), the
groups were revised such that group 4 became 45 and over. The following are the resulting
groups: group 1 (16-24), group 2 (25-34), group 3 (35-44), and group 4 (45 and over).
Table 75 shows the mean scores for the significant questions. Only three of the questions
showed significant results. The mean scores for the three significant questions were groups 1-4
(4.38/2.75), 2-3 (4.65/3.00), and 2-4 (4.65/2.75) for question 11; 1-3 (3.14/1.00), 1-4 (3.14/1.75),
2-3 (2.88/1.00) for question 13; and 1-4 (3.34/4.50) for question 15.
Table 75. Descriptive Data for Automation Attitude by Age N Mean
Std. Deviation
Std. Error
95% Confidence Interval for Mean
Minimum Maximum Lower Bound
Upper Bound
Attitude 11 1 143 4.38 1.054 .088 4.20 4.55 0 5
2 17 4.65 .606 .147 4.34 4.96 3 5
3 2 3.00 2.828 2.000 -22.41 28.41 1 5
4 4 2.75 1.500 .750 .36 5.14 1 4
Total 166 4.35 1.084 .084 4.18 4.52 0 5
Attitude 13 1 143 3.14 1.270 .106 2.93 3.35 0 5
2 17 2.88 .993 .241 2.37 3.39 1 4
3 2 1.00 .000 .000 1.00 1.00 1 1
4 4 1.75 .500 .250 .95 2.55 1 2
Total 166 3.05 1.261 .098 2.86 3.25 0 5
Attitude 15 1 143 3.34 1.210 .101 3.14 3.54 0 5
2 17 3.88 .485 .118 3.63 4.13 3 5
3 2 4.50 .707 .500 -1.85 10.85 4 5
4 4 4.50 .577 .289 3.58 5.42 4 5
Total 166 3.43 1.167 .091 3.25 3.61 0 5

May 25, 2010 Version 1.0
85
The results of the ANOVA showed the three significant automation attitude questions
were question 11 (F = 4.694 and Sig = .004), question 13 (F= 3.691 and Sig = .013), and
question 15 (F= 2.943 and Sig = .035) (see Table 76).
Table 76. ANOVA for Automation Attitude by Age
Sum of
Squares Df Mean Square F Sig.
Attitude 11 Between Groups 15.494 3 5.165 4.694 .004
Within Groups 178.241 162 1.100
Total 193.735 165
Attitude 12 Between Groups .751 3 .250 .234 .872
Within Groups 172.894 162 1.067
Total 173.645 165
Attitude 13 Between Groups 16.795 3 5.598 3.691 .013
Within Groups 245.718 162 1.517
Total 262.512 165
Attitude 14 Between Groups 8.042 3 2.681 2.570 .056
Within Groups 157.468 151 1.043
Total 165.510 154
Attitude 15 Between Groups 11.618 3 3.873 2.943 .035
Within Groups 213.153 162 1.316
Total 224.771 165
Note. Statistical significance is < .05.
Table 77 shows the Post Hoc LSD significant group were (a) groups 1-4 (Sig = .003), 2-3
(Sig = .037), and 2-4 (Sig = .001) for question 11; (b) groups 1-3 (Sig = .016), 1-4 (Sig = .027),
and 2-3 (Sig = .043) for question 13; and (c) groups 1-4 (Sig = .047) for question 15.
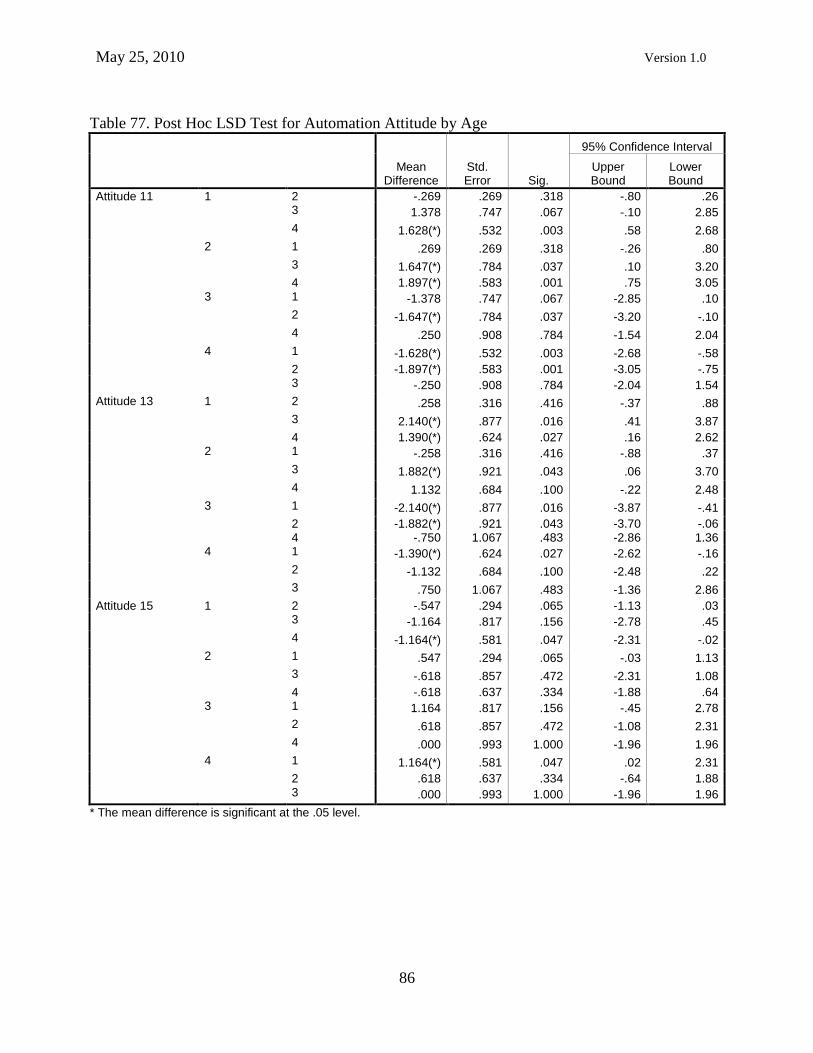
May 25, 2010 Version 1.0
86
Table 77. Post Hoc LSD Test for Automation Attitude by Age
Mean
Difference Std. Error Sig.
95% Confidence Interval
Upper Bound
Lower Bound
Attitude 11 1 2 -.269 .269 .318 -.80 .26 3 1.378 .747 .067 -.10 2.85
4 1.628(*) .532 .003 .58 2.68
2 1 .269 .269 .318 -.26 .80
3 1.647(*) .784 .037 .10 3.20
4 1.897(*) .583 .001 .75 3.05 3 1 -1.378 .747 .067 -2.85 .10
2 -1.647(*) .784 .037 -3.20 -.10
4 .250 .908 .784 -1.54 2.04
4 1 -1.628(*) .532 .003 -2.68 -.58
2 -1.897(*) .583 .001 -3.05 -.75 3 -.250 .908 .784 -2.04 1.54
Attitude 13 1 2 .258 .316 .416 -.37 .88
3 2.140(*) .877 .016 .41 3.87
4 1.390(*) .624 .027 .16 2.62 2 1 -.258 .316 .416 -.88 .37
3 1.882(*) .921 .043 .06 3.70
4 1.132 .684 .100 -.22 2.48
3 1 -2.140(*) .877 .016 -3.87 -.41
2 -1.882(*) .921 .043 -3.70 -.06 4 -.750 1.067 .483 -2.86 1.36 4 1 -1.390(*) .624 .027 -2.62 -.16
2 -1.132 .684 .100 -2.48 .22
3 .750 1.067 .483 -1.36 2.86
Attitude 15 1 2 -.547 .294 .065 -1.13 .03 3 -1.164 .817 .156 -2.78 .45
4 -1.164(*) .581 .047 -2.31 -.02
2 1 .547 .294 .065 -.03 1.13
3 -.618 .857 .472 -2.31 1.08
4 -.618 .637 .334 -1.88 .64 3 1 1.164 .817 .156 -.45 2.78
2 .618 .857 .472 -1.08 2.31
4 .000 .993 1.000 -1.96 1.96
4 1 1.164(*) .581 .047 .02 2.31
2 .618 .637 .334 -.64 1.88 3 .000 .993 1.000 -1.96 1.96
* The mean difference is significant at the .05 level.

May 25, 2010 Version 1.0
87
Appendix I
Analysis of Flight Hours
This appendix shows the results of the ANOVA for the various flight experience groups.
The current flight experience (flight hours) was divided into six groups (a) group 1 (0 to 200), (b)
group 2 (200 to 500), (c) group 3 (500 to 1,000), (d) group 4 (1,000 to 1,500), (e) group 5 (1,500
to 2,500, and (f) group 6 (over 2,500 hours).
Three of the automation attitude questions had significant differences between groups,
questions 11 (Sig = .010), 13 (Sig = .008), and 14 (Sig = .009) (see Table 79).
Table 78. Descriptive Data for Automation Attitude by Flight Hour
N Mean
Std. Deviation
Std. Error
95% Confidence Interval for Mean
Minimum Maximum Lower Bound Upper Bound
Attitude 11 1 91 4.27 1.174 .123 4.03 4.52 0 5
2 55 4.60 .655 .088 4.42 4.78 2 5
3 8 4.38 1.408 .498 3.20 5.55 1 5
4 5 4.80 .447 .200 4.24 5.36 4 5
6 7 3.14 1.574 .595 1.69 4.60 1 5
Total 166 4.36 1.079 .084 4.19 4.52 0 5
Attitude 13 1 91 3.22 1.323 .139 2.94 3.50 0 5
2 55 3.13 1.106 .149 2.83 3.43 1 5
3 8 2.50 1.309 .463 1.41 3.59 1 5
4 5 2.20 1.095 .490 .84 3.56 1 4
6 7 1.71 .488 .184 1.26 2.17 1 2
Total 166 3.06 1.263 .098 2.87 3.25 0 5
Attitude 14 1 81 2.48 1.119 .124 2.23 2.73 0 5
2 54 2.24 .910 .124 1.99 2.49 1 5
3 8 1.50 .535 .189 1.05 1.95 1 2
4 5 1.60 .548 .245 .92 2.28 1 2
6 7 1.57 .787 .297 .84 2.30 1 3
Total 155 2.28 1.035 .083 2.11 2.44 0 5
The Post Hoc LSD test showed (a) question 11 had significant differences between group
means for Groups 1-6 (Sig = .007, means = 4.27/3.14), Groups 2-6 (Sig = .001, means = 4.60/
3.14), Groups 3-6 (Sig = .024, means = 4.38/ 3.14), and Groups 4-6 (Sig = .008, means = 4.80/
3.14); (b) question 13 had significant differences for Groups 1-6 (Sig = .002, means = 3.22/1.71)

May 25, 2010 Version 1.0
88
and Groups 2-6 (Sig =.005, means = 3.13/1.71), and (c) question 14 had significant differences
for Groups 1-3 (Sig = .009, means = 2.48/1.50) and Groups 1-6 (Sig =.023, means = 2.48/1.57)
(see Table 78).
Table 79. ANOVA for Automation Attitude by Flight Hour
Sum of Squares df Mean Square F Sig.
Attitude 11 Between Groups 15.166 4 3.792 3.451 .010
Within Groups 176.864 161 1.099
Total 192.030 165
Attitude 12 Between Groups 4.309 4 1.077 1.029 .394
Within Groups 168.511 161 1.047
Total 172.819 165
Attitude 13 Between Groups 21.456 4 5.364 3.569 .008
Within Groups 241.942 161 1.503
Total 263.398 165
Attitude 14 Between Groups 14.064 4 3.516 3.493 .009
Within Groups 151.007 150 1.007
Total 165.071 154
Attitude 15 Between Groups 8.402 4 2.100 1.562 .187
Within Groups 216.496 161 1.345
Total 224.898 165
Note. Statistical significance is < .05.
Table 80 shows the group means for question 18. Question 18 is the only flight hour
automation trust question that showed a significant differences between the means on ANOVA
(Sig = .000) (see Table 81). A Post Hoc LSD analysis showed significant differences between
Table 80. Descriptive Data for Automation Trust by Flight Hour N Mean
Std. Deviation
Std. Error
95% Confidence Interval for Mean
Minimum Maximum Lower Bound
Upper Bound
Trust 18 1 91 2.69 1.736 .182 2.33 3.05 0 5
2 55 4.04 1.105 .149 3.74 4.34 0 5
3 8 4.75 .463 .164 4.36 5.14 4 5
4 5 4.40 .548 .245 3.72 5.08 4 5
6 7 4.43 .535 .202 3.93 4.92 4 5
Total 166 3.36 1.626 .126 3.11 3.61 0 5

May 25, 2010 Version 1.0
89
group means for Groups 1-2 (Sig = .000, means = 2.69/4.04), Groups 1-3 (Sig = .000, means =
2.69/ 4.75), Groups 1-4 (Sig = .012, means = 2.69/ 4.04), and Groups 1-6 (Sig = .003, means =
2.69/4.4 3) for question 18 (see Table 80 for group means).
Table 81. ANOVA for Automation Trust by Flight Hour
Sum of
Squares df Mean Square F Sig.
Trust 16 Between Groups 6.318 4 1.579 1.005 .407
Within Groups 253.031 161 1.572
Total 259.349 165
Trust 17 Between Groups 11.789 4 2.947 2.173 .074
Within Groups 218.355 161 1.356
Total 230.145 165
Trust 18 Between Groups 94.587 4 23.647 11.141 .000
Within Groups 341.726 161 2.123
Total 436.313 165
Trust 19 Between Groups 2.148 4 .537 .249 .910
Within Groups 346.702 161 2.153
Total 348.849 165
Note. Statistical significance is < .05.
All five of the flight hour automation competency questions had significant differences
between groups on the ANOVA (a) question 20 (Sig = .000), question 21 (Sig = .000), question
22 (Sig = .000), question 23 (Sig = .000), and question 24 (Sig = .000) (see Table 83). Post Hoc
LSD test showed (a) question 20 had significant differences between group means for Groups 1-
2 (Sig = .000, means = 2.49/3.53), Groups 1-3 (Sig = .000, means = 2.49/ 4.63), Groups 1-4 (Sig
= .001, means = 2.49/4.80), and Groups 2-3 (Sig = .043, means = 3.53/4.63); (b) question 21 had
significant differences between group means for Groups 1-2 (Sig = .000, means = 2.46/4.13),
Groups 1-3 (Sig = .000, means = 2.46/ 4.88), Groups 1-4 (Sig = .001, means = 2.46/4.80), and
Groups 1-6 (Sig = .012, means = 2.46/4.00); (c) question 22 had significant differences between
group means for Groups 1-2 (Sig = .000, means = 2.09/ 3.38), Groups 1-3 (Sig = .000, means =
2.09/ 4.50), Groups 1-4 (Sig = .000, means = 2.09/4.80), Groups 1-6 (Sig = .010, means =
2.09/3.57), Groups 2-3 (Sig = .044, means = 3.38/4.80), Groups 2-4 (Sig = .039, means =

May 25, 2010 Version 1.0
90
3.38/4.50); (d) question 23 had significant differences between group means for Groups 1-2 (Sig
= .000, means = 2.00/ 3.48), Groups 1-3 (Sig = .016, means = 2.00/ 3.38), Groups 1-4 (Sig =
.000, means = 2.00/4.60), and Groups 4-6 (sig =.011, means = 4.60/2.29); and (e) question 24
had significant differences between group means for Groups 1-2 (Sig = .000, means = 2.44/
3.72), Groups 1-3 (Sig = .002, means = 2.44/ 4.13), Groups 1-4 (Sig = .000, means = 2.44/4.80),
and Groups 1-6 (sig =.024, means = 2.44/3.71).
Table 82. Descriptive Data for Automation Competency by Flight Hours N Mean
Std. Deviation
Std. Error
95% Confidence Interval for Mean
Minimum Maximum Lower Bound
Upper Bound
Competency 20 1 91 2.49 1.682 .176 2.14 2.84 0 5
2 55 3.53 .997 .134 3.26 3.80 1 5
3 8 4.63 .518 .183 4.19 5.06 4 5
4 5 4.80 .447 .200 4.24 5.36 4 5
6 7 3.43 1.512 .571 2.03 4.83 0 4
Total 166 3.05 1.560 .121 2.81 3.29 0 5
Competency 21 1 87 2.46 1.829 .196 2.07 2.85 0 5
2 55 4.13 1.123 .151 3.82 4.43 0 5
3 8 4.88 .354 .125 4.58 5.17 4 5
4 5 4.80 .447 .200 4.24 5.36 4 5
6 7 4.00 1.826 .690 2.31 5.69 0 5
Total 162 3.28 1.781 .140 3.01 3.56 0 5
Competency 22 1 90 2.09 1.626 .171 1.75 2.43 0 5
2 55 3.38 1.254 .169 3.04 3.72 0 5
3 8 4.50 .535 .189 4.05 4.95 4 5
4 5 4.80 .447 .200 4.24 5.36 4 5
6 7 3.57 1.618 .612 2.07 5.07 0 5
Total 165 2.78 1.657 .129 2.53 3.04 0 5
Competency 23 1 91 2.00 1.745 .183 1.64 2.36 0 5
2 54 3.48 1.209 .165 3.15 3.81 0 5
3 8 3.38 1.302 .460 2.29 4.46 1 5
4 5 4.60 .548 .245 3.92 5.28 4 5
6 7 2.29 1.496 .565 .90 3.67 0 4
Total 165 2.64 1.707 .133 2.38 2.90 0 5
Competency 24 1 91 2.44 1.721 .180 2.08 2.80 0 5
2 54 3.72 .998 .136 3.45 3.99 0 5
3 8 4.13 .835 .295 3.43 4.82 3 5
4 5 4.80 .447 .200 4.24 5.36 4 5
6 7 3.71 .488 .184 3.26 4.17 3 4
Total 165 3.07 1.586 .123 2.82 3.31 0 5
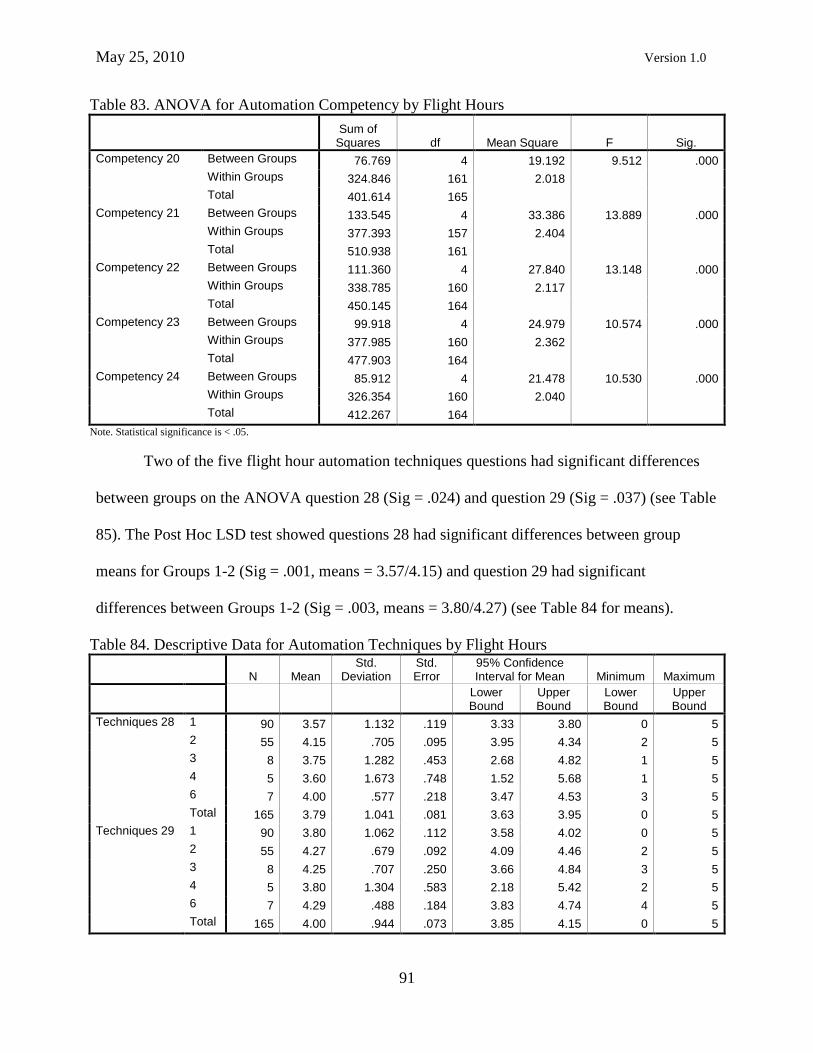
May 25, 2010 Version 1.0
91
Table 83. ANOVA for Automation Competency by Flight Hours
Sum of
Squares df Mean Square F Sig.
Competency 20 Between Groups 76.769 4 19.192 9.512 .000
Within Groups 324.846 161 2.018
Total 401.614 165
Competency 21 Between Groups 133.545 4 33.386 13.889 .000
Within Groups 377.393 157 2.404
Total 510.938 161
Competency 22 Between Groups 111.360 4 27.840 13.148 .000
Within Groups 338.785 160 2.117
Total 450.145 164
Competency 23 Between Groups 99.918 4 24.979 10.574 .000
Within Groups 377.985 160 2.362
Total 477.903 164
Competency 24 Between Groups 85.912 4 21.478 10.530 .000
Within Groups 326.354 160 2.040
Total 412.267 164
Note. Statistical significance is < .05.
Two of the five flight hour automation techniques questions had significant differences
between groups on the ANOVA question 28 (Sig = .024) and question 29 (Sig = .037) (see Table
85). The Post Hoc LSD test showed questions 28 had significant differences between group
means for Groups 1-2 (Sig = .001, means = 3.57/4.15) and question 29 had significant
differences between Groups 1-2 (Sig = .003, means = 3.80/4.27) (see Table 84 for means).
Table 84. Descriptive Data for Automation Techniques by Flight Hours
N Mean Std.
Deviation Std. Error
95% Confidence Interval for Mean Minimum Maximum
Lower Bound
Upper Bound
Lower Bound
Upper Bound
Techniques 28 1 90 3.57 1.132 .119 3.33 3.80 0 5
2 55 4.15 .705 .095 3.95 4.34 2 5
3 8 3.75 1.282 .453 2.68 4.82 1 5
4 5 3.60 1.673 .748 1.52 5.68 1 5
6 7 4.00 .577 .218 3.47 4.53 3 5
Total 165 3.79 1.041 .081 3.63 3.95 0 5
Techniques 29 1 90 3.80 1.062 .112 3.58 4.02 0 5
2 55 4.27 .679 .092 4.09 4.46 2 5
3 8 4.25 .707 .250 3.66 4.84 3 5
4 5 3.80 1.304 .583 2.18 5.42 2 5
6 7 4.29 .488 .184 3.83 4.74 4 5
Total 165 4.00 .944 .073 3.85 4.15 0 5

May 25, 2010 Version 1.0
92
Table 85. ANOVA for Automation Techniques by Flight Hours
Sum of
Squares df Mean Square F Sig.
Techniques 25 Between Groups 6.537 4 1.634 1.520 .199
Within Groups 171.972 160 1.075
Total 178.509 164
Techniques 26 Between Groups 7.461 4 1.865 2.086 .085
Within Groups 143.048 160 .894
Total 150.509 164
Techniques 27 Between Groups 2.830 4 .708 .697 .595
Within Groups 162.382 160 1.015
Total 165.212 164
Techniques 28 Between Groups 11.939 4 2.985 2.883 .024
Within Groups 165.636 160 1.035
Total 177.576 164
Techniques 29 Between Groups 8.962 4 2.241 2.616 .037
Within Groups 137.038 160 .856
Total 146.000 164
Note. Statistical significance is < .05.
None of the flight hour level of automation questions was significant. Consequently, this
analysis is not included in the study.

May 25, 2010 Version 1.0
93
Appendix J
Levels of Automation Scenario
Scenario
This mission is one of four that measures pilot performance while using various levels of
automation installed on the SR22. In Scenario 1, you are to use the automation. That is, the flight
plan is to be loaded into the GPS. The autopilot is to be engaged as soon as possible after takeoff
and it is to be used through short final. See aircraft performance information listed below. In
Scenario 2, you will program (load the flight plan in the GPS) into the GPS but you will not use
the autopilot. In Scenario 3, you will not load the flight plan but the autopilot throughout the
flight as in Scenario 1. Finally, Scenario 4, you will not load the flight plan and will not use the
autopilot.
Scenario: You are to fly to Fargo and pick up a passenger, then fly to St Paul, MN (St Paul
Downtown airport) to attend a Vikings game. Your friend is your best friend and is an avid
Vikings fan. The game starts at 2:00 pm on January 10th
, you will need to arrive in St Paul at
11:00 am to make it to the game on time, you plan to spend the night in St Paul, and return on the
11th
.
Profile: This is a day IFR flight, on January 10th,
from KGFK (Grand Forks International) to
KFAR (Hector Field) in the Cirrus SR22 aircraft. The second leg is from KFAR to St Paul. As
much as possible, make all decisions as though this is a real flight, in real weather conditions.
You are an experienced instrument pilot with over 500 hours in your SR22, you have recently
completed an instrument proficiency check, and have completed 5 takeoffs and landings (three at
night) within the last two weeks.
Weather: In the Red River Valley is generally 1000 ft ceilings with ¾ mile visibility with
moderate snow. No forecasted or reported icing.
Alternate airport: Jamestown Regional Airport with forecasted weather 3000/2 with light snow.
NOTAMS: Nothing significant
Filed Clearance: KGFK direct JOCOR V181 FAR direct KFAR at 5000 ft.

May 25, 2010 Version 1.0
94
Aircraft performance:
Rotate at 70 knots
Climb with full power at 78 to 82 (VX) knots, with an obstacle; 95 to 101 (VY) knots, no
obstacle; or cruise climb 110 to 120 knots (transition when desired)
Cruise at 55% to 85% power (at 5,000 feet use 81%, 20.4 GPH, 169 - 170 knots)
Approach:
0% flaps – 90 to 95 knots
50% flaps – 85 to 90 knots (27 – 31% power) (maximum flap setting with
autopilot)
100% flaps – 80 knots (28% power)
Autopilot can be engaged at 400 feet AGL and disengaged at 50 feet AGL. (maximum
flaps with the autopilot on is 50%)
Flap speeds:
50% – 119 knots maximum
100% – 104 knots maximum.