Embed Size (px)
Citation preview
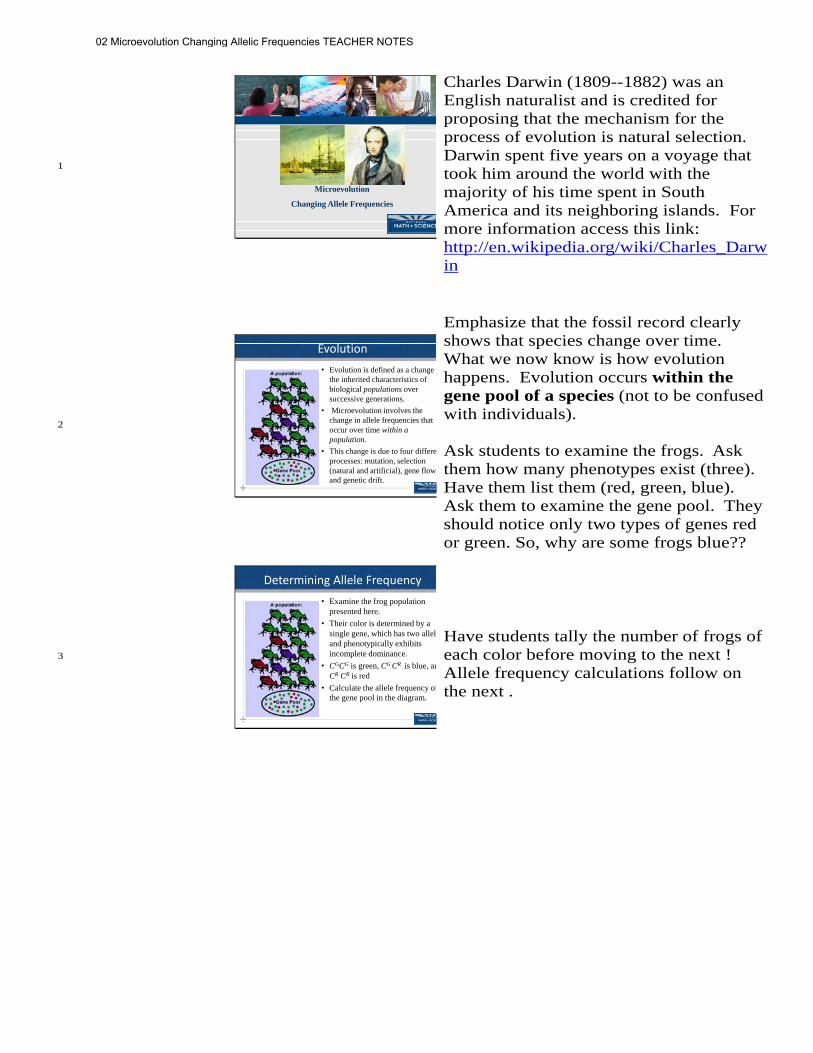
1
Microevolution
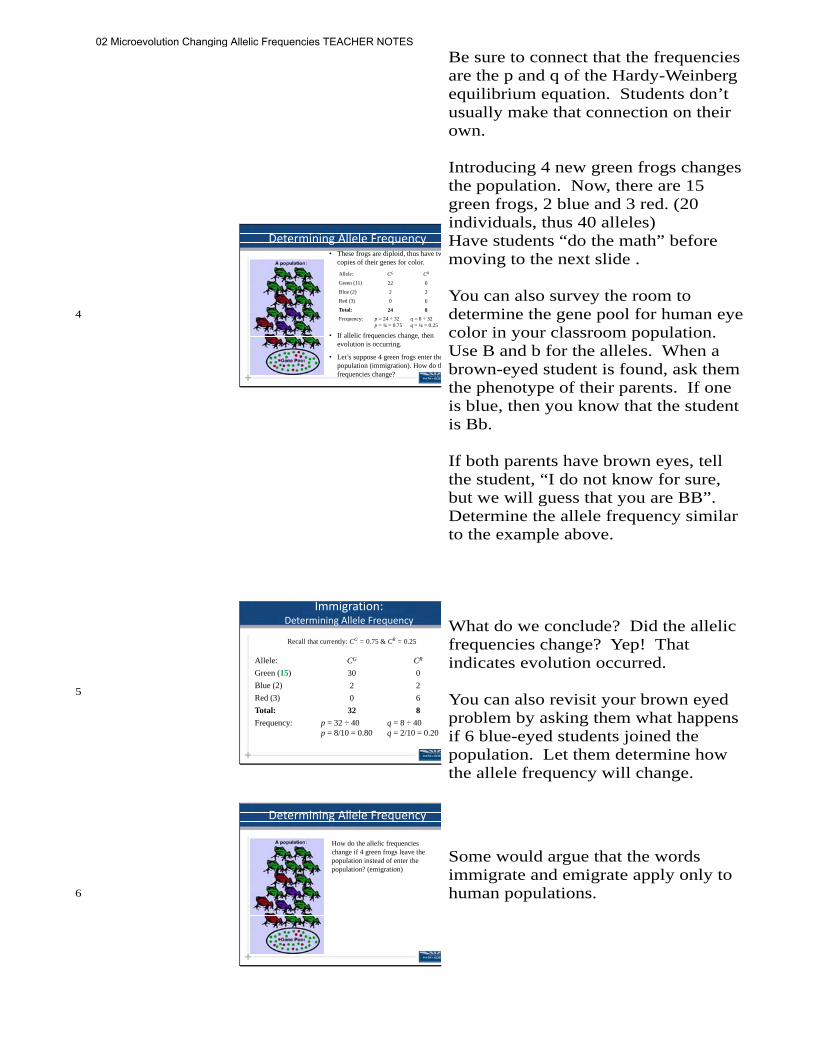
Changing Allele Frequencies
Charles Darwin (1809--1882) was an English naturalist and is credited for proposing that the mechanism for the process of evolution is natural selection. Darwin spent five years on a voyage that took him around the world with the majority of his time spent in South America and its neighboring islands. For more information access this link: http://en.wikipedia.org/wiki/Charles_Darwin
2
Evolution• Evolution is defined as a change i
the inherited characteristics of biological populations over successive generations.
• Microevolution involves the change in allele frequencies that occur over time within a population.
• This change is due to four differeprocesses: mutation, selection (natural and artificial), gene flow,and genetic drift.
2
Emphasize that the fossil record clearly shows that species change over time. What we now know is how evolution happens. Evolution occurs within the gene pool of a species (not to be confused with individuals). Ask students to examine the frogs. Ask them how many phenotypes exist (three). Have them list them (red, green, blue). Ask them to examine the gene pool. They should notice only two types of genes red or green. So, why are some frogs blue??
3
Determining Allele Frequency• Examine the frog population
presented here.
• Their color is determined by a single gene, which has two alleleand phenotypically exhibits incomplete dominance.
• CGCG is green, CG CR is blue, anCR CR is red
• Calculate the allele frequency ofthe gene pool in the diagram.
3
Have students tally the number of frogs of each color before moving to the next ! Allele frequency calculations follow on the next .
02 Microevolution Changing Allelic Frequencies TEACHER NOTES
4
• These frogs are diploid, thus have twcopies of their genes for color.
• If allelic frequencies change, then evolution is occurring.
• Let’s suppose 4 green frogs enter thepopulation (immigration). How do thfrequencies change?
4
Determining Allele Frequency
Allele: CG CR
Green (11) 22 0
Blue (2) 2 2
Red (3) 0 6
Total: 24 8
Frequency: p = 24 ÷ 32p = ¾ = 0.75
q = 8 ÷ 32q = ¼ = 0.25
Be sure to connect that the frequencies are the p and q of the Hardy-Weinberg equilibrium equation. Students don’t usually make that connection on their own. Introducing 4 new green frogs changes the population. Now, there are 15 green frogs, 2 blue and 3 red. (20 individuals, thus 40 alleles) Have students “do the math” before moving to the next slide . You can also survey the room to determine the gene pool for human eye color in your classroom population. Use B and b for the alleles. When a brown-eyed student is found, ask them the phenotype of their parents. If one is blue, then you know that the student is Bb. If both parents have brown eyes, tell the student, “I do not know for sure, but we will guess that you are BB”. Determine the allele frequency similar to the example above.
5
Immigration: Determining Allele Frequency
5
Recall that currently: CG = 0.75 & CR = 0.25
Allele: CG CR
Green (15) 30 0
Blue (2) 2 2
Red (3) 0 6
Total: 32 8
Frequency: p = 32 ÷ 40p = 8/10 = 0.80
q = 8 ÷ 40q = 2/10 = 0.20
What do we conclude? Did the allelic frequencies change? Yep! That indicates evolution occurred. You can also revisit your brown eyed problem by asking them what happens if 6 blue-eyed students joined the population. Let them determine how the allele frequency will change.
6
Determining Allele Frequency
6
How do the allelic frequencies change if 4 green frogs leave the population instead of enter the population? (emigration)
Some would argue that the words immigrate and emigrate apply only to human populations.
02 Microevolution Changing Allelic Frequencies TEACHER NOTES

7
Emigration:Determining Allele Frequency
7
Recall that originally: CG = 0.75 & CR = 0.25
Allele: CG CR
Green (7) 14 0
Blue (2) 2 2
Red (3) 0 6
Total: 16 8
Frequency: p = 16 ÷ 24p = 2/3 = 0.67
q = 8 ÷ 24q = 1/3 = 0.33
What do we conclude? Did the allelic frequencies change? Yep! That indicates evolution occurred. Emphasize that allele frequencies can be changed by gene flow OR emigration and immigration occurring. Now, what would happen if four green frogs joined the population but the population was twice as large as the original population?
8
Impact On Small vs. Large Population
8
Before 4 frogs joined After 4 frogs joined
Compare the effect on the small population to 4 frogs joining a much larger population.
The next few s are investigating the effect of large versus small sample size. What happens to the allelic frequencies when the frog population is twice as large. Have students tally the frogs prior to moving to the next . Additionally, you can ask the students what happens to the allele frequency in the classroom population if the six blue-eyed students joined the school gene pool instead of just the class gene pool. (It would not have as great an effect since the school population is much larger than the class population.)
9
Impact Large Population
9
Allele: CG CR
Green (22) 44 0
Blue (4) 4 4
Red (6) 0 12
Total: 48 16
Frequency: p = 48 ÷ 64p = 3/4= 0.75
q = 16 ÷ 64q = 1/4= 0.25
Allele: CG CR
Green (26) 52 0
Blue (4) 4 4
Red (6) 0 12
Total: 56 16
Frequency: p = 5 ÷ 72p = 56/72= 0.78
q = 16 ÷q = 16/7= 0.22
Before 4 frogs joined After 4 green frogs joined
larger population larger population
There is a change in allelic frequency, but it is a relatively small change (0.02). Evolution does still occur.
10
Impact Small Population
10
Allele: CG CR
Green (11) 22 0
Blue (2) 2 2
Red (3) 0 6
Total: 24 8
Frequency: p = 24 ÷ 32p = ¾ = 0.75
q = 8 ÷ 32q = ¼ = 0.25
Allele: CG CR
Green (15) 30 0
Blue (2) 2 2
Red (3) 0 6
Total: 32 8
Frequency: p = 32 ÷ 40p = 8/10 = 0.80
q = 8 ÷ 40q = 2/10 =
Before 4 frogs joined After 4 green frogs joined
In both cases the allele frequency for CG increases but it has a bigger impact on the smaller population.
There is a more dramatic effect on allelic frequency upon addition of four green frogs to the small population. The change in frequency is 0.05 for the small population compared to 0.02 for the larger population which is more than twice as much!
02 Microevolution Changing Allelic Frequencies TEACHER NOTES

11
Genetic Drift
11
Small populations can experience changes in allele frequencies more dramatically than large populations. In very large populationthe effect can be insignificant. Also in small populations genes canbe lost more easily. When there is only one allele left for a particular gene in a gene pool, that gene is said to be fixed , thus there is no genetic diversity.
The diagram is showing how genes can become fixed in gene pool.
12
Genetic Drift• Genetic drift or allelic drift is the change in the
frequency of a gene variant (allele) in a population due to random sampling in the absence of a selection pressure.
• Genetic drift is important when populations are dramatically reduced. Genes are lost and deleterious genes can also increase.
• When there are few copies of an allele, the effect of genetic drift is larger, and when there are many copies the effect is smaller.
12
Populations that experience a bottleneck effect or a founder effect are usually more susceptible to genetic drift. Genetic drift can lead to the existence of completely separate subpopulations (genetically). However, it is important to note that even large populations can experience genetic drift. This is relatively new in more recent books.
13
Genetic Drift• Genetic drift can be most
profound in populations that are dramatically reduced (bottle neck populations) usually due to some environmental catastrophe.
• Also genetic drift occurs when a small population arrives at a new habitat such as an island.
13
Populations that experience a bottleneck effect or a founder effect are usually more susceptible to genetic drift. Sometimes it’s a social pressure among humans in particular. The instances of hemophilia among the British royal family for instance. “Pressure” was (and in some cases still is) placed on members of the Royal Family to marry only Royals. The result is that genes become magnified since there is a reduction in genetic diversity.
14
Bottleneck Example
14
In 1900, the population of praichickens in Illinois was 100 million but by 1995, the population was reduced to around 50 in Jasper County duto over hunting and habitat destruction which caused the bottleneck to occur.
A comparison of the DNA fromthe 1995 bird population indicated the birds had lost moof their genetic diversity.
Emphasize that a reduction in genetic diversity has a negative impact on offspring. For example, most deleterious alleles like cystic fibrosis are recessive. If these negative genes are ones that are left in the reduced gene pool then it increases the probability that they will be expressed.
02 Microevolution Changing Allelic Frequencies TEACHER NOTES

15
Bottleneck Example
• Additionally, less than 50%of the eggs laid actually hatched in 1993.
• Populations outside IL do not experience the egg hatching problem.
• Bottleneck populations generally experience a severe reduction in genetic diversity within the population.
15
16
Bottleneck Example
16
Genetic drift in smaller populations produces changes in allele frequency (evolution) whether it is due to a bottleneck or founder effect. A greater change of allele frequencies due to gene flow is evident insmaller populations. As populations rebound in number, their genetdiversity is still limited compared to the diversity that existed beforthe bottleneck event.
Organism Year/Population Current Population
Northern Elephant Seal 1890/30 Thousands
Golden Hamster 1930/Single litter Millions
American Bison 1890/750 360,000
Wisent European Bison 1900’s/12 3,000
17
Founder Effect
• The founder effect is the loss of genetic variation that occurs when a new population is established by a very small number of individuals from a larger population and is a special case of genetic drift.
• Founder effects are very hard to study!
17
The new, yet small population colonizes the area.
18
Founder Effect
• Biologist got their chance after a hurricane wiped out all thelizard species on certain islands in the Bahamas, scientists rpopulated the small islands with two lizard pairs, one havinlong limbs and one having short limbs.
18
http://io9.com/the-founder-effect/
02 Microevolution Changing Allelic Frequencies TEACHER NOTES

19
Founder Effect
• Before the hurricane, these islands supported populations of a Caribbean lizard, the brown anole, Anolis sagrei.
• After the hurricane, seven of the islands were thoroughly searched. No lizards were found.
19
http://io9.com/the-founder-effect/
20
Founder Effect• In May 2005, the researchers
randomly selected one male and one female brown anole from lizards collected on a nearby larger island to found new anole populations on seven small islands.
• They then sat back and watched how those lizards evolved to get an up-close look at the Founder Effect.
20
21
Founder Effect• During the next four years, the researchers repeatedly
sampled lizards from the source island, from the sevenexperimental founder islands, and from 12 nearby islands that served as a control.
• The team found that all lizard populations adapted to their environment, yet retained characteristics from thefounders.
21
22
A Human Founder Effect Example• The Amish community was found
by a small number of colonist.
• The founding group possessed thegene for polydactyly (extra toes ofingers).
• The Amish population has increasin size but has remained geneticalisolated as few outsiders become part of the population.
• As a result polydactyly is much more frequent in the Amish community than it is in other communities.
22
Another interesting American case of the Founder Effect involves the Fugates of Troublesome Creek in Kentucky. http://www.rootsweb.ancestry.com/~kyperry3/Blue_Fugates_Troublesome_Creek.html and http://news.yahoo.com/humans-eventually-look-brazilians-140349518.html
02 Microevolution Changing Allelic Frequencies TEACHER NOTES

23
Impact of Nonrandom Mating
• Nonrandom mating also changes allele frequency.
• Let’s revisit our adorable frogs and suppose that 4 frogs migrate to a pond some distance from the main pond.
• It is likely that these 4 frogs will mate with one another, leaving the rest of the population in the main pond behind to also mate with one another.
• Nonrandom mating implies a choice of mates which ismore prevalent in animals.
23
Random mating is the exception rather than the norm. Most mating is nonrandom. Emphasize that time and space also factor into nonrandom mating. For example, pollen from Ohio is more likely to cross pollinate a neighboring tree in Ohio rather than a tree in Oregon. However, truly nonrandom mating would imply that these events would have an equal probability.
24
Two Types of Sexual Selection
• Darwin wrote:
“The sexual struggle is of two kinds; in the one it is between individuals of the same sex, generally the males, in order to drive away or kill their rivals, the females remaining passive; whilst in the other, the struggle is likewise between the individuals of the same sex, in order to excite or charm those of the opposite sexgenerally the females, which no longer remain passive, but select the more agreeable partners.”
24
25
Sexual Selection• Sexual selection of mates also
affects allele frequency.
• The peacock provides a particularly well known example of intersexual selection, where ornate males compete to be chosen by females.
• The result is a stunning feathered display, which is large and unwieldy enough to pose a significant survival disadvantage.
25
Emphasize that in addition to a flashy appearance males often have vocalizations and compete with other males to attract females.
26
Sexual Selection
• Female birds of many species choose the male.
• Males that are “showier” will better attract females.
• These males have a selective advantage even though they are more susceptible to predators.
26
Emphasize a gene is determined beneficial if it gives an organism an advantage which depends entirely on the environment.
02 Microevolution Changing Allelic Frequencies TEACHER NOTES

27
Sexual Selection• Females that are drab, blend in to their
surroundings and as a result, avoid predators which giving females a survival advantage.
• This illustrates that the importance of mating with the correct male outweighs the importance of being preyed upon.
• Sexual selection can lead to sexual dimorphism where there is a distinct difference between males and females.
27
28
Hardy-Weinberg Equilibrium
28
So, when is there no change in the allele frequency? When the population is said to be in Hardy-Weinberg Equilibrium, thus no evolutiis occurring.
FIVE Conditions of Hardy-Weinberg Equilibrium:
1. Population must be large so chance is not a factor. (No genetic drift)
2. Population must be isolated to prevent gene flow. (No immigration emigration)
3. No mutations occur.
4. Mating is completely random with respect to time and space.
5. Every offspring has an equal chance of survival without regard to phenotypes. (No natural selection)
Godfrey Hardy (1877-1947), an English mathematician, and Wilhelm Weinberg (1862-1937), a German physician, both found a way to link genetic probability and evolution the early 20th century. Hardy and Weinberg independently worked on finding a mathematical equation to explain the link between genetic equilibrium and evolution in a population of species.
29
Hardy-Weinberg Equilibrium• Condition #1 can be met. It is important to have large
populations in order that the loss or addition of genes is not a factor. By contrast, small populations experience genetic drift. Additionally, if a small population moves to another area or becomes isolated, the gene pool will be different from the original gene pool. And the founder effect comes into play.
• Condition #2 can only be met if the population is isolated. If individuals immigrate or emigrate from the population, the allefrequencies change and evolution occurs.
• Condition #3 cannot ever be met since mutations always occur.Thus mutational equilibrium can never be met.
29
This and the next slide explain that three of the five conditions for Hardy-Weinberg can never be met, therefore evolution occurs within populations.
30
Hardy-Weinberg Equilibrium
30
Condition #4 can never be met. Mating is never random. Pollen from an apple tree in Ohio is more likely to pollinate a tree in Ohio than one in Washington state.
Condition #5 can never be met. There will always be variation. Variation can help organisms survive longer and/or reproduce more effectively.
Since 3 out of the 5 H-W conditions can never be met, evolution DOES occur and allele frequencies do indeed change.
02 Microevolution Changing Allelic Frequencies TEACHER NOTES

31
Applying the H-W Model
31
Here we go with our frogs again! Let’s suppose that in a population of 100 frogs36 were green (CGCG), 48 were blue (CGCR) and 16 were red (CRCR) and there was total random mating.
Thus, it can be assumed that 60% of all the gametes (eggs and sperm) should
carry the CG allele and 40% of the gametes should carry the CR allele.
Allele: CG CR
Green (36) 72 0
Blue (48) 48 48
Red (16) 0 32
Total: 120 80
Frequency: p = 120 ÷ 200p = 3/5 = 0.60
q = 80 ÷ 200q = 2/5 = 0.40
The next three slides derive the Hardy-Weinberg equilibrium.
32
Applying the H-W Model
32
A population Punnett square is shown above. It indicates that the next generation shouldhave the following offspring distribution: 36% green (CGCG), 48% blue(CGCR), 16% red(CRCR). When the second generation gets ready to reproduce, the results will be the samebefore.
CG 0.60 CR 0.40
CG 0.60 CGCG
0.36CGCR
0.24
CR 0.40 CGCR
0.24CRCR
0.16
Allele: CG CR
Green (36) 72 0
Blue (48) 48 48
Red (16) 0 32
Total: 120 80
Frequency: p = 120 ÷ 200p = 3/5 = 0.60
q = 80 ÷ 200q = 2/5 = 0.40
As long as the allelic frequencies are remaining constant, there is no evolution of the population.
33
Applying the H-W Model
33
So, the allele frequency remains at 0.40 CG and 0.60 CR thus no evolution is taking place.
Let’s suppose that there is an environmental change that makes red frogs more obvious to predators. How is the population affected and now the population consists of 36 green, 48 blue, and 6 red frogs?
Now, allele frequencies are changing and there is an advantage to being green or blue but NOT red. Evolution is indeed occurring.
Allele: CG CR
Green (36) 72 0
Blue (48) 48 48
Red (6) 0 12
Total: 120 60
Frequency: p = 120 ÷ 180p = 2/3 = 0.66
q = 60 ÷ 180q = 1/3 = 0.33
Whoever said “It isn’t easy being green?”
34
Deriving the H-W Model
34
Examine this Punnett square again. If p represents the allele frequency of CG (dominantand q represents the allele frequency of CR (recessive) then two equations for a population in Hardy-Weinberg equilibrium can be derived where the following genotypes are represented by:
CGCG = p2 CRCR = q2 CGCR = 2pq
Mathematically then p + q = 0.60 + 0.40 = 1 (1st H-W equation)
So, the Punnett square effectively crossed (p + q ) × (p + q ) which gives
p2 + 2pq + q2 = 1 (2nd H-W equation)
CG 0.60 CR 0.40
CG 0.60 CGCG
0.36CGCR
0.24
CR 0.40 CGCR
0.24CRCR
0.16
Ask students if they know the “FOIL” method for solving (p + q)2. FOIL stands for “first by the first, outsides, insides, second by the second.” It’s a mnemonic device math teachers use to teach binomial expansions and arrive at p2 + 2pq + q2 which equals 1 in this situation since p + q = 1, thus (p + q)2 =
12 = 1 as well, and gives this algebraic expression: p2 + 2pq + q2. It may have been a while since your last Algebra class, but it hasn’t been that long since students mastered this skill! This pair of equations along with a subsequent Chi square calculation allow us to determine if a population is in H-W equilibrium.
02 Microevolution Changing Allelic Frequencies TEACHER NOTES

35
Natural SelectionNatural Selection is the only mechanism that consistently causes adaptive evolution.
• Evolution by natural selection is a blend of chance and “sorting”.
– Chance in the context of mutations causing new genetic variations
– Sorting in the context of natural selection favoring some allelesover others
• This favoring process causes the outcome of natural selection to beanything but random!
• Natural Selection consistently increases the frequencies of alleles that provide reproductive advantage and thus leads to adaptive evolution.
36
Relative Fitness• There are animal species in which
individuals, usually males, lock horns or otherwise compete through combat for mating privileges.
• Reproductive success is usually far more subtle!
• Relative fitness is defined as the contribution an individual makes to the gene pool of the next generation relative to the contributions of other individuals.
Emphasize to students that the phrases “survival of the fittest” and “struggle for existence” are commonly used to describe natural selection, BUT they should not be taken to mean between individuals! There are reproductive advantages among animals that are passive and do not involve a form of battle: • An animal may be a better “food
gatherer”, thus has more energy to lay more eggs.
• An animal may be better camouflaged, thus lives longer and produces more offspring.
37
Three Modes of Natural Selection • Natural selection can alter the frequency distribution o
heritable traits in three ways depending on which phenotype is favored:
– Directional Selection
– Disruptive Selection
– Stabilizing Selection
The next few slides deal with a hypothetical deer mouse population with heritable variation in fur coloration from light to dark. Emphasize to students that the width of the curve corresponds to variance (numerical range of the x-axis) and the “peak” corresponds to the mean (corresponds to the numerical value on the y-axis). This type of curve goes by many names: normal distribution, bell curve, optimum, etc. When a particular trait confers an advantage to an organism in a given environment, then one would expect a change in the gene pool over time. The next slides explain the three types of selection with examples for each type illustrating how the gene pool changes.
02 Microevolution Changing Allelic Frequencies TEACHER NOTES

38
Directional Selection • Directional selection occurs when conditions favor individuals
exhibiting one extreme of a phenotypic range.
• Commonly occurs when the population’s environment changes when members of a population migrate to a new (and different) habitat.
Emphasize that the arrow symbolizes selective pressures AGAINST certain phenotypes. Ask students to interpret the “before and the after” regarding these two graphs. Ask “What’s the scoop?” They should conclude that the environment changed such that the lighter mice were selected against. Perhaps they live among dark rocks, etc. which makes it harder for them to hide from predators. Revisit the peppered moth as an example of directional selection.
39
Possible Effect of Continual Directional Selection
39
Freq
uenc
y
Freq
uenc
y
Phenotype (trait)
before after
If continued, the variance may decrease.
Freq
uenc
y
Phenotype (trait)
before after
Phenotype (trait)
before afte
Ask students to propose possible consequences of continual directional selection (extinction or speciation).
40
Disruptive or Diversifying Selection• Disruptive selection occurs when conditions favor
individuals at both extremes of a phenotypic range over individuals with intermediate phenotypes.
• The “intermediates” in the population have lower relative fitness.
40
The mice in (b) have colonized a patchy habitat made up of light and dark rocks, with the result that mice of an intermediate color are selected AGAINST as indicated by the arrow. This art is from the 8th edition of Campbell, revised art from the 9th edition has (b) labeled as “Disruptive selection”. Once again, synonyms are troublesome for students!
41
Disruptive or Diversifying Selection• Disruptive selection occurs when conditions favor
individuals at both extremes of a phenotypic range over individuals with intermediate phenotypes.
• The “intermediates” in the population have lower relative fitness.
41
The mice in (b) have colonized a patchy habitat made up of light and dark rocks, with the result that mice of an intermediate color are selected AGAINST as indicated by the arrow. This art is from the 8th edition of Campbell, revised art from the 9th edition has (b) labeled as “Disruptive selection”. Once again, synonyms are troublesome for students!
02 Microevolution Changing Allelic Frequencies TEACHER NOTES

42
Stabilizing Selection• Stabilizing selection removes extreme variants from
the population and preserves intermediate types.
• This reduces variation and tends to maintain the status quo for a particular phenotypic character.
42
Ask students to explain the significance of the shape change of the graph in (c). They should point out that the value of the mean has increased and the variance of the population has decreased. If the environment consists of rocks of an intermediate color, both light and dark mice will be selected AGAINST.
43
Sexual Selection
• A form of selection in which individuals with certain inherited characteristics are more likely than other individuals to obtain mates.
• Can result in sexual dimorphism which is a differencbetween the two sexes with regard to secondary sexuacharacteristics.
43
Ask students to identify “differences in secondary sexual characteristics”. Possible answers include: size, color, ornamentation and behavior.
44
Intrasexual vs. Intersexual Selection
• How does sexual selection operate?
• Intrasexual—selection within the same sex, individualof one sex compete directly for mates of the opposite sex. Males are famous for this!
44
Remind students that the prefix intra- means “within” as opposed to the prefix inter- which means “between” as in interstate highways that connect states. HI and AK don’t have those types of highways! Ask student to come up with examples of intrasexual selection: patrolling a group of females, male to male combat, marking a territory, etc.
45
Intrasexual vs. Intersexual Selection
• Intersexual selection (mate choice)—individuals of onsex are choosy.
• Often these are females that select mates based on theishowiness.
45
Ask student to come up with examples of showiness and its possible consequences: bright coloration—sacrifice of camouflage, mating call or song—alerting would be predators of the prey’s location, etc.
02 Microevolution Changing Allelic Frequencies TEACHER NOTES

46
Preserving Genetic Variation
• Some of the genetic variation is populations representsneutral variation, differences in DNA sequence that dnot confer a selective advantage or disadvantage.
• There are several mechanisms that counter the tendencfor directional and stabilizing selection to reduce variation:– Diploidy
– Balancing Selection
– Hererzygote Advantage
– Frequency-Dependent Selection
46
Genetic variation in a gene pool is beneficial. The question is how certain populations can maintain genetic variation. These next slides explain how genetic variation can be maintained.
47
Diploidy
• In diploid eukaryotes each organism has two copies of every gene and a considerable amount of genetic variation is hidden from selection in the form of recessive alleles.
• Often alleles are recessive and less favorable than their dominant counterparts.
• By contrast, haploid organisms express every gene that is in their genome. What you see is what you get. It reduces genetic variability.
47
48
Diploidy
• Recessive alleles persist by propagation in heterozygous individuals.
• This latent variation is exposed to natural selection only when both parents carry the same recessive allele and two copies end up in the same zygote.
• As you might expect, this happens rarely if the allelic frequency of the recessive allele is very low.
• Why is heterozygote protection of potentially negative recessive alleles important to species survival?
48
Recessive alleles might not be favored under present environmental conditions, but can still bring new benefits if the environment changes.
49
Balancing Selection• Balancing selection occurs when natural selection
maintains two or more forms in a population.
• This type of selection includes heterozygote advantageand frequency-dependent selection.
• Heterozygote advantage involves an individual who isheterozygous at a particular gene locus thus has a greater fitness than a homozygous individual.
49
Recessive alleles might not be favored under present environmental conditions, but can still bring new benefits if the environment changes.
02 Microevolution Changing Allelic Frequencies TEACHER NOTES

50
Heterozygote Advantage
• A well-studied case is that of sickle cell anemia in humans, a hereditary disease that damages red blood cells.
• Sickle cell anemia is caused by the inheritance of a variant hemoglobin gene (HgbS) from both parents.
• In these individuals, hemoglobin in red blood cells is extremely sensitive to oxygen deprivation, and this causes shorter life expectancy.
50
51
Heterozygote Advantage
• A person who inherits the sickle cell gene from one parent, and a normal hemoglobin gene (HgbA) from the other, has a normal life expectancy.
• However, these heterozygote individuals, known as carriers of the sickle cell trait, may suffer problems from time to time.
51
52
Heterozygote Advantage
• The heterozygote is resistant to the malarial parasite which kills a large number of people each year in Africa.
• There exists a balancing selection between fierce selection against homozygous sickle-cell sufferers, and selection against the standard HgbA homozygotes by malaria.
• The heterozygote has a permanent advantage (a higher fitness) wherever malaria exists. 52
53
Heterozygote Advantage
53
02 Microevolution Changing Allelic Frequencies TEACHER NOTES

54
Frequency-Dependent Selection• The fitness of a phenotype depends on how common i
is in the population.
• In positive frequency-dependent selection the fitness of a phenotype increases as it becomes more common.
• In negative frequency-dependent selection the fitness of a phenotype increases as it becomes less common.
• For example in prey switching, rare morphs of prey aractually fitter due to predators concentrating on the more frequent morphs.
54
Natural selection may favor non-poisonous butterflies that have the same color pattern as poisonous butterflies. This system is called Batesian mimicry. When they are rare, birds will tend to avoid the mimics, because they will have already have encountered a poisonous butterfly of the same appearance. But when the non-poisonous type is common, the previous encounters of birds with butterflies of their appearance are more likely to have been rewarding; the birds will not avoid eating them, and their fitness will be lower. The fitness of the mimics is negatively frequency-dependent.
55
Balanced PolymorphismBalanced polymorphism occurs in a given population when two distinct types (or morphs) exists and the allele frequencies do not change. This may be due to
• Variation in the environment where one morph may be favored over another.
• One morph may be better adapted to a certain time of the year over the other. The lady bird beetle has 2 morphs. The red variety is more abundant in the spring and winter, whereas the black morph is more abundant in the summer and fall.
55
56
Why Natural Selection Cannot Fashion Perfect Organisms
1. Selection can act only on existing variations.
• Natural selection favors only the fittest phenotypes amothose in the population, which may not be the ideal traitNew advantageous alleles do not arise on demand.
2. Evolution is limited by historical constraints
• Each species has a legacy of descent with modification from ancestral forms. Evolution does not scrap the ancestral anatomy. For example in birds and bats, an existing pair of limbs took on new functions for flight athese organisms evolved from nonflying ancestors.
56
Though natural selection leads to adaptation, nature abounds with examples of organisms that are less than ideally “engineered” for their lifestyles.
02 Microevolution Changing Allelic Frequencies TEACHER NOTES

57
Why Natural Selection Cannot Fashion Perfect Organisms
3. Adaptations are often compromises.
• The loud call that enables a frog to attract mates also attracts predators.
4. Chance, natural selection and the environmeinteract.
• Chance can affect the subsequent evolutionary history opopulations. A storm can blow birds hundreds of kilometers over an ocean to an island, the wind does nonecessarily transport those individuals that are best suitto the environment!
57
With these 4 constraints, evolution does not tend to craft perfect organisms. Natural selection operates on a “better than” basis. As a result, many organisms contain imperfections.
58
Created by:
Carol LeiblDirector of Science ContentNational Math and ScienceDallas, TX
02 Microevolution Changing Allelic Frequencies TEACHER NOTES