Embed Size (px)
Citation preview

415.3 - 1
METHOD 415.3 DETERMINATION OF TOTAL ORGANIC CARBON ANDSPECIFIC UV ABSORBANCE AT 254 nm IN SOURCE WATERAND DRINKING WATER
Revision 1.0June, 2003
B. B. Potter, USEPA, Office of Research and Development, National Exposure Research LaboratoryJ. C. Wimsatt, The National Council On The Aging, Senior Environmental Employment Program
NATIONAL EXPOSURE RESEARCH LABORATORYOFFICE OF RESEARCH AND DEVELOPMENT
U.S. ENVIRONMENTAL PROTECTION AGENCYCINCINNATI, OHIO 45268

415.3 - 2
METHOD 415.3 DETERMINATION OF TOTAL ORGANIC CARBON AND SPECIFIC UV ABSORBANCE
AT 254 nm IN SOURCE WATER AND DRINKING WATER
1.0 SCOPE AND APPLICATION
1.1 This method provides procedures for the determination of total organic carbon (TOC),dissolved organic carbon (DOC), and UV absorption at 254 nm (UVA) in sourcewaters and drinking waters. The DOC and UVA determinations are used in thecalculation of the Specific UV Absorbance (SUVA). For TOC and DOC analysis, thesample is acidified and the inorganic carbon (IC) is removed prior to analysis fororganic carbon (OC) content using a TOC instrument system. The measurements ofTOC and DOC are based on calibration with potassium hydrogen phthalate (KHP)standards. This method is not intended for use in the analysis of treated or untreatedindustrial wastewater discharges as those wastewater samples may damage orcontaminate the instrument system(s).
1.2 The three (3) day, pooled organic carbon detection limit (OCDL) is based on the
detection limit (DL) calculation.1 It is a statistical determination of precision, andmay be below the level of quantitation. The determination of OCDL is dependent onthe analytical instrument system’s precision, the purity of laboratory reagent water(LRW), and the skill of the analyst. Different TOC instrument systems haveproduced significantly different OCDLs that range between 0.02 and 0.12 mg/L OCfor both TOC and DOC measurements. Examples of these data can be seen inSection 17, Table 17.1. It should be noted that background levels of OCcontamination are problematic. The minimum reporting level (MRL) for TOC and DOC will depend on the laboratory’s ability to control background levels (Sect. 4).
2.0 SUMMARY OF METHOD
2.1 In both TOC and DOC determinations, organic carbon in the water sample is oxidizedto produce carbon dioxide (CO2), which is then measured by a detection system. There are two different approaches for the oxidation of organic carbon in watersamples to carbon dioxide gas: (a) combustion in an oxidizing gas and (b) UVpromoted or heat catalyzed chemical oxidation with a persulfate solution. Carbondioxide, which is released from the oxidized sample, is detected by a conductivitydetector or by a nondispersive infrared (NDIR) detector. Instruments using anycombination of the above technologies may be used in this method.
2.2 Settleable solids and floating matter may cause plugging of valves, tubing, and the injection needle and/or injection port. The TOC procedure allows the removal ofsettleable solids and floating matter. The suspended matter is considered part of the

415.3 - 3
sample. The resulting water sample is then considered a close approximation of theoriginal whole water sample for the purpose of TOC measurement.
2.3 The DOC procedure requires that the sample be passed through a 0.45-µm filter prior
to analysis to remove particulate OC from the sample.
2.4 The TOC and DOC procedures require that all IC be removed from the sample beforethe sample is analyzed for organic carbon content. If the IC is not completelyremoved, significant error will occur. The sample, which is then free from ICinterference, is injected into a TOC instrument system. The organic carbon isoxidized to CO2, which is released from the sample, detected, and reported as mg/L orppm TOC or DOC.
2.5 The UVA procedure requires that the sample be passed through a 0.45-µm filter and transferred to a quartz cell. It is then placed in a spectrophotometer to measure theUV absorbance at 254 nm and reported in cm-1.
2.6 The SUVA calculation requires both the DOC and UVA measurement. The SUVA iscalculated by dividing the UV absorbance of the sample (in cm-1) by the DOC of thesample (in mg/L) and then multiplying by 100 cm/M. SUVA is reported in units ofL/mg-M. The formula for the SUVA may be found in Section 12.2.
3.0 DEFINITIONS AND TERMSNOTE: To assist the reader, a table of acronyms can be found in Section 3.20.
3.1 ANALYSIS BATCH - A set of samples prepared and analyzed on the sameinstrument during a 24-hour period. For a TOC/DOC analysis batch, the set maycontain: calibration standards, laboratory reagent blank and/or filter blanks, fieldblank, field samples, laboratory fortified matrix sample, field duplicate sample, andcontinuing calibration check standards. For a UVA analysis batch, the set maycontain: filter blanks, field samples, field blank, field duplicate sample, andspectrophotometer check solutions with associated blank. An analysis batch islimited to 20 field samples. QC samples are not counted towards the 20 sample limit. QC requirements are summarized in Table 17.6.
3.2 BLANKS - Prepared from a volume of LRW (Sect. 3.9) and used as needed to fulfillquality assurance requirements and to monitor the analytical system.
3.2.1 CALIBRATION BLANK (CB) - The calibration blank is a volume of LRWthat is treated with the same reagents used in the preparation of the calibrationstandards. The CB is a “zero standard” and is used to calibrate the TOCinstrument. The CB is made at the same time as the calibration standards andstored along with and under the same conditions as the calibration standards.The CB is also used to monitor increases in organic background found in the
415.3 - 4
calibration standards over time by analyzing it as a sample and comparing theresults with initial analysis of the CB.
3.2.2 FIELD REAGENT BLANK (FRB) - A volume, equivalent to that which iscollected at a sample site, of LRW is placed in a sample bottle or vial. Asecond empty sample bottle or vial accompanies the LRW sample container tothe sample site. At the sample site, the LRW is transferred into the emptybottle or vial which then becomes the FRB. The FRB is treated as a sample inall respects including shipment from the sampling site, exposure to thesampling site conditions, storage, preservation, and all analytical procedures. The purpose of the FRB is to determine if the TOC, DOC, and UVAmeasurements of the samples collected in the field are free from interferencesor contamination as a result of the sample collection procedure and/ortransport of the sample(s) to the laboratory. The FRB is optional and isusually used when the laboratory suspects a problem in sample collection andhandling.
3.2.3 FILTER BLANK (FB) - The FB is an aliquot of LRW that is filtered andanalyzed using the same procedures as field samples undergoing DOC andUVA determinations. For DOC and UVA analyses, the FB serves as the LRB. The FB will give an indication of overall contribution of organic carboncontamination from laboratory sources such as the LRW itself, labwarecleaning procedures, reagents, the filter apparatus, filter, and instrumentsystem(s).
3.2.4 LABORATORY REAGENT BLANK (LRB) - A volume of LRW that isprepared with each sample set and is treated exactly as a TOC sampleincluding exposure to all glassware, plasticware, equipment, and reagents thatare used with other samples. The LRB is used to determine if organiccontamination or other interferences are present in the laboratory environment,reagents, apparatus, or procedures. The LRB must be acidified and spargedfollowing the same procedure as is used to prepare the TOC sample(s).
3.3 CALIBRATION SOLUTIONS - Calibration should be performed according to themanufacturer’s operation manual. The following solutions are used to calibrate theTOC instrument system for TOC or DOC determinations (calibration solutions arenot used for UVA determination):
3.3.1 ORGANIC CARBON PRIMARY DILUTION STANDARD (OC-PDS) - Aconcentrated solution containing potassium hydrogen phthalate (KHP) inLRW water that is prepared in the laboratory or is an assayed KHP standardsolution purchased from a commercial source. The OC-PDS is used for thepreparation of organic carbon calibration standards (OC-CAL), continuing

415.3 - 5
calibration check standards (CCC), and laboratory fortified matrix samples(LFM).
3.3.2 ORGANIC CARBON CALIBRATION STANDARD (OC-CAL) - A solutionprepared from the OC-PDS and diluted with LRW to various concentrations. The OC-CAL solutions are used to calibrate the instrument response withrespect to organic carbon concentration.
3.3.3 CONTINUING CALIBRATION CHECK (CCC) - An OC-CAL solutionwhich is analyzed periodically to verify the accuracy of the existing calibrationof the instrument (Sect. 10.3).
3.4 DISSOLVED ORGANIC CARBON (DOC) - Organic matter, contained in a watersample that is soluble and/or colloidal, that can pass through a 0.45-µm filter.
3.5 FIELD DUPLICATES (FD1 and FD2) - Two separate samples collected at the sametime and place under identical circumstances, and treated exactly the same throughoutfield and laboratory procedures. Analyses of FD1 and FD2 give a measure of theprecision associated with sample collection, preservation, and storage, as well aslaboratory procedures.
3.6 INORGANIC CARBON (IC) - Carbon in water samples from non organic sources,composed mainly from dissolved mineral carbonates and carbon dioxide. IC caninterfere with the determination of TOC and DOC if it is not removed.
3.7 LABORATORY FORTIFIED BLANK (LFB) – An aliquot of LRW or other blankmatrix to which a known quantity of KHP is added in the laboratory. The LFB issubjected to the same preparation and analysis as a sample. The purpose of the LFBis to determine whether the methodology is in control, and whether the laboratory iscapable of making accurate and precise measurements. For this method, a TOC LFBis the same as a CCC (Sect. 10.3) and no additional LFB is required. One LFB isrequired with each DOC analysis batch. No LFB is required for UVA analysis.
3.8 LABORATORY FORTIFIED SAMPLE MATRIX (LFM) - An aliquot of a field sample to which a known quantity of KHP is added in the laboratory. The LFM issubjected to the same preparation and analysis as a sample, and its purpose is todetermine whether the sample matrix affects the accuracy of the TOC or DOCanalytical results. The background concentration of organic carbon in the samplematrix must be determined in a separate aliquot and the measured value in the LFMcorrected for background concentration.
3.9 LABORATORY REAGENT WATER (LRW) - The LRW may be distilled and/ordeionized (DI) water, or high pressure liquid chromatography (HPLC) reagent grade

415.3 - 6
or equivalent water which is low in TOC concentration, meeting the requirements asstated in Section 7.2.
3.10 MATERIAL SAFETY DATA SHEET (MSDS) - Written information provided by avendor describing a chemical’s toxicity, health hazards, physical and chemicalproperties (flammability, reactivity, etc.), storage, handling, and spill precautions.
3.11 MINIMUM REPORTING LEVEL (MRL) - The minimum concentration of organiccarbon that can be reported as a quantified value in a sample following analysis. Thisconcentration is determined by the background level of the analyte in the LRBs andthe sensitivity of the method to organic carbon. See Section 9.10 for guidelines in theestablishment of the MRL.
3.12 ORGANIC CARBON DETECTION LIMIT (OCDL) - The calculated minimumconcentration of a known amount of organic carbon (OC) added to the LRW that canbe identified, measured as either TOC or DOC, and reported with 99% confidencethat the OC concentration is greater than zero as per the procedure in Section 9.2.7.
3.13 ORGANIC CARBON (OC) - In this method, when a concentration or instrumentreading applies to either a TOC or DOC determination, the term “OC” may be used. For example, the LRB must not exceed 0.35 mg/L OC.
3.14 ORGANIC MATTER - A mixture of organic compounds (carbon-carbon, carbon-hydrogen bonded compounds) naturally occurring and/or man-made that are found insource water used by drinking water utilities. The quantity and quality of the OM insource water is measured by TOC/DOC instrument systems or is measured by UVA.
3.15 QUALITY CONTROL SAMPLE (QCS) - A solution containing a knownconcentration of an organic carbon compound(s) which is analyzed exactly like asample. The QCS is obtained from a source external to the laboratory and is differentfrom the source used for preparing the calibration standards. It is used to checklaboratory and instrument performance.
3.16 SOURCE WATER - Surface water or ground water that is used by a drinking waterutility to produce potable water for public consumption.
3.17 SPECIFIC UV ABSORBANCE AT 254 nm (SUVA) - A measure of DOC aromaticcontent that is calculated by measuring the DOC and the UV absorbance at 254 nm ofa 0.45-µm filtered water sample. SUVA is calculated according to the equation givenin Section 12.2.
3.18 TOTAL CARBON (TC) - A measure of the OC and IC contained in a water sample. In this method, IC is removed from the sample. Therefore, the TC reported by a TOCinstrument system will be equal to the TOC or DOC measurement.

415.3 - 7
3.19 TOTAL ORGANIC CARBON (TOC) - The gross amount of organic matter (carbonnot removed by the IC removal step) found in natural water. Suspended particulate,colloidal, and dissolved organic matter are a part of the TOC measurement. For thismethod, the TOC definition excludes the contribution of floating vegetative or animalmatter, and volatile organic matter found in source water. Settleable solids consistingof inorganic sediments and some organic particulate are not transferred from thesample by the laboratory analyst and are not a part of the TOC measurement.
3.20 TABLE OF ACRONYMS
Acronym Term
CB calibration blank
CCC continuing calibration check
COMM-BKScommercial spectrophotometer backgroundsolution
COMM-SCScommercial spectrophotometer checksolution
DOC dissolved organic carbon
FB filter blank
FD field duplicate
FRB field reagent blank
IC inorganic carbon
IDC initial demonstration of capability
KHP potassium hydrogen phthalate
LFB laboratory fortified blank
LFM laboratory fortified matrix
LRB laboratory reagent blank
LRW laboratory reagent water
MRL minimum reporting level
MSDS material safety data sheet
OC-CAL organic carbon calibration standard

Acronym Term
415.3 - 8
OC-PDS organic carbon primary dilution standard
OCDL organic carbon detection limit
QCS quality control sample
SCS spectrophotometer check solution
SDWA Safe Drinking Water Act
SOP standard operating procedure
SUVA specific UV absorbance
TC total carbon
TOC total organic carbon
UVA UV absorbance
4.0 CONTAMINATION AND INTERFERENCES
4.1 SPECIAL CONSIDERATIONS FOR ONSITE UTILITY LABORATORIES -Aerosols (foam and mist) from the operation of a water treatment plant contain organic carbon and will contaminate glassware, reagents, sample collectionequipment, and onsite laboratory equipment if they are exposed to air at the waterutility. For an onsite laboratory, it is recommended that air be filtered and isolatedfrom organic fumes generated by petroleum products and combustion gases whichcome from the operation of some water utility equipment. Work traffic in the onsitelaboratory should be minimized as it may produce dust containing organic matter thatwill result in the contamination of unprotected samples and laboratory equipment.
4.2 All glassware must be meticulously cleaned. Wash glassware with detergent and tapwater, rinse with tap water followed by reagent water. Non-volumetric glassware maythen be heated in a muffle furnace at 425 oC for 2 hours to eliminate interferences. Volumetric glassware should not be heated above 120 oC. Alternate cleaningprocedures, such as acid rinsing and heating at lower temperatures, may be employed,providing that these procedures are documented in a laboratory SOP and LRBs aremonitored as per Section 9.9.
4.3 Laboratory water systems have been known to contaminate samples due to bacterialbreakthrough from resin beds, activated carbon, and filters. Laboratory water systemsshould be maintained and monitored frequently for carbon background and bacterialgrowth. It is recommended that the LRW be filtered through a 0.22-µm filtermembrane to prevent bacterial contamination of TOC instrument systems, reagents,

415.3 - 9
and samples. The LRW, sample transfer (pipet), glassware, and sample bottles are theprinciple source for organic background in the analytical system. However, it is notpossible to control all sources of organic carbon contamination. Therefore, thismethod allows for instrument background correction or adjusting the zero referencepoint of the instrument for organic carbon background that is found in the analyticalsystem. 2 There are many ways to correct for organic carbon background. Consult theinstrument manufacturer’s operation manual for the instrument background correctionprocedure. Subtraction of LRB or FB measurements from TOC, DOC, or UVAsample results is not allowed.
4.4 High concentrations of OC, both man-made and naturally occurring, can cause grosscontamination of the instrument system, changes in calibration, and damage to valves,pumps, tubing, and other components. It is recommended that analysis of a sampleknown to have a concentration of OC > 10 mg/L OC be followed by the analysis of anLRB. It is highly recommended that known samples containing OC concentrations > 50 mg/L OC be diluted or not run on instruments used to analyze low-level drinkingwater samples.
4.5 Source waters containing ionic iron, nitrates, nitrites, and bromide have been reportedto interfere with measurements of UVA absorbance at 254 nm. 3 The concentration ofthe interferences and their effect on the UVA cannot be determined as each uniquesample matrix may produce a different UVA response for the same concentration ofinterference or combination of interferences. This method does not treat or removethese interferences. Therefore, suspected or known interferences may affect resultsand must be flagged in the SUVA result as “suspected UVA interferences.”
4.6 Chloride exceeding 250 mg/L may interfere with persulfate oxidation methods.4, 5 Some instrument systems may require increased persulfate concentration andextended oxidation times. Consult with your instrument manufacturer’srepresentative or instrument operation manual for instrument settings and reagentstrengths when analyzing samples containing high levels of chloride.
4.7 Inorganic carbon (IC) interferes with TOC and DOC measurements. TOC instrumentbias due to incomplete IC removal has been reported.6, 7 If inorganic carbon is notcompletely removed from the water sample, it will result in a positive or negative biasdepending on the way the instrument system calculates TOC (e.g., TOC =TC - IC, TC = TOC + IC, or TOC = TC). When inorganic carbon (IC) is removed from thesample prior to the TOC assay, as required in this method, TOC = TC and the methodbias is minimized.
5.0 SAFETY
5.1 Fast-moving source water, steep inclines, water conduits, and electrical hazards maypresent special safety considerations for the sample collector. The sample collector

415.3 - 10
should be aware of any potential safety hazards and take necessary precautions whilecollecting samples.
5.2 Each chemical reagent used in this method should be regarded as a potential healthhazard. Exposure to these compounds should be minimized and/or avoided by activeparticipation in safety planning and good laboratory practices.8 Each laboratory isresponsible for maintaining a current awareness file of OSHA regulations9 regardingthe safe handling of the chemicals specified in this method. Material Safety DataSheets (MSDS) containing information on chemical and physical hazards associatedwith each chemical should be made available to all personnel involved in thechemical analysis.
5.3 Potassium persulfate is a strong oxidizing and corrosive reagent. The analyst shouldavoid eye and skin contact by wearing eye/face protection, powderless gloves andlaboratory clothing. If body tissue comes in contact with this reagent, apply largequantities of water for at least 15 minutes (see MSDS) while removing contaminatedclothing. This reagent may cause delayed burns. Seek immediate medical attention ifthe area becomes irritated or burned. This reagent can also cause a fire or explosion ifit is allowed to come in contact with combustible materials.
5.4 Protect your hands by wearing laboratory disposable gloves during the preparationand disposal of corrosive (acids and oxidants) laboratory reagents. Do not reuselaboratory gloves that have been discarded or are suspected of being contaminated.
6.0 EQUIPMENT AND SUPPLIES NOTE: Brand names, and/or catalog numbers are included for illustrative purposesonly. No endorsement is implied. Equivalent performance may be achieved usingapparatus, instrument systems, and reagents other than those that are illustratedbelow. The laboratory is responsible for the assurance that alternate products,apparatus, instrument systems, and reagents demonstrate equivalent performance asspecified in this method.
6.1 FILTER APPARATUS - Nalgene® or Corning® 250 mL Filter System, 0.45-µmNylon (NYL) or Polyethersulfone (PES) Low Extractable Membrane/PolystyreneBody with optional glass fiber prefilters (nominal 1 to 7 um). Packaging and filterapparatus are recyclable (NALGE-NUNC International: Nalgene Labware CAT.numbers NYL: 153-0045, PES: 168-0045). It is recommended that filter membranesbe hydrophilic 0.45-µm filter material.
NOTE: Alternate filter membranes (e.g., polypropylene, silver or Teflon®), apparatustechnologies such as cartridges, reusable filter bodies, syringe filters, and theirassociated syringes, peristaltic pumps or vacuum pumps may be selected. Thecomplexity of an alternative filter apparatus is left to the analyst’s ingenuityproviding that the apparatus meets quality control and initial demonstration of

415.3 - 11
capability requirements as stated in Section 9.3.2, and that FB requirements are met(Sect. 9.9). It is recommended that the analyst review the AWWA journal article“Selecting filter membranes for measuring DOC and UV254”, Karanfil, et. al.10, priorto the selection of an alternative filter membrane, apparatus, and wash procedure. Karanfil tested 11 filter membranes (0.45-µm pore size and 47-mm disc size)representing four different manufacturers and seven different types of filter materialsfor both desorption and adsorption. Hydrophilic polyethersulfone (PES) filtersavailable from two manufacturers (Osmonics Micro-PES and Gelman Supor 450,both 0.45 micron absolute pore size and 47-mm disc size) and a hydrophilicpolypropylene filter (Gelman GH Polypro, 0.45 micron absolute pore size and 47-mmdisc size) were found to be the best options among those tested in the study.
6.2 INJECTION VIALS - Specially cleaned 40-mL glass vials, with cap andpolytetrafluoroethylene (PTFE)/silicone septa. Eagle-Picher TOC Certified, Cat. No.40C-TOC/LL, Eagle-Picher Technologies®. These vials are specially cleaned by themanufacturing process and certified to contain < 10 µg TOC. Vials may be reused ifcleaned as per Section 4.2. The PTFE/silicone septa once pierced by the sampleinjector must be discarded.
6.3 INSTRUMENT SYSTEMS - The TOC and UVA procedures allow for the use ofseveral different types or combinations of TOC instrumental system technologies.Examples of typical TOC instrument systems, as well as a UV spectrophotometer, aredescribed below. Data from these instruments may be found in Section 17. Only oneTOC instrument is required to perform this method.
6.3.1 TOC INSTRUMENT 1: UV/Persulfate/Wet Oxidation withPermeation/Conductivity Detection. The Ionics-Sievers® 800 TOC analyzeris based on UV catalyzed persulfate digestion to produce CO2, which isdetected by a membrane permeation/conductivity detector.
6.3.2 TOC INSTRUMENT 2: Elevated Temperature/Catalyzed/Persulfate/WetOxidation/Nondispersive Infrared Detection (NDIR). The O.I. Analytical®TOC Model 1010 is based on elevated temperature (95-100°C) catalyzedpersulfate digestion to produce CO2, which is then detected by an NDIRdetector.
6.3.3 TOC INSTRUMENT 3: UV/Low Temperature/Persulfate/WetOxidation/NDIR. The Tekmar-Dohrmann® Phoenix 8000 TOC analyzer isbased on UV catalyzed persulfate digestion to produce CO2, which is thendetected by an NDIR detector.
6.3.4 TOC INSTRUMENT 4: Catalyzed/Combustion Oxidation(680 °C)/NDIR. The Shimadzu® model TOC-5000A analyzer is based on a catalyzed

415.3 - 12
combustion in air or oxygen reagent gas to produce CO2, which is thendetected by an NDIR detector.
6.3.5 TOC INSTRUMENT 5: High Temperature Combustion Oxidation/NDIR. The Thermo Environmental® ThermoGlasTM 1200 TOC is based on a dualzone furnace with individually adjustable ovens from 700 to 1250 °C for finalhigh temperature combustion of the sample with air or oxygen reagent gas toproduce CO2, which is then detected by an NDIR detector.
6.3.6 UV SPECTROPHOTOMETER: The spectrophotometer is used for the UVAdetermination only. The spectrophotometer must be able to measure UVA(254 nm), with an absorbance from 0.0045 to at least 1.0 cm-1 UVA, andaccommodates a sample cell with a path length of 1, 5, or 10 cm.
6.4 LABORATORY REAGENT WATER TREATMENT SYSTEM - The LRW used forthe development of this method was generated using a Millipore®, Milli-Q PlusUltra-Pure Water Treatment System with a 0.22-µm sterile pack filter capable ofproducing organic carbon free (< 0.010 mg/L OC), ultrapure deionized water.11 Themaximum amount of OC allowed in the LRW for this method is 0.35 mg/L. Whenpurchasing a treatment system for general laboratory use, it is recommended that asystem be purchased capable of producing LRW of the above stated quality in orderto be of use in other laboratory analyses.
6.5 MUFFLE FURNACE - A muffle furnace capable of heating up to 425 °C.
6.6 FIELD SAMPLE pH TEST - Sample pH indicator test strips, non-bleeding(colorpHast® Indicator Strips 0 - 2.5, cat. 9580), EM Science, 480 Democrat Road,Gibbstown, N.J. 08027. Pocket pH test kits, pocket pH meters, or laboratory pHmeters are acceptable for field sample pH measurements.
6.7 PIPET, DISPOSABLE TRANSFER - Large volume bulb (15mL), non-sterile, withflexible long stem polyethylene transfer pipet. “Sedi-Pet ™”, Fisher Scientific® Cat. 13-711-36. Pipets are used for sample transfer from the middle of a sample bottlecontaining floating material (scum).
6.8 SAMPLE COLLECTION REAGENT BOTTLES - Specially cleaned, 1-L Bostonround glass bottles with cap. Eagle-Picher TOC Certified, Cat. No. 112-01A/C TOC,Eagle-Picher Technologies, LLC. These bottles are specially cleaned by themanufacturing process and certified to meet EPA OSWER Directive # 9240.0-05A“Specifications And Guidance For Contaminant-Free Sample Containers 12/92.” Amber bottles are preferred, but clear glass bottles may be used if care is taken toprotect samples from light. The laboratory may select glass bottles of any volume thatmeet the utility and laboratory sample processing and quality control sampling needs.

415.3 - 13
Glass bottles may be reused after cleaning (see Sect. 4.2 for glassware cleaninginstructions) or discarded.
6.9 SPARGE APPARATUS - N-EVAPTM, Nitrogen Evaporator System Model 111,Organomation Associates Inc. This apparatus is not used for its originally designedpurpose of evaporating sample extracts. In this method, the apparatus is used as asparging device. The stainless steel needles of the apparatus are lowered into the 40-mL sample vials containing the TOC or DOC samples to remove inorganic carbon bysparging with nitrogen gas.
Alternately, some TOC auto-samplers provide a pre-sparging or membrane ICremoval option prior to injection of the sample into the TOC instrument system. Theanalyst is encouraged to utilize these instrument options, if available. Anotheralternative is for the laboratory analyst to fabricate a sparging apparatus. Forexample, an apparatus may consist of copper tubing from a regulated gas source,connected to a needle valve used for gas flow control, a length of silicone tubing witha glass Pasteur pipet inserted into the tubing and a ring stand with clamp forpositioning the pipet. The Pasteur pipet is inserted into the sample bottle or vial toremove inorganic carbon by sparging with nitrogen gas (Sect. 11.5). The complexityof the alternative sparging apparatus is left to the analyst’s ingenuity providing thatthe apparatus meets quality control and initial demonstration of capability (ICremoval test) requirements as stated in Section 9.2.4.
6.10 VACUUM SOURCE - Aspirator, air flow or water flow, hand-operated or lowpressure electric vacuum pump, providing a vacuum of 15 inches of mercury (Hg) orbetter. If an alternative choice is made, see note in Section 6.1.
6.11 VARIABLE PIPETTES - Programable automated pipettes. Rainin Instrument®EDP-Plus Pipette 10ml, Cat. No. EP-10 mL; EDP-Plus Pipette 1000 µL, Cat. No. EP-1000; EDP-Plus Pipette 100 µL, Cat. No. EP-100, or manual variable pipets withdisposable tips having a calibrated range of 0 to 100-µL, 0 to 1000-µL, and 0 to 10mL.
6.12 VOLUMETRIC FLASK AND PIPETS - All volumetric glassware used in thismethod are required to be “Class A”.
6.13 WAVELENGTH VERIFICATION FILTER SET- Wavelength verification may beprovided by the instrument manufacturer, a scientific instrument service company, orif this not practical, wavelength verification may be made by the laboratory usingcertified spectrophotometric filter sets with values traceable to NIST. FisherScientific Cat. No. 14-385-335, Spectronic No. 333150.

415.3 - 14
7.0 REAGENTS AND STANDARDSNOTE: The chemicals required for this method must be at least reagent grade. Unless otherwise indicated, it is intended that all reagents shall conform to thespecifications of the Committee on Analytical Reagents of the American ChemicalSociety (ACS) and/or ACS certified, when available. Some instrument manufacturersprovide reagents specifically prepared for the optimum performance of their TOCinstruments and provide calibration services and/or calibration standards. Theanalyst is allowed to use these services or prepare reagents and/or standardsaccording to the instrument manufacturer’s operation manual.
7.1 COMPRESSED GASES – Carbon dioxide free Ultra High Purity (UHP) gradenitrogen gas or an optional Ultra-low level TOC gas delivery system. For combustionbased TOC systems, zero grade air and UHP grade oxygen may be needed. The useof lesser grades of compressed gases will result in high background noise in the TOCinstrument systems. The TOC Instrument 1 described in Section 6.3.1. does notrequire compressed gasses for operation.
7.2 LABORATORY REAGENT WATER (LRW) - Water that has a TOC reading of < 0.35 mg/L and < 0.01 cm-1 UVA. Although the LRW TOC and UVA limits in thismethod are 0.35 mg/L and 0.01 cm-1, respectively, the system specified in Section 6.4is capable of producing better quality organic carbon free, ultrapure deionized water. For optimum performance, it is recommended that LRW with < 0.05 mg/L TOC and < 0.0045 cm-1 UVA be used for this method. Alternatively, LRW may be purchased(ACS HPLC grade or equivalent).
7.3 DISODIUM HYDROGEN PHOSPHATE, [Na2HPO4, CAS# 7558-79-4] -Anhydrous, ACS grade or better.
7.4 O-PHOSPHORIC ACID (85%), [H3PO4, CAS# 7664-38-2] - ACS grade or better.
7.5 POTASSIUM DIHYDROGEN PHOSPHATE, [KH2PO4, CAS# 7778-77-0]-Anhydrous, ACS grade or better.
7.6 POTASSIUM HYDROGEN PHTHALATE (KHP), [C8H5O4K, CAS# 877-24-7] -Anhydrous, ACS grade or better.
7.7 REAGENT SOLUTIONS FOR WET CHEMICAL OXIDATION - It is assumed thateach instrument manufacturer has optimized reagent solutions for their respectiveinstruments and has provided the instructions for the preparation of reagents in theinstrument’s operation manual. NOTE: TOC Instrument 1 does not require gassparge of reagents as the manufacture provides reagent packs for the operation of theinstrument.

415.3 - 15
7.7.1 PERSULFATE REAGENT - Prepare this solution according to the instrumentmanufacturer’s instructions or purchase the solution from the instrumentmanufacturer. If the laboratory prepares the solution, transfer the solution tothe instrument reagent bottle and cap. It is recommended that this solution besparged gently with carbon dioxide free UHP grade nitrogen gas forapproximately 1 hour. If the instrument system provides continuous sparge, itis recommended that the reagent bottles be allowed to sparge for 10 minutes to1 hour before operating the instrument. Self contained reagent packs or othertypes of reagent systems may not require reagent sparging. Discard thesolution as per expiration time/date listed in the manufacturer’s operationmanual.
7.7.2 PHOSPHORIC ACID SOLUTION - Prepare this solution according to theinstrument manufacturer’s instructions or purchase the solution from theinstrument manufacturer. If the laboratory prepares the solution, transfer thesolution to the instrument reagent bottle and cap. It is recommended that thissolution be sparged gently with carbon dioxide free UHP grade nitrogen gasfor approximately 1 hour. If the instrument system provides continuoussparge, it is recommended that the reagent bottles be allowed to sparge for 10minutes to 1 hour before operating the instrument. Self contained reagentpacks or other types of reagent systems may not require reagent sparging. Discard the solution as per expiration time/date listed in the manufacturer’soperation manual.
7.8 STANDARD SOLUTIONSNOTE: Consult with the instrument manufacturer or operation manual for therecommended concentrated acid used for preservation of standard solutions. Theconcentrated acid used to preserve the standards is usually HCl, H2SO4, or H3PO4
depending upon the instrument operation manual recommendation. The acid used forthe standards must be the same as the one used for the samples. Standard solutionsmay be alternatively prepared in larger or smaller volumes and concentrations asneeded for the calibration of instruments. Standard solutions may be prepared bygravimetric or volumetric techniques. This section provides guidance for thepreparation of calibration solutions.
7.8.1 INORGANIC CARBON PRIMARY TEST SOLUTION (IC-TEST)REAGENTS
7.8.1.1 AMMONIUM CHLORIDE, [NH4Cl, CAS# 12125-02-9] - ACS gradeor better.
7.8.1.2 CALCIUM CHLORIDE DIHYDRATE, [CaCl2 C 2H2O, CAS# 10035-04-8] - ACS grade or better.

415.3 - 16
7.8.1.3 CALCIUM NITRATE TETRAHYDRATE, [Ca(NO3)2 C 4H2O, CAS#13477-34-4] - ACS grade or better.
7.8.1.4 MAGNESIUM SULFATE HEPTAHYDRATE, [MgSO4 C 7H2O,CAS# 10034-99-8] - ACS grade or better.
7.8.1.5 POTASSIUM CHLORIDE, [KCl, CAS# 7447-40-7] - ACS grade orbetter.
7.8.1.6 SODIUM BICARBONATE, [NaHCO3, CAS# 144-55-8] - ACS gradeor better.
7.8.1.7 SODIUM CHLORIDE, [NaCl, CAS# 7647-14-5] - ACS grade orbetter.
7.8.1.8 SODIUM-META SILICATE NONAHYDRATE, [Na2SiO3 C 9H2O,CAS# 13517-24-3]
7.8.1.9 SODIUM PHOSPHATE DIBASIC HEPTAHYDRATE, [Na2HPO4 C7H2O, CAS# 7782-85-6] - ACS grade or better.
7.8.2 PREPARATION OF THE IC-TEST SOLUTION, 100 MG/L IC - Thissolution is used in the performance of the IC removal sparging efficiency test(Sect. 9.2.4 ). The ionic content of the IC-TEST mixture solution was chosenfrom a previous investigation in which the authors wanted to simulate waterslikely to be found in waste treatment plants.12 Because the inorganic salts arenot soluble in a single concentrated solution, prepare four separate stocksolutions by diluting each of the following to one liter with LRW:

415.3 - 17
FLASK(1 L)
SALT WEIGHT(g)
A magnesium sulfate heptahydrate, MgSO4 C 7H2O 2.565
B ammonium chloride, NH4Cl 0.594
calcium chloride dihydrate, CaCl2 C 2H2O 2.050
calcium nitrate tetrahydrate, Ca(NO3)2 C 4H2O 0.248
potassium chloride, KCl 0.283
sodium chloride, NaCl 0.281
C sodium bicarbonate, NaHCO3 2.806
sodium phosphate dibasic heptahydrate, Na2HPO4 C 7H2O 0.705
D sodium-meta silicate nonahydrate, Na2SiO3 C 9H2O 1.862
Prepare a 102.5 mg/L IC-TEST mixture, based on bicarbonate calculationsand impurities, by adding a 10-mL aliquot of each of the above solutions to a40-mL vial. Add 40 µL of H3PO4, HCl, or H2SO4, depending upon instrumentrequirements (see note, Sect. 7.8), to the 40-mL injection vial. An IC-TESTmixture of approximately 100 mg/L was chosen to represent the extremeinorganic carbon concentration the analyst may encounter. Although themixture is turbid after preparation, clarification occurs after acidification.
7.8.3 ORGANIC CARBON PRIMARY DILUTION STANDARD (OC-PDS), 500mg/L (1 mL = 0.5 mg OC) - Prepare an acid preserved (pH #2) OC-PDS bypouring approximately 500 mL of LRW into a 1-liter volumetric flask, adding1 mL of concentrated acid for preservation (see note, Sect. 7.8), carefullytransferring 1.063 g KHP into the LRW, stirring until it is dissolved, and thendiluting to the mark with LRW (1.0 mg KHP = 0.471 mg Organic Carbon). Transfer this solution to a marked amber glass reagent bottle and cap forstorage. This solution does not require refrigeration for storage and is stablefor an indefinite period of time (6 months to a year). Replace the OC-PDS ifthe instrument system fails to pass the QCS requirements (Sect. 9.11).
7.8.4 ORGANIC CARBON CALIBRATION (OC-CAL) - At least 4 calibrationconcentrations and the CB (i.e., a minimum of 5 total calibration points) arerequired to prepare the initial calibration curve. Prepare the calibrationstandards over the concentration range of interest from dilutions of the OC-PDS. The calibration standards for the development of this method wereprepared as specified in the table below. Calibration standards must be
415.3 - 18
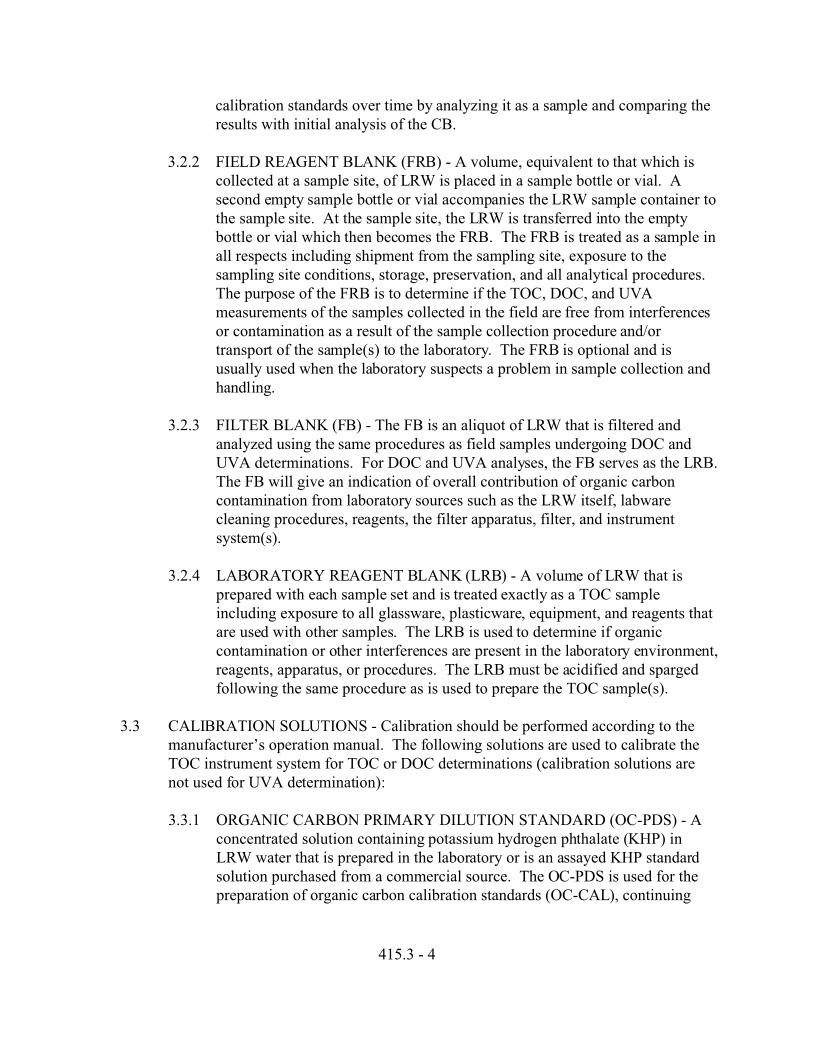
prepared using LRW preserved to pH # 2 with concentrated acid (see note,Sect. 7.8). Filtration of the CAL standards for DOC analysis is unnecessary,since interferences from the filtration unit are monitored via the FB. Therefore, the OC-CAL may be applied to TOC or DOC determinations. TheOC-CAL standards must be sparged, or otherwise treated for IC removal, likea sample following the procedure in Section 11.5.
PREPARATION OF CALIBRATION (OC-CAL) CURVE STANDARDS
CAL
Level
Initial Conc. of
OC-PDS
(mg/L)
Vol. of
OC-PDS
(mL)
Final Vol. of
OC-CAL Std.
(mL)
Final Conc. of
OC- CAL Std.
(mg/L)
CB – 0 1000 –
1 500 1.0 1000 0.5
2 500 2.0 1000 1.0
3 500 4.0 1000 2.0
4 500 10.0 1000 5.0
5 500 20.0 1000 10.0
6 * 500 5.0 100 25.0
7 * 500 10.0 100 50.0
* Note: OC-CAL 6 - 7 are optional calibration standards for use whenoperating the instrument in a higher concentration range.
The calibration blank (CB) is a “0.0 mg/L OC ” standard which approximateszero mg/L OC concentration plus the background carbon contributed from theLRW. The CB is stored and treated the same as all other calibrationstandards. When analyzed, the CB must not exceed 0.35 mg/L TOC.
7.8.5 Calibration standards may be stored at room temperature in amber glassbottles (Sect. 6.8) and/or in a dark cabinet (if clear glass used) for a period of30 days. If stored OC-CALs are used to recalibrate the instrument during this30 day period, the CB which has been stored with the OC-CALs must beanalyzed as a sample prior to recalibration. The CB must not exceed 0.35mg/L OC. If the CB does not meet this criteria, the CB and OC-CALs mayhave absorbed OC from the laboratory atmosphere and must be discarded.
7.9 COMMERCIAL SPECTROPHOTOMETER CHECK SOLUTION (COMM-SCS) -The laboratory may use a commercially prepared COMM-SCS for the purpose ofchecking the performance of the spectrophotometer. The analyst should purchase theCOMM-SCS in the absorbance range that is commonly observed for the samples

415.3 - 19
analyzed. The IN-SPEC™ optical standard and background solution for a 254 nmspectrophotometric check is NIST traceable, and is available from GFS Chemicals,PO Box 245, Powell, Ohio 43065.
7.9.1 COMMERCIAL SPECTROPHOTOMETER BACKGROUND SOLUTION(COMM-BKS) - A background solution provided by the COMM-SCSprovider that is used to correct for stabilizing agents present in the COMM-SCS.
7.10 LABORATORY PREPARED KHP-SPECTROPHOTOMETER CHECKSOLUTIONS (KHP-SCS) - The laboratory may elect to prepare a KHP basedspectrophotometer check solution (KHP-SCS) for the purpose of checking theperformance of the spectrophotometer at the absorbance of the average UVA sample. This requires the preparation of a buffered KHP solution having a knownconcentration and a known absorbance at 254 nm. The analyst should prepare theKHP-SCS that will provide an absorbance similar to the absorbance in the range (low,mid, high) of the sample analyzed. NOTE: If the phosphate buffer reagents usedbelow have been exposed to laboratory humidity, it is recommended that potassiumdihydrogen phosphate (KH2PO4) and disodium hydrogen phosphate (Na2HPO4) bedried for 1 hour at 105°C.
7.10.1 KHP-SCS-BLANK - Prepare a 1-L volumetric flask containing approximately500 mL of LRW. Transfer and dissolve 4.08 g anhydrous KH2PO4 and 2.84 ganhydrous Na2HPO4 in 500 mL. Dilute to the mark with LRW and transfer to a1-L amber glass bottle.
7.10.2 KHP-SCS - Prepare the KHP-SCS that will provide an absorbance similar tothe absorbance of the samples analyzed. Prepare a 1-L volumetric flaskcontaining approximately 500 mL of LRW. Transfer and dissolve 4.08 ganhydrous KH2PO4 and 2.84 g anhydrous Na2 HPO4 into the 500 mL of LRW. From the example calculation, or table located below (Sect. 7.10.2.1), transferthe amount of OC-PDS (in mL) needed to produce the representativeabsorbance of the sample into the buffered KHP-SCS and dilute with LRW tothe 1 L mark.
7.10.2.1 KHP-SCS, CONCENTRATION CALCULATION - StandardMethod 5910 B provides for a spectrophotometer check using acorrelation equation which was based on the analyses of 40-samplesof KHP solution. 3 The correlation formula is as follows: UV254 =0.0144 KHP + 0.0018. This formula may be algebraically solved forthe concentration of KHP, expressed as mg/L OC, needed toproduce a KHP-SCS for the observed sample absorbance asfollows:

415.3 - 20
KHP-OC conc. = (UV254 !0.0018) ' 0.0144
Using the calculated KHP-OC concentration, determine the amountof OC-PDS (Sect. 7.8.3, 1 mL = 0.5 mg OC) needed to produce aknown absorbance for the KHP-SCS. For example, if you typicallyrun samples that have an average UVA equal to 0.08 cm-1, you cancalculate the KHP in the following manner:
5.431 KHP mg/L as OC = (0.08 cm-1 UVA254 !0.0018) ' 0.0144
The 5.431 mg/L is the same as 5.431 mg/L KHP. It follows that toproduce a 1-L KHP-SCS solution having a UVA absorbance of 0.08cm-1, you will need 10.9 mL of OC-PDS as calculated below:
(5.431 KHP-SCS mg/L)(1000mL/L) / 500 OC-PDS mg/L = 10.9 mL of OC-PDS
In summary, 10.9 mL OC-PDS is needed to make a 1-L KHP-SCSsolution that will have a UVA absorbance of 0.08 cm-1.
Alternately, the following table, which is based on the abovecalculation, can be used. From this table, cross reference theamount of the OC- PDS (in mLs) needed to produce the desiredUVA for the KHP-SCS. Transfer the required amount of OC-PDSinto a 1-L flask and dilute to the mark with LRW.
KHP-SCS Preparation
UVA@254nm(cm -1)
ORGANICCARBON (mg/L)
OC-PDS (mLadded per liter of
LRW)
0.0738 5 10
0.1458 10 20
0.2898 20 40
0.4338 30 60
7.10.3 Verify that the KHP-SCS-BLANK and the KHP-SCS buffered solutions are at pH 7. Check the pH by placing a drop from the SCS bottle onto pH test paper. Do not put the pH paper into the SCS bottle. Placing the pH paper in the bottle will contaminate the sample with organic carbon. If this happens, thespectrophotometer check solution must be discarded and a new solutionprepared in a clean bottle. If the buffered KHP-SCSs are not at a pH of 7, the
415.3 - 21
solution must be discarded and a new solution made. Store these solutions atapproximately < 6 °C. These solutions are not preserved. In a sterileenvironment these solutions may be stable for a month. However, the shelf lifeof these solutions may be shortened as a result of microbial growth. Therefore,it is recommended that the above solutions be made fresh weekly and/or bereplaced if any significant change in absorbance is noted.
8.0 SAMPLE COLLECTION, FILTRATION, AND HOLDING TIMESNOTE: Consult with the instrument manufacturer or operation manual for therecommended type of concentrated acid used for preservation of TOC or DOCsamples. The concentrated acid used to preserve the sample is usually HCl, H2SO4, orH3PO4 depending upon the instrument operation manual recommendation. The acidused for the standards must be the same as the one used for the samples. Samples forDOC and UVA analyses may be filtered in the field using alternate apparatustechnologies such as cartridges, reusable filter bodies, syringe filters, and theirassociated syringes, peristaltic pumps or vacuum pumps providing that the filter blankrequirements are met (Sect. 9.9).
8.1 SUVA SAMPLE COLLECTION - SUVA is determined by the analysis of a DOCsample and a UVA sample, together called the SUVA sample set. A single samplemay be collected and split for the DOC and UVA analyses or two individual samplesmay be collected at the same time. For example: if the sample is to be determined bytwo separate laboratories (i.e., one lab determines UVA and a second lab determinesthe DOC), the sample collector may collect two representative samples for shipment. A 1-L volume is recommended for the collection of DOC and UVA samples, but othervolumes may be collected depending on the sample volume needed for the filtrationapparatus used by the analyzing laboratory. The SUVA sample set is collected in cleanglass bottles by filling the bottle almost to the top. The sample set is NOT preservedwith acid at the time of collection. The sample set is delivered as soon as possible tothe laboratory and should arrive packed in ice or frozen gel packs. The sample set isprocessed by the laboratory and stored at < 6 °C, until analysis. If there is no visibleice or the gel packs are completely thawed, the laboratory should report theseconditions to the data user. Samples shipped that are improperly preserved, and/or donot arrive at the laboratory within 48 hrs, cannot be used to meet compliancemonitoring requirements under the Safe Drinking Water Act (SDWA).
8.1.1 The DOC sample must be filtered in the field or in the laboratory within 48hours of sample collection according to the procedure detailed in Section 11.4prior to acidification and analysis. After filtration, the DOC sample is acidifiedwith 1 mL of concentrated acid per 1 L of sample or the sample is preserved bydrop wise adjustment to a pH < 2 (Sect. 8.3). The DOC bottle is capped andinverted several times to mix the acid and is stored at < 6 °C. The sample mustbe analyzed within 28 days from time of collection.

415.3 - 22
8.1.2 The UVA sample must be filtered in the field or in the laboratory according tothe procedure detailed in Section 11.4. The sample used for the UVAdetermination is not acidified. The UVA bottle is capped and stored at < 6 °Cfor up to 48 hours from the time of collection. The UVA sample must beanalyzed within 48 hours from the time of collection.
8.2 TOC SAMPLE COLLECTION - The typical sample volume collected may vary from40 mL to 1 L of sample. It is recommended that the sample collector coordinate thesize of collection volume with the needs of the analytical laboratory. If the TOCsample is collected in a 40-mL injection vial, it is acidified to pH < 2 by adding 2drops of concentrated acid. If the TOC sample is collected in a 1-L bottle, 1 mL ofconcentrated acid is added or the sample is drop wise adjusted to a pH < 2 (Sect. 8.3). TOC samples must be acidified at the time of collection. Cap the bottle or injectionvial and invert several times to mix the acid. The sample is delivered as soon aspossible to the laboratory and should arrive packed in ice or frozen gel packs. If thereis no visible ice or the gel packs are completely thawed, the laboratory should reportthe conditions to the data user. Samples shipped that are improperly preserved, and/ordo not arrive at the laboratory within 48 hrs, cannot be used for compliance monitoringunder the SDWA. The sample is stored at < 6 °C, until analysis. Stored and preservedsamples must be analyzed within 28 days from time of collection.
8.3 SAMPLE pH CHECK - The pH of the preserved sample (DOC, TOC only) or filtrateshould be checked to ensure adequate acidification for the preservation. This shouldonly be performed by an adequately trained sample collector. Check the pH by placinga drop from the sample onto pH test paper. Do not put the pH paper into the samplebottle. Placing the pH paper in the sample bottle will contaminate the sample withorganic carbon. If this happens, the sample or filtrate must be discarded and a newsample collected.
9.0 QUALITY CONTROL
9.1 Each laboratory using this method is required to operate a formal quality control (QC)program. QC requirements for TOC include: the initial demonstration of laboratorycapability (IDC) followed by regular analyses of continuing calibration checks (CCC),independent quality control samples (QCS), laboratory reagent blanks (LRB), fieldduplicates (FD), and laboratory fortified matrix samples (LFM). For this method, aTOC laboratory fortified blank (LFB) is the same as a CCC (Sect. 10.3) and no LFB isrequired. QC requirements for DOC include: the IDC followed by regular analyses ofCCCs, QCSs, filter blanks (FB), LFB, FDs, and LFMs.
For laboratories analyzing both TOC and DOC samples, only the DOC IDCdetermination is required, as it is similar to, yet more rigorous than, the TOC IDC. The IDC must be performed the first time a new instrument is used and/or when a newanalyst is trained.

415.3 - 23
QC requirements for UVA analysis include: the performance of the IDC followed bythe regular analysis of spectrophotometer check solutions (SCS), FBs, and FDs. ForUVA analysis, no LFB or DL determination is required.
The control of instrument background is crucial prior to the performance of the IDC. It is required that a critical evaluation be made of the instrument background 2
associated with an instrument system before proceeding with the IDC. Once anacceptable instrument background is established, it is safe to proceed with the IDC.
In summary, this section describes the minimum acceptable QC program, andlaboratories are encouraged to institute additional QC practices to meet their specificneeds. The laboratory must maintain records to document the quality of the datagenerated. All users of this method are encouraged to write their own SOPs statingexactly how their lab executes the method. A summary of QC requirements can befound in Tables 17.5 and 17.6.
9.2 INITIAL DEMONSTRATION OF CAPABILITY FOR TOC DETERMINATION
9.2.1 INITIAL DEMONSTRATION OF LOW SYSTEM BACKGROUND - Beforeany samples are analyzed, and any time a new set of reagents is used, prepare alaboratory reagent blank (LRB) and demonstrate that it meets the criteria inSection 9.9.
9.2.2 INITIAL INSTRUMENT CALIBRATION VERIFICATION - Prior to theanalysis of the IDC samples, calibrate the TOC instrument as per Section 10.2. Verify calibration accuracy with the preparation and analysis of a QCS asdefined in Section 9.11.
9.2.3 INITIAL ORGANIC CARBON FLOW INJECTION MEMORY CHECK -Inject the highest OC-CAL used, followed by two injections of the LRB. If thefirst LRB is > 0.35 mg/L OC and the second LRB is in QC compliance (i.e., < 0.35 mg/L OC), a memory problem is indicated. Therefore, an LRB mayneed to be placed after every sample. If the instrument system provides a rinseor system flush with LRB between injections, activate the event control settingsand repeat this section. If the memory problem persists, then an LRB must beplaced after every sample.
9.2.4 INORGANIC CARBON REMOVAL SPARGING EFFICIENCY TEST-Various sample sparge times (3-10 minutes) and sparging flow rates have beenreported for the removal of IC. 13 A multi-laboratory study reported largevariations and positive bias in analyses of solutions of standards containingeven small amounts of IC, demonstrating the importance of IC removal.14 Since IC must be removed in order to reduce interferences with the TOC and
415.3 - 24
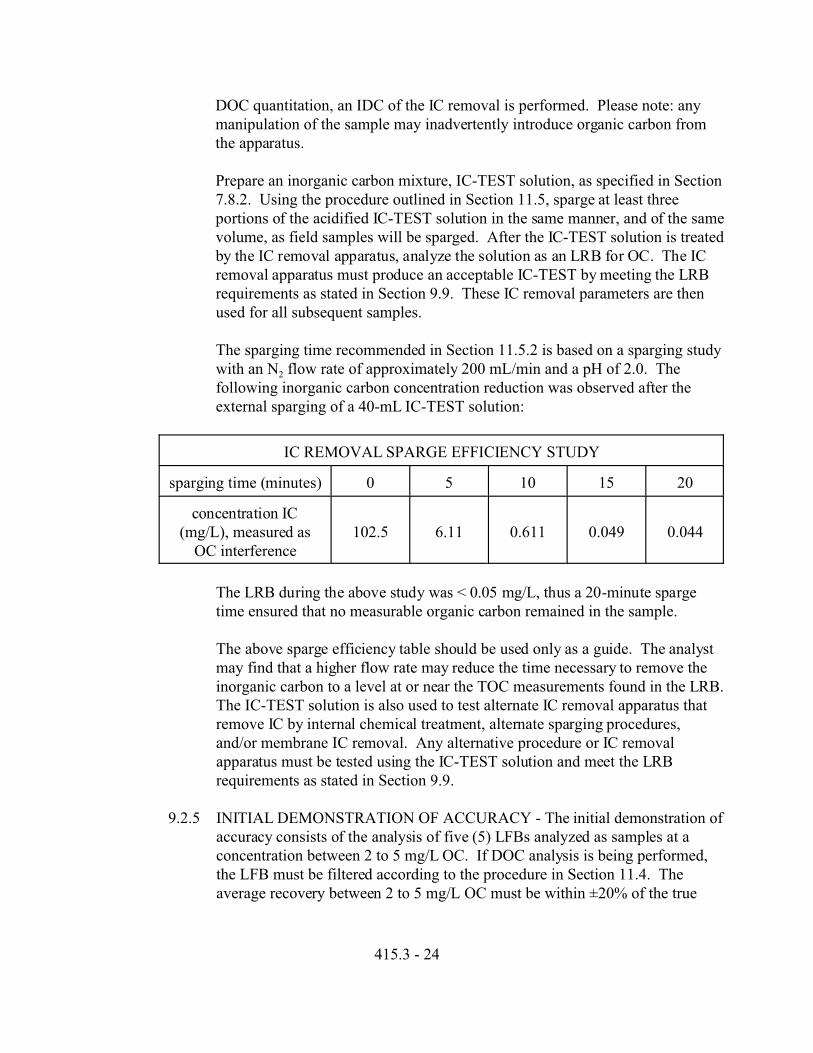
DOC quantitation, an IDC of the IC removal is performed. Please note: anymanipulation of the sample may inadvertently introduce organic carbon fromthe apparatus.
Prepare an inorganic carbon mixture, IC-TEST solution, as specified in Section7.8.2. Using the procedure outlined in Section 11.5, sparge at least threeportions of the acidified IC-TEST solution in the same manner, and of the samevolume, as field samples will be sparged. After the IC-TEST solution is treatedby the IC removal apparatus, analyze the solution as an LRB for OC. The ICremoval apparatus must produce an acceptable IC-TEST by meeting the LRBrequirements as stated in Section 9.9. These IC removal parameters are thenused for all subsequent samples.
The sparging time recommended in Section 11.5.2 is based on a sparging studywith an N2 flow rate of approximately 200 mL/min and a pH of 2.0. Thefollowing inorganic carbon concentration reduction was observed after theexternal sparging of a 40-mL IC-TEST solution:
IC REMOVAL SPARGE EFFICIENCY STUDY
sparging time (minutes) 0 5 10 15 20
concentration IC(mg/L), measured as
OC interference102.5 6.11 0.611 0.049 0.044
The LRB during the above study was < 0.05 mg/L, thus a 20-minute spargetime ensured that no measurable organic carbon remained in the sample.
The above sparge efficiency table should be used only as a guide. The analystmay find that a higher flow rate may reduce the time necessary to remove theinorganic carbon to a level at or near the TOC measurements found in the LRB. The IC-TEST solution is also used to test alternate IC removal apparatus thatremove IC by internal chemical treatment, alternate sparging procedures,and/or membrane IC removal. Any alternative procedure or IC removalapparatus must be tested using the IC-TEST solution and meet the LRBrequirements as stated in Section 9.9.
9.2.5 INITIAL DEMONSTRATION OF ACCURACY - The initial demonstration ofaccuracy consists of the analysis of five (5) LFBs analyzed as samples at aconcentration between 2 to 5 mg/L OC. If DOC analysis is being performed,the LFB must be filtered according to the procedure in Section 11.4. Theaverage recovery between 2 to 5 mg/L OC must be within ±20% of the true

415.3 - 25
value. If ±20% of the true value is exceeded, identify and correct the problemand repeat Sections 9.2.5 and 9.2.6.
9.2.6 INITIAL DEMONSTRATION OF PRECISION - Calculate the averageprecision of the replicates in the Initial Demonstration of Accuracy (Sect.9.2.5). The RSD% must be no greater than 20%. If the RSD% exceeds 20%,identify and correct the problem and repeat Sections 9.2.5 and 9.2.6.
9.2.7 ORGANIC CARBON DETECTION LIMIT (OCDL) DETERMINATION -The OCDL determination must be conducted over at least three (3) days with aminimum of seven (n=7) replicate LFB analyses. Before conducting the initialOCDL, the OC-CAL-1 standard is used to estimate the starting concentrationfor the OCDL study. If DOC analyses are being performed, the low-level LFBsmust be filtered according to procedure in Section 11.4 prior to analysis for theOCDL. If the instrument can easily detect the OC-CAL-1 standard, the analystshould lower the concentration to a level so that the LFB produces a signal 2 to5 times the background noise level of the instrument. It is recommended thatthe LFB be fortified somewhere between 0.1 to 0.5 mg/L OC. All availableinstrument digits are carried for the OCDL calculation. After completion of theOCDL, the calculation is rounded up or down according to Standard Methods,1050 B.15 The final result is reported in units used for the TOC or DOCprocedure and recorded to two significant figures in the instrument log book. Calculate the OCDL using the equation:
Organic Carbon Detection Limit = St( n - 1, 1 - alpha = 0.99)
where:
t(n-1,1-alpha = 0.99) = Student's t value for the 99% confidence level with n-1 degreesof freedom (t = 3.14 for 7 replicates)n = number of replicates, andS = standard deviation of replicate analyses.
If the initial OCDL exceeds 0.35 mg/L or the mean recovery of the LFB used inthe OCDL determination exceeds + 50% of the true value, then the OCDLdetermination must be repeated.
9.3 INITIAL DEMONSTRATION OF CAPABILITY FOR DOC DETERMINATION
9.3.1 Perform Sections 9.2.1 through 9.2.4 as prescribed for TOC.
9.3.2 INITIAL DEMONSTRATION OF FILTER MEMBRANE SUITABILITY -Filter membranes are capable of affecting DOC and UVA analyses either bydesorption (leaching) of DOC and UV-absorbing materials from the filters to

415.3 - 26
the samples, or by adsorption (uptake) of DOC and UV-absorbing materialsfrom the samples onto the filters. Filter membranes selected for DOC andUVA measurements must not desorb nor adsorb significant DOC and UV-absorbing materials. Desorption is minimized by pre-washing selected filtersas described in Section 9.3.2.2. Adsorption is minimized by filtering a portionof the sample to waste before sample collection as described in Section 9.3.2.3. Because the filtration of relatively turbid samples may cause filters to clog, pre-filtration may be necessary and pre-filter preparation is described in Section9.3.2.1. Due to the possibility of lot-to-lot variations in the levels ofcontamination or adsorption, it is recommended that for each filter lot, the userdetermine the amount of LRW needed to wash the filters and the amount ofsample that needs to be filtered and discarded prior to collection of filtrate(filter-to-waste volume). A minimum of three filters (from each new lot)should be cleaned and checked for desorption/adsorption prior to using thefilters for actual samples. This evaluation must be repeated when filters arepurchased from another manufacturer or when the type of filter being used ischanged.
9.3.2.1 PRE-FILTER PREPARATION - If the analyst anticipates that the UVAand DOC sample will clog the 0.45-µm pore size filter membranebefore enough filtrate can be collected, glass fiber pre-filters withoutorganic binders may be used. Karanfil et al 10 suggested cleaning thepre-filter by heating to 550 °C for one hour, cooling to roomtemperature, then washing it with 500 mL of LRW. A 25-mL filter-to-waste volume (Sect. 9.3.2.3) was also recommended. The pre-filtersmust be demonstrated as acceptable using the procedures describedbelow in Sections 9.3.2.2 and 9.3.2.3. Depending on the design of thefilter apparatus, the analyst may be able to insert a pre-filter into thefilter apparatus. The pre-filter and filter apparatus could then bewashed as a unit, following the procedure in Section 9.3.2.2. Prefilteradsorption and desorption may also be tested separately from the filtermembrane.
9.3.2.2 FILTER CLEANING - UV-absorbing materials and DOC are removedfrom the filter and filter apparatus by passing LRW through the filter. The volume of LRW required depends on the type and disc size of thefilter. For the filter apparatus used to generate the data in this method,three successive rinses of 250 mL each (for a total of 750 mL) removedUV-absorbing materials and DOC that could leach from the filter andapparatus. (The Karanfil 10 study found that a 500 mL wash wassufficient to prepare the 47-mm disk filters recommended in their studyfor DOC samples and a wash of 100 mL was sufficient for filters usedsolely to prepare UVA samples.) Acceptable cleaning is demonstratedby analyzing filter blanks (Sects. 11.4.3, 11.6) and meeting the criteria
415.3 - 27
in Section 9.9. The volume of LRW required to obtain acceptable filterblanks is then used to clean filters for analyses of all samples (Sect.11.4). Filters that cannot be cleaned to meet the referenced criteriamust not be used in the preparation of DOC and UVA samples.
9.3.2.3 FILTER-TO-WASTE VOLUME DETERMINATION - In order tominimize the loss of sample onto the filter by adsorption, a portion ofthe sample must be used to saturate the adsorption sites on the filterafter it is cleaned according to Section 9.3.2.2. The amount of samplefiltrate that must be discarded prior to collecting filtrate for DOC and/orUVA analyses will vary depending upon the type and size of filter andthe volume should be minimized in order to prevent filter clogging. A25-mL filter-to-waste volume was recommended when using thehydrophilic polyethersulfone and hydrophilic polypropylene filters of47-mm disc size studied by Karanfil et al 10 based on evaluations usinglow-turbidity model waters prepared from preconcentrated humic andfulvic materials.
In this method, a low-turbidity (i.e., TOC = DOC) finished watersample can be used in the filter-to-waste determination. Forlaboratories that are analyzing samples from a variety of sources, theselected water should have a TOC concentration in the range of 1 to 3mg/L. For laboratories that only analyze samples from one source, theselected water should be a finished water with the lowest TOC that isgenerally observed (NOTE: Depending on the quality of the sourcewater, this could be water with a TOC concentration much higher thanthe 1 to 3 mg/L recommended for laboratories that are analyzingsamples from a variety of sources.)
A series of at least three filtrates are collected in separate containers forthe filter-to-waste volume determination. The volume of each filtrate isdetermined based on the minimum volume required to make ananalytical determination. For example, if the DOC analysis requires 30mL, then a series of at least three successive 30-mL filtrates should becollected. For UVA, three successive 10-mL filtrates can be collected. If DOC and UVA analyses are to be performed on the same filtrate,then the volume of each filtrate should be adjusted to provide theminimum volume necessary to accommodate both analyses (in theabove example, three successive 40-mL washes).
Each filtrate is analyzed according to the procedure in Section 11 andthe concentration is compared to the concentration of the unfilteredsample. When the concentration of the filtrate is within ± 15% of theconcentration measured in the unfiltered sample, then the recommended

415.3 - 28
filter-to-waste volume is the sum of the volumes of that filtrate and anyprevious filtrates in the series. For example, if the unfiltered samplehas a TOC concentration of 3.5 mg/L and the filtrate series (each filtrate= 30 mL) have concentrations of 2.3, 3.2, and 3.4 mg/L, then aminimum of 60 mL of sample should be filtered-to-waste prior tocollecting filtrate for DOC analyses. It is recommended that the filter-to-waste volume be determined by performing this test on at least threefilters from each lot and averaging the results. Filters that requirelarge volumes of filter-to-waste should be avoided, because they willbe more subject to clogging prior to the collection of the necessaryvolume of filtrate for analysis. The filter-to-waste volume that isdetermined in this section must be used in the filtration proceduredescribed in Section 11.4.4.
9.3.3 Perform Sections 9.2.5 through 9.2.7 using filtered LFBs. The LFBs must beprepared using the same procedure used to prepare samples (Sect. 11.4).
9.4 INITIAL DEMONSTRATION OF CAPABILITY FOR UVA DETERMINATION
9.4.1 INITIAL CHECK OF SPECTROPHOTOMETER PERFORMANCE - The UVSpectrophotometer must be checked annually for 0 % transmittance,wavelength accuracy, stray radiant energy, accuracy and linearity, and opticalalignment. It is recommended that the instrument performance be verifiedthrough the manufacturer or a scientific instrument service company. Ifindependent verification of performance is not feasible, the laboratory mayacquire a certified spectrophotometric filter set and conduct the evaluation. Wavelength verification is made using certified spectrophotometric filter setswith values traceable to NIST. Using the filter set, test two wavelengthsbetween 220 and 340 nm. The instrument performance should be recorded inthe instrument log and be used to monitor the spectrophotometer performanceover time. Follow the instrument manufacturer’s operation manual whenmeasuring the acceptable wavelength transmittance limits.
9.4.2 Verify the spectrophotometer performance according to the procedure asoutlined in Section 10.4.
9.4.3 Conduct the filter membrane suitability study described in Section 9.3.2 forUVA.
9.5 CONTINUING CALIBRATION CHECK (CCC) - With each analysis batch, analyze aLow-CCC at or below the MRL (Sect. 9.10) prior to TOC or DOC sample analysis. Subsequent CCCs are analyzed after every ten samples and after the last sample. Theconcentrations should be rotated to cover the instrument calibration range. A Mid-CCC is required during every analysis batch. Acceptance criteria are as follows: Low-

415.3 - 29
CCC, + 50% of true value; Mid-CCC, + 20% of true value; High-CCC, + 15% of truevalue, see Section 10.3 for concentrations.
9.6 FIELD DUPLICATE (FD) - Within each analysis batch, a minimum of one set of fieldduplicates must be analyzed (FD1 and FD2). Sample homogeneity and the chemicalnature of the sample matrix can affect analyte recovery and the quality of the data. Duplicate sample analyses serve as a check on sampling and laboratory precision. Two samples are collected at the field site and are treated exactly alike.
9.6.1 Calculate the relative percent difference (RPD) for duplicate measurements(FD1 and FD2) using the equation:
9.6.2 Relative percent difference for field duplicates having an average concentrationof > 2 mg/L OC should fall in the range of < 20% RPD. If field duplicates inthis concentration range exhibit an RPD greater than 20%, results should beflagged and the cause for the greater difference (e.g. incomplete IC removal ormatrix interference), investigated. UVA readings should be < 10% RPD. NOTE: Greater variability may be observed for samples with OC approachingthe OCDL.
9.7 LABORATORY FORTIFIED BLANK (LFB) - Within each DOC analysis batch,analyze an aliquot of reagent water or other blank matrix which has been fortified withKHP at a concentration of 1-5 mg/L OC. Recovery for the LFB must be within ±20%of the true value. One LFB is required with each DOC analysis batch. For the DOCanalysis, an LFB is subjected to the same preparation and analysis as a sample,including filtration (Sect. 11.4). The LFB is not determined for the TOC or UVAmeasurements.
9.8 LABORATORY FORTIFIED MATRIX (LFM) - Within each TOC or DOC analysisbatch, an aliquot of one field sample is fortified with an aliquot of the OC-PDS (Sect.7.8.3). The spike concentration used should result in an increase in the LFMconcentration of 50 to 200% of its measured or expected concentration. Over time,samples from all routine sample sources should be fortified. For DOC analysis, theLFM is filtered prior to acidification and analysis.
9.8.1 Calculate the percent spike recovery (%REC) using the equation:

415.3 - 30
whereA = measured concentration in the fortified sampleB = measured concentration in the unfortified sample,andC = fortification concentration.
9.8.2 Recoveries may exhibit a matrix dependence. If the LFM recovery falls outsideof 70 to 130% for any fortified concentration, the analyst should suspect thatinorganic carbon was not properly removed (Sect. 11.5) from the sample or thatcontamination or matrix interference exists (Sect. 4) and can not be removed. If the source of the poor recovery can not be identified, the analyst should labelthe sample report “suspect/contamination or matrix interference” to inform thedata user that the sample data quality is questionable but should not be rejected. Failure to meet the recovery criteria after repeated sampling may suggest thatthe sample matrix may need further study.
9.9 LABORATORY REAGENT BLANK (LRB) AND FILTER BLANK (FB) - Withineach analysis batch, a minimum of one LRB must be analyzed. For DOC and UVAanalysis, the FB serves as the LRB. If more than one lot of filters is used in a DOC orUVA analytical batch, a FB must be analyzed for each lot. The analyst should beaware that additional filter blanks, up to one for each sample, are required by someregulations (e.g., 40 CFR 141.131(d)(4)(i)).
The LRB or FB is used to assess contamination from the laboratory environment andbackground contamination from the reagents used in sample processing and is treatedexactly the same as a sample. The volume of the FB must be the same as the samplevolume. If UVA is to be determined, the FB (UVA-FB) must have an absorbance of < 0.01 cm-1 UVA. The LRB and/or the FB (DOC-FB) must be < 0.35 mg/L OC. If0.35 mg/L OC or 0.01 cm-1 UVA is exceeded, background carbon or reagentcontamination should be suspected. The cause for significant changes in the LRB orFB value must be identified and any determined source of contamination must beeliminated. For the FB, this may mean redetermination of filter membrane suitability(Sect. 9.3.2). The cause of the contamination and the corrective action used to remedythe problem is then recorded in the instrument log for future reference.
9.10 MINIMUM REPORTING LEVEL (MRL) - The OCDL should not be used as theMRL. For TOC analysis, it is recommended that an MRL be established no lower thanthe mean LRB measurement plus 3F, or two times the mean LRB measurement,whichever is greater. For DOC analysis, the FB is substituted for the LRB. This valueshould be calculated over a period of time, to reflect variability in the blankmeasurements. Although the lowest calibration standard for OC may be belowthe MRL, the MRL for OC must never be established at a concentration lowerthan the lowest OC calibration standard.

415.3 - 31
9.11 QUALITY CONTROL SAMPLE (QCS) - During the analysis of the IDC (Sects. 9.2,9.3), each time new OC-PDS solutions are prepared (Sect. 7.8.3), or at least quarterly,analyze a QCS from a source different from the source of the calibration standards. The QCS is used to provide an independent verification of the method and the TOCinstrument system. To verify the stock or calibration solutions by comparison with theQCS, dilute the calibration solution and QCS to a concentration in the mid range of thecalibration curve (approx. 1 - 5 mg/L TOC) in the same manner that the OC-CALstandards are made (Sect. 7.8.4). Acceptable verification of the calibration is madewhen the means of 3 analyses for both the calibration solution and QCS, having aconcentration range between 1 to 5 mg/L OC, agree to within ±20% of the true value. If the measured QCS concentration is not within ±20% of the true value, thecalibration solution must be remade and/or the source of the problem must bedetermined and corrected. Analysis of the QCS only applies to TOC and DOCdetermination.
9.12 SPECTROPHOTOMETER CHECK REQUIREMENT - The performance of thespectrophotometer is initially demonstrated using the procedure in Section 9.4.1. Theday-to-day performance of the spectrophotometer is checked using KHP-SCS (Sect.7.10) or a commercially available SCS (COMM-SCS, Sect. 7.9) according to theprocedure in Section 10.4.
10.0 CALIBRATION AND STANDARDIZATION
10.1 INSTRUMENT SET UP AND OPTIMIZATION - Prior to calibrating the TOCinstrument, clean the instrument system with carbon dioxide free water and spargereagents with ultra high purity reagent gas as specified by the instrument manufacturerto remove background carbon dioxide. NOTE: TOC Instrument 1 does not requirereagent gas for operation. Monitor the instrument background carbon dioxide levelsfor at least 30 minutes or until the background signal reaches the manufacturer’srecommended level. The instrument should have a stable background and be free fromdrift caused by CO2 contaminated gas or leaks in the system. Adjust instrumenttemperature, reagent gas and reagent pump flow settings according to themanufacturer’s operation manual. Some instruments may require reagent priming runsto clean the flow injection system and reduce carbon background. After the instrumentis judged to be stable, load the auto-injector or prepare to manually inject four LRBsamples and start the analysis. The data collected from the first injection of LRB isdiscarded and is considered a system cleanup blank. The next three LRB injectionsshould produce consecutive readings that fall within 20% of their mean. If theseconditions are met, the instrument is ready for calibration. If not, use the OC-CAL-1standard and repeat this section. If the three injections of OC-CAL-1 do not produceconsecutive readings that fall within 20% of their mean, the instrument is not ready tooperate and maintenance must be performed according to the instrument operationmanual before proceeding.

415.3 - 32
10.2 CALIBRATION CURVE - A new calibration curve is generated when fresh standardsare made (Sect. 7.8.4) or when CCCs fall out of QC limits (Sect. 10.3). Use a CB andat least four OC-CAL standards that span the concentration range of the samples to beanalyzed. For example, if the samples to be analyzed are low in concentration (a rangefalling between 0.5 to 5 mg/L OC), prepare a calibration blank and a minimum of fourTOC calibration standards (CB, OC-CAL 1 - 4, see Sect. 7.8.4). The lowestconcentration calibration standard must be at or below the MRL, which may depend onsystem sensitivity. Add an additional 40 µL of H3PO4, HCl, or H2SO4, depending uponinstrument requirements (Sect. 8.0), to the 40-mL injection vial(s). Sparge thecalibration standards using the IC removal procedure in Section 11.5 prior tocalibrating the instrument. Inject the standards from low to high concentration andcalibrate the instrument. Be careful not to extend the calibration range over too wideof a concentration range as flow injection memory may cause analytical error (Sect.9.2.3). The optional OC-CAL 6 - 7 may be used when operating the instrument in ahigher concentration range. NOTE: For instruments that have an internal calibration setting, the calibration ischecked by comparing the five point calibration curve with the internal calibrationpoint. If the five point calibration curve does not agree with the internal calibrationusing the CCC criteria in Section 10.3, the internal calibration of TOC instrumentmust be reset by the manufacturer or adjusted by the analyst, following themanufacturer’s operation manual.
10.2.1 With the instrument in the ready mode, initiate the automated instrumentcalibration routine as per the instrument manufacturer’s operation manual. The computer generated calibration curve must have r2 $ 0.993 beforeproceeding with analyses. Ideally the instrument calibration should be r2 $ 0.9995 for best results. After the instrument system has been calibrated,verify the calibration using the Continuing Calibration Check (CCC, Sect.10.3)and QCS (Sect. 9.11).
10.2.2 Save the data from the initial calibration curve and record it in the laboratorynotebook or instrument log. The initial calibration curve serves as a historicalreference so that future calibrations curves can be compared to determine if theslope or sensitivity of calibration has changed. If the slope or sensitivity of theinstrument changes such that QC requirements cannot be met, consult theinstrument manual or lab SOP for corrective action, which may includeinstrument maintenance and recalibration.
10.3 CONTINUING CALIBRATION CHECK (CCC) - Demonstration and documentationof continuing calibration is required and must meet the requirements listed below. TheCCC solutions are made up weekly or just prior to a sample run and are prepared in thesame manner as the OC-CALs (Sect. 7.8.4). An analysis batch begins with theanalysis of a Low-CCC. CCCs are analyzed every 10 samples and must also include a

415.3 - 33
Mid-CCC. Subsequent CCCs should alternate between low, medium, and highconcentrations, and must end the analysis batch. In summary, at least one Low-CCCand one Mid-CCC is analyzed with each analysis batch in order to verify thecalibration curve. It is recommended that low, mid, and high CCCs be used to verifythe calibration curve over time.
10.3.1 Low-CCC - the concentration range may vary from as low as 2 times theOCDL up to 0.7 mg/L OC. The Low-CCC is used to verify the low end of thecalibration and must be at or below the MRL, which may depend on systemsensitivity. The recovery for the Low-CCC must be within + 50% of the truevalue.
10.3.2 Mid-CCC - the concentration is varied between 1.0 mg/L to 5.0 mg/L OC. The purpose of this CCC is to verify the precision and accuracy at thecalibration range where critical source water treatment decisions are made. The Mid-CCC concentration may be varied to meet changing regulatoryrequirements. The Mid-range CCC must be within ±20% of the true value. Ifit is not, the TOC instrument system must be re-calibrated.
10.3.3 High-CCC - the concentration range is varied between 5 to 50 mg/L OC. Theselection of the High-CCC should be near the concentration of the highest OC-CAL standard used. The purpose of this CCC is to bracket the concentrationthe samples that are typically analyzed and to verify the upper range of thecalibration curve. High-CCC must be within ±15% of the true value. If it isnot, the TOC instrument system must be re-calibrated.
10.4 SPECTROPHOTOMETER PERFORMANCE CHECK - The performance of thespectrophotometer is initially demonstrated using the procedure in Section 9.4.1. Theday-to-day performance of the spectrophotometer is checked using KHP-SCS (Sect.7.10) or a commercially available SCS (COMM-SCS, Sect. 7.9) prior to analyzing anyUVA samples using the procedure described below.
10.4.1 Using a transfer pipet fill the spectrophotometer cell with the COMM-BKS orKHP-SCS-BLANK (Sects. 7.9.1, 7.10.1). Use this solution to zero thespectrophotometer.
10.4.2 After the spectrophotometer is zeroed, empty the cell, clean with LRW, rinsewith methanol, dry with N2 or reagent grade air, and fill it with the KHP-SCSor COMM-SCS.
10.4.3 Read the UVA of the KHP-SCS or COMM-SCS. The reading must be within10% of the expected absorbance value. Record the absorbance of the KHP-SCS or COMM-SCS in the spectrophotometer instrument logbook. Empty the
415.3 - 34
cell, clean with LRW, rinse with methanol, and dry with N2 or reagent gradeair.
10.4.4 If the SCS absorbance criteria stated above cannot be met, discard the COMM-SCS or the KHP-SCS and purchase new COMM-SCS or remake the KHP-SCS. Repeat Section 10.4.
11.0 PROCEDURE
11.1 TOC/DOC SAMPLE INTEGRITY EVALUATION - It is important to analyze a TOCor DOC sample as directly and as soon as possible. Sample handling and preparationshould be minimized. Upon receiving the sample from the field, the analyst mustdetermine if the sample was treated and stored according to instructions found inSection 8.
11.2 OPTIONAL TREATMENT FOR TOC/DOC SAMPLE MATRIX LOSS - Aquatichumic substances precipitate at pH below 2 16, and may move to glass vessel walls orinstrument tubing. If the analyst suspects that humic substances have precipitated(which sometimes occurs in blackwaters)14 or flocked to the bottom of the samplecontainer, the sample is degassed by sparging to remove IC as directed in Section 11.5. The sample is then split into two portions. One portion is left at a pH #2, and the pHof the second portion is adjusted to pH 5 to 7 in order to increase the solubility ofhydrophobic matter in the sample. Both samples are allowed to sit capped for ½ hourbefore further sample processing. These samples are treated in the same manner asfield duplicates (FD), Section 9.6. The results of both split samples and correspondingpH values should be reported to the data user.
11.3 TOC SAMPLE PREPARATION - Remove the TOC sample from cold storage andallow the sample to come to room temperature. Determine if the sample has beenpreserved by acidification to a pH #2 by placing some drops on pH paper or bypouring some of the sample into a small beaker and checking it with a glass or solid-state pH electrode. Do Not put the pH paper or electrode into the sample bottle. If thepH is greater than 2, discard the sample.
11.3.1 TYPICAL TOC SAMPLE PRE-TREATMENT - Samples that appear to below in particulate and suspended material are generally transferred directly tothe 40-mL injection vial. If the sample appears to contain sediment or floatingmaterial, allow the sample to sit for a minute or two to allow sediment materialto settle back to the bottom of the bottle. After allowing the sample to settle, transfer the sample from the middle of the bottle using a disposable pipet to theinjection vial. Add 40 µL of H3PO4, HCl, or H2SO4 depending upon instrumentrequirements (Sect. 8.0) to the 40-mL injection vial and label it.
11.3.2 Proceed to Section 11.5, for IC removal.

415.3 - 35
11.4 SUVA SAMPLE PREPARATION - If SUVA is not being determined, proceed toSection 11.5. The SUVA determination consists of paired sample analyses composedof a DOC sample and a UVA sample. DOC and UVA samples may be taken from thesame bottle, or may be taken from separate field duplicate bottles. Remove the DOCand UVA sample(s) from cold storage and allow them to come to room temperature. The laboratory is required to document any use of alternative filters, apparatus (seenote, Sect. 6.1), or changes in the SUVA sample preparation procedure. All QCrequirements (Sect. 9) must be met.
11.4.1 Samples for DOC and UVA analysis are NOT acidified in the field. The DOCsample is acidified after filtration as described below and the UVA sample isnot acidified at all. Determine if the sample(s) was accidentally preserved byplacing a few drops from the sample on pH paper or by pouring some of thesample into a small beaker and checking it with a glass or solid-state pHelectrode. Do Not put the pH paper or electrode into the sample bottle. Placing the pH paper or electrode into the sample bottle will contaminate thesample solution with organic carbon. If this happens, the sample must bediscarded. If the UVA sample pH is #2, check to make sure that the sample isactually for the UVA determination. It is possible that this sample is a TOC orfiltered DOC sample and was mislabeled as a UVA sample. If the sample setwas not mislabeled or switched but accidentally preserved, the sample must bediscarded. The analyst must check the date and time of collection to ensurethat the sample holding times listed in Section 8.1 have been met.
11.4.2 Filter Cleaning - Cleaning the filter apparatus, including the filter, removestrace organic compounds that may have been left behind in the manufacturingprocess. This cleaning must be done immediately prior to sample filtration. Rinse the filter with LRW, using the cleaning procedure used to determinefilter membrane suitability (Sect. 9.3.2.2), including the cleaning of the pre-filter if a pre-filter is necessary.
11.4.3 Filter Blank (FB) - Use a clean filter apparatus (prepared in Sect. 11.4.2) andfilter an aliquot of LRW into an injection vial for the DOC analysis and anotheraliquot of LRW into a vial for UVA analysis (Figure 1). FB volume must bethe same as the sample volume collected in Section 11.4.4. During thedevelopment of this method, approximately 250 mL of LRW was filtered andaliquots were poured into two 40-mL injection vials and labeled as the DOCand UVA FBs. If the DOC and UVA analyses are coming from two separatebottles, a filter apparatus will be needed for each bottle and an FB should beprepared from each apparatus. Add 40 µL of H3PO4, HCl, or H2SO4 (asrequired by the various instrument types, Sect. 8.0) to the 40-mL DOC-FBinjection vial. Do not acidify the UVA-FB injection vial. These vials arepaired with the respective SUVA sample and retained for DOC-FB and UVA-FB analyses.
415.3 - 36
11.4.4 Sample Preparation - Reassemble the filter apparatus. Pour enough sampleonto the filter to saturate any adsorption sites, as determined according to thefilter-to-waste procedure in Section 9.3.2.3. Apply vacuum until no visiblewater remains on the filter. Remove the vacuum, swirl the apparatus withsample filtrate, disassemble, and discard the sample filtrate rinse. Reassemblethe filter apparatus and pour an additional aliquot of sample into the top of thefilter apparatus. Attach the vacuum and retain the filtrate. Pour one aliquotinto a 40-mL injection vial and label it to identify it as the DOC sample. Poura second aliquot into a 40-mL injection vial and label it to identify it as theUVA sample. Add 40 µL of H3PO4, HCl, or H2SO4 to the 40-mL DOCinjection vial. Do not acidify the UVA injection vial. As with the DOC andUV FBs (Sect. 11.4.3), separate filter apparatus may be used for the DOC andUVA samples, in which case the filtrate need not be split into two aliquots. For a sample that is difficult to filter, an additional filter apparatus or theoptional pre-filter insert apparatus may be used. The use of additional filtersmay require the collection of additional FBs, collected as specified in Section11.4.3. The resulting additional DOC-FB, UVA-FB sample filtrates arecollected, their volumes composited and then placed into their respectiveinjection vials.
11.5 INORGANIC CARBON REMOVAL - All OC-CALs, TOC and DOC samples,DOC-FBs, and LRBs must be treated to remove IC prior to OC analysis. UVAsamples and UVA-FBs are not sparged with nitrogen gas or otherwise treated toremove IC prior to analysis (See Figure 2). The laboratory is required to documentany use of alternative IC removal apparatus (Sects. 6.9, 11.5.2) or changes in the ICremoval procedure. All quality control requirements (Sect. 9.2.4) must be met. NOTE: If a sparging apparatus is used, it should be isolated from the organiclaboratory and be free of organic contaminants.
11.5.1 CLEANING SPARGING APPARATUS: Before initial use and immediatelyafter each use, the sparging apparatus must be cleaned. With the nitrogenturned off, dip the stainless steel needles in a 40-mL injection vial containingdilute acid (40 µL H3PO4, HCL, or H2SO4 per 40 mL LRW). Take the needlesout of the dilute acid and turn the nitrogen back on to flush out any residualdilute acid. If disposable pipettes are used as part of the sparging apparatus,discard the pipettes after each use instead of attempting to clean and reuse them.
11.5.2 SPARGING PROCEDURE: Submerge the apparatus needles used to spargethe samples near the bottom of the 40-mL sample injection vial. Datagenerated for this method were generated by externally sparging the acidifiedsamples with nitrogen gas, at 100 to 200 mL/minute, for 20 minutes per 40-mLsample injection vial. Some instrument companies provide optional inorganic

415.3 - 37
carbon removal apparatus that may produce an efficient means for the removalof IC. The laboratory must demonstrate sparging efficiency by the performanceof the IC removal sparging efficiency test (Sect. 9.2.4 ) and meeting the LRBrequirements as stated in Section 9.9.
11.6 SAMPLE ASSAY
11.6.1 TOC/DOC Sample Analysis - This is accomplished by placing into theinjection vial tray a series of 40-mL injection vials usually containing any or allof the following types of samples: LRB, DOC-FB, CB, OC-CAL(s), CCC s(Low, Mid or High concentration), field samples, FD1 & FD2, LRB betweensamples if needed as specified in Section 9.2.3, LFB, LFM, and the QCS. TheDOC-FB maximum allowable background concentration is 0.35 mg/L OC. The injection tray is placed into the instrument, the run is initiated, and theresults of analyses are recorded.
11.6.2 UVA ANALYSES - If the spectrophotometer performance meets the SCSabsorbance criteria as stated in Section 10.4, zero the instrument with theempty cell. Next fill the cell with the UVA-FB and read the absorbance. The UVA-FB’s maximum allowable background absorbance is 0.01 cm-1 UVA. If0.01 cm-1 UVA for the UVA-FB is exceeded, the cause must be identified andany determined source of contamination must be eliminated. Thespectrophotometer performance must then be rechecked (Sect. 10.4). Thelaboratory should also check the initial zero each time 10 samples have beenread. Rinse the spectrophotometer cell with a small amount of the UVAsample or UVA-FB by directly pipetting or pouring the sample into thespectrophotometer cell and discarding the rinse. Refill the spectrophotometercell, carefully clean the cell window, and place in the spectrophotometer cellholder. Alternatively, flow cells maybe used, filled and flushed as needed. Measure the UVA and record. If field duplicates are collected, the FD1 & FD2sample filtrates are also read and recorded.
12.0 DATA ANALYSIS AND CALCULATION
12.1 TOC DIRECT READING: The TOC concentration is calculated by the automatedinstrument system’s software. Follow the instrument manufacturer’s operation manualwhen making instrument response adjustments for instrument system blankcorrections. The TOC calculation assumes that the sample has been properlypreserved, that only a trace amount of IC remains following the IC removal procedure,and that any remaining IC will not contribute to the TOC measurement and result in acalculation error. Some instrument systems calculate TOC from the difference of thetotal carbon (TC) minus the IC. The analyst is reminded that the IC in the sample isremoved prior to sample analysis. Therefore, the reported TC is equal to, and the same

415.3 - 38
as, the TOC value (TOC =TC) and is read directly from the instrument’s computer orprintout.
12.2 SUVA CALCULATION: Follow the instrument manufacturer’s operation manualinstructions when making instrument response adjustments for instrument systemblank correction. As in the above TOC calculation, the analyst is reminded that the ICof the DOC sample is removed prior to analysis. After filtration, the TOC instrumentvalue is equal to the DOC. The SUVA is then calculated from the DOC & UVA datathat results from the procedure as described above (Sects. 11.6.1, 11.6.2). The UVA ofthe sample in cm-1 is divided by the DOC of the sample, multiplied by 100 cm/M andeither reported in units of L/mg-M or as “SUVA”. The SUVA is calculated as follows:
SUVA (L/mg-M) = UVA(cm-1) / DOC (mg/L) * 100 cm/M
UVA Calculation: UVA = A /d
where:
UVA = The calculated UV absorbance of the sample inabsorbance units (cm-1).
A = The measured UV absorbance at 254 nm of the
sample that is filtered through a 0.45-µm filtermedia.
d = The quartz cell path length in cm.
NOTE: A Filter Blank (FB) is used to monitor background carboncontamination (Sect. 11.4.3) and is not subtracted from the DOC andUVA measurements.
12.3 Calculations should utilize all available digits of precision, but final reportedconcentrations should be rounded to two significant figures (one digit of uncertainty). The final calculation is rounded up or down according to Standard Methods 1050B.15
13.0 METHOD PERFORMANCENOTE: Data presented in Section 17 are from single-laboratory determinations. Allavailable digits were used for calculation and the calculations were rounded prior toentry in the tables. The data were reported to as many as three significant figures togive the reader a better understanding of method performance.
13.1 Table 17.1 summarizes the 3-day organic carbon detection limit (OCDL) study for fiveTOC instruments systems. The DOC determination ranged from 0.02 to 0.08 mg/LOCDL and the TOC determination ranged from 0.04 to 0.12 mg/L OCDL. All source

415.3 - 39
water samples reported in Section 13 and the Section 17 Tables were sparged for 20minutes to remove inorganic carbon interferences.
13.2 Table 17.2 and associated sub-tables illustrate the single instrument precision andaccuracy for each of the five TOC instrument technologies.
13.3 Tables 17.3 and 17.4 illustrate the instrument differences and performances for fiveTOC instruments analyzing seven different source water matrices.
13.4 In all cases, the TOC instruments had difficulty in analyzing the Saint Leon well water. The Saint Leon well water had a moderately high inorganic carbon content ofapproximately 100 mg/L IC, and a low organic carbon content of 0.2 to 0.6 mg/L OC. The Saint Leon well water organic carbon content was near the organic carbondetection limit. The low OC concentration produced the greatest differences betweeninstrument responses. For low TOC samples with high IC, differences betweeninstrument responses may be more apparent due to possible IC interference.
13.5 The TOC, DOC and SUVA procedures of this method are dependent on the operationmanual for the TOC instrument system and the UV spectrophotometer as provided bythe respective instrument manufacturers. However, all performance criteria andquality control requirements described in this method, as summarized in Tables 17.5and 17.6, must be met.
14.0 POLLUTION PREVENTION
14.1 Pollution prevention encompasses any technique that reduces or eliminates thequantity or toxicity of waste at the point of generation. Numerous opportunities forpollution prevention exist in laboratory operations. The EPA has established apreferred hierarchy of environmental management techniques that places pollutionprevention as the management option of first choice. Whenever feasible, laboratorypersonnel should use pollution prevention techniques to address their waste generation. When wastes cannot be feasibly reduced at the source, the Agency recommendsrecycling as the next best option.
14.2 For information about pollution prevention that may be applicable to laboratories andresearch institutions, consult Less is Better: Laboratory Chemical Management forWaste Reduction, available from the American Chemical Society's Department ofGovernment Relations and Science Policy, 1155 16th Street N.W., Washington D.C.20036, (202)872-4477.
14.3 For recycle information, contact the US EPA, Pollution Prevention and WasteWiseprogram, http://www.epa.gov/wastewise/ .

415.3 - 40
1. Glaser, J. A.; Foerst, D. L.; McKee G. D.; Quave, S. A.; Budde, W. L. Trace Analysesfor Wastewaters. Environ. Sci. Technol. 1981, 15 (12), 1426-1434.
2. Benner, R.; Storm, M. A Critical Evaluation of the Analytical Blank Associated withDOC Measurements by High-Temperature Catalytic Oxidation. Mar. Chem. 1993, 41,153-160.
3. Standard Method 5910B: Ultraviolet Absorption Method. In Standard Methods for theExamination of Water and Wastewater, Eaton, A. D.; Clesceri, L. S.; Greenberg, A. E.,Eds.; American Public Health Association; Washington, DC, 1995; 19th ed.
4. Aiken, G.R. Chloride Interference in the Analysis of Dissolved Organic Carbon by theWet Oxidation Method. Environ. Sci. Technol. 1992, 26 (12), 2435-2439.
5. Sakamoto, T.; Miyasaka, T. TOC Analysis Study Confirming the Accuracy of a Methodfor Measuring TOC by Wet Oxidation. Ultrapure Water 1987, 24-31.
6. Potter, B. B.; Wimsatt, J. C. Preprints of Extended Abstracts, Vol 42 (1), 223rd NationalMeeting of the American Chemical Society, Orlando, FL, April 7-11, 2002; AmericanChemical Society Division of Environmental Chemistry: Cape Girardeau, MO, 2002;Paper 60, 559-564.
7. Aiken, G.; Kaplan, L. A.; Weishaar, J. Assessment of Relative Accuracy in theDetermination of Organic Matter Concentrations in Aquatic Systems. J. Environ. Monit.2002, 4, 70-74.
15.0 WASTE MANAGEMENT
15.1 The U.S. Environmental Protection Agency requires that laboratory waste managementpractices be conducted consistent with all applicable rules and regulations. TheAgency urges laboratories to protect the air, water, and land by minimizing andcontrolling all releases from hoods and bench operations, complying with the letter andspirit of any sewer discharge permits and regulations, and by complying with all solidand hazardous waste regulations, particularly the hazardous waste identification rulesand land disposal restrictions. For further information on waste management, consultThe Waste Management Manual for Laboratory Personnel, available from theAmerican Chemical Society at the address listed in Section 14.2.
15.2 The laboratory should consult with local authorities prior to disposal of any waste to publicly owned treatment works (POTW) and receive permission for that disposal.
16.0 REFERENCES

415.3 - 41
8. American Chemical Society, Committee on Chemical Safety. Safety in AcademicChemistry Laboratories, Vol. 2, Accident Prevention for Faculty and Administrators, 7th
ed.; American Chemical Society: Washington, DC, 2003.
9. Occupational Exposure to Hazardous Chemicals in Laboratories. Code of FederalRegulations, Part 1910.1450, Title 29, 2001.
10. Karanfil, T.; Erdogan, I.; Schlautman, M. A. Selecting Filter Membranes for MeasuringDOC and UV254. J.—Am. Water Works Assoc. 2003, 95 (3), 86-100.
11. Standard Method 1080: Reagent-Grade Water. In Standard Methods for the Examinationof Water and Wastewater, Eaton, A. D.; Clesceri, L. S.; Greenberg, A. E., Eds.; AmericanPublic Health Association; Washington, DC, 1995; 19th ed.
12. Schaffer, R. B.; Van Hall, C. E.; McDermott, G. N.; Barth, D.; Stenger, V. A.; Sebesta,S. J.; Griggs, S. H. Application of a Carbon Analyzer in Waste Treatment. J.—WaterPollut. Control Fed. 1965, 37 (11), 1545-1566.
13. Van Hall, C. E.; Barth, D.; Stenger, V. A. Elimination of Carbonates from AqueousSolutions Prior to Organic Carbon Determination. Anal. Chem. 1965, 37 (6), 769-771.
14. Kaplan, L.A. Comparison of High-Temperature and Persulfate Oxidation Methods forDetermination of Dissolved Organic Carbon in Freshwaters. Limnol. Oceanogr. 1992, 37(5), 1119-1125.
15. Standard Method 1050B: Significant Figures. In Standard Methods for the Examinationof Water and Wastewater, Eaton, A. D.; Clesceri, L. S.; Greenberg, A. E., Eds.; AmericanPublic Health Association; Washington, DC, 1995; 19th ed.
16. Standard Method 5510: Aquatic Humic Substances. In Standard Methods for theExamination of Water and Wastewater, Eaton, A. D.; Clesceri, L. S.; Greenberg, A. E.,Eds.; American Public Health Association; Washington, DC, 1995; 19th ed.

415.3 - 42
17.0 TABLES, DIAGRAMS, FLOWCHARTS, AND VALIDATION DATA
17.1 ORGANIC CARBON DETECTION LIMIT (OCDL)a
Dissolved Organic Carbon (DOC), mg/L
InstrumentFortified
Conc.b
MeanRecovered
Conc.%RSDc %RECd OCDL
1 0.130 0.155 11 119 0.054
2 0.125 0.116 22 93 0.082
3 0.250 0.249 4 100 0.035
4 0.130 0.125 5 96 0.018
5 0.250 0.233 9 93 0.068
Total Organic Carbon (TOC), mg/L
InstrumentFortified
Conc.
MeanRecovered
Conc.%RSDc %RECd OCDL
1 0.130 0.159 14 122 0.071
2 0.125 0.145 26 116 0.118
3 0.250 0.259 8 104 0.061
4 0.130 0.130 9 100 0.036
5 0.250 0.251 7 100 0.059
a Organic Carbon Detection Limits were determined by analyzing 7 replicates over 3 days.b LRW fortified as specified in the table.c %RSD = percent relative standard deviationd %REC = percent recovery
INSTRUMENT:1: UV/Persulfate/Wet Oxidation with Permeation/Conductivity Detection2: Elevated Temperature/Catalyzed/Persulfate/Wet Oxidation/Nondispersive Infrared Detection (NDIR)3: UV/Low Temperature/Persulfate/Wet Oxidation/NDIR4: Catalyzed/Combustion Oxidation(680 °C)/NDIR5: High Temperature Combustion Oxidation/NDIR

415.3 - 43
17.2 SINGLE TOC INSTRUMENT PRECISION AND ACCURACY
17.2.1 TOC Instrument 1: UV/persulfate wet oxidation withpermeation/conductivity detection
Dissolved Organic Carbon, mg/La
SourceWater
Unfortified SampleConc.
Fortified Sample Conc.
Mean %RSD Mean %REC
Boulder Creek 1.63 1.62 12.2 105
Shingobee R. 2.98 0.19 13.5 105
Bolten Well 1.27 0.00 12.0 107
Ohio R. (Fernbank) 2.79 0.36 13.6 108
Muddy Creek 3.81 0.15 14.6 108
Great Miami R. 3.18 0.00 13.7 104
Saint Leon Well 0.53 0.97 11.0 104
Total Organic Carbon, mg/La
Source Water
Unfortified SampleConc.
Fortified Sample Conc.
Mean %RSD Mean %REC
Boulder Creek 1.73 0.33 12.1 103
Shingobee R. 3.16 0.18 13.0 98
Bolten Well 1.32 0.44 11.4 100
Ohio R. (Fernbank) 3.02 0.57 13.2 102
Muddy Creek 4.24 0.00 14.6 103
Great Miami R. 3.51 0.33 13.8 102
Saint Leon Well 0.66 0.52 11.1 104
a N = 3, samples fortified at 10mg/L OC using KHP

415.3 - 44
17.2 SINGLE TOC INSTRUMENT PRECISION AND ACCURACY, cont’d.
17.2.2 TOC Instrument 2: Elevated temperature/catalyzed/persulfate wetoxidation/NDIR
Dissolved Organic Carbon, mg/La
SourceWater
UnfortifiedSample Conc.
Fortified Sample Conc.
Mean Mean %REC
Boulder Creek 1.40 11.8 104
Shingobee R. 2.58 13.3 106
Bolten Well 1.04 12.6 105
Ohio R. (Fernbank) 2.41 13.3 108
Muddy Creek 3.25 14.3 110
Great Miami R. 2.68 13.4 107
Saint Leon Well 0.40 10.6 101
Total Organic Carbon, mg/La
Source Water
UnfortifiedSample Conc.
Fortified Sample Conc.
Mean Mean %REC
Boulder Creek 1.38 11.2 98
Shingobee R. 2.62 12.7 100
Bolten Well 1.05 11.4 103
Ohio R. (Fernbank) 2.46 13.1 106
Muddy Creek 3.41 13.8 104
Great Miami R. 2.89 13.2 103
Saint Leon Well 0.38 10.5 102
a N = 2, samples fortified at 10mg/L OC using KHP

415.3 - 45
17.2 SINGLE TOC INSTRUMENT PRECISION AND ACCURACY, cont’d.
17.2.3 TOC Instrument 3: UV/low temperature/persulfate wet oxidation/NDIR
Dissolved Organic Carbon, mg/La
SourceWater
Unfortified SampleConc.
Fortified Sample Conc.
Mean %RSD Mean %REC
Boulder Creek 1.52 1.81 11.5 100
Shingobee R. 2.71 1.10 13.2 104
Bolten Well 1.18 1.76 11.3 101
Ohio R. (Fernbank) 2.50 0.74 13.1 106
Muddy Creek 3.38 0.81 14.0 106
Great Miami R. 2.91 0.64 13.1 102
Saint Leon Well 0.56 0.88 10.7 101
Total Organic Carbon, mg/La
Source Water
Unfortified SampleConc.
Fortified Sample Conc.
Mean %RSD Mean %REC
Boulder Creek 1.47 1.77 11.2 97
Shingobee R. 2.72 0.02 12.7 99
Bolten Well 1.16 2.45 11.0 98
Ohio R. (Fernbank) 2.58 1.01 12.6 100
Muddy Creek 3.18 1.28 13.5 103
Great Miami R. 2.92 1.01 13.0 101
Saint Leon Well 0.45 1.57 10.7 102a N = 3, samples fortified at 10 mg/L OC using KHP

415.3 - 46
17.2 SINGLE TOC INSTRUMENT PRECISION AND ACCURACY, cont’d.
17.2.4 TOC Instrument 4: Catalyzed, 680 °C combustion oxidation/NDIR
Dissolved Organic Carbon, mg/La
SourceWater
Unfortified SampleConc.
Fortified Sample Conc.
Mean %RSD Mean %REC
Boulder Creek 1.54 5.75 11.4 98
Shingobee R. 2.71 3.18 12.4 97
Bolten Well 1.24 1.25 12.4 98
Ohio R. (Fernbank) 2.52 5.73 12.4 98
Muddy Creek 3.56 3.17 13.3 98
Great Miami R. 3.00 6.94 12.7 96
Saint Leon Well 0.38 27.4 10.1 98
Total Organic Carbon, mg/La
Source Water
Unfortified SampleConc.
Fortified Sample Conc.
Mean %RSD Mean %REC
Boulder Creek 1.46 2.86 11 100
Shingobee R. 2.84 2.19 13 97
Bolten Well 1.12 1.70 11 100
Ohio R. (Fernbank) 2.81 1.79 13 100
Muddy Creek 4.04 2.02 14 96
Great Miami R. 3.42 1.66 14 101
Saint Leon Well 0.28 7.64 10 100
a N = 3, samples fortified at 10 mg/L OC using KHP
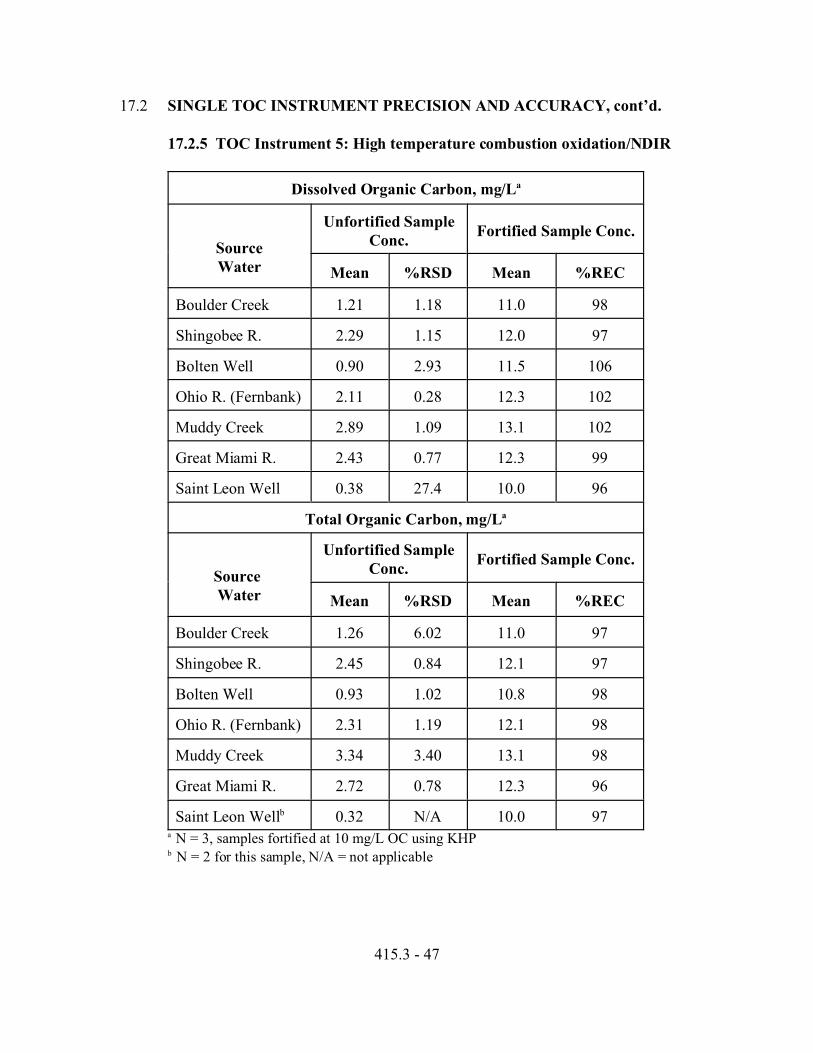
415.3 - 47
17.2 SINGLE TOC INSTRUMENT PRECISION AND ACCURACY, cont’d.
17.2.5 TOC Instrument 5: High temperature combustion oxidation/NDIR
Dissolved Organic Carbon, mg/La
SourceWater
Unfortified SampleConc.
Fortified Sample Conc.
Mean %RSD Mean %REC
Boulder Creek 1.21 1.18 11.0 98
Shingobee R. 2.29 1.15 12.0 97
Bolten Well 0.90 2.93 11.5 106
Ohio R. (Fernbank) 2.11 0.28 12.3 102
Muddy Creek 2.89 1.09 13.1 102
Great Miami R. 2.43 0.77 12.3 99
Saint Leon Well 0.38 27.4 10.0 96
Total Organic Carbon, mg/La
Source Water
Unfortified SampleConc.
Fortified Sample Conc.
Mean %RSD Mean %REC
Boulder Creek 1.26 6.02 11.0 97
Shingobee R. 2.45 0.84 12.1 97
Bolten Well 0.93 1.02 10.8 98
Ohio R. (Fernbank) 2.31 1.19 12.1 98
Muddy Creek 3.34 3.40 13.1 98
Great Miami R. 2.72 0.78 12.3 96
Saint Leon Wellb 0.32 N/A 10.0 97a N = 3, samples fortified at 10 mg/L OC using KHP
b N = 2 for this sample, N/A = not applicable

415.3 - 48
17.3 PRECISION AND ACCURACY DATA FOR DOC AND SUVA MEASURED INSEVEN SOURCE WATERS ON FIVE INSTRUMENTSa
17.3.1 DOC Measurements for Seven Source Waters, Three ReplicateInstrument Injections on Five Instruments
Dissolved Organic Carbon, mg/L, Unfortified Samples
Source WaterInst#1
Inst#2
Inst#3
Inst#4
Inst#5
MeanStdDev
%RSD
Boulder Creek 1.64 1.40 1.52 1.54 1.21 1.46 0.17 11
Shingobee R. 2.98 2.58 2.71 2.71 2.29 2.66 0.25 9
Bolton Well 1.27 1.04 1.18 1.24 0.90 1.13 0.15 14
Ohio R. (Fernbank) 2.79 2.41 2.50 2.52 2.12 2.47 0.24 10
Muddy Creek 3.81 3.25 3.38 3.56 2.89 3.38 0.34 10
Great Miami R. 3.18 2.69 2.91 3.00 2.43 2.84 0.29 10
St. Leon Well 0.53 0.40 0.56 0.38 0.25 0.42 0.13 30
17.3.2 DOC Measurements for Seven Source Waters, Fortified with KHP, ThreeReplicate Instrument Injections on Five Instruments
Dissolved Organic Carbon, mg/L, Samples Fortified at 10 mg/L OC
Source Water Inst #1 Inst #2 Inst #3 Inst #4 Inst #5 MeanStdDev
%RSD %RECb
Boulder Creek 12.2 11.8 11.5 11.4 11.0 11.6 0.43 4 101
Shingobee R. 13.5 13.3 13.2 12.4 12.0 12.9 0.62 5 102
Bolton Well 12.0 11.5 11.3 11.2 11.5 11.5 0.31 3 104
Ohio R. (Fernbank) 13.6 13.2 13.1 12.4 12.3 12.9 0.54 4 105
Muddy Creek 14.6 14.3 14.0 13.3 13.1 13.9 0.62 5 105
Great Miami R. 13.7 13.4 13.1 12.7 12.3 13.0 0.55 4 102
St. Leon Well 11.0 10.5 10.7 10.1 10.0 10.5 0.40 4 100a For instrument identification (by type) see Section 6.3.b % Recovery calculated as described in Section 9.8.

415.3 - 49
17.3 PRECISION AND ACCURACY DATA FOR DOC AND SUVA MEASURED INSEVEN SOURCE WATERS ON FIVE INSTRUMENTSa, cont’d.
17.3.3 Mean SUVA Calculation Based on the DOC Data in 17.3.1 for FiveSource Waters
Source WaterUVA(cm-1)
SUVA b (L/mg-M)
Inst #1 Inst #2 Inst #3 Inst #4 Inst #5 Mean
Boulder Creek 0.4324 2.62 3.08 2.84 2.97 3.58 3.02
Shingobee R. 0.7440 2.50 2.88 2.75 2.77 3.25 2.83
Bolton Well 0.2364 1.86 2.28 2.01 1.91 2.62 2.14
Ohio R. (Fernbank) 0.7267 2.60 3.01 2.90 2.88 3.43 2.97
Muddy Creek 1.124 2.95 3.46 3.33 3.20 3.89 3.37
Great Miami R. 0.8948 2.81 3.33 3.07 3.05 3.69 3.19
St. Leon Well 0.0771 1.46 1.93 1.38 1.83 3.13 1.95a For instrument identification (by type) see Section 6.3.b SUVA calculated as described in Section 12.2.
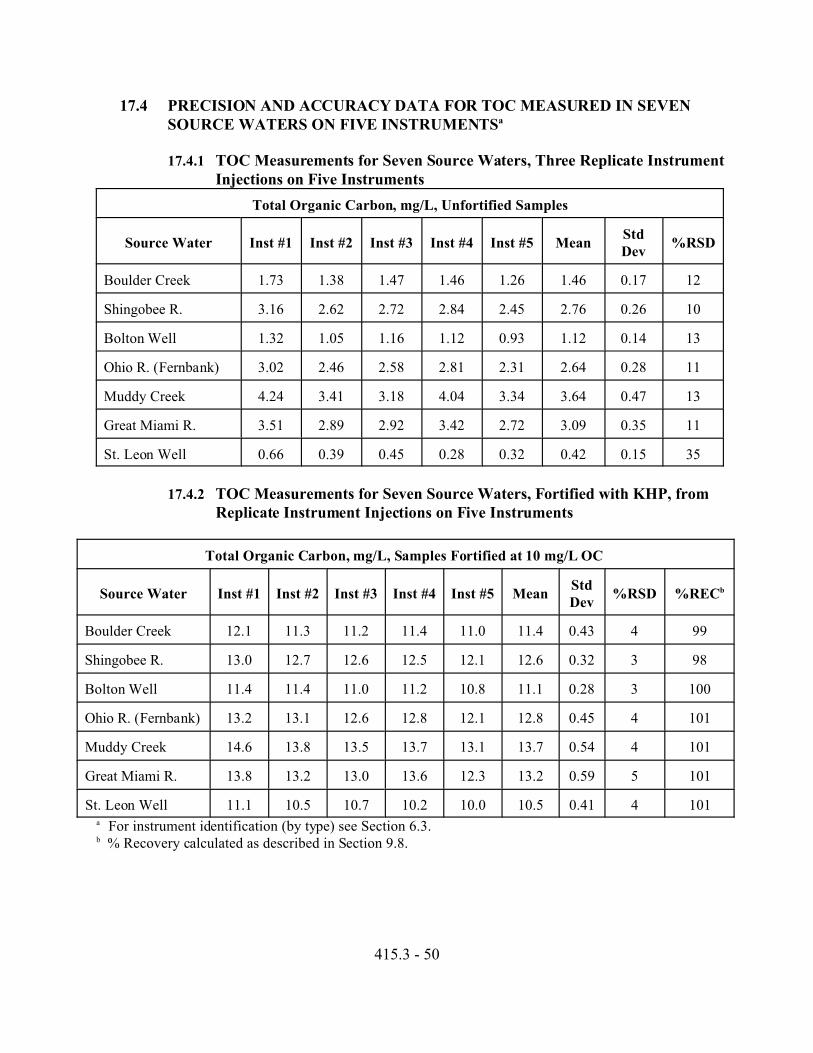
415.3 - 50
17.4 PRECISION AND ACCURACY DATA FOR TOC MEASURED IN SEVENSOURCE WATERS ON FIVE INSTRUMENTSa
17.4.1 TOC Measurements for Seven Source Waters, Three Replicate InstrumentInjections on Five Instruments
Total Organic Carbon, mg/L, Unfortified Samples
Source Water Inst #1 Inst #2 Inst #3 Inst #4 Inst #5 MeanStdDev
%RSD
Boulder Creek 1.73 1.38 1.47 1.46 1.26 1.46 0.17 12
Shingobee R. 3.16 2.62 2.72 2.84 2.45 2.76 0.26 10
Bolton Well 1.32 1.05 1.16 1.12 0.93 1.12 0.14 13
Ohio R. (Fernbank) 3.02 2.46 2.58 2.81 2.31 2.64 0.28 11
Muddy Creek 4.24 3.41 3.18 4.04 3.34 3.64 0.47 13
Great Miami R. 3.51 2.89 2.92 3.42 2.72 3.09 0.35 11
St. Leon Well 0.66 0.39 0.45 0.28 0.32 0.42 0.15 35
17.4.2 TOC Measurements for Seven Source Waters, Fortified with KHP, fromReplicate Instrument Injections on Five Instruments
Total Organic Carbon, mg/L, Samples Fortified at 10 mg/L OC
Source Water Inst #1 Inst #2 Inst #3 Inst #4 Inst #5 MeanStdDev
%RSD %RECb
Boulder Creek 12.1 11.3 11.2 11.4 11.0 11.4 0.43 4 99
Shingobee R. 13.0 12.7 12.6 12.5 12.1 12.6 0.32 3 98
Bolton Well 11.4 11.4 11.0 11.2 10.8 11.1 0.28 3 100
Ohio R. (Fernbank) 13.2 13.1 12.6 12.8 12.1 12.8 0.45 4 101
Muddy Creek 14.6 13.8 13.5 13.7 13.1 13.7 0.54 4 101
Great Miami R. 13.8 13.2 13.0 13.6 12.3 13.2 0.59 5 101
St. Leon Well 11.1 10.5 10.7 10.2 10.0 10.5 0.41 4 101a For instrument identification (by type) see Section 6.3.b % Recovery calculated as described in Section 9.8.

415.3 - 51
17.5 INITIAL DEMONSTRATION OF CAPABILITY (IDC) REQUIREMENTS(SUMMARY)
MethodReference
Requirement Specification andFrequency
Acceptance Criteria
Sects. 9.2.1,9.9
InitialDemonstration ofLow SystemBackground
Analyze LRB prior toany other IDCsamples.
LRBs must be < 0.35 mg/L OCand < 0.01 cm-1 UVA.
Sects. 9.2.2,9.11
Initial CalibrationVerification
After initial calibrationof TOC instrumentsystem a QCS sampleis used to verifyaccuracy.
The analyzed value of a 1-5 mg/Lcalibration standard must bewithin ±20% of the true valuebefore proceeding with themethod.
Sect. 9.2.3 Initial OrganicCarbon FlowInjection MemoryCheck
Analyze after LowSystem Background requirement, butbefore any other TOCor DOC IDC samples.
LRB injections after the highestOC-CAL injection must be < 0.35 mg/L TOC.
Sect. 9.2.4 Inorganic CarbonRemoval
Prior to first analysisof samples andwhenever the ICremoval procedure ismodified.
Analysis of the IC-TEST solutionafter IC removal must result in aconcentration of < 0.35 mg/L IC,measured as OC interference.
Sect. 9.2.5 InitialDemonstration ofAccuracy
Analyze 5 replicateLFBs (at 2-5 mg/LOC).
The average recovery must be+20% of the true value.
Sect. 9.2.6 InitialDemonstration ofPrecision
Calculate precision ofthe accuracy samples.
The %RSD must be < 20%.
Sect. 9.2.7 Organic CarbonDetection Limit(OCDL)Determination
Analyze 7 replicateLFBs over a period ofat least 3 days at aconcentrationestimated to be nearthe DL.
The calculated OCDL must notexceed 0.35 mg/L. The meanrecovery of the LFBs used in theOCDL determination must be+50% of the true value.

MethodReference
Requirement Specification andFrequency
Acceptance Criteria
415.3 - 52
Sect. 9.3.2 InitialDemonstration ofFilter MembraneSuitability
Prior to the first use offilters and whenever a manufacturer or filtertype is changed.
FB < 0.35 mg/L OC and/or < 0.01 cm -1 UVA. Samplefiltrate OC within + 15% ofunfiltered sample OC.
Sect. 9.4.1 InitialSpectrophotometerCheck
Prior to firstinstrument use andannually thereafter.
Test two wavelengths between220 and 340 nm. Checkmanufacturer’s operation manualfor acceptance limits.
Sects. 9.4.2,10.4
SpectrophotometerPerformance Check
Prior to analysis ofsamples.
UVA within 10% of expectedabsorbance value.

415.3 - 53
17.6 QUALITY CONTROL REQUIREMENTS (SUMMARY)
MethodReference
Requirement Specification andFrequency
Acceptance Criteria
Sect. 9.9 Blanks One LRB with each TOCanalysis batch. One FBwith each DOC and UVAanalysis batch.
TOC LRBs and DOC-FBsmust be < 0.35 mg/L OC. The UVA-FB must be < 0.01cm-1 UVA.
Sect. 8.1 Holding Time,SUVA
DOC - filtered and thenacidified within 48 hours ofcollection. Analyzedwithin 28 days of time ofcollection.
Stored at < 6 °C; preservedwith acid to pH < 2 afterfiltration.
UVA - filtered andanalyzed within 48 hours oftime of collection.
Not preserved with acid,stored at < 6 °C.
Sect. 8.2 Holding Time,TOC
TOC - analyze within 28days from time ofcollection.
Preserved at pH < 2 at thetime of collection, stored at < 6 °C.
Sects. 9.2,9.3, 9.4
InitialDemonstration ofCapability (IDC)
Performed whenever a newinstrument is set up orwhen a new analyst istrained.
See Table 17.5.
Sect. 9.5,10.3
ContinuingCalibration Checks
Analysis of Low-CCC (atthe MRL or below) at thebeginning of each analysisbatch. Subsequent CCCsanalyzed after every 10samples and after the lastsample in the analysisbatch, rotatingconcentrations to cover thecalibrated range of theinstrument. Mid-CCCrequired during eachanalysis batch.
Low-CCC: + 50% of truevalue.Mid-CCC: + 20% of truevalue.High-CCC: + 15% of truevalue.

MethodReference
Requirement Specification andFrequency
Acceptance Criteria
415.3 - 54
Sect. 9.6 Field Duplicate(FD) Analyses
One FD is collected andanalyzed with each analysisbatch.
FD > 2 mg/L OC < 20%RPD. UVA < 10% RPD.
Sect. 9.7 LaboratoryFortified Blank(LFB) analysis
One LFB is analyzed withevery DOC analysis batch.
Concentration of 1-5 mg/LOC using KHP. Recoverymust be within + 20% of truevalue.
Sect. 9.8 LaboratoryFortified Matrix(LFM)
One LFM is analyzed withevery TOC or DOCanalysis batch. Spikeconcentration should resultin an increase in the LFMconcentration of 50 to200% of its measured orexpected concentration.
Recovery outside 70-130%warrants investigation ofmatrix effect.
Sect. 9.11 Quality ControlSample (QCS)
The QCS is analyzedduring the IDC, after eachnew calibration curve, eachtime new calibrationsolutions are prepared, or atleast quarterly.
The analyzed value of a 1-5mg/L QCS must be within ±20% of the true value.
Section10.2
Calibration Curve A new calibration curve isgenerated when freshstandards are made and/orwhen CCCs are out of QClimits.
Calibration curve must haver2 > 0.993 before proceedingwith analyses.
Section10.4
Spectrophotometerperformance check
The day to day performanceof the spectrophotometer ischecked using the COMM-SCS and/or KHP-SCS priorto analyzing any UVAsample(s).
The UVA of the KHP-SCS orCOMM-SCS reading must bewithin 10% expectedabsorbance values. Analysisof LRW must result in UVAof < 0.01 cm-1.

415.3 - 55
FIGURE 1: FILTER BLANK PREPARATION
LRW
WASH FILTER*,DISCARD
FILTER LRW*, DISPENSE INTO
40-ML VIALS
DESIGNATE ASFILTER BLANK (FB)
DOC - FBADD ACIDSPARGE
ANALYZE
UVA - FBNO ACID
NO SPARGEANALYZE
*Using volume as determined in Section 9.3.2.

415.3 - 56
FIGURE 2 : SAMPLE PREPARATION
WATER SAMPLE
TOC DOC UVA
USING PRE - WASHED FILTERSFILTER AND DISCARD FIRST PORTION*
TO WASTE
FILTER REMAINING SAMPLE
DISPENSE INTO 40ML VIALS
TOC AND DOC-SAMPLEADD ACID SPARGE
ANALYZE
UVA-SAMPLENO ACID
NO SPARGEANALYZE
* Using volume as determined in Section 9.3.2.3.