Embed Size (px)
Citation preview

Determination of spoilage levels of fresh fruit and vegetables
according to the type of packaging
Evaluation report May 2013
Study initiated by Stiftung Initiative Mehrweg (Foundation for Reusable Systems)
Fraunhofer Institut für Materialfluss und Logistik
(Fraunhofer Institute for Material Flow and Logistics)
Abteilung Verpackungs- und Handelslogistik
(Department of Packaging and Trade Logistics)
Dipl.-Logist. (Certified Logistian) Michael Pelka
Joseph-von-Fraunhofer-Str. 2-4
D-44227 Dortmund
Phone: +49 (0) 231 9743 281
Fax: +49 (0) 231 9743 311
Email: [email protected]
URL: www.iml.fraunhofer.de
Rheinische Friedrich-Wilhelms-Universität Bonn
Institut für Tierwissenschaften (Institute for Animal Science),
Arbeitsgruppe Cold-Chain Management
(Cold-Chain Management Working Group)
PD Dr. Judith Kreyenschmidt (Food Technologist)
Katzenburgweg 7-9
D-53115 Bonn
Phone: +49 (0) 228 73 38 86
Fax: +49 (0) 228 73 26 17
Email: [email protected]
URL: www.ccm.uni-bonn.de

Study – Determination of spoilage levels of fresh fruit and vegetables according to the type of packaging, May 2013
- 2 -
Table of ContentsTable of Contents ............................................................................................................................................. 2
1 Introduction and objectives of the study ................................................................................................... 3
2 Definition of terms and differentiation of terms ........................................................................................ 4
2.1 Reusable and Disposable Packaging ................................................................................................. 4
2.2 Crates............................................................................................................................................... 4
3 Part 1: Empirical determination of damage to disposable and reusable packaging .................................... 5
3.1 Procedure and data collection .......................................................................................................... 5
3.1.1 Data collection in central warehouses ......................................................................................... 5
3.1.2 Data collection in retail outlets .................................................................................................... 6
3.2 Central warehouse results ................................................................................................................ 7
3.2.1 Recorded products ...................................................................................................................... 7
3.2.2 Damage rates ........................................................................................................................... 10
3.2.3 Causes of damage ..................................................................................................................... 10
3.2.4 Damage to products ................................................................................................................. 12
3.2.5 Process costs in the event of damage ........................................................................................ 12
3.3 Retail outlet results ........................................................................................................................ 14
3.3.1 Damage rates ........................................................................................................................... 14
3.3.2 Causes of damage ..................................................................................................................... 14
3.3.3 Damage to products ................................................................................................................. 16
3.4 Damage to packaging throughout the whole supply chain .............................................................. 17
3.5 Applying the results to the current market situation ........................................................................ 17
3.6 Summary (Part 1) ........................................................................................................................... 19
4 Part 2: Determining the influence of the type of packaging on the loss of freshness of fruit and vegetables
20
4.1 Background and objective .............................................................................................................. 20
4.2 Comparison of the surface bacterial counts on disposable and reusable crates ............................... 20
4.2.1 Procedure ................................................................................................................................. 20
4.2.2 Results ...................................................................................................................................... 20
4.3 Influence of the type of packaging on the loss of freshness of fruit and vegetables under
standardised laboratory conditions............................................................................................................. 21
4.3.1 Procedure ................................................................................................................................. 21
4.3.2 Results ...................................................................................................................................... 23
4.4 Influence of the type of packaging on the loss of freshness of fruit and vegetables with data
collection as of the place of harvesting ....................................................................................................... 28
4.4.1 Procedure ................................................................................................................................. 28
4.4.2 Results ...................................................................................................................................... 30
4.5 Summary (Part 2) ........................................................................................................................... 34

Study – Determination of spoilage levels of fresh fruit and vegetables according to the type of packaging, May 2013
- 3 -
1 Introduction and objectives of the study
In 2011, the debate on the handling of fresh foodstuffs in Germany gained new momentum, not least through
the film Taste the Waste. Although statistics on how much food is thrown away unused in Germany vary
greatly, there is, however, a consensus that the amount needs to be reduced. Estimates of food wastage range
from around 20 million tonnes per year – for total domestic wastage in Germany (source: Taste the Waste) – to
as much as 300,000 tonnes for the German food trade as a whole (source: EHI).
This significant variation between different sources clearly shows that there is still not enough transparency
with regard to wastage. This also applies to fresh fruit and vegetables. In this connection, it is of particular
interest whether and to what extent the packaging method used (disposable vs reusable packaging) influences
the spoilage of products.
The Fraunhofer Institute for Material Flow and Logistics and the Cold-Chain Management Working Group at
the University of Bonn have addressed this problem. Their study investigated the potential link between pack-
aging damage and packaging type on the one hand, and the potential link between loss of freshness of fruit
and vegetables and packaging type on the other.
The following issues are the focus of the present study:
- Losses due to damage to packaging throughout the supply chain (Part 1):
Throughout the logistics chain to the point of sale, transport packaging is subject to static and dy-
namic loads. Project experiences show that these cause damage to packaging and damage to pro-
duce. It is the aim of this investigation to determine, along defined points of the supply chain (central
warehouse and outlet), the extent of the damage and loss ratios according to the type of packaging.
- Loss of freshness of fruit and vegetables due to the type of packaging (Part 2):
The shelf life of fruit and vegetables throughout the supply chain is, as expected, influenced by factors
such as surface bacterial count and the environment within the packaging. It is the aim of this investi-
gation to identify and quantify the impacts of the type of packaging on the sensory and microbiologi-
cal quality of these foodstuffs.

Study – Determination of spoilage levels of fresh fruit and vegetables according to the type of packaging, May 2013
- 4 -
2 Definition of terms and differentiation of terms
2.1 Reusable and Disposable Packaging
Reusable packaging is sales, outer or transport packaging that is intended to be reused repeatedly for contain-
ing, protecting, handling, supplying or presenting goods (VDI (Association of German Engineers) 4407). Dis-
posable packaging fulfils this purpose only once and is then recovered or disposed of.
2.2 Crates
The term "crate" designates packaging made of wood, plastic or cardboard that does not fully cover the pack-
aged goods or products. Crates are primarily used for transporting fruit and vegetables. Crates are available in
both types of packaging (disposable and reusable).
Within the context of this study, the terms "crate" and "packaging" are used interchangeably.

Study – Determination of spoilage levels of fresh fruit and vegetables according to the type of packaging, May 2013
- 5 -
3 Part 1:
Empirical determination of damage to disposable and reusable packaging
3.1 Procedure and data collection
Packaging damage was assessed for incoming goods both in central warehouses and in retail outlets.
3.1.1 Data collection in central warehouses
Following the harvest, fresh fruit and vegetables are packed in crates. Multiple layers of transport packaging of
one type of fruit or vegetable are grouped on a pallet to form what is known as a homogeneous loading unit.
This means that only one product type and one packaging type are contained in a loading unit. As a rule, the
loading unit is then transported to a central warehouse. After the delivered loading units are unloaded, they
are placed in a buffer zone for goods inward within the central warehouse, where the loading units will remain
for a short time before being made available in the picking area. The collection of data took place immediately
after the unloading process in the buffer zone of the goods inward area. An employee of the Fraunhofer Insti-
tute inspected the loading units located there on each side and documented any damage to individual trans-
port packaging units.
In the process, the following data was recorded:
- Data concerning products and loading units
- Product group (fruit/vegetables)
- Product type
- Country and region of origin
- Type of packaging
- Reusable
- Disposable corrugated cardboard
- Disposable solid cardboard
- Disposable wood
- Dimensions of packaging
- Number of loading units
- Number of transport packaging units
- Photo documentation
- Data concerning the documentation of damage
- Number of damaged transport packaging units
- Causes of damage
- Breakage in stack
- Inadequate securing of cargo
- Outside influences
- Product condition
- Undamaged

Study – Determination of spoilage levels of fresh fruit and vegetables according to the type of packaging, May 2013
- 6 -
- Partially damaged
- Completely damaged
- Photo documentation
The data was collected during the period from July to August 2012. Data was collected in three central ware-
houses belonging to Top 5 retail groups and one central warehouse belonging to one of the Top 5 discount
retail groups.
3.1.2 Data collection in retail outlets
The central warehouse pools all deliveries from producers and distributes them to retail outlets. This involves
composing loading units according to demand in the course of the picking process for each individual outlet.
Consequently, a loading unit typically comprises different product types and also different types of packaging.
These mixed loading units are then transported to the outlet. Data collection at the outlet took place after the
loading units were unloaded and handed over to an employee of the store. Following the same principles ap-
plied in the central warehouse, an employee of the Fraunhofer Institute inspected the loading unit on each
side, and determined and documented any damage to individual transport packaging units.
The following data was recorded in the goods inward areas of the outlets in question:
- Data concerning the loading unit
- Number of transport packaging units per pallet for each type of packaging
- Reusable
- Disposable corrugated cardboard
- Disposable solid cardboard
- Disposable wood
- Photo documentation
- Data concerning the documentation of damage
- Number of damaged transport packaging units for each type of packaging
- Causes of damage
- Breakage in stack
- Inadequate securing of cargo
- Outside influences
- Inconsistent module dimensions
- Incompatible transport packaging
- Product condition
- Undamaged
- Partially damaged
- Completely damaged
- Photo documentation
Study – Determination of spoilage levels of fresh fruit and vegetables according to the type of packaging, May 2013
- 7 -
The data was collected during the period from July to August 2012. Data was collected in the outlets of two of
the Top 5 retail groups and in the outlets of one of the Top 5 discount retail groups. A total of 25 stores were
visited.
Figure 1: Exemplary supply chain for a retail group
3.2 Central warehouse results
A total of 78,153 transport packaging units were examined. 52% were reusable and 48% were disposable.
3.2.1 Recorded products
The two following tables show the products recorded in descending order according to the number of trans-
port packaging units recorded. Moreover, for each product, the proportions of each type of transport packag-
ing are indicated as percentages.

Study – Determination of spoilage levels of fresh fruit and vegetables according to the type of packaging, May 2013
- 8 -
Fruit
Type of fruit Proportion of all packaging used for this fruit
Of which dispos-able corrugated cardboard
Of which dispos-able solid card-board
Of which dispos-able wood
Of which reusable
Peaches 23% 20% - - 80%
Apples 14% 73% - - 27%
Nectarines 12% 35% - - 65%
Melons 9% 46% - - 54%
Grapes 8% 57% 1% 7% 34%
Bananas 6% 100% - - -
Cherries 6% 82% - - 18%
Lemons 3% 8% 30% 30% 32%
Raspberries 3% 100% - - -
Apricots 3% 100% - - -
Blueberries 3% 41% - - 59%
Pears 2% 94% - - 6%
Strawberries 1% - 74% - 26%
Oranges 1% 100% - - -
Limes 1% 100% - - -
Physalis < 1% 100% - - -
Pineapples < 1% 100% - - -
Plums < 1% 45% - 55% -
Mangoes < 1% 100% - - -
Gooseberries < 1% - 51% - 49%
Redcurrants < 1% - - - 100%
Grapefruit < 1% 100% - - -
Kiwi fruit < 1% 100% - - -
Papaya < 1% 100% - - -
Table 1: Types of fruit recorded, listed according to the proportion of packaging recorded for each type of fruit, and broken down by packaging type
Study – Determination of spoilage levels of fresh fruit and vegetables according to the type of packaging, May 2013
- 9 -
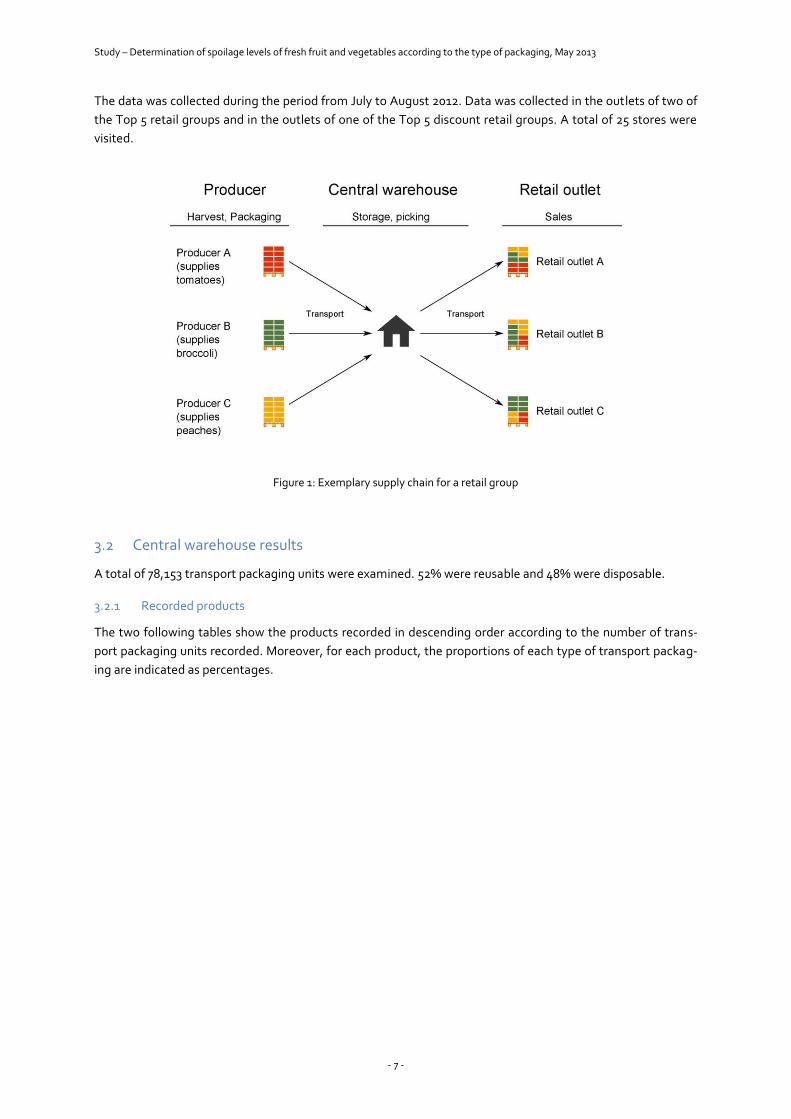
Vegetables
Type of vegetable Proportion of all packaging used for this vegetable
Of which dispos-able corrugated cardboard
Of which dispos-able solid card-board
Of which dispos-able wood
Of which reusable
Tomatoes 50% 34% - - 66%
Cucumbers 11% 16% 48% - 36%
Peppers 6% 49% 7% - 44%
Potatoes 6% 28% - - 72%
Red radishes 4% 0% - 100% -
Iceberg lettuce 3% 15% - - 85%
Zucchini (Courgette) 3% 20% 10% - 70%
Mushrooms 3% 23% - - 77%
Onions 2% 11% - - 89%
Carrots 2% - - - 100%
Cauliflowers 2% - - - 100%
Spring onions 2% - - 30% 70%
Romaine lettuce hearts
1% - - - 100%
Lettuce < 1% - - - 100%
Avocados < 1% 100% - - -
Rocket < 1% - - - 100%
Aubergines (Egg-plants)
< 1% 63% 37% - -
Radicchio < 1% 45% - 9% 45%
Mirepoix < 1% - - - 100%
Chicory < 1% - 100% - -
White radishes < 1% - - - 100%
Fennel < 1% - - 100% -
Lamb’s lettuce < 1% 33% - 67% -
Artichokes < 1% - - 100% -
Peas < 1% 100% - - -
Garlic < 1% - 100% - -
Turnips < 1% - - - 100%
Sweet corn < 1% 100% - - -
Others < 1% 100% - - -
Spinach < 1% 100% - - -
Loose leaf lettuce < 1% 100% - - -
Table 2: Types of vegetable recorded, listed according to the proportion of packaging recorded for each type of vegetable, and broken down by packaging type

Study – Determination of spoilage levels of fresh fruit and vegetables according to the type of packaging, May 2013
- 10 -
3.2.2 Damage rates
Table 3 shows the number of packaging units recorded and all damage observed, as well as the corresponding
damage rates for disposable and reusable packaging.
All dispos-able types
Disposable cardboard
Disposable wood
Reusable
Total number of packaging units 37,577 34,935 2,642 40,576
Total number of damaged packaging units 309 307 2 9
Damage rate 0.82% 0.88% 0.08% 0.02%
Table 3: Damage rates in the central warehouses
Table 4 shows the damage rates for disposable packaging, broken down according to the types of packaging
(corrugated cardboard, solid cardboard and wood).
Corrugated cardboard
Solid cardboard Wood
Proportion of disposable packaging units 84% 9% 7%
Total number of packaging units 31,557 3,378 2,642
Total number of damaged packaging units 224 83 2
Damage rate 0.71% 2.46% 0.08%
Table 4: Damage rates for different types of disposable packaging
3.2.3 Causes of damage
In the central warehouse, the following causes of damage were identified:
- insufficiently robust packaging;
- inadequate securing of loading units;
- outside influences.
"Insufficiently robust packaging" covers packaging that is unable to support loads stacked on top of it.
"Inadequate securing of loading units" covers damage caused by loading units that are insufficiently or incor-
rectly secured (by means of stretch film or straps, for instance).
"Outside influences" typically occur when damage to the packaging stems from incorrect or improper handling
or from negligence. Examples include:
- damage during unloading from the lorry or damage caused by forklift prongs;
- mistakes made during the formation of the loading unit (excessive length);
- incorrect securing of load within the lorry.
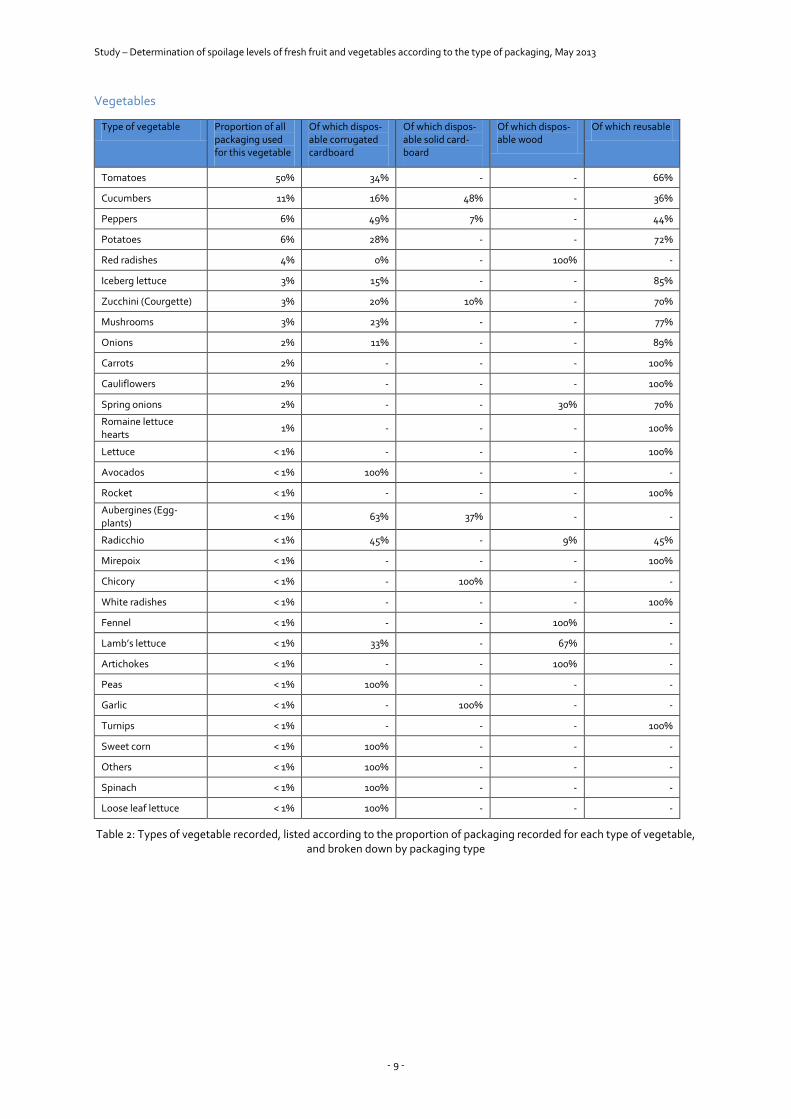
The following photos illustrate the three main causes of damage identified above:
Study – Determination of spoilage levels of fresh fruit and vegetables according to the type of packaging, May 2013
- 11 -
Insufficiently robust packaging Inadequate securing
of loading units Outside influences
Table 5: Examples of causes of damage (in central warehouses)
The following table shows the absolute and relative frequency of causes of damage among disposable packag-
ing. Damage because of insufficiently robust packaging concerns only cardboard boxes.
Insufficiently robust packaging
Inadequate securing of loading units
Outside influences
Absolute frequency 199 61 49
Relative frequency 64% 20% 16%
Table 6: Absolute and relative frequencies of causes of damage among disposable packaging
The following table shows the absolute and relative frequency of causes of damage among reusable packag-
ing.
Insufficiently robust packaging
Inadequate securing of loading units
Outside influences
Absolute frequency 0 6 3
Relative frequency 0% 67% 33%
Table 7: Absolute and relative frequencies of causes of damage among reusable packaging
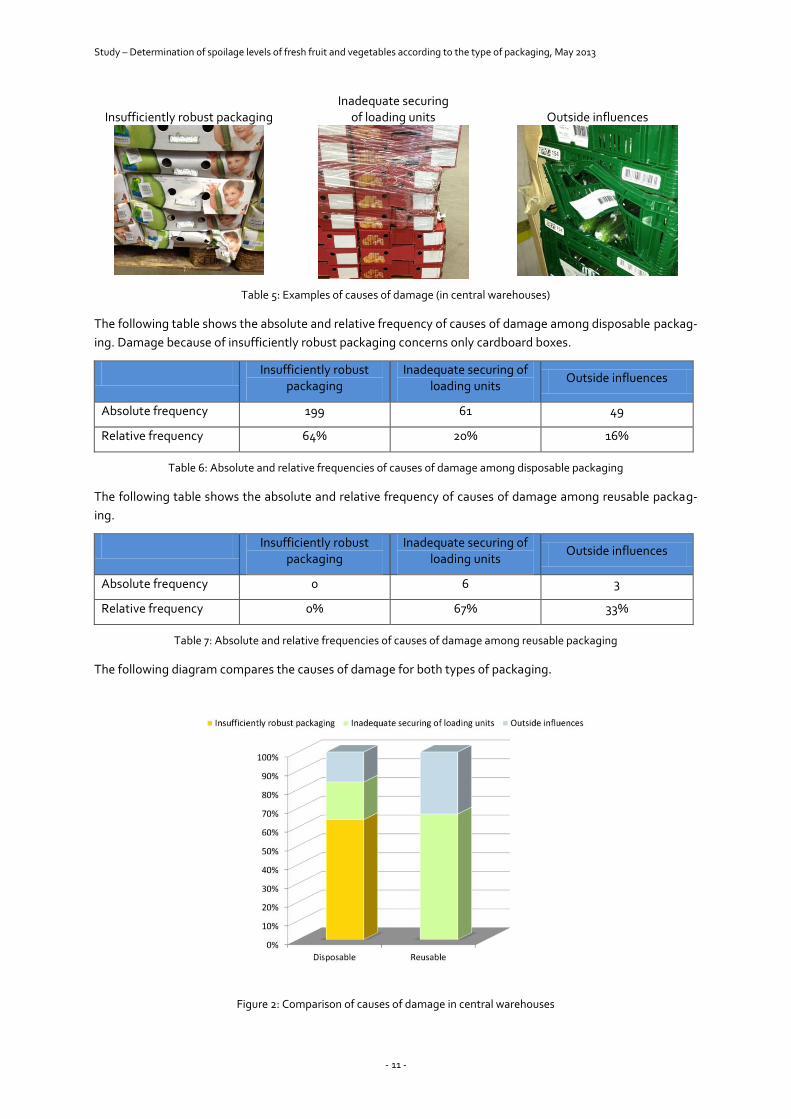
The following diagram compares the causes of damage for both types of packaging.
Figure 2: Comparison of causes of damage in central warehouses

Study – Determination of spoilage levels of fresh fruit and vegetables according to the type of packaging, May 2013
- 12 -
Figure 2 illustrates that the most frequent cause of damage to cardboard boxes results from insufficient ro-
bustness. The main cause of damage to reusable packaging, on the other hand, is incorrect and improper han-
dling: the producer secured the loading unit incorrectly, or the haulage contractor did not secure the load well
enough on the lorry, or the damage was caused by negligence on the part of staff during the loading or
unloading processes.
3.2.4 Damage to products
For each damaged packaging unit, the quantity of products damaged was recorded. This process involved
classifying the damage to products according to three categories:
- Products completely damaged
- Products partially damaged
- Products undamaged
Table shows the absolute and relative frequencies for the three categories of damage, broken down according
to the types of packaging (disposable and reusable). Figure 3 presents these values in graph form.
Cardboard boxes Reusable
Completely damaged 0 / 0% 0 / 0%
Partially damaged 123 / 40% 2 / 22%
Undamaged 184 / 60% 7 / 78%
Table 8: Absolute and relative frequencies for the product condition (Central warehouse)
Figure 3: Condition of products contained in damaged packaging (in central warehouses)
Figure 3 shows that damage to packaging does not necessarily mean damage to the products it contains. In
most cases, products remain undamaged despite packaging damage. The probability of a product being dam-
aged in the event of packaging being damaged is significantly lower for reusable packaging.
3.2.5 Process costs in the event of damage
In addition to the product loss caused by packaging damage, additional expenses– incurring further economic
losses – which may arise must be considered. To demonstrate this, we shall consider the example of a settle-
ment for damage caused in a central warehouse: As a rule, a damaged packaging unit within the stack of a
loading unit destabilises the whole loading unit and may cause the stack to become unbalanced. In extreme

Study – Determination of spoilage levels of fresh fruit and vegetables according to the type of packaging, May 2013
- 13 -
cases, this may lead to a tipping over of the whole loading unit or individual stacking columns. In order to pre-
vent a significantly higher product loss in terms of material flow costs, severely damaged packaging must be
removed from the stack of the loading unit. As damaged packaging is typically situated in the lower third of a
loading unit, a loading unit must often be depalletised completely, or the individual transport packaging unit
must be repacked to another pallet, in order to reach the damaged packaging. As a result, process costs of
around €6.70* are incurred per pallet. In this study, it was not ascertained in how many cases of damage a
repacking of the loading units was necessary.
-----
*One pallet contains 80 transport packaging units on average, of which 60, on average, must be depalletised or repacked in the case of damage. The average process duration of each repacking procedure for a transport packaging unit amounts to around 20 seconds. The average personnel costs of a warehouse employee amounts to around €20 per hour.

Study – Determination of spoilage levels of fresh fruit and vegetables according to the type of packaging, May 2013
- 14 -
3.3 Retail outlet results
A total of 1,879 transport packaging units were examined. Of these, 52% were reusable and 48% were dispos-
able.
3.3.1 Damage rates
Table shows the total number of packaging units recorded, the number of damaged packaging units observed
and the resulting damage rates for disposable and reusable packaging.
Disposable Reusable
Total number of packaging units 903 976
Total number of damaged packaging units 30 1
Damage rate 3.32% 0.10%
Table 9: Damage rates in retail outlets
3.3.2 Causes of damage
In retail outlets, the following causes of damage were identified:
- insufficiently robust packaging;
- inadequate securing of loading units;
- outside influences;
- inconsistent module dimensions;
- lack of compatibility.
The first three causes of damage correspond to the descriptions given in section 3.2.3 above.
Since mixed commissioning units are combined at the second distribution level (central warehouse to retail
outlet), two further causes of damage (inconsistent module dimensions and lack of compatibility) can be
added to the list. These causes refer to the suitability of packaging for the formation of heterogeneous com-
missioning loading units.
"Inconsistent module dimensions" typically refers to packaging whose dimensions do not comply with the
basic 600 x 400 mm module, and which are consequently the cause of damage. This often arises when the
packaging has unusual base dimensions and is thus only partly stackable, meaning that parts of the packaging
therefore rest directly on the products.
A "lack of compatibility" refers to situations where the packaging unit causing damage has standard modular
dimensions, but cannot be properly stacked (by means of interlocking stacking lugs on the ends of packaging
units, for example). Incompatible packaging units often slip into the unit below and rest directly on top of pro-
duce.
The following photos illustrate the causes of damage identified above:
Insufficiently robust packaging
Inadequate secur-ing of loading units
Outside influences Inconsistent module dimensions
Lack of compatibility

Study – Determination of spoilage levels of fresh fruit and vegetables according to the type of packaging, May 2013
- 15 -
Table 10: Examples of causes of damage (in retail outlets)
The following table shows the absolute and relative frequency of the causes of damage among disposable
packaging.
Insufficiently robust packaging
Inadequate securing of
loading units
Outside influences
Inconsistent module
dimensions
Lack of compatibility
Absolute frequency
5 1 1 11 12
Relative frequency
17% 3% 3% 37% 40%
Table 11: Absolute and relative frequencies of causes of damage among disposable packaging
The following table shows the absolute and relative frequency of causes of damage among reusable packag-
ing.
Insufficiently robust
packaging
Inadequate securing of
loading units
Outside influences
Inconsistent module
dimensions
Lack of com-patibility
Absolute frequency
0 0 1 0 0
Relative frequency
0% 0% 100% 0% 0%
Table 12: Absolute and relative frequencies of causes of damage among reusable packaging
The following graph compares the causes of damage for both types of packaging:
Figure 4: Comparison of causes of damage (in retail outlets)
Unlike in the central warehouses, the main causes of damage to disposable packaging in the retail outlets are
a lack of standardisation and compatibility. Lack of compatibility here refers not just to the compatibility of
disposable vs reusable packaging, but also the compatibility of different types of disposable packaging. In the
case of reusable packaging, only one case of damage was recorded, which was due to outside influences.

Study – Determination of spoilage levels of fresh fruit and vegetables according to the type of packaging, May 2013
- 16 -
3.3.3 Damage to products
Using a procedure similar to that employed in the central warehouse, the extent of damage to the product for
each damaged packaging unit was also recorded in the retail outlet.
Table shows the absolute and relative frequencies for the three damage categories, broken down according to
the types of packaging (disposable and reusable). Figure 5 shows these values in graph form.
Disposable Reusable
Completely damaged 0 / 0% 0 / 0%
Partially damaged 6 / 20% 0 / 0%
Undamaged 24 / 80% 1 / 100%
Table 13: Absolute and relative frequencies of product condition (in retail outlets)
Figure 5: Condition of products in damaged packaging (in retail outlets)
As was already observed at the first distribution level (from the producer to the central warehouse), the major-
ity of the products in damaged packaging units in fact remain undamaged on their way to the outlet. For dis-
posable packaging, around 20% of the products in damaged packaging units were partially damaged. In the
one case of damage observed for reusable packaging, the product was not damaged.

Study – Determination of spoilage levels of fresh fruit and vegetables according to the type of packaging, May 2013
- 17 -
3.4 Damage to packaging throughout the whole supply chain
Figure 6 shows the damage rates for disposable and reusable packaging throughout the whole supply chain,
from the producer to the central warehouse to the retail outlet.
Figure 6: Cumulative damage rates throughout the whole supply chain
In the case of disposable packaging, around 4% of all packaging is damaged on its way to the consumer. For
reusable packaging, the corresponding figure is around 0.1%.
3.5 Applying the results to the current market situation
In this section, the damage rates determined above are used to model the effects on the entire German mar-
ket for fresh fruit and vegetables. Here, a distinction is made between two scenarios. The first scenario as-
sumes that disposable packaging is used exclusively across the entire supply chain, while the second scenario
involves the exclusive use of reusable packaging. The calculation is based on the annual per-capita consump-
tion levels of fresh fruit and vegetables in the Federal Republic of Germany. As there exist some significant
variations in consumption data, an average was taken of the various data sources (Zentrale Markt- und Preis-
berichtstelle = Central Market and Price Reporting Agency (ZMP); Marktbilanz (Market Balance); Deutscher
Fruchthandelsverband = The German Fruit Trade Association (DFHV)). Thus, the annual per-capita consump-
tion in the Federal Republic of Germany amounts to around 50.2 kg for fruit and about 57.2 kg for vegetables.
This gives a total nationwide consumption of around 8.7 billion kg of fruit and vegetables per year, which in
turn represents around 1.1 billion crates per year1 that are consumed overall by German consumers.
Scenario 1 (disposable packaging only): By the end of the supply chain, around 45 million packag-
ing units per year will be damaged. From this, we may conclude that around 36,000 tonnes of
fruit and vegetables are damaged each year.2 This corresponds to a loss of some €68 million.
3
Scenario 2 (reusable packaging only): By the end of the supply chain, around 1.4 million packaging
units per year will be damaged. From this, we may conclude that 1.1 thousand tonnes of fruit and
vegetables are damaged per year2. This corresponds to a loss of some €2 million.
3

Study – Determination of spoilage levels of fresh fruit and vegetables according to the type of packaging, May 2013
- 18 -
-----
1An average crate contains around 8 kg of fruit or vegetables.
2Assumption: an average of 10% of products are damaged in the event of damage to packaging. This value is an estimate based on the
observations in the central warehouses and in the retail outlets. A more precise quantification requires a separate survey.
3The average value of a fruit/vegetable crate is around €15 (including VAT).

Study – Determination of spoilage levels of fresh fruit and vegetables according to the type of packaging, May 2013
- 19 -
3.6 Summary (Part 1)
The first part of the study sought to determine the level of packaging and product damage, depending on the
type of packaging, throughout the distribution chain of fresh fruit and vegetables. To this end, packaging
damage was recorded both after the first distribution level (producer to central warehouse) and after the sec-
ond distribution level (central warehouse to retail outlet).
The data collected shows that the type of packaging (disposable or reusable) has a significant influence on the
damage rate for packaging. As opposed to disposable cardboard-packaging, reusable packaging experiences a
significantly lower rate of packaging damage. It should be noted that, among the reusable packaging, not a
single case of damage was observed due to insufficiently robust packaging. The main causes of packaging
damage with regard to reusable packaging were instead inadequate securing of loading units and improper
handling. As regards disposable packaging, the most frequent causes of damage to cardboard boxes were
insufficiently robust packaging, inconsistent dimensions and a lack of compatibility with other packaging.
The distribution level has an additional influence on the packaging damage rate. Damage rates increase at the
second distribution level (supply to retail outlets) for both types of packaging by around fourfold. This is
caused by a lack of compatibility among the different types of packaging, as compatibility is essential during
the formation of picking units or heterogeneous loading units. This problem is observed with both disposable
and reusable packaging and also among all the different types of disposable packaging.
Damage to transport packaging can also lead to the quality of the goods transported being compromised. This
is, for example, the case in the central warehouse for 40% of the fruit and vegetables transported in damaged
disposable cardboard boxes; for reusable packaging, however, the proportion is only 22%. It should be noted
that the study does not take into consideration the final destination of damaged produce.
In addition to the value of the goods damaged – around €68 million per year for an all-disposable packaging
scenario and around €2 million per year for an all-reusable packaging scenario – further economic losses may
arise due to additional costs of handling damaged transport packaging. For the central warehouses, it was
shown that the repacking of a loading unit containing damaged packaging results in process costs of around
€6.70 per loading unit. A low damage rate thus leads to low product losses and consequently low damage
costs throughout the supply chain, from the producer to the retail outlet.

Study – Determination of spoilage levels of fresh fruit and vegetables according to the type of packaging, May 2013
- 20 -
4 Part 2:
Determining the influence of the type of packaging on the loss of freshness of fruit and
vegetables
4.1 Background and objective
The loss of freshness and the shelf life of perishable foodstuffs are significantly influenced by the microbiologi-
cal contamination, the growth rate of microorganisms present and the speed of enzymatic, chemical and
physical reactions within the product. The specific reaction and growth rates here are functions of intrinsic
parameters of foodstuffs and of environmental factors such as temperature, gas atmosphere, humidity or
packaging structure and materials (Mossel 1971; Heard 1999; Kreyenschmidt & Ibald 2012). In order to obtain a
high-quality and safe product at the end of the value-added chain, these parameters need to be optimised in a
product-specific way and monitored.
The influence of disposable and reusable packaging on the loss of freshness of fruit and vegetables is currently
a topic of debate, the main focus of which concerns the potential impacts of packaging on product hygiene,
the cross-contaminations involved and the temperature and humidity conditions. The objective of this part of
the study was to evaluate the effect of disposable and reusable packaging on the loss of freshness of fruit and
vegetables using selected parameters.
The study was divided into three parts: in the first part, the comparison of the surface bacterial counts on dis-
posable and reusable packaging was the primary concern. In the second part, the loss of freshness of selected
products, stored in disposable packaging and reusable packaging under laboratory conditions, was compared
using sensory and microbiological parameters. Examinations were carried out on red radishes, tomatoes and
nectarines. In the last part of the study, the losses of freshness in strawberries and lettuce were measured and
compared in disposable packaging and reusable packaging respectively in realistic conditions.
4.2 Comparison of the surface bacterial counts on disposable and reusable crates
4.2.1 Procedure
The surface bacterial count of the empty packaging was measured before the filling process in terms of
bioburden for a total of 100 reusable packaging units and 100 disposable crates, by means of a swab tech-
nique. Increased bacterial counts on surfaces (measured as bioburden) indicate a lack of hygiene and subse-
quently an increased risk of cross-contamination (surface – product). Depending on the type of bacterial flora,
it is possible that cross-contaminations may accelerate the loss of freshness and influence the safety of a
product. The examination method was conducted according to the official test procedures of
§64 LFGB B 80.00.2 or according to standard DIN 101 13-2, whereby 20 cm² per crate was sampled. Sampling
was carried out on 10 different days. The statistical analysis of the microbiological examinations was con-
ducted according to the Mann-Whitney U Test. The significance level was set up in such a manner that two
test series with p > 0.05 would not be considered statistically significant.
4.2.2 Results
Figure 7 shows the bacterial counts on the disposable and reusable crates before the filling process. In each
case, the medians, the 25% and 75% inter-quartile ranges and the respective extreme values of the bioburden
are shown.

Study – Determination of spoilage levels of fresh fruit and vegetables according to the type of packaging, May 2013
- 21 -
Figure 7: Surface bacterial counts on disposable and reusable crates (n = 100)
The bacterial counts on the different crates do not show any significant differences (p > 0.05). The median of
the bacterial counts lies at 15.0 CFU/cm² for the disposable crates and at 12.5 CFU/cm² for reusable crates, with
a higher scatter for disposable crates.
6/7 9/7 11/7 12/7 13/7 16/7 17/7 20/7 23/7 24/7
Figure 8 shows the bacterial counts on reusable crates on the different test days.
6/7 9/7 11/7 12/7 13/7 16/7 17/7 20/7 23/7 24/7
Figure 8: Surface bacterial counts on reusable crates on different test days (n = 10 per examination day)
The median bioburdens fluctuate between 2.5 and 22.5 CFU/cm². On the first two days on which the crates
were washed, the high variability of the surface bacterial count on the reusable crates is remarkable.
4.3 Influence of the type of packaging on the loss of freshness of fruit and vegetables un-
der standardised laboratory conditions
4.3.1 Procedure
The influence of the type of packaging (disposable vs reusable) on the loss of freshness of fruit and vegetables
contained was examined using the following products: nectarines, vine tomatoes and red radishes. In each test
series, three product-specific disposable creates and three reusable crates were filled with the respective
products and the loss of freshness was compared over time using selected parameters. To ensure the stan-
dardisation of the tests, the surface bacterial counts were taken before the filling process.

Study – Determination of spoilage levels of fresh fruit and vegetables according to the type of packaging, May 2013
- 22 -
The fruit and vegetables were delivered by a forwarding agent to the institute, in each case with one crate
more than necessary for the filling of the three disposable and three reusable crates. The suppliers were re-
quired to supply, for each test series, products from only one batch which were all stored in the same condi-
tions during transport. After delivery of the products, the crates were filled and stored under retail- or house-
hold-specific temperature conditions for the product. The temperature and time scenarios were agreed be-
forehand with IFCO. During storage, the temperature conditions and humidity levels inside the crates were
measured continuously, in order to record any possible effects of the packaging on the temperature conditions
within the crates. For this purpose, a data logger was placed in the centre of the base of each crate.
In order to record potential differences in heat transfers and associated temperature adjustments in the dis-
posable and reusable crates, the crates were stacked one at a time (see Figure 9). In the bottom crates, heat
transfers mainly occur via thermal conduction; in the top and middle crates, there is an additional transfer via
convection). Figure 9 shows the experimental set-up.
Figure 9: Storage of the crates during the experiment
Depending on the product, a sensory evaluation was carried out at the beginning and in the middle of the
chain-typical storage times (including storage in household-like areas) by a trained panel of 6 people, together
with photographic documentation. The sensory examination seeks to evaluate the product’s current degree of
freshness. The evaluation of the samples was made using a hedonic scale (0 = very good, 5 = unacceptable). As
a basic guide, an evaluation scheme was developed for each product, where product-specific characteristics of
the loss of freshness were included. Criteria such as colour, smell, juiciness/texture and the overall impression
were considered in the evaluation as characteristics. Different weighting factors were then assigned to the
various characteristics, depending on the product, and illustrated in the form of a sensory index (S). In addition
to the grading of freshness level, the sensory index and the level of features of the different criteria provide
insight on possible factors of spoilage. The sensory tests were conducted “blind”. Furthermore, at the end of
the storage period, the quantities of nectarines and tomatoes showing mould growth, dents or other sensory
deficiencies were counted per crate.
In parallel to the sensory tests, at the beginning and end of the test series, the surface bacterial count, meas-
ured as bioburden of the products of each individual crate was determined. The bioburden on products pro-
vides indirect conclusions on the freshness of the product. For the determination of the bioburden, two com-
posite samples of each kind of fruit and vegetable tested were taken at the beginning and the bioburden de-
termined. Then, at the time of the final test, the bioburden of the products was examined in each of the six
crates (three disposable, three reusable). The series of tests for each crate were terminated as soon as first
products in the crate showed clear signs of a loss of freshness. At the end of the storage period, the surface
bacterial counts were additionally determined in all crates. Each test was repeated three times.

Study – Determination of spoilage levels of fresh fruit and vegetables according to the type of packaging, May 2013
- 23 -
Table 1 provides an overview of the products tested:
Product Quantity of products per test series
Total quantity of products
Total number of crates
Red radishes: 10 bunches, open, crate: 64 × 13 cm
6 × 10 bunches plus 1 bunch = 61 bunches
183 bunches 9 disposable, 9 reus-able
Nectarines: 7 kg, loosely arranged, crate: 64 × 10 cm
6 × 7 kg plus 1 kg = 43 kg
129 kg 9 disposable, 9 reus-able
Vine tomatoes: 5 kg, loose, crate: 43 × 14 cm
6 × 5 kg plus 1 kg = 31 kg
93 kg 9 disposable, 9 reus-able
Table 1: Overview of the sample sizes for the products tested
Figure 10 shows the products and their respective disposable and reusable packaging:
Figure 10: Overview of the products and packaging used for the study
4.3.2 Results
Red radishes
Before the beginning of the storage period, no significant differences in the surface bacterial count were
measured between reusable and disposable crates (between 1.4 and 1.6 log10 CFU/cm²). At the end of the
storage period, the bacterial count on disposable crates was, however, significantly higher, at
3.7 log10 CFU/cm², than the bacterial count of the reusable crates, which came to 2.7 log10 CFU/cm². Moreover,
as far as the disposable crates were concerned, significant mould growth was identified at numerous points.
When the crates were filled, the bacterial counts of red radishes rose to 6.35 log10 CFU/g. During the storage
period, an increase of around 1 log level was recorded; no difference was measured between those samples
stored in disposable packaging and those in reusable packaging. Figure 11 shows the development of the sen-
sory index.
It is notable that products stored at the top tended to receive worse evaluations in both reusable and dispos-
able crates. No significant differences were observed in the sensory index with regard to the type of packaging
used.

Study – Determination of spoilage levels of fresh fruit and vegetables according to the type of packaging, May 2013
- 24 -
Figure 11: Progression of the sensory index during the storage of red radishes
Fehler! Verweisquelle konnte nicht gefunden werden. shows the sensory evaluations of the individual prod-
uct characteristics at the end of the storage period. In particular, the juiciness and hardness of the products
from the top crates was rated worse than the ones in the middle and bottom disposable and reusable crates.
See also Figure 13.
Figure 12: Sensory evaluation of red radishes at the end of the storage (Day 11)
Figure 13: Red radishes in the bottom disposable crate (left) and in the top disposable crate (right)
During storage, no systematic differences could be identified in the temperature profiles and the humidity
conditions in disposable and reusable crates. The relative humidity fluctuated between 85% and 100%. Figure
0
0,5
1
1,5
2
2,5
3
3,5
Colour
External defects
Juiciness
HardnessLeaves
Smell
Overall
impression Disposable top
Reusable top
Disposable middle
Reusable middle
Disposable bottom
Reusable bottom
Study – Determination of spoilage levels of fresh fruit and vegetables according to the type of packaging, May 2013
- 25 -
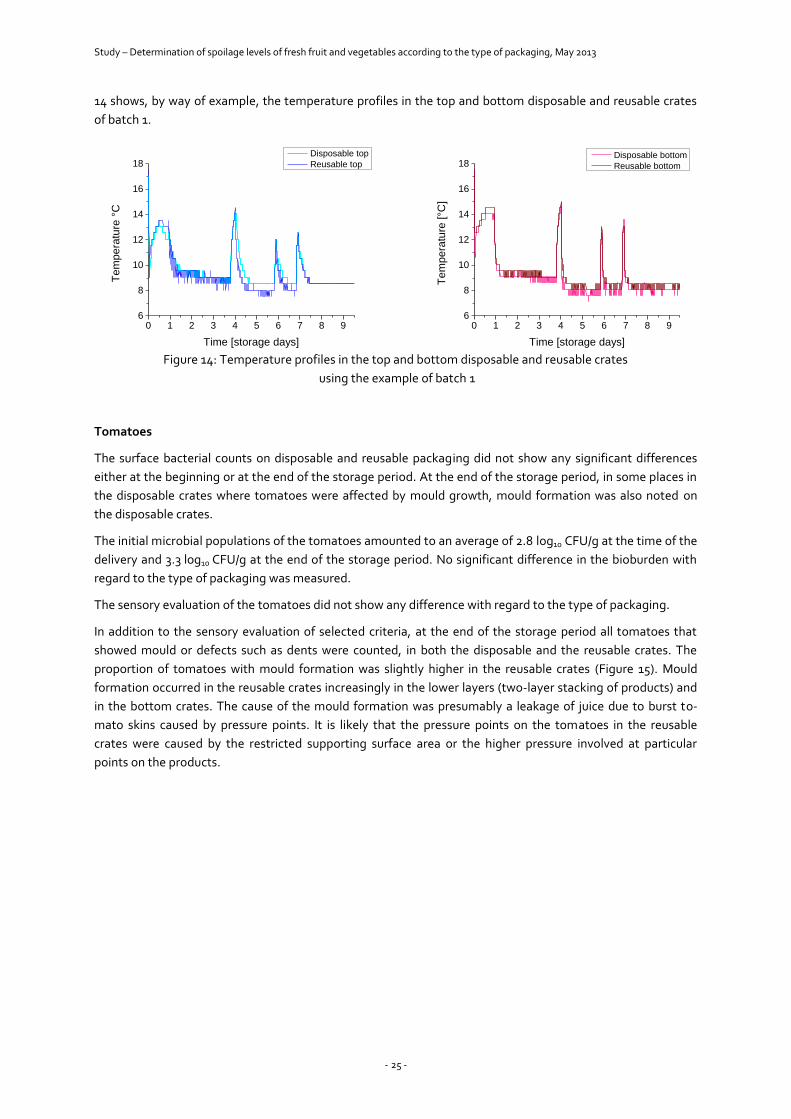
14 shows, by way of example, the temperature profiles in the top and bottom disposable and reusable crates
of batch 1.
Figure 14: Temperature profiles in the top and bottom disposable and reusable crates
using the example of batch 1
Tomatoes
The surface bacterial counts on disposable and reusable packaging did not show any significant differences
either at the beginning or at the end of the storage period. At the end of the storage period, in some places in
the disposable crates where tomatoes were affected by mould growth, mould formation was also noted on
the disposable crates.
The initial microbial populations of the tomatoes amounted to an average of 2.8 log10 CFU/g at the time of the
delivery and 3.3 log10 CFU/g at the end of the storage period. No significant difference in the bioburden with
regard to the type of packaging was measured.
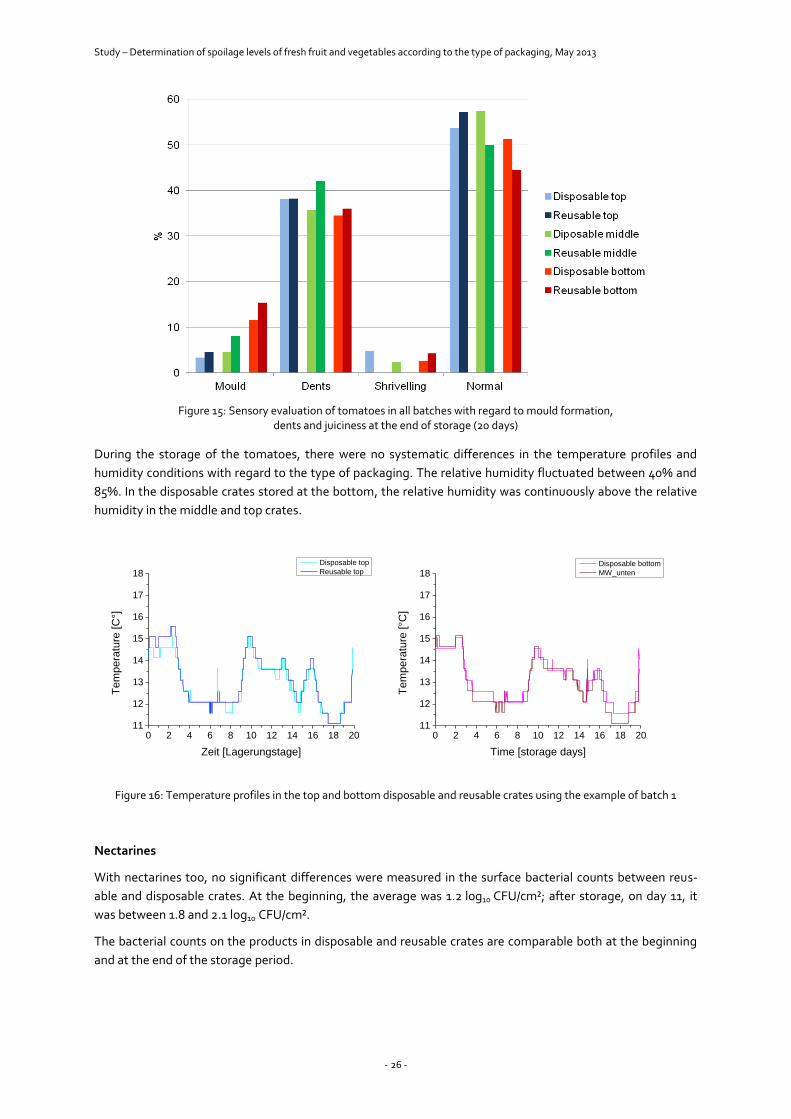
The sensory evaluation of the tomatoes did not show any difference with regard to the type of packaging.
In addition to the sensory evaluation of selected criteria, at the end of the storage period all tomatoes that
showed mould or defects such as dents were counted, in both the disposable and the reusable crates. The
proportion of tomatoes with mould formation was slightly higher in the reusable crates (Figure 15). Mould
formation occurred in the reusable crates increasingly in the lower layers (two-layer stacking of products) and
in the bottom crates. The cause of the mould formation was presumably a leakage of juice due to burst to-
mato skins caused by pressure points. It is likely that the pressure points on the tomatoes in the reusable
crates were caused by the restricted supporting surface area or the higher pressure involved at particular
points on the products.
0 1 2 3 4 5 6 7 8 96
8
10
12
14
16
18
Tem
pera
ture
°C
Time [storage days]
Disposable top
Reusable top
0 1 2 3 4 5 6 7 8 96
8
10
12
14
16
18
Te
mpera
ture
[°C
]
Time [storage days]
Disposable bottom
Reusable bottom
Study – Determination of spoilage levels of fresh fruit and vegetables according to the type of packaging, May 2013
- 26 -
Figure 15: Sensory evaluation of tomatoes in all batches with regard to mould formation, dents and juiciness at the end of storage (20 days)
During the storage of the tomatoes, there were no systematic differences in the temperature profiles and
humidity conditions with regard to the type of packaging. The relative humidity fluctuated between 40% and
85%. In the disposable crates stored at the bottom, the relative humidity was continuously above the relative
humidity in the middle and top crates.
Figure 16: Temperature profiles in the top and bottom disposable and reusable crates using the example of batch 1
Nectarines
With nectarines too, no significant differences were measured in the surface bacterial counts between reus-
able and disposable crates. At the beginning, the average was 1.2 log10 CFU/cm²; after storage, on day 11, it
was between 1.8 and 2.1 log10 CFU/cm².
The bacterial counts on the products in disposable and reusable crates are comparable both at the beginning
and at the end of the storage period.
0 2 4 6 8 10 12 14 16 18 2011
12
13
14
15
16
17
18
Tem
pera
ture
[°C
]
Time [storage days]
Disposable bottom
MW_unten
0 2 4 6 8 10 12 14 16 18 2011
12
13
14
15
16
17
18
Tem
pera
ture
[C
°]
Zeit [Lagerungstage]
Disposable top
Reusable top

Study – Determination of spoilage levels of fresh fruit and vegetables according to the type of packaging, May 2013
- 27 -
Figure 17 presents the results of the sensory evaluation of the nectarines on the different test days using the
sensory index. Analysis shows that the positioning of the crates has a greater influence on the loss of quality
than the type of packaging. Thus, the nectarines in the top disposable and reusable crates tended to be as-
sessed more poorly. This difference is presumably due to different temperatures and air-flow rates and, con-
sequently, changed humidity.
Figure 17: Development of the sensory index during the storage of nectarines
The sensory evaluation of nectarines, which tends to be worse in the upper section of the crate, is also re-
flected in figure 18. Here, the numbers of nectarines showing mould, visible shrinking of the skin and with no
defects was observed in differently positioned disposable and reusable crates. The number of nectarines
where a shrinking of the skin was observed was higher in the top reusable and disposable crates than in the
middle and bottom crates (disposable crates: 69 to 55 of 126; reusable crates 65 to 51 of 126).
Figure 18: Sensory evaluation of nectarines in all batches with regard to mould growth and juiciness at the end of the storage period (day 11)
The temperature profiles measured in the crates also do not show systematic differences between disposable
and reusable packaging. In general, there is a quicker adjustment of temperature and higher storage tempera-
tures for the disposable and reusable crates which are positioned above (Figure 19).

Study – Determination of spoilage levels of fresh fruit and vegetables according to the type of packaging, May 2013
- 28 -
0 1 2 3 4 5 6 7 8 9 106
8
10
12
14
16
18
Tem
pera
ture
[°C
]
Time [storage days]
Resuable top
Resuable middle
Resuable bottom
Figure 19: Temperature profiles in the top and bottom disposable and reusable crates for nectarines using the example of batch 1
Relative humidity fluctuated between 55% and 100%. However, no systematic differences between disposable
and reusable crates were ascertainable. In general, humidity fluctuated more strongly in the top crates than in
the bottom and middle crates (
Figure 20).
Figure 20: Graphs showing relative humidity in the top and bottom
disposable and reusable crates for nectarines, using the example of batch 1
The inferior sensory evaluation of the products in the top crates may be caused by such differences in the
temperature and humidity profile.
4.4 Influence of the type of packaging on the loss of freshness of fruit and vegetables with
data collection as of the place of harvesting
4.4.1 Procedure
It was the objective of this sub-study to assess the effects of types of packaging on the loss of freshness of the
fruit and vegetables contained using selected parameters. In comparison to the laboratory tests previously
described, one part of the test was conducted additionally under conditions simulating real-life use, “from the
field to the central warehouse”. The survey was conducted using strawberries and lettuce.
First, microbiological swab samples were collected in the field from the intended six disposable and six reus-
able crates. Before the filling process these crates were additionally equipped with data loggers for measuring
0 1 2 3 4 5 650
55
60
65
70
75
80
85
90
95
100
105
Hum
idity [
rel.%
]
Time [storage days]
Disposable bottom
Reusable bottom
0 1 2 3 4 5 6 7 8 9 10
6
8
10
12
14
16
18
Tem
pera
ture
[°C
]
Time [storage days]
Disposable top
Disposable middle
Disposable bottom
0 1 2 3 4 5 650
55
60
65
70
75
80
85
90
95
100
105
Hum
idity [re
l.%
]
Time [storage days]
EW_oben
MW_oben

Study – Determination of spoilage levels of fresh fruit and vegetables according to the type of packaging, May 2013
- 29 -
the temperature conditions and humidity. Subsequently, the crates were filled in the field with the products.
Furthermore, two composite samples for the microbiological and sensory first examination were taken from
the same product batch. The composite samples and the swap samples of the 12 crates were immediately
transported to the laboratory and analysed there.
The six disposable and six reusable crates were transported via the usual transport routes to the central ware-
house. During transport and in the warehouse the disposable and the reusable packaging units were stacked
three high, stored next to each other on a pallet and exposed, wherever possible, to the same environmental
conditions. After a typical storage time in the central warehouse the twelve crates were collected and stored in
the laboratory under trade-specific or household-specific temperature conditions respectively.
On arrival at the laboratory the freshness conditions of the products were determined using microbiological
and sensory parameters. Samples were taken from three disposable and three reusable crates each and exam-
ined. The remaining 3 disposable and 3 reusable crates were analysed on a sensory basis at predefined time
intervals. At the end of the storage period the bacterial counts of the products were furthermore determined
in all other crates. The end of storage was chosen at the time when the first products in the crates showed
clear signs of a loss of freshness. All tests were repeated three times. Table 2 provides an overview of the
products examined.
Product Quantity of products per test series
Total quantity of products
Total number of crates
Strawberries (10 × 500 g) crate: 64 × 10 cm
12 × 10 pcs = 120 trays
360 trays 18 disposable, 18 reusable
Lettuce heads (6 pieces) crate: 64 × 10 cm
12 × 6 pcs = 72 pcs 216 pcs 18 disposable, 18 reusable
Table 2: Survey of sample amount
Figure 21 shows the products in the respective disposable and reusable packaging. On the left, the reusable
packaging of plastic and on the right the disposable packaging of cardboard is presented each time.
Figure 21: Survey of the products and packaging used for the study

Study – Determination of spoilage levels of fresh fruit and vegetables according to the type of packaging, May 2013
- 30 -
4.4.2 Results
Strawberries
The surface bacterial counts on the disposable and reusable crates did not show any significant differences
either before the filling process or at the end of the storage period.
The bioburden of the strawberries directly after harvesting amounted to an average of 4.6 log10 CFU/g. During
the transport and the typical storage time in the central warehouse there was no measurable increase in bac-
terial count on the products after 1.5 days. At the end of the storage period (5 days for local field-grown straw-
berries [batch 1]; 7 days for greenhouse strawberries [batches 2 and 3]) the bacterial counts increased by a
maximum of 1.2 log levels. No significant differences with regard to packaging were measured.
Also the sensory evaluation did not show any differences in quality between the products in disposable and
those in reusable packaging. At the end of the storage period, all strawberries in the disposable and reusable
crates were counted and evaluated with regard to mould and dent formation. The results are represented in
Figure 22.
.
Figure 22: Sensory evaluation of strawberries in all batches with regard to mould formation and dents at the end of storage
Both mould and dent formation was neither influenced by the type of crate (reusable or disposable) nor by the
positioning of the crates (top, middle, bottom).
Figure 23 presents the temperature profiles in the top and bottom crates (disposable and reusable), using the
example of a batch. No systematic differences were identified in the temperature profiles between disposable
and reusable crates.

Study – Determination of spoilage levels of fresh fruit and vegetables according to the type of packaging, May 2013
- 31 -
Figure 23: Temperature profiles for the top and bottom disposable and reusable crates, using the example of batch 2
The relative humidity in the crates varied during the execution of the test between 45% and 100%. During the
three executions of the tests no systematic differences were identifiable in the relative humidity curves. How-
ever, in all tests it showed that the humidity was lowest in the lowest crates.
Figure 24: Graphs showing relative humidity in the top, middle and bottom crates (disposable and reusable)
0 1 2 3 4 5 6 7 8
4
6
8
10
12
14
16
18
20
Tem
pera
ture
[°C
]
Time [storage days]
EW_oben
MW_oben
0 1 2 3 4 5 6 7 84
6
8
10
12
14
16
18
20
Tem
pera
ture
[C
°]
Time [storage days]
Disposable bottom
Reusable bottom
0 1 2 3 450
60
70
80
90
100
Hu
mid
ity [re
l. %
]
Time [storage days]
Disposable top
Disposable middle
Disposable bottom
0 1 2 3 450
60
70
80
90
100
Hu
mid
ity [re
l. %
]
Time [storage days]
Reusable top
Reusable middle
Reusable bottom

Study – Determination of spoilage levels of fresh fruit and vegetables according to the type of packaging, May 2013
- 32 -
Lettuce heads
Before the crates were filled the bacterial counts on the reusable crates came up to 1.2 log10 CFU/cm², on the
disposable crates to 1.7 log10 CFU/cm². During storage the bacterial counts on the crates increased on average
by 2 log levels. At the end of the storage period the surface bacterial count on the reusable crates came up to
3.5 log10 CFU/cm² and the one on disposable crates to 3.7 log10 CFU/cm². Thus, the surface bacterial counts
were comparable both at the beginning and at the end of the measurement. It is a notable fact, however, that
at the end of the storage period the disposable crates or cardboard boxes respectively were heavily soaked
and unstable.
The bacterial counts of the lettuce heads directly after harvesting and on arrival at the laboratory fluctuated
between 5.5 and 5.7 log10 CFU/g in the disposable and the reusable crates.
During the storage period, bacterial counts of the lettuce heads in the disposable crates rose to an average of
6.2 ± 0.37 log10 CFU/g and that in the reusable crates to 5.9 ± 0.29 log10 CFU/g. This difference is not significant.
Figure 25 shows the progression of the sensory index during storage. The sensory evaluation during the stor-
age period was conducted on the stem side of the lettuce. During storage, no influence of the packaging on
the specific sensory characteristics was observed. On the last day of storage, the lettuce heads in the top
crates were evaluated generally worse with regard to the juiciness of the leaves than the ones in the middle
and bottom crates (Figure 26).
Figure 25: Development of the sensory index during storage of lettuce heads
In addition, on the last day of the storage period the lettuce heads were turned around and another sensory
evaluation was conducted on the top of the lettuce heads. Here, the heads in the disposable crates were
evaluated as being worse in many cases, notably because the leaves of the lettuces in the disposable crates
were more soiled.

Study – Determination of spoilage levels of fresh fruit and vegetables according to the type of packaging, May 2013
- 33 -
Figure 26: Sensory evaluation of the lettuce heads at the end of the storage period (day 9) from above and below
As regards the temperature profiles, no systematic differences were identified between disposable and reus-
able crates (Figure 27).
Figure 27: Temperature profiles in the top and bottom disposable and reusable crates for lettuce heads, using the example of batch 2
The relative humidity in the disposable crates was almost at 100%. Stronger fluctuations were identifiable for
reusable crates during storage.
0 1 2 3 4 5 6 7 8 9 100
2
4
6
8
10
12
14
16
18
20
22
Tem
pera
ture
[°C
]
Time [storage days]
Disposable top
Reusable top

Study – Determination of spoilage levels of fresh fruit and vegetables according to the type of packaging, May 2013
- 34 -
4.5 Summary (Part 2)
This study also sought to evaluate the impact of disposable and reusable packaging on the loss of freshness of
fruit and vegetables using selected parameters. The study was divided into three parts: in the first part, the
comparison of the surface bacterial counts on disposable and reusable packaging was the primary concern.
Increased bacterial counts on surfaces (measured as bioburden) indicate a lack of hygiene and subsequently an
increased risk of cross-contamination (surface – product). Depending on the type of bacterial flora, it is possi-
ble that cross-contaminations may accelerate the loss of freshness and influence the safety of a product.
In the second part, the loss of freshness of selected products, stored in disposable and reusable packaging
under laboratory conditions, was compared using sensory and microbiological parameters. Examinations were
carried out on radishes, tomatoes and nectarines. In the last part of the study, the loss of freshness in straw-
berries and lettuce was measured and compared in disposable and reusable packaging under realistic condi-
tions, i.e. beginning with the regional producer.
In this study, with one exception, no significant differences between the surface bacterial counts (measured in
terms of bioburden) for disposable and reusable packaging could be found, both before the filling process and
at the end of the storage period.
During the microbiological examinations, the total bacterial count for the products was measured throughout
the process chain. No significant differences were measured between products in disposable packaging and
those in reusable packaging.
Furthermore, the results of the sensory evaluations for disposable and reusable packaging were either compa-
rable or did not show any significant differences.
For certain products, such as nectarines and radishes, the position of the packaging (top, middle or bottom)
had an influence on the loss of freshness. These differences are mainly caused by temperature-related effects,
air-flow velocity and associated changes in humidity. Since the temperature loggers were positioned in the
middle of the base of the packaging in this test, these effects were not clearly visible in the measured temper-
ature profile.
No systematic differences were identified inside the disposable and reusable packaging with regard to tem-
perature sequences and humidity conditions.
The results of these regional practice-oriented studies cannot be extrapolated for long-distance transport
without a separate investigation. At present, no conclusions can be drawn on this matter.
Bibliography
Kreyenschmidt, J. & R. Ibald. 2012. "Modeling Shelf Life Using Microbial Indicators", in M. C. Nicoli, Shelf life
assessment of food, New York: Taylor and Francis, pp. 127–163.
Heard, G. M. 1999. "Microbial safety of ready-to-eat salads and minimally processed vegetables and fruits",
Food Australia, issue 51, pp. 414–420.
Mossel, D. A. A. 1971. "Physiological and metabolic attributes of microbial groups associated with foods",
Journal of Applied Bacteriology, vol. 34, issue 1, pp. 95–118.