Embed Size (px)
Citation preview

can alsoredn–his paperatMbstratesplicate theterms of
relations arensgh
Journal of Colloid and Interface Science 280 (2004) 484–497www.elsevier.com/locate/jcis
Determination of solid surface tension from particle–substrate pull-offforces measured with the atomic force microscope
Jaroslaw Drelicha,∗, Garth W. Tormoena, Elvin R. Beachb
a Department of Materials Science and Engineering, Michigan Technological University, Houghton, MI 49931, USAb The Dow Chemical Company, Analytical Sciences, 1897 Bldg., Midland, MI 48640, USA
Received 13 March 2004; accepted 3 August 2004
Available online 9 September 2004
Abstract
Atomic force microscopy (AFM) is capable of solid surface characterization at the microscopic and submicroscopic scales. Itbe used for the determination of surface tension of solids (γ ) from pull-off force (F ) measurements, followed by analysis of the measuF values using contact mechanics theoreticalmodels. Although a majority of the literatureγ results was obtained using either JohnsoKendall–Roberts (JKR) or Derjaguin–Muller–Toporov (DMT) models, re-analysis of the published experimental data presented in tindicates that these models are regularly misused. Additional complication in determination ofγ values using the AFM technique is ththe measured pull-off forces have poor reproducibility. Reproducible and meaningfulF values can be obtained with strict control over AFexperimental conditions during the pull-off force measurements (low humidity level, controlled and known loads) for high quality suand probes (surfaces should be free of heterogeneity, roughness, and contamination). Any probe or substrate imperfections cominterpretation of experimental results and often reduce the quality of the generated data. In this review, surface imperfection inroughness and heterogeneity that influence the pull-off force are analyzed based upon the contact mechanics models. Simple corproposed that could guide in selection and preparation of AFM probes and substrates forγ determination and selection of loading conditioduring the pull-off force measurements. Finally, the possibility of AFM measurements of solid surface tension using materials with rousurfaces is discussed. 2004 Elsevier Inc. All rights reserved.
Keywords: Atomic force microscopy; Chemical force microscopy; Adhesion; Surface energy; Surface tension
engiredepthers.de-
ng,en-ured-
uchero-per-tiondllydeedcalebeon ei-
bmi-e.
1. Introduction
Many modern materials possess surfaces that areneered to have special wetting, electronic, optical, and otheproperties. Material modification is often accomplishthrough an alteration of the material surface region at a dof a single atomic or molecular layer to several micrometThis can be achieved by adsorption of organic modifiers,position of thin inorganic or organic films, surface etchiinitiation of chemical reaction at the surface, etc. Manygineered surfaces cannot be melted, dissolved, or fracttherefore their surface/interfacial tension (γ ) cannot be de
* Corresponding author.E-mail address: [email protected](J. Drelich).
0021-9797/$ – see front matter 2004 Elsevier Inc. All rights reserved.doi:10.1016/j.jcis.2004.08.002
-
,
termined through any of the “conventional” techniques sas tensiometry, solubility studies, crystal cleavage, zcreep method, etc. The theoretical background and eximental techniques for solid’s surface tension determinahave been reviewed previously[1,2] and will not be repeatehere. Additionally, these conventional techniques are usuaapplicable to macroscopic solids, whereas the current trenin miniaturization of products and devices pose the nfor examination of nanosurfaces or surfaces with nanoscharacteristics. Newγ determination methods need todeveloped to meet these needs. Two techniques basedther (i) contact angles for macroscopic surfaces[3] or (ii)adhesion force measurements for microscopic and sucroscopic surfaces by AFM[4] have been under intensivdevelopment by several research groups in recent years

J. Drelich et al. / Journal of Colloid and Interface Science 280 (2004) 484–497 485
plesub-ctivefor
/orm-
copien
nvi-alf
olidea
quesur
re ovelsthefor
theceacedtionff
mearevarycs oation
forusedi-s onns, anted
it-ea-ctioniusicle
isce-
redg be
ver
crves
ahingingap-
toentiff-to
ur-
ec-te istantleft
sur-vsace.sioning
. Atthired
he-
The experimental approach to determineγ of solidsbased on contact angle measurements is relatively simfor flat, smooth, homogeneous, and inert macroscopicstrates. Problems arise with substrates that are: (i) reawith, or sensitive to, the environment (common casesolids in contact with many liquids or solutions), and(ii) have small dimensions (e.g., small or powdered saples, patterned heterogeneous substrates with microsdomains). In other words, the contact angle measuremtechnique is limited to materials that are stable in the eronment of the probing liquids. Any ionization of functiongroups, chemical instability of the solid, or dissolution othe solid by the probing liquid invalidates this method forγ
determination. Also, the interfacial tension between a sand a solution cannot be deduced from contact angle msurement results. Additionally, the contact angle techniprobes “average” surface properties of heterogeneousfaces and thus, is unable to distinguish the discrete natusuch surfaces at the microscopic and submicroscopic leThe direct method of pull-off force measurements usingatomic force microscope is a very attractive techniquesurface characterization of such engineered materials.
In this paper, we first briefly discuss the basics ofAFM technique for the determination of the solid surfatension and then, discuss common technical problems fby the researchers during normalization and interpretaof the AFM pull-off force measurements. The AFM pull-oforce measurements have not been widely accepted forsurements ofγ of solids because of an irreproducible natuof the data generated by this approach. Factors such asing surface roughness and heterogeneity characteristiboth probes and substrates, and varying loads/deformof the tip and substrate are among the major reasonswidely scattered data, even for the same set of materialsin a single experiment. Strict control of all of these contions should be recognized. This paper reviews progresapplication of the AFM technique as an analytical tool imeasurements of surface tension of engineered surfaceseveral new aspects of these measurements are presenthis paper.
2. Measurements of pull-off forces using atomic forcemicroscopy
2.1. Basics of the AFM technique
The principles of the AFM are well described in the lerature[4–6]; here, the major features of surface force msurements are reviewed. The AFM measures the defleof a cantilever spring with a sharp cantilever tip (tip radis usually 10 to 100 nm) or an attached particle (a partwith a diameter ranging from about 2 to more than 20 µmglued to the end of the cantilever) as a function of displament from a horizontal position. The deflection, monitoby a laser–photodiode system, relates to the forces actin
ct
-
-f.
-
-f
d
din
-
Fig. 1. Schematic of a cantilever deflection vs vertical position of cantilecurve in the AFM measurement of surface forces.
tween a probing tip and a substrate.Fig. 1shows a schematiof the cantilever deflection vs tip–substrate distance cuandFig. 2shows two examples of cantilever tips.
As shown inFig. 1, the AFM measurement starts atlarge tip–surface separation in the so-called nontoucregime. Then with or without a slight deflection, dependon the long-distance tip–surface interactions, the surfaceproaches the tip following the horizontal line moving rightleft in the force vs distance curve. At a certain point, whthe tip–substrate attractive interactions overcome the sness of the cantilever, the transition from nontouchingtouching occurs, and the tip “jumps” onto the sample sface.
Moving the substrate (surface) still further causes defltion of the cantilever equal to the distance that the substramoved. This is referred to as the touching regime or conscompliance region represented by the diagonal line in thepart of the force vs distance curve. Upon retracting theface from the tip, i.e., going toward the right in the forcedistance curve, the cantilever again moves with the surfThe cantilever deflects toward the surface due to adheforce before the tip breaks contact with the surface, gothrough the lowest point in the force vs distance curvethis “jump-off” point, the tip completely loses contact withe surface, and the cycle is complete. The force requto pull the tip off the substrate surface is calledpull-off oradhesion force (F ) and is calculated from Hooke’s law,
(1)F = k�x,
wherek is the spring constant of cantilever and�x is themaximum deflection of cantilever during tip–substrate adsion.

486 J. Drelich et al. / Journal of Colloid and Interface Science 280 (2004) 484–497
Fig. 2. Scanning electron micrographs of a cantilever tip (left) and colloidal probe (borosilicate glass) glued to a tipless cantilever (right).
tos onvere-s ode-theith
tantere-10%s inp, aays,sconlledues
nd
arearee
ionre
eenoicevers
forThe
pringers.ur-
romr V-up
eg-osecan-
s are(seeen-latedthe
andormopic-ex-
old,
nantss ist-
knot
cisetion
ora-uaremo-
Accuracy of theF measurement, which directly relatesthe solid surface tension (as will be shown later), dependthe precision of which both the spring constant of cantileand its deflection during pull-off force measurements are dtermined. The laser beam–photodiode detector systemthe AFM instruments are usually capable of recordingflection of the cantilever to subangstrom precision andmajor error in pull-off force determination is associated wthe k value determination. This error, however, is consand cannot cause a scatter ofF values, always reported in thliterature even for the highest quality and most carefully ppared probes and substrates. Standard deviation fromto 20% of an average value is commonly reported. Errorpiezo responses resulting from piezo hysteresis and creewell as fluctuation of light intensity and its interference, mcause variations in theF value determination. Neverthelesthe major causes for the scatter ofF values are imperfectionin solid surfaces of both substrates and probes and untrolled deformations of the materials posed by uncontroand varied loading conditions. We will return to these issin a later part of this paper.
2.2. Cantilever’s spring constant
Two basic types of cantilevers, triangular (V-frame) asingle beam cantilevers (rectangular or trapezoidal)[5,6],commonly used for imaging of substrate topography,also used for force measurements. V-frame cantileversmade of polycrystalline silicon or silicon nitride. They comavailable with a variety of elastic constants, from a fractof N/m to several N/m. Single beam silicon cantilevers astiffer with spring constants varying from several N/m totens of N/m. The expected strength of the adhesion betwthe tip of the cantilever and a substrate dictates the chof cantilever (i.e., strong adhesion forces require cantilewith large spring constants).
Estimates for the cantilever spring (elastic) constantevery type of cantilever is provided by the manufacturer.
f
s
-
values specified by producers are however, average sconstants, usually determined for a batch of cantilevSmall variations in the dimensions of the cantilever ding manufacture result in significant changes ink, therefore,the spring constant for each cantilever may deviate fthe specified average value by as much as 10–20% foframe cantilevers (which are very regular in shape) andto 100% for single beam cantilevers (which are more irrular in shape). In quantitative force studies, such as thdiscussed in this paper, it is necessary to determine thetilever spring constant more accurately.
Among several proposed approaches, three methodcommonly used for the spring constant determinationRef. [7] for review). The first method is based on convtional static mechanics, and the spring constant is calcufrom the cantilever dimensions and Young’s modulus ofmaterials used for cantilever fabrication[7]. This method ismore suitable for cantilevers that are regular in shaperequires that the material properties are known and unifover the entire cantilever. The presence of submicroscdefects are detrimental to mechanical properties of microscopic cantilevers and can cause deviation from what ispected for bulk material. The thickness of a coating (gfor example), if applied, must also be known.
A second method relies on measurement of the resofrequency of the cantilever before and after an end-maattached[8]. A spherical particle, typically tungsten, is atached to the cantilever throughcapillary forces. A drawbacof this nondestructive method is that particles often dostay attached to the cantilever without glue. Also, preweights of particles are required for accurate determinaof k.
A third method is called the thermal noise method[9].Although this method is restricted to cantilevers withk <
1 N/m, it has became very popular among service labtories. This method relies on measurements of mean sqdisplacement of the unloaded cantilever due to thermal

J. Drelich et al. / Journal of Colloid and Interface Science 280 (2004) 484–497 487
ve-
asegereveinedn-
qua
es
(ortheull-a-
ct.themucureliesg-
eal-las-le–anic
n-elity.rti-ithereiatein-
ult,s
er tots.any
besrobeurfa
n et
rs toue.anyn-ratefor-i-llyfon-om-ibestaction,ic
s inandton-
con-ela-
,
r-
ap-tiontheattheT
se-otoreur-KRacedoes
ap-our
ug-pre-
tion. The details of this method as well as two other abomentioned methods are reviewed by Sader[7].
These days, precalibrated cantilevers can be purchfrom several companies and this task is usually no lonnecessary for researchers. It should be recognized, howthat the experimental spring constants are always determwith limited precision and errors of typically 5–10% are ecountered, though a 20% error is not unusual.
3. Correlation between pull-off force and solid surfacetension
The equilibrium work of adhesion (WA) is defined by thenegative of the Gibbs free energy change per unit area (�G)of interacting interfaces, and is expressed by the Dupré etion [3],
(2)WA = −�G = γ13 + γ23 − γ12,
where subscripts 1, 2, and 3 describe three different phasof the system: solid 1, solid 2, and fluid.
If we replace one surface with a spherical particleprobing tip), such as the systems used in AFM studies,relation between the work of adhesion and adhesion (poff) force (F ) can be described by the Derjaguin approximtion,
(3)F = 2πRWA,
which is applicable to perfectly rigid particles in contaThe Derjaguin approximation is valid for systems whereseparation distance between the sphere and substrate isshorter than the radius of the sphere (probe). In measments of adhesion forces this assumption always appbut this approximation can fail in the examination of (lonrange) noncontact forces. It is important to note that in rity, particles and/or substrates deform elastically and/or ptically under applied loads during adhesion, and particsubstrate analysis requires more accurate contact mechmodels that include a physical deformation component.
In AFM pull-off force measurements, continuum cotact mechanics models are commonly used to describthe probe–substrate system with a high degree of ideaTypical AFM measurements utilize either spherical pacles glued to cantilevers or commercial cantilever tips wrounded ends and such systems are modeled as a sphcontact with a flat surface. Many practical systems devfrom this idealized geometry, often causing problems interpretation of measured AFM pull-off forces. As a ressignificant effort is always concentrated on preparation of aclose-to-perfect sphere–flat systems as possible in ordsimplify the analysis of experimental pull-off force resulHowever, this has not always been accomplished and mliterature reports lack complete characterization of proand substrates (i.e., probe geometry and dimension, pand substrate surface roughness, probe and substrate sheterogeneity, etc.).
d
r,
-
h-,
s
in
ce
Two contact mechanics models derived by Johnsoal. [10] and Derjaguin et al.[11], named JKR and DMTmodels, respectively, are frequently used by researcheinterpret the pull-off forces measured by the AFM techniqThese analytical models were reviewed in detail by mauthors[4,12–16] and will not be repeated here. In geeral, both JKR and DMT models apply to particle–substsystems where the following assumptions are met: (i) demations of materials are purely elastic, described by classcal continuum elasticity theory, (ii) materials are elasticaisotropic, (iii) both Young’s modulus and Poisson’s ratio omaterials remain constant during deformation, (iv) the ctact diameter between particle and substrate is small cpared to the diameter of particle, (v) a paraboloid descrthe curvature of the particle in the particle–substrate conarea, (vi) no chemical bonds are formed during adhesand (vii) contact area significantly exceeds molecular/atomdimensions.
The difference between JKR and DMT models occurassuming the nature of forces acting between particlesubstrate. Johnson et al.[10] assumed in their model thaattractive forces act only inside the particle–substrate ctact area, whereas Derjaguin et al.[11] included long-rangesurface forces operating outside the particle–substratetact area. Both JKR and DMT models describe the corrtion between pull-off force (F ) and work of adhesion (WA)through a simple analytical equation of the following form
(4)F = cπRWA,
which leads to Eq.(5) for a symmetrical system (when inteacting materials and their surfaces are the same):
(5)γ = F
2cπR.
R is the radius of the particle (probing tip) andc is a con-stant; c = 2 in the DMT model andc = 1.5 in the JKRmodel. Thus, knowing which contacts mechanics modelplies to a particular system under study, and setting operaconditions during the AFM measurements that satisfyparticular model, theγ value can be determined. Note th(i) both models, JKR and DMT, were derived based onHertz theory[17], and (ii) an analytical solution to the DMmodel was provided by Maugis[16].
Which of the contact mechanics models should belected for interpretation of the AFM pull-off forces is nalways straightforward. In general, the DMT model is mappropriate for systems with hard materials having low sface energy and small radii of probe curvature. The Jmodel applies better to softer materials with higher surfenergy and larger probes. This generalization, however,not bring the researcher any closer to the selection of thepropriate model and mistakes are often made (includingown).
Maugis analyzed both the JKR and DMT models and sgested that the transition between these models can be

488 J. Drelich et al. / Journal of Colloid and Interface Science 280 (2004) 484–497
the
or
ly.as
de-
toels
beand
ichn th
ly:
es-
pleated
lit-omicoffod-es,
fority,FM
ea-, theulate
om-nsor-
-thech
onse-ers,used
sd ex-
n-d intiononeenlobeth
s ofalsod ing the-es
c-ectandfacealy-ngtionaltion
oresiththe
dicted from the dimensionless parameterλ defined as[16]
(6)λ = 2.06
z0
3
√RW2
A
πK2 ,
wherez0 is the equilibrium separation distance betweenprobe and substrate,R is the radius of the probe,WA is thework of adhesion, andK is the reduced elastic modulus fthe particle–substrate system where
(7)1
K= 3
4
(1− ν2
p
Ep
+ 1− ν2s
Es
);
ν is the Poisson ratio andE is the Young’s modulus, andpands stand for probe (particle) and substrate, respective
For λ → ∞ (λ � 5) the JKR model applies wherethe DMT model is more appropriate for systems withλ →0 (λ � 0.1). The transition between these two models isscribed by the Maugis–Dugdale (MD) theory[16]. Often forAFM pull-off force measurements, the MD model seemsbe more appropriate than either of the JKR or DMT modas will be shown in the next section.
In the MD model, two parametric equations mustsolved to describe the transition region between JKRDMT mechanics. These equations are[16]
(8)P = A3 − λA2(√
m2 − 1+ m2 cos−1(
1
m
)),
λA2
2
[√m2 − 1+ (m2 − 2)cos−1
(1
m
)]
(9)+ 4λ2A
3
[−m + 1+
√m2 − 1cos−1
(1
m
)]= 1,
wherem = b/a is the ratio between an outer radius at whthe adhesive stress no longer acts in the gap betweesurfaces and the contact radius;P andA are the normalizedload and normalized radius ofthe contact area, respective
(10)P = P
πRWA,
(11)A = a
(πR2WA/K2)1/3.
A problem with this model is that there is no single exprsion between a andP and both Eqs.(8) and (9)must besolved simultaneously. Importantly, there is also no simrelation for pull-off force and iteration is needed to calculthec value (1.5< c < 2) in Eq.(4). Examples of calculatec values for differentλ parameters are presented in[18].
4. Solid surface tension values determined by the AFMtechnique: critical literature review
Table 1summarizes a number of data reported in theerature for adhesion force measurements made with atforce microscopy. This table includes data from pull-force measurements for AFM cantilever tips, both unmified and coated tips, as well as for some colloidal prob
e
performed either in liquid or gaseous environments. Assubstrates, gold films modified with organic functionalpolymers, and inorganic materials were used in the Aexperiments. The spring constant is shown inTable 1 toderive possible loading conditions experienced during msurement, a parameter often left unreported. In additioncontact mechanics model used by the authors to calcthe work of adhesion (WA) along with the reportedWA isincluded. This is contrasted with what is predicted forWAfrom contact angle determinations of surface tension cponents for the tested materials. The final four columdepict calculations performed for the tested systems inder to determine what constant (c) is appropriate for determining WA from force measurements, according toMD model [16]. In this contribution, we used the approaproposed by Carpick et al.[18] in determination of thec pa-rameter. The corresponding recalculatedWA value is shownin the last column of the table.
Table 2shows the material properties used in calculatiof the reduced elastic modulus (K) for the probe–substratsystems presented inTable 1. Finally,Table 3shows the calculatedK values. Note that for self-assembled monolaythe material properties of the underlying substrate wereto determineK and not the properties of the monolayer filmthemselves due to the small thicknesses (1–1.5 nm) anpected pliancy of the monolayers.
As shown inTable 1, both continuum contact mechaics models, the JKR model and DMT model, were useanalysis of the measured pull-off forces, although selecof a particular model was rarely justified. Also, basedthe literature reports there is no clear distinction betwanalysis of the data generatedwith sharp tips and colloidaprobes, in spite of the fact that both the size of the prand spring constant of cantilever differ significantly in bocases. Additionally, although we do not analyze all detailprevious experimental work, we noted that many paperslack reporting of mechanical properties of materials useexperimentation and loads that are used during pressintip or colloidal probe on the substrate surface. This information is important for detailed analysis of the pull-off forcand behavior of the tip–substrate system.
The calculated values of the Maugis parameter (λ) for theliterature systems (Table 1) indicate that a common charateristic in a majority of publications is the use of an incorrcontact mechanics model for analysis of pull-off forcessubsequent calculation of the work of adhesion or surenergy. The JKR model was used most frequently in ansis of pull-off forces obtained with colloidal probes comiin contact with various substrates. Although the selecof the JKR model for analysis of the results from colloidprobe microscopy studies is often appropriate, this selecshould not be blindly made without analysis of theλ para-meter; examples of the systems where the MD model is mappropriate are shown inTable 1. Also, the JKR model wathe most popular in analysis of pull-off forces measured wsharp tips (regular and coated), in spite of the fact that

J. Drelich et al. / Journal of Colloid and Interface Science 280 (2004) 484–497 489
Table 1Measured and calculated values of the work of adhesion for different systems
Ref. System Probe Lit. results This study
Surfacechemistry
Medium R [nm]or [µm]
k
[N/m]WA [mJ/m2]Predicted Determined
Modelused
K
[GPa s]λ (z =0.2–0.4 nm)
c WA
[mJ/m2]
Sharp tips (R in [nm])
Noy et al.[19] COOH–COOH Ethanol 54 0.12 ND 8.9± 3.1 JKR 64.4 0.04–0.07 2.0 6.7± 2.3CH3–CH3 5 3.9± 1.5 c = 1.5 64.4 0.03–0.06 2.0 2.9± 1.1
Van der Vegteand Hadziioan-nou[20]
CH3–CH3 Ethanol 35 0.2 5 5 JKR 64.4 0.03–0.05 2.0 3.8CH3–CH3 Water 104 103 c = 1.5 64.4 0.2–0.4 1.8 86OH–OH Ethanol ND 6 64.4 0.02–0.04 2.0 2.3NH2–NH2 Ethanol ND 5.6 64.4 0.01–0.03 2.0 2.1COOH–COOH Ethanol ND 9 64.4 0.03–0.05 2.0 3.4CONH2–CONH2 Ethanol ND 10.6 64.4 0.03–0.06 2.0 4.0
Tsukruk andBliznyuk [21]
SiOH–SiOH Water 40–500 0.23–0.25 ND 4 JKR ND ND ND NDSi3N4–Si3N4 8 c = 1.5 220.7 0.01–0.06 2.0 6NH2–NH2 4.5 76.9 0.02–0.08 2.0 3.4SO3H–SO3H 1.5 76.9 0.01–0.04 2.0 1.1CH3–CH3 0.5 76.9 < 0.02 2.0 0.4
Clear andNealy[22]
CH3–CH3 Hexadecane ∼60 0.44 1.6 4.1 JKR 70.2 0.02–0.03 2.0 3.1Ethanol 5.5 3.3 c = 1.5 70.2 0.03–0.07 2.0 2.51,2-Propanediol 27.1 20.7 70.2 0.1–0.2 1.9 16.31,3-PropanediolWater
43.7 41.5 70.2 0.13–0.27 1.9 32.8102.8 102.9 70.2 0.24–0.47 1.8 85.8
COOH-ox-OYTS Hexadecane ND 19.6 70.2 0.1–0.2 1.9 15.5Ethanol ND 10.1 70.2 0.04–0.08 2.0 7.61,2-Propanediol ND 16 70.2 0.05–0.1 2.0 121,3-PropanediolWater
ND 6 70.2 0.03–0.07 2.0 4.5ND 1.7 70.2 0.01–0.02 2.0 1.3
COOH–COOH 1,2-Propanediol ND 14 70.2 0.05–0.09 2.0 10.51,3-Propanediol ND 14.6 70.2 0.05–0.1 2.0 11
CH3-ox-OYTS Hexadecane ND 4.6 70.2 0.02–0.04 2.0 3.5Ethanol ND 2.1 70.2 0.01–0.03 2.0 1.61,2-Propanediol ND 4.9 70.2 0.02–0.04 2.0 3.71,3-PropanediolWater
ND 6 70.2 0.03–0.07 2.0 4.5ND 0.9 70.2 0.01–0.02 2.0 0.7
El Ghzaoui[23]
SiO2–PTFE Dry N2 70 NA 95 88 DMT 0.7 1.7–3.4 1.6 110SiO2–PP 110 114 c = 2 2 1.0–2.0 1.6 142SiO2–PU 145 150 ∼(1–2) ∼(1–2) 1.6 187
Skulason andFriesbie[24]
CH3–CH3 Water 15–130 0.23–0.28 103 110± 10 JKR 64.4 0.16–0.64 1.8 92± 8c = 1.5
Jaquot andTakadoum[25]
Si3N4–silica Water 200 0.3 27.9 30 DMT 99.9 0.1–0.2 1.9 32Si3N4–TiN 20 18.3 c = 2 ND ND ND NDSi3N4–DLC 13.5 12 337.7 0.03–0.06 2.0 12Si3N4–Si(111) 27.5 42 114.1 0.1–0.2 1.9 44Si3N4–Si(100) 19.9 24 114.1 0.09–0.2 1.9 25
Leite et al.[26] Si–mica Water 23 0.13 110 83 DMT 36.6 0.3–0.6 1.8 92Si–mica Air 215 173 c = 2 36.6 0.4–0.9 1.7 204
Colloidal probes (R in [µm])
Burnham et al.[27]
W–mica Dry N2 2.5± 0.5 50± 10 369 21 DMT 44.4 2.4–4.8 1.5 28W–graphite 210 14 c = 2 ND ND ND NDW–Al2O3 2.0± 0.5 128 8 286 0.3–0.8 1.7 9.4W–CH3 98 3 286 0.3–0.6 1.8 3.3W–CF3 2.5± 0.5 96 1 286 0.3–0.7 1.8 1.1W–PTFE 2.0± 0.5 92 0 0.7 15–35 1.5 ND
(continued on next page)

490 J. Drelich et al. / Journal of Colloid and Interface Science 280 (2004) 484–497
Table 1 (continued)
Ref. System Probe Lit. results This study
Surfacechemistry
Medium R [nm]or [µm]
k
[N/m]WA [mJ/m2]Predicted Determined
Modelused
K
[GPa s]λ (z =0.2–0.4 nm)
c WA
[mJ/m2]
Biggs andSpinks[28]
PS–mica Dry N2 5 27± 1 102.4 148.5/122.5 JKR/MP 4 7–14 1.5 148.5
Nalaskowski etal. [29]
PE–SiO2 Water 5–9 27–30 21 4.4 JKR 2 2–7 1.5 4.4PE–SiO2 (heat) 35 21 c = 1.5 4–8 1.5 21PE–CH3 66 64 6–12 1.5 64
y
mp-
ithT
temwith
-off-n ofsizee ofe-(astrumue.lmtals,m-edon
atoryly-
rss ofusend-
di-ed
u-i-ith
theenddAM-opyntal
enbyver
dalof
f col-ithlim-ing.
Table 2Elastic modulus and Poisson’s ratio for materials analyzed in this stud
Material Young’s modulus[GPa]
Poisson’sratio
Source
Au 78 0.44 [30]W 411 0.28 [30]PS 2.8–3.5 0.38 [31]PP 1–1.6 0.4 (assumed) [31]PTFE 0.41 0.46 [31]Mica 34.5 0.205 [32]Si 107 0.27 [33]Si3N4 (hot pressed) 300–330 0.22 [33]SiO2 94 0.17 [33]Diamond 1035 0.1–0.29 [34]Al2O3 390 0.2–0.25 [33]
small dimensions of the tips comply better with the assution of the DMT model. As shown inTable 1, the results ofchemical force microscopy studies (sharp tips modified worganic functionality) can usually be analyzed by the DMmodel. This again cannot be assumed a priori, and syswith softer substrates such as polymers require analysiseither the MD model or JKR model.
5. Common sources of experimental errors (andmisconceptions)
5.1. Characterization of the AFM probes
One of the key to a successful understanding of pullforces measured by AFM, and establishment of their relation with surface tensions, is a detailed characterizatiothe system under investigation including both shape andof the probe tip. Conventional cantilevers have tips madonly two type of materials, silicon or silicon–nitride, therfore tips are often modified or replaced with particlesdiscussed in the previous section) to broaden the specof materials that can be studied with the AFM techniqThe tip material may be altered by coating with a thin fiof metal, however, due to high surface energies of methe control of their surface chemistry is difficult. For exaple, oxide films grow very fast on a majority of depositmetals. Organic contaminants also adsorb very quicklyboth metals and oxides when exposed to a regular laborenvironment. It is also possible to form coatings of po
s
Table 3Reduced elastic moduli for AFM systems reported in the literature
System 1/K K [GPa]
Au–Au 1.55077× 10⁻¹¹ 64.4Si–Si 1.29967× 10⁻¹¹ 76.9Si3N4–Si3N4 4.53143× 10⁻¹² 220.7W–mica 2.25073× 10⁻¹¹ 44.4W–PTFE 1.53827× 10⁻⁹ 0.7PS–mica 2.50004× 10⁻¹⁰ 4.0Si–mica 2.73239× 10⁻¹¹ 36.6Si3N4–Si 8.76408× 10⁻¹² 114.1Au–Si 1.42522× 10⁻¹¹ 70.2W–Al2O3 3.5031× 10⁻¹² 285.5Si3N4–SiO2 1.00139× 10⁻¹¹ 99.9Si3N4–DLC 2.96137× 10⁻¹² 337.7SiO2–PTFE 1.44994× 10⁻⁹ 0.7SiO2–PP 4.92364× 10⁻¹⁰ 2.0
meric materials on the cantilever tips, although researchehave not explored this option, mainly due to the dangerdepositing polymer on the cantilever leg, which can caproblems with reflection of the laser beam and affect being of the cantilever.
Silicon or silicon nitride surfaces can be directly mofied with (organic) silanes, but the quality of the adsorbmolecular layers is often questionable. Instead, tips are usally coated with a thin film of gold, which is next modfied with self-assembled monolayers (SAMs) of thiols wa desirable functionality. SAMs of thiols (X–(CH2)n–SH)form a very regular, close-packed structure by reacting–SH end group with a gold surface whereas the othergroup (X: CH3, OH, COOH, NH2, and others) is exposeto the environment. Force measurements made with Smodified tips are categorized as chemical force microsc(CFM) and have become an area of intensive fundameresearch[35,36].
A small particle with a diameter of 2 to 20 µm (or evlarger) can also be attached to the cantilever, typicallygluing or in some cases melting the particle to the cantile(we follow previous reports and call such probes “colloiprobes” in many parts of this paper, although the sizesuch probes are larger than frequently accepted size oloids,�1 µm). Both tipless cantilevers and cantilevers wregular tips are used for this purpose. This allows nearlyitless combinations of materials to be used in force test

J. Drelich et al. / Journal of Colloid and Interface Science 280 (2004) 484–497 491
ol-
ate ofy ofcu-dals,withdm-cesn thre-
dingt theomureardMs)t re-jectionhanrizeds,
ra-
tlyng--leman-glsong
Mconkesely,a-f thetipthethan
or-reTR
re-ningGT
nbe
tivi-cordsicearparti-
beng,d.
edonsub-im-
Fig. 2 shows example of both a commercial tip and a cloidal probe.
A problem with manufacturing of colloidal probes is thnot many materials are commercially offered in the shapsmall spherical particles, and often a new methodologcolloidal particle precipitation, characteristic to that partilar material (as, for example, in[37,38]), must be developefor this purpose. This is not practical for some materitherefore force measurements have been carried outirregular particles[39–41], which make quantification aninterpretation of the experimental data difficult or even ipossible. Even “spherical” particles can show rough surfaat the nanoscale that can affect the contact area betweeprobe and substrate during the AFM pull-off force measuments.
Characterization of the probe size and its shape, includetermination of surface defects and nanoroughness atip apex, is an important task for analysis of the results frAFM pull-off force measurements. The radius of curvatfor AFM cantilever tips are less than 100 nm and standthermionic emission scanning electron microscopes (SEcannot resolve the edges of such small features withouducing the signal to noise ratio to the point that the obis indistinguishable from the background. Field emissSEM (FE-SEM) techniques have much better resolution tthermionic emission SEM, and are often used to charactethe AFM tip shape and topography.Two alternative methoboth utilizing the AFM instrument, are used in our labotory.
First, larger (colloidal) probes can be imaged direcwith another (much sharper) AFM cantilever using TappiMode AFM imaging.Fig. 3 shows an image of a polyethylene microsphere obtained by this technique. A probwith this approach is that positioning of the scanning ctilever tip over the top of the colloidal probe is difficult usinthe optical microscope attached to the AFM instrument. Ait is difficult to keep the cantilever solid and stable duriimaging.
e
Second, the technique calledblind tip reconstruction(BTR), developed by Villarubia[42], is more versatile andused frequently in our laboratory. In BTR, either the AFtip or colloidal probe is scanned over an ultrasharp siligrating (specially fabricated array of sharp silicon spior asperities such as in TGT or TGG gratings, respectivoffered by NT-MDT Co., Moscow, Russia). The grating fetures must have a higher aspect ratio than the shape oAFM tip in order to produce an inverted image of therather than the image of the spike/asperity. Also, radii ofgrating feature tip or edge should be small (they are less10 nm for TGT and TGG).
Using (Deconvo) software based on mathematical mphology operations (NT-MDT Co.), the radius of curvatuof the tip is determined from images generated by the Bmethod.Fig. 4shows an example of AFM image and corsponding cross section of this image produced by scanthe colloidal probe made of borosilicate glass over the Tgrating.
Noise artifacts in the image have a large influence othe results of BTR experiments. Low scan rates shouldused and the AFM instrument should be placed on an anbration support; a cement plate suspended by bungee(offered by Digital Instruments) is probably the best choin eliminating vibrations. Even after such precautions, shchanges in height of the grating features can producefacts in the image[36]. An additional complication in theBTR method is the possibility for scratching of the prowith the harder silicon spike/asperity. To avoid scratchiprobe–contact forces during imaging should be minimize
5.2. Plastic deformation of the probe
As shown inFig. 5, the probe can be severely damagduring the pull-off force measurements. Loads and frictiexperienced by the probe during multiple contacts with sstrate can induce plastic deformation in the material, or sply fracture the tip.
of
Fig. 3. Three-dimensional image of the apex of a 12-µm-diameter polyethylene microsphere attached to an AFM cantilever and a cross-sectional viewthisparticle. The SEM micrographs for similar particles are presented in[37].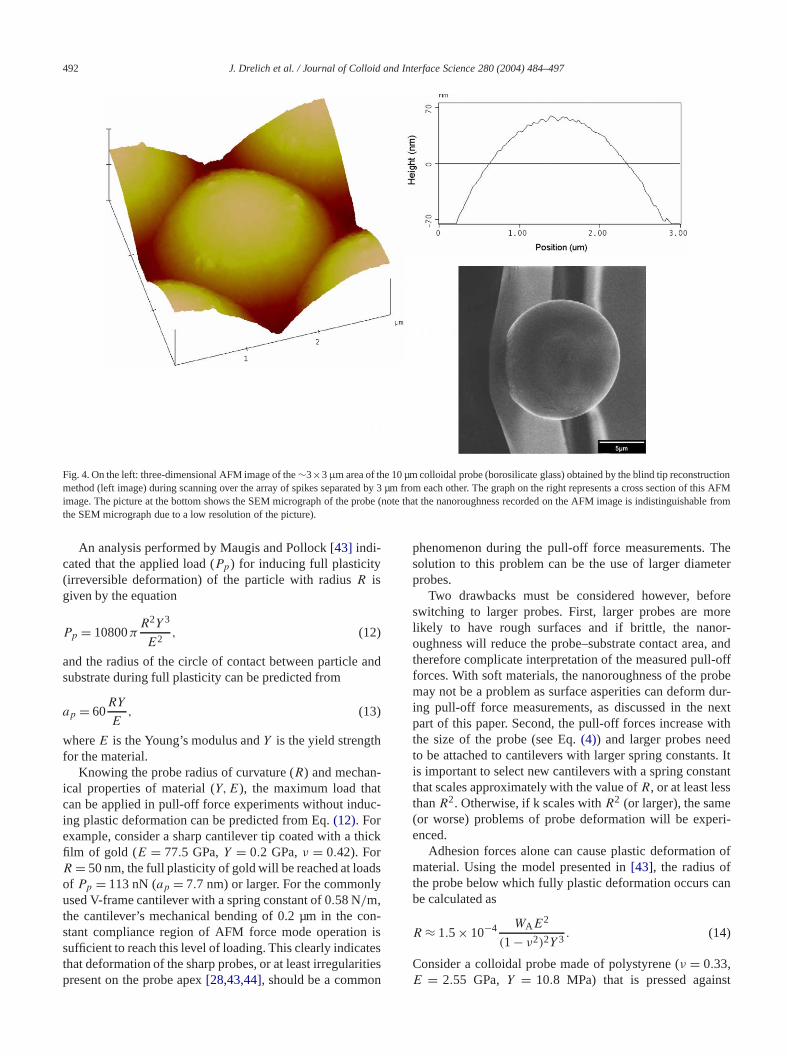
492 J. Drelich et al. / Journal of Colloid and Interface Science 280 (2004) 484–497
onAfrom
Fig. 4. On the left: three-dimensional AFM image of the∼3×3µm area of the 10 µm colloidal probe (borosilicate glass) obtained by the blind tip reconstructimethod (left image) during scanning over the array of spikes separated by 3 µm from each other. The graph on the right represents a cross section of thisFMimage. The picture at the bottom shows the SEM micrograph of the probe (note that the nanoroughness recorded on the AFM image is indistinguishablethe SEM micrograph due to a low resolution of the picture).
and
-tc-
hick
dsly
on-is
tesitiesn
Theeter
foreoreor-, andffrobedur-
nextith
dts. Ittant
eri-
n of
an
st
An analysis performed by Maugis and Pollock[43] indi-cated that the applied load (Pp) for inducing full plasticity(irreversible deformation) of the particle with radiusR isgiven by the equation
(12)Pp = 10800πR2Y 3
E2,
and the radius of the circle of contact between particlesubstrate during full plasticity can be predicted from
(13)ap = 60RY
E,
whereE is the Young’s modulus andY is the yield strengthfor the material.
Knowing the probe radius of curvature (R) and mechanical properties of material (Y,E), the maximum load thacan be applied in pull-off force experiments without induing plastic deformation can be predicted from Eq.(12). Forexample, consider a sharp cantilever tip coated with a tfilm of gold (E = 77.5 GPa,Y = 0.2 GPa,ν = 0.42). ForR = 50 nm, the full plasticity of gold will be reached at loaof Pp = 113 nN (ap = 7.7 nm) or larger. For the commonused V-frame cantilever with a spring constant of 0.58 N/m,the cantilever’s mechanical bending of 0.2 µm in the cstant compliance region of AFM force mode operationsufficient to reach this level of loading. This clearly indicathat deformation of the sharp probes, or at least irregularpresent on the probe apex[28,43,44], should be a commo
phenomenon during the pull-off force measurements.solution to this problem can be the use of larger diamprobes.
Two drawbacks must be considered however, beswitching to larger probes. First, larger probes are mlikely to have rough surfaces and if brittle, the nanoughness will reduce the probe–substrate contact areatherefore complicate interpretation of the measured pull-oforces. With soft materials, the nanoroughness of the pmay not be a problem as surface asperities can deforming pull-off force measurements, as discussed in thepart of this paper. Second, the pull-off forces increase wthe size of the probe (see Eq.(4)) and larger probes neeto be attached to cantilevers with larger spring constanis important to select new cantilevers with a spring consthat scales approximately with the value ofR, or at least lessthanR2. Otherwise, if k scales withR2 (or larger), the sam(or worse) problems of probe deformation will be expeenced.
Adhesion forces alone can cause plastic deformatiomaterial. Using the model presented in[43], the radius ofthe probe below which fully plastic deformation occurs cbe calculated as
(14)R ≈ 1.5× 10⁻⁴ WAE2
(1− ν2)2Y 3 .
Consider a colloidal probe made of polystyrene (ν = 0.33,E = 2.55 GPa,Y = 10.8 MPa) that is pressed again

J. Drelich et al. / Journal of Colloid and Interface Science 280 (2004) 484–497 493
Fig. 5. Field-emission scanning electron micrograph of a tip before and after use. The right picture shows that the tip was damaged (plastically deformed) andcontaminated during pull-off force measurements.
ifer
ev-phiccur-ad-ults
atesato-a-ningsub-es;r oncn inriedarti-
ng,theay
andent,angeorp-sol-
y (ine seten-
nsityrd tonta-h ak ofextuld
ichdi-
ss ata totactnter-le.cantioncol-
Nev-
pull-obe–of theforon-d in
ap-n.
mica (WA = 120 mJ/m2) as studied in[28]. According toEq. (14), the polystyrene probe will deform plasticallyR � 117 nm. Colloidal probes this small made of polymare not used in AFM pull-off force measurements. Nertheless, these calculations indicate that any topograirregularities on the probe surface that have a radius ofvature smaller than 117 nm can be deformed duringhesive polystyrene–mica contact. The experimental respresented in the literature support this possibility[28,44].
5.3. Substrate/probe imperfections: size limits
Contamination of a probe and a substrate by particuland adsorbates is a common problem in the AFM laborries. It is important to recognize that all pull-off force mesurements should be done with cleaned surfaces. Cleathe probe is usually a bigger challenge than cleaning thestrates.Fig. 6shows two images of borosilicate glass probone probe had been imaged before cleaning and anotheafter cleaning in a surfactant solution, water, and organisolvent. Severe contamination of the glass bead showFig. 6 was the result of static charge effects between ddust particles and glass. Surface contamination by dust pcles is difficult to avoid during the probe preparation/gluicantilever’s storage and use (particles purchased fromvendor that are used for preparation of colloidal probes malready be contaminated).
Cleaning procedures should differ for each probesubstrate. Such effects as dissolution of glue by solvetching or dissolution of the probe/substrate surface, chin probe/substrate surface functionality, or chemical adstion should be taken into consideration before selectingvents and cleaning conditions.
Surface defects such as roughness and heterogeneitherent or introduced by adsorbed/deposited species) arrious problems in the determination of the solid surface
e
--
sion by the AFM technique. Due to the small dimensioof the probes, both nanoroughness and nanoheterogeneinfluence the measured pull-off forces. There was neitheexperimental or theoretical research done that could leadetermination of the size of surface imperfections and comination, which affects the value of pull-off forces to sucdegree that the calculated solid’s surface tension (or woradhesion) is not reliable for a particular material. In the npart of this section, we present simple models, which cobe used for this purpose.
5.3.1. RoughnessIt is well recognized that substrate roughness, for wh
asperities’ dimensions are comparable or smaller to themensions of the probe, as well as any surface roughnethe probe apex, can affect the sphere–flat contact area degree that is not taken into account by simple conmechanics models discussed thus far. If this happens, ipretation of the pull-off forces is difficult or even impossibBoth microscopic and submicroscopic roughness effectsbe eliminated in many experiments by appropriate selecand preparation of the substrates. Nanoroughness ofloidal probes and/or substrates often cannot be avoided.ertheless, as discussed in the literature[28,29,44], nanoscaleasperities can be squeezed and flattened out during theoff force measurements to such a degree that the prsubstrate contact area is the same as predicted by onecontact mechanics models (usually JKR or MD modelcolloidal probes). In order to reach such experimental cditions, stiff cantilevers and higher loads need to be usethe AFM pull-off force measurements[29].
We expect that the asperity may be flattened out byplying a sufficient load to initiate its plastic deformatioTherefore, if we adopt the Maugis–Pollock analysis[43],Eq. (12) predicts that at a specified loadP , asperities with

494 J. Drelich et al. / Journal of Colloid and Interface Science 280 (2004) 484–497
Fig. 6. Scanning electron micrographs of a colloidal probe (borosilicate glass bead) glued to a tipless cantilever before cleaning (left) and after cleaning (right).
androbe
oad-rateal-
thantion
ithsur-c-
i--
tacttherface
te ahas
tro-–
t theam-d inhe
harpofl as
Ms,o-
ero-in
harporedelre.listi-ndin
ene-ityer-hnessringef-
radius of curvature ofRa and smaller will flatten out:
(15)Ra �
√PE2
10800πY 3 .
It is also possible that asperities of a certain sizeshape may deform elastically to such a degree that a pestablishes its full contact area with a substrate during ling and fully recover elastically after the probe–substcontact is broken, if sufficient time for this recovery islowed. This will happen if elastic deformation (δ) is com-parable to the height of asperity (h); δ � h. This means thaonly asperities with a radius of curvature much larger tthe height of the asperity can experience such deformaIf this possibility is analyzed in view of the JKR model[10],we conclude that
(16)h � a2
Ra
− 2
3
√6πaWA
K,
where
(17)
a = 3
√Ra
K
[P + 3πRaWA +
√6πRaWAP + (3πRaWA)2
].
Consider, for example, a polymeric probe interacting wa rigid material. Assuming that asperities on the probeface have radii ofRa = 100 nm, and the system is charaterized by the following parameters:K = 65 GPa,WA =120 mJ/m2, and P = 10 µN, we calculate that asperties with the height ofh � 6.2 nm can be completely deformed elastically to allow for the probe–substrate conarea that is predicted by the JKR model. Alternatively,load needed to produce a desired deformation of the sutopographic irregularities could be estimated by Eq.(16) ifthe dimensions of irregularities (Ra andh) are determinedwith the AFM or another technique.
5.3.2. HeterogeneityUsing contact mechanics models we can also estima
maximum size of an impurity/surface heterogeneity that
.
a negligible effect on the measured pull-off force. In mosof the systems this will occur if the impurity and/or hetegeneity has a dimension (d) smaller than 10% of the probesubstrate contact area at zero load conditions, (πd2)/4 <
(0.1πa20), and therefored < 0.63a0, wherea0 is the probe–
substrate contact radius at zero load. Assuming also thasystem meets the terms of the DMT model, the size (dieter) of the heterogeneity/impurity that can be acceptethe pull-off force measurements can be estimated from tfollowing equation:
(18)d < 0.633
√2πR2WA
K.
For example, forR = 50 nm,WA = 100 mJ/m2, K =63 GPa (which are characteristic values determined for stips coated with a gold film and modified with SAMsthiols [45]), the heterogeneity with a diameter as smal1.8 nm will influence the measured pull-off force. Thismeans that a few molecular defects in the structure of SAwhich are common for thiol monolayers aligned into dmains on gold surfaces[46], most likely affect the magnitudand variation of measured pull-off forces, and one (repducible) pull-off force value is almost impossible to obtaexperimentally for such systems. Replacement of the sprobe with a 10-µm-diameter colloidal probe, which mlikely will operate in the regime described by the JKR mo(therefore, factor 2 must be replaced with 6 under the squaroot in Eq. (18)), will increase this limit to about 90 nmThe heterogeneity size of less than 90 nm is more reacally avoidable in routine pull-off force measurements athe use of larger probes seems to be more appropriateγ
determination, from the prospective of surface heterogity. Problem is that colloidal probes of perfect sphericwith smooth surfaces are difficult to manufacture. Nevtheless, as discussed in the previous section, nanorougof soft probes (and substrates) can be flattened out dupull-off force measurements reducing or eliminating the

J. Drelich et al. / Journal of Colloid and Interface Science 280 (2004) 484–497 495
sam
dita-andapethencethe
ir-ive-
ct tatf paf theade
ughperi-eathe
sur-n thbe–thetwo
cogibu-the-offausilar
n.ncespe
stratn-stembe–nd/odntaccs o
as-ail-ed in
be-tratehisyh-ere
ste
s
umom-
gh-con-
r
ma-
oftact
age)he-
rytheir
aly-
fect of roughness on probe–substrate contact area. The“trick,” however, cannot be imposed on hard materials.
6. Can solid surface tension be determined for roughsurfaces?
The factor that complicates interpretation of the measureAFM pull-off forces the most is surface roughness. Quanttive calculations of the adhesion force between a particlerough surface are difficult for many reasons. The size, shhomogeneity, mechanical properties and distribution ofasperities (deviations from an ideal planar surface) influethe actual area of contact, and therefore directly affectpull-off force [39,45,47]. The particle can also have anregular geometry leading to more difficulties in quantitatanalysis of pull-off force data[39] but this case is not discussed here.
Surface roughness causes the actual area of contavary significantly from the ideal spherical particle on flsurface contact. Roughness can increase the adhesion oticles to a surface or decrease it depending on the scale oroughness, location on the surface where contact is mand the size and geometry of the particle.
The actual area of contact between a particle and rosurface depends on the size and distribution of the asties on the surface[39,45]. The probe–substrate contact aroften increases for probes whose size is smaller thandistance between asperities of a microscopically roughface. However, the increased area of adhesion betweeprobe and rough surface can also result from multiple prosubstrate contacts, if the probe only partially penetratesspace between asperities and interacts with the walls ofor more asperities[45]. Multi-modal distribution of pull-offforces can be recorded for such systems. It should be renized however, that the appearance of multi-modal distrtion of pull-off forces does not necessarily indicate thatmultiple contact points are experienced during the pullforce measurements. Surface heterogeneity is another cfor generation of similar graphs and therefore results simto those presented in[45] should be interpreted with cautio
When the size of the probe is larger than the distabetween asperities, the probe cannot penetrate the interaity space and the contact area between probe and subis reduced. As a result, the pull-off forces are weaker thaexpected for the sphere–flatgeometry. Two different scenarios are possible in such a sphere–rough surface syFirst, as discussed earlier, if the loads applied during prosubstrate contact are increased to high values, elastic aplastic deformation of asperities can be induced. For applieloads that are properly managed, the probe–substrate coarea corresponds to that predicted by contact mechanisphere–flat geometry system.
In many systems, however, sufficient deformation ofperities cannot be initiated due to the low stiffness of avable/used cantilevers and high hardness of materials us
e
,
o
r-
,
e
-
e
r-e
.
r
tf
experiments. For these systems, the work of adhesiontween the probe and a submicroscopically rough subscan still be estimated from the measured pull-off forces. Tis possible with the theoretical model recently introduced bRabinovich et al.[48]. Assumptions and details of the matematics of the Rabinovich model will not be repeated hand only final equation is presented:
(19)WA =(
F
R− B
)58R rms2
cπλ22
,
where
(20)B = A
6z20
1
(1+ 58R rms1/λ21)(1+ 1.82 rms2/z0)2
,
(21)rms=√
32∫ r
0 y2r1 dr1
λ2 kp;
c is constant equal toc = 1.5 if JKR contact mechanicapply andc = 2 if DMT contact mechanics apply (nothat in original paper by Rabinovich et al.[48] c = 1.5);λ is the peak-to-peak distance between asperities (λ = 4r);kp is the surface packing density for close-packed sphere(kp = 0.907);A is the Hamaker constant;z0 is the distanceof closest approach between the two surfaces;r andR arethe radius of the asperity and particle, respectively;k1 isa coefficient relating the rms roughness and the maximpeak height, which is equal to 1.817 for the assumed geetry. The model geometry is shown inFig. 7.
In this model, surfaces which exhibit two scales of rouness, both smaller than the size of spherical probe, aresidered (Fig. 7). The first type of roughness, called rms1, isassociated with a longer peak-to-peak distance,λ1. A secondsmaller roughness, called rms2, is associated with a smallepeak-to-peak distance,λ2.
Because for many systemsF/R � B, Eq. (19) can bereduced to
(22)WA = 58F rms2cπλ2
2
.
Again, if both probe and substrate are made of the sameterial,
(23)γS = 29F rms2cπλ2
2
.
To test the Rabinovich model we analyze the resultspull-off forces measured for silanized glass probes in conwith rough polypropylene substrates and reported in[39].Table 4 lists substrate characteristics, measured (averpull-off forces, and calculated values of the work of adsion. The work of adhesion was calculated using Eq.(4)assumingc = 1.6. Three polypropylene substrates of verandom roughness, regarding the size of asperities anddistribution, which as reported earlier[39] did not fit to theRabinovich model, are not included in the presented ansis.

496 J. Drelich et al. / Journal of Colloid and Interface Science 280 (2004) 484–497
-
f
Fig. 7. Rabinovich’s model geometry for surfaces having two different scales of roughness.
Table 4Surface roughness of polypropylene samples, average pull-off forces between polypropylene and silanized glass probe[39], and calculated polypropylenesilanized glass work of adhesion
Sample Surface roughness characteristics Pull-offforce [nN]
Work of adhesion [mJ/m2]
rms1 [nm] λ1 [µm] rms2[nm] λ2 [nm] Exp. Theor.
1 25 3.7 6.5 366 76 422 42 4.5 15.6 598 136 683 386 5.8 39.6 964 100 49 48–54a
4 194 7.5 32.6 685 41 335 31 3.1 13.6 548 74 386 37 3.9 16.0 345 63 98
Average: 55 (49)b ∼50
a Estimated usingWA ≈ 2(γ1γ2)1/2, whereγ1 = 25.7 mJ/m2 is the surface tension of polypropylene[3], andγ2 = 22–28 mJ/m2 is the surface tension osilanized glass (own data).
b In parentheses: average value calculated for four samples, without result for samples 4 and 6.
ofalcuret-ting
ea-ll-offval-
-lastibil-
heis
andrateortedectscan
tic-of
rsely,e the
de-canuldam-s ofials,inatentacthan-
-using–flatftenntalureJKReduseddale
As shown inTable 4, an average value of the workadhesion between polypropylene and silanized glass, clated from the Rabinovich model, relates well to the theoical value estimated from the surface tensions of interacsurfaces.
7. Concluding remarks
The atomic force microscopy is commonly used in msurements of particle–substrate adhesion through puforce measurements, and the measured pull-off forceues are used to determine the work of adhesion (WA) and/orsolid’s surface tension/surface energy (γ ). However, the experimental results presented in the literature over theseveral years indicate inconsistency and poor reproducity of pull-off forces measured with the AFM technique. Tscatter and irreproducibility of the experimental resultsmainly caused by variation in solid surface roughnessheterogeneity characteristics (that of probe and substand these characteristics should be analyzed and repAs demonstrated in this paper, imperfections and defof the interacting surfaces as small as a few angstromssubstantially influence the measured pull-off force, parularly for small probes made of rigid material. The use
-
).
larger probes reduces the detrimental effects of moleculaheterogeneity on the measured pull-off force, but converincreases the danger that surface roughness will reducprobe–substrate contact area.
Varying loading conditions imposed on a probe by theflected cantilever during the pull-off force measurementsbe another source of pull-off force variation. Loads shobe managed properly to avoid plastic deformation or dages to rigid probes. On the other hand, deformationthe nanoscaled surface irregularities of compliant matermanaged by increased loads, can reduce or even elimthe effects of nanoroughness on the probe–substrate coarea, promoting conditions described by the contact mecics models for the sphere–flat system.
Determination ofWA andγ from pull-off force measurements has been practiced over the last several yearscontact mechanics theoretical models derived for spheresystems. Unfortunately, the theoretical models were oselected without careful analysis of both the experimesystem and theoretical model. A majority of the literatsolid’s surface tension results was obtained using eitheror DMT models, although our re-analysis of the publishexperimental data indicates that these models were misand very often should be replaced with the Maugis–Dug(MD) model. As a result, many publishedWA andγ data

J. Drelich et al. / Journal of Colloid and Interface Science 280 (2004) 484–497 497
hatn-
b-ics iedf in-fm oacin
peri-od-sed
is
rchy
m-
a-
ork,
rk,
:4.ker,
In-
3.4
3
r,
i-9,
,
ce
,
57–
0.
.7
ys.
03)
New
air5.rk,
uc-
7)
02)
ch-
01
ace
Berg,
27
454.
giling,
8
.G.J.
-
l-
should be regarded with caution. It is also important tfurther research on pull-off force measurements be contiued but under more restricted experimental conditions.
The analysis of pull-off forces measured for rigid sustrates and probes having nanoroughness characteristterms ofWA andγ still seems possible if probes selectare much larger than the size of roughness features oteracting surfaces. In order tosucceed with interpretation osuch complex systems, a detailed surface analysis in terroughness parameters, asperity size and shape, and spbetween asperities is required. Then, analysis of the exmental data should be done with one of the theoretical mels, which is suitable for rough surfaces; the model propoby Rabinovich et al.[48] is the most promising one at thtime.
Acknowledgment
Financial support provided by the Petroleum ReseaFund and administrated by the American Chemical Societis gratefully acknowledged.
References
[1] A.I. Rusanov, V.A. Prokhorov, Interfacial Tensiometry, Elsevier, Asterdam, 1996.
[2] H.-J. Butt, R. Raiteri, in: A.J. Milling (Ed.), Surface Characteriztion Methods: Principles, Techniques, and Applications, Dekker, NewYork, 1999, pp. 1–36.
[3] C.J. Van Oss, Interfacial Forces in Aqueous Media, Dekker, New Y1994.
[4] B. Cappella, G. Dietler,Surf. Sci. Rep. 34 (1999) 1–104.[5] D. Sarid, Scanning Force Microscopy, Oxford Univ. Press, New Yo
1991.[6] R. Wiesendanger, Scanning ProbeMicroscopy and Spectroscopy
Methods and Applications, Cambridge Univ. Press, Cambridge, 199[7] J.E. Sader, in: Encyclopedia of Surface and Colloid Science, Dek
2002, pp. 846–856.[8] J.P. Cleveland, S. Manne, D. Bocek, P.K. Hansma, Rev. Sci.
strum. 64 (1993) 403–405.[9] J.L. Hutler, J. Bechhoefer, Rev. Sci. Instrum. 64 (1993) 1868–187
[10] K.L. Johnson, K. Kendall, A.D.Roberts, Proc. R. Soc. London A 32(1971) 301–313.
[11] B.V. Derjaguin, V.M. Muller, Y.P.Toporov, J. Colloid Interface Sci. 5(1975) 314–326.
[12] D. Maugis, Contact, Adhesion and Rupture of Elastic Solids, SpringeBerlin, 2000.
[13] N.A. Burnham, A.J. Kulik, in: B. Bhushan (Ed.), Handbook of Mcro/Nano Tribology, second ed., CRC Press, Boca Raton, 199pp. 247–271.
[14] O. Marti, in: B. Bhushan (Ed.), Modern Tribology Handbook, vol. ICRC Press, Boca Raton, 2001, pp. 617–639.
n
fg
[15] U.D. Schwarz, J. Colloid Interface Sci. 261 (2003) 99–106.[16] D. Maugis, J. Colloid Interface Sci. 150 (1992) 243–269.[17] H. Hertz, Miscellaneous Papers, Macmillan, London, 1896.[18] R.W. Carpick, D.F. Ogletree, M. Salmeron, J. Colloid Interfa
Sci. 211 (1999) 395–400.[19] A. Noy, C.D. Friesbie, L.F. Rozsnyai, M.S. Wrighton, C.M. Lieber
J. Am. Chem. Soc. 117 (1995) 7943–7951.[20] E.W. Van der Vegte, G. Hadziioannou, Langmuir 13 (1997) 43
4366.[21] V.V. Tsukruk, V.N. Bliznyuk, Langmuir 14 (1998) 446–455.[22] S.C. Clear, P.F. Nealy, J. Colloid Interface Sci. 213 (1999) 238–25[23] A. El Ghzaoui, J. Appl. Phys. 85 (1999) 1231–1233.[24] H. Skulason, C.D. Friesbie, Langmuir 16 (2000) 6294–6297.[25] C. Jacquot, J. Takadoum, J. Adhes. Sci. Technol. 14 (2001) 681–687[26] F.L. Leite, A. Riul Jr., P.S.P. Herrmann, J. Adhes. Sci. Technol. 1
(2003) 2141–2156.[27] N.A. Burnham, D.D. Dominguez, R.L. Mowery, R.J. Colton, Ph
Rev. Lett. 64 (1990) 1931–1934.[28] S. Biggs, G. Spinks, J. Adhes. Sci. Technol. 12 (1998) 461–478.[29] J. Nalaskowski, J. Drelich, J. Hupka, J.D. Miller, Langmuir 19 (20
5311–5317.[30] Web site:http://www.webelements.com.[31] J.R. Fried, Polymer Science and Technology, Prentice–Hall PTR,
Jersey, 1995.[32] H. Matsuoka, T. Kato, Adhesion forces between mica surfaces in
and liquids, in: International Tribology Conference, Yokohama, 199[33] M. Barsoum, Fundamentals of Ceramics, McGraw–Hill, New Yo
1997.[34] W.D. Callister Jr., Materials Science and Engineering. An Introd
tion, fourth ed., Wiley, New York, 1997.[35] A. Noy, D.V. Vezenov, C.M. Lieber, Ann. Rev. Mater. Sci. 27 (199
381–421.[36] E. Beach, G. Tormoen, J. Drelich, J. Adhes. Sci. Technol. 16 (20
845–868.[37] J. Nalaskowski, J. Drelich, J. Hupka, J.D. Miller, J. Adhes. Sci. Te
nol. 13 (1999) 1–17.[38] J. Drelich, J. Nalaskowski, J.D. Miller, J. Colloid Interface Sci. 2
(1998) 253–256.[39] E.R. Beach, G.W. Tormoen, J. Drelich, R. Han, J. Colloid Interf
Sci. 247 (2002) 84–99.[40] L.H.G.J. Segeren, B. Siebum, F.G. Karssenberg, J.W.A. van den
G.J. Vancso, J. Adhes. Sci. Technol. 16 (2002) 793–828.[41] R. Chi, Z. Xu, T. DiFeo, J.A. Finch, J.L. Yordan, J. Pulp Paper
(2001) 152–159.[42] J.S. Villarubia, J. Res. Natl. Inst. Stand. Technol. 102 (1997) 425–[43] D. Maugis, H.M. Pollock, Acta Metall. 9 (1984) 1323–1334.[44] E.R. Beach, J. Drelich, in: J.J. Kellar, M.A. Herpfer, B.M. Moud
(Eds.), Functional Fillers and Nanoscale Minerals, Society for MinMetallurgy, and Exploration, Littleton, CO, 2003, pp. 177–193.
[45] G.W. Tormoen, J. Drelich, E.R. Beach, J. Adhes. Sci. Technol.(2004) 1–18.
[46] C. Schonenberger, J. Jorritsma, J.A.M. Sondag-Huethorst, LFokkink, J. Phys. Chem. 99 (1995) 3259–3271.
[47] L. Sirghi, N. Hakagiri, K. Sugisaki, H. Sugimura, O. Takai, Langmuir 16 (2000) 7796–7800.
[48] Y.I. Rabinovich, J.J. Adler, A. Ata, R.K. Singh, B.M. Moudgil, J. Coloid Interface Sci. 232 (2000) 17–24.