Embed Size (px)
Citation preview

This article is also available online at:
www.elsevier.com/locate/mineng
Minerals Engineering 17 (2004) 1135–1142
Determination of lifter design, speed and filling effects in AG millsby 3D DEM
N. Djordjevic *, F.N. Shi, R. Morrison
Julius Kruttschnitt Mineral Research Centre, The University of Queensland, Brisbane 4068, Australia
Received 28 April 2004; accepted 1 June 2004
Abstract
The power required to operate large gyratory mills often exceeds 10MW. Hence, optimisation of the power consumption will
have a significant impact on the overall economic performance and environmental impact of the mineral processing plant. In most
of the published models of tumbling mills (e.g. [Morrell, S., 1996. Power draw of wet tumbling mills and its relationship to charge
dynamics, Part 2: An empirical approach to modelling of mill power draw. Trans. Inst. Mining Metall. (Section C: Mineral Process-
ing Ext. Metall.) 105, C54–C62. Austin, L.G., 1990. A mill power equation for SAG mills. Miner. Metall. Process. 57–62]), the effect
of lifter design and its interaction with mill speed and filling are not incorporated. Recent experience suggests that there is an oppor-
tunity for improving grinding efficiency by choosing the appropriate combination of these variables. However, it is difficult to exper-
imentally determine the interactions of these variables in a full scale mill. Although some work has recently been published using
DEM simulations, it was basically limited to 2D.
The discrete element code, Particle Flow Code 3D (PFC3D), has been used in this work to model the effects of lifter height (5–
25cm) and mill speed (50–90% of critical) on the power draw and frequency distribution of specific energy (J/kg) of normal impacts
in a 5m diameter autogenous (AG) mill.
It was found that the distribution of the impact energy is affected by the number of lifters, lifter height, mill speed and mill filling.
Interactions of lifter design, mill speed and mill filling are demonstrated through three dimensional distinct element methods (3D
DEM) modelling. The intensity of the induced stresses (shear and normal) on lifters, and hence the lifter wear, is also simulated.
� 2004 Elsevier Ltd. All rights reserved.
Keywords: Comminution; Grinding; Modelling; DEM
1. Introduction
The power required to operate large mills often ex-ceeds 10MW. Therefore, optimisation of the power uti-
lisation will have a significant impact on the overall
economic performance and environmental impact of
the mineral processing plant. Recent experience suggests
that there is an opportunity for improving grinding effi-
0892-6875/$ - see front matter � 2004 Elsevier Ltd. All rights reserved.
doi:10.1016/j.mineng.2004.06.033
* Corresponding author. Present address: JKMRC, Isles Road,
Indooroopilly 4096, Australia. Tel.: +61 7 3365 5888; fax: +61 7 3365
5999.
E-mail address: [email protected] (N. Djordjevic).
ciency by choosing the appropriate combination of mill
speed, filling and lifter design. However, it is difficult to
experimentally determine the interactions of these varia-bles in a full scale mill.
The discrete element method (DEM) has been proved
to be a useful tool in milling simulation and optimisa-
tion. A number of papers have been published in the lit-
erature by using DEM in modelling and simulation of
comminution devices, majority of them being limited
in 2D. Hlungwani et al. (2003) used a 2D laboratory ball
mill to validate the DEM modelling of liner profile andmill speed effects. Cleary (1998, 2001) used DEM to
investigate charge behaviour and power consumption

1136 N. Djordjevic et al. / Minerals Engineering 17 (2004) 1135–1142
in relation to operating conditions, liner geometry and
charge composition in a 5m ball mill, also limited to
the 2D code.
In the present work, Particle Flow Code 3D (PFC3D)
has been used to model the effects of lifter height (5–
25cm) and mill speed (50–90% of critical) on the powerdraw and frequency distribution of specific energy (J/kg)
of normal impacts in a 5m diameter autogenous grind-
ing (AG) mill, with a mill charge volume varying be-
tween 7% and 20%. The trends established from the
DEM study will be incorporated in developing a new
tumbling mill model at the Julius Kruttschnitt Mineral
Research Centre (JKMRC).
Fig. 1. Charge shape for the mill without lifters, with coefficient of
friction nil.
2. Discrete element modelling
Particle Flow Code 3D (ITASCA Inc., 1999) models
the behaviour of particles, which may be enclosed within
a finite volume by non-deformable walls. The code keeps
a record of individual particles and updates any contact
with other particles or walls. Each calculation step in-cludes application of the Newton�s laws of motion to
all particles, a force–displacement law to each contact,
and constant updating of the walls positions.
PFC3D modelling is based on the assumption that
the individual particles (balls) can be treated as rigid
bodies. At contacts, rigid particles are allowed to over-
lap. The magnitude of the overlap is related to the con-
tact force. There overlaps are small relative to the size ofthe particles.
During contact, the behaviour of a material is simu-
lated using a linear contact model. The contact force
vector between two balls or ball and wall is composed
of normal and shear components. The normal contact
force vector is calculated using the formula:
F n ¼ Kn � Un � ni
where Fn is the normal contact force vector; Kn is normal
stiffness at the contact; Un is the relative contact dis-
placement in the normal direction and ni is unit normal
vector.
The incremental shear force is calculated using the
formula:
DF s ¼ �Ks � DU s
where Ks is the shear stiffness at contact and DUs is theincremental shear displacement at contact.
PFC3D also includes a slip model. The slip model is
defined by the friction coefficient at the contact, where
the active relevant friction coefficient is taken to be the
minimum friction coefficient of the two contacting enti-ties. Each contact is checked for slip conditions, by cal-
culating the maximum allowable shear contact force:
F sðmaxÞ ¼ l � jF nj
where l is the friction coefficient.
The energy state of the entire set of particles can be
examined by recording various forms of energy. Fric-
tional work is defined as the total cumulative energy dis-
sipated by frictional sliding at all contacts. Intensity of
deformation can be assessed using strain energy, which
is defined as the total strain energy stored at all contactsassuming a linear contact-stiffness model.
The PFC3D model of the mill is composed of a num-
ber of walls which represent mill liner and lifters as well
as balls which represents mill charge. The power of the
mill is calculated for each instant of time by summing
products of moments applied to the liner and lifters
and rotational velocity of the mill. Power calculated
with DEM refers to the net power associated with millcharge. Power required to rotate the empty mill (no-load
power) cannot be modelled using PFC3D. The no-load
power is determined by the efficiency of particular mill
design, mill size and its rotational velocity. No-load
power is about 5–10% of the gross power draw under
typical working conditions (Morrell, 1996).
3. Effect of number of lifters on power utilization
Previous work (Djordjevic, 2003) demonstrated that
from the point of view of power draw modelling, a cylin-
drical tumbling mill could be represented with a vertical
slice, where thickness of the slice was 20% of the mill
length. In the absence of fluid flow in the mill, transla-
tional displacements of the charge along the length ofthe mill are minimal. The net-power draw of 1m thick
slice of 5m diameter mill is modelled in this work. The
charge of the modelled mill (Figs. 1 and 2), is composed
of spherical particles in the range 20–150mm diameter
(Table 1). Net power draw was modelled for the case
of mill with 30 identical rectangular shaped lifters. The
lifter thickness was fixed at 10cm in all cases. Height
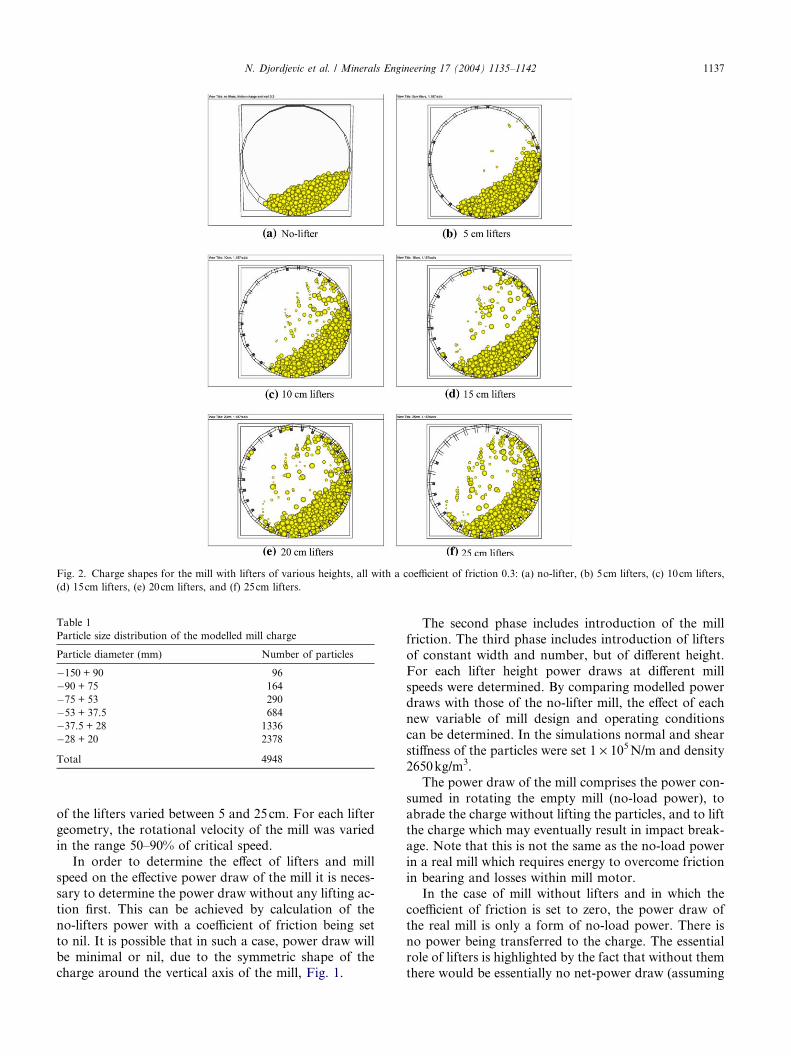
Fig. 2. Charge shapes for the mill with lifters of various heights, all with a coefficient of friction 0.3: (a) no-lifter, (b) 5cm lifters, (c) 10cm lifters,
(d) 15cm lifters, (e) 20cm lifters, and (f) 25cm lifters.
Table 1
Particle size distribution of the modelled mill charge
Particle diameter (mm) Number of particles
�150 + 90 96
�90 + 75 164
�75 + 53 290
�53 + 37.5 684
�37.5 + 28 1336
�28 + 20 2378
Total 4948
N. Djordjevic et al. / Minerals Engineering 17 (2004) 1135–1142 1137
of the lifters varied between 5 and 25cm. For each liftergeometry, the rotational velocity of the mill was varied
in the range 50–90% of critical speed.
In order to determine the effect of lifters and mill
speed on the effective power draw of the mill it is neces-
sary to determine the power draw without any lifting ac-
tion first. This can be achieved by calculation of the
no-lifters power with a coefficient of friction being set
to nil. It is possible that in such a case, power draw willbe minimal or nil, due to the symmetric shape of the
charge around the vertical axis of the mill, Fig. 1.
The second phase includes introduction of the mill
friction. The third phase includes introduction of lifters
of constant width and number, but of different height.
For each lifter height power draws at different mill
speeds were determined. By comparing modelled powerdraws with those of the no-lifter mill, the effect of each
new variable of mill design and operating conditions
can be determined. In the simulations normal and shear
stiffness of the particles were set 1 · 105N/m and density
2650kg/m3.
The power draw of the mill comprises the power con-
sumed in rotating the empty mill (no-load power), to
abrade the charge without lifting the particles, and to liftthe charge which may eventually result in impact break-
age. Note that this is not the same as the no-load power
in a real mill which requires energy to overcome friction
in bearing and losses within mill motor.
In the case of mill without lifters and in which the
coefficient of friction is set to zero, the power draw of
the real mill is only a form of no-load power. There is
no power being transferred to the charge. The essentialrole of lifters is highlighted by the fact that without them
there would be essentially no net-power draw (assuming

Fig. 3. Effect of mill filling on net power utilization.
1138 N. Djordjevic et al. / Minerals Engineering 17 (2004) 1135–1142
nil friction), and consequently no comminution. In such
case only this ‘‘no-load’’ power will be drawn and it will
be completely wasted. As a result, the throughput of the
machine will be nil.
In the case of a mill which has some finite effective
coefficient of friction (0.3) and charge which is also char-acterised with same coefficient of friction, net power
draw has a value of 49kW per unit of length of the mod-
elled mill. The entire power is consumed through abra-
sion of the charge and leads to gradual size reduction.
Net-power consumed by the mill without lifters is re-
ferred as no-lifter power. When the same mill is
equipped with lifters, the mill will draw additional
power for impact breakage and more intensive abrasion.The introduction of 5cm high lifters increases net power
draw to 77kW per unit length of the modelled mill.
Hence, an additional 28kW power is consumed for pro-
ducing high energy impacts.
This indicates that abrasive action in the form of low
energy impacts and shearing between particles and balls
within the charge is the prevailing mechanism of power
consumption within the mill. The increased power isconsumed in introduction of impacts due to free falling
particles as well as faster movement of the particles on
top of charge and within the charge. Lifters are able to
more efficiently transfer motion from the mill shell into
the motion of the charge. However dominant part of the
introduced net energy into the charge (63%) is consumed
through low energy shearing between particles, or be-
tween particles and mill liners.
4. Effect of mill filling on power utilization
The fraction of net-power draw that will be con-
sumed by shearing and abrasion is determined by the
charge volume. In the case of mill with 500 particles
(7vol%), no-lifter power is about 52% of the net powerdraw with lifters. In the case of mill with 1500 particles
(20vol%) no-lifter power represents 70.5% of total net
power of the mill equipped with 5cm high lifters (Fig.
3). Hence as the charge volume increases, the greater
fraction of the net power draw will be consumed in
the form of charge abrasion and low energy impacts,
while the fraction of the net power that leads to high en-
ergy impacts will gradually decrease.Fig. 3 also shows that as the lifter height increases, a
greater fraction of the power will be used without high
intensity impacts. An increase in lifter height results in
a reduced net power draw, which leads to an increased
ratio of no-lifter net power to net power.
In a current JKMRC SAG mill modelling approach,
the relationship of size reduction and high intensity im-
pact energy is experimentally determined with a dropweight test (Napier-Munn et al., 1996), and that of size
reduction with the low intensity abrasion energy is
measured through tumbling test. A key feature of the
JKMRC AG/SAG model is that ratio of impact to abra-
sion breakage varies with size distribution in the mill
load. Abrasion breakage dominates for coarse particles
and impact breakage is the main mechanism for fine
particles. However, the same relationship is used regard-less of the mill filling and lifter design. While this
assumption is adequate for industrial mills which oper-
ate at load close to maximum load, this modelling ap-
proach is not appropriate in terms of the trends
demonstrated in Fig. 3 for mills with wide range of mill
loads.
Particle motion within the mill is different with differ-
ent mill filling levels. In the extreme case of single parti-cle, motion is essentially highly reproducible, and
characterised by a period when particle is in touch with
liner, the period of free fall and period of bouncing at
the base of mill, Fig. 4. In the case of a particle within
the mill charge, the dominant part of particle motion oc-
curs within the main body of the charge, eventually fol-
lowed by the lifting of the particle, free fall and high
intensity impact. While particle is within the charge itbecomes subjected to numerous low-intensity force
applications which should result in a gradual size reduc-
tion due to abrasion.
5. Influence of lifter number, height and mill speed on net
power draw
The effect of the number of lifters on net power draw
is clearly illustrated in Fig. 5. Power draw increases from
a non-zero value to a stable value. After certain number
of lifters a further increase in the number of lifters will
not increase net power draw of the mill. This perhaps ex-
plains why the number of lifters is not included as a
parameter in the empirical models of power draw. In
practice all mills have more than the necessary number

0
10
20
30
40
50
60
70
80
2 4 6 10 14 18 22
net p
ower
dra
w(k
W)
number of lifters
Fig. 5. Effect of number of lifters on the net power draw (lifter height
20cm, width 10cm).
Fig. 4. Pattern of particle motion for the case of mill with singular particle (left) and for the case of mill with 1000 particles (right).
0
20
40
60
80
5cm 10cm 15cm 20cm 25cmnet p
ower
dra
w (k
W)
net p
ower
dra
w (k
W)
0
20
40
60
80
5cm 10cm 15cm 20cm 25cmlifter height (cm)
lifter height (a) (
(c) (
Fig. 6. The effects of lifter height on net power draw for various mill speeds (5
70% critical speed, and (d) 60% critical speed.
N. Djordjevic et al. / Minerals Engineering 17 (2004) 1135–1142 1139
of lifters required for onset of steady state power draw.
However, investigation in the angle of the loading edge
of the lifter is not conducted in this study.
Influence of lifter height on net power draw is pre-
sented in Fig. 6. The sensitivity of the power draw to
the lifter height is much higher than what might be ex-
pected due to change of effective diameter of the mill.
The mill with low lifters tends to draw higher powerthan the mill with higher lifters. Similar trends have been
reported in literature (Cleary, 2001; Hlungwani et al.,
2003). Higher lifters will result in more frequent impact
events while consuming less power.
Fig. 6 demonstrates that the influence of lifter height
on net power draw increases as the mill rotational velo-
city increases. This is due to the fact that propensity for
net p
ower
dra
w (k
W)
net p
ower
dra
w (k
W)
0
20
40
60
80
5cm 10cm 15cm 20cm 25cm
0
20
40
60
80
5cm 10cm 15cm 20cm 25cmlifter height (cm)
lifter height (cm)b)
d)
m mill with 30 lifters). (a) 90% critical speed, (b) 80% critical speed, (c)

0.5 1.0 1.5 2.0 2.5 3.0
0.
0.0
0.2
0.4
0.6
0.8
1.0
1.2
1.4
1.6
1.8
2.0
2.2
2.4
2.6
2.8
3.0
0.0
0.2
0.4
0.6
0.8
1.0
1.2
1.4
1.6
1.8
2.0
2.2
2.4
2.6
2.8
3.0
time (sec) x10^1 0.5 1.0 1.5 2.0 2.5 3.0
time (sec) x10^1
force (N) x10^3resultant force (N) x10^3
Fig. 7. Resultant force time history for the case of 5cm high lifters (left) and 15cm high lifters.
020406080
100120
80 100 150 200 240 300
particle diameter (mm)
net-p
ower
dra
w (k
W)
020406080
100120
80 100 150 200 240 300
particle diameter (mm)
net-p
ower
dra
w (k
W)
(a) (b)
Fig. 8. Effect of the particle size on the net power draw of the mill. (a) Constant lifter height 30cm and (b) lifter height = 80% particle diameter.
1140 N. Djordjevic et al. / Minerals Engineering 17 (2004) 1135–1142
centrifuge will increase with the increases of lifter height
and mill speed. Rotational velocity of the modelled mill
is calculated based on the dimension of mill shell, ignor-
ing height of the lifters. As the probability of centrifuge
is minimal for a slower velocity, the effect of lifter heighton power draw is insignificant. However, as the modern
mills often operate at about 75% of critical speed or
higher, the influence of the lifter height on power draw
is significant.
Influence of the lifter height can also be observed
through the intensity of forces that are acting on typ-
ical particles within the mill. In the case of low lifters
(e.g. 5cm), the average forces that are acting on a par-ticle are much smaller than that with higher lifters
(e.g. 15cm). In addition to that, in the case of higher
lifters there is a much higher probability that particles
will be lifted, resulting in their free fall and high inten-
sity impacts. This is illustrated in Fig. 7, showing the
time history of the resultant force acting on a single
particle of 10cm diameter (within the charge) for the
mill equipped with 5 and 15cm high liftersrespectively.
In all discussions about the power draw of the mills it
is important to consider the nature of the charge size dis-
tribution. The impact of particle size on the net power
draw is clearly highlighted in Fig. 8. The mill charge is
composed of mono size particles. Fig. 8a shows that
there is a large increase in power draw when particles be-
come much smaller than the lifter height (30cm). How-
ever, when the ratio of the lifter height to particle
diameter is kept constant (i.e. height = 80% of the dia-
meter), the impact of particle diameter on the power
draw becomes insignificant, as shown in Fig. 8b.
6. Intensity of stresses acting on lifters
The lifter wear is directly proportional to the intensity
of the induced stresses acting on the lifters. Stresses ap-
plied to the lifters were calculated from the moments
acting on the lifter plates. From the moments and the
known distance between lifters plate and centre of rota-
tion, the average force was calculated. The average value
of stress was then calculated from the average force and
the area of the lifter.The stresses on the lifter were modelled for the case of
vertical plate with the active side facing the charge, and
for a plate corresponding to the flat top of the lifter.
Considering that stresses are averaged over the entire
surface of the lifter, the most significant factor is the
mass of the particles. The force that opposes the motion
of the vertical side of the lifter will predominantly act
perpendicular to the plate. On the top of the lifter, theactive force is a shear component of the predominantly
vertical force induced by the mass of superimposed par-
ticles and the centrifugal force.

Fig. 10. Impacts energy distribution.
Fig. 9. Influence of number of lifters on the stress intensity applied on
lifters.
N. Djordjevic et al. / Minerals Engineering 17 (2004) 1135–1142 1141
Hence, stresses acting on the vertical side of the rec-
tangular shaped lifter will be mostly in a perpendicu-
lar–normal direction, while stresses acting on the top
of lifter will be predominantly shear stresses. Shear stres-
ses will be responsible for the gradual wear of the lifters,
resulting in a decrease of their height and reduction of
milling efficiency. The modelled stresses show significant
variation in stress intensity during each lifter revolution.
Fig. 11. Intensity of normal stresses for the cases of 25-cm-
The interaction of forces with the lifters results in
variable induced stress, particularly the stresses that
act on top of the lifters. As a result, a large number
of balls will be superimposed which will result in higher
forces and stresses acting on the lifters. The stresses
acting perpendicular to the lifting side are higher inmagnitude than the shear stresses acting along the
top of the lifter. As the number of lifters increases,
both normal and shear stresses decrease, Fig. 9. This
finding is in agreement with in situ observations that
severity of lifter wear decreases with increase in the
number of lifters.
Increasing the numbers of lifters will also alter the im-
pact energy frequency spectrum of the mill. The numberof very low energy impacts (0.1J) for a mill with only
two lifters is the highest, as shown in Fig. 10. However,
starting from relatively modest impact energy (2J), the
number of impacts per second for the two lifters case
drops at a much higher rate than for the mills with 14
and 22 lifters.
The effect of the lifter height on the intensity of stres-
ses that are acting on the lifters was also investigated.The results show that an increase of lifter height results
in an increased intensity of stresses that are acting on the
lifter. Fig. 11 shows the normal stresses induced to the
lifters with 25 and 5cm height respectively. The higher
lifters will be exposed to the higher average stresses,
due to the higher pile of the particles that are lifted.
The higher stresses will cause higher initial wear rates.
As the lifter height decreases due to wear, rate of furtherheight reduction should slow down.
7. Conclusions
In summary, the following conclusions may be drawn
from the DEM simulations of the interactions of lifter
design, mill speed and charge filling on energy utilisation
in an AG mill:
• Increasing a number of lifters leads to increase the
proportion of high intensity impacts. A decrease thenumber of lifter leads to an increase the proportion
of low intensity abrasion.
height lifters (left) and 5-cm-height lifters respectively.

1142 N. Djordjevic et al. / Minerals Engineering 17 (2004) 1135–1142
• An increase the number of lifters leads to an
increase the net power draw, but only up to a stable
value.
• An increase mill filling leads to an increase the
proportion of energy used for the low energy abra-
sion breakage, but decreases high energy impactbreakage.
• As the rotational speed increases, the mill draws more
power with lower lifter height, but draws less power
with higher lifters.
• At constant lifter height, the mill draws more power
when grinding smaller particles. At constant ratio of
lifter height to particle size, the influence of particle
size on mill power is not significant.• Less number of lifters and greater lifter height result
in the greater stress intensity applied to the lifters,
causing faster lifters/liners wears. After a certain
number of lifters are reached, a further increase in
the number of lifters will not result in a significant
further reduction of stress intensity.
References
Cleary, P.W., 1998. Predicting charge motion, power draw, segrega-
tion, wear and particle breakage in ball mills using discrete element
methods. Miner. Eng. 11 (11), 1061–1080.
Cleary, P.W., 2001. Charge behaviour and power consumption in ball
mills: sensitivity to mill operating conditions, liner geometry and
charge composition. Int. J. Miner. Process. 63, 79–114.
Djordjevic, N., 2003. Discrete element modelling of power draw of
tumbling mills. Trans. Inst. Mining Metall. (Section C: Miner.
Process. Ext. Metall.) 112, C109–C114.
Hlungwani, O., Rikhotso, J., Dong, H., Moys, M.H., 2003. Further
validation of DEM modelling of milling: effects of liner profile and
mill speed. Miner. Eng. 16, 993–998.
Morrell, S., 1996. Power draw of wet tumbling mills and its
relationship to charge dynamics, Part 2: An empirical approach
to modelling of mill power draw. Trans. Inst. Mining Metall.
(Section C: Miner. Process. Ext. Metall.) 105, C54–C62.
Napier-Munn, T.J., Morrell, S., Morrison, R.D., Kojovic, T., 1996.
Mineral comminution circuits. Their operation and optimisation.
Julius Kruttschnitt Mineral Research Centre, Brisbane.
PFC3D Particle Flow Code in 3 Dimensions, 1999. Itasca Consulting
Group Inc., Minneapolis, Minnesota.