Embed Size (px)
Citation preview
Determination of Least Cost Phosphorus Abatement Practices in a
Watershed Under Stochastic Conditions
Arthur Stoecker, Davis S. Marumo, Stella Machooka, Sierra Howry,
Daniel Storm and Michael White
Arthur Stoecker, Department of Agricultural Economics, Oklahoma State University 312 Ag. Hall, Stillwater, OK 74078;Tel: 405-744-6165, Fax: 405-744-8210
E-mail: [email protected]
Davis S. Marumo, Department of Agricultural Economics, Oklahoma State University 555 Ag. Hall, Stillwater, OK 74078;Tel: 405-744-9969, Fax: 405-744-8210
E-mail: [email protected]
Stella Machooka, Department of Agricultural Economics, Oklahoma State University 557 Ag. Hall, Stillwater, OK 74078;Tel: 405-744-9799, Fax: 405-744-8210
E-mail: [email protected]
Sierra Howry, Department of Agricultural Economics, Oklahoma State University 316 Ag. Hall, Stillwater, OK 74078;Tel: 405-744-6172, Fax: 405-744-8210
E-mail:[email protected]
Daniel Storm, Department of Agricultural Economics, Oklahoma State University 121 Ag. Hall, Stillwater, OK 74078;Tel: 405-744-8422, Fax: 405-744-6059
E-mail: [email protected]
Mike White, Department of Agricultural Economics, Oklahoma State University 120 Ag. Hall, Stillwater, OK 74078;Tel: 405-744-5288, Fax: 405-744-8210
E-mail: [email protected]
Selected Paper Prepared for Presentation at the American Agricultural
Economics Association Annual Meeting, Portland, OR, July 29-August 1, 2007
Copyright 2007 by A. Stoecker, D. Marumo, S. Machooka, S. Howry,
D. Storm and M. White.
All rights reserved. Readers may make verbatim copies of this document
for non-commercial purposes by any means,
provided that this copyright notice appears on all such copies.

2
Determination of Least Cost Phosphorus Abatement Practices in a
Watershed Under Stochastic Conditions
Arthur Stoecker, Davis S. Marumo, Stella Machooka, Sierra Howry,
Daniel Storm and Michael White
The U.S. Environmental Protection Agency implements the Total Maximum Daily Load
(TMDL) program with the objective of attaining ambient water quality standards by
controlling both point and nonpoint sources of pollution. The TMDLs are being
implemented to prevent eutrophication of public water supplies by phosphorus runoff
from manure applications in many watersheds (USEPA 2003). This article determines
the least cost mix, location, and magnitude of management practices to meet maximum
average annual phosphorus loads entering watershed lakes within specified margins of
safety. Possible practices included pasture management, converting poultry litter to
energy, adding alum to poultry litter, and hauling litter from the Eucha-Spavinaw
watershed in Oklahoma. This watershed is of interest because there is very little cropland
in the watershed, most of the non-point pollution comes from fertilized pastures and
because eutrophication threatens a metropolitan water supply. The Geographical
Information System (GIS) - based Soil Water Assessment Tool (SWAT) was calibrated
and used to evaluate non-point source sediment and nutrient loading into Lakes under
alternative land management practices. SWAT simulations generated site-specific

3
production, sediment yield, nitrogen and phosphorus runoff coefficients that were used in
a Target MOTAD programming model to select a specific management practice for each
site in the watershed. The objective was to maximize net agricultural and electrical
returns from the watershed less litter transportation costs subject to maximum annual
nutrient loads with limits on average annual deviations above the limits.
Agricultural pollution attributed to excessive land application of poultry manure as
fertilizer is a serious environmental problem for surface water quality in the Eucha-
Spavinaw watershed situated on the border of the states of Oklahoma and Arkansas .
The Eucha-Spavinaw watershed is of interest because Lake Eucha and Spavinaw Lake
are currently on the Environmental Protection Agency (EPA) 303(d) Impaired Water List
due to low dissolved oxygen and excessive phosphorus from municipal point source
discharges, agriculture, and other unknown sources (ODEQ, 2004). The Oklahoma Water
Quality Standard specifies the designated beneficial uses of Lake Eucha and Spavinaw
Lake as including public and private water supply, aquatic community, agricultural
irrigation, recreation and aesthetics, and sensitive drinking water supply (OWRB 2004;
2006). There is rapid urban expansion in adjacent watershed, rapid expansion of poultry
production and very little cropland within the Eucha-Spavinaw watershed. The rate at
which poultry litter is currently being produced and land applied is most likely to exceed
the assimilative capacity of the limited cropland available in the watershed. Most of the
non-point nutrient pollution comes from poultry manure fertilized pastures (OWRB 2002;
Storm et al 2003).

4
Eutrophication threatens the Tulsa metropolitan water supply. Excessive levels of
phosphorus and algal growth impair the designated aesthetics, recreational and drinking
water beneficial uses of Lakes Eucha and Spavinaw by causing undesirable taste and bad
odor. Municipal water treatment facilities that treat the water to achieve established
drinking water standards find it difficult and prohibitively expensive to remove the bad
taste and odor in drinking water. The City of Tulsa reported additional water treatment
costs due to excessive algae exceeding $72.78 per million gallons. Should their current
treatment system be unable to eliminate the taste and odor problems, the City of Tulsa
will have to either increase water treatment costs or abandon lake Eucha and Spavinaw
lake as a water supply entirely and look for alternative drinking water supply such as
Lake Hudson. The additional costs of using Lake Hudson water was estimated to exceed
$7,000 per day whereas the cost of abandoning lakes Eucha and Spavinaw as a water
supply and using Lake Hudson was estimated to exceed $250 million (City of Tulsa
2006; OWRB 2006).
There is need for regulations and nutrient management plans to reduce both point and
nonpoint source nutrient pollution in the Eucha-Spavinaw watershed, especially that
coming from agriculture. Therefore best management practices (BMPs) to reduce
phosphorus loading in the watershed are of high interest, not only to poultry integrators
and farmers using poultry manure, but also to municipal authorities, recreation managers,
regulators, policy makers and the general public. Although several studies have analyzed
nitrogen and phosphorus loading in the watershed, few studies have analyzed the role of

5
grazing management systems as a profitable economic enterprise and a phosphorus
reduction strategy under stochastic conditions from a watershed where large quantities of
litter were available for use as fertilizer on pastures to achieve the established phosphorus
total maximum daily loads (TMDL) for the watershed at minimum cost to society. The
research presented in this article addresses the question, “What is the most efficient set of
litter and grazing management practices that can be used to maximize net agricultural
income while meeting the phosphorus TMDL for the Eucha-Spavinaw watershed within
specified margins of safety?” To answer this question we develop an integrated
biophysical - economic optimization model for cost efficient non-point source pollution
abatement in the Eucha - Spavinaw watershed to determine the least cost mix, location,
and magnitude of grazing management practices to reduce phosphorus loading under
various phosphorus loading targets and margins of safety for the Eucha-Spavinaw
watershed. We determine the optimal transportation pattern for poultry litter under
various phosphorus loading targets and margins of safety for the watershed as well as
evaluate the efficiency of changes in pasture management practices in reducing
phosphorus runoff relative to the use in a possible litter-to-energy power plant under
various phosphorus loading targets and margins of safety for the Eucha-Spavinaw
watershed with and without the alum-treated poultry litter option.
Conceptual Framework
The water quality problem resulting from excessive emissions of nutrients (e.g.
phosphorus and nitrogen) into Lakes Eucha and Spavinaw is viewed in this article as a

6
case of market failure. The water pollution problem exists because property rights for
clean water in the area are not clearly defined. Polluters, especially agricultural
producers using inputs that have adverse effects on the environment such as pesticides
and fertilizers (especially poultry manure) do not internalize the social costs associated
with the use of such inputs in their private cost calculations. The negative environmental
externality for which polluters do not account causes a divergence between private and
social costs that gives them an incentive to use the inputs (e.g. poultry litter) in quantities
exceeding socially optimal levels.
This article approaches the problem of phosphorus pollution in the Eucha-Spavinaw
watershed from a social perspective, a point of view that calls for choosing a level of
phosphorus control that maximizes total net benefits to the society. The conceptual
framework for determining optimal abatement levels, as noted by Freeman, Haveman and
Kneese (1973), is based on the concept of minimizing the sum of total pollution
abatement cost and total environmental damage cost. This concept assumes that there
exists a social welfare function with which to work. The general social welfare function
can be maximized by minimizing the sum of total pollution abatement cost and total
environmental damage cost as demonstrated in Tietenberg (2003). This article is based on
the same concept and assumes existence of a social welfare function to be maximized
from consumption of market or economic output and environmental services in the
Eucha-Spavinaw watershed. This relationship can be mathematically expressed as:
(1) W = M + E

7
Where W is the social welfare function; M is the value of the market goods and services
consumed by society and E is the value of environmental service consumed by society.
If we let E* be maximum potential value of environmental services from pristine
environment, D be costs of environmental damages from production and consumption of
market goods and services, M* be maximum value of market goods and services with no
pollution treatment, and T be costs associated with treating pollution, then we may state
the actual values of market goods and services and environmental services as follows:
(2) M = M* - T
(3) E = E* - D
Substituting equations (2) and (3) into equation (1) redefines total social welfare function
as:
(4) W = (M* - T) + (E* - D) = M* + E* - (T + D)
Given that M* and T* are fixed, equation (4) shows that we can maximize total welfare
function by minimizing (T + D), the sum of pollution treatment costs and environmental
damage costs. If we assume that both T and D are functions of a given pollutant (p),
equation (4) may be recast to show that total welfare function will also be a function of
pollutant (p) as follows:
(5) W (p) = M* + E* - ( T(p) + D(p) )
Maximizing total social welfare function in this form requires differentiating
equation (5) with respect to p and setting the derivative equal to zero:

8
p
D
p
T
p
D
p
T
p
W
∂
∂=
∂
∂−⇒
=∂
∂−
∂
∂−=
∂
∂
)7(
0)6(
Where ∂T/∂p is the marginal treatment cost, the change in total treatment costs from an
additional unit of pollutant treated; and ∂D/∂p is the marginal environmental damage
costs, the change in total environmental cost due to an additional untreated unit of
pollutant emitted into the environment. The result in equation (7) implies that total social
welfare is maximum when marginal treatment costs are equal to marginal environmental
damage costs.
The second order conditions with respect to p are:
0)8(2
2
2
2
2
2
≤∂
∂−
∂
∂−=
∂
∂
p
D
p
T
p
W
Equation (8) shows that the second order derivative is non-positive and thus consistent
with the requirement for the point of maximum of the social welfare function. The
implicit assumption here is that both ∂2T/∂p2 and ∂2D/∂p2 are non-negative at the optimal
point in order for the second order derivative to be non-positive. Equation (8) implies that
the treatment cost function should be increasing at a non-decreasing rate as the amount of
pollution treatment increases. On the other hand, the environmental damage cost function
should be increasing at a non-decreasing rate as the amount of pollution treatment
decreases. In the case of water pollution as in the Eucha-Spavinaw watershed, the
damage cost function represents the cost to the environment (such as dead fish, reduced
recreational values, increased downstream water treatment costs) if various amounts of
9
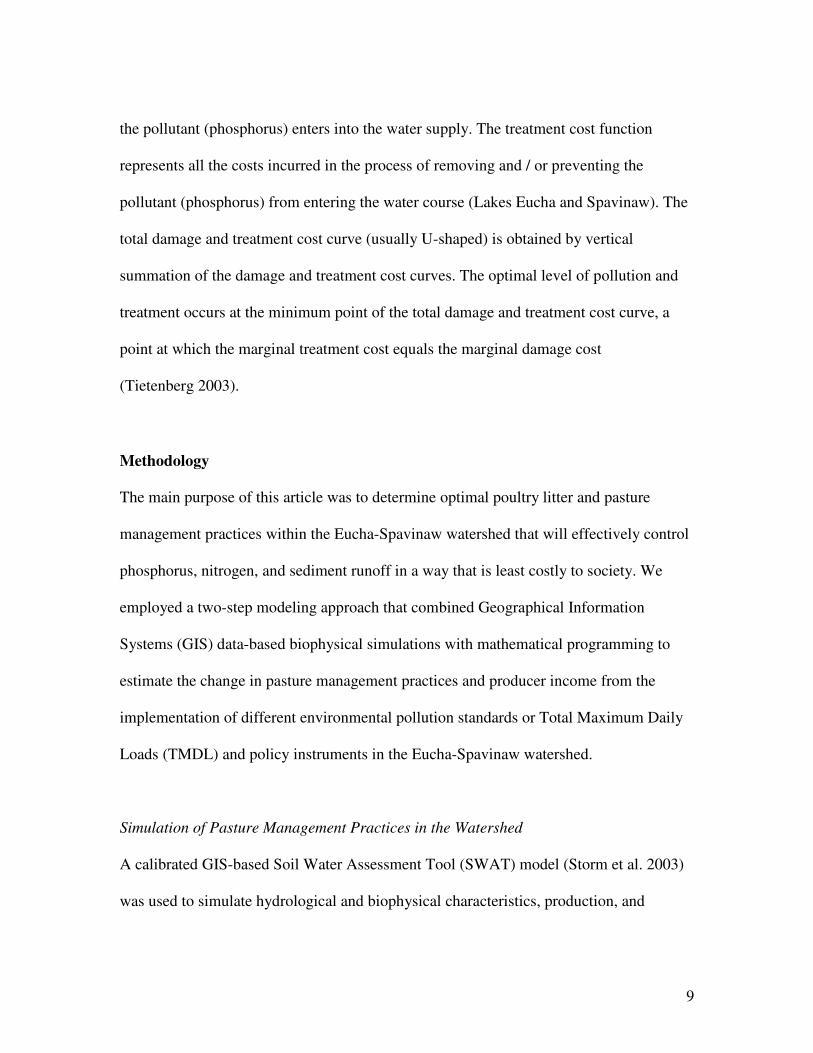
the pollutant (phosphorus) enters into the water supply. The treatment cost function
represents all the costs incurred in the process of removing and / or preventing the
pollutant (phosphorus) from entering the water course (Lakes Eucha and Spavinaw). The
total damage and treatment cost curve (usually U-shaped) is obtained by vertical
summation of the damage and treatment cost curves. The optimal level of pollution and
treatment occurs at the minimum point of the total damage and treatment cost curve, a
point at which the marginal treatment cost equals the marginal damage cost
(Tietenberg 2003).
Methodology
The main purpose of this article was to determine optimal poultry litter and pasture
management practices within the Eucha-Spavinaw watershed that will effectively control
phosphorus, nitrogen, and sediment runoff in a way that is least costly to society. We
employed a two-step modeling approach that combined Geographical Information
Systems (GIS) data-based biophysical simulations with mathematical programming to
estimate the change in pasture management practices and producer income from the
implementation of different environmental pollution standards or Total Maximum Daily
Loads (TMDL) and policy instruments in the Eucha-Spavinaw watershed.
Simulation of Pasture Management Practices in the Watershed
A calibrated GIS-based Soil Water Assessment Tool (SWAT) model (Storm et al. 2003)
was used to simulate hydrological and biophysical characteristics, production, and

10
sediment, nitrogen and phosphorus runoff for feasible alternative pasture management
practices in the Eucha-Spavinaw watershed. We used daily weather records for
temperature and rainfall for the period 1950 to 2004, from which three sets of 23 years of
daily weather (rainfall and temperature) were selected for use in all simulations
performed in this study. The first three years in each set comprised of daily weather data
for the period 1993-95 and were used for warm-up and the base run of the simulation
model. The other twenty years in each of the three weather data sets consisted of
randomly selected sequence of years between 1950 and 2004. GIS data for topography,
soils, land cover and streams required by SWAT model were obtained from various
sources including public agencies (especially USGS, NRCS, and NOAA), extension
offices, and via personal communication. The SWAT model delineated the Eucha-
Spavinaw watershed into 90 subbasins with a total of 2416 hydraulic response units
(HRUs) and 27 major soil types. Clarksville is the dominant soil type, covering about 44
percent of the watershed area, followed by Nixa which accounts for approximately 14
percent. Captina and Doniphan cover approximately 7 percent of the watershed area each.
The soil types Razort and Tonti account for about 6 and 4 percent of the area,
respectively. The other 21 soil types collectively account for about 18 percent of the
Eucha-Spavinaw watershed area.
A series of simulation runs were performed for a total of one hundred and five feasible
pasture management practices in each hydraulic response unit (HRU) in the Eucha-
Spavinaw watershed. Potential alternative pasture management practices were simulated

11
using different combinations of land use/land cover, rate of poultry litter application,
commercial nitrogen, minimum biomass retained during grazing, and stocking rates
shown in Table 1 below. The land uses modeled are low-biomass pasture (LPAS),
medium-biomass pasture (MPAS), high-biomass pasture (HPAS), litter low-biomass
pasture (LLPA), litter medium-biomass pasture (LMPA), and litter high-biomass pasture
(LHPA), winter wheat (WWHT), green beans (GRBN), rangeland (RNGB) and forests
(FRST). It was assumed that poultry litter is applied only to pastures and row crops in the
management simulations. The results of each simulation were then used to generate HRU
specific coefficients for production, phosphorus runoff, nitrogen runoff and sediment
runoff for each pasture management practice in each HRU. The respective coefficients
obtained from the SWAT model were then used to develop an environmental target
MOTAD risk programming model that was later used to select the most efficient pasture
management practice for each HRU in the watershed.
Table 1. Levels of Management Practice Variables Used
Land Use
/Land Cover
Litter Applied (kg/ha)
Nitrogen Applied (kg/ha)
Minimum Plant Biomass for Grazing
(kg/ha)
Stocking Rate
(AU/ acre)
AGRL HPAS LHPA LLPA LMPA LPAS MPAS RNGB FRST
0 1765 2000 3529 4000 5294 6000
0 50
100 150 200
1100 1600 2000
0.63 1.00 1.26
Table 1shows levels of each management practice variable simulated. There are

12
eight types of land use / land cover, seven levels of litter application rate, five levels of
nitrogen application rate, three levels of minimum plant biomass maintained during
grazing, and three levels that represented a low, medium and high stocking rate. A
management scenario that maintained minimum plant biomass during grazing of 1100,
1600 and 2000 kg/ha was considered to represent a poor, fair, or good pasture,
respectively. The SCS-curve numbers (CN2) were adjusted according to the pasture
condition and hydrologic group (A, B, C, or D) assigned to each soil type.
The row crops, winter wheat and green beans were modeled as a graze-out wheat-and-
green bean rotation (green beans followed by winter wheat). All other pasture
management scenarios were modeled as tall fescue pasture management systems. It is
assumed that poultry litter is applied only to pastures and row crops in the management
simulations. Phosphorus applied on cropland was assumed to come solely from poultry
litter. A metric ton of poultry litter was assumed to contain 14kg of phosphorus and 30kg
of nitrogen. The model assumes a choice of nitrogen replacement by commercial
fertilizer at litter application rates less than the base application rate to maintain the
current total nitrogen rate and forage production. For application rates exceeding the base
rate, the nitrogen applied on the grasses is assumed to come from the poultry litter. Both
litter and nitrogen application rates are based on fertilization recommendations. The
length of the grazing period was set at 270 days for all pastures.
13
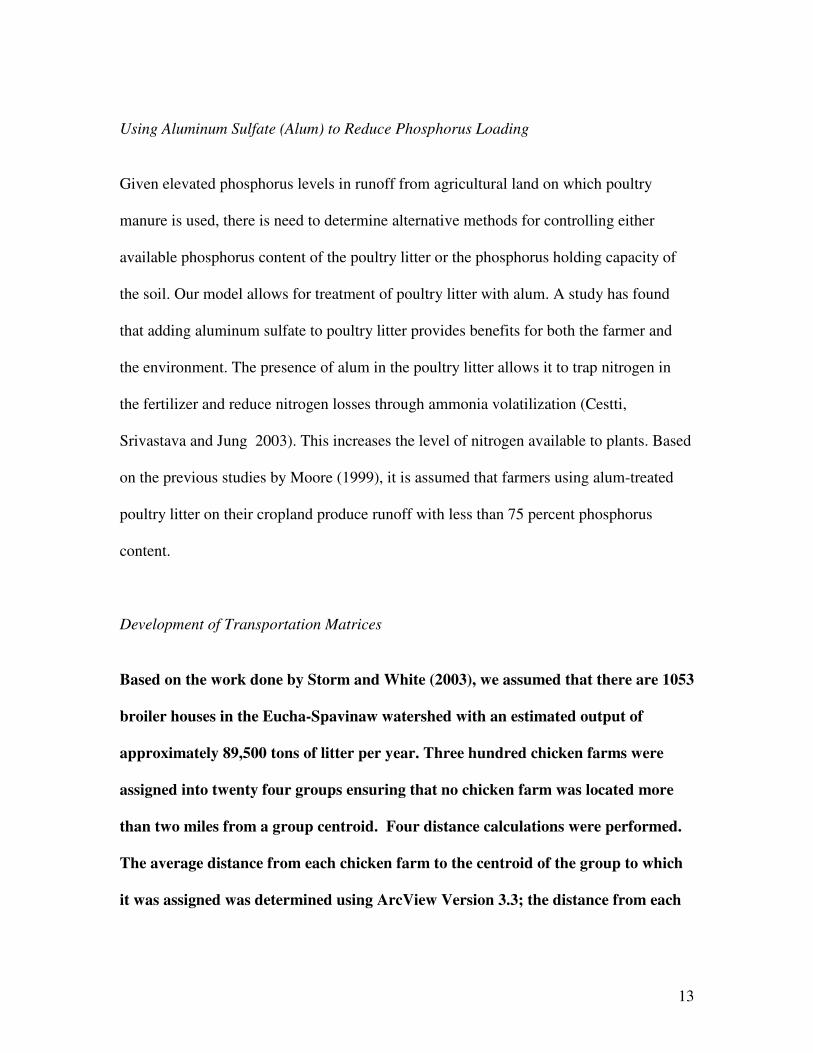
Using Aluminum Sulfate (Alum) to Reduce Phosphorus Loading
Given elevated phosphorus levels in runoff from agricultural land on which poultry
manure is used, there is need to determine alternative methods for controlling either
available phosphorus content of the poultry litter or the phosphorus holding capacity of
the soil. Our model allows for treatment of poultry litter with alum. A study has found
that adding aluminum sulfate to poultry litter provides benefits for both the farmer and
the environment. The presence of alum in the poultry litter allows it to trap nitrogen in
the fertilizer and reduce nitrogen losses through ammonia volatilization (Cestti,
Srivastava and Jung 2003). This increases the level of nitrogen available to plants. Based
on the previous studies by Moore (1999), it is assumed that farmers using alum-treated
poultry litter on their cropland produce runoff with less than 75 percent phosphorus
content.
Development of Transportation Matrices
Based on the work done by Storm and White (2003), we assumed that there are 1053
broiler houses in the Eucha-Spavinaw watershed with an estimated output of
approximately 89,500 tons of litter per year. Three hundred chicken farms were
assigned into twenty four groups ensuring that no chicken farm was located more
than two miles from a group centroid. Four distance calculations were performed.
The average distance from each chicken farm to the centroid of the group to which
it was assigned was determined using ArcView Version 3.3; the distance from each

14
chicken farm centroid to a point on the nearest road was estimated using the nearest
feature algorithm; the distance from the point on the road nearest each chicken
farm to a point on the road nearest each sub-basin centroid was estimated using a
multi-path script; and lastly the nearest feature algorithm was used to determine the
distance from the road to the sub-basin centroid. We used the same process to
create a transportation matrix from each chicken farm centroid to Jay, Oklahoma
for location of a possible litter-to-energy processing plant. This approach resulted in
a matrix with 2208 possible transportation activities constituted from each of the 24
chicken farm centroids supplying litter to each of the 92 sub-basin centroids. Cost
estimates for transporting litter from chicken farm centroids to subbasin centroids
were based on information supplied by BMPs Inc. The cost for loading and
coordinating a haul ranged from $7.50 to $8.00 per ton. The cost of hauling ranged
from $3.25 to $3.50 per loading mile per truckload. Each truck averaged 23 tons per
load. The loaded mileage is a one-way distance. No direct cost for spreading, but
BMPs, Inc. would coordinate spreading at an average of $6 per short ton (BMPs,
Inc 2006).
The Value of Biomass Consumed During Grazing
The value of hay and pasture consumed during grazing was derived based on a 100 cow
unit size cow-calf enterprise budget obtained from Oklahoma State University
Cooperative Extension Service. We assumed that part of the calf crop were kept beyond
weaning and sold later as stockers. Table xxx below shows the modified OSU 100 herd

15
cow-calf enterprise budget with the net value of consumed grass estimated at $53.05 per
metric ton.
Table 2. 100 Herd Cow Calf Enterprise Budget
Production Weight Unit Price / Cwt Qty Revenue
Steer Calves 470 Lbs./hd $107.42 18.91 $9,547
Heifer Calves 470 Lbs./hd $100.04 7.49 $3,522
Cull Cows 1150 Lbs./hd $44.27 12 $6,109
Cull Replacement 825 Lbs./hd $84.34 12 $8,350
Cull Bulls 1750 Lbs./hd $58.58 1 $1,025
Stockers 623 Lbs./hd $112.00 40 $27,910
Total Receipts $56,463
Protein Supp. $ Salt 1 hd. $44.40 1.1 $4,884
Minerals 1 hd. $14.07 1.1 $1,548
Vet Services 1 hd. $7.14 1.1 $785
Vet Supplies 1 hd. $1.16 1.1 $128
Marketing 1 hd. $6.91 1 $691
Mach. Fuel,Oil, Repairs 1 hd. $24.09 1.1 $2,650
Machinery labor 1 hrs. $9.25 2.65 $2,451
Other labor 1 hrs. $9.25 3 $2,775
Other expense 1 hd. - 1.1
Annual Oper. Capital Dollars 0.0825 184.62 $1,523
Total Operating Costs $17,435
Other Fixed Costs $12,926
Net Return to Hay and Pasture $26,102
lbs/day days/yr lbs/yr kg/yr
Cow 25 365 9125 4139
Bull 25 365 365 166
16
Replacement Heifer 18 365 788 358
Stocker 14 100 560 254
Hay and Pasture Required Per Cow Unit 4916
Net Revenue per Mg Biomass Consumed ($26,102/100hd/4.92) $53.05
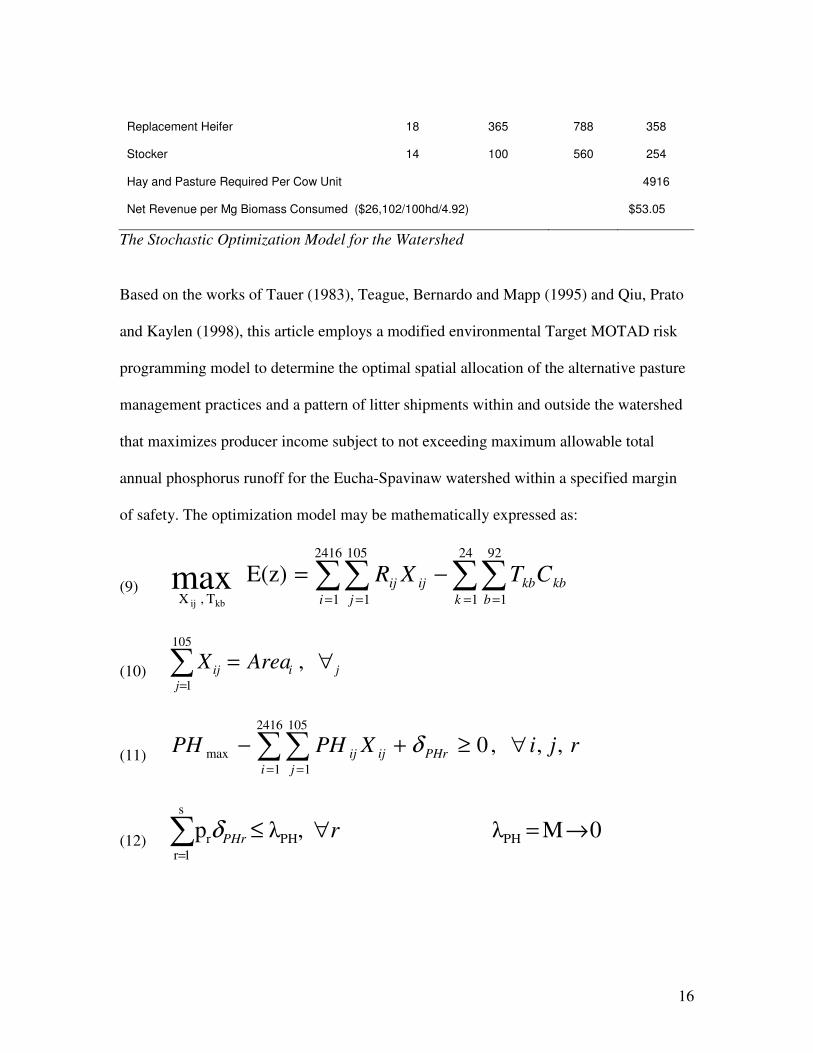
The Stochastic Optimization Model for the Watershed
Based on the works of Tauer (1983), Teague, Bernardo and Mapp (1995) and Qiu, Prato
and Kaylen (1998), this article employs a modified environmental Target MOTAD risk
programming model to determine the optimal spatial allocation of the alternative pasture
management practices and a pattern of litter shipments within and outside the watershed
that maximizes producer income subject to not exceeding maximum allowable total
annual phosphorus runoff for the Eucha-Spavinaw watershed within a specified margin
of safety. The optimization model may be mathematically expressed as:
(9) ∑∑∑∑= == =
−=
24
1
92
1
2416
1
105
1T , X
E(z)maxkbij k b
kbkb
i j
ijij CTXR
(10) j
j
iij AreaX ∀=∑=
,105
1
(11) rjiXPHPHi j
PHrijij ,,,02416
1
105
1
max ∀≥+− ∑∑= =
δ
(12) 0Mλ,λp PHPH
s
1r
r →=∀≤∑=
rPHrδ

17
(13) kST k
b
kb ∀=∑=
,92
1
(14) ∑ ∑∑= ==
∀=
92
1
24
1
105
1
,,,b k
kb
j
jbjb kjbTXQ
(15) 0,0 ≥≥ kbij TX
where E(z) is the expected net agricultural income for the watershed; Rij is the net income
from the jth management practice in the ith HRU; Xij represents amount of land allocated
for the jth management practice in the i
th HRU; Tkb is the quantity of litter transported
from the kth chicken farm centroid to the b
th subbasin centroid; Ckb is the cost of
transporting poultry litter from the kth chicken farm centroid to the bth subbasin centroid;
Areai represents the amount of available land resource in each HRU that can be allocated
for use under any feasible pasture management system; PHmax, is the maximum allowable
total annual phosphorus loading for the watershed; PHij represents the amount of
phosphorus runoff from the ith HRU under the jth pasture management system and δpHr is
the phosphorus runoff deviation above the maximum allowable total phosphorus load for
the watershed under each state of nature r; pr is probability that state of nature r will
occur; λ PH represents an environmental risk measure, the expected value of positive
deviations above the annual phosphorus loading target for the watershed parameterized
from a large number M to 0; Sk is the quantity of litter supplied at the kth chicken farm
centroid; Qjb is the quantity of litter required by the jth management practice in the b
th
subbasin; and Xjb is the amount of land allocated to the jth management practice in the bth

18
subbasin. Thus, this model maximizes net returns from grazing less transportation and
treatment costs for poultry litter subject to a limit on phosphorus loading from the entire
watershed within a specified tolerance level.
Phosphorus Pollution Abatement Costs
In the case of water pollution from phosphorus emissions as is the case in the Eucha-
Spavinaw watershed, the treatment or abatement cost function represents all the costs
incurred in the process of removing and / or preventing the pollutant (phosphorus) from
entering the water course (Lakes Eucha and Spavinaw). However, for purposes of this
study, we determined total abatement costs in terms of reduction in producer income
from crops, pasture and range. Total abatement costs were estimated as the difference in
the value of the objective function (representing total agricultural net returns for the
watershed) of the Target MOTAD programming model (specified above) subject to the
estimated current level of phosphorus loading for the Eucha-Spavinaw watershed (40
tons per year) and the value of the objective function at each of the alternative annual
phosphorus loading targets (that is, at 35, 30, 25, and 20 tons per year) and a specified
phosphorus deviation limit above a given phosphorus loading target. The upper limit on
the phosphorus runoff deviation above annual phosphorus loading was varied from 10
tons to 2 tons per year. The marginal phosphorus treatment/abatement cost may be
defined as the change in total phosphorus pollution abatement costs from an additional
unit of phosphorus treated/abated. Optimal pollution abatement requires that the marginal

19
abatement costs in production be set equal to the marginal benefit of the abatements as
measured by a reduction in environmental damage (Tietenberg 2003; Sterner 2003). For
purposes of this study, we determined the marginal phosphorus pollution abatement cost
using the shadow price on the binding average annual phosphorus runoff constraint
obtained from the solution of the economic model specified above. This shadow price
may be interpreted in economic terms to represent the amount by which the value of the
objective function (or the total agricultural net return for the Eucha-Spavinaw watershed)
is reduced as the maximum allowable annual phosphorus runoff is restricted by an
additional unit per year. The intersection of the curves for the marginal costs of pollution
damage and the marginal costs of pollution abatement determines the optimal levels of
pollution emissions and their shadow cost (Steiner 2003; Tietenberg 2003).
Mixed Linear Model Specification
A general mixed linear econometric model was specified to determine the relationship
between phosphorus runoff in the current period and soil type, RKLS-factor, curve
number (CurV), minimum biomass maintained during grazing (BmMin), stocking rate
(StkRate), amount of litter/phosphorus applied (Papl), amount of commercial nitrogen
applied (Napl) and the litter/phosphorus applied (Napl) and phosphorus runoff in the
previous period (LagPloss). The general econometric model may be mathematically
specified as:
(16) itk
K
k
itkit uβXP += ∑= 1
i =1,…,N ; t =1,…,T

20
(17) ittiit evu ε++=
Where Pit represent expected phosphorus runoff in the current period, Xit represent the
independent variables outlined above, βk are parameters to be estimated, vi is a cross-
section specific residual, et is a time-series specific residual, εit is a classical error term
with zero mean and a homoskedastic covariance matrix, N is the number of cross-
sections, T is the length of the time series for each cross section, and K is the number of
explanatory variables included in the model.
Results A total of 105 feasible grazing management practices were simulated and tested in each
of the agricultural HRUs in the Eucha-Spavinaw watershed. However, not all of them
were in the feasible solution set when the optimization model was solved for each of the
possible mean annual phosphorus runoff targets and phosphorus runoff deviation limits
above target for the Eucha-Spavinaw watershed.
Hauling Without Alum-Treated Litter Option
In this option we examined the effects of limiting total phosphorus runoff for the Eucha-
Spavinaw watershed to 40, 35, 30, 25, and 20 tons per year on optimal litter and pasture
management systems when the available method of litter allocation is hauling within the
watershed and to a possible litter-to-energy power plant located at Jay, Oklahoma.

21
Table 2 below show a wide range of grazing management practices the optimization
model identified for optimal level of phosphorus abatement in the Eucha-Spavinaw
watershed at different phosphorus loading targets and deviation limits. Optimal
phosphorus abatement for the watershed was achieved through a combination of various
site-specific grazing management practices at each mean annual phosphorus loading
target and phosphorus runoff deviation limit tested in this study. Table 3 to table 5 below
show the optimal grazing management practices selected by the economic optimization
model and amount of land allocated for each selected management practice when the
mean annual total phosphorus runoff for the Eucha-Spavinaw watershed was limited to
40 Mg, 30Mg, 25Mg and 20Mg per year, respectively, with phosphorus deviation limits
above target varied from 10 Mg to 2 Mg per year. Table xxx below shows that when
mean annual phosphorus load for the Eucha-Spavinaw watershed is limited to 40 Mg per
year with an upper limit on phosphorus deviation above mean load of not more than 10
Mg per year, BMP 2022 received the largest land allocation of about 16,000 hectares of
pastureland. Under this grazing management practice, the pasture received 4 tons of
poultry litter per hectare and no commercial nitrogen fertilizer was applied at all.

22
Table 2 Selected Optimal Grazing Management Practices for the Watershed
BMP Poultry Litter
Applied Elemental Nitrogen
Applied Minimum Biomass
Maintained During Grazing Stocking
Rate
Code (tons/ha) (kg/ha) (tons/ha) (AU/ha)
0011 0 0 1.1 0.63
0012 0 0 1.1 1.00
0013 0 0 1.1 1.26
0221 0 100 1.6 0.63
0222 0 100 1.6 1.00
0223 0 100 1.6 1.26
0331 0 150 2.0 0.63
0332 0 150 2.0 1.00
0333 0 150 2.0 1.26
0111 0 50 1.1 0.63
0112 0 50 1.1 1.00
0113 0 50 1.1 1.26
1011 2 0 1.1 0.63
1012 2 0 1.1 1.00
1013 2 0 1.1 1.26
1231 2 100 2.0 0.63
1232 2 100 2.0 1.00
1233 2 100 2.0 1.26
1121 2 50 1.6 0.63
1122 2 50 1.6 1.00
1123 2 50 1.6 1.26
2021 4 0 1.6 0.63
2022 4 0 1.6 1.00
2023 4 0 1.6 1.26
3031 6 0 2.0 0.63
3032 6 0 2.0 1.00
3033 6 0 2.0 1.26
3231 6 100 2.0 0.63
3431 6 200 2.0 0.63
3432 6 200 2.0 1.00
3433 6 200 2.0 1.26
23
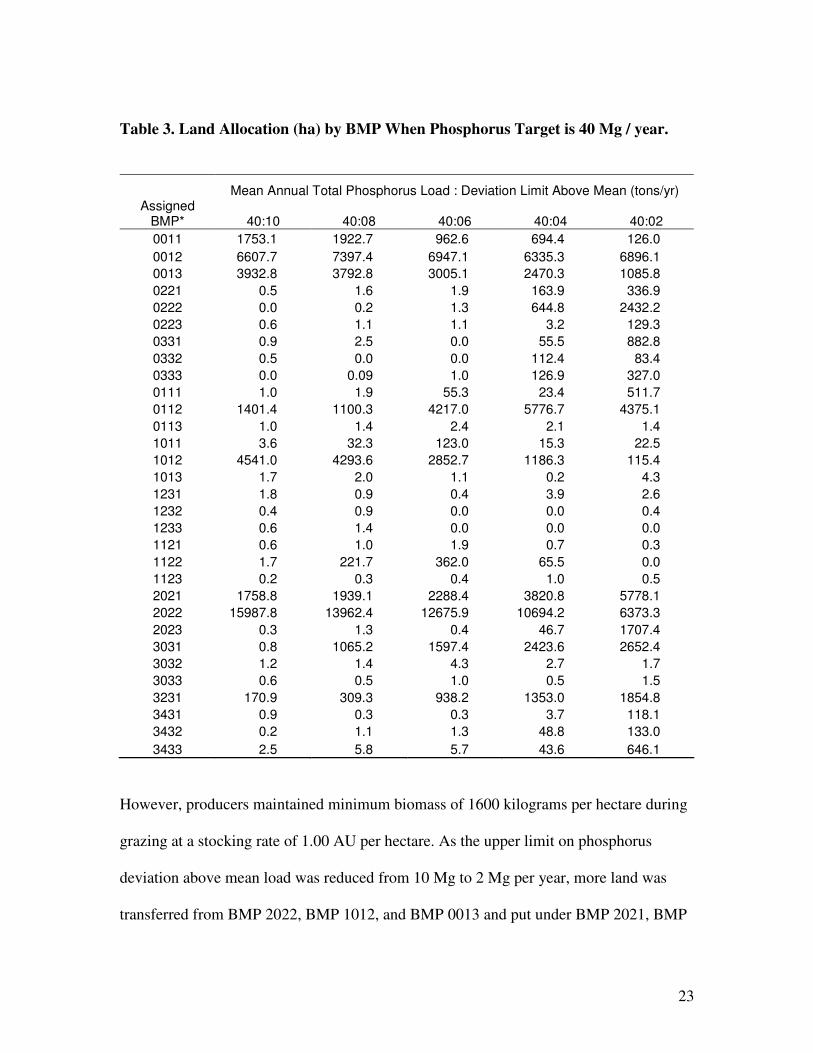
Table 3. Land Allocation (ha) by BMP When Phosphorus Target is 40 Mg / year.
Mean Annual Total Phosphorus Load : Deviation Limit Above Mean (tons/yr) Assigned
BMP* 40:10 40:08 40:06 40:04 40:02
0011 1753.1 1922.7 962.6 694.4 126.0
0012 6607.7 7397.4 6947.1 6335.3 6896.1
0013 3932.8 3792.8 3005.1 2470.3 1085.8
0221 0.5 1.6 1.9 163.9 336.9
0222 0.0 0.2 1.3 644.8 2432.2
0223 0.6 1.1 1.1 3.2 129.3
0331 0.9 2.5 0.0 55.5 882.8
0332 0.5 0.0 0.0 112.4 83.4
0333 0.0 0.09 1.0 126.9 327.0
0111 1.0 1.9 55.3 23.4 511.7
0112 1401.4 1100.3 4217.0 5776.7 4375.1
0113 1.0 1.4 2.4 2.1 1.4
1011 3.6 32.3 123.0 15.3 22.5
1012 4541.0 4293.6 2852.7 1186.3 115.4
1013 1.7 2.0 1.1 0.2 4.3
1231 1.8 0.9 0.4 3.9 2.6
1232 0.4 0.9 0.0 0.0 0.4
1233 0.6 1.4 0.0 0.0 0.0
1121 0.6 1.0 1.9 0.7 0.3
1122 1.7 221.7 362.0 65.5 0.0
1123 0.2 0.3 0.4 1.0 0.5
2021 1758.8 1939.1 2288.4 3820.8 5778.1
2022 15987.8 13962.4 12675.9 10694.2 6373.3
2023 0.3 1.3 0.4 46.7 1707.4
3031 0.8 1065.2 1597.4 2423.6 2652.4
3032 1.2 1.4 4.3 2.7 1.7
3033 0.6 0.5 1.0 0.5 1.5
3231 170.9 309.3 938.2 1353.0 1854.8
3431 0.9 0.3 0.3 3.7 118.1
3432 0.2 1.1 1.3 48.8 133.0
3433 2.5 5.8 5.7 43.6 646.1
However, producers maintained minimum biomass of 1600 kilograms per hectare during
grazing at a stocking rate of 1.00 AU per hectare. As the upper limit on phosphorus
deviation above mean load was reduced from 10 Mg to 2 Mg per year, more land was
transferred from BMP 2022, BMP 1012, and BMP 0013 and put under BMP 2021, BMP
24
0112, BMP 0222 and BMP 0012. The amount of pastureland that received no poultry
litter at all increased from about 14000 to 17000 ha whereas the amount of land that
received 4 tons of poultry litter per hectare declined from about 18000 to 14000 ha. The
amount of land that received from 50-150 kg/ha of commercial nitrogen fertilizer
increased from approximately 1400 to 11000 hectares. However, the amount of
pastureland on which a minimum biomass of 1100 kg/ha was maintained during grazing
declined from 18000 to 13000 hectares whereas the land on which a minimum biomass of
1600 kg/ha and above was maintained during grazing increased from about 18000 to
27000 hectares. The amount of land that was stocked at a rate of 1.00 AU/ha and above
declined from approximately 33000 to 24000 hectares while that which was stocked at a
lower rate of 0.63 AU/ha increased from 4000 to 12000 hectares. Table 4 below shows
the optimal grazing management practices selected by the economic optimization model
and amount of land allocated for each selected management practice when the mean
annual total phosphorus runoff for the Eucha-Spavinaw watershed was reduced from 40
Mg to 30 Mg per year, with phosphorus deviation limits above target varied from not
more than 10 Mg to 2 Mg per year. The area allocated for BMP 2021 drastically
increased from 1800 to 9000 hectares, the largest share of total area under pasture. Under
this grazing management practice, the pasture received 4 tons of poultry litter per hectare
and no commercial nitrogen fertilizer was applied at all. However, producers maintained
minimum biomass of 1600 kilograms per hectare during grazing at a stocking rate of 0.63
AU per hectare. BMP 2022 and BMP 0012 are second, each of them allocated about

25
6000 ha. The grazing management practices BMP 0011 and BMP 3031 were each
allocated about 3000 hectares of land.
Table 4 Land Allocation (Ha) by BMP When Phosphorus Target is 30 Mg / year.
Mean Annual Total Phosphorus Load : Deviation Limit Above Mean (tons/yr) Assigned
BMP* 30:10 30:08 30:06 30:04 30:02
0011 3469.3 3470.0 3470.2 1605.9 1568.0
0012 5953.5 5924.8 5902.6 6602.7 5349.1
0013 837.6 837.6 831.3 822.0 1.7
0221 360.1 360.1 364.9 97.8 989.5
0222 2575.2 2643.4 2446.6 3957.3 3870.0
0223 189.1 188.9 167.9 188.1 1735.6
0331 55.6 55.6 58.9 10.1 728.6
0332 13.4 13.2 14.3 42.4 498.5
0333 68.6 68.5 221.3 1213.5 4009.0
0111 1.4 1.3 123.9 0.8 7.2
0112 2717.4 2715.6 2896.5 2631.4 1782.3
0113 0.0 0.5 1.8 1.1 1.1
1011 4.1 4.2 7.7 6.5 7.0
1012 108.7 113.1 100.1 11.4 4.9
1013 2.1 2.7 2.5 1.8 1.1
1231 0.0 0.0 0.9 0.4 1.3
1232 0.2 0.2 0.0 0.0 0.0
1233 0.2 0.2 0.0 0.0 0.0
1121 0.1 0.5 0.9 0.4 0.0
1122 1.4 1.9 2.4 1.6 2.0
1123 0.0 0.5 0.0 0.0 0.0
2021 8910.9 8825.5 8115.3 6781.7 5939.2
2022 6090.8 6113.9 6463.3 5100.6 910.0
2023 1244.5 1245.9 939.1 1139.8 632.3
3031 3040.8 3113.9 3503.5 3805.1 4902.5
3032 2.4 2.6 6.8 3.7 1.0
3033 0.2 0.7 0.5 0.2 0.2
3231 378.9 378.5 423.8 1853.4 2431.7
3431 0.2 0.2 0.4 78.2 191.0
3432 0.5 0.6 0.8 59.7 199.1
3433 0.7 1.6 4.1 31.0 502.1
Table 5 below shows the optimal grazing management practices selected by the economic
optimization model and amount of land allocated for each selected management practice
26
when the mean annual total phosphorus runoff for the Eucha-Spavinaw watershed was
reduced from 40 Mg to 25 Mg and 20 Mg per year, with phosphorus deviation limits
above target varied from not more than 10 Mg to 4 Mg per year. When the mean annual
phosphorus runoff was limited to 25 Mg per year, the area allocated for BMP 2021
declined slightly, but it remained the largest share of total area under pasture followed by
BMP 3031 and BMP 0011. The amount of land allocated for BMP 0011, BMP 0222,
BMP 0333, and BMP 3031 increased. However, when the mean annual phosphorus
runoff was further limited to 20 Mg per year, the area allocated for BMP 0333 drastically
increased to about 9000 hectares, receiving the largest share of total area under pasture.
The amount of land allocated for BMP 2021 declined to about 5000 hectares, but ranked
second to BMP 0333. Land allocated for BMP 3031 declined while that allocated for
BMP 0222 remained relatively the same. The amount of land allocated for BMP 0221
increased significantly. When the mean annual total phosphorus runoff for the Eucha-
Spavinaw watershed was reduced from 40 Mg to 20 Mg per year, the amount of
pastureland that received no poultry litter at all increased from about 14000 to 26000
hectares whereas the amount of land that received 4 tons of poultry litter per hectare
declined from about 18000 to 5000 hectares. The amount of land that received no
commercial nitrogen fertilizer dropped from approximately 35,000 to 14000 hectares
whereas the land that received from 100-150 kg/ha of commercial nitrogen fertilizer
increased from approximately 5 to 22000 hectares. However, the amount of pastureland
on which a minimum biomass of 1100 kg/ha was maintained during grazing declined
from 18000 to 4000 hectares whereas the land on which a minimum biomass of 1600
27
kg/ha and above was maintained during grazing increased from about 18000 to 32000
hectares. The amount of land that was stocked at a rate of 1.00 AU/ha and above declined
from approximately 33000 to 19000 hectares while that which was stocked at a lower rate
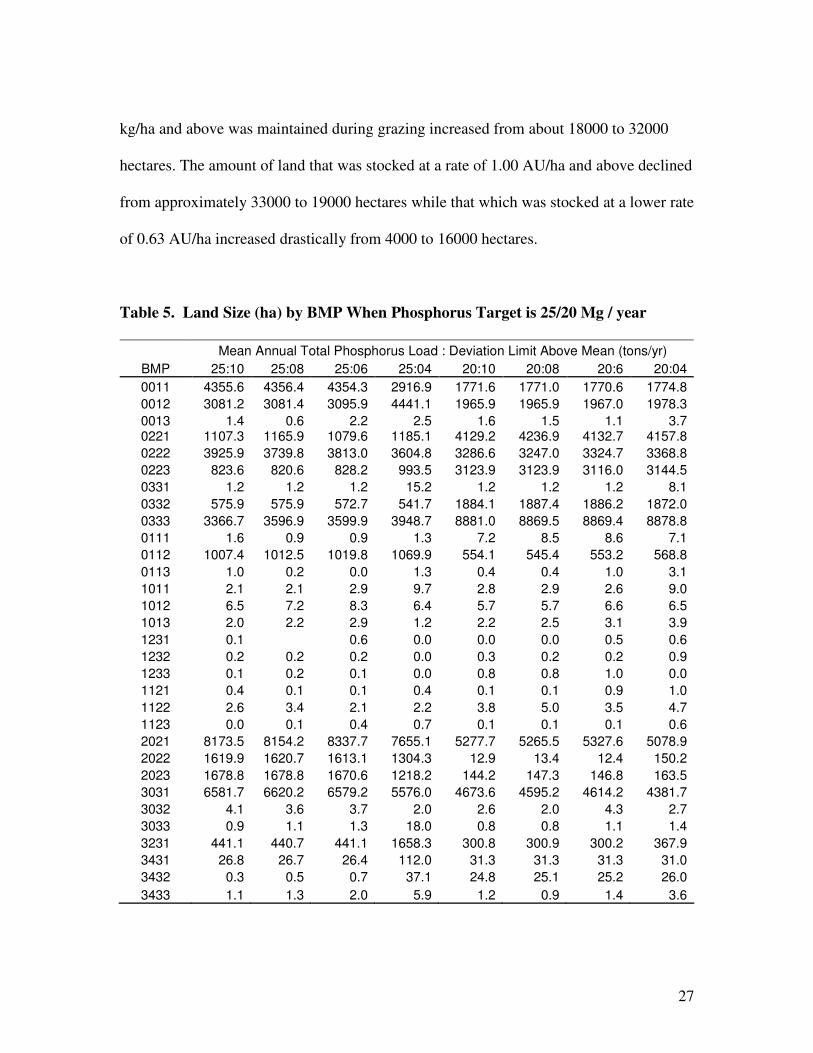
of 0.63 AU/ha increased drastically from 4000 to 16000 hectares.
Table 5. Land Size (ha) by BMP When Phosphorus Target is 25/20 Mg / year
Mean Annual Total Phosphorus Load : Deviation Limit Above Mean (tons/yr)
BMP 25:10 25:08 25:06 25:04 20:10 20:08 20:6 20:04
0011 4355.6 4356.4 4354.3 2916.9 1771.6 1771.0 1770.6 1774.8
0012 3081.2 3081.4 3095.9 4441.1 1965.9 1965.9 1967.0 1978.3
0013 1.4 0.6 2.2 2.5 1.6 1.5 1.1 3.7 0221 1107.3 1165.9 1079.6 1185.1 4129.2 4236.9 4132.7 4157.8
0222 3925.9 3739.8 3813.0 3604.8 3286.6 3247.0 3324.7 3368.8
0223 823.6 820.6 828.2 993.5 3123.9 3123.9 3116.0 3144.5
0331 1.2 1.2 1.2 15.2 1.2 1.2 1.2 8.1
0332 575.9 575.9 572.7 541.7 1884.1 1887.4 1886.2 1872.0
0333 3366.7 3596.9 3599.9 3948.7 8881.0 8869.5 8869.4 8878.8
0111 1.6 0.9 0.9 1.3 7.2 8.5 8.6 7.1
0112 1007.4 1012.5 1019.8 1069.9 554.1 545.4 553.2 568.8
0113 1.0 0.2 0.0 1.3 0.4 0.4 1.0 3.1
1011 2.1 2.1 2.9 9.7 2.8 2.9 2.6 9.0
1012 6.5 7.2 8.3 6.4 5.7 5.7 6.6 6.5
1013 2.0 2.2 2.9 1.2 2.2 2.5 3.1 3.9
1231 0.1 0.6 0.0 0.0 0.0 0.5 0.6
1232 0.2 0.2 0.2 0.0 0.3 0.2 0.2 0.9
1233 0.1 0.2 0.1 0.0 0.8 0.8 1.0 0.0
1121 0.4 0.1 0.1 0.4 0.1 0.1 0.9 1.0
1122 2.6 3.4 2.1 2.2 3.8 5.0 3.5 4.7
1123 0.0 0.1 0.4 0.7 0.1 0.1 0.1 0.6
2021 8173.5 8154.2 8337.7 7655.1 5277.7 5265.5 5327.6 5078.9
2022 1619.9 1620.7 1613.1 1304.3 12.9 13.4 12.4 150.2
2023 1678.8 1678.8 1670.6 1218.2 144.2 147.3 146.8 163.5
3031 6581.7 6620.2 6579.2 5576.0 4673.6 4595.2 4614.2 4381.7
3032 4.1 3.6 3.7 2.0 2.6 2.0 4.3 2.7
3033 0.9 1.1 1.3 18.0 0.8 0.8 1.1 1.4
3231 441.1 440.7 441.1 1658.3 300.8 300.9 300.2 367.9
3431 26.8 26.7 26.4 112.0 31.3 31.3 31.3 31.0
3432 0.3 0.5 0.7 37.1 24.8 25.1 25.2 26.0
3433 1.1 1.3 2.0 5.9 1.2 0.9 1.4 3.6
28
Predicted Annual Phosphorus Runoff for the
Eucha-Spavinaw Watershed (kg/yr)
05000
100001500020000
2500030000350004000045000
40:1
0
40:8
40:6
40:4
40:2
35:1
0
35:8
35:6
35:4
35:2
30:1
0
30:8
30:6
30:4
30:2
25:1
0
25:8
25:6
25:4
20:1
0
20:8
20:6
20:4
Annual Phosphorus Runoff Target With Deviation Limits (tons/yr)
Phosphoru
s R
unoff
(kg/y
r)
Predicted Annual Phosphorus Runoff in Watershed (kg/yr)
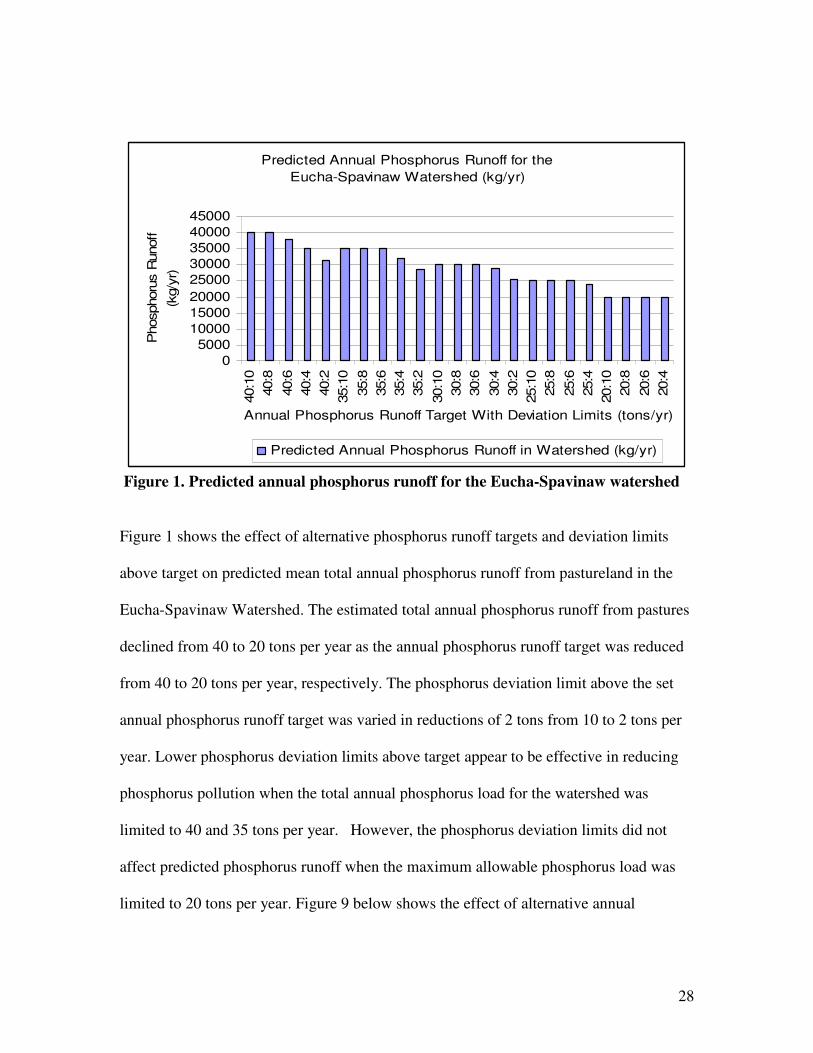
Figure 1. Predicted annual phosphorus runoff for the Eucha-Spavinaw watershed
Figure 1 shows the effect of alternative phosphorus runoff targets and deviation limits
above target on predicted mean total annual phosphorus runoff from pastureland in the
Eucha-Spavinaw Watershed. The estimated total annual phosphorus runoff from pastures
declined from 40 to 20 tons per year as the annual phosphorus runoff target was reduced
from 40 to 20 tons per year, respectively. The phosphorus deviation limit above the set
annual phosphorus runoff target was varied in reductions of 2 tons from 10 to 2 tons per
year. Lower phosphorus deviation limits above target appear to be effective in reducing
phosphorus pollution when the total annual phosphorus load for the watershed was
limited to 40 and 35 tons per year. However, the phosphorus deviation limits did not
affect predicted phosphorus runoff when the maximum allowable phosphorus load was
limited to 20 tons per year. Figure 9 below shows the effect of alternative annual
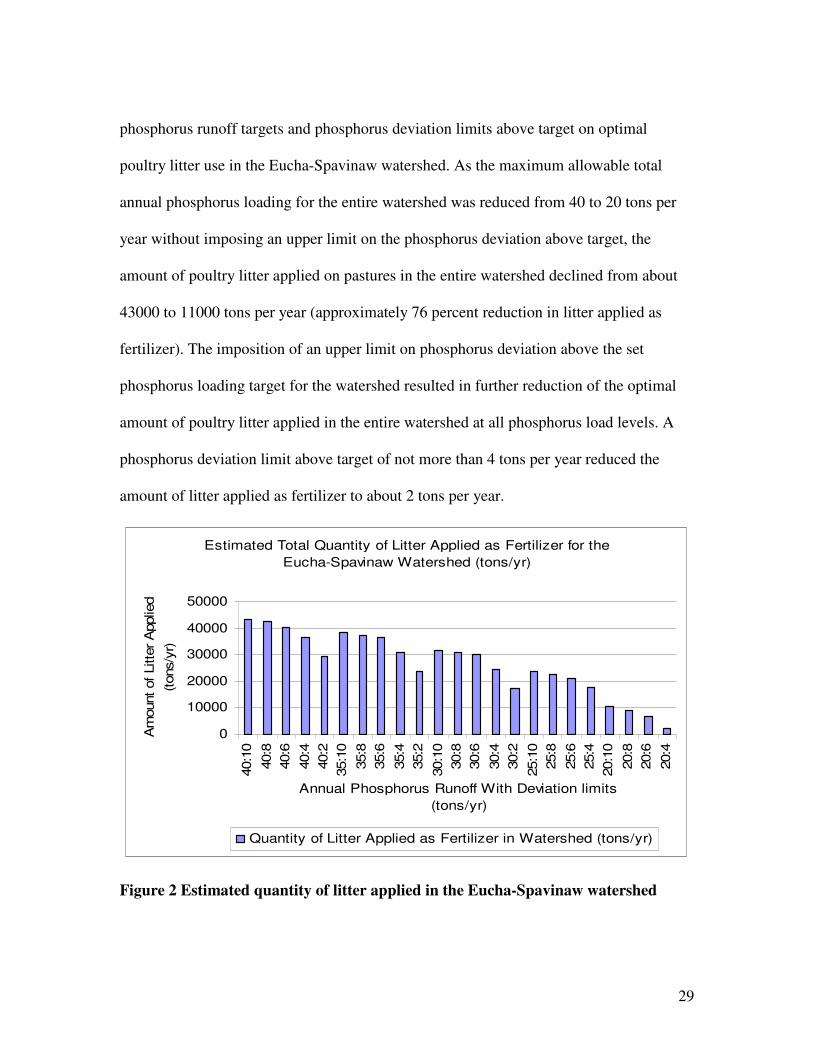
29
phosphorus runoff targets and phosphorus deviation limits above target on optimal
poultry litter use in the Eucha-Spavinaw watershed. As the maximum allowable total
annual phosphorus loading for the entire watershed was reduced from 40 to 20 tons per
year without imposing an upper limit on the phosphorus deviation above target, the
amount of poultry litter applied on pastures in the entire watershed declined from about
43000 to 11000 tons per year (approximately 76 percent reduction in litter applied as
fertilizer). The imposition of an upper limit on phosphorus deviation above the set
phosphorus loading target for the watershed resulted in further reduction of the optimal
amount of poultry litter applied in the entire watershed at all phosphorus load levels. A
phosphorus deviation limit above target of not more than 4 tons per year reduced the
amount of litter applied as fertilizer to about 2 tons per year.
Estimated Total Quantity of Litter Applied as Fertilizer for the
Eucha-Spavinaw Watershed (tons/yr)
0
10000
20000
30000
40000
50000
40:1
0
40:8
40:6
40:4
40:2
35:1
0
35:8
35:6
35:4
35:2
30:1
0
30:8
30:6
30:4
30:2
25:1
0
25:8
25:6
25:4
20:1
0
20:8
20:6
20:4
Annual Phosphorus Runoff With Deviation limits
(tons/yr)
Am
ount of Litte
r A
pplie
d
(tons/y
r)
Quantity of Litter Applied as Fertilizer in Watershed (tons/yr)
Figure 2 Estimated quantity of litter applied in the Eucha-Spavinaw watershed
30
Estimated Total Quantity of Litter Shipped From Chicken Farm
Centroids in the Watershed To a Proposed Processing Plant at
Jay, Oklahoma (tons/yr)
0100002000030000400005000060000700008000090000
40:1
0
40:8
40:6
40:4
40:2
35:1
0
35:8
35:6
35:4
35:2
30:1
0
30:8
30:6
30:4
30:2
25:1
0
25:8
25:6
25:4
20:1
0
20:8
20:6
20:4
Annual Phosphorus Runoff Target With Deviation Limits (tons/yr)
Quantity
of Litte
r Ship
ped
(tons/ yr)
Quantity of Litter Shipped To Processing Plant (tons/yr)
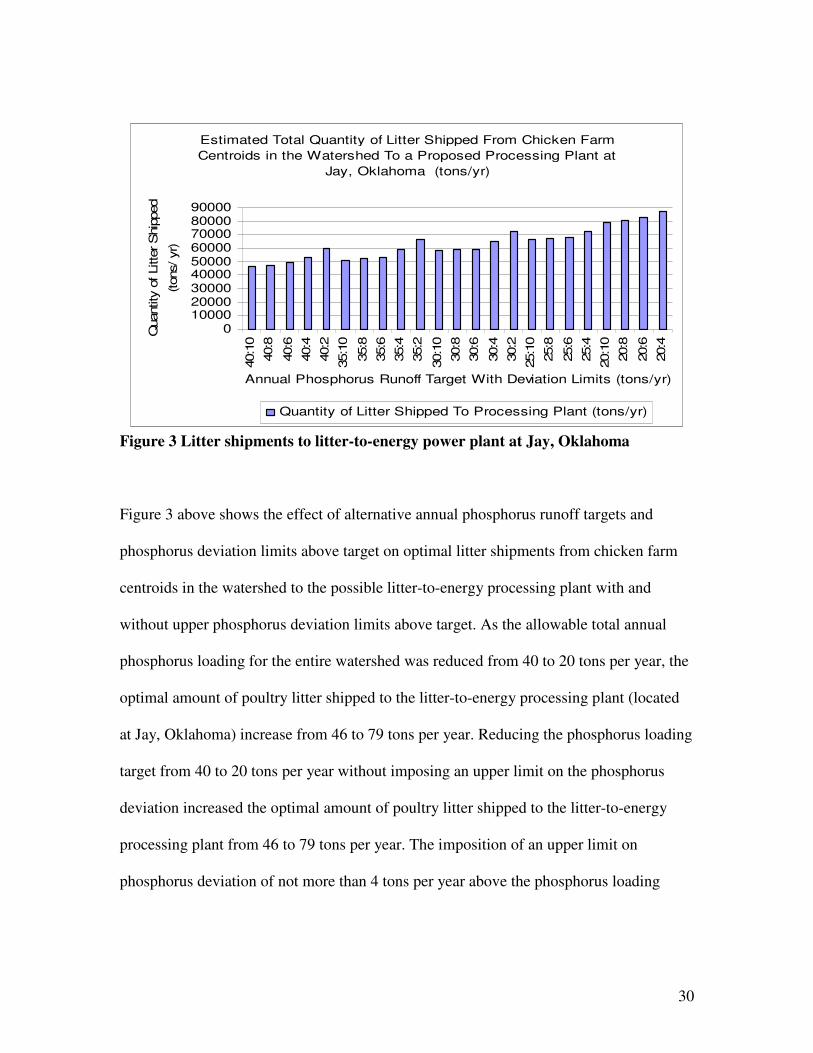
Figure 3 Litter shipments to litter-to-energy power plant at Jay, Oklahoma
Figure 3 above shows the effect of alternative annual phosphorus runoff targets and
phosphorus deviation limits above target on optimal litter shipments from chicken farm
centroids in the watershed to the possible litter-to-energy processing plant with and
without upper phosphorus deviation limits above target. As the allowable total annual
phosphorus loading for the entire watershed was reduced from 40 to 20 tons per year, the
optimal amount of poultry litter shipped to the litter-to-energy processing plant (located
at Jay, Oklahoma) increase from 46 to 79 tons per year. Reducing the phosphorus loading
target from 40 to 20 tons per year without imposing an upper limit on the phosphorus
deviation increased the optimal amount of poultry litter shipped to the litter-to-energy
processing plant from 46 to 79 tons per year. The imposition of an upper limit on
phosphorus deviation of not more than 4 tons per year above the phosphorus loading
31
target of 20 tons per year for the watershed resulted in further increases of the optimal
amount of poultry litter shipped to the processing plant to about 87 tons per year.
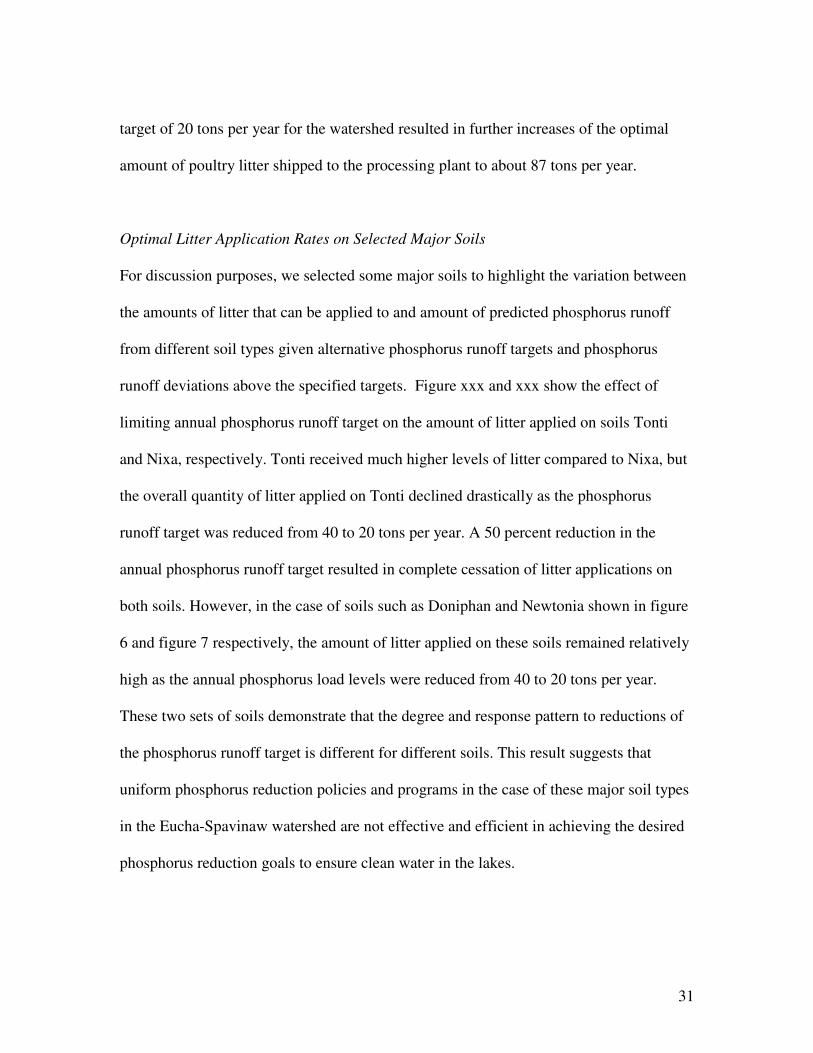
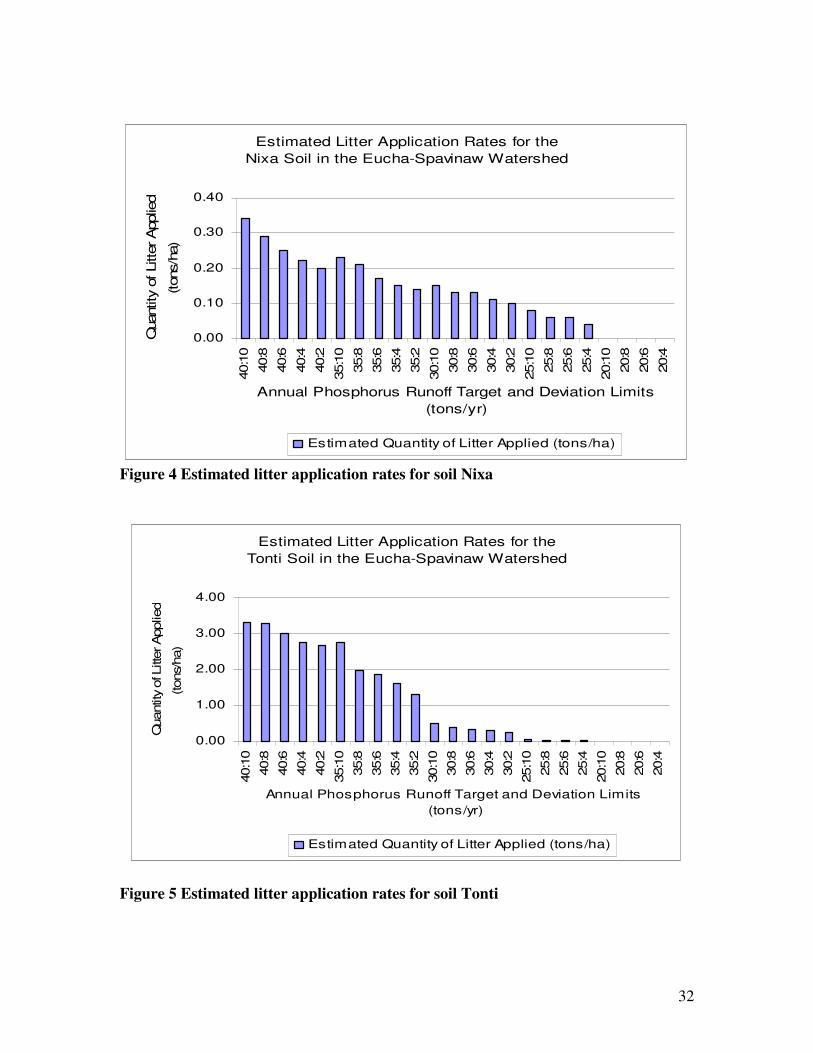
Optimal Litter Application Rates on Selected Major Soils
For discussion purposes, we selected some major soils to highlight the variation between
the amounts of litter that can be applied to and amount of predicted phosphorus runoff
from different soil types given alternative phosphorus runoff targets and phosphorus
runoff deviations above the specified targets. Figure xxx and xxx show the effect of
limiting annual phosphorus runoff target on the amount of litter applied on soils Tonti
and Nixa, respectively. Tonti received much higher levels of litter compared to Nixa, but
the overall quantity of litter applied on Tonti declined drastically as the phosphorus
runoff target was reduced from 40 to 20 tons per year. A 50 percent reduction in the
annual phosphorus runoff target resulted in complete cessation of litter applications on
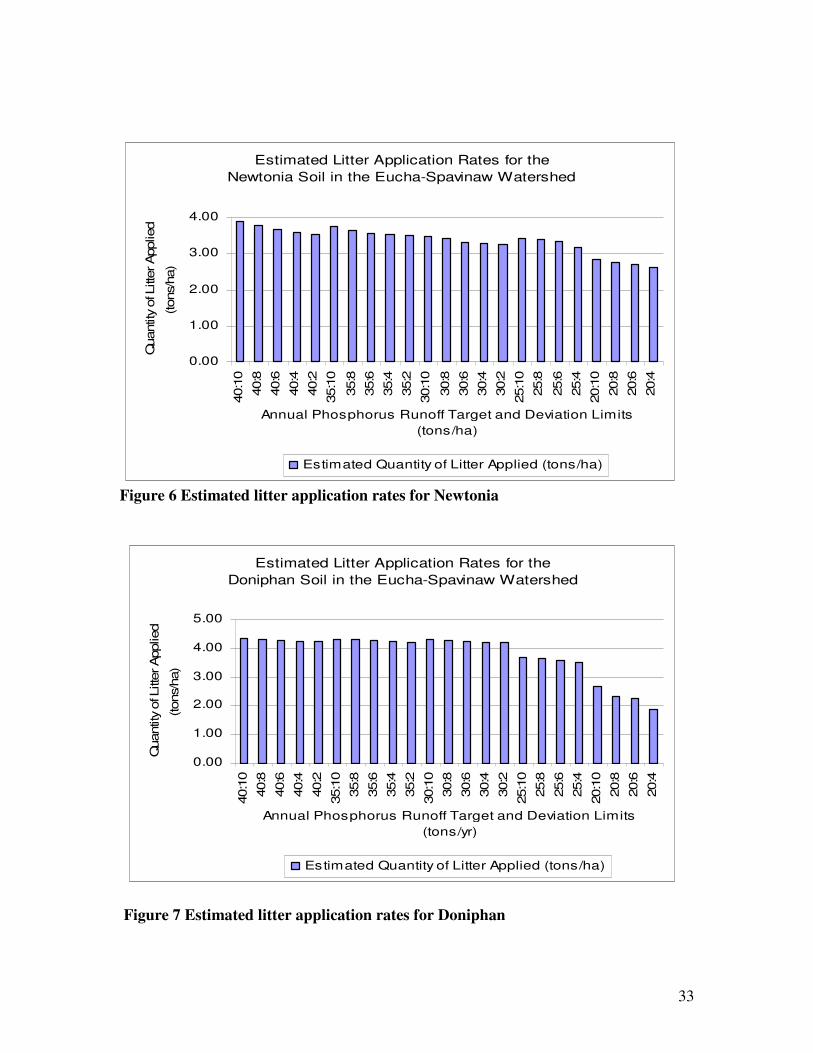
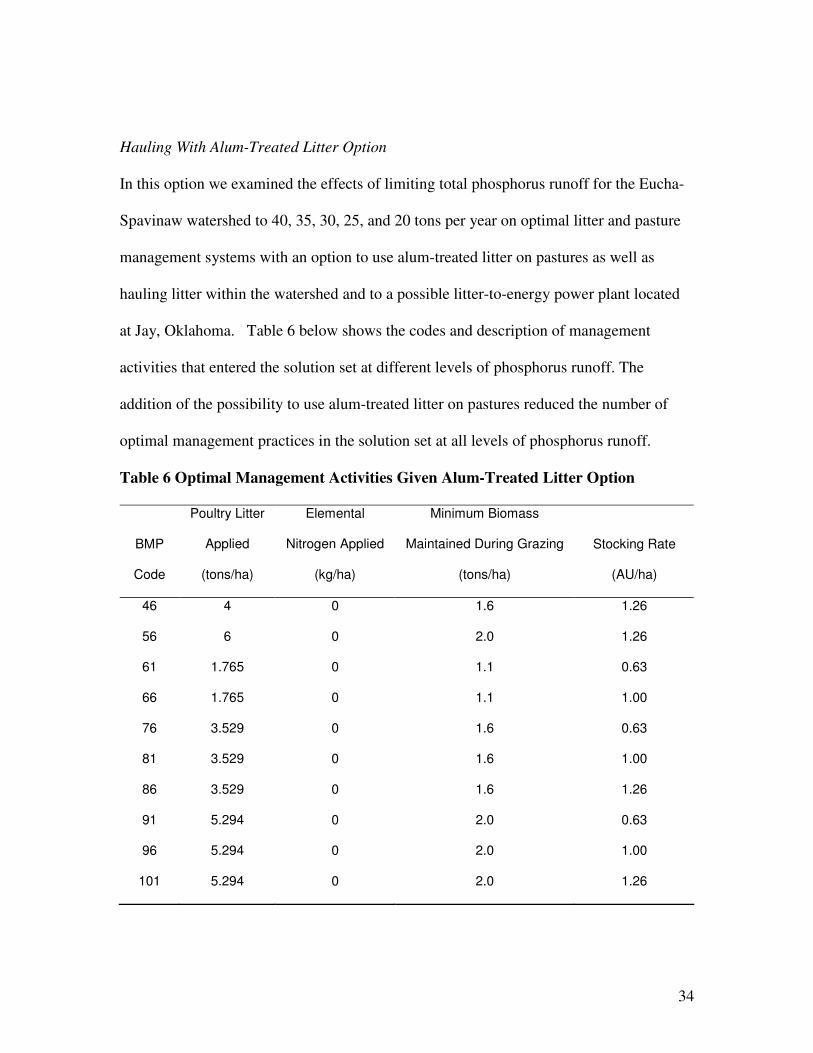
both soils. However, in the case of soils such as Doniphan and Newtonia shown in figure
6 and figure 7 respectively, the amount of litter applied on these soils remained relatively
high as the annual phosphorus load levels were reduced from 40 to 20 tons per year.
These two sets of soils demonstrate that the degree and response pattern to reductions of
the phosphorus runoff target is different for different soils. This result suggests that
uniform phosphorus reduction policies and programs in the case of these major soil types
in the Eucha-Spavinaw watershed are not effective and efficient in achieving the desired
phosphorus reduction goals to ensure clean water in the lakes.
32
Estimated Litter Application Rates for the
Nixa Soil in the Eucha-Spavinaw Watershed
0.00
0.10
0.20
0.30
0.40
40:1
0
40:8
40:6
40:4
40:2
35:1
0
35:8
35:6
35:4
35:2
30:1
0
30:8
30:6
30:4
30:2
25:1
0
25:8
25:6
25:4
20:1
0
20:8
20:6
20:4
Annual Phosphorus Runoff Target and Deviation Limits
(tons/yr)
Quantity
of Litte
r Applie
d
(tons/h
a)
Estimated Quantity of Litter Applied (tons/ha)
Figure 4 Estimated litter application rates for soil Nixa
Estimated Litter Application Rates for the
Tonti Soil in the Eucha-Spavinaw Watershed
0.00
1.00
2.00
3.00
4.00
40:1
0
40:8
40:6
40:4
40:2
35:1
0
35:8
35:6
35:4
35:2
30:1
0
30:8
30:6
30:4
30:2
25:1
0
25:8
25:6
25:4
20:1
0
20:8
20:6
20:4
Annual Phosphorus Runoff Target and Deviation Limits
(tons/yr)
Quantit
y of L
itte
r Applied
(tons/
ha)
Estimated Quantity of Litter Applied (tons/ha)
Figure 5 Estimated litter application rates for soil Tonti
33
Estimated Litter Application Rates for the
Newtonia Soil in the Eucha-Spavinaw Watershed
0.00
1.00
2.00
3.00
4.00
40:1
0
40:8
40:6
40:4
40:2
35:1
0
35:8
35:6
35:4
35:2
30:1
0
30:8
30:6
30:4
30:2
25:1
0
25:8
25:6
25:4
20:1
0
20:8
20:6
20:4
Annual Phosphorus Runoff Target and Deviation Limits
(tons/ha)
Quantit
y of L
itter Applied
(tons/
ha)
Estimated Quantity of Litter Applied (tons/ha)
Figure 6 Estimated litter application rates for Newtonia
Estimated Litter Application Rates for the
Doniphan Soil in the Eucha-Spavinaw Watershed
0.00
1.00
2.00
3.00
4.00
5.00
40:1
0
40:8
40:6
40:4
40:2
35:1
0
35:8
35:6
35:4
35:2
30:1
0
30:8
30:6
30:4
30:2
25:1
0
25:8
25:6
25:4
20:1
0
20:8
20:6
20:4
Annual Phosphorus Runoff Target and Deviation Limits
(tons/yr)
Quantit
y of L
itte
r Applied
(tons/
ha)
Estimated Quantity of Litter Applied (tons/ha)
Figure 7 Estimated litter application rates for Doniphan
34
Hauling With Alum-Treated Litter Option
In this option we examined the effects of limiting total phosphorus runoff for the Eucha-
Spavinaw watershed to 40, 35, 30, 25, and 20 tons per year on optimal litter and pasture
management systems with an option to use alum-treated litter on pastures as well as
hauling litter within the watershed and to a possible litter-to-energy power plant located
at Jay, Oklahoma. Table 6 below shows the codes and description of management
activities that entered the solution set at different levels of phosphorus runoff. The
addition of the possibility to use alum-treated litter on pastures reduced the number of
optimal management practices in the solution set at all levels of phosphorus runoff.
Table 6 Optimal Management Activities Given Alum-Treated Litter Option
BMP
Code
Poultry Litter
Applied
(tons/ha)
Elemental
Nitrogen Applied
(kg/ha)
Minimum Biomass
Maintained During Grazing
(tons/ha)
Stocking Rate
(AU/ha)
46 4 0 1.6 1.26
56 6 0 2.0 1.26
61 1.765 0 1.1 0.63
66 1.765 0 1.1 1.00
76 3.529 0 1.6 0.63
81 3.529 0 1.6 1.00
86 3.529 0 1.6 1.26
91 5.294 0 2.0 0.63
96 5.294 0 2.0 1.00
101 5.294 0 2.0 1.26

35
No commercial nitrogen was applied to pastures in this scenario. Poultry litter was
applied to pastures at levels consistent with meeting the nitrogen requirement of the crop.
There are only 2 pasture management systems in the solution set (codes 46 and 56) that
do not involve the use of alum-treated poultry litter. Table 7, table 8, and table 9 show the
range of pasture management practices that entered the solution when the annual
phosphorus runoff was limited to 40, 30, and 20 tons per year, with phosphorus deviation
limits above target varied from 10 to 2 tons per year. When the phosphorus runoff is
limited to 40 tons per year, 21000 ha of land is allocated to pasture that receives 4 tons of
untreated litter per ha, stocked at 1.26 AU/ha and the biomass maintained during grazing
is 1600kg/ha. Approximately 15000 ha of pasture will be allocated to management 96.
This BMP recommends application of alum-treated poultry litter at the rate of about 5
tons per ha, with cattle put on pasture at the stocking rate of 1.00 AU/ha. Biomass
maintained during grazing is estimated at 2000kg/ha. However, as the phosphorus runoff
limit is reduced to 20 tons per year, more land is moved out of management 46 and 56
(both use untreated litter) and allocated largely to management systems 96, 81 and 66 in
that order. All these three management systems that come into the solution set
recommend the use of alum-treated litter, maintaining at least 1600kg/ha of biomass
during grazing and a stocking rate of 1.00 AU/ha. The option of using alum-treated
poultry litter on pastures lead to complete cessation of litter shipments from the
watershed to the possible litter-to-energy power plant in Jay, Oklahoma.

36
Table 7 Land Allocation (ha) By BMP When Phosphorus Limit is 40 Mg Per Year
Annual Phosphorus Runoff and Deviation Limits Above Target
Assigned BMP 40:10 40:08 40:06 40:04 40:02
46 20774 18873 14027 12009 4583
56 5473 6173 4954 3020 1025
61
66 58
76 350
81 1303 11715
86 53
91 316 1174 21029
96 15208 16797 22833 23951 21029
101 1647 1611 1689 1445 3394
Table 8 Land Allocation (ha) By BMP When Phosphorus Limit is 30 Mg Per Year
Annual Phosphorus Runoff and Deviation Limits Above Target
Assigned BMP 30:10 30:08 30:06 30:04 30:02
46 14724 14724 10012 7314 71
56 1284 1284 1821 720 176
61 350
66 1433
76 125 797
81 36 36 34 1468 21696
86 32 1799
91 316 1050 226
96 24270 24270 27862 29607 16291
101 2739 2739 3144 2908 108

37
Table 9 Land Allocation (ha) By BMP When Phosphorus Limit is 20 Mg Per Year
Assigned BMP 20:10 20:08 20:06 20:04 20:02
46 1676 1676 1676 402
56 375 375 375 283
61 7 7 7 7
66 58 20679
76 176 176 176 125
81 9258 9258 9258 10396 17852
86 848 848 848 1702
91 647 647 647 1277
96 29682 29682 29682 28191 4605
101 252 252 252 595
Predicted Phosphorus Runoff
05000
10000
15000200002500030000
3500040000
40:1
040:8
40:6
40:4
40:2
35:1
035:8
35:6
35:4
35:2
30:1
030:8
30:6
30:4
30:2
25:1
025:8
25:6
25:4
25:2
20:1
020:8
20:6
20:4
20:2
Annual Phosphorus Runoff Target With Deviation Limits
(tons/yr)
Pre
dic
ted P
hosphoru
s R
unoff
(kg/y
r)
Predicted Phosphorus Runoff (kg/yr)
Figure 8 Predicted annual phosphorus runoff from pastures

38
Figure 8 shows that phosphorus pollution in the watershed can be reduced to levels below
the set annual phosphorus runoff when the alum-treated poultry litter option is
considered. Significant reductions in phosphorus runoff were achieved by varying
expected phosphorus deviation above target at each phosphorus level without reducing
the annual phosphorus runoff target. As the phosphorus load limit was reduced from 40
to 20 tons per year, predicted phosphorus runoff from pastures declined from 40 to 12.5
tons per year. Phosphorus runoff levels well below the expected annual phosphorus
runoff target were obtained by varying only the phosphorus deviation limits above the
specified target. Phosphorus runoff levels from all soil types in the watershed
significantly declined when alum-treated litter was used on pastures. Tonti and Nixa still
produced the least amount of phosphorus runoff whereas levels from Doniphan and
Clarksville soils remained relatively higher.
Total Agricultural Income From Grazing for the
Eucha-Spavinaw Watershed
0
500000
1000000
1500000
2000000
2500000
3000000
40:1
0
40:8
40:6
40:4
40:2
35:1
0
35:8
35:6
35:4
35:2
30:1
0
30:8
30:6
30:4
30:2
25:1
0
25:8
25:6
25:4
25:2
20:1
0
20:8
20:6
20:4
20:2
Annual Phosphorus Runoff Target With Deviation Limit
(tons/yr)
Incom
e
($/y
r)
Total Agricultural Income From Grazing ($/yr)
Figure 9 Estimated total producer income from grazing in the watershed
39
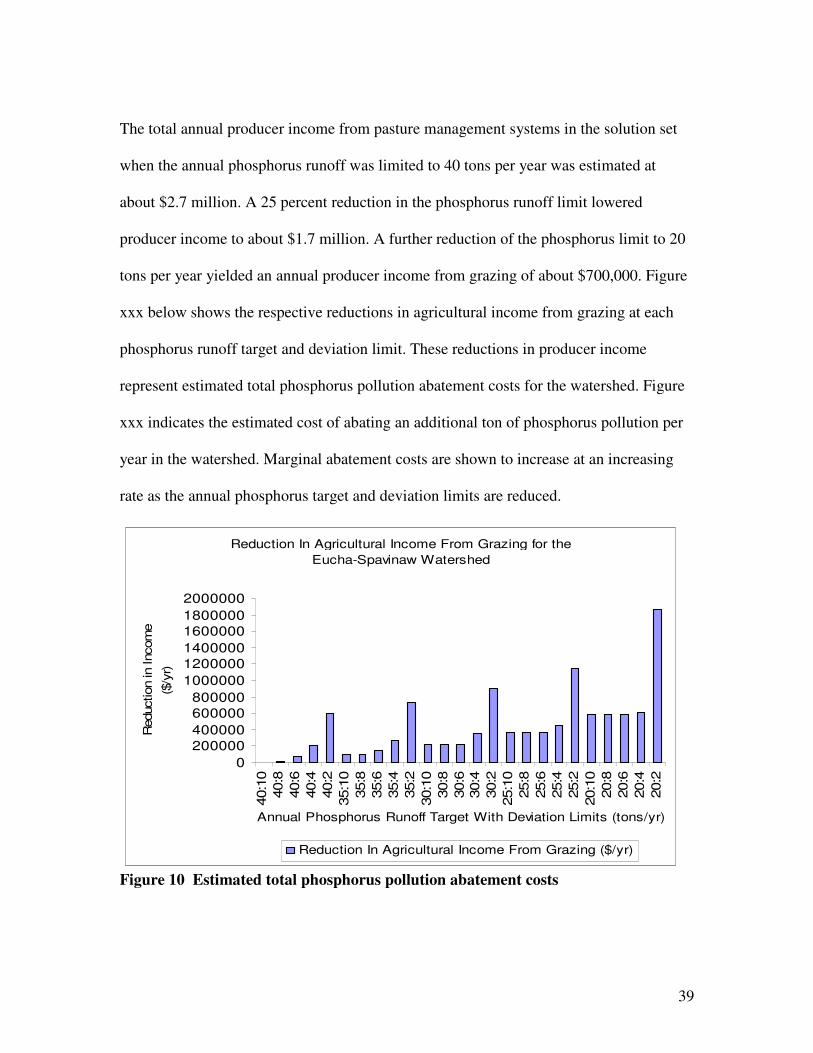
The total annual producer income from pasture management systems in the solution set
when the annual phosphorus runoff was limited to 40 tons per year was estimated at
about $2.7 million. A 25 percent reduction in the phosphorus runoff limit lowered
producer income to about $1.7 million. A further reduction of the phosphorus limit to 20
tons per year yielded an annual producer income from grazing of about $700,000. Figure
xxx below shows the respective reductions in agricultural income from grazing at each
phosphorus runoff target and deviation limit. These reductions in producer income
represent estimated total phosphorus pollution abatement costs for the watershed. Figure
xxx indicates the estimated cost of abating an additional ton of phosphorus pollution per
year in the watershed. Marginal abatement costs are shown to increase at an increasing
rate as the annual phosphorus target and deviation limits are reduced.
Reduction In Agricultural Income From Grazing for the
Eucha-Spavinaw Watershed
0
200000400000
600000800000
1000000
12000001400000
16000001800000
2000000
40:1
0
40:8
40:6
40:4
40:2
35:1
0
35:8
35:6
35:4
35:2
30:1
0
30:8
30:6
30:4
30:2
25:1
0
25:8
25:6
25:4
25:2
20:1
0
20:8
20:6
20:4
20:2
Annual Phosphorus Runoff Target With Deviation Limits (tons/yr)
Reduction in Incom
e
($/y
r)
Reduction In Agricultural Income From Grazing ($/yr)
Figure 10 Estimated total phosphorus pollution abatement costs

40
24
68
10
40
35
30
25
20
3872
132
5959
59
987
10636
3636
582
10245
2626
450
9546
2121
390
8844
3219
0
1000
2000
3000
4000
Abate
ment C
osts
($/h
a)
Deviation Above Mean (tons/yr)
Mean Annual Phosphorus
Runoff
(tons/yr)
Costs of Reducing Mean and Deviation of Phosphorus Runoff for the
Eucha-Spavinaw Watershed
40 35 30 25 20
Figure 11 Estimated marginal phosphorus pollution abatement costs Table10 below presents the estimates of fixed effects parameters of the mixed linear
model fitted to the panel data considered in this article. The parameter estimates have
been sorted in descending order to show to relative contribution of each explanatory
variable to phosphorus runoff in the Eucha-Spavinaw watershed. All the “effects” shown
in italics have regression coefficients that are significantly different from zero at the 5%
significance level. This means a change in any of these variables will have a statistically
significant impact on the amount of phosphorus loss from pastures in the watershed. Only
13 of the 24 soil types have a statistically significant effect on phosphorus runoff in the
watershed. Britwater, Razort, Clarksville, Captina, Secesh and Healing contribute more
to phosphorus pollution. It is estimated that putting one more hectare of Britwater under

41
pasture will increase phosphorus loss by 3 kg per hectare. When the stocking rate
increases by 1AU / ha, phosphorus runoff will increase by about 24kg/ha.
Table 10. Fixed Effects Parameters of the Mixed Linear Model
Effect Estimate Standard Error t Value Pr>|t|
Intercept -47.8379 5.0665 -9.44 <.0001
Britwater 3.0772 1.3424 2.29 0.0219
Razort 2.3981 1.1362 2.11 0.0348
Clarksville 2.0253 0.9638 2.10 0.0356
Captina 1.6864 0.4134 4.08 <.0001
Secesh 1.4292 0.7230 1.98 0.0481
Healing 1.4078 0.4822 2.92 0.0035
Cherokee 1.3653 0.7232 1.89 0.0590
Noark 1.3210 0.6886 1.92 0.0551
Nixa 1.0697 0.6202 1.72 0.0846
Macedonia 0.9691 0.3104 3.12 0.0018
Peridge 0.8471 0.2761 3.07 0.0022
Tonti 0.7468 0.4137 1.81 0.0711
Stigler 0.6987 0.1757 3.98 <.0001
Doniphan 0.2024 0.1395 1.45 0.1467
Jay 0.1896 0.2092 0.91 0.3648
Eldorado 0.1441 0.0202 7.15 <.0001
Taloka 0.1133 0.1100 1.03 0.3033
Elsah 0.0615 0.1052 0.58 0.5590
Hector -0.1190 0.4494 -0.26 0.7912
Newtonia -0.2618 0.1368 -1.89 0.0593
Linker -0.6358 0.2075 -3.06 0.0022
Carytown -1.4204 0.3809 -3.73 0.0020
Mountainburg -2.0916 0.7242 -2.89 0.0039
Waben 0.0000 . . .
StkRate 24.3077 0.0599 405.54 <.0001
LagPloss 0.1355 0.0026 52.74 <.0001
CurV 0.0294 0.0018 16.05 <.0001
BmMin 0.0216 0.0026 8.27 <.0001
RKLS -0.0745 0.0344 -2.16 0.0305
Papl -0.0751 0.0138 -5.44 <.0001
Napl -0.1101 0.0050 -21.85 <.0001
42
Conclusion
This article demonstrates that integrated environmental-economic modeling approach,
that combines the use of the SWAT model and mathematical programming can be used to
assess the impact of current and alternative farming practices on water quality in the
Eucha-Spavinaw watershed. This decision-support tool can be used to assist
policymakers in their strategic phosphorus loss reduction and water quality improvement
decisions and in setting realistic and efficient Total Maximum Daily Loads (TMDLs).
There is no single management practice that dominates in all parts of the watershed. The
economic optimization model assigned various site-specific pasture management systems
and litter allocations on the basis of relevant environmental and economic factors in that
part of the watershed. The environmental-economic optimization model shows that least
cost abatement policies may differ significantly from and be much less costly than the
imposition of uniform restrictions. The econometric model determined that only about
half of the soil types in the Eucha-Spavinaw watershed contribute significantly to the
phosphorus runoff and water quality problem in the area. Britwater, Razort, Clarksville,
Captina, Secesh and Healing contribute more to phosphorus pollution than any other soil
found in the area. The phosphorus runoff problem gets even worse when pastures on
these soils are heavily grazed at stocking rates exceeding 1 AU/ha and the plant biomass
maintained during grazing is lower than 1600kg/ha. The use of alum-treated poultry litter
43
appears to be a very effective phosphorus runoff reduction strategy even at high
phosphorus loss limits for the watershed. As the phosphorus loss limits were reduced, the
pasture management practices that were adopted included those that encourage the use of
alum-treated litter to meet the nitrogen requirement for the crop as well as lowering
stocking rates on the pastures and retained higher levels of biomass during grazing.
The other soils that do not significantly contribute to phosphorus runoff received higher
optimal litter application rates compared to the set of soils specified above. On the other
hand, complete elimination of all fertilizer was found to actually increase total
phosphorus loss on some soils because of increased erosion and sediment bound
phosphorus. These results show that optimal poultry litter application rates can vary from
one soil type to another within the watershed. This implies that it may be more cost
effective to develop phosphorus reduction programs that target specific soil types within
the watershed rather than continue with the current uniform policy of limiting litter
application rates strictly by soil test phosphorus. The possible litter-to-energy plant does
not appear to be a viable option when producers have an incentive to use alum-treated
poultry as fertilizer. However, when the alum-treatment option is removed from the
model, the litter-to-energy power plant located at Jay, Oklahoma becomes a more cost
effective method of reducing both the level and the variability of phosphorus runoff as
pollution limits for the Eucha-Spavinaw watershed are reduced.
44
References Cestti, R., J. Srivastava and S. Jung. “Agriculture Non-Point Source Pollution Control:
Good Management Practices- The Chesapeake Bay Experience.” World Bank Working Paper No. 7, World Bank, Washington DC, 2003.
Freeman, A.M., R.M. Haveman, and A.V. Kneese. “The Economics of Environmental
Policy”, New york: Wiley Publishers, 1973. Moore, P. A., T.C. Daniel and D. R. Edwards.”Reducing Phosphorus Runoff and
improving Poultry Production with Alum.” Poultry Science, 78(1999):692-698. Oklahoma Water Resources Board (OWRB). “Water Quality Evaluation of the Eucha /
Spavinaw Lake System- Final Report.” Oklahoma City, Oklahoma, 2002.
Oklahoma Department of Environmental Quality (ODEQ). “Water Quality Assessment
Integrated Report”, Oklahoma City, Oklahoma, 2004. Oklahoma Water Resources Board (OWRB) and City of Tulsa. “Justification For Total
Phosphorus Criteria to Protect Public and Private Water Supply Beneficial Use and Aesthetics Use of Lake Eucha and Spavinaw Lake”, Oklahoma City, Oklahoma, 2006.
Qui, Z., T. Prato, and M. Kaylen. “Watershed-Scale Economic and Environmental
Tradeoffs Incorporating Risks: A Target MOTAD Approach.” Agricultural and
Resource Economics Review 27 (1998): 231-240.
Sterner, T. “Policy Instruments for Environmental and Natural Resource Management”,Resources for the Future. Washington, D. C., 2003
Storm, D.E., A.L. Stoecker, T. Ancev, and M.J. White. “Evaluating Cost effectiveTechnologies to Reduce Phosphorus Loading to Surface Waters for the Ozark Region.” Final Report to Water Resources Institute, Oklahoma State University and United State Geological Survey, June 2003.

45
Teague, M. L., Bernardo, D.J. and Mapp, H.P. “Farm-Level Economic Analysis
Incorporating Stochastic Environmental Risk Assessment, American Journal of
Agricultural Economics 77 (1995): 8-19 Tietenberg, T. “Environmental and Natural Resource Economics.” 5th Ed., Addison
Wesley, New York, NY, 2000.
United States Environmental Protection Agency (USEPA), Office of Water Quality. “Water Quality Trading Policy.” Washington DC, 2003.