Embed Size (px)
Citation preview
R.J. Vonk B AS
5897041
Universiteit van Amsterdam
27 mei 2011
Determination of glycosaminoglycans in human
serumDevelopment of a method for the size‐characterization of glycosaminoglycans
R.J. VONK
2
DDeetteerrmmiinnaattiioonn ooff ggllyyccoossaammiinnooggllyyccaannss iinn
hhuummaann sseerruumm
DDeevveellooppmmeenntt ooff aa mmeetthhoodd ffoorr tthhee ssiizzee--cchhaarraacctteerriizzaattiioonn ooff ggllyyccoossaammiinnooggllyyccaannss
RRuuddyy VVoonnkk
Master of Science Analytical Chemistry track Universiteit van Amsterdam Name : R.J. Vonk B AS Student number : 5897041 Research period : October 2010 - April 2011 Supervisors : Dr. W. Th. Kok : R.N. Qureshi MSc
Figure 1: Front page; 4D-structure of polysaccharide hyaluronan. Reprinted from http://www.conformetrix.com
R.J. VONK
3
Tabel of contents
Samenvatting ................................................................................................5
Summary .......................................................................................................6
Abbreviations................................................................................................7
1 Introduction............................................................................................8
2 Glycosaminoglycans...........................................................................10
2.1 The structure of glycosaminoglycans .................................................. 10
2.2 Glycosaminoglycans disturbance in diseases ..................................... 12
3 Analytical methods..............................................................................14
3.1 AsFlFFF-UV-MALS-DRI....................................................................... 15
3.2 RP-HPLC-fluorescence........................................................................ 17
3.3 Pyrolysis-GC/MS.................................................................................. 18
4 Experimental ........................................................................................19
4.1 Chemicals ............................................................................................ 19
4.2 Apparatus............................................................................................. 20
4.3 Method optimization............................................................................. 20
4.3.1 Deproteination of serum samples .................................................. 20 4.3.2 AsFlFFF-MALS-DRI method .......................................................... 21 4.3.3 Enzymatic cleavage ....................................................................... 21 4.3.4 Derivatization with AMAC............................................................... 21 4.3.5 RP-HPLC method........................................................................... 22 4.3.6 Pyrolysis-GC/MS............................................................................ 22
5 Results and discussion.......................................................................23
5.1 Method optimization............................................................................. 23
5.1.1 Deproteination of serum samples .................................................. 23 5.1.2 AsFlFFF-MALS-DRI method .......................................................... 25 5.1.3 Enzymatic cleavage ....................................................................... 29 5.1.4 Derivatization with AMAC............................................................... 31 5.1.5 RP-HPLC method........................................................................... 33 5.1.6 Pyrolysis -GC/MS........................................................................... 35
5.2 Sample preparation overview after optimizing method........................ 35
5.3 Analysis of serum samples .................................................................. 36
R.J. VONK
4
6 Conclusions .........................................................................................37
6.1 Current method .................................................................................... 37
6.2 Recommendation for future work......................................................... 37
7 Literature ..............................................................................................40
Appendix A: AsFlFFF method....................................................................44
Appendix B: RP-HPLC-FLR method..........................................................45
Appendix C: Pyrolysis-GC/MS method .....................................................46
Appendix D: Major project proposal .........................................................47
Acknowledgements / Dankwoord..............................................................49
R.J. VONK
5
Samenvatting
Dit verslag heb ik geschreven naar aanleiding van mijn Research project aan het
einde van de Master of Chemistry met Analytical Science als specialisatie. Deze
Master of Chemistry heb ik gevolgd aan de UvA en de VU in de periode van
september 2008 t/m mei 2011. Dit project is uitgevoerd bij de Analytical
Chemistry groep van de afdeling HIMS aan de UvA onder begeleiding van Dr. W.
Th. Kok.
Tijdens dit project heb ik geprobeerd om een analytische methode op te zetten
voor het bepalen van de grootte en het kwantificeren van polysacchariden in
menselijk bloed. Evenals de grootte van de polysacchariden veranderen ook de
gehalten van deze polysacchariden in het bloed bij patiënten met verschillende
ziekten. De grootte in combinatie met het gehalte kunnen gebruikt worden als
diagnostische tool voor het juist behandelen van patiënten. Om deze
vraagstelling te beantwoorden is er gebruik gemaakt van een Asymmetric Flow-
Flied Flow Fractionation (AsFlFFF) off-line gecombineerd met HPLC-
fluorescentie detectie.
Bij AsFlFFF worden de moleculen geïnjecteerd in een vloeistofstroom. De
AsFlFFF techniek scheidt macromoleculen (>10kDa) door middel van het
toepassen van een kracht loodrecht op de vloeistof stroom (in dit geval een
andere vloeistofstroom). Door deze kracht worden grote moleculen meer
vertraagd dan kleinere moleculen en elueren dus later uit het systeem.
Vervolgens worden, in de opgevangen AsFlFFF fracties, de gehalten van de
polysacchariden bepaald d.m.v. HPLC fluorescentie. De polysacchariden uit de
fracties kunnen niet direct geïnjecteerd worden op de HPLC. Door enzymen
worden de polysacchariden omgezet in disacchariden. Deze disacchariden zelf
geven geen signaal op een fluorescentie detector en daarvoor moeten deze
disacchariden eerst gederivatiseerd worden met een fluorescent actief label.
Tijdens dit project zijn de verschillende enzymatische stappen, de derivatisatie
reactie en de HPLC methode geoptimaliseerd voor een lagere detectielimiet en
een betere omzetting van polysacchariden naar disacchariden.
Al met al een leuk en uitdagend project waarvan ik heb geleerd hoe het is om met
weinig geld en veel tijd een leuk project te kunnen uitvoeren, dit in tegenstelling
tot mijn vorige werk bij Abbott Healthcare BV waar het juist andersom was.

R.J. VONK
6
Summary
In this current research thesis the method development for the size-
characterization and quantification of glycosaminoglycans (GAGs) in human
blood serum will be described.
The separation between serum proteins (BSA) and hyaluronan (HA) on an
asymmetric flow field-flow fractionation (AsFlFFF) has been achieved using
standard solutions. The MW distribution of HA standard was in the range of
120kDa to 3.2MDa. In the collected AsFlFFF-fractions the concentration of HA
was determined with a recovery of 18±9%. Baseline separation between HA and
multiple other GAGs had been achieved on a RP-HPLC-FLR method. The limit of
decision for HA was 20ng/mL. With the achieved limit of decision measurement of
HA in human serum should be possible. Although the limit of decision was low
enough for determination of HA in serum samples, HA could not be quantified in
serum samples so far.
R.J. VONK
7
Abbreviations
ACN acetonitril
AMAC 2-aminoacridone
AsFlFFF asymmetric flow-field flow fractionation
BSA bovine serum albumin
cIMT cardio intima-media thickness
CS chondroitin sulfate
ΔDi disaccharide unit
DRI refractive index detector
DS dermatan sulfate
Fch detector flow
Fcr cross flow
FLR fluorescence detection
GAGs glycosaminoglycans
Gal β-D-galactose
GalNAc N-acetyl-D-galactosamine
GlcA β-D-glucuronic acid
GlcNAc N-acetyl-D-glucosamine
HA hyaluronan
HPLC high performance liquid chromatography
HS heparin sulphate
IdoA α-D-iduronic acid
KS keratan sulfate
MALS multi angle light scattering
MS mass spectrometry
MW molecular weight
NaAce sodium acetate
PB phosphate buffer
PBS phosphate buffer containing saline
Py-GC/MS pyrolysis gas chromatography coupled to mass spectrometry
SEC size exclusion chromatography
TMAH tetramethylammonium hydroxide
TRIS-Cl tris(hydroxymethyl)aminomethane hydrochloride
UV ultra violet absorbance detector

R.J. VONK
8
1 Introduction
The blood vessel wall is covered with glycocalyx which forms a gel-like
endothelial lining [01]. Glycoproteins and proteoglycans are the building blocks
for these glycocalyx. Some glycoproteins and proteoglycans are membrane-
bound and some are soluble molecules [02]. Proteoglycans consist of a core
protein (such as syndecans and glypicans) which in turn is the backbone for
unbranched polysaccharide chains called glycosaminoglycans (GAGs) [01-02].
One GAG, named hyaluronic acid / hyaluronan [03] (HA), is not connected to the
proteoglycan backbone but is synthesized in the glycocalyx matrix [04]. More
than one GAG can bind to the core protein [02]. The endothelial glycocalyx is
important in the vascular integrity and permeability [01-02] and repels red blood
cells from the endothelium [02]. More details about the endothelial glycogalyx can
be found in review articles from Broekhuizen et al. [01] and Reitsma et al. [02].
Figure 2 visualizes the complete network of the glycocalyx, proteoglycans and
GAG.
Figure 2: Schematic representation of the endothelial glycocalyx, showing its main components. Left: The endothelial glycocalyx located on the luminal side of the
vascular endothelium. Right: Components of the endothelial glycocalyx. Incorporated in and on top of this grid are plasma and endothelium-derived soluble components, including HA and other soluble proteoglycans. Note that this figure is not drawn to scale; its purpose is to illustrate glycocalyx composition. This figure and legend are
reprinted from Reitsma et al. [02]
hyaluronan
R.J. VONK
9
GAGs are linear, unbranched, polysaccharides of a repeating disaccharide [05].
Based on the structure GAGs can be subdivided into four groups, namely
hyaluronan (HA), chondroitin sulfate (CS) / dermatan sulfate (DS), keratan sulfate
(KS) and heparin / heparan sulfate (HS) [06].
Disturbance of the molecular weight (MW) and plasma levels of the GAGs have
been related to diseases such as Rheumatoid arthritis [07-08]. In this disease the
change in MW distribution in combination with the plasma levels of the GAGs can
be used as a biomarker or diagnostic tool [09]. Therefore, the focus of this project
will be the development of a sensitive method for size-characterization and
quantification of GAGs in human blood serum samples. In order to develop this
method a novel approach for off-line combination of Asymmetric Flow-Field Flow
Fractionation combined with Ultra Violet absorbance detector, Multi Angle Light
Scattering, and Refractive Index detection (AsFlFFF-UV-MALS-DRI) and High
Performance Liquid Chromatography combined with Fluorescence detection
(HPLC-FLR) was investigated. Furthermore, Pyrolysis Gas Chromatography
coupled to a mass spectrometry (Py-GC/MS) will be investigated as alternative
for the HPLC-FLR method with the purpose of simplifying the sample preparation.
To measure GAGs in serum samples the following sample preparation steps
have been investigated:
deproteination of serum samples
size-based separation of the GAGs on the AsFlFFF
enzymatic cleavage of polysaccharides into disaccharide units
derivatization of disaccharides with a fluorescent label
the conditions of the RP-HPLC method
the interpretation of the Py-GC/MS data of the GAGs
The next chapter will give more information about the individual GAGs and their
structural properties. The analytical tools that were used are explained in chapter
3. In chapter 4 the details of the experiments performed are described and in
chapter 5 the results and discussion are given. Chapter 6 gives the conclusions
and recommendations for future work.
R.J. VONK
10
2 Glycosaminoglycans
Synthesis routes and location of the different GAGs in the human body are
different. CS, DS and HS are synthesized in the Golgi apparatus and are bound
via a tetrasaccharide to the proteoglycan backbone [04,10]. HA on the other hand
is synthesized in the extracellular glycocalyx matrix and is not bound to the
proteoglycan backbone [04]. The structural differences and the role of the
different GAGs will be explained briefly.
2.1 The structure of glycosaminoglycans
The main structure of all the GAGs is basically the same. The building blocks are
disaccharide units which consist of a hexosamine unit and a hexuronic acid
[05,10]. This second sugar unit is a galactose unit for KS [05].
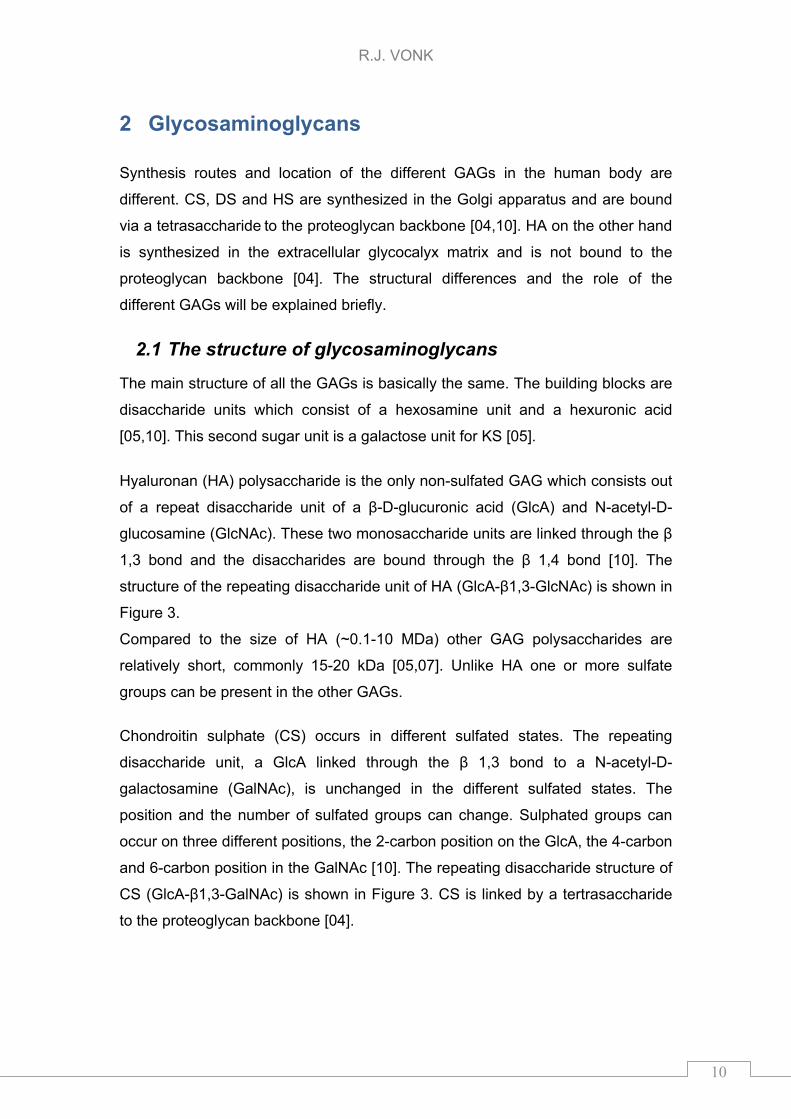
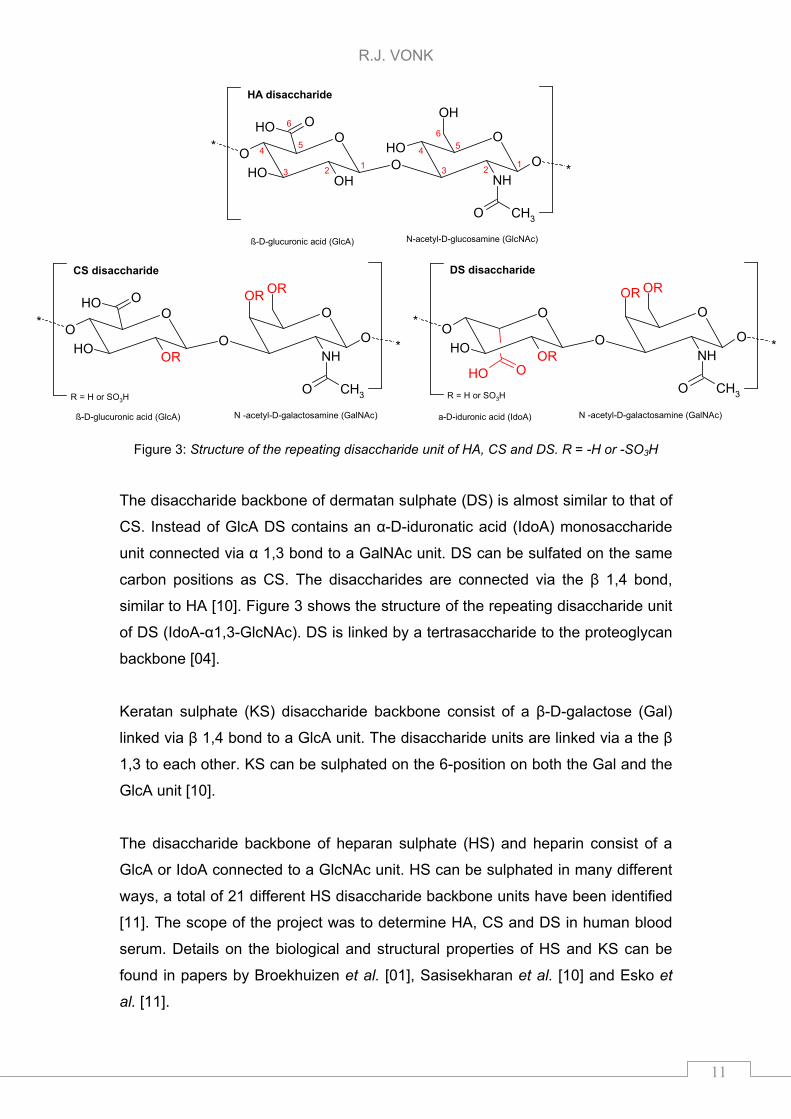
Hyaluronan (HA) polysaccharide is the only non-sulfated GAG which consists out
of a repeat disaccharide unit of a β-D-glucuronic acid (GlcA) and N-acetyl-D-
glucosamine (GlcNAc). These two monosaccharide units are linked through the β
1,3 bond and the disaccharides are bound through the β 1,4 bond [10]. The
structure of the repeating disaccharide unit of HA (GlcA-β1,3-GlcNAc) is shown in
Figure 3.
Compared to the size of HA (~0.1-10 MDa) other GAG polysaccharides are
relatively short, commonly 15-20 kDa [05,07]. Unlike HA one or more sulfate
groups can be present in the other GAGs.
Chondroitin sulphate (CS) occurs in different sulfated states. The repeating
disaccharide unit, a GlcA linked through the β 1,3 bond to a N-acetyl-D-
galactosamine (GalNAc), is unchanged in the different sulfated states. The
position and the number of sulfated groups can change. Sulphated groups can
occur on three different positions, the 2-carbon position on the GlcA, the 4-carbon
and 6-carbon position in the GalNAc [10]. The repeating disaccharide structure of
CS (GlcA-β1,3-GalNAc) is shown in Figure 3. CS is linked by a tertrasaccharide
to the proteoglycan backbone [04].
.
R.J. VONK
11
O
O
OO
OR
OHOR
OR
O*
*
NH
O CH3
OOH
ß-D-glucuronic acid (GlcA) N -acetyl-D-galactosamine (GalNAc)
CS disaccharide
R = H or SO3H
O
O
OO
OR
OHOR
OR
O*
*
NH
O CH3
OOH
DS disaccharide
N -acetyl-D-galactosamine (GalNAc)a-D-iduronic acid (IdoA)
R = H or SO3H
Figure 3: Structure of the repeating disaccharide unit of HA, CS and DS. R = -H or -SO3H
The disaccharide backbone of dermatan sulphate (DS) is almost similar to that of
CS. Instead of GlcA DS contains an α-D-iduronatic acid (IdoA) monosaccharide
unit connected via α 1,3 bond to a GalNAc unit. DS can be sulfated on the same
carbon positions as CS. The disaccharides are connected via the β 1,4 bond,
similar to HA [10]. Figure 3 shows the structure of the repeating disaccharide unit
of DS (IdoA-α1,3-GlcNAc). DS is linked by a tertrasaccharide to the proteoglycan
backbone [04].
Keratan sulphate (KS) disaccharide backbone consist of a β-D-galactose (Gal)
linked via β 1,4 bond to a GlcA unit. The disaccharide units are linked via a the β
1,3 to each other. KS can be sulphated on the 6-position on both the Gal and the
GlcA unit [10].
The disaccharide backbone of heparan sulphate (HS) and heparin consist of a
GlcA or IdoA connected to a GlcNAc unit. HS can be sulphated in many different
ways, a total of 21 different HS disaccharide backbone units have been identified
[11]. The scope of the project was to determine HA, CS and DS in human blood
serum. Details on the biological and structural properties of HS and KS can be
found in papers by Broekhuizen et al. [01], Sasisekharan et al. [10] and Esko et
al. [11].
O
O
OO OH
OHOH
OH
O*
*
NH
O CH3
OOH
ß-D-glucuronic acid (GlcA) N-acetyl-D-glucosamine (GlcNAc)
HA disaccharide
123
45
6
123
45
6
R.J. VONK
12
2.2 Glycosaminoglycans disturbance in diseases
The disturbance of the glycocalyx structure and changes in the level of GAGs
have been observed in patients with different diseases. GAGs have different
biological functions in the human body. Disturbance of the glyocalyx is related to
inflammation [01], cancer [09], hyperglycemia [01], atherosclerosis [09], and
shear stress [12]. When the endothelial glycocalyx is damaged the adhesion of
circulating cells, influx of lipoproteins and leakage of macromolecules to the
endothelium have been described [01].
HA is found in nearly all tissues and fluids of the body: plasma [13], the
connective tissue [14], lymph [15], synovial fluid [08], eye [16], urine [13], skin
[13], brain [05], and umbilical cord [13]. HA plays a role in the water regulation in
tissue by transporting water through extracellular matrix [05,07] Furthermore it
plays a role as lubricant in the joints [05,17].
The role of HA has been investigated for the understanding and diagnosis of
various diseases, such as malignant mesothelioma [18], exfoliation syndrome
[16], abdominal aortic aneurysm [19] and Rheumatoid arthritis [07-08].
The relation between the increased plasma levels of HA and the increase of the
cardio intima-media thickness (cIMT) in type 1 diabetes patients has been
reported [12]. Also an increase in both the MW and plasma levels of HA were
reported in patients with Primary biliary cirrhosis and Rheumatoid arthritis [07]. In
contrast to the increased MW of HA in plasma, a decreased MW of HA in
synovial fluid has been reported in patients who suffer from Rheumatoid arthritis
[08]. In exfoliation syndrome HA is overproduced in the anterior chamber and the
cornea [16].
The role of CS and DS side chains of the proteoglycan is described in the review
article of Sasisekharan et al. [10]. CS and DS provide electrostatic forces to the
proteoglycan which enables joints to function despite the shear, tensile and
dynamic compressive forces. Furthermore, the mechanical stiffness of cartilage
tissue is provided by CS and DS [10]. Analysis of CS and DS has been used for
diagnosis and understanding of exfoliation syndrome and abdominal aortic
aneurysm [16,19].
In these diseases the levels of some of the GAGs is changed while the other
levels of the GAGs remain constant. In patients with e.g. exfoliation syndrome the
R.J. VONK
13
levels of non-sulphated CS/DS were not increased in the aqueous humor of the
eye, in contrast to HA [16]. Another example is in abdominal aortic aneurysm in
which the aorta tissue levels of both CS and HA were decreased compared to
healthy persons while the aorta tissue levels of DS remained unchanged [19].
The scope of the project was to measure GAGs in plasma. The serum samples
for this study were related to type 1 diabetes patients. The changes in MW
distribution and plasma levels of HA related to the increase of the cIMT have to
be determined [12].
R.J. VONK
14
3 Analytical methods
GAGs can be separated and quantified by different separation techniques such
as HPLC [06,20-21], polyacrylamide gel electrophoresis [22] and capillary
electrophoresis [21,23-24]. These separation methods can be hyphenated with
different detection techniques such as fluorescence detection (FLR) [20-21,24]
and (tandem)mass spectrometry (MS(/MS)) [06,23].
HPLC-FLR coupled to a MS detector has been used for determination of GAGs in
human serum by Volpi [06]. The FLR detector was used for quantification of the
compounds and the MS detector was used for selectivity. The linear range of the
method, using MS as detection, was between 0.1 and 200 ng. The reported
levels of HA in human blood vary between different studies and between healthy
persons and diseased patients. The HA levels in blood serum in healthy persons
ranges from 10 to 300 ng/mL [07,15,25].
For the current project a HPLC-FLR apparatus was applied. In order to measure
HA in human blood serum, with an injection volume around 10µL, the HPLC-FLR
method described by Volpi [06] needed to be adapted to gain enough sensitivity
and selectivity for quantification.
Additional to quantification of the GAGs, determination of the MW distribution of
GAGs in human blood serum was required. The combination of the MW and the
change in serum/plasma levels of e.g. HA can be used as a biomarker approach
in cardio vascular diseases such as cIMT, Rheumatoid arthritis and Primary
biliary cirrhosis [01,07,12].
The MW distribution of the aqueous soluble GAGs polysaccharide can be
determined by AsFlFFF [26-28] and size exclusion chromatography (SEC) [29-
31]. For this project AsFlFFF was used for separation. The advantage of AsFlFFF
is that no column is used for separation. Therefore, this technique has no high-
MW cut-off caused by the pore size of the particles, compared to SEC. High MW
polymers are separated without any major structural breakdown since no
shearing forces are being applied [32].
R.J. VONK
15
3.1 AsFlFFF-UV-MALS-DRI
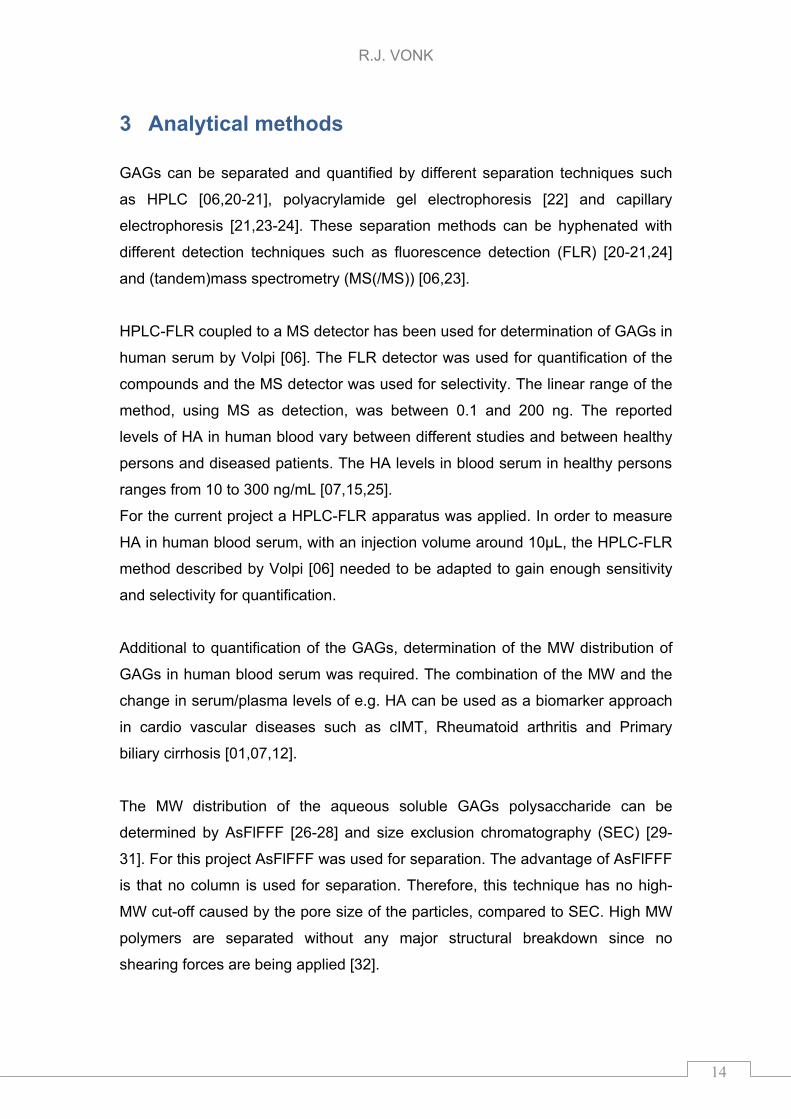
Separation of polymers by AsFlFFF is without a stationary phase that may
interact, degrade, or alter the sample and therefore is gentle, rapid, and non-
destructive [32]. A schematic view of AsFlFFF is depicted in Figure 4. A channel
flow runs from the inflow (left) to the outflow (right), the sample is introduced at
the sample inflow (middle). Before the sample is injected into the channel, the
outflow is reversed and the net flow is zero at the sample inflow point, which
causes focusing of the analytes to the channel after injection. Once the analytes
are focused the flow runs again from inflow to outlflow and the analytes are
transported over the channel. A side view of the channel is given in the “Exploded
view” in Figure 4. The upper channel plate is impermeable. The bottom channel
plate, on the other hand, is made of a porous frit material. To prevent the lost of
analytes through the bottom plate an ultra filtration membrane covers the bottom
plate [32].
When the analytes are transported over the channel a parabolic flow profile is
created due to the laminar flow of the liquid. This profile results in slower moving
stream closer to the walls than it does at the center of the channel flow [32-33].
Figure 4: Schematic drawing of AsFlFFF. Reprinted and adjusted from website of Wyatt [32]
R.J. VONK
16
When the perpendicular force field (in the case of AsFlFFF a liquid flow) is
applied to the flowing, laminar stream, the analytes are driven towards the
boundary layer the so-called "accumulation wall" of the channel [33].
Diffusion, due to concentration difference in the channel [33], creates a
counteracting motion. Smaller particles, or particles with a higher diffusion rate,
tend to diffuse higher in the channel, where the longitudinal flow is faster. The
smaller particles are transported much more rapidly along the AsFlFFF-channel
than the larger particles. This is the opposite of a SEC separation in which the
large molecules elute first [32].
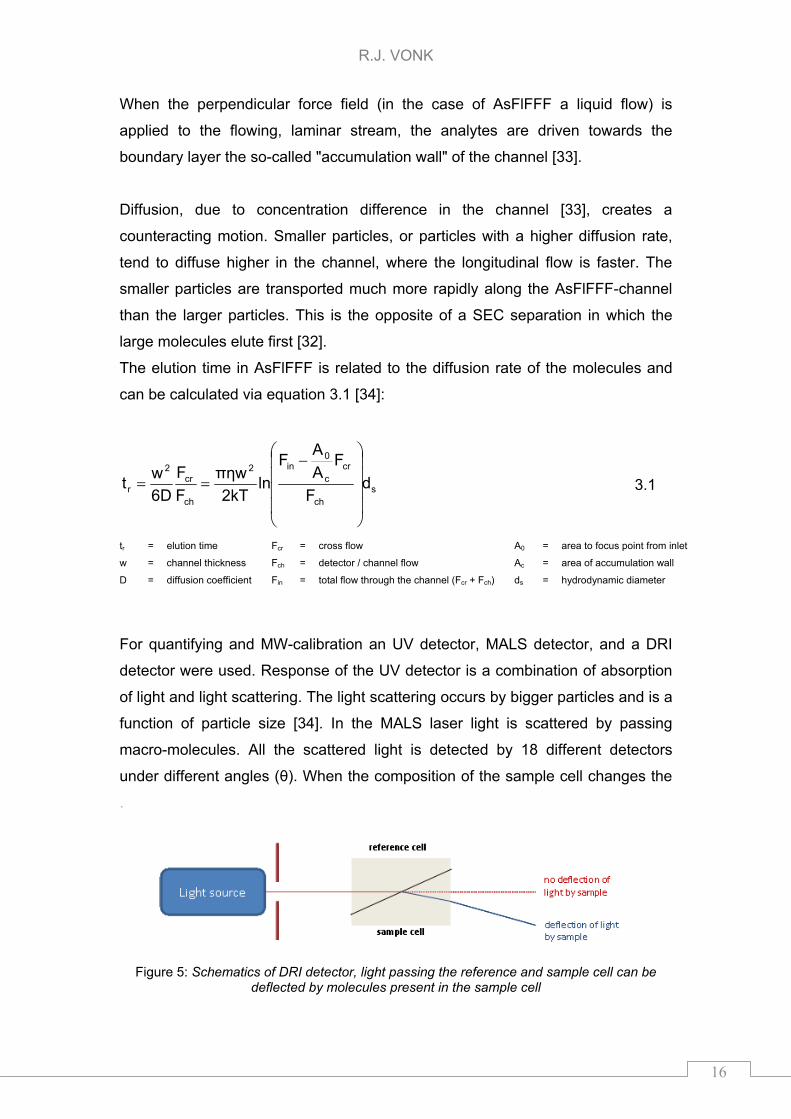
The elution time in AsFlFFF is related to the diffusion rate of the molecules and
can be calculated via equation 3.1 [34]:
sch
crc
0in2
ch
cr2
r dF
FA
AF
ln2kT
πηw
F
F
6D
wt
3.1
tr = elution time
w = channel thickness
D = diffusion coefficient
Fcr = cross flow
Fch = detector / channel flow
Fin = total flow through the channel (Fcr + Fch)
A0 = area to focus point from inlet
Ac = area of accumulation wall
ds = hydrodynamic diameter
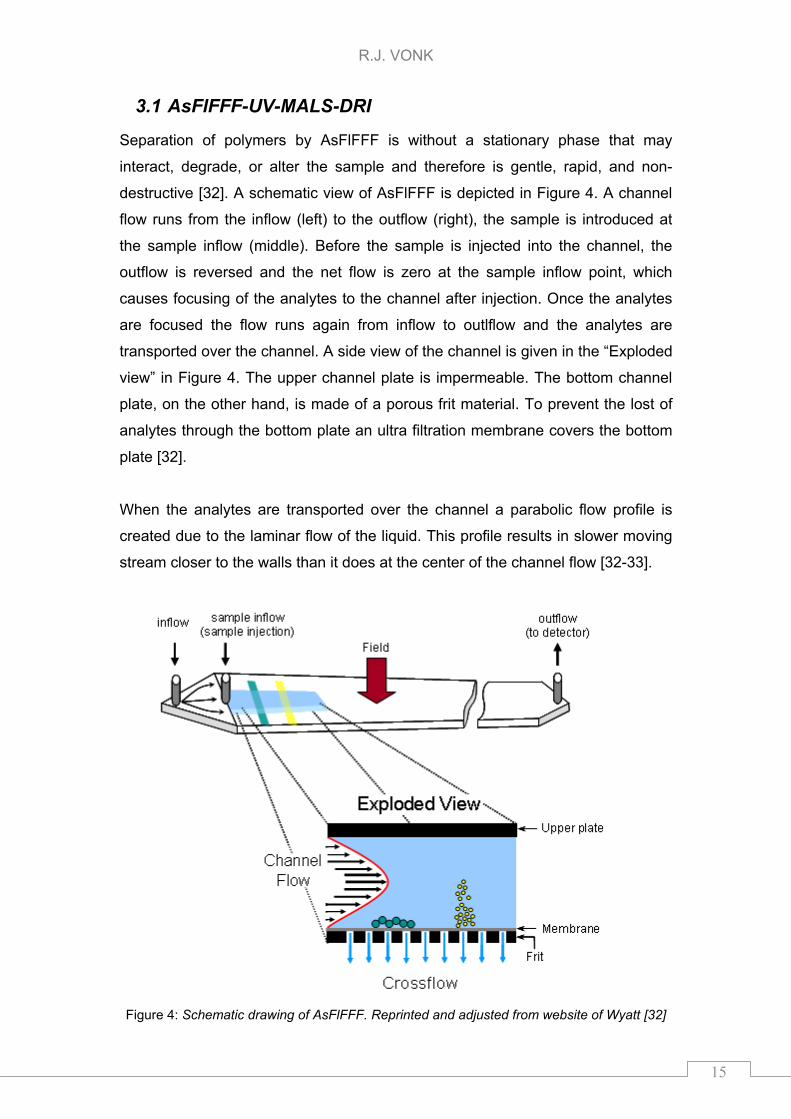
For quantifying and MW-calibration an UV detector, MALS detector, and a DRI
detector were used. Response of the UV detector is a combination of absorption
of light and light scattering. The light scattering occurs by bigger particles and is a
function of particle size [34]. In the MALS laser light is scattered by passing
macro-molecules. All the scattered light is detected by 18 different detectors
under different angles (θ). When the composition of the sample cell changes the
.
Figure 5: Schematics of DRI detector, light passing the reference and sample cell can be deflected by molecules present in the sample cell
R.J. VONK
17
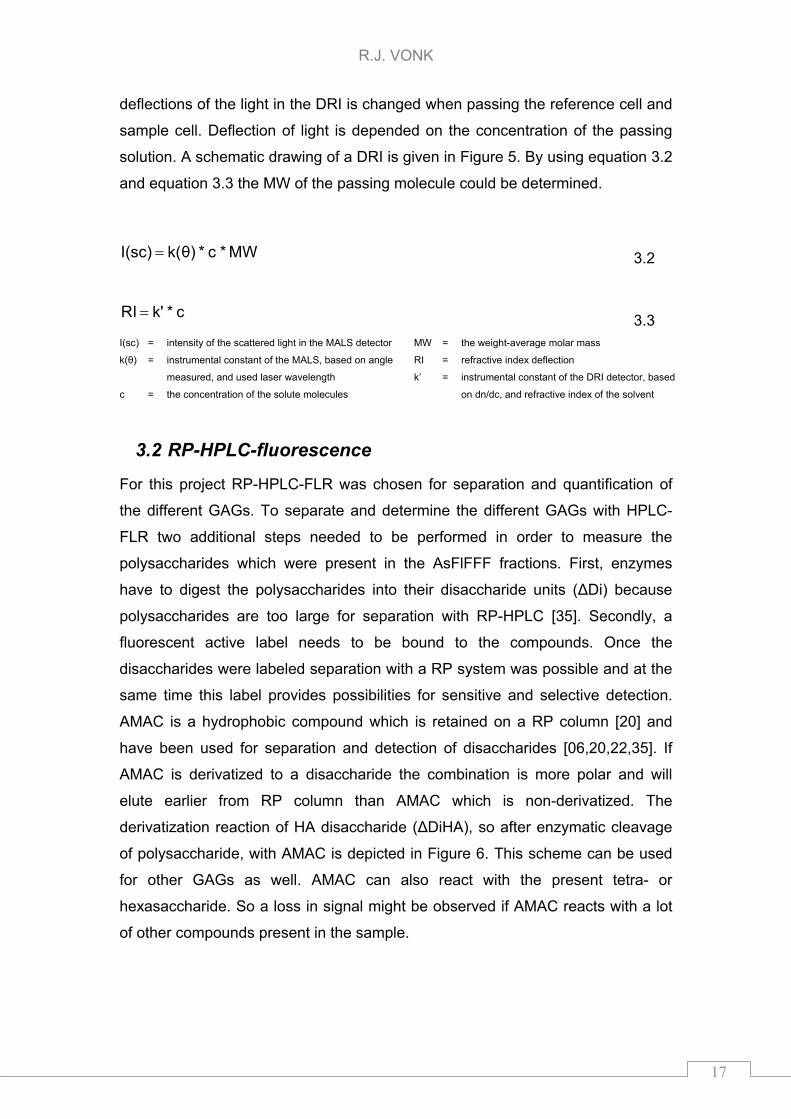
deflections of the light in the DRI is changed when passing the reference cell and
sample cell. Deflection of light is depended on the concentration of the passing
solution. A schematic drawing of a DRI is given in Figure 5. By using equation 3.2
and equation 3.3 the MW of the passing molecule could be determined.
I(sc) = intensity of the scattered light in the MALS detector
k(θ) = instrumental constant of the MALS, based on angle
measured, and used laser wavelength
c = the concentration of the solute molecules
MW = the weight-average molar mass
RI = refractive index deflection
k’ = instrumental constant of the DRI detector, based
on dn/dc, and refractive index of the solvent
3.2 RP-HPLC-fluorescence
For this project RP-HPLC-FLR was chosen for separation and quantification of
the different GAGs. To separate and determine the different GAGs with HPLC-
FLR two additional steps needed to be performed in order to measure the
polysaccharides which were present in the AsFlFFF fractions. First, enzymes
have to digest the polysaccharides into their disaccharide units (ΔDi) because
polysaccharides are too large for separation with RP-HPLC [35]. Secondly, a
fluorescent active label needs to be bound to the compounds. Once the
disaccharides were labeled separation with a RP system was possible and at the
same time this label provides possibilities for sensitive and selective detection.
AMAC is a hydrophobic compound which is retained on a RP column [20] and
have been used for separation and detection of disaccharides [06,20,22,35]. If
AMAC is derivatized to a disaccharide the combination is more polar and will
elute earlier from RP column than AMAC which is non-derivatized. The
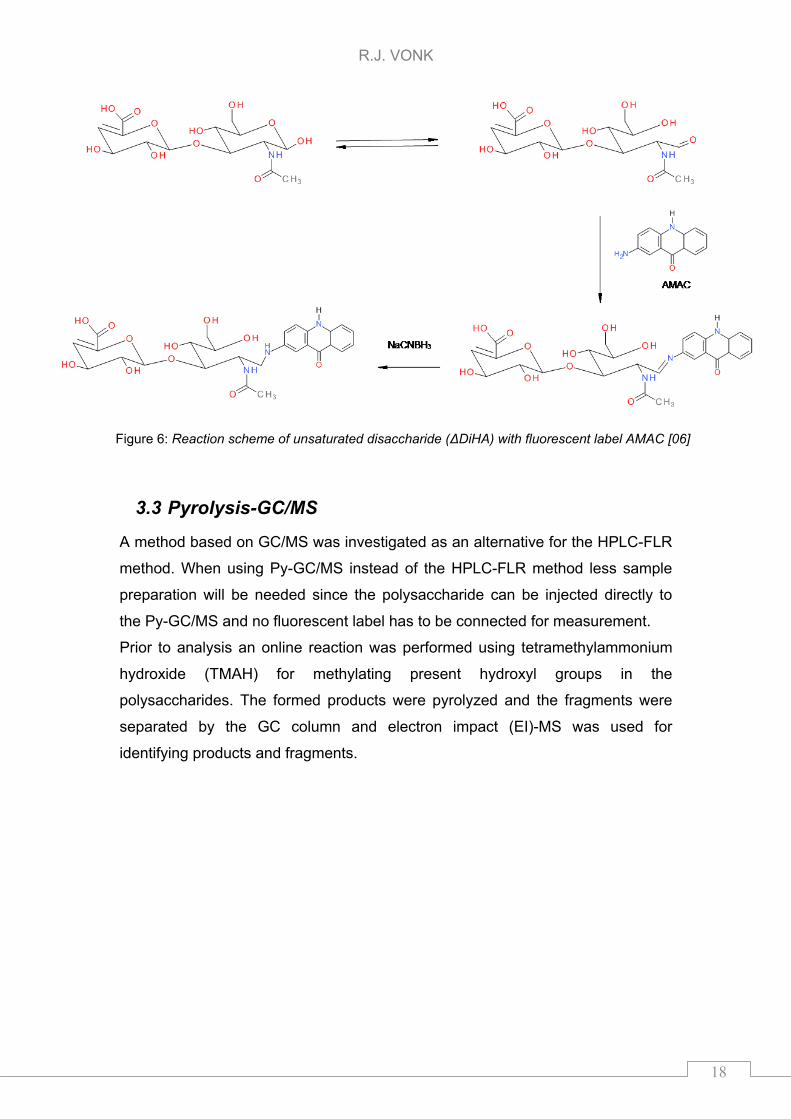
derivatization reaction of HA disaccharide (ΔDiHA), so after enzymatic cleavage
of polysaccharide, with AMAC is depicted in Figure 6. This scheme can be used
for other GAGs as well. AMAC can also react with the present tetra- or
hexasaccharide. So a loss in signal might be observed if AMAC reacts with a lot
of other compounds present in the sample.
MW *c * θ)k(I(sc)
c * k'RI
3.2
3.3
R.J. VONK
18
Figure 6: Reaction scheme of unsaturated disaccharide (ΔDiHA) with fluorescent label AMAC [06]
3.3 Pyrolysis-GC/MS
A method based on GC/MS was investigated as an alternative for the HPLC-FLR
method. When using Py-GC/MS instead of the HPLC-FLR method less sample
preparation will be needed since the polysaccharide can be injected directly to
the Py-GC/MS and no fluorescent label has to be connected for measurement.
Prior to analysis an online reaction was performed using tetramethylammonium
hydroxide (TMAH) for methylating present hydroxyl groups in the
polysaccharides. The formed products were pyrolyzed and the fragments were
separated by the GC column and electron impact (EI)-MS was used for
identifying products and fragments.
R.J. VONK
19
4 Experimental
4.1 Chemicals
Dissacharide standards of GAGs were purchased from Iduron, Manchester, UK
and are listed in Table 1. The water for the mobile phase was of MQ standard
quality (>18.2MΩ). The ACN was obtained from BioSolve, Valkenswaard, The
Netherlands. Coomassie Blue dye was purchased from Bio-Rad Laboratories,
Veenendaal, The Netherlands. The purchased materials from Sigma Aldrich,
St. Louis, USA were;
RP-HPLC column; Ascentis Express, C18, 2.1x150mm, 2.7μm
Proteinase K from Tritirachium album
Chondroitinase ABC from Proteus vulgaris
Hyaluronidase from bovine testes
HA polysaccharide potassium and sodium salt from human umbilical cord
Other salts of the highest quality
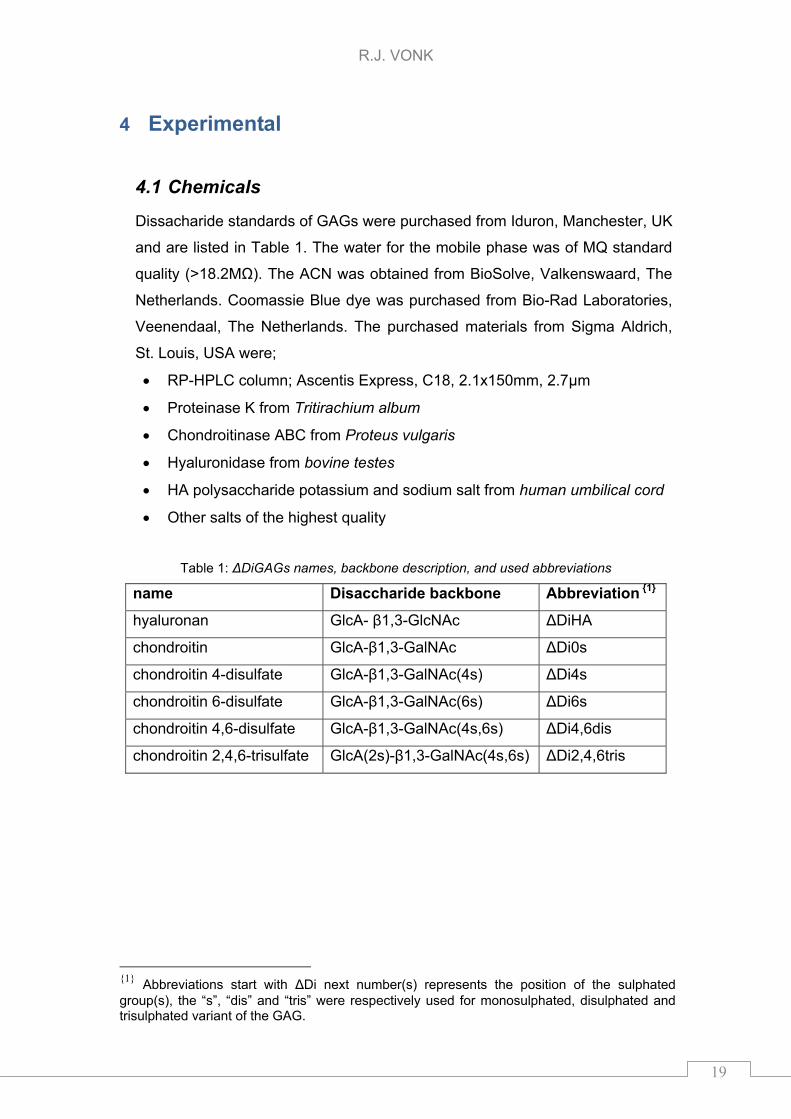
Table 1: ΔDiGAGs names, backbone description, and used abbreviations
name Disaccharide backbone Abbreviation 1
hyaluronan GlcA- β1,3-GlcNAc ΔDiHA
chondroitin GlcA-β1,3-GalNAc ΔDi0s
chondroitin 4-disulfate GlcA-β1,3-GalNAc(4s) ΔDi4s
chondroitin 6-disulfate GlcA-β1,3-GalNAc(6s) ΔDi6s
chondroitin 4,6-disulfate GlcA-β1,3-GalNAc(4s,6s) ΔDi4,6dis
chondroitin 2,4,6-trisulfate GlcA(2s)-β1,3-GalNAc(4s,6s) ΔDi2,4,6tris
1 Abbreviations start with ΔDi next number(s) represents the position of the sulphated group(s), the “s”, “dis” and “tris” were respectively used for monosulphated, disulphated and trisulphated variant of the GAG.
R.J. VONK
20
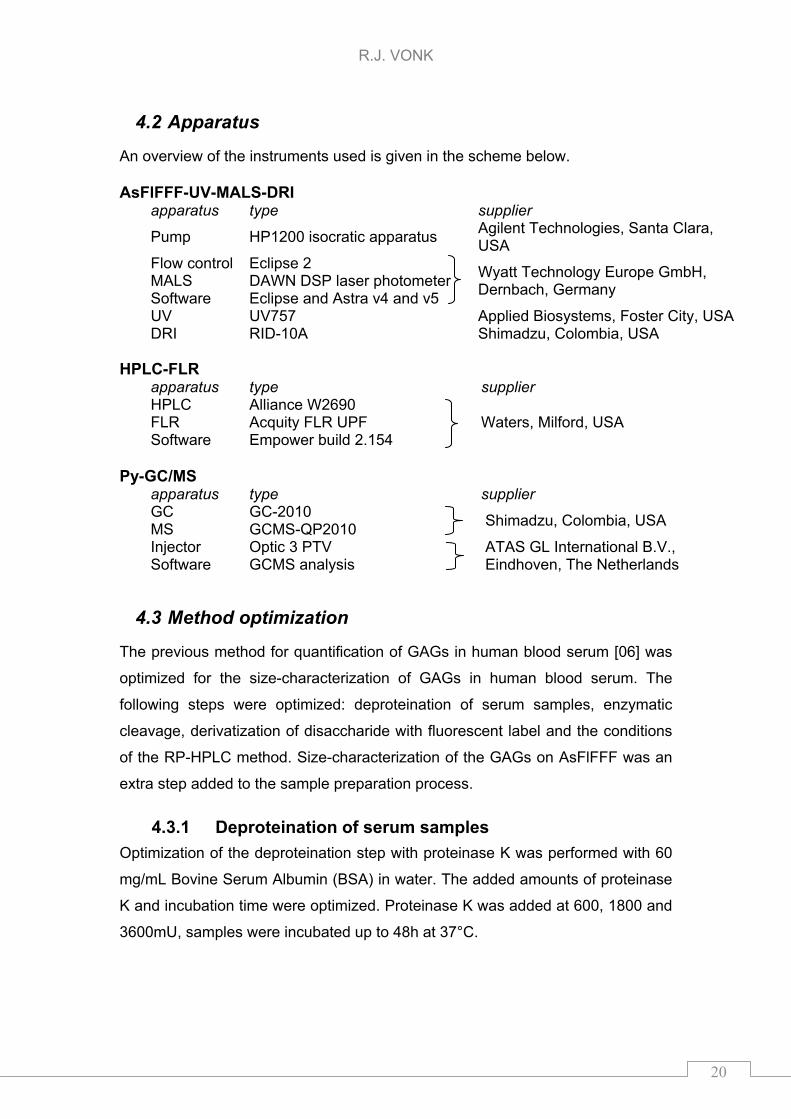
4.2 Apparatus
An overview of the instruments used is given in the scheme below. AsFlFFF-UV-MALS-DRI
apparatus type supplier
Pump HP1200 isocratic apparatus Agilent Technologies, Santa Clara, USA
Flow control Eclipse 2 MALS DAWN DSP laser photometer Software Eclipse and Astra v4 and v5
Wyatt Technology Europe GmbH, Dernbach, Germany
UV UV757 Applied Biosystems, Foster City, USA DRI RID-10A Shimadzu, Colombia, USA
HPLC-FLR
apparatus type supplier HPLC Alliance W2690 FLR Acquity FLR UPF Software Empower build 2.154
Waters, Milford, USA
Py-GC/MS
apparatus type supplier GC GC-2010 MS GCMS-QP2010
Shimadzu, Colombia, USA
Injector Optic 3 PTV Software GCMS analysis
ATAS GL International B.V., Eindhoven, The Netherlands
4.3 Method optimization
The previous method for quantification of GAGs in human blood serum [06] was
optimized for the size-characterization of GAGs in human blood serum. The
following steps were optimized: deproteination of serum samples, enzymatic
cleavage, derivatization of disaccharide with fluorescent label and the conditions
of the RP-HPLC method. Size-characterization of the GAGs on AsFlFFF was an
extra step added to the sample preparation process.
4.3.1 Deproteination of serum samples
Optimization of the deproteination step with proteinase K was performed with 60
mg/mL Bovine Serum Albumin (BSA) in water. The added amounts of proteinase
K and incubation time were optimized. Proteinase K was added at 600, 1800 and
3600mU, samples were incubated up to 48h at 37°C.

R.J. VONK
21
4.3.2 AsFlFFF-MALS-DRI method
An AsFlFFF method was setup for separation of GAGs from other larger
molecules, such as enzymes, which were present in serum samples. Calibration
of the HA polysaccharide and separation from BSA was investigated on AsFlFFF
with mobile phases of water, NaNO3 and PBS. Channel space was made by
cutting a 350-μm-thick Mylar spacer with a tip-to-tip length of 13.5cm. The
channel had a trapezoidal shape (the initial breadth decreased from 2.15cm to
0.3cm), and the volume of the channel was 0.56cm3.
4.3.3 Enzymatic cleavage
In previous studies either chondroitinase ABC [05,36] or hyaluronidase [21,36]
were used for the enzymatic cleavage of the polysaccharides into their ΔDi. In
this study the enzymatic conditions for a combination of both chondroitinase ABC
and hyaluronidase have been investigated. The absolute amount of
hyaluronidase added was kept constant (10U) while the amount of chondroitinase
ABC added varied between 1 and 10mU. Sample volumes were 100μL of HA
polysaccharide concentrations of 0.5, 5 and 100μg/mL. Incubations were
performed at 37°C up to 48h. Different solutions for enzymatic cleavage were
used namely, NaAce at pH 6.82, PBS and PB buffer at pH 7.43.
4.3.4 Derivatization with AMAC
All consulted studies used the method of Jackson [22], optimized by Kitawaga
and coworkers [21]. In this method AMAC, sodium-cyanoborohydride (NaCNBH3)
and DSMO/water were added to the samples. In this current study the optimal
derivatization conditions were investigated. First, the concentration of the AMAC
solution was varied between 0.05M and 0.1M. Secondly, the derivatization
reaction was monitored at 20°C up to 100h after incubation at 37°C for 2h and
16h. Thirdly, a lyophilization step was investigated to check if the samples could
be concentrated after derivatization. Water and DMSO/water (50/50 (v/v%)) were
used for dissolving the samples after lyophilization.
2 50mM NaAce solution for enzymatic cleavage contained 0.02% BSA for activation of chondroitinase ABC. 3 PBS & PB buffers for enzymatic cleavage contained 50mM NaAce and 0.02% BSA for activation of chondroitinase ABC.
R.J. VONK
22
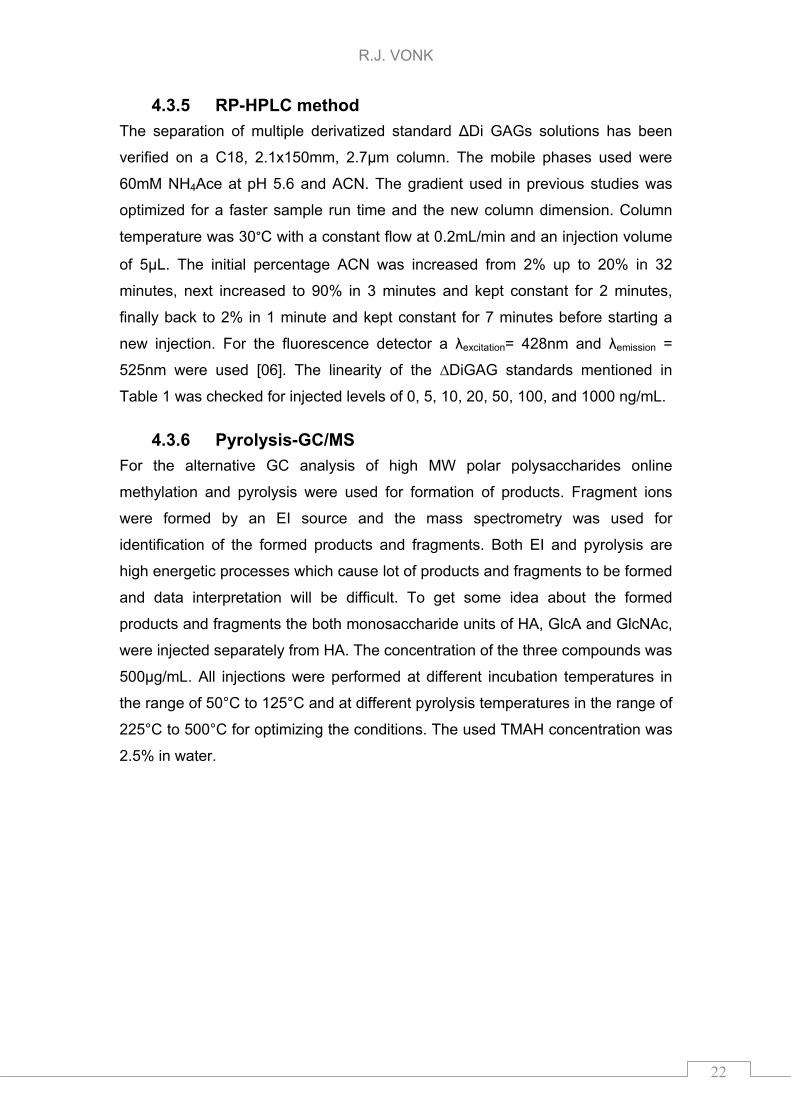
4.3.5 RP-HPLC method
The separation of multiple derivatized standard ΔDi GAGs solutions has been
verified on a C18, 2.1x150mm, 2.7µm column. The mobile phases used were
60mM NH4Ace at pH 5.6 and ACN. The gradient used in previous studies was
optimized for a faster sample run time and the new column dimension. Column
temperature was 30°C with a constant flow at 0.2mL/min and an injection volume
of 5μL. The initial percentage ACN was increased from 2% up to 20% in 32
minutes, next increased to 90% in 3 minutes and kept constant for 2 minutes,
finally back to 2% in 1 minute and kept constant for 7 minutes before starting a
new injection. For the fluorescence detector a λexcitation= 428nm and λemission =
525nm were used [06]. The linearity of the ∆DiGAG standards mentioned in
Table 1 was checked for injected levels of 0, 5, 10, 20, 50, 100, and 1000 ng/mL.
4.3.6 Pyrolysis-GC/MS
For the alternative GC analysis of high MW polar polysaccharides online
methylation and pyrolysis were used for formation of products. Fragment ions
were formed by an EI source and the mass spectrometry was used for
identification of the formed products and fragments. Both EI and pyrolysis are
high energetic processes which cause lot of products and fragments to be formed
and data interpretation will be difficult. To get some idea about the formed
products and fragments the both monosaccharide units of HA, GlcA and GlcNAc,
were injected separately from HA. The concentration of the three compounds was
500µg/mL. All injections were performed at different incubation temperatures in
the range of 50°C to 125°C and at different pyrolysis temperatures in the range of
225°C to 500°C for optimizing the conditions. The used TMAH concentration was
2.5% in water.
R.J. VONK
23
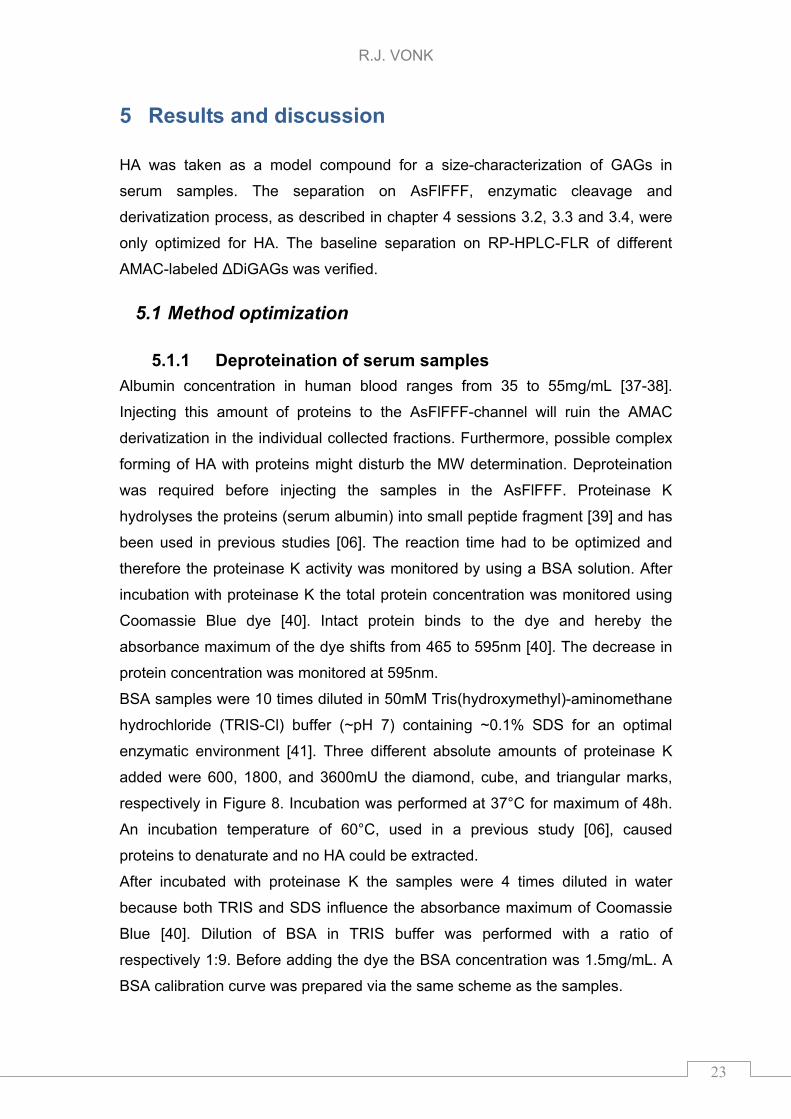
5 Results and discussion
HA was taken as a model compound for a size-characterization of GAGs in
serum samples. The separation on AsFlFFF, enzymatic cleavage and
derivatization process, as described in chapter 4 sessions 3.2, 3.3 and 3.4, were
only optimized for HA. The baseline separation on RP-HPLC-FLR of different
AMAC-labeled ΔDiGAGs was verified.
5.1 Method optimization
5.1.1 Deproteination of serum samples
Albumin concentration in human blood ranges from 35 to 55mg/mL [37-38].
Injecting this amount of proteins to the AsFlFFF-channel will ruin the AMAC
derivatization in the individual collected fractions. Furthermore, possible complex
forming of HA with proteins might disturb the MW determination. Deproteination
was required before injecting the samples in the AsFlFFF. Proteinase K
hydrolyses the proteins (serum albumin) into small peptide fragment [39] and has
been used in previous studies [06]. The reaction time had to be optimized and
therefore the proteinase K activity was monitored by using a BSA solution. After
incubation with proteinase K the total protein concentration was monitored using
Coomassie Blue dye [40]. Intact protein binds to the dye and hereby the
absorbance maximum of the dye shifts from 465 to 595nm [40]. The decrease in
protein concentration was monitored at 595nm.
BSA samples were 10 times diluted in 50mM Tris(hydroxymethyl)-aminomethane
hydrochloride (TRIS-Cl) buffer (~pH 7) containing ~0.1% SDS for an optimal
enzymatic environment [41]. Three different absolute amounts of proteinase K
added were 600, 1800, and 3600mU the diamond, cube, and triangular marks,
respectively in Figure 8. Incubation was performed at 37°C for maximum of 48h.
An incubation temperature of 60°C, used in a previous study [06], caused
proteins to denaturate and no HA could be extracted.
After incubated with proteinase K the samples were 4 times diluted in water
because both TRIS and SDS influence the absorbance maximum of Coomassie
Blue [40]. Dilution of BSA in TRIS buffer was performed with a ratio of
respectively 1:9. Before adding the dye the BSA concentration was 1.5mg/mL. A
BSA calibration curve was prepared via the same scheme as the samples.
R.J. VONK
24
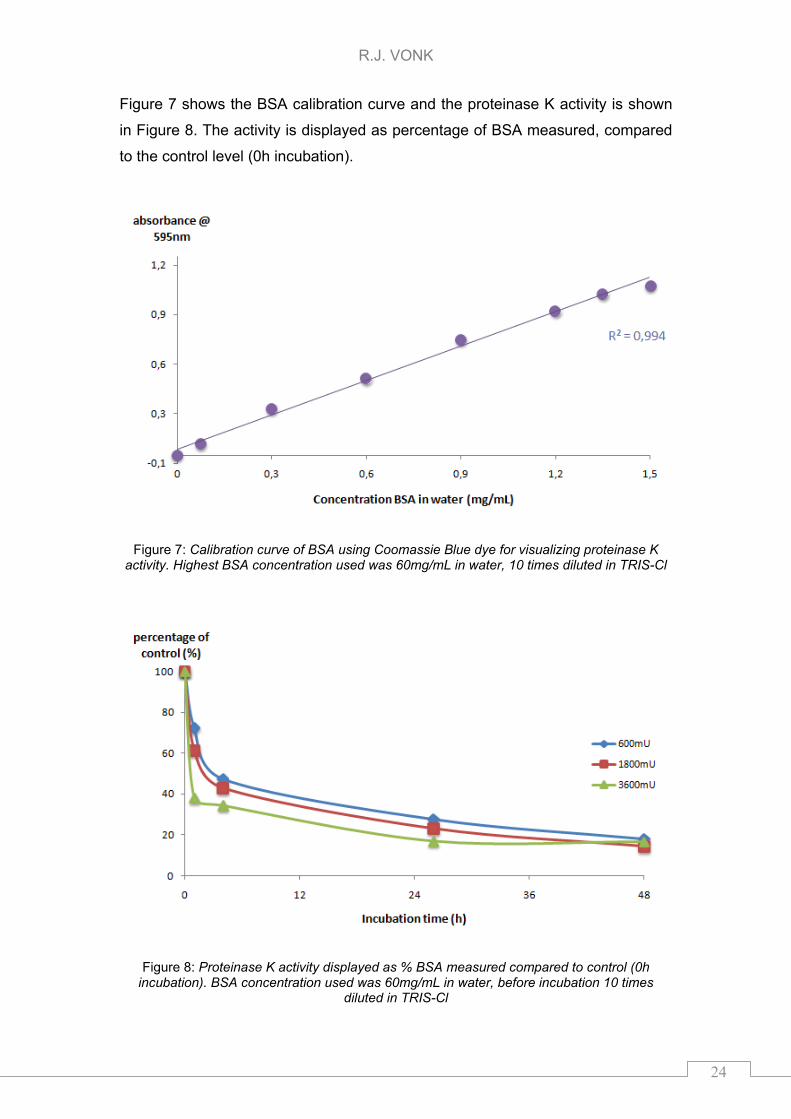
Figure 7 shows the BSA calibration curve and the proteinase K activity is shown
in Figure 8. The activity is displayed as percentage of BSA measured, compared
to the control level (0h incubation).
Figure 7: Calibration curve of BSA using Coomassie Blue dye for visualizing proteinase K activity. Highest BSA concentration used was 60mg/mL in water, 10 times diluted in TRIS-Cl
Figure 8: Proteinase K activity displayed as % BSA measured compared to control (0h incubation). BSA concentration used was 60mg/mL in water, before incubation 10 times
diluted in TRIS-Cl
R.J. VONK
25
Linear curve (R2=0994) was observed for the BSA concentration (spheres). All
the different concentrations of proteinase K show similar activity in 48h. The
signal of ~15% proteins after 48h incubation was not caused by proteinase K
since the enzyme did not gave a shift in the absorbance maximum of the dye
(data not shown). This 15% signal might be caused by BSA left in solution.
Additionally, an experiment was performed in which the dilution ratio of the BSA
in TRIS buffer was changed to 1:46 and 1:1 with the same final BSA
concentration of 1.5mg/mL before adding the dye (data not shown). The high
concentrations of SDS and TRIS in the 1:46 experiment influenced the
absorbance maximum of the Coomassie Blue too much so no BSA concentration
could be determined in these samples. For the other dilution ratio (1:1) the
percentage BSA after adding 1600mU proteinase K and incubation for 48h at
37°C was 25% compared to the 0h incubation. This low activity of the proteinase
K might be caused by the low TRIS concentration / low buffer capacity during
incubation.
5.1.2 AsFlFFF-MALS-DRI method
After enzymatic deproteination of serum samples, still peptides and proteins
might be present in the sample. When the sample is injected to an AsFlFFF-
channel, the peptides will be lost due to the 10kDa cut-off of the used channel
membrane. The proteins on the other hand has to be separated from the HA by
the AsFlFFF method. HA polysaccharide is an aqueous soluble molecule and
therefore the use of water as mobile phase in AsFlFFF-MALS-DRI was preferred.
Normalization of the MALS signals was performed with a BSA solution
(MW=66kDa). The RIcal constant of the used DRI detector was determined using KCl
solution. Separation of BSA and HA was investigated using PBS4, 10mM NaNO3
and water.
First water was used a mobile phase but BSA and HA were not retained in the
channel using a cross flow / detector flow (Fcr/Fch) value of three. AsFlFFF
program details are given in Appendix A. Due to the low ionic strength of water,
HA and BSA cannot approach the channel wall due to electrostatic repulsion
4 PBS solution was prepared by weighing 1.03 gr NaH2PO4.H2O, 4.25 gr Na2HPO4.2H2O, 8.06 gr NaCl and 0.4 gr KCl dissolved in 1L water
R.J. VONK
26
between particles and the wall [42]. Due to this repulsion BSA and HA were not
sufficiently driven towards the accumulation wall during focusing and therefore
the equilibrium inside the channel was not reached and the molecules were
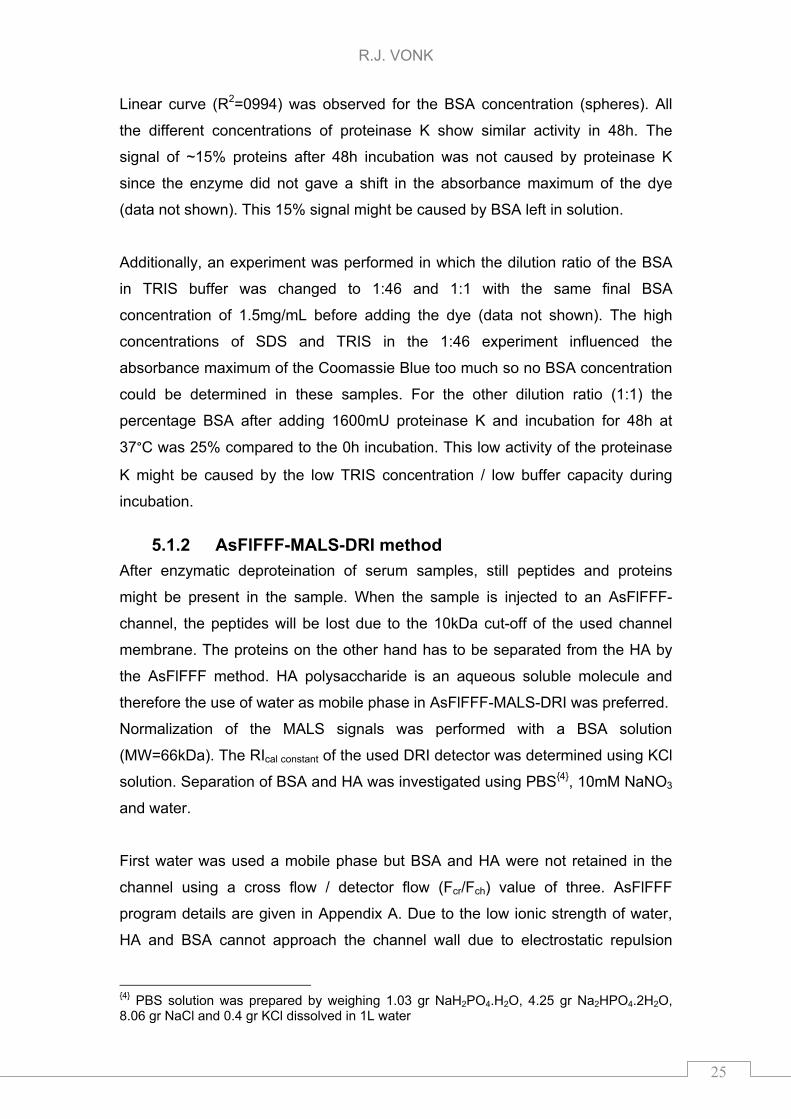
eluted at an elevated position [42-43]. When using a Fcr/Fch–value of five HA
could be slightly retained in the AsFlFFF-channel, as shown in Figure 9.
Figure 9: Separation of HA polysaccharide (Na-salt) on AsFlFFF with a high cross flow using water as mobile phase. Concentration HA was 1mg/mL, 50µL injection volume and detector
flow 0.6mL/min, secondary Y-axis showed the cross flow program used. No baseline subtraction was applied
No separation between BSA and HA could be obtained while using water as
mobile phase and applying this high cross flow. Next, 10mM NaNO3 solution was
used as mobile phase for separation of BSA and HA. The ionic strength of this
10mM NaNO3 solution was high enough to overcome the electrostatic repulsion
and a separation between BSA and HA was obtained, even at Fcr/Fch–value of
three. BSA and HA eluted 6.0 and 18 minutes after injection started, respectively.
The DRI signal showed a third peak between BSA and HA. Since this third peak
influenced the MW calibrations another mobile phase was tried. Finally, PBS was
used and it showed a nice separation between BSA and HA. Solution containing
1mg/mL of both BSA and HA was injected. Elution times of BSA and HA were 5.7
and 20 minutes, respectively. The DRI signal of the AsFlFFF separation between
BSA and HA using PBS was shown in Figure 10a with the used cross flow
program on the secondary y-axis. Figure 10b showed the MALS signal (θ = 90°)
of HA and BSA with the MW-distribution calibrations on the secondary y-axis.
Additionally, fractions per minute were collected from 10 to 25 minutes,
R.J. VONK
27
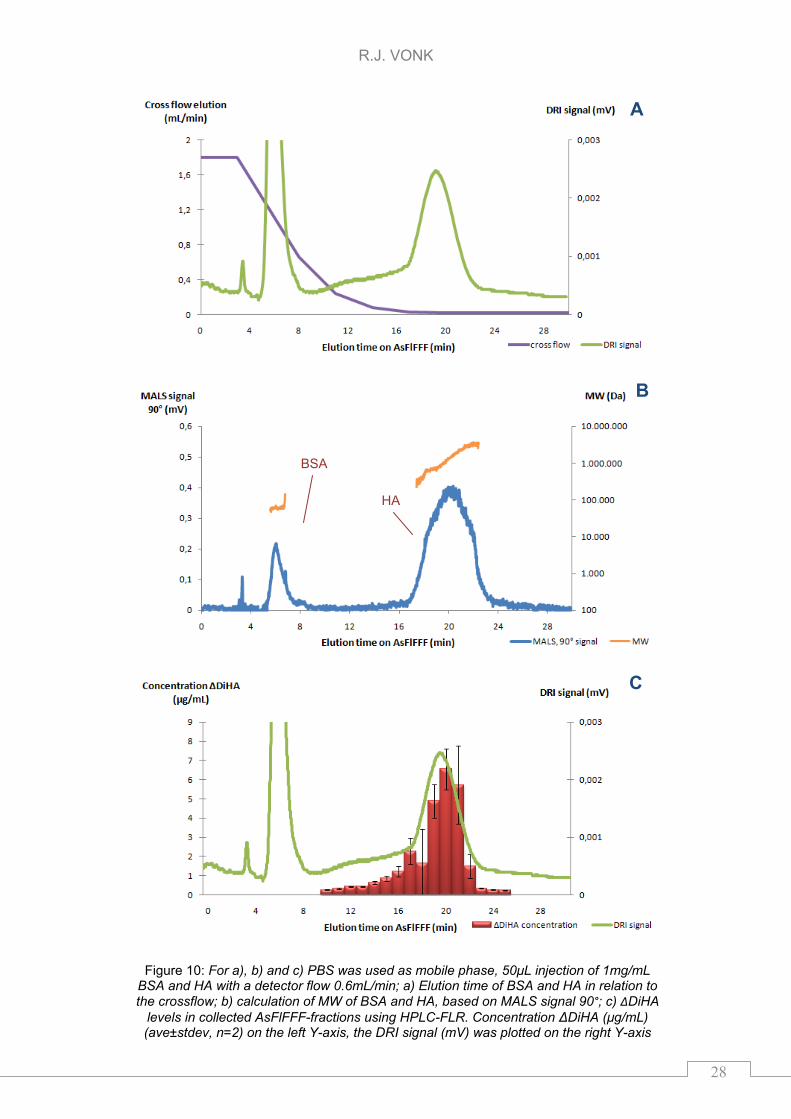
lyophilized, and reconstituted in 50mM sodium acetate (NaAce). In each fraction
the concentration of ΔDiHA was determined after lyophilization and enzymatic
cleavage (24h). The concentration (μg/mL) of the ΔDiHA in the separate fractions
and the observed DRI signal are given in Figure 10c. For calculation of the
AsFlFFF yield the weighted amount of HA (1mg/mL) was corrected using the
65% purity provided by the supplier and corrected for the 48±17% enzymatic
yield (see PBS-6, 10mU chondroitinase ABC in chapter 5.1.3).
The MW of the HA potassium salt eluting between 17 and 26 minutes was in the
range of 0.2 to 3.4MDa. Figure 10c shows that the fractions of 10 to 17 minutes
contained HA. The MW of HA eluting between 10 and 17 minutes was in the
range of 120 to 200kDa. The total amount ΔDiHA in the fractions collected was
6±3μg this was 18±9% (ave±stdev, n=2) of the injected absolute amount HA.
During AsFlFFF ~80% of the injected HA was lost. This might be low molecular
HA (>10kDA <120kDa) which elutes before the fractions were collected or even
smaller material (<10kDa) that disappears through the membrane during
focusing. Another explanation might be that the HA sticks to the membrane and
does not elute with the current AsFlFFF method.
R.J. VONK
28
.
Figure 10: For a), b) and c) PBS was used as mobile phase, 50μL injection of 1mg/mL BSA and HA with a detector flow 0.6mL/min; a) Elution time of BSA and HA in relation to the crossflow; b) calculation of MW of BSA and HA, based on MALS signal 90°; c) ΔDiHA
levels in collected AsFlFFF-fractions using HPLC-FLR. Concentration ΔDiHA (μg/mL) (ave±stdev, n=2) on the left Y-axis, the DRI signal (mV) was plotted on the right Y-axis
B
BSA
HA
C
A
R.J. VONK
29
5.1.3 Enzymatic cleavage
Enzymatic cleavage of HA polysaccharide was done by chondroitinase ABC and
hyaluronidase. These enzymes cleave the β 1-4 bond between the disaccharide
units of HA [06,44]. The conditions, for enzymatic cleavage, vary in previous
performed studies and have to optimized for the best result [06,09,35-36,44].
Chondroitinase ABC is activated after addition of NaAce. Chondroitinase ABC
degraded the most HA in a 50mM NaAce solution at pH 6.8 [44]. In a primary
experiment only chondroitinase ABC was used. In this experiment a cleavage
yield less than 50% was obtained. Because the expected levels of HA in serum
were in the range of 10 to 300ng/mL [07,15,25] a 50% loss of the HA
polysaccharide due to low enzymatic cleavage yield was not desirable. Therefore,
a combination of both chondroitinase ABC and hyaluronidase was investigated.
The solutions used as matrix for enzymatic cleavage were NaAce at pH 6.8, PBS
and PB at pH 7.4. PBS and PB were used as buffer for enzymatic cleavage
because the AsFlFFF fractions contained either PBS or PB. Lyophilizing the
AsFlFFF fractions will increase the salt concentrations. Therefore higher
concentrations of PB(S) buffers were used for observation of the enzymatic yield.
A 6 times and 15 times higher concentrated PB(S) were used, named PB(S)-63
and PB(S)-153, respectively. PBS-6 matrix was used for quantification of HA in
the collected AsFlFFF fractions as described in chapter 5.1.2.
For determination of the optimal enzymatic conditions a 0.5, 5, and 100μg/mL HA
polysaccharide solutions (weighted, not corrected for purity) were incubated. To
each sample (100μL) either 1mU or 10mU chondroitinase ABC and 10U of
hyaluronidase were added. Next the samples were incubated at 37°C up to 48h.
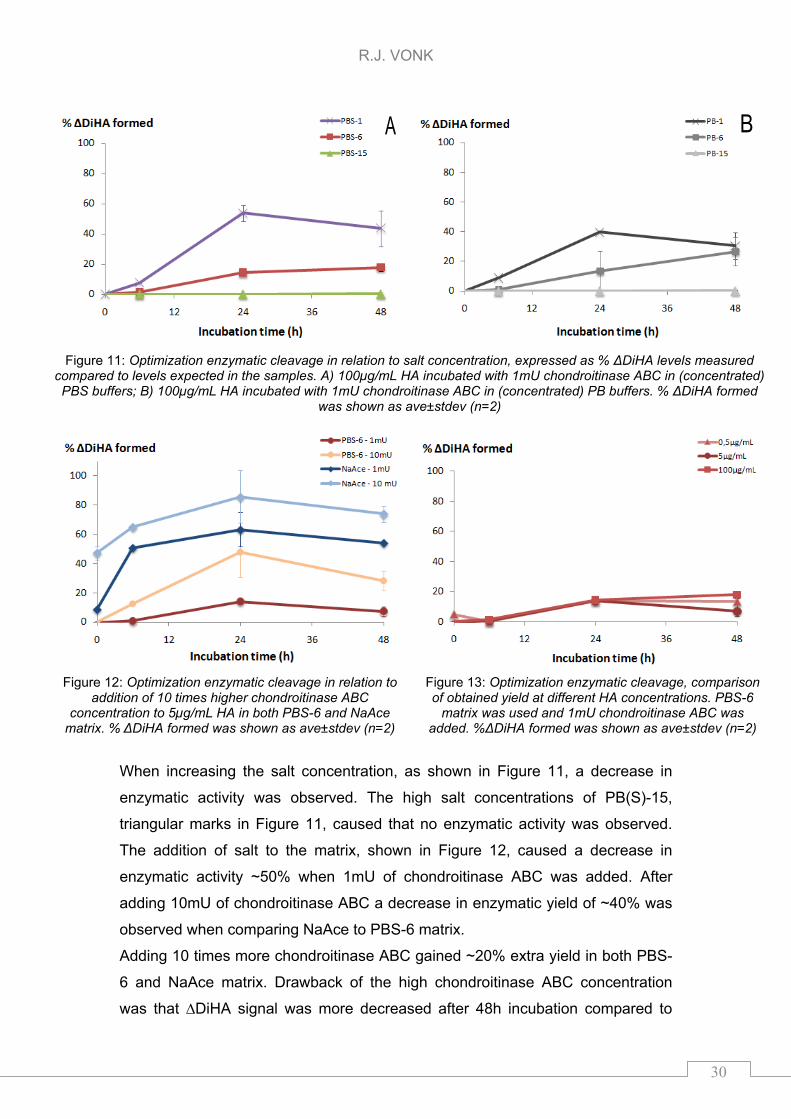
In Figure 11, Figure 12, and Figure 13 an overview is given of the different
enzymatic conditions. In Figure 11, the enzymatic yield of 1mU chondroitinase
ABC at a concentration of 5µg/mL HA was investigated in relation to increasing
salt concentrations of PB(S)-1, -6, and -15. The comparison of adding 1mU or
10mU chondroitinase ABC to both PBS-6 and NaAce is shown in Figure 12. In
Figure 13, the enzymatic yield in PBS-6 matrix with addition of 1mU
chondroitinase is compared at three different HA concentrations. All yields
obtained were corrected for 65% purity of HA.
R.J. VONK
30
When increasing the salt concentration, as shown in Figure 11, a decrease in
enzymatic activity was observed. The high salt concentrations of PB(S)-15,
triangular marks in Figure 11, caused that no enzymatic activity was observed.
The addition of salt to the matrix, shown in Figure 12, caused a decrease in
enzymatic activity ~50% when 1mU of chondroitinase ABC was added. After
adding 10mU of chondroitinase ABC a decrease in enzymatic yield of ~40% was
observed when comparing NaAce to PBS-6 matrix.
Adding 10 times more chondroitinase ABC gained ~20% extra yield in both PBS-
6 and NaAce matrix. Drawback of the high chondroitinase ABC concentration
was that ∆DiHA signal was more decreased after 48h incubation compared to
Figure 11: Optimization enzymatic cleavage in relation to salt concentration, expressed as % ΔDiHA levels measured
compared to levels expected in the samples. A) 100µg/mL HA incubated with 1mU chondroitinase ABC in (concentrated) PBS buffers; B) 100µg/mL HA incubated with 1mU chondroitinase ABC in (concentrated) PB buffers. % ΔDiHA formed
was shown as ave±stdev (n=2)
Figure 12: Optimization enzymatic cleavage in relation to addition of 10 times higher chondroitinase ABC
concentration to 5µg/mL HA in both PBS-6 and NaAce matrix. % ΔDiHA formed was shown as ave±stdev (n=2)
Figure 13: Optimization enzymatic cleavage, comparison of obtained yield at different HA concentrations. PBS-6
matrix was used and 1mU chondroitinase ABC was added. %ΔDiHA formed was shown as ave±stdev (n=2)
R.J. VONK
31
24h incubation. The decrease in ∆DiHA might have been caused by excessive
cleavage of HA polysaccacharide into e.g. monosaccharide units. When
comparing the enzymatic yield between the different concentrations of HA no
difference could be observed after 24h incubation, as shown in Figure 13.
Furture AsFlFFF-fractions will be lyophilized and reconstituted in 6 times less
volume of 50mM NaAce containing 10mU of chondroitinase ABC and 10U
hyaluronidase. The enzymatic yield for this condition was about 47% (PBS-6 –
10mU).
5.1.4 Derivatization with AMAC
Parameters optimized for fluorescent labeling of the ΔDi were the used AMAC
concentration, derivatization time, and concentrating the samples by
lyophilization.
The reaction of AMAC with ΔDiHA is described by Jackson [22]. The fluorescent
label AMAC was dissolved in 85% DMSO/15% acetic acid. NaCNBH3 was added
to the samples to make the reaction irreversible. The volumes of DMSO/water
(50/50 (v/v%)) vary between the articles [06,21,35]. Non-derivatized AMAC
disturbed the chromatography (data not shown). Since excess of AMAC was not
used for derivatization the concentration of AMAC was reduced for a better peak
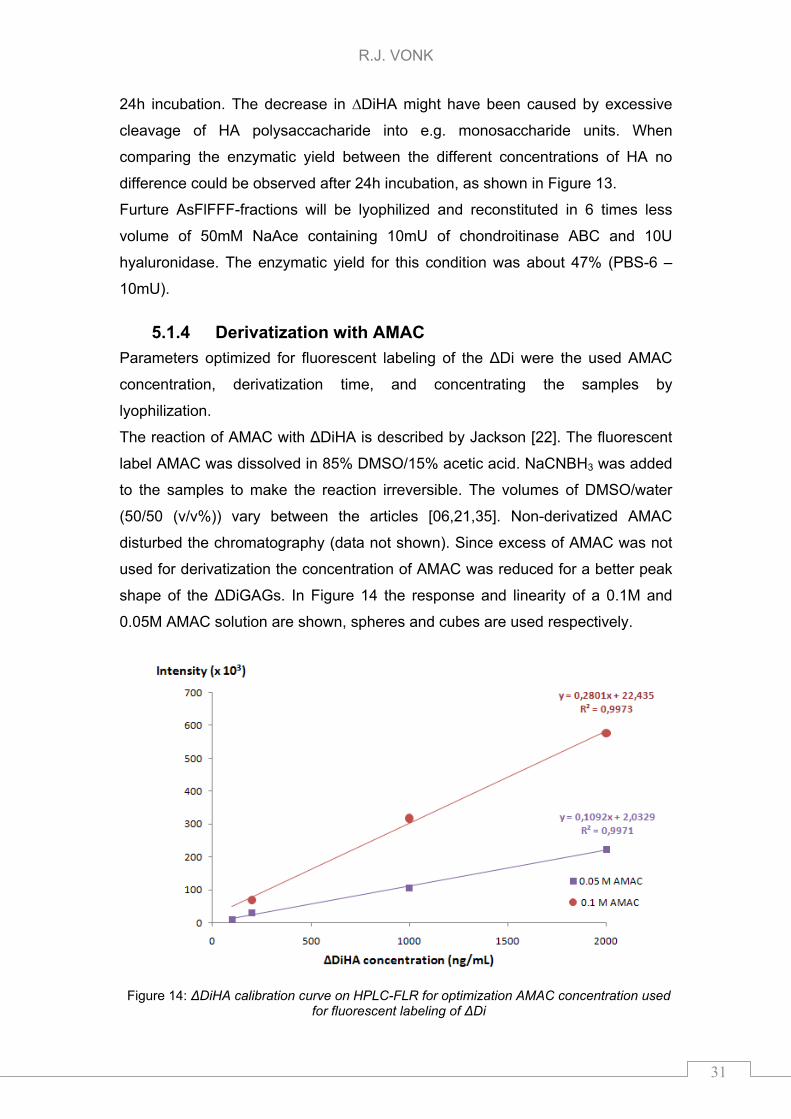
shape of the ΔDiGAGs. In Figure 14 the response and linearity of a 0.1M and
0.05M AMAC solution are shown, spheres and cubes are used respectively.
Figure 14: ΔDiHA calibration curve on HPLC-FLR for optimization AMAC concentration used for fluorescent labeling of ΔDi
R.J. VONK
32
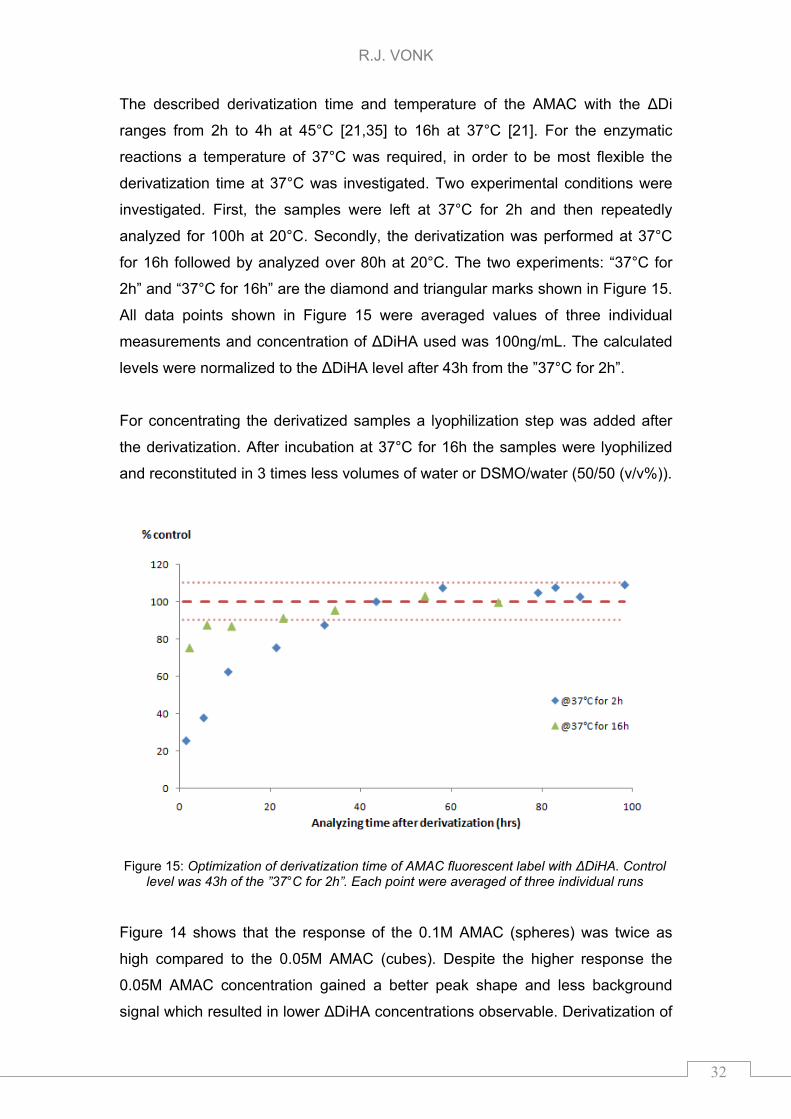
The described derivatization time and temperature of the AMAC with the ΔDi
ranges from 2h to 4h at 45°C [21,35] to 16h at 37°C [21]. For the enzymatic
reactions a temperature of 37°C was required, in order to be most flexible the
derivatization time at 37°C was investigated. Two experimental conditions were
investigated. First, the samples were left at 37°C for 2h and then repeatedly
analyzed for 100h at 20°C. Secondly, the derivatization was performed at 37°C
for 16h followed by analyzed over 80h at 20°C. The two experiments: “37°C for
2h” and “37°C for 16h” are the diamond and triangular marks shown in Figure 15.
All data points shown in Figure 15 were averaged values of three individual
measurements and concentration of ΔDiHA used was 100ng/mL. The calculated
levels were normalized to the ΔDiHA level after 43h from the ”37°C for 2h”.
For concentrating the derivatized samples a lyophilization step was added after
the derivatization. After incubation at 37°C for 16h the samples were lyophilized
and reconstituted in 3 times less volumes of water or DSMO/water (50/50 (v/v%)).
Figure 15: Optimization of derivatization time of AMAC fluorescent label with ΔDiHA. Control level was 43h of the ”37°C for 2h”. Each point were averaged of three individual runs
Figure 14 shows that the response of the 0.1M AMAC (spheres) was twice as
high compared to the 0.05M AMAC (cubes). Despite the higher response the
0.05M AMAC concentration gained a better peak shape and less background
signal which resulted in lower ΔDiHA concentrations observable. Derivatization of
R.J. VONK
33
the ΔDi was a flexible and time consuming process as visualized in Figure 15.
For this study 10% fluctuation in the observed signal was allowed and therefore
the derivatization should be performed either at 37°C and left there for 2h before
adding DSMO/water and additionally wait for 48h before analyzing, or left at 37°C
for 16h before adding DMSO/water and wait for 24h before measurement.
Higher DMSO concentration in concentrated samples caused peak broadening.
The peak shape was not influenced when the samples were reconstituted in
water (data not shown). Increase in limits of decision was not observed since the
background signal increased as well. Since lyophilization after derivatization did
not gained a better limit of decision this step was not incorporated to the sample
preparation.
5.1.5 RP-HPLC method
To achieve lower detection limit the C18 column with a 4.6mm I.D. used in
previous studies [06,35] was replaced for an Ascentis Express C18, 2.1x150mm,
2.7μm column. The used Fused-Core™ particle technology of this column, could
provide both high speed and high efficiencies of sub-2 μm particles while
maintaining lower backpressures [45]. The gradient and column flow needed to
be adapted because the I.D. of the column was decreased compared to previous
studies [06,35]. The HPLC method details were given in Appendix B.
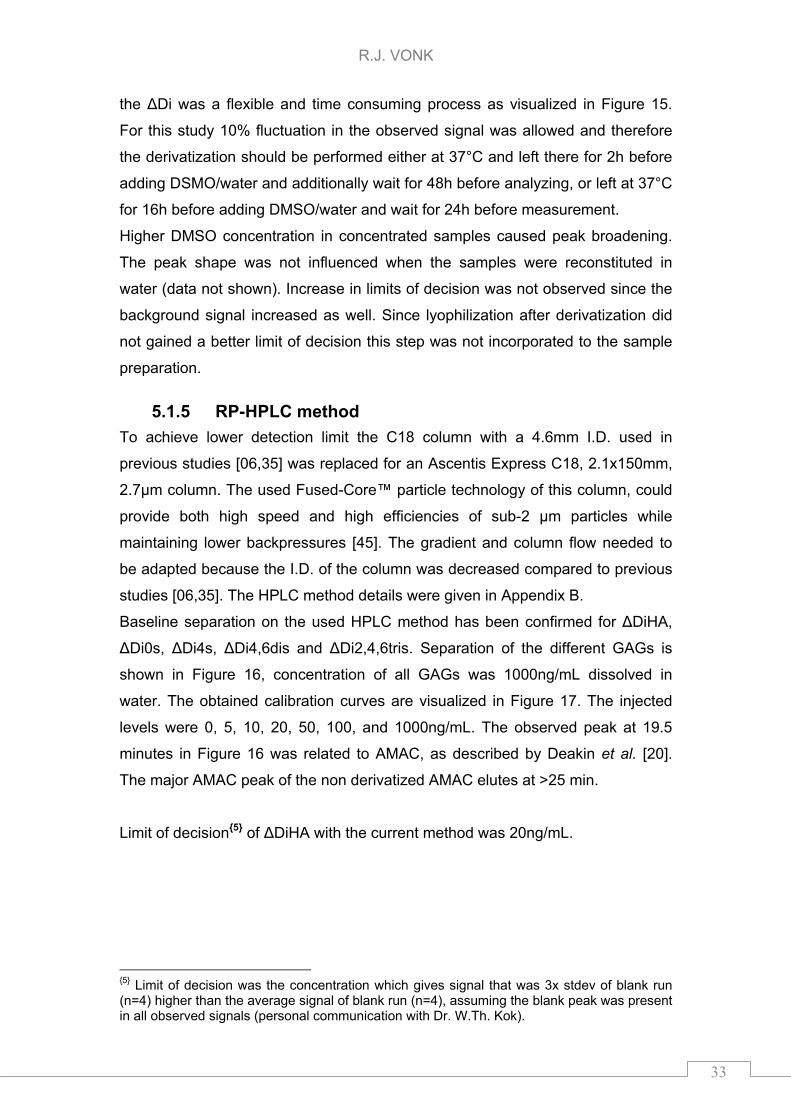
Baseline separation on the used HPLC method has been confirmed for ΔDiHA,
ΔDi0s, ΔDi4s, ΔDi4,6dis and ΔDi2,4,6tris. Separation of the different GAGs is
shown in Figure 16, concentration of all GAGs was 1000ng/mL dissolved in
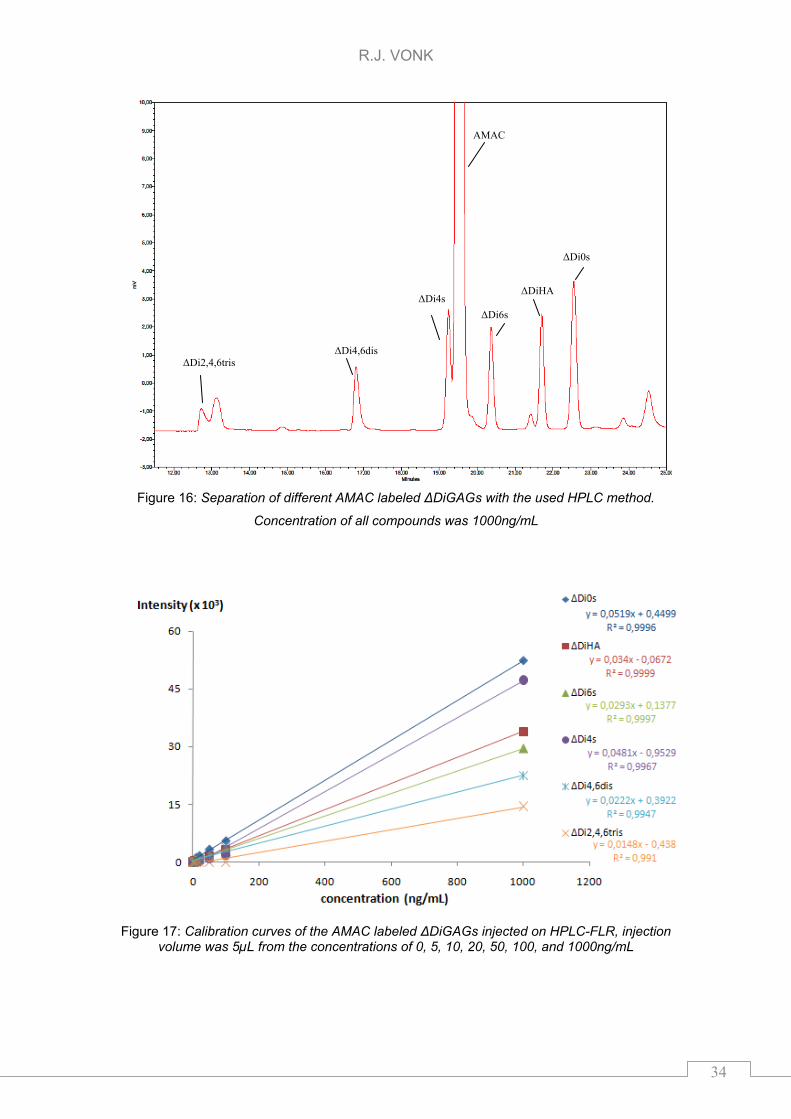
water. The obtained calibration curves are visualized in Figure 17. The injected
levels were 0, 5, 10, 20, 50, 100, and 1000ng/mL. The observed peak at 19.5
minutes in Figure 16 was related to AMAC, as described by Deakin et al. [20].
The major AMAC peak of the non derivatized AMAC elutes at >25 min.
Limit of decision5 of ΔDiHA with the current method was 20ng/mL.
5 Limit of decision was the concentration which gives signal that was 3x stdev of blank run (n=4) higher than the average signal of blank run (n=4), assuming the blank peak was present in all observed signals (personal communication with Dr. W.Th. Kok).
R.J. VONK
34
Figure 16: Separation of different AMAC labeled ΔDiGAGs with the used HPLC method.
Concentration of all compounds was 1000ng/mL
Figure 17: Calibration curves of the AMAC labeled ΔDiGAGs injected on HPLC-FLR, injection
volume was 5µL from the concentrations of 0, 5, 10, 20, 50, 100, and 1000ng/mL
ΔDi6s
ΔDi2,4,6tris ΔDi4,6dis
ΔDi4s ΔDiHA
ΔDi0s
AMAC
R.J. VONK
35
5.1.6 Pyrolysis -GC/MS
Optimizing the incubation temperature with TMAH and optimizing the pyrolysis
temperature was examined. Incubation temperatures used were from 50 to
125°C, with a step size of 25°C. Pyrolysis temperatures examined were from 225
to 300 (step size of 25°C) and from 300 to 500°C (step size 50°C). More details
of the GC method are depicted in Appendix C.
The expected trend in the formation of products with neither the
monosaccharides nor the disaccharide was obtained. Many products and
fragments were formed and no data interpretation could be performed because
no reaction mechanism could be made for any of the formed products or
fragments. During pyrolysis no unique fragments of the products of HA compared
to other GAGs were formed. The fragments that were formed did not have a
unique part of the structure present in the GlcNAc part of HA.
5.2 Sample preparation overview after optimizing method
To quantify HA in human blood serum the following sample preparation steps
were applied:
Deproteination of serum samples by 10 times dilution in 50mM TRIS
buffer (~pH7), adding 600mU proteinase K and incubate for 48h at 37°C
Inject 50μL sample in the AsFlFFF for size-based separation, using PBS4
as mobile phase and collect the fractions
Lyophilize the AsFlFFF fractions and reconstitute in 100μL of 50mM
NaAce solution (pH 6.8) containing 0.02% BSA
Enzymatic cleavage of HA polysaccharide to disaccharides using
chondroitinase ABC (10mU) and hyaluronidase (10U) for 24h at 37°C
Derivatization of disaccharide with 10μL AMAC (0.05M) and 10μL
NaCNBH3 (1M) and after 16h at 37°C add 60μL DMSO/water (50/50 v/v%)
Centrifuge 24h after adding DMSO/water at 11.000rpm for 5 min
Analyze supernatant on RP-HPLC method with 5µL injection volume using
λexcitation = 428nm and λemission = 525nm
R.J. VONK
36
5.3 Analysis of serum samples
This method has been used for size-characterization of HA in serum samples. HA
has been spiked to serum samples and compared to the levels in non-spiked
serum samples. The serum samples were prepared via the sample preparation
scheme given in chapter 5.2 but no HA could be measured in any of the collected
serum samples. Possibly due to cleavage of HA by proteinase K which causes
HA to be lost when injected at AsFlFFF. Also the low AsFlFFF recovery might
contribute to the lack of HA signal observed.
R.J. VONK
37
6 Conclusions
6.1 Current method
The method described in this thesis can be used for size-characterization of HA
in human serum samples. The separation of BSA and HA on the AsFlFFF
channel by has been achieved. The MW of the used HA standard was in the
range of 0.12 to 3.2MDa and was separated from BSA (MW=66kDA). The
obtained separation between BSA and HA was sufficient for the expected MW of
HA in human serum samples of (~0.1-10MDa) [05].
Separation of different AMAC labeled ΔDi of the GAGs was performed on the
HPLC-FLR. The observed limit of decision for ΔDiHA of 20ng/mL was expected
to be low enough for quantification of HA in human blood serum.
6.2 Recommendation for future work
For the size-characterization and quantification of HA in human serum, and later
all the GAGs, some additional experiments have to be performed. Some
recommendations are listed below.
After deproteination of the serum samples with proteinase K still 15% of the
proteins were left. Other enzymes such as trypsin [46] or pronase [47] might be
more sufficient for deproteination of serum samples. Ambrosius et al. [35] added
10% TCA for deproteination of serum samples which causes proteins to
precipitate. When the 15% signal was caused by BSA left, addition of TCA might
be the solution after 48h incubation with the enzymes.
The low AsFlFFF-recovery can be investigated by two additional experiments.
First, proteinase K might cleave HA polysaccharides. An experiment to check this
possible HA cleavages is recommended. Two serum sample could be injected
into AsFlFFF without deproteination by proteinase K. The first one will be spiked
with HA polysaccharide, the second will be blank serum. The AsFlFFF-fractions
which do not contain proteins, so no UV response at 280nm, will be prepared for
measurement on HPLC-FLR. When proteins are present in the collected fractions
derivatization of HA will be difficult. The spiked HA serum samples, corrected for
HA levels present in the blank serum samples, should give a similar size-
R.J. VONK
38
distribution as have been shown in Figure 10. If proteinase K cleaves HA
polysaccharides a higher HA recovery will be obtained with the described
experiment. Second explanation for the low AsFlFFF recovery was that low MW
material (<120kDa) might be present in the HA standard. This material can elute
with BSA (>10kDa<120kDa) or will be lost during focusing (<10kDa). Quantifying
the HA levels in all fractions and in the cross flow liquid can give an idea about
the distribution of HA standard during AsFlFFF.
The enzymatic cleavage yield of HA polysaccharide in the lyophilized AsFlFFF-
fractions (PBS-6) was only ~20% for 1mU of chondroitinase. This yield was ~3
times lower compared to non-lyophilized AsFlFFF-fractions (PBS-1), shown in
Figure 11. A higher HA conversion could be obtained by enzymatic cleavage in
non-lyophilized AsFlFFF fractions and lyophilize after enzymatic cleavage but
before adding AMAC to the samples.
Enzymatic cleavage of the polysaccharides was optimized for HA. The optimal
enzymatic conditions for other GAGs might be different. For CS polysaccharide
cleavage by chondroitinase ABC in a buffer at pH 8.0 is recommended while for
HA pH 6.8 gives the highest yield [44]. In previous performed studies
hyaluronidase was used for cleavage of GAGs at pH 5-6 [36, 48].
Different enzymes have different primary substrates. The chondroitinase ABC
“cocktail” used was not specific for cleavage of HA or the other GAGs. ΔDi of the
GAGs cleaved by chondroitinase ABC and hyaluronidase, were mentioned in
Table 2. More specific enzymatic cleavage could performed by chondroitinase
AC, chondroitinase B, or by chondroitinase C [10,36]. Apart from more specific
cleavage these enzymes might also give higher cleavage yields for the
polysaccharide. Other enzymes, such as heparinase, keratanase and keratanase
II can be used for cleavage of HS [04,10,36] and KS [49] polysaccharides.
With the AsFlFFF method separation of BSA (MW=66kDa) and HA standard
(MW=0.12 to 3.2MDa) was possible. Other GAGs, with common MW of 15-
20kDa [05,07], will be separated from HA but not from BSA. Present proteins
after deprotienation could be separated from the other GAGs by changing the
cross flow program. With a higher Fcr/Fch-value BSA will be retained and other
GAGs will elute before BSA.
R.J. VONK
39
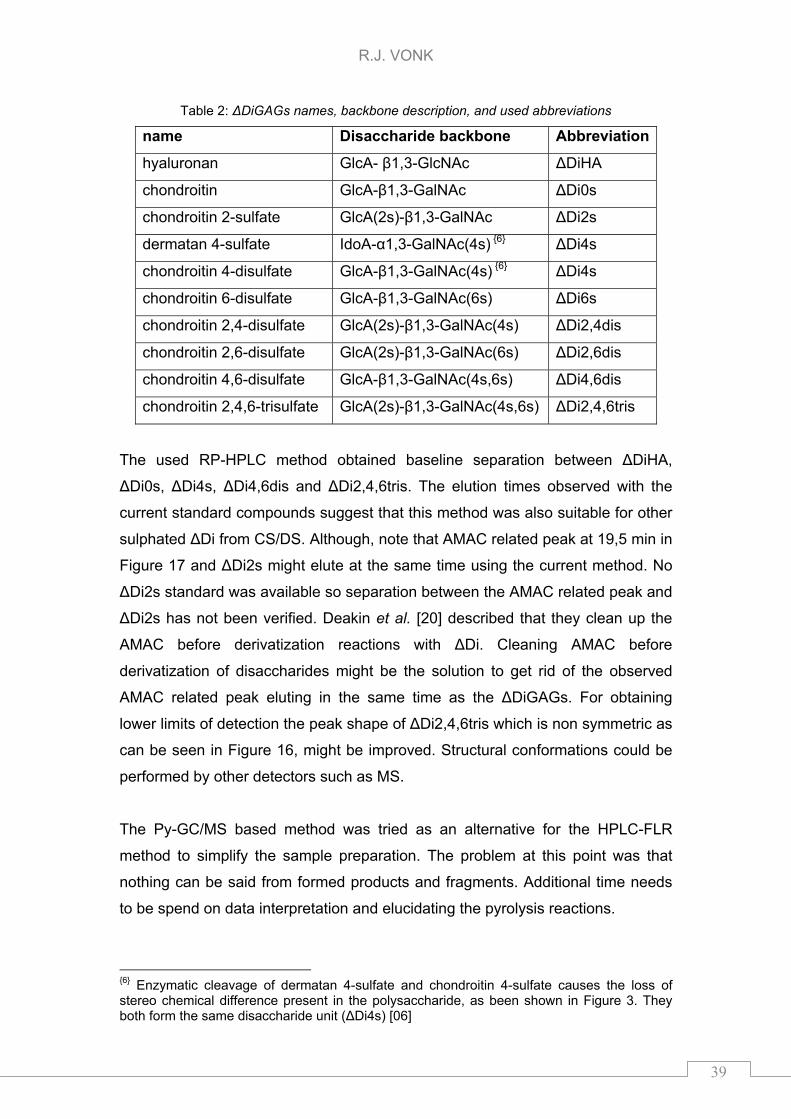
Table 2: ΔDiGAGs names, backbone description, and used abbreviations
name Disaccharide backbone Abbreviation
hyaluronan GlcA- β1,3-GlcNAc ΔDiHA
chondroitin GlcA-β1,3-GalNAc ΔDi0s
chondroitin 2-sulfate GlcA(2s)-β1,3-GalNAc ΔDi2s
dermatan 4-sulfate IdoA-α1,3-GalNAc(4s) 6 ΔDi4s
chondroitin 4-disulfate GlcA-β1,3-GalNAc(4s) 6 ΔDi4s
chondroitin 6-disulfate GlcA-β1,3-GalNAc(6s) ΔDi6s
chondroitin 2,4-disulfate GlcA(2s)-β1,3-GalNAc(4s) ΔDi2,4dis
chondroitin 2,6-disulfate GlcA(2s)-β1,3-GalNAc(6s) ΔDi2,6dis
chondroitin 4,6-disulfate GlcA-β1,3-GalNAc(4s,6s) ΔDi4,6dis
chondroitin 2,4,6-trisulfate GlcA(2s)-β1,3-GalNAc(4s,6s) ΔDi2,4,6tris
The used RP-HPLC method obtained baseline separation between ΔDiHA,
ΔDi0s, ΔDi4s, ΔDi4,6dis and ΔDi2,4,6tris. The elution times observed with the
current standard compounds suggest that this method was also suitable for other
sulphated ΔDi from CS/DS. Although, note that AMAC related peak at 19,5 min in
Figure 17 and ΔDi2s might elute at the same time using the current method. No
ΔDi2s standard was available so separation between the AMAC related peak and
ΔDi2s has not been verified. Deakin et al. [20] described that they clean up the
AMAC before derivatization reactions with ΔDi. Cleaning AMAC before
derivatization of disaccharides might be the solution to get rid of the observed
AMAC related peak eluting in the same time as the ΔDiGAGs. For obtaining
lower limits of detection the peak shape of ΔDi2,4,6tris which is non symmetric as
can be seen in Figure 16, might be improved. Structural conformations could be
performed by other detectors such as MS.
The Py-GC/MS based method was tried as an alternative for the HPLC-FLR
method to simplify the sample preparation. The problem at this point was that
nothing can be said from formed products and fragments. Additional time needs
to be spend on data interpretation and elucidating the pyrolysis reactions.
6 Enzymatic cleavage of dermatan 4-sulfate and chondroitin 4-sulfate causes the loss of stereo chemical difference present in the polysaccharide, as been shown in Figure 3. They both form the same disaccharide unit (ΔDi4s) [06]
R.J. VONK
40
7 Literature
[01] Broekhuizen L.N., et al., Endothelial glycocalyx as potential diagnostic and therapeutic
target in cardiovascular disease, Current Opinion in Lipidology, 20 (2009) 57-62
[02] Reitsma S., et al., Pflügers Archiv - European Journal of Physiology, 454 (2007) 345-
359
[03] Balazs E.A., Laurent T.C., and Jeanloz R.W., Nomenclature of hyaluronic acid,
Biochemical Journal, 235 (1986) 903
[04] Taylor K.R., and Gallo R.L., Glycosaminoglycans and their proteoglycans: host-
associated molecular patterns for initiation and modulation of inflammation, The FASEB
Journal, 20 (2006) 9-22
[05] Fraser J.R.E., Laurent T.C., and Laurent U.B.G., Hyaluronan: its nature, distribution,
functions and turnover, Journal of Internal Medicine, 242 (1997) 27-33
[06] Volpi N., High-performance liquid chromatography and on-line mass spectrometry
detection for the analysis of chondroitin sulfates/hyaluronan disaccharides derivatized
with 2-aminoacridone, Analytical Biochemistry, 397 (2010) 12-23
[07] Laurent T. C., and Fraser J. R. E., Catabolism of hyaluronan, In Degradation of Bio-
active Substances: Physiology and Pathophysiology (Henriksen, J. H., ed) (1991) 249-
265, CRC Press, Boca Raton, Florida
[08] Dahl L.B., et al., Concentration and molecular weight of sodium hyaluronate in synovial
fluid from patients with rheumatoid arthritis and other arthropathies, Annals of the
Rheumatic Diseases, 44 (1985) 817-822
[09] Lamari F.N., et al., Analysis of glycosaminoglycan-derived disaccharides in illogic
samples by capillary electrophoresis and protocol for sequencing glycosaminoglycans,
Biomedical Chromatography, 16 (2002) 95-102
[10] Sasisekharan R., Raman R., and Prabhakar V., Glycomisa approach to structure-
function relationships of glycosaminoglycans, Annual Review of Biomedical Engineering,
8 (2006) 181-231
[11] Esko J.D., and Selleck S.B., Order out of chaos: Assembly of ligand binding sites in
Heparan Sulfate, Annual Review of Biomedical Engineering, 718 (2002) 435-471
[12] Nieuwdorp M., et al., Perturbation of hyaluronan metabolism predisposes patient with
type 1 diabets mellitus to artherosclerosis, Diabetologia, 50 (2007) 1288-1293
[13] Faser J.R.E., and Laurent T.C., Turnover and metabolism of hyaluronan, In The biology
of Hyaluronan, Ciba Foundation Symposium, 143 (1989) 41-59, Wiley, Chichester,
England.
[14] Nurminen M., et al., Clinical Utility of liquid-chormatographic analysis of effusions for
hyaluronate content, General Clinical Chemistry, 40(5) (1994) 777-780
[15] Tengblad A., et al., Concentraion and relative molecular mass of hyaluronate in lymph
and blood, Biochemical Journal, 236 (1986) 521-525
R.J. VONK
41
[16] Lamari F., et al., Profiling of the eye aqueous humor in exfoliation syndrome by high-
performance liquid chromatographic analysis of hyaluronan and galactosaminoglycans,
Journal of Chromatography B, 709 (1998) 173–178
[17] Laurent U.B.G., and Reed R.K., Turnover of hyaluronan in the tissues, Advanced Drug
Delivery Reviews, 7 (1991) 237-256
[18] Karamanos N.K., and Hjerpe A., High-performance capillary electrophoretic analysis of
hyaluronan in effusions from human malignant mesothelioma, Journal of
Chromatography B, 697 (1997) 277–281
[19] Theocharis A.D., et al., human abdominal aortic aneurysm is closely associated with
compositional and specific structural modifications at the glycosaminoglycan level,
Atherosclerosis, 145(2) (1999) 359–368
[20] Deakin J.A., and Lyon M., A simplified and sensitive fluorescent method for disaccharide
analysis of both heparin sulfate and chondroitin/dermatan sulfates from biological
samples, Glycobiology, 18(6) (2008) 483-491
[21] Kitagawa H., Kinoshita A., and Sugahara K., Microanalysis of glycosaminoglycan-
derived disaccharides labeled with the fluorophore 2-aminoacridone by capillary
electrophoresis and high-performance liquid chromatography, Analytical Biochemistry,
232 (1995) 114-121
[22] Jackson P., Polyacrylamide gel electrophoresis of reducing saccharides labeled with the
fluorophore 2-aminoacridone: subpicomolar detection using an imaging system based
on a cooled charge-coupled device, Analytical Biochemistry, 196 (1991) 238-244
[23] Zamfir A.D., et al., On-line sheathless capillary electrophoresis/ nanoelectrospray
ionization-tandem mass spectrometry for the analysis of glyocsaminoglycan
oligosaccharides, Electrophoresis, 25 (2004) 2010-2016
[24] Lamari F.N., et al., Ultrasensitive capillary electrophoresis of sulfated disaccharides in
chondroitin/dermatan sulfates by laser-induced fluorescence after derivatization with 2-
aminoacridone, Journal of Chromatography B, 730 (1999) 129-133
[25] Laurent U.B.G., and Laurent T.C., On the origin of hyaluronate in blood, Biochemistry
International, 2(2) (1981) 195-199
[26] Moon M.H., et al., Flow field-flow fractionation/multiangle light scattering of sodium
hyaluronate from various degradation processes, Journal of Chromatography B, 864
(2008) 15-21
[27] Shin D.Y., et al., Molecular weight and structure characterization of sodium hyaluronate
and its gamma radiation degradation products by flow field-flow fractionation and on-line
multiangle light scattering, Journal of Chromatography A, 1160 (2007) 270-275
[28] Lee H., Cho I.H., and Moon M.H., Effect of dissolution temperature on the structures of
sodium hyaluronate by flow field-flow fractionation/multiangle light scattering, Journal of
Chromatography A, 1131 (2006) 185-191
R.J. VONK
42
[29] Orvisky E., et al., The Determination of Hyaluronan Molecular Weight Distribution by
Means of High- Performance Size Exclusion Chromatography, Journal of liquid
Chromatography, 15(18) (1992) 3203-3218
[30] Tømmeraas K., and Wahlund P.O., Poly-acid properties of biosynthetic hyaluronan
studied by titration, Carbohydrate polymers, 77 (2009) 194-200
[31] Chaidedgumjorn A., et al., Conductivity detection for molecular mass estimation of per-
O-sulfonated glycosaminoglycans separated by high-performance size-exclusion
chromatography, Journal of Chromatography A, 959 (2002) 95-102
[32] Technical details of the AsFlFFF apparatus provided by the manufacturer, website visited
on 1st October 2010; http://www.wyatt.eu/index.php?id=field_flow_fractionation
[33] Giddings J.C., Field-flow fractionation: Analysis of macromolecular, colloidal, and
particulate materials, Science, 260 (1993) 1456-1465
[34] Moon M.H., and Williams K.R., Course material from short course SCM-5, Field-Flow
Fractionation, January 2011
[35] Ambrosius M., Kleesiek K., and Götting C., Quantitative determination of the
glycosaminoglycan Δ-disaccharide composition of serum, platelets and granulocytes by
reversed-phase high-performance liquid chromatography, Journal of Chromatography A,
1201 (2008) 54-60
[36] Volpi N., and Linhardt R.J., High-performance liquid chromatography-mass spectrometry
for mapping and sequencing glycosaminoglycan-derived oligosaccharides, Nature
Protocols, 5 (2010) 993-1004
[37] Alvarez-Perez F.J., Castelo-Branco M., and Alvarez-Sabin J., Albumin level and stroke.
Potential association between lower albumin level and cardioembolic aetiology,
International Journal of Neuroscience, 121 (2011) 25-32
[38] Wissenschaftliche Tabellen Geigy, CIBA-GEIGY, Basel Switzerland (1976) 121-123
[39] Hilz H., Wiegers U., and Adamietz P., Stimulation of proteinase K action by denaturing
agents: application to the isolation of nucleic acids and the degradation of ‘masked’
proteins, European Journal of Biochemistry, 56 (1975) 103-108
[40] Bradford M.M., A rapid and sensitive method for the quantification of microgram
quantities of protein utilizing the principle of protein-dye binding, Analytical Biochemistry,
72 (1976) 248-254
[41] Product details at the website of the provider, visited on 10th Januari 2011;
http://www.sigmaaldrich.com/catalog/ProductDetail.do?lang=en&N4=P2308|SIAL&N5=S
EARCH_CONCAT_PNO|BRAND_KEY&F=SPEC
[42] Moon M.H., Effect of carrier solutions on particle retention in flow field-flow fractionation,
Bulletin of the Korean Chemical Society, 16(7) (1995) 613-619
[43] Moon M.H., Park I., and Kim Y., Size characterization of liposomes by flow filed-flow
fractionation and photon correlation spectroscopy effect of ionic strength and pH of
carrier solutions, Journal of Chromatography A, 813 (1998) 91-100
R.J. VONK
43
[44] Yamagata T., et al., Purification and properties of bacterial chondroitinases and
chondrosulfatases, The Journal of Biological Chemistry, 243 (1968) 1523-1535
[45] Product details at the website of the provider, visited on 10th February 2011;
http://www.sigmaaldrich.com/catalog/ProductDetail.do?lang=en&N4=53825U|SUPELCO
&N5=SEARCH_CONCAT_PNO|BRAND_KEY&F=SPEC
[46] Mota M.V.T., et al., Trypsin hydrolysis of whey protein concentrates: Characterization
using multivariate data analysis, Food Chemsitry, 94(2) (2006) 278-286
[47] Sweeney P.J., and Walker J.M., Pronase, Methods in Molecular Biology 16 (1993) 271-
276
[48] Gherezghiher T., et al., Rapid and sensitive method for measurement of hyaluronic acid
and isomeric chondroitin sulfates using high-performance liquid chromatography,
Journal of Chromatography, 413 (1987) 9-15
[49] Plaas A.H.K., West L.A., and Midura R.J., Keratan sulfate disaccharide composition
determination by FACE analysis of keratanase II and endo-β-galactosidase digestion
products, Glycobiology, 11(10) (2001) 779-790
[50] Hokputsa S., et al., A comparison of molecular mass determination of hyaluronic acid
using SEC/MALS and sedimentation equilibrium, European Biophysics Journal, 32
(2003) 450-456
R.J. VONK
44
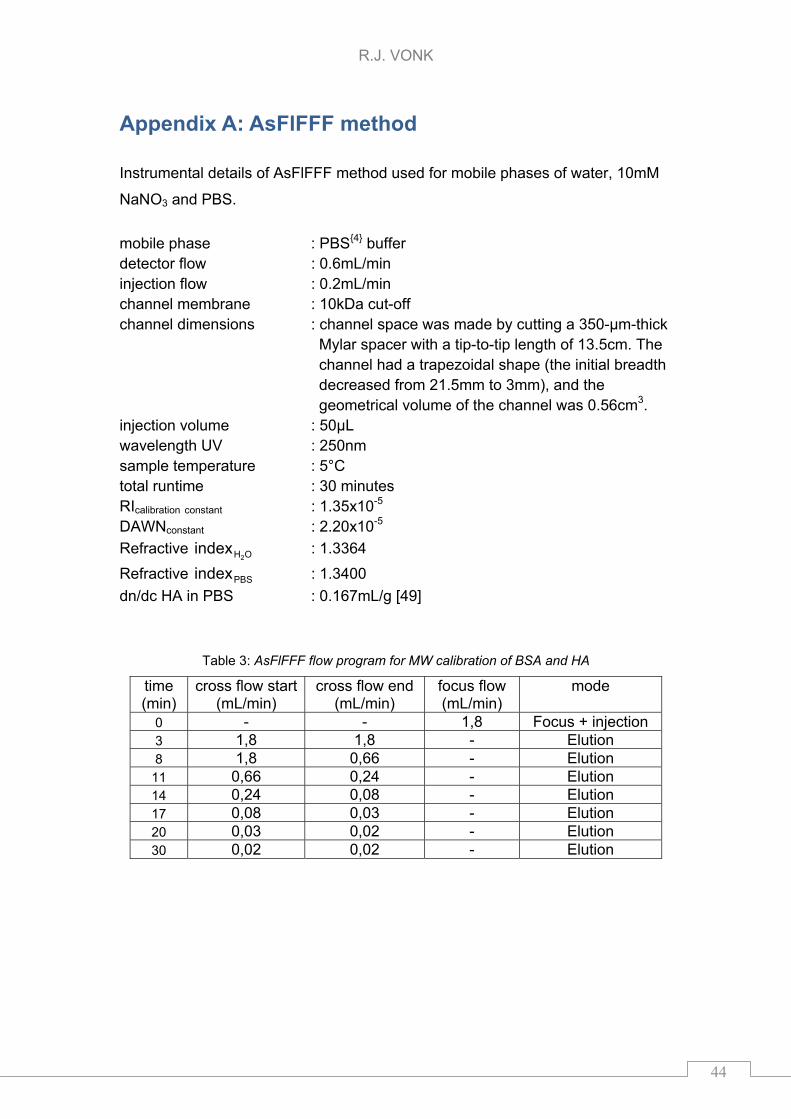
Appendix A: AsFlFFF method
Instrumental details of AsFlFFF method used for mobile phases of water, 10mM
NaNO3 and PBS.
mobile phase : PBS4 buffer detector flow : 0.6mL/min injection flow : 0.2mL/min channel membrane : 10kDa cut-off channel dimensions : channel space was made by cutting a 350-μm-thick
Mylar spacer with a tip-to-tip length of 13.5cm. The channel had a trapezoidal shape (the initial breadth decreased from 21.5mm to 3mm), and the geometrical volume of the channel was 0.56cm3.
injection volume : 50μL wavelength UV : 250nm sample temperature : 5°C total runtime : 30 minutes RIcalibration constant : 1.35x10⁻⁵
DAWNconstant : 2.20x10⁻⁵
Refractive OH2index : 1.3364
Refractive PBSindex : 1.3400
dn/dc HA in PBS : 0.167mL/g [49]
Table 3: AsFlFFF flow program for MW calibration of BSA and HA
time (min)
cross flow start (mL/min)
cross flow end (mL/min)
focus flow (mL/min)
mode
0 - - 1,8 Focus + injection 3 1,8 1,8 - Elution 8 1,8 0,66 - Elution
11 0,66 0,24 - Elution 14 0,24 0,08 - Elution 17 0,08 0,03 - Elution 20 0,03 0,02 - Elution 30 0,02 0,02 - Elution
R.J. VONK
45
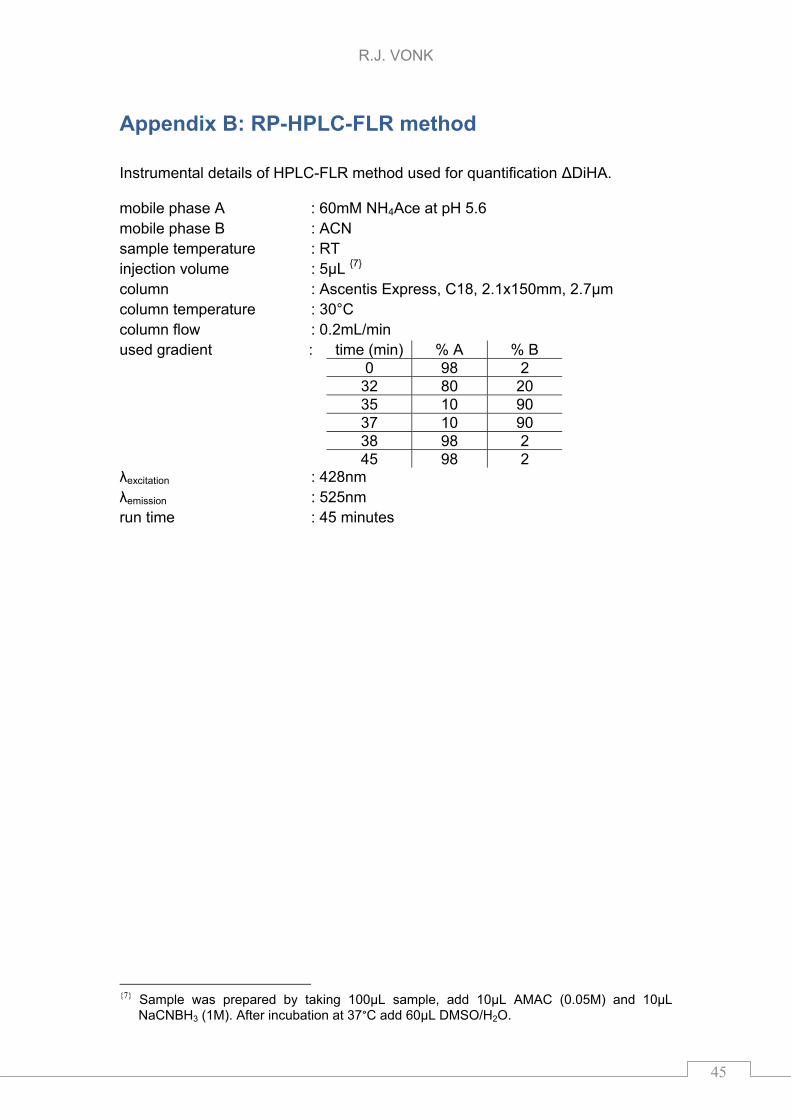
Appendix B: RP-HPLC-FLR method
Instrumental details of HPLC-FLR method used for quantification ΔDiHA. mobile phase A : 60mM NH4Ace at pH 5.6 mobile phase B : ACN sample temperature : RT injection volume : 5μL 7 column : Ascentis Express, C18, 2.1x150mm, 2.7μm column temperature : 30°C column flow : 0.2mL/min used gradient : time (min) % A % B 0 98 2 32 80 20 35 10 90 37 10 90 38 98 2 45 98 2 λexcitation : 428nm λemission : 525nm run time : 45 minutes
7 Sample was prepared by taking 100μL sample, add 10µL AMAC (0.05M) and 10µL
NaCNBH3 (1M). After incubation at 37°C add 60μL DMSO/H2O.
R.J. VONK
46
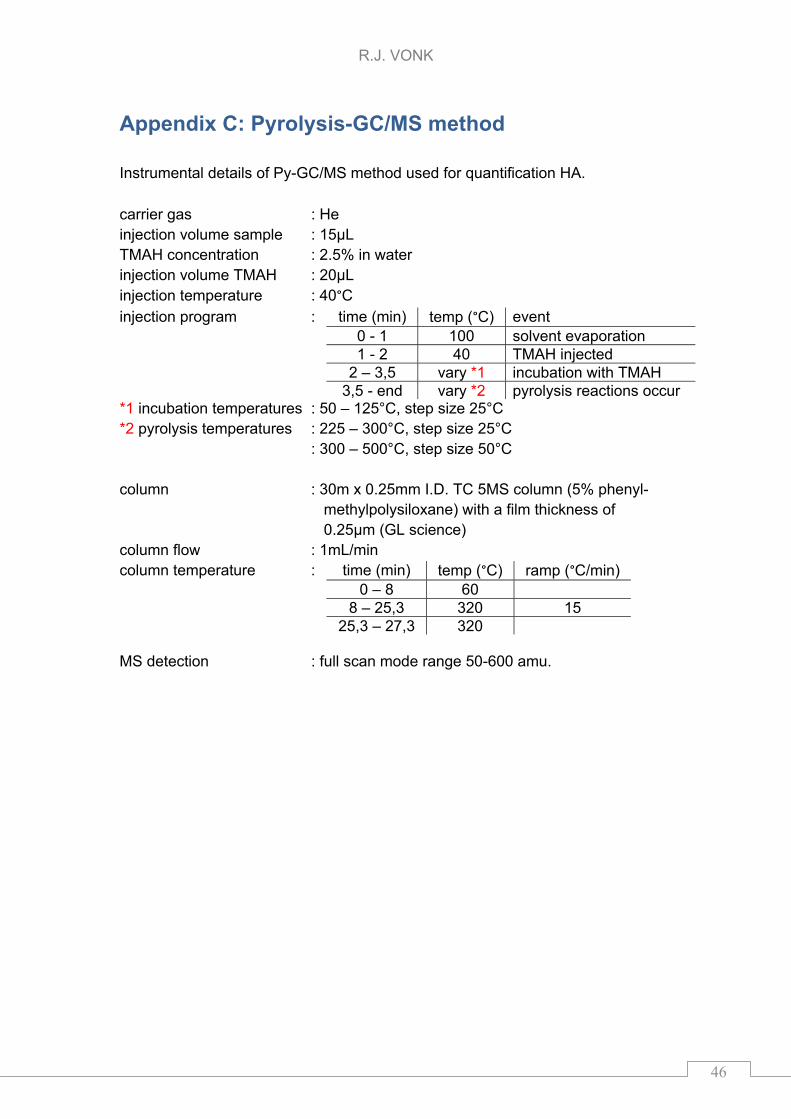
Appendix C: Pyrolysis-GC/MS method
Instrumental details of Py-GC/MS method used for quantification HA. carrier gas : He injection volume sample : 15µL TMAH concentration : 2.5% in water injection volume TMAH : 20µL injection temperature : 40°C injection program : time (min) temp (°C) event 0 - 1 100 solvent evaporation 1 - 2 40 TMAH injected 2 – 3,5 vary *1 incubation with TMAH 3,5 - end vary *2 pyrolysis reactions occur *1 incubation temperatures : 50 – 125°C, step size 25°C *2 pyrolysis temperatures : 225 – 300°C, step size 25°C : 300 – 500°C, step size 50°C column : 30m x 0.25mm I.D. TC 5MS column (5% phenyl-
methylpolysiloxane) with a film thickness of 0.25µm (GL science)
column flow : 1mL/min column temperature : time (min) temp (°C) ramp (°C/min) 0 – 8 60 8 – 25,3 320 15 25,3 – 27,3 320 MS detection : full scan mode range 50-600 amu.
R.J. VONK
47
Appendix D: Major project proposal
Major Project/ Research Thesis proposal Rudy Vonk (5897041)
October 2010 to March 2011
University of Amsterdam
Analytical Chemistry department
Supervisor: Dr. W.Th. Kok
Co-supervisor: R.N. Qureshi MSc
Develop a method for the size-characterization of
glycosaminoglycans (GAGs) in human blood serum
The glycocalyx forms a gel-like layer covering the endothelial lining, shielding
endothelial cells from direct contact with circulating blood cells. The glycocalyx-
related functions might be a diagnostic tool or even a therapeutic target for
preventive strategies in clinical practice [01]. Glycocalyx consist of a number of
glycoproteins and proteoglycans. The core proteoglycans are firmly connected to
the endothelial cell membrane and soluble proteoglycans. These proteoglycans
are the backbone for various glycosaminoglycans (GAGs) [01].
GAGs consist of repeating units of a disaccharide unit. Based on structure there
are four groups of GAGs namely (1) hyaluronic acid/hyaluronan [03] (HA), (2)
chondroitin sulfate (CS) and dermatan sulfate (DS), (3) heparin sulfate (HS) and
heparin (H), (4) keratin sulfate (KS) [35]. The differences between the four groups
are primary the building blocks of the disaccharides and the number of sulfate
groups. The property of the GAGs is divers. HA is crucial for structure and the
maintenance of the entangled network providing stability to the glycocalyx [01].
Due to shear stresses GAGs are synthesized in the blood vessel and damage the
artery which might lead to cardiovascular diseases. The size of the synthesized
GAGs ranges from 5 kDa to ~20 MDa.
In disease states HA is one of the first molecules to be shed from the glycocalyx
to exert several biological functions. Damaging the glycocalyx with hyaluronidase
R.J. VONK
48
has been associated with increased vascular vulnerability towards atherogenic
insults.
Looking at the sizes of HA, low-molecular-size polymers appear to function as
endogenous “danger signals”, while even smaller fragments can ameliorate these
effects. In pathologic situations, such as in shock, septicemia, massive trauma,
post surgery, blood loss and in burn patients, circulating high-molecular-mass HA
increases.
In the literature Volpi describes a method for the quantification of GAGs in human
plasma using mass spectrometry as detection method [06]. This method includes
enzymatic degradation of GAGs from plasma samples but does not include the
molecular-size determination of the GAGs in relation to the disease state.
Goal is to develop a method which is suitable for size-characterization of the
GAGs in human serum.
This project consists of, but might be changed based on rolling apprehension, the
following steps;
(1) The deproteination of serum samples, extractions of GAGs,
(2) Asymmetric Flow Field-Flow Fractionation (AsFlFFF) size-based
separation the GAGs into sample fragments
(3) Measure GAGs in the fragments of AsFlFFF by enzymatic breakdown
polysaccharides into disaccharide units, derivatization with fluorescence label
and measure on a HPLC-fluorescence detector.
(4) Measure the GAGs in the fragments of AsFlFFF on a pyrolysis GCMS.
Our aim is to measure GAGs using HPLC combined with fluorescence as a
detection method. Step 4 is opted in order to confirm structural information of the
AsFlFFF fragments and if pyrolysis GCMS is suitable it would be a fast and new
method for quantification of GAGs.
This research project focuses on analyzing the vast range of molecular weight of
HA polymers to show patterns that would provide insight into their production and
regulation of HA in different disease states.
R.J. VONK
49
Acknowledgements / Dankwoord
Een dankwoord schrijven is net als een Sinterklaas gedicht, het begint altijd met dezelfde zin… Dat vind ik niet erg origineel maar ja het hoort erbij. Ik denk niet dat ik aan één A4-tje genoeg heb om iedereen te bedanken die mij geholpen heeft bij het onderzoek de afgelopen 7 maanden, met het schrijven van de thesis en natuurlijk het volgen van de studie. Maar ik ga het toch proberen…. Als eerste wil ik Arnoud, inmiddels mijn voormalig leidinggevende, bedanken voor het mogelijk maken van het volgen van de Master studie naast mijn gewone werk. Ook toen het onweerde in Weesp heb ik van jou de mogelijkheid gehad om mijn studie af te ronden, bedankt voor je inzet daarin! Ook Niels en Sigrid, collega’s van de BM-groep, bedankt dat jullie het werk overgenomen hebben zodat ik mij volledig kon focussen op het research project. Sigrid verder wil ik je ook bedankt voor je kritische blik op mijn thesis en je tips en tricks om het geheel zo overzichtelijk mogelijk op papier te krijgen. Next I would like to thank you Rashid for your supervising during my research project. Your view on the project was a good guidance during the past 7 months. Also your notes and remarks during building this thesis were helpful. Ook wil ik graag Wim bedanken voor de begeleiding van het project en de verhelderende blik toen ik vast zat tijdens het onderzoek. Zonder je hulp bij het uitvoeren van de berekeningen waren die niet gelukt. Verder wil ik graag een paar collega’s bij de universiteit bedanken dat ik gebruik heb mogen maken van hun kennis en apparatuur tijdens het project. Winfried, dhr. L. de Jong en Prof. C. de Koster, zonder jullie bijdrage waren sommige stappen niet zo snel gegaan als ze nu zijn gegaan. In het rijtje van bedankjes hoort mijn dochter Isabel zeker thuis. Isabel hoewel je nog niet veel zegt, je bent per slot van rekening pas 10 maanden jong, en alleen maar veel lacht en af en toe ondeugend bent wil ik je bedanken voor je liefde het afgelopen jaar, nou ja eigenlijk pas 10 maanden. Als ik het niet zag zitten of het typen zat was liet jij mij altijd met je knuffelen zodat ik er daarna weer tegen kon! Bedankt lieve meid! Last but certainly not least wil ik graag mijn lieve vrouw Gerdien bedanken voor de steun tijdens de avonden achter de computer gedurende mijn gehele Master studie. Zonder jouw goede zorg en bemoedigende woorden weet ik niet of ik zover was gekomen. Rudy 20 april 2011