Embed Size (px)
Citation preview

Determination of Distribution Coefficientsfor Radionuclides of Concern
at the Westinghouse Hematite Facility
REV. 0
Prepared by:
I
GEO Consultants, LLC199 Kentucky Avenue
Kevil, KY 42053
and
An&En 7e-Owne-dCawnyScience Applications International Corporation
500 Northwest Plaza, Suite 1000St. Ann, MO 63074
Prepared for:
OWestinghouseWestinghouse Electric Company
Hematite Facility3300 State Road PFestus, MO 63028

TABLE OF CONTENTS
TABLES AND FIGURES............................................................................................................. IV
ABBREVIATIONS AND ACRONYMS........................................................................ ............. VI
EXECUTIVE SUMMARY ........................................................... VII
1. INTRODUCTION ........................................................... 1I
1.1 BACKGROUND ............................................................ 11.2 STUDY OBJECTIVES AND REPORT ORGANIZATON ........................................................ 2
2. PROCEDURES FOR DETERMINING SITE-SPECIFIC URANIUM AND TECHNETIUMDISTRIBUTION COEFFICIENCY ............................................................ 3
2.1 SOIL AND GROUNDWATER SAMPLE COLLECTION METHODS ...................... 32.1.1 Borehole locations ............................................................. 32.1.2 Borehole Drilling and Soil Coring Procedures .......................................................... 62.1.3 Groundwater Sample Collection and Field Analyses ................................................ 72.1.4 Field Analyses ............................................................ 7
2.2 LABORATORY METHODS ............................................................. 72.2.1 Radionuclide Analysis ............................................................. 72.2.2 Distribution Coefficient Measurement ............................................. ................ 72.2.3 Laboratory Measurement of Other Soil and Groundwater Parameters .................... 11
2.3 QUALITY CONTROL PROCEDURES ..................................................... 1....... 1
3. PHYSICAL AND CHEMICAL CHARACTERISTICS .......................................................... 12
3.1 SOIL TYPES AND PARTICLE SIZE DISTRIBUTIONS .................... ..................... 123.2 SOIL CHEMICAL CHARACTERISTICS ............................................................ 123.3 URANIUM AND TECHNETIUM ACTIVITIES IN SOIL SAMPLES ..................... 153.4 GROUNDWATER CHARACTERISTICS ............................................................ 17
4. RESULTS OF SITE-SPECIFIC KD STUDY ................................... ......................... 18
4.1 DESORPTION AND ADSORPTION KINETICS ...................................................... 184.2 CALCULATED DISTRIBUTION COEFFICIENTS ....................... 31
4.2.1 Uranium ............................................................ 314.2.2 Technetium ............................................................ 37
5. LITERATURE KD VALUES FOR OTHER RADIONUCLIDES ......................................... 42
5.1 PLUToNlUMv..................................................................................................... ............ 425.2 THoRIuM ............................................................ 435.3 NEPTUNIUM.................................................................................................................. .445.4 AMERIcluM ............................................................ 44
6. SUMMARY AND RECOMMENDATIONS ............................................................ 46
7. REFERENCES ............ 48
ii

TABLE OF CONTENTS
TABLES AND FIGURES ........................................................... III
ABBREVIATIONS AND ACRONYMS ........................................................... V
EXECUTIVE SUMMARY .......................................................... VI
1. INTRODUCTION.....................................................................................................................I
1.1 BACKGROUND .......................................................... 11.2 STUDY OBJECTIVES AND REPORT ORGANIZATON.........................................................2
2. PROCEDURES FOR DETERMINING SITE-SPECIFIC URANIUM AND TECHNETIUMDISTRIBUTION COEFFICIENCY ........................ ; 3
2.1 SOIL AND GROUNDWATER SAMPLE COLLECTION METHODS ....................... 32.1.1 Borehole locations ........................................................... 32.1.2 Borehole Drilling and Soil Coring Procedures ........................................................... 62.1.3 Groundwater Sample Collection and Field Analyses ................................................. 72.1.4 Field Analyses ........................................................... 7
2.2 LABORATORY METHODS .......................................................... 72.2.1 Radionuclide Analysis ........................................................... 72.2.2 Distribution Coefficient Measurement ........................................................... 72.2.3 Laboratory Measurement of Other Soil and Groundwater Parameters .................... I 11
2.3 QUALITY CONTROL PROCEDURES .......................................................... 11
3. PHYSICAL AND CHEMICAL CHARACTERISTICS .......................................................... 12
3.1 SOIL TYPES AND PARTICLE SIZE DISTRIBUTIONS .......................................... 123.2 SOIL CHEMICAL CHARACTERISTICS .......................................................... 123.3 URANIUM AND TECHNETIUM ACTIVITIES IN SOIL SAMPLES ...................... 153.4 GROUNDWATER CHARACTERISTICS .......................................................... 17
4. RESULTS OF SITE-SPECIFIC KD STUDY ........................................................ I 8
4.1 DESORPTION AND ADSORPTION KINETICS ...................................................... 184.2 CALCULATED DISTRIBUTION COEFFICIENTS .................................................. 31
4.2.1 Uranium .......................................................... 314.2.2 Technetium .......................................................... 37
5. LITERATURE KD VALUES FOR OTHER RADIONUCLIDES .......................................... 42
5.1 PLUTONIUM .......................................................... 425.2 THORIUM .......................................................... 435.3 NEPTUNIUM .......................................................... 445.4 AMERICIUM .......................................................... 44
6. SUMMARY AND RECOMMENDATIONS .......................................................... 46
7. REFERENCES .......................................................... 48

LIST OF APPENDICES
Appendix A - D ata Validation Reports .................................. A-1Appendix B - Boring Logs ................................ B-IAppendix C - Particle Size Distribution Results ................................ C-lAppendix D - Soil Properties vs. Depth .................................. D-1
ii

TABLES AND FIGURES
Tables
Table 1. Borehole coordinates in MO-East State Plane ................................................................ 4Table 2. Test conditions for distribution coefficient measurements .............................................. 8Table 3. Procedural details regarding application of ASTM*D4319 .......................................... 10Table 4. Field descriptions of soil samples collected for Kd testing and other analyses ............. 13Table 5. Particle size distribution analyses results .................................................................. 14Table 6. Physical and chemical characteristics of soil samples collected for Kd testing ............. 14Table 7. Uranium isotope and Technetium-99 activities in soil samples .................................... 15Table 8. Characteristics of groundwater samples collected for this study ................................... 17Table 9. Uranium concentrations in contact solutions during Kd tests ........................................ 1 l8Table 10. Technetium. activities in contact solutions during Kd tests . ...........................................1 l9Table 11. Mass balance calculations for uranium in soil/water mixtures . . 28Table 12. Mass balance calculations for technetium in soil/water mixtures . . 30Table 13. Calculated distribution coefficients for Uranium based on average U
concentration in contact solutions on Days 7, 10, and 14 ............................................ 33Table 14. Comparison of measured distribution coefficients for Uranium in this
study with published values .................................................................. 36Table 15. Calculated distribution coefficients for Technetium based on average Tc concentration
in contact solutions on Days 7, 10, and 14 ................................................................... 38Table 16. Comparison of measured distribution coefficients for technetium in this study with
published values Figures .................................................................. 39Table 17. Published Kd values for plutonium .................................................................. 43Table 18. Published Kd values for thorium .................................................................. 43Table 19. Published Kd values for neptunium .................................................................. 44Table 20. Published Kd values for Americium .................................................................. 45Table 21. Summary of Hematite soil properties measured in this study ...................................... 46Table 22. Recommended Kd values for RESRAD modeling at Hematite Site ............................. 47
Figures
Fig. 1. Locations of boreholes where samples were collected for laboratory K~d
measurements ........................................................... 5Fig. 2. Total uranium concentration in soil samples calculated from isotopic activities . 16Fig. 3. U concentration in contact solutions vs time for Batch 1 desorption tests .20Fig. 4. U concentration in contact solution vs time for Batch I adsorption tests .21Fig. 5. U concentration in contact solutions vs time for Batch 2 desorption tests .22Fig. 6. U concentration in contact solutions vs time for Batch 2 adsorption tests on samples
from BHKD1 and BHKD3 ................. 23Fig. 7. U concentration in contact solutions vs time for Batch 2 adsorption tests on samples
from BHKD4 and BHKD6 ................. 24
Fig. 8. Tc activities in contact solutions vs time for Batch I adsorption tests on samples fromBHKD2 ................. 25
Fig. 9. Tc activities in contact solutions vs time for Batch 2 adsorption tests on samples fromBHKDI and BHKD3 ................. 26
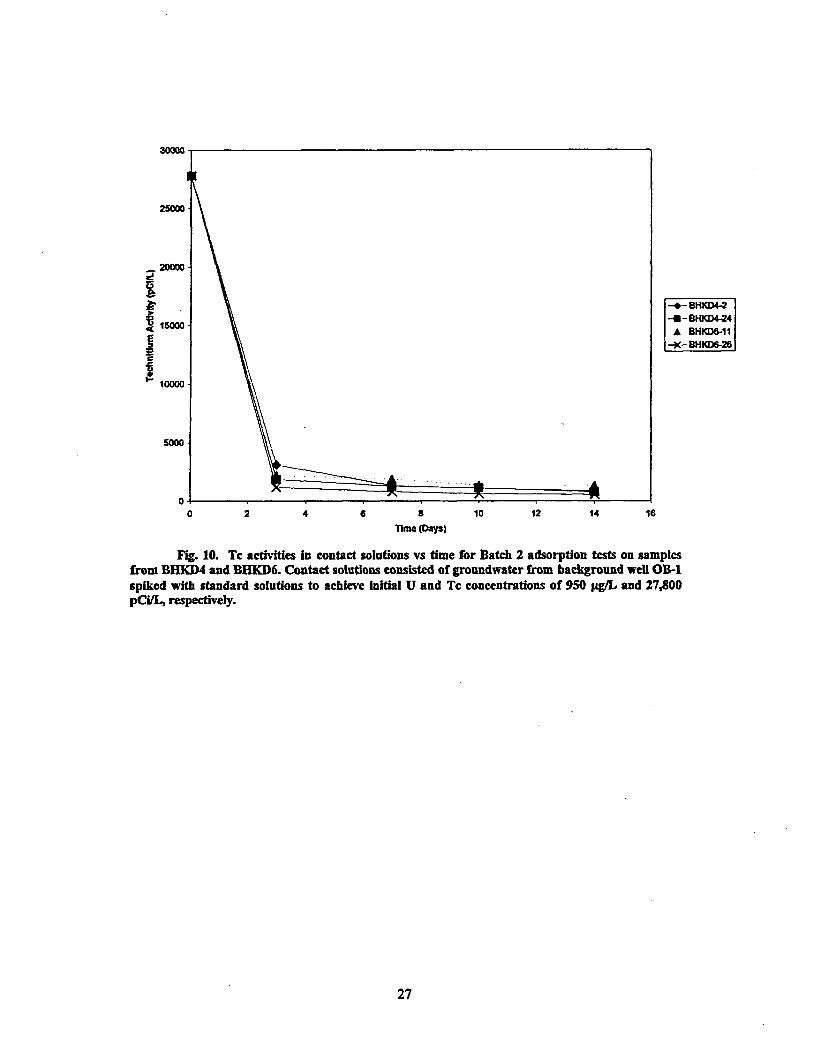
Fig. 10. Tc activities in contact solutions vs time for Batch 2 adsorption tests on samples fromBHKD4 and BHKD6.....................................................................................................27
iii

Fig. 11. Histograms of measured distribution coefficients ......................................................... 34Fig. 12. Distribution coefficients (Kd) for uranium measured in Hematite Site soil samples
plotted vs sample depth ................................................................. 35Fig. 13. Histogram of Tc Kd values, excluding high value from BHKD2-2 .............................. 40Fig. 14. Distribution coefficients (Kd) for Tc measured in Hematite Site soil samples plotted vs
sample depth ......................................................... 41
iv

ABBREVIATIONS AND ACRONYMS
ASTM American Society for Testing and Materialsbgs below ground surfaceCSSG clayey silty sandy gravelDCGL derived concentration guideline levelDOE U.S. Department of EnergyDQO data quality objectiveDSCC deep silty-clay/clayEC&HS Environmental Compliance and Health and SafetyEPA U.S. Environmental Protection AgencyGEO GEO Consultants, LLCHU hydrostratigraphic unitIDW investigation-derived wasteISCORS Interagency Steering Committee on Radiation StandardsJCD Jefferson City DolomiteLSC Liquid scintillation countingKd distribution coefficientKPA kinetic phosphorescence analysisMCAWW Methods for Chemical Analysis of Water and WastesNAD83 North American Datum of 1983NSSC near surface silt, silty clayORP oxidation reduction potentialQA quality assuranceQC quality controlRESRAD Residual Radioactivity, a computer code for evaluating radioactive sitesSAP Sampling and Analysis PlanSAIC Science Applications International Corporation
v

EXECUTIVE SUMMARY
The nuclear manufacturing facility at Hematite, Missouri was used for the production ofnuclear fuels from natural, depleted, and enriched uranium. More than 45 years of processingnuclear materials and formerly authorized on-site disposal of process waste has resulted inradionuclide contamination of surface and near-surface soils at the Hematite Site. As part of thedecommissioning process by Westinghouse, derived concentration guideline levels (DCGLs) forresidual soils must be determined for radionuclides of concern. DCGLs will be calculated usingthe Residual Radioactivity (RESRAD) model, in which the soil distribution coefficient or Kd is aninput parameter for simulating radionuclide leaching from contaminated soils. The primaryobjective of the study described in this report is to determine appropriate Kd factors for uranium(U), technetium (Tc), thorium (Th), plutonium (Pu), americium (Am), and neptunium (Np) to beused for modeling radionuclide leaching from unconsolidated soils at the Hematite Site. Becausehigher-than-background levels of U isotopes (2MU, 235U, and 2381J) and Tc (as "Tc) have beenmeasured during previous characterization events, site-specific Kd factors for these radionuclideswere measured in the laboratory using soil samples collected from the Hematite Site. Th, Pu,Am, and Np are contaminants of concern based on site history but have not been detected duringprevious characterization efforts. Thus, it was deemed sufficient to obtain Kd factors for theseradionuclides from the published literature.
Site-specific measurements for K4 were performed on samples collected from areas ofconcern within the Hematite Site. Six boreholes were drilled to refusal or bedrock (-30 to 35 ft),and 18 soil samples (3 depth intervals per borehole) were collected for Kd testing, radionuclideanalysis, and general soil characterization procedures. Groundwater used for the Kd tests wastaken from an uncontaminated background monitoring well. All samples collected from the siteconsisted of very fine-grained, brown silty clay. The sand/gravel unit described in previouscharacterization efforts was encountered in four out of six boreholes but at a thickness of less than1 fA not enough to obtain representative samples for Kd testing. The fine-grained nature of the soilsamples was confirmed by particle size distribution measurements, which showed the soils toconsist of >96% silt and clay sized fractions and -30% clay. Soil pH ranged from 5.8 to 8.3, totalorganic carbon ranged from 2.2 to 14 g/kg and iron (extracted through hot-acid digestion) rangedfrom I 1.1 to 21.2 g/kg. Uranium activities were detected at significant levels in samples from therestricted areas, and in shallowest sample from the Tile Barn/Cistern Burn Pit area. Except forone sample from the restricted areas, technetium was not detected above the laboratory reportinglimits in the samples collected for this study.
Kd testing was performed following ASTM 4319-93, Standard Test Method for DistributionRatios by the Short-term Batch Method, as recommended in the RESRAD data collectionhandbook. Two types of Kd tests were performed: (1) desorption tests where a measured mass ofsoil was contacted with a measured volume of uncontaminated groundwater over a period of 14days, and (2) adsorption tests where soil was contacted with uncontaminated groundwater spikedto predetermined levels of U (as the uranyl ion or U02
24) and 9Tc (as the pertechnetate ionTcO4). For uranium, lower overall Kd values were observed in the adsorption tests, whencompared to the desorption tests. Average Kds from the adsorption and desorption tests werecalculated, and the mean of the averages was considered the "best" estimate for U Kd for theHematite Site. Although the desorption tests are likely to be more representative of contaminantleaching under field conditions, the adsorption data were still considered to yield a reasonable butconservative site-specific Kd for uranium. For Tc, significant removal of Tc was observed fromthe liquid phase of the soil/water mixtures within 3 days. This "apparent" sorption could be due
vi

to the reduction of Tc(VII) to Tc(VI) and adsorption or precipitation of the latter, rather thanelectrostatic interactions of Tc(VII) with soil mineral surfaces. The resulting Kds for Tc aresignificantly higher than published values, but the validity of Kd obtained from this study issupported by results that were repeated in multiple soil samples at several time intervals, andrecovery of the Tc on the solid residues.
The following table shows recommended Kd values for radionuclides of interest to the HematiteSite. The U and Tc Kd values are site-specific in that these were measured using soil samplescollected from the site. Because there were no distinct trends with depth in the Kd measurementsfor both U and Tc, spatial variability is best addressed by assuming that the unconsolidatedsediments overlying bedrock at the Hematite Site can be characterized by a single Kd parameterthat has either a log-normal (for U) or uniform (for Tc) distribution. The K~d values for the rest ofthe radionuclides are based on published literature values.
RecommendedRadionuclides K1 value Remarks
of Concern (mLdva) Remarks
Uranium 175 Site specific measurement with range of 6.6 and 471.4_ __g; grossly approAimates a lognonnal distributon.
Site specific measurement with range of 15.1 and 172.9Technetium 106 mL/g; approxdmates a uniform distribution between 0
and 200 milg.
Plutonium 2000 RESRAD default value, reasonable when compared topublished literatue.
Thorium 60000 RESRAD default value, reasonable when compared topublished literature.Neptunium 2 At low end of published literature values.Americium 100Consistent with published literature values, more
Amencim 1000reasonable than default Kd of 20.
vii

1. INTRODUCTION
1.1 BACKGROUND
The nuclear manufacturing facility at Hematite, Missouri, referred to in this report as theHematite Site, was formerly used for the production of nuclear fuels from natural, depleted, andenriched uranium. The Hematite Site consists of 228 acres of property, 8 acres of which wereused for operations. After taking ownership of the facility in 2000, Westinghouse ElectricCompany ceased operations and is proceeding with plant decommissioning.
More than 45 years of processing nuclear materials and formerly authorized on-sitedisposal of process waste has resulted in radionuclide contamination of surface and near-surfacesoils at the Hematite Site. These soils or unconsolidated sediments consist of a fine-grained siltyclay/clay layer and a sand-gravel unit, with a total thickness of approximately 30 to 40 ft beneaththe site [LBG 2003]. As part of the decommissioning process by Westinghouse, derivedconcentration guideline levels (DCGLs) for residual soils must be determined for radionuclides ofconcern in accordance with the requirements of 1 OCFR20, Subpart E. DCGLs will be calculatedusing the Residual Radioactivity (RESRAD) model [Yu et al. 2001], in which the soil distributioncoefficient or Kd is an input parameter for simulating radionuclide leaching from contaminatedsoils. The K4 factor is defined as the concentration of a chemical species on the solid fractiondivided by the concentration in the aqueous phase:
SKd
where S is mass of chemical species sorbed per unit mass of soil, and C,, is mass of chemicalspecies per volume of solution. When the Kd parameter is used to model the leaching ofchemicals from contaminated soils, the underlying assumption is that rapid equilibrium is reachedbetween the dissolved and sorbed concentrations of a chemical species, and that these twoconcentrations are linearly related through the Kd factor. In theory, the Kd factor is used tocharacterize the reversible adsorption of a chemical species on solid surfaces including soilminerals and organic matter. However, other chemical processes, including mineral precipitation,diffusion into dead-end pores and attachment to microbes, can influence the experimentalmeasurement of Kd. Although research efforts have attempted to differentiate adsorption fromthese other processes, there are no universally accepted standard methods for doing so.
There are two laboratory approaches for measuring Kd: the "batch" and the "column" methods.The "batch" method for measuring Kd consists of equilibrating a measured mass of soil with aselected contact solution (e.g., synthetic or site groundwater). In the more commonly usedadsorption mode for Kd testing, the contact solution is spiked with a measured mass of thechemical species of interest which then adsorbs onto the soil during equilibration. It is alsopossible to use contaminated soils, in which case the chemical species of interest desorbs from thesoil into the contact solution. The concentration of the chemical species is then monitored in thecontact liquid over time. When this concentration reaches a steady state, it is assumed that theliquid and solid concentrations are in equilibrium, and Kd is calculated from their ratio. Theliquid concentration is directly measured, while the solid concentration is usually inferred from amass balance knowing the initial mass of chemical species in the soil/water mixture. In the"column" procedure for measuring KY, a soil column (i.e., a cylinder packed with soil) is flushed
1

with the contact solution under a controlled flow rate. The Kd factor is then determined byanalyzing the breakthrough of the chemical species of interest at the effluent end of the soilcolumn. The "column" procedure is a closer simulation of the physical processes occurring in thefield, however the experimental set-up and data interpretation are more difficult when comparedto the "batch" procedure. Moreover, batch and column loading of uranyl complexes wascompared in one study and no significant differences were observed [Bostick et al. 2002]. Thus,the "batch" procedure is more commonly used when a large number tests are needed tocharacterize spatial variability. Kd measurements in this study were performed using a "batch"procedure.
1.2 STUDY OBJECTIVES AND REPORT ORGANIZATION
The primary objective of the study described in this report is to determine appropriate Kdfactors for uranium (U), technetium (Tc), thorium (Th), plutonium (Pu), americium (Am), andneptunium (Np) to be used for modeling radionuclide leaching from unconsolidated soils at theHematite Site. Because higher-than-background levels of U isotopes (2MU, 235U, and 238U) and Tc(as 99Tc) have been measured during previous characterization events, site-specific Kd factors forthese radionuclides were measured in the laboratory using soil samples collected from theHematite Site. The laboratory Kd measurements were conducted following ASTM D 4319-93,Standard Test Method for Distribution Ratios by the Short-Term Batch Method, which is theprocedure recommended in the RESRAD data collection manual [Yu et al., 1993]. Th, Pu, Am,and Np are contaminants of concern based on site history but have not been detected duringprevious characterization efforts. Thus, it was deemed sufficient to obtain Kd factors for theseradionuclides from the published literature.
A secondary objective for the activities described in this report is to obtain radionuclidecontamination data as well as basic geochemical and physical properties of soil samples collectedfrom selected areas of concern within the Hematite Site. These data were used in assessing thelaboratory-measured U and Tc Kd factors, through comparisons with published studies on similarsoils, and in selecting Kd factors for Th, Pu, Am, and Np from literature values.
This report describes the site-specific laboratory measurement of Kd factors for U and Tcon soil samples collected from the Hematite Site. It also includes the selection of appropriate Kdfactors for Th, Pu, Am, and Np from literature Kd values. The report is organized as follows:
a Section 2 contains the methods used to collect and characterize soil and groundwatersamples from the Hematite Site for this study and the laboratory procedures followed tomeasure site-specific Kd factors for U and Tc.
* Section 3 describes results of physical, geochemical, and radionuclide (U isotopes and9Tc) analyses of soil and groundwater samples collected from the Hematite Site for thisstudy.
* Section 4 provides results of laboratory U and Tc Kd measurements and a discussion ofthese results in comparison with published literature values.
* Section 5 contains literature Kd values for the other radionuclides (Th, Am, Pu, Np).* Section 6 summarizes the primary findings from this study and includes a table
containing Kd values for U, Tc, Th, Pu, Am, and Np recommended for use in RESRADmodeling and DCGL calculations for the Hematite Site.
2

2. PROCEDURES FOR DETERMINING SITE-SPECIFICURANIUM AND TECHNETIUM DISTRIBUTION
COEFFICIENTS
2.1 SOIL AND GROUNDWATER SAMPLE COLLECTION METHODS
Laboratory Kd measurements for U and Tc were performed on soil samples collected fromareas of concern within the Hematite site. A bulk sample of groundwater from a background wellwas collected and used in preparing contact solutions for the Kd tests. Details regarding soil andgroundwater sample collection are described below.
2.1.1 Borehole locations
Soil samples were collected from six boreholes located based on site history, previoussubsurface characterization [LBG 2003], and a recently conducted gamma walkover survey[SAIC 2003]. Coordinates of these boreholes were measured via a Global Positioning System andare shown in Table 1. Areas surrounding borehole locations are described below (see Fig. I forborehole location map):
1. Duels Mountain (Borehole BHKDI) - Refers to a pile of excavated and potentiallycontaminated soil stored along the southeast corner of the fence line.
2. Burial Pits (Borehole BHKD2) - Approximately 40 burial pits are known to exist outsidethe fenced area based on available plant documentation.
3. Tile Barn Cistern Bum Pit (Borehole BHKD3) - The roof of the Red Room (referring toBuilding 240, Area 240-2 formerly used for highly enriched U conversion processes) wasreportedly buried in an area south of the Tile Barn.
4. Restricted Area No.1 (Borehole BHKD4) - This borehole is located in "restricted areas"where elevated gamma radiation was detected during the walkover survey [SAIC 2003].
5. Restricted Area No. 2 (Borehole BHKD5) - This borehole is also located in "restrictedareas" where elevated gamma radiation was detected during the walkover survey [SAIC2003].
6. Evaporation Pond (Borehole BHKD6) - Past waste management practices have includedthe disposal of water containing trichloroethylene and 99Tc from cylinder washing.
3

Table 1. Borehole coordinates in MO-East State Plane (NAD83) coordinate system
Borehole ID Area EASTING NORTHING(ft) (ft)
BHKD 1 Duel's Mountain 82748934 864930AI
BHKD 2 Burial Pits 827677.93 864996.11
BHKD 3 Tile Barn Cistern Bum Pit 826723.31 864800.19
BHKD 4 Restricted Area #1 827245.45 864663.76
BHKD 5 Restricted Area #2 827255.37 864725.49
BHKD 6 Evaporation Ponds 827320.86 864645.66
*NADS3: North Amenican Datum of 1983
4

Fig. 1. Lachtlois of boreholet where samples were collected for laboratory K3 measurements
5

2.1.2 Borehole Drilling and Soil Coring Procedures
Continuous soil cores were collected in 3 to 4 ft long, 2-in diameter acetate sleevesusing a direct-push drill rig. This coring method was chosen over auger drilling because it ismore economical and capable of collecting relatively intact samples from unconsolidatedsediments at depths anticipated for the Hematite Site (<35 ft). In addition, this method ofdrilling/coring minimized the amount of investigation-derived waste (IDW) generated during theproject.
Immediately after collection, cores contained in acetate sleeves were laid out on field tablesand sleeves were cut for better visual examination. Gross gamma and beta scanning of the soilcores was performed to delineate contaminated zones within each core and allow collection ofcontaminated soil samples needed for the desorption Kd tests (see Section 2.2). Geologicdescriptions were logged, with particular attention to mottling and appearance of iron oxide inorder to estimate probable redox conditions of the soil. Water saturation of the cores werevisually examined, recorded, and used to estimate the location of the water table.
Field geologists attempted to delineate the hydrostratigraphic units (HU) described duringprevious site investigations. Within the unconsolidated sediments, these units included a "near-surface silt/silty clay" unit (NSSC), a "deeper silty-clay/clay" unit (DSSC), and a "clayey, silty,sandy-gravel" unit (CSSG) [LBG 2003]. An attempt was made to collect samples for Kdmeasurements from each HU within each borehole. However, as will be shown later (Section3.1), it was impossible to visually differentiate between the NSSC and the DSSC layers in thefield. Furthermore, the CSSG layer was not encountered at a significant thickness before drillrefusal. Soil samples (-I kg) were collected from each borehole from three depths, focusing onintervals with elevated gamma and/or beta radiation from the core scans. This approach was usedto increase the likelihood of collecting contaminated samples for desorption K& measurements(see Section 2.2).
The soil samples were collected using pre-cleaned spatulas and placed in 1-L, wide-mouth,pre-cleaned polyethylene bottles. The bottles were then sealed with a chain-of-custody labelaffixed over the cap, and the bottles were labeled with the following information:
borehole number• sample label• sampling depth interval• date and time collected* sampler name
Samples were labeled according to the following scheme: BHKDI -03, where the first field(BHKDI) corresponds to the borehole number, and the second field (03) corresponds to the upperlimit of the sampling interval (e.g., 3 ft below ground surface). The soil samples were thenpackaged in ice and transported within 24 hours to the laboratory, together with completed chain-of-custody forms. A second 1-kg sample of soil was also collected for archiving, and labeled asBHKD1-03-ARCH. In total, 36 soil samples were collected, 18 of which were sent immediatelyto the laboratory for Kd measurements and other analyses while the remainder were archived andstored on site.
6

2.13 Groundwater Sample Collection and Field Analyses
Groundwater uncontaminated by radionuclides needed for preparing contact solutions inthe laboratory Kd tests was collected from OB-1, a background-monitoring well locatedapproximately 1000 to 1200 ft south/southwest from the center of the Hematite plant's main area.OB-1 is a 2-in diameter polyvinyl chloride (PVC) well with a depth of 26.2 ft and 16.2-ft wellscreen located within the unconsolidated sediments. Groundwater from this well was collectedusing a peristaltic pump and directly placed in a 20-L container. The headspace of the 20-Lcontainer was purged with nitrogen gas, immediately capped and a chain-of-custody seal affixedto the cap. Smaller volume groundwater samples were also collected in 40-mL vials for 234U,235U, 238U, 99Tc activity analyses, major cation (Ca, K, Mg, Na) and anion (Cl, NO3 - S0 4 -2)analyses. The groundwater samples were brought to the laboratory where they were stored at-40 C prior to analyses or use in Kd tests. The samples for cation analyses were preserved withnitric acid as soon as they were received in the laboratory. The purpose of nitrogen gas purging(for the 20-L sample) and cool storage is to maintain, to the extent possible, the dissolved oxygencontent of the groundwater as well as minimize biological activity and chemical processes thatcan alter the water chemistry.
2.1A Field Analyses
Gross gamma/beta scans were performed on the soil cores in the field using zinc sulfide(alpha/beta) and 2" x 2" sodium iodide (gamma) hand-held meters. The field radiologicalmeasurements were used to determine sampling locations within each boring.
A number of groundwater parameters (pH, temperature, oxidation reduction potential(ORP), specific conductivity, and dissolved oxygen) were measured in the field at monitoringwell OB-1 using a multi-parameter water quality instrument. Alkalinity and dissolved Fe weremeasured within 24 hours using single parameter test kits. Groundwater parameters were alsomeasured in WS-14, a 2-in diameter PVC well screened within the unconsolidated sediments andlocated within 50 ft of BHKD2 in the Burial Pits area. Of the six boreholes, only BHKD2 waslocated near an existing groundwater monitoring well.
2.2 LABORATORY METHODS
2.2.1 Radionuclide Analysis
Upon receipt, the laboratory collected sub-samples from each of the 18 soil samples forisotopic U analysis via alpha spectroscopy following NAS/DOE 3050, and 99Tc analysis vialiquid scintillation counting (LSC) following DOE TC-02-RC. A sub-sample of the groundwatersample from OB-1 was analyzed for total U via kinetic phosphorescence analysis (KPA)following ASTM D5 174, and Tc via LSC following DOE TC-02-RC.
2.2.2 Distribution Coefficient Measurement
Kd factors for U and 99Tc were measured following ASTM 4319-93, Standard Test Methodfor Distribution Ratios by the Short-term Batch Method, as recommended in the RESRAD datacollection handbook [Yu, et al., 1993]. The ASTM method uses the term "distribution ratio" (or
7

Rd) instead of "distribution coefficient" (or Kd) to avoid implying that equilibrium is attained inthe measurements. In this study, the tests were performed for a maximum of 14 days, at whichpoint steady-state concentrations in the contact solutions was observed in most of the tests andassumed to represent equilibrium conditions.
Two types of Kd tests were performed: (I) desorption tests where a measured mass ofsoil (20 g) was contacted with a measured volume of OB-I groundwater (80 mLs) over a periodof 14 days, and (2) adsorption tests where 20 g of soil was contacted with 80-mLs of OB-Igroundwater spiked to predetermined levels of U (as the uranyl ion or UO22+) and 99Tc (as thepertechnetate ion TcO4).
Although the adsorption test protocol is more commonly applied in research and practicedue to the ability to control and accurately quantify radionuclide levels in the soil/water mixtures,the desorption tests more closely simulate radionuclide leaching from contaminated soils in thefield. Before the Kd tests were initiated, the field-sampled radionuclide levels were reviewed toselect soil samples containing U and 99Tc at high enough levels such that detectable radionuclidelevels would likely be present in the contact solution. Furthermore, the K1 tests were performed in.two batches to allow modifications in the Kd test procedures (e.g., spike levels) between batchesto improve test measurements. Initially, desorption tests were performed on four of the sampleswith the highest levels of U. Two additional soil samples were later determined to have asufficient amount of U that would possibly result in measurable U levels in the contact solutionsduring a desorption Kd test, based on the Kd factors measured from Batch 1. These two sampleswere subjected to desorption Kd testing in Batch 2. None of the soil samples collected for thisstudy-contained "Tc that exceeded the laboratory-reporting limit (10 pCi/g). Table 2 shows thesamples that were used for each type of Kd test. The target spike levels in Batch I were 10,000pg/L and 150 pCifL for U and 99Tc, respectively, and 1000 pg/L and 25,000 pCi/L for U and "Tc,respectively, in Batch 2. The values shown in Table 2 are based on analyses of the contactsolutions. The actual Tc concentration in Batch I is higher than the target level, suspected to bedue to errors in dispensing the minute volume of Tc standard solution when the contact solutionswere prepared.
Table 2. Test conditions for distribution coefficient measurements
Type of 1(4 Test Samples Radionuclide levels inTypef~d~st |Sampes |contact solution*l
Batch IDesorption test BHKD3-8 Unspiked*
BHKD5-1; -19; -27
Adsorption test BHKD2-4; -13; -23 1 0,000 pg/L U; 600 pCi/L '9TcBatch 2Desorption test BHKD4-14 Unspiked
BHKD6-1Adsorption test BHKDI-4; -23; -28 950 pg/L U; 27,800 pCiL
BHKD3-16; -23BHKD4-2; 24BHKD6-1 1; 26
*A bulk groundwater sample (20 L) from a background well (OB-1) was used for preparing contact solutions. Refer toTable 8 for radionuclide levels in groundwater sample.
8

Although visual observations of soil samples and field analyses in this study indicatemildly reducing conditions (discussed in Section 3), there are no available site-wide redoxmeasurements. Thus, no attempts were made to strictly control the oxidizing conditions duringthe Ku tests. Furthermore, measured Vd factors under oxidizing conditions should be lower (andmore conservative) because it will be unlikely for U (VI) (the oxidation state of U in U0 2
24) toreductively precipitate as U (IV). Table 3 summarizes procedural details on how ASTM D 4319was applied to Kd measurements on the Hematite samples, including any deviations from therecommended procedures.
For each soil sample, eight soil/water mixtures were prepared to enable sacrificialsampling of each mixture for 99Tc and U analysis of the supernatant at eight predetermined timeintervals (Days 3, 7, 10, 14, 21, 28, 35, 45). However, Batch I test results indicated steady-state Uand 99Tc levels in the contact liquid (see Section 4.1) were achieved in 14 days. Thus, thesupernatant in the soil/water mixtures were analyzed on Days 3, 7, 10, and 14 in both Batch I andBatch 2 Kd tests. 49Tc and total U in the supematant/contact liquids were quantified through LSCand KPA, respectively.
9

Table 3. Procedural details regarding application of ASTM* D 4319, "Standard TestMethod for Distribution Ratios by the Short-term Batch Method," to Hematite s inple.:.
(Specific procedures are given in Section 7 of ASTM D 4319)
ASTMMethod Notes regarding application to Hematite samples
Subsection7.1 Soil samples were disaggregated using a ball mill grinder to maximize homogcnization
and minimize variability between soil/water mixtures prepared for each soil sample.7.2 Organic matter was not removed prior to Kd testing. This step is not necessary s ince
the intent of the measurements was to obtain model parameters for leaching from fik 1d.soils with its natural organic content.
7.3 Characterization of soil samples prior to K1 tests included: pH, total and organiccarbon, moisture content, particle size distribution, total Fe and Mn, U isotopes and99Tc (refer to Section 2.2.1 and 2.2.3 for methods). Characterization of 013- Igroundwater used as contact solution included: pH, DO, ORP, dissolved Fe, aikalinity,specific conductivity, NO3; Cr, SO;, Ca, K, Mg, Na).
7.4 Bulk samples were ground to ensure homogeneity among subsamples collected forpreparing soil/water mixtures.Soil samples were air-dried before disaggregation (Section 7.1). Air-drying waSdeemed acceptable since in situ redox conditions at Hematite are largely unknoxvn.
7.5 OB-I groundwater was used to pre-treat/pre-wash soil samples in Batch 1. This st pwas eliminated in Batch 2 to avoid loss of natural U from the soil samples, whichcould bias Kd estimates if the field-sampled U concentration were used in calculations.
7.6 Two types of treatment solution/contact liquid were used: (1) unspiked 013- Igroundwater for desorption tests, and (2) OB-I groundwater spiked with U and 5TIc
using certified standard solutions (refer to Table 2 for concentrations).The pH of soi liquid mixtures was adjusted to 6.6, value measured for 013- I in the field.
7.7 Specific conductance of each solution was not measured nor required in this studs.7.8 Contact periods for each soil sample were 3, 7, 10, and 14 days. Steady-state
conditions were achieved within 14 days.
.PIIi
I
I
7.9 pH of mixtures was measured in Batch 2 samples. Eh measurement was not necess"r'since mixtures were kept under atmospheric conditions
7. Analysis of total U and '9Tc in the supernatant were measured via KPA and LSC,7 respectively.
7.11 Supernatant liquids were filtered before analysis.7.12 Mass balance was assessed through solid residue analyses of Day 14 soil'water
mixtures (see 7.13 below).7.13 Filtered residues for Day 14 were measured in selected soil samples to assess mass
balance.
America^. Society for Testing Materials
10

2.23 Laboratory Measurement of Other Soil and Groundwater Parameters
Other soil and groundwater parameters measured in the laboratory include the following.
Moisture content MCAWW 160.3 MODSoil pH SW846 9045AParticle Size Distribution ASTM D422Total organic carbon/soil SW846 9060Total carbon/soil SW846 9060Total Fe/soil SW846 6010BTotal Mn/soil - SW846 6010BMajor cations/groundwater SW846 6010BMajor anions/groundwater SW846 9056A
Except for the particle size distribution, all parameters were measured in all 18-soilsamples collected from the boreholes. Particle size distributions were measured in soil samplesfrom two boreholes (BHKD5 and BHKD6).
2.3 QUALITY CONTROL PROCEDURES
Established field quality control (QC) procedures were followed to ensure that fieldactivities comply with the approved Quality Assurance (QA) Program Plan. Field TechnicalProcedures used for this project were listed in the project SAP [GEO and SAIC, 2003]. Thelaboratory adhered to all the QA/QC requirements specified in the analysis methods used in thisstudy.
Data validation technical reviews were performed in accordance with the ContractLaboratory Program Data Validation Functional Guidelinesfor Evaluating Inorganic AnalyticalData, and the Laboratory Data Validation Guidelines for Evaluating Radionuclide Analyses andRadiochemical Data Verification and Validation. These reviews were based on the informationand documentation supplied by the laboratory. There were only minor findings in these reviews,none of which affected the accuracy of the Kd values calculated from the analytical data.Complete data validation reports can be found in Appendix A.
11

3. PHYSICAL AND CHEMICAL CHARACTERISTICSOF STUDY SOIL SAMPLES
3.1 SOIL TYPES AND PARTICLE SIZE DISTRIBUTIONS
Soil samples were collected from three depth intervals from each borehole and weredescribed as brown silty clay with increasing degrees of limonite and gray mottling and thepresence of chert and/or limestone fragments at lower depths (see Table 4 and complete boringlogs in Appendix B). Gray mottling indicates dissolution of ferric iron (i.e., Fe3+ in iron oxides) asferrous iron (Fe2+), a microbial process that requires anaerobic conditions under normalenvironmental pH conditions. Thus, it appears the soils are poorly aerated, consistent with thefine soil texture (i.e., poorly draining soil) observed in the samples. Note that the samples areassumed to be representative of soils from areas of concern within the Hematite Site.
The NSSC and DSCC layers previously identified by LBG [2003] could not bedistinguished in the field. What appears to be the sand/gravel unit identified by LBG [2003] wasencountered in four of the six boreholes (see Table 4 and complete boring logs in Appendix B),but all were observed to have a thickness of less than I ft before drill refusal. Drill refusal in allsix boreholes occurred between 27 and 33 ft below ground surface, and was assumed tocorrespond to the depth of the Jefferson City Dolomite bedrock. Particle size distribution analysesin 6 samples from 2 boreholes (Table 5 and Appendix C) supports the field descriptions, with 5out of six of the samples containing more than 96% silt/clay (-30% clay). One sample withcoarser grained particles was taken from the lowest sampling interval in BHKD6, also consistentwith the noted presence of clayey sand gravel in the last 6 in of this interval (see Table 4). Watersaturation was encountered at 21 to 22 ft in BHKD2 and BHKD3 and at 28 ft in BHKD4 andBHKD5. Soil was moist but not saturated throughout the drilled depths of BHKD1 (33 ft) andBHKD6 (30 ft).
3.2 SOIL CHEMICAL CHARACTERISTICS
Chemical characteristics of soil samples collected from the Hematite site for this studyare shown in Table 6. Soil pH ranged from 6.5 to 7.5 for a majority of the soil samples. Thelowest soil pH (5.8 and 6.0) were measured in the shallowest samples from BHKD4 and BHKD6,respectively. The highest pH values (8.1 and 8.3) where measured in mid-depth and deepestsamples collected from BHKD1. Total and organic carbons levels were less than 1% in most ofthe measurements. In some samples, organic carbon levels were higher than total carbon (whichconsists of both organic and inorganic carbon). This was attributed to sub-sample heterogeneitycoupled with low levels of inorganic carbon in the soil. In general, the chemical characteristics ofthe soil samples did not vary significantly among the soil samples, and no trends were observedwhen these parameters were plotted vs sample depth (see Appendix D for graphs).
12

Table 4. Field descriptions of soil samples collected for Kd testing and other analyses
Sample Interval
Borehole Location (It) Field DescriptionUpper LowerLimit Limit
BHKDl Duels Mt 4 8.6 Silty clay, brown with 10% gray mottling23 28 Silty clay, brown with 5% mottling and limestone or
dolomite fragments28 33* Silty clay, brown with 5% mottling and limestone or
dolomite fragments
BHKD2 Burial Pits 4 10 Sil clay, brown with 5% mottling13 17 Silty clay, brown with 15% mottling23 34* Silty clay, brown with 15% mottling with chert
___fragments; silty sand gravel from 33.5-34 ft (bottom)
BHKD3 Tile Barn/Cistern 8 13 Silty clay, brown with 15% iron oxide amottlingBum Pit 16 20 (Silty clay, brown with 5% iron oxide mottling
23 27* Silty clay, brownish gray with 10% mottling anddolomite fragments
BHKD4 Restricted Area #1 2 14 Silty clay, brown with manganese (Mn) and chertnodules
14 21 Silty clay, brown and 100/ mottling24 30* Silty clay, grayish brown with 15 mottling; sand
-with gravel 29.5-30
BHKD5 Restricted Area #2 1 12 Silty clay brown with Mn nodules1 24 Silty clay, brown Mn nodules and 15% iron oxide
mottling27 31 * Silty clay, brownish gray with 20% iron oxide
_ _ mottling; clayey sand with gravel from 30.5- 31
BHKD6 Evaporation Pond I 8 Silty clay, brown with iron oxide mottling1 16 Silty clay, brown with iron oxide mottling
26 30* Silty clay, brown with iron oxide mottling, clayeysand with gravel from 29-30 ft
*Total depth of boreholes
13

Table 5. Particle size distribution analyses results
SampleSample ID Location Interval %Gravel %Sand %Silt % Clay
(fR)BHKDS-O1 Restricted Area #2 1-12 0 3.5 66.3 30
BHKD5-19 Restricted Area #2 19-24 0 2.8 66.2 31
BHKD5-27 Restricted Area #2 27-31 3 39.2 32.8 25
BHKD6-01 Evaporation Ponds 1-8 0 3 67 30
BHKD6-11 Evaporation Ponds 11-16 0 2.4 69.5 28
BHKD6-26 Evaporation Ponds 26-30 0 1.9 68.1 30
Table 6. Physical and chemical characteristics of soil samples collected for Kd testing
Sample ID PH Moisture (%o) Total Carbon Total Organic Iron Manganese________________ (gtkg) Carbon (g/kg) (g/kg) (g/kg)
BHKDI-4 6.6 21.3% 1.36 2.26 19.8 1.5-23 8.1 28.0% 4.12 4.64 22.2 1.55
-28 8.3 13.00/c 1.49 2.32 16.3 0.458
BHKD2-4 7.3 19.8% 2.45 3.2 J 19.4 0.367-13 6.6 21.3% 1.36 2.26 17.1 0.577-23 6.7 24.2% 8.9 14.9 19 0.311
BHKD3-8 7.3 20.8% 5.55 3.93 20.3 0.955-16 7.4 22.3% 2.7 3.78 22 0.364-23 7.5 24.0% 3.75 3.74 22.2 1.04
BHKD4-21 6.0 18.8% 2.56 2207 22 0.449-14 7.2 22.0% 2.26 2.98 19.9 1 0.623-24 7.1 23.7% 2.55 427 17.9 I 1.12
BHKD5-1 7.2 J 20.6% 3.45 3.32 20.8 0.535-19 6.6 23.1% 3.07 3.4 20.9 0.283
-27 7.0 24.8% 625 5.35 11.1 0216
BHKD6-1 5.8 20.0% | 2.35 6.88 21.2 1.85-11 6.8 21.2% 1.99 . 2.58 14.3 0.479-26 7.7 L 22.0% 9.49 14 11.1 0.221
Minimum 5.8 13% 1.36 2.2 11.1 0.216Maximum 8.3 1 28% 9.49 14 21.2 1.85
14

3.3 URANIUM AND TECHNETIUM ACTIITIES IN SOIL SAMPLES
Soil samples collected from the restricted areas (BHKD5) contained the highest uraniumconcentrations (see Fig. 2) and highest radioactivity from 234U and 235U (see Table 7). Elevated Uwas also detected in the shallowest sample from the Tile Barn/Cistern Bum Pit area (BHKD3-8).Slightly elevated total U was measured in BHKD4-14 (from restricted area #1) and BHKD6-1(from the Evaporation Ponds); elevated activities from 23
4U and 23 U were also observed in these
samples (see Table 7).
99Tc activity was not detected (0.5 pCi/g detection limit) in any of the samples fromBHKD2 (Burial Pits) and BHKD3 (Tile Barn/Cistern Burn Pit). Activities were higher than thedetection limit in the rest of the samples, but all were still below the laboratorys reporting limit(10 pCi/g). The highest 9Tc activity was measured in BHKD4-14.
All samples from BHKD5 and the shallowest sample from BHKD3 were deemed to havesufficient U levels for desorption testing in the first batch of Kd measurements. BHKD4-14 andBHKD6-1 were subjected to desorption testing in the second batch of Kd measurements becausethese had sufficient U to result in quantifiable levels in the contact solutions based on Kdsmeasured in the first batch. "Tc was not measured in the first batch of desorption tests becausethe field-sampled activities in the soil samples (see Table 7) were below the reporting limit andwere unlikely to be reliable for Kd calculations based on mass balance.
Table 7. Uranium isotope and Technetium-99 activities in soil samples
Upper Lower. Limit of Limit of FU '9 TcBoreholeLocaton Samp Int Samp tat (pCi/g) (pCifg) (pCi/g) (pCi/g)
BHKDl Duels Mt 4 8.6 6.14 1.lS 48:23 28 1.79 N.D. 1.0428 33 - m N .A m p ;
BEIKD2 Burial Pits 4 10 4.97 jgT 1.22 N-D.13 17 Sm..N.D.23 34 __ N.D. N.D.
BHKD3 Tile Barn/Cistern 8 13 21.5 1.31 12 N.D.Burn Pit 16 20 1.48 Am N.D.
23 27 1.63 1.01 N.D.BHIKD4 Restricted Area #1 2 14 3 N.D. 98 YW<
14 21 202 * a 3.32 13.824 30 1.38 ND.
BHKD5 Restricted Area #2 1 12 218 9.8 33.6 .19 24 90 4.12 14.527 31 75.8 2.67 6.57 .
BHKD6 Evaportion Pond 1 8 11.6 0.45 2.06 .11 16 y NJ.26 30 1.14 N.D.
Note: Shaded values are below the method-reporting limit (I pCi/g for U isotopes and 10 pCi/g for "Tc) but above the detectionlimit (0.1 pCi/G for U isotopes and I pCilg for Arc). N.D.: not detected; value was below the method detection limit
15

Total Uranium (mglkg)
600 20 40 80 100 1200
5
10
15
0Q 20
25
30
35
_-*- BHKDI-4-BHKD2-*- BNHD3
BHKD4
_BH-- BHKD6
Fig. 2. Total uranium concentration in soil samples calculated from isotopic activities (Table 7) usingthe following conversion factors: 6.2 x 10⁴ Cig 234U, 2.2 x 10⁴ Ci/g 25U, and 3.3 x 10⁷ Ci/g 23U.
16

3.4 GROUNDWATER CHARACTERISTICS
Table 8 shows characteristics of groundwater used as contact solution for the Kd tests(OB-1). It also contains field parameters measured in WS-14, the only well located within 50 ftof one of the boreholes (BHKD2) drilled for this study. Note that the concentration of U in theOB-l groundwater is significantly lower than the spike levels used in the adsorption Kd tests (seeTable 2). The ORP in both wells indicated mildly reducing conditions, consistent with thepresence of dissolved iron (Fe2W), but appear were inconsistent with the high dissolved oxygenmeasurements. It is suspected that the latter was affected by handling of the samples that canartificially aerate the groundwater.
Table 8. Characteristics of Groundwater samples collected for this study
Parameter OB-| WS-14PH 6.57 5.93Temperature OC 16.5 16.7Oxidation Reduction Potential (ORP, mV) 27 57Dissolved oxygen (mg/L) 1.42 4.79Specific conductivity (mS/cm) 1.61 0.28'14U (pCi/L)r 1.27 Not measured'1'U (pCi!L)* 0.03 Not measured23U (pCi/L)* 0.66 Not measured99Tc (pCiIL) 0.2 Not measuredCa (mg/L) 83.5 Not measuredK (mgfL) 1.6 Not measuredMg (mg/L) 28.1 Not measuredNa (mg/L) 19 Not measuredCl (mg/L) 5 Not measuredNO3 (mg/L) 3.5 Not measuredS0 4 (mgfL) 40.1 Not measured
Total Depth (ft) 27.1 Not measuredDepth to water (ft) 16.5 Not measured
Fe*e (mg/L) 0.18 0.42Alkalinity** (mg/L) 150 14
*Calculated total U = 2.6 pg/L*Measured 24 hours later
17

4. RESULTS OF SITE-SPECIFIC Kd STUDYFOR URANIUM AND TECHNETIUM-99
4.1 DESORPTION AND ADSORPTION KINETICS
Steady-state conditions were achieved within 14 days for both desorption and adsorptionKd tests (see Tables 9 and 10, Figs. 3 to 10). As mentioned in Section 2, the Kd tests were done intwo batches to allow procedure modifications based on results of the first batch of tests. Tc wasnot quantified in the Batch 1 desorption tests because Tc activities were below the reporting limitin the soil samples (see Section 3.3 and Table 7). In addition, the Day 3 U analyses for BHKD2-4,-13, -23, BHKD4-14, and BHKD6-1 were not included in Figs. 4 and 5 because these wereinconsistent with analyses on subsequent days (i.e., values were significantly higher or lower) andwere deemed likely to be in error.
Table 9. Uranium concentrations in contact solutions during 14 tests
Batch No. Initial U Uranium in contact solution (1gL)Sample ID and mn contact Average Std. Dev
Test Type' solution Day 3 Day 7 Day 10 Day 14 Day 7-14 Day 7-14(I /L _ _ _ _ _ __ _ _ _ _ _
BHKDl-4 2,Ads 950 175 254 242 177 224 41-23 2, Ads 950 491 420 321 335 359 54-28 2, Ads 950 141 348 253 318 t 306 49
BHKD2-4 1, Ads 10000 | 0.606 9300 | 10100 10100 | 9833 | 462-13 1, Ads1 10000 0.291 9400 1 9900 9300 l 9533 1 321-23 1, Ads 10000 0.291 8400 8700 9100 8733 351
BHKD3-8 1, Des 0 127 168 184 191 181 | 12-16 1 Ads 950 28 12 19.3 18.7 17 1 4-23 2 Ads 950 162 190 157 192 180 J 20
BHKD4-2 2, Ads | 950 185 174 121 J 148 148 1 27-14 2, Des | 0 850 163 137 127 142 1 9-24 2, Ads 1950 40 34 20.9 8.83 21 13
BHKD5-l 1, Des J 1 675 1 760 - 730 1 679 1 723 1 41-19 1, Des 0 1 252 l 102 1 1081 l79.2 1 96 15-27 1, Des j 0 1 73.8 1 84 1 73.6 1 65.6 74 __ 9
BHKD6-1 2, Des 0 1 840 [ 7 .7 l 4.5 | 7.79 I 7 2-11 2, Ads 950 1 26 1 31 1 21.1 1 9.21 20 61-26 2, Adsj 950 J 13 1 16 6.51 1.-4.88 9 6
Ads: adsorption; Des: desorption
18

Table 10. Tc activities in contact solutions during Kd tests
Batch No. Initial Tc Tc in contact solution (pCi/L)Sample ID and in contact
Test Type* soludon Day 3 Day 7 Day 10 Day 14 Average Std. Dev._ _ j(pCi/L) I_ ja ~ O(Day 7- 14) (Day 7-14)
BHKD1-4 2, Ads 27800 1370 916 990 938 948 J 38-23 2, Ads | 27800 2610 3540 13200 724 5821 6543-28 2, Ads 1 27800 1 565 548 | 635j j 6270 2484 J 3279
BHKD2-4 1, Ads 600 27 1 27 6.5 7.2 14 12-13 1, Ads 600 64 68 29.7 4.8 34 32-23 1, Ads 600 36 12 6.7 1 8.2 _ 9 3 -
BHKD3-811, Des 0 N.A. N.A. N.A. JNA. -- I -
-161 2, Ads 27800 1380 718 710 694 707 12-231 2, Ads |27800 688 697 585 638 640 56
BHKD4-2 2, Ads 27800 3090 1300 1080 859 1080 | 221-14 2, Des 0 N.A. N.A. -9.1 -15 _ -- __-24 2, Ads 27800 1850 1250 1110 760 1040 | 252
BHKD5-l 1, Des 0 N.A. I NA. N.A. N.A.| --
-1 1 Ds 0 N.A. jN.A. N.A. N.A.!_ __
-27 1, Des 0 N.A. N.A. I N.A. N A. T -- I -
BHKD6-1 2, Des 0 N.A. f N.A. | 10 -6 ----11 2, Ads 27800 2160 1860 1330 1300 | 1497 315-26 2, Ads 27800 1170 783 618 550 650 120
*N.A.= Not applicable
19

800
700
600
wn 500
40 -~ ID.= 3X /- BHKDX521
200
100
0 2 4 6 8 10 12 14
Time (days)
Fig. 3. Total U concentration in contact solutions vs time for Batch 1 desorption tests.Contact solutions consisted of groundwater from well OB-1 considered as a background well (U and'9 Tc at 2.6 pg/L and 0.2 pCi/L, respectively)
20

~oO100----
-_- BHKD2-4GM00 x-a-SHM2-13
A BHKD2- 2
C
2000
Note: Day 3 analyses not Included In plot0
0 2 4 6 8 10 12 14
Tkne (Days)
Fig. 4. Total U concentration in contact solutions vs time for Batch 1 adsorption tests.Contact solutions consisted of groundwater from background well OB-1 spiked with standardsolutions to achieve initial uranium and technetium concentrations of 10,000 pg/L and 600 pCi/L
21

200
1I0
160
140
N 120-
I.100 / - 1
~6060 /i! /
40 /
20 / Note: Day 3 anayses not Included In plot
0 2 4 6 a 10 12 14 16
Time (days)
Fig. 5. Total U concentration in contact solutions vs time for Batch 2 desorption tests.Contact solutions consisted of groundwater from well OB-1 considered as a background well (U and9 Tc at 2.6 Wg/L and 0.2 pCi/L, respectively).
22

1ODO
2 1*1 -4-- BHKD1-04-UI-BHKDI-23
SW -A-8HKD1-28
-( - 9H1D3-16
.2400 K81022
200
100
0 X x SX
0 2 4 a a 10 12 14 16
lmo (days)
Fig. 6. Total uranium concentration in contact solutions fvs time for Batch 2 adsorption testson samples from BHKD1 and BEID3. Contact solutions consisted of groundwater from backgroundwell OB-1 spiked with standard solutions to achieve Initial uranium and technetium concentrationsof 950 ,ag1L and 27,800 pCi/L respectively.
23

1000
sol
0 2 4 e e 10 12 14 la
Time (days)
Fig. 7. Total U concentration in contact solutions vs: time for Batch 2 adsorption tests onsamples from BHIKD4 and BHIKD6. Contact solutions consisted of groundwater from backgroundwel 0OB1 spiked with standard solutions to achieve initial U and Tc concentrations of 950 AgL and27,800 pCiJL,, mepectively.
24

a2 [-,-HK2-
0 2 4 6 8 10 12 14 16
Tnme (days)
Fig. 8. Tc activities in contact solutions vs time for Batch I adsorption tests on samples fromBHKD2. Contact solutions consisted of groundwater from background well OB-1 spiked withstandard solutions to achieve Initial U and Tc concentrations of 10,000 pg/L and 600 pCifLrespectively.
25

a
-. B-HKD1-4
15000 A S-M1-28E -.a- BHKD3-16
10000
A8000
0 2 4 a 8 10 12 14 16
Thne (days)
Fig. 9. Tc activities in contact solutions vs time for Batch 2 adsorption tests on samples fromBEHKDI and BHKD3. Contact solutions consisted of groundwater from background well OB-1spiked with standard solutions to achieve initial U and Tc concentrations of 950 ptg/L and 27,800PCi/L, respectively.
26
99
-+--BHKD4I-2
1500_- BHKD4-2415000 *A BHID6-11
\--- BHKD8-26
10000
5000
00 2 4 6 8 10 12 14 16
ThU (Days}
Fig. 10. Tc activities in contact solutions vs time for Batch 2 adsorption tests on samplesfrom BHKD4 and BHKD6. Contact solutions consisted of groundwater from background well OB-spiked with standard solutions to achieve initial U and Tc concentrations of 950 pg/L and 27,800pCi/L, respectively.
27

A relatively high U spike level (10,000 gtg/L) was selected for the Batch I adsorptiontests, in anticipation of Kd values that can be as high as 10,000 mL/g [EPA 1999]. If the Kd factorwere this high, then a high spike level would be required to adequately quantify U in the contactsolutions after equilibration with the soil samples. Measured U concentrations in the contactsolutions did not vary much from the spike level in the Batch I adsorption tests (see Table 9,BHKD2-4, 13, and 23, and Fig. 4), indicating very little to no adsorption onto the soil. On theother hand, Batch I desorption samples exhibited Kd factors that were greater than 100 mL/g.When the spike level was reduced to 950 pg/L U in Batch 2, adsorption was observed in allsamples (see Figs. 6 and 7). It is possible that the low adsorption observed in Batch 1 was due tothe high U concentration in the contact solution that led to saturation of the active sites on thesolid surfaces. Table 11 shows results of U analyses on select Day 14 solid residues, as well asmass balance calculations that show good recovery in most of the samples.
Table 11. Mass balance calculations for U in soil/water mixtures
s U in Mass-of UAs-sampled U Initial U in Initial Mass of U in solid contact in
Sample ID in soil contact solution U in soil/water residue on solution on soil/water Massl (mg/kg) (u1L) mixture Day 14* Dmixture on Balance"
(m/g uf)(mg) (mg/kg) Day 14 Day 14(ug/L) (mg)
BHKD1-4 4.60 950 0.168 7.4 177 0.162 96%-23 3.15 950 0.139 8.2 335 0.192 138%-28 2.21 950 0.120 5.4 318 0.134 111%
BHKD2-4 3.78 | 10000 [ 0.876 N.M. | 10100 | -.- 13 2.82 10000 0.856 N.M. 9300 _
-23 2.36 10000 0.847 N.M. 9100 _
BHKD3-8 36.96 0 0.739 30.2 191 0.618 84%-16 2.89 950 0.134 7.9 18.7 0.160 120%-23 3.17 950 0.139 7.9 192 0.174 124%
BHKD4-2[ 3.00 950 0.136 9.2 148 0.195 144%-141 10.36 0 0.207 10.8 127 0.225 109%-241 2.85 950 0.133 5.5 8.83 0.110 83%
BHKD5-1 106.31 0 J 2.126 116.0 | 679 2.375 112%-19 45.83 0 1 0.917 36.8 1 79.2 0.742 81%-27 21.13 0 0.423 22.1 1 65.6 0.447 106%
BHKD6-1 6.45 0 A 0.129 6.4 7.79 0.129 100%-11 2.76 1 950 J 0.131 6.1 9.21 0.123 94%-26 2.00 ( 950 0.116 ( 6.7 4.88 j 0.134 116%
*These were corrected for dissolved U in the water phase of the solid residue samples. The moisture content in the solid residues(-45%/.) were measured and used for these corrections, together with measured U in Day 14 contact solutions.**Mass balance - Ratio between mass of U on Day 14 and initial mass of U in soil/water mixtures.
28

The Tc activities in the contact solutions from the Batch 1 adsorption Kd tests (Table 10,Fig. 8) were significantly lower than the initial contact solution activity of 600 pCi/L, indicatingthat Tc was being removed from solution in the soil/water mixtures. Published studies on TcO 4
adsorption are fairly consistent in that all show very low Kd values (0.1 to 1 mL/g, Krupka andSemne 2002) under aerobic conditions. The negative TcO4 ion is not expected to adsorb on soilsurfaces that are predominantly negatively charged under typical pH values found in thesubsurface environment. Because 600 pCi/L is equivalent to a mass concentration of -35 ng/L, itwas thought that the observed disappearance of Tc from solution was a "concentration effect",and that there were enough positively charged sites on the soil surfaces to interact electrostaticallywith the minute amount of Tc in solution. For Batch 2, the Tc spike level was increased to 27,800pCi/L (-1.6 pgfL).
Even at this elevated concentration, Tc was still removed from solution, dropping by anorder of magnitude by Day 14 in most of the samples. The Day 14 Tc activities in the deepersamples from BHKD 1 were the exception to this trend (Table 10, Fig. 9). The Tc activities in thecontact solutions for BHKDI-23 were erratic, with values that fluctuated between a minimum of724 pCi/L on Day 14, and a maximum of 13,200 pCi/L on Day 10. Tc activities in BHKD1-28on Days 3, 7 and 10 were relatively consistent (548 to 635 pCi/L), but Tc activity was muchhigher on Day 14 (6,270 pCi/L). These results could be due to heterogeneity among subsamplescollected from a bulk sample used to prepare the soil/water mixtures. Nevertheless, 10 out of 12Tc adsorption tests showed significant removal of Tc from solution by Day 3, and relativelymonotonic Tc activities that either leveled off or decreased gradually through Day 14 (Table 10,Figs. 8-10).
Determining the actual mechanism by which Tc was being removed from solution isbeyond the scope of this study. However, published experimental studies on the behavior of Tc ingeologic media can shed light on the observations in this study. The Tc added to the contactsolutions was in the +7 oxidation state [Tc (VII)] in the form of TcO4 . The latter is known to bevery soluble and not strongly adsorbed at neutral and basic pH conditions (Krupka and Serne2002). Significant removal of Tc in this study could be due to chemical reduction of Tc (VII) toTc(IV) which is more highly sorbed and can form relatively insoluble Tc oxides. Chemicalreduction of Tc (VII) has been observed by others through biotic processes (e.g., aided by metalreducing bacteria) and abiotic reactions (e.g., interaction with reduced iron) (Krupka and Serne2002).
It is somewhat surprising that Tc (VII) reduction occurred in the soil/water mixturesprepared for this study because the mixtures were not kept under anaerobic conditions, which istypically done in experiments where Tc (VII) reduction was observed (e.g., Sheppard, Sheppardand Evenden, 1990). However, significant recovery of Tc in the solid residues (see Table 12)from filtration of the soiVwater mixtures is consistent with its removal from solution. Thus, theevidence from this study points towards TcO4 being removed from solution and "adhering" to theHematite soil samples, either through adsorption or chemical reduction followed by precipitation.
29

Table 12. Mass balance calculations for Tc in soil/water mixtures
Total 99Tc 99Tc in 99Tc in Toty inAs-sampled Initial 99Tc in activity in solid contact activity in
Sample ID 99Tc in soil contact solution soil/water residue on solution on mixture on Balance**(pCi/g) (pCilL) mixture Day 14* Day 14 Day 14
(pCi) (pCi/g) (iCi/L) (pCi)
BHKDI-4 6.60 27800 2356 71.4 938 1503.7 64%-231 6.23 27800 2349 86.6 724 1790.1 76%
-281 2.84 27800 2281 67.7 6270 1855.0 81%
BHKD2-4 0.00 600 48 N.M. 7.2 --
-13 0.00 600 48 N.M. 4.8 _ _-23 0.00 600 48 N.M. 8.2
BHKD3-8 0.00 0 0 N.M. N.M. -- _-16 0.00 27800 2224 100.4 694 2064.2 93%-23 0.00 27800 2224 87.3 638 1796.6 81%
BHKD4-2 2.80 27800 2280 81.5 859 1698.7 75%-14 13.80 0 276 N.M. -15-24 0.82 27800 2240 74.0 760 1540.4 69%/
BHKD5-1 2.52 0 50.4 N.M. |_-19 1.18 0 23.6 N.M.
-27 0.91 0 18.2 N.M. 1_
BHKD6-1 2.55 0 51 N.M. -6 --- -
-11 2.00 27800 2264 _ _89.9 _ _1300 1902.7 84%
-26 5.86 27800 2341 73.2 550 j 1507.0 64%
*These were corrected for dissolved "Tc in the water phase of the solid residue samples. The moisture content in the solid residues(-4Vh) were measured and used for these corrections, together with measured "Tc in Day 14 contact solutions.*Mass balance = Ratio between total "Tc activity on Day 14 and initial total 9Tc activity in soil/water mixtures.
30

42 CALCULATED DISTRIBUTION COEFFICIENTS
Distribution coefficients (Kd) were calculated from the ratio between the U or Tcadsorbed onto the soil (S) and the average of Day 7, 10, and 14 U or Tc concentration in thecontact solutions (C., Table 9 and 10 for U and Tc, respectively). For the desorption tests, theadsorbed U or Tc concentration was calculated via mass balance as follows:
S =SiM - CwV [1]
M
where Si is the field-sampled U or Tc concentration in the soil samples (Table 7), V is thevolume of contact solution (0.08 L) and M is the mass of soil (0.02 kg) used in the Kd tests.Because the U or Tc soil concentrations (S.) were measured following hot acid digestion of thesoil samples, it is possible that a fraction of the field-sampled U or Tc in the soil is in precipitatedform or occluded in the soil's mineral structure and not reversibly sorbed onto the soil. Thus,using the total (acid-digested) U and Tc soil concentration in calculations for the desorption testscan result in overestimated Kd factors. Researchers have used methods for selective extraction ofdefined U fractions (e.g., Kaplan and Serkiz, 2000, Senko et al, 2002, Sowder et al. 2003),however use of these methods was beyond the scope of this project. The initial contaminantconcentrations to be used in RESRAD modeling will also consist of analyses results from acid-digested samples. Thus, calculating Kds from the desorption test results assuming that the acid-digested U or Tc represents the "leachable" fraction in contaminated soil is a reasonableapproach.
For the adsorption tests, the U or Tc concentrations sorbed onto the soil (S) wascalculated as follows:
S = (Cwi CJ)V
M
where Cw, is the initial U or Tc concentration in the spiked contact solution. Neglecting thecontribution of the initial U or Tc in the soil samples to the final concentration in the contactsolution is a conservative approach, resulting in a lower estimate for S and lower calculated Kd.
4.2.1 Uranium
The average U Kd factors from the adsorption and desorption tests are 117.8 and 232.7mL/g, respectively (Table 13). These averages were calculated without Kd values from BHKD2and BHKD6-1. As mentioned previously (Section 4.1), it is suspected that results from BHKD2were compromised by the high U concentration in the Batch 1 contact solution (10,000 Pg/L).The Kd value from BHKD6-1 is more than twice the next lower value and was not consideredwhen calculating the average Kd (a conservative approach). Significant variability in themeasured Kds is reflected by standard deviations that are comparable to the average values (seeTable 13). The degree of variability is not entirely surprising, and has been observed by others[EPA 1999, Krupka and Serne 2002]. Higher average Id values in the desorption tests can be dueto the sorbed U concentration in the soil-water mixtures being estimated from the U extractedfrom the soil samples via acid digestion. This digestion procedure extracts not only U that isadsorbed on to the soil (e.g., through electrostatic interactions with soil surfaces), but also likely
31

dissolves some U that is in precipitated form or occluded in the soil minerals. The latter shouldnot, in theory, be included in the initial soil concentration (S.) when estimating sorbedconcentration, S (see Eqn. [1]). Higher Kd values in the desorption tests can also be due to an"aging effect" in field-contaminated samples, as described by Kaplan et al. [2001] who alsomeasured Kd factors via desorption that were higher than Kd values based on adsorptionmeasurements. Desorption from field-contaminated samples more closely simulates the leachingof radionuclides from contaminated soils, the process that is being modeled by RESRAD inDCGL calculations.
The lower average Kd in the adsorption tests can also be from soil samples with lowpotential for adsorption being fortuitously selected for adsorption testing. For example, all threesamples from BHKD I were subjected to adsorption testing and exhibited low K4 values. In ahistogram of adsorption Kds (excluding data from BHKD2 suspected to have been compromisedby high U spike in Batch I contact solution), 3 out of 5 data points in the 0-100 mL/g range wereresults from one borehole (BHKDI, Fig. 11). There were no other consistent trends with boreholelocation or depth in the Kd measurements (see Fig. 12).
The "best" estimate for uranium Kd applicable to the Hematite Site is 175 mLlg, which isthe mean of the averages from the adsorption and desorption test samples (excluding data fromBHKD2 and BHKD6-1, discussed earlier in this subsection). This approach for estimating the"best" Kd was chosen over averaging the entire data set (158.8 mL/g), which unduly weights theadsorption Kd values (9 data points) over the desorption Kd values (5 data point). The approachused to arrive at the "best" estimate for Uranium Kd balances the more conservative estimation ofK& in the adsorption tests (i.e., by neglecting the contribution of the field-sampled U in the soil),with the less conservative approach (i.e., by using U in acid-digested soil samples) in calculatingKd factors from the desorption tests.
Histograms of measured Kd values for U (Fig. 11) from both adsorption and desorptiontests (excluding data from BHKD2 and BHKD6-1, justification discussed earlier in thissubsection) shows a more skewed distribution for the adsorption tests when compared to thedesorption tests. If RESRAD modeling will include uncertainty analysis, it is recommended thatparameters for characterizing the statistical distribution of Kd be obtained from a data set thatconsists of (1) the adsorption test results from this study excluding the 3 data from BHKD2, andthe two highest and the two lowest 14 values, and (2) the desorption test results excluding K1from BHKD6-1. This trimmed data set, which consists of an equal number of adsorption anddesorption data points, grossly approximates a lognormal distribution (Fig. 11). Because therewere no distinct depth trends in the Kd measurements (Fig. 12), spatial variability is bestaddressed by assuming that the unconsolidated sediments overlying bedrock at the Hematite Sitecan be characterized by a single Kd parameter that has a lognormal distribution.
The range and "best" estimate for U 1( from this study are compared with publishedliterature values in Table 14. The latter include (1) a compilation by Sheppard and Thibbault(1990), where the Kd values are categorized according to soil texture, (2) a compilation by EPA(1999), where a look-up table, based on a large number of published experimental results, isformulated with pH as the independent variable, and (3) measurements by Kaplan and Serkiz(2001) following a desorption procedure using field-contaminated soil from the Department ofEnergy's Savannah River Site. The ranges for loam (>80% silt-sized and smaller fractions) andclay (>35% clay-sized fractions) from Sheppard and Thibbault (1990) are given in Table 14,because these textures best describe the soil collected from the Hematite Site for this study. K4dranges for pH 6, 7 and 8 from EPA (1999) are shown in Table 14, also based on thecharacteristics of soil and groundwater from the Hematite Site (see Section 3). The Interagency
32

Steering Committee on Radiation Standards (ISCORS) recently performed a RESRAD dosemodeling effort for radionuclides in sewage sludge used for agricultural and land reclamation.The baseline Kd value for U in the ISCORS model in this modeling study is also shown in Table14. Note that the Kd range from this study is near the lower end of the published range of Kdvalues in Table 14. Thus, the Kd values in this study, including the best estimate for Uranium Kdfor RESRAD modeling, appear to be reasonable and conservative.
Table 13. Calculated distribution coefficients for U based on average U concentration incontact solutions on Days 7, 10, and 14
Sample ID I Location Adsorption Test Desorption Test Remarks.d (mug) Kd (MLg)
BHKDI-4 Duel's Mountain 12.9 _Initial U at 950 pg/L-231 6.6 _ _ Initial U at 950 pgfL-28| 8.4 _-_ Initial U at 950 pg/L
BHKD2-4 Burial Pits 0.1* Initial U at 10,000 pg/L-13 0.2* Initial U at 10,000 pg/L-23 0.6* _ Initial U at 10,000 ,g/L
BHKD3-8 Tile Barn/ Cistern Burn Pit --- 200.2 Unspiked-16 224.0 ---- Initial U at 950 pg/L-23 17.2 - Initial U at 950 pg/L
BHKD4-2 Restricted Area #1 21.7 --__ Initial U at 950 ipg/L-14 ------_68.8 Unspiked-24 _ 174.9 -- Initial U at 950 pg/L
BHKD5-1 Restricted Area #2 __ 143.0 Unspiked-19 -- 471.4 Unspiked-27 280.1 Unspiked
BHKD6-I Evaporation Ponds | 963.8** Unspiked-11 181.9 _ Initial U at 950 rug/L
-26 _ 412.2 __ Initial U at 950 pg/L
Average 117.8 232.7 Excludes BHKD2 andBHKD6-1
Std. dev. 141.4 154.2 Excludes BHKD2 andBHKD6-1
Mean of adsorption and desorption Excludes BHKD2 andaverages 175 BHKD6-1
every low adsorption in these tests suspected to have been due to high initial U in contact solution, resulting insaturation of adsorption sites on soil surfaces."This value is very high compared to other values.
33

IEAdsorplon NDeswrpton ESeOetAdsorpton + Demption I
6
4
2
0-100 100-200 200-300 300-400 400-500
Range of Kd values (muLg)
Fig. 11. Histograms of measured distribution coefficients (Yi) for U. "Adsorption" and"desorption" data sets exclude data from BHKD2 and BHKD6-1. "Select Adsorption + Desorption"data set consists of adsorption results excluding data from BH)KD2, two highest and two lowestvalues, and desorption results excluding data from BHICD6-1.
34

Uranium Distribution Coeffcient Kd (mUg)50 100 150 200 250 300 350 400 450 500
8
-*- BHKD1
-U- BHKD4
X BHKDS-4-- BHKD6
Fig. 12. Distribution coefficients (Vd) for uranium measured in Hematite Site soil samplesplotted vs sample depth. Note that both adsorption and desorption test results are shown in thegraph, and results from BHKD2 and BH}XD6-1 are not plotted.
35

Table 14. Comparison of measured distribution coefficients for U in this study withpublished values
"Best" EstimateMinimum Kd Maximum KdorK
Source Soil Type or Characteristic (ImL) (|)mug) for Kd
This Study* >96% silt-sized and smallerparticles 6.6 471.4 175
pH 5.8-8.3RESRAD default ---- --- 50
Sheppard and LoamThibault 0.2 4,500 15**.,1990
Sheppard and Clay 46 395,100 1600**Thibault., 1990EPA 1999 pH 6 100 1,000,000 i
EPA 1999 pH 7 63 6,300,000EPA 1999 pH 8 0.4 250,000Kaplan et al, pH 4-5.82001 (desorption tests) 170 6493 _
20%-40% silt-sized andsmaller particles
ISCORS***, 1262003
*Data set excludes data from BHKD2 and BHKD6-1 (see Section 4.2.1 for justification). 'Best" estimate for Kd is themean of the average Kds from the adsorption and desorption tests."Geometric mean; data observed to be log normally distributed.*"Interagency Steering Committee on Radiation Standards
36

4.2.2 Technetium
The Kd values measured for Tc ranged from 15.1 to 172.9 mL/g and one data point at263.7 mL/g (Table 15). The values appear to be relatively uniformly distributed between 0 and200 mL/g, as shown by the histogram in Fig. 13. The lowest Kd values were obtained fromBHKD 1-23 and BHKD 1-28, which were the samples that exhibited fluctuating concentrations inthe contact solutions (Fig. 9). As a result, the Tc contact solution activity averaged over Day 7,10, and 14 (used to calculate Kd) had a large standard deviation reflecting significant uncertaintyin the Kd obtained from these time-averaged Tc activities. Exclusion of these data points wasconsidered, but was eventually ruled out because the Kd5 from these samples were on the low endand inclusion of these data points would constitute a conservative approach. Aside from BHKD 1samples exhibiting the lowest Kd values, no other trends were observed with borehole location ordepth (Fig. 14).
Based on the measured Kd values (excluding data from the BHKD2-23), the best estimatefor Tc Kd applicable to the Hematite site is 106 mL/g. Although this is significantly higher thanpublished literature values measured under aerobic conditions, this value is considered to be validbased on the general consistency of the results (i.e., out of 9 samples, 7 exhibited significant andconsistent removal of Tc from solution over 4 time intervals spanning 14 days, see Figs. 8-10) aswell as recovery of Tc in the solid residues (Table 12).
Determining the mechanism for the removal of TcO4i from solution is beyond the scopeof this study, but a mechanism can be hypothesized based on published literature. Because TcOjis known to be highly soluble due to its negative charge and the negative character of soilsurfaces at neutral pH, removal of Tc from contact solutions and its association with the soil isunlikely to be an electrostatic process, but is more likely from a reduction reaction where Tc(VII)is reduced to less soluble Tc(IV) either through abiotic reactions with reduced chemical species(e.g., Fe(2 ')) or microbial processes. The rapid removal of Tc (within 3 days) is more indicativeof abiotic reactions, rather than biological processes particularly for metal-reducing bacteria thatare active mainly under anaerobic conditions. It is also possible that Tc removal from solutionobserved in this study is due to the very low concentration of Tc used in these studies (maximumof 1,600 ng/L in the contact solution equivalent to a soil concentration 0.0064 mg /kg for 20 g: 80mL soil:water mixtures). Gu and Dowlen (1996) conducted their experiments under similar Tcsoil concentrations, while Sheppard et al. (1990b) applied Tc to their study soils at an effectivesoil concentration of 3.9 mgtkg. Note that historical Tc levels in groundwater at the Hematite siteare significantly lower than the lowest contact solution spike level in this study (600 pCilL).
If uncertainty analysis will be performed during RESRAD modeling, it is recommendedthat statistical parameters be obtained from the range of values shown in Table 15, excluding thehigh value from BHKD2-23. The histogram in Fig. 13 grossly approximates a uniformdistribution between 0 and 200 :mLJg. Because there were no distinct trends with depth in the Kdmeasurements (Fig. 14), spatial variability is best addressed by assuming that the unconsolidatedsediments overlying bedrock at the Hematite Site can be characterized by a single Kd parameterthat has a uniform distribution.
37
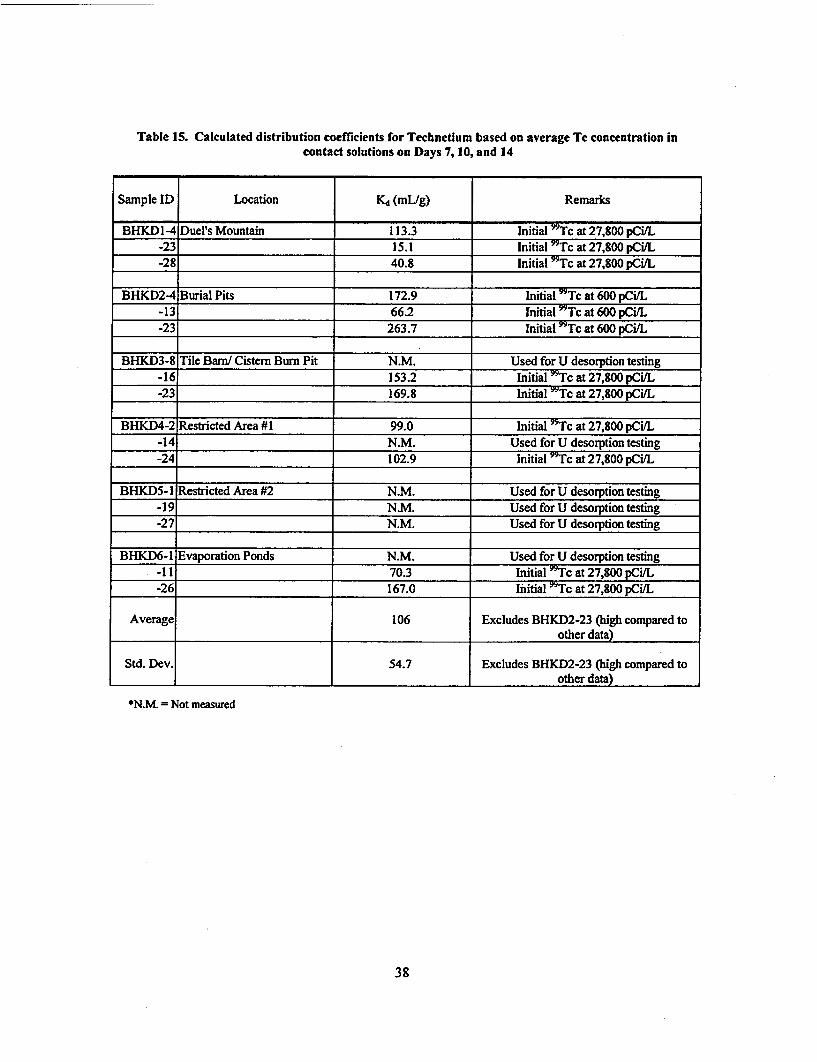
Table 15. Calculated distribution coefficients for Technetium based on average Tc concentration incontact solutions on Days 7, 10, and 14
Sample ID Location Kd (mL/g) Remarks
BHKD 1 -4 Duel's Mountain 113.3 Initial 99Tc at 27,800 pCi/L-23 15.1 Initial 99Tc at 27,800 pCi/L-28 40.8 Initial '9Tc at 27,800 pCifL
BHKD2-4 Burial Pits 172.9 Initial 99Tc at 600 pCi/L-13 66.2 Initial 9Tc at 600 pCiL-23 263.7 Initial 99Tc at 600 pCi/L
BHKD3-8 Tile Barn/ Cistern Burn Pit N.M. Used for U desorption testing-16 153.2 Initial 99Tc at 27,800 pCVL-23 169.8 Initial -Tc at 27,800 pCiVL
BHKD4-2 Restricted Area # 1 99.0 Initial 99Tc at 27,800 pCiVL-14 N.M. Used for U desorption testing-24 102.9 Initial 99Tc at 27,800 pCi/L
BHKD5- 1 Restricted Area #2 N.M. Used for U desorption testing-19 N.M. Used for U desorption testing-27 N.M. Used for U desorption testing
BHKD6-1 Evaporation Ponds N.M. Used for U desorption testing-11 70.3 Initial 99Tc at 27,800 pCi/L-26 167.0 Initial "Tc at 27,800 pCi/L
Average 106 Excludes BHKD2-23 (high compared toother data)
Std. Dev. 54.7 Excludes BHKD2-23 (high compared toother data)
*N.M. = Not measured
38

Table 16. Comparison of measured distribution coefficients for technetium in this studywith published values
Source SoilTypeorCharacteristic | Minimum Kd MaximumKd "Best" Estimate
>96% silt-sized and smallerThis Study* particles 15.1 172.9 106
pH 5.8-8.3RESRAD default ___ .______Sheppard and Loam 0.01 0.4 0.1*
Thibault, 1990 Clay 1.16 1.32 1*Sheppard,Sheppard and Clay-Loam, aerobic - - -0.2*-Evenden, 1990Sheppard,Sheppard and Clay-Loam, anaerobic __ _ 50Evenden, 1990
Gu and Dowlen No sorption;1996 Silty and sandy clay, aerobic _- ___ KYs not
reportedGu and Dowlen Silty and sandy clay, 20 1001996 anaerobic I I I
*Geometric mean, based on assumed log-normal distribution for Kd**Negative values have been reported elsewhere and attributed to ion exclusion
39

5 l
4
3
00-s0 50-100 100-150 1504200
Kd range (mL%)
Fig. 13. Histogram of Technetium }Cd values, excluding high value from BHKD2-23. All Kdvalues obtained via adsorption testing.
40

Technidum Kd (mLig)0 20 40 60 80 100 120 140 160 180 200
U I
5
10
15
220 -
A
-4*- BHKDI-U- BHKD2
A BH4KD
-X- BHKD4-*- BHKD6
25
30
7-x
I
A
x
Fig. 14. Distribution coefficients (Kd) for technetium measured in Hematite Site soil samplesplotted vs sample depth. High value from BHKD2-23 not plotted.
41

5. LITERATURE Kd VALUES FOR OTHERRADIONUCLIDES
The published compilation of distribution coefficients by Sheppard and Thibault (1990)was primarily used to select appropriate Kd values for Pu, Th, Np, and Am based on soilcharacteristics of the samples collected from the Hematite Site (Section 3). Sheppard and Thibault(1990) categorized the data by the texture of the soils used in the measurements. These categorieswere "sand" (containing> 70% sand-sized particles), clay (containing >35% clay-sized particles),"loam" (containing and even distribution of sand- clay- and silt-sized particles or consisted of upto 80%/c silt-sized particles), and "organic soils" (contained >30% organic matter). Thiscategorization is consistent with the positive correlation between soil texture and specific surfacearea, and adsorption being a chemical interaction between a chemical species and chemicallyactive surfaces on soil particles. For each category, Sheppard and Thibault (1990) provide thenumber of data points, geometric mean, minimum and maximum Kd measurements included inthe data compilation. Given the particle size distribution measurements (Section 3.1), the samplesfrom this study can be classified under the "clay" category. However, since the clay-sized fractionin the Hematite samples (-30%) is near the boundary for clay soils selected by Sheppard andThibault (1990), Kd values for "loam" were also considered as shown below. Note that the"loam" Kd values are typically lower, and that inclusion of Sheppard and Thibault's "loam" datain selecting Kd values for the Hematite Site is a conservative approach.
EPA's compilation of Kd measurements (EPA 1999) was also considered when selectingKd values for Pu and Th. Np and Am were not included the in EPA (1999) compilation but arecovered in a forthcoming report (EPA 2003 unpublished).
5.1 PLUTONIUM
Table 17 shows summary statistics for Pu Kd values for loam and clay from Sheppard andThibault (1990), and the range of values in EPA (1999) where a look-up table (with clay contentand soluble carbonate as independent variables) is formulated based on one study that included 17soil samples from 9 different locations within the Department of Energy complex. Given thesepublished values, the RESRAD default value appears reasonable for application at the HematiteSite. This value is between Sheppard and Thibault's (1990) geometric means for loam and clay,and is within the range of Kds for soils with 31 to 50% clay in EPA's look-up table. The baselineKd value for Pu used in the ISCORS dose modeling effort for sewage sludge is also shown inTable 17.
42

Table 17. Published Kd values for plutonium
Minimum Kd Maximum d 'efor EstmatSource Soil Type or Characteristic (mu|g) (mL/g) | forl
Sheppard and Loam (21 data points) 100 5933 1200*Thibault (1990) _ _ _ _ _ _ _ _ _ _ _ _ __ _ _ _ _ _ _
Sheppard and Clay (18 data points) 316 190000 5100*Thibault (1990) _ _ _ _ _ _ _ _ _ _ _ __ _ _ _ _ _ _ _ _ _ _ _ _
EPA 1999 Soluble carbonate 0.1-6 380 2700 _meq L; lay(31 -500/o)_ _ _ _ _ _
ISCORS 2003 __ __-_ 953RESRAD default _ _ _ 2000
*Geometric mean, based on assumed lognormal distribution
5.2 THORiUM
Table 18 shows summary statistics for Thorium (Th) Kd values in clay from Sheppardand Thibault (1990), and the range of values in EPA (1999) where a look-up table (with pH as theindependent variable) was formulated based on several published studies. The RESRAD defaultvalue of 60000 mL/g is recommended for application at Hematite. Although it is an order ofmagnitude higher than the geometric mean for clay in Sheppard and Thibault (1990), it is wellwithin the range in EPA's look-up table, which is based on several studies and many more datapoints when compared to 5 data points used by Sheppard and Thibault for calculating theirgeometric mean. The baseline Kd value for Th used in the ISCORS dose modeling effort forsewage sludge is also shown in Table 18.
Table 18. Published lKd values for thorium
. Minimum Kd Maximum Kd "Best" EstimateSource Soil Type or Characteristic (mL/Mximu) (L/) for d
(m L~g)(m L/g)(m u g)Sheppard and Loam (no data) _Thilbault (1 990
Thibault (1990) Clay (5 data points) 244 160000 5800*EPA 1999 pH 5-8 1700 170000 _ -
ISCORS 2003 A_ -_ 5884RESRAD default __ _ _ 60000
*Geometric mean, based on an assumed lognormal distribution
43

53 NEPTUNIUM
Table 19 shows summary statistics for neptunium (Np) Kd values in loam and clay fromSheppard and Thibault (1990), as well are results from a number of studies found in the literature.The baseline Kd value for Np used in the ISCORS dose modeling effort for sewage sludge is alsoshown in Table 19. Note that the "default" Kd value in RESRAD is -1, which is a flag thatinvokes calculation of the default value using a correlation with the plant root uptake transferfactor [Yu et al., 2001]. In current version of RESRAD (v.6), the correlation for a loamy soil isused and results in a calculated Ks for Neptunium of 257. For the Hematite Site, a value of 2m.Lg is recommended which is near the low end of Kds shown in Table 19. If the calculatedDCGL based on this conservative K& is significantly smaller than in situ Np levels andwill require significant clean-up efforts, site-specific laboratory measurements may bewarranted.
Table 19. Published Kd values for neptunium
Minium K MaimumKd "Best" EstimateSource Soil Type or Characteristic Minimum M mum for Kd
(maL/) (mL/g)L (miU)Sheppard and Loam (I11 data points) 1.3 79 25*Thibault (1 990) _ _ _ _ _ _ _
Sheppard and Clay (4 data points) 79 2575 55*Thbibault (1990) Ca 4dt onsEPA 1999 Not included in compendium --- -
Kaplan et al., Silty loam and coarse sand, 2.17 19.861996 pH 8.3 2198Kaplan et al., Loamy sand and silt loam 2.4 21.71995 _ _ _ _ _ _ _ _ _ _ _ _ _ _
Montmorillonite clay,Tu1er et al., maximum at pH 8-8.5 in _ 100 m/g -199 ___presence of atmospheric CO2ISCORS 2003 -_ --- 17RESRAD default _ _ -_
*Geometric mean, based on an assumed log-normal distribution"*This is a flag that invokes the calculation of a default Kd value using correlations with plant/soilconcentration ratios. This results in a default Kd of 257 mIug in the current version of RESRAD (v.6).
5A AMERICIUM
Table 20 shows summary statistics for americium (Am) Kd values in loam and clayfrom Sheppard and Thibault (1990), as well as results from a study referenced by Cantrell et al.(2000) where Kd values were measured in sandy material from the Department of Energy'sHanford Site. The baseline Kd value for Np used in the ISCORS dose modeling effort for sewagesludge is also shown in Table 20. The default RESRAD Kd value is very low (20 mL/g), and isoutside the range of Kds for loam and clay reported by Sheppared and Thibault (1990). For theHematite site, it is recommended that 1000 mL/g be used. This value is more consistent with thepublished values referenced in Table 20, but is still conservative given that it is much lower thanthe geometric means for loam and clay in Sheppard and Thibault (1990).
44

Table 20. Published Kd values for Americium
Minium d Maimu Kd "Best" EstimateSource Soil Type or Characteristic |Min]imumK MaximumKd| for Kd
Sheppard and Loam (20 data points) 400 48309 9600*Thibault (1990) _ _ _ _ _ _ _ _ _ _ _ _ _ _ _ _ _ _ _ _ _
Sheppard and Clay (1 I data points) 25 40000 8400*T hibault (1990) _ _ _ _ _ _ _ _ _ _ _ _ _ _ _ _ _ _ _ _ _ _ _ _ _ _ _ _ _ _ _ _ _
EPA 1999 Not included in compendium -_ _.
Cantrell et al. Sandy material >1200mLlg(2 000) _ _ _ _ _ _ _ _ _ _ _ _ _ _ _ _ _ _ _ _ _ _ _ _ _ _ _ _ _
ISCORS 2003 i_ _ _ 825RESRAD default _ - 20
*Geometric mean, based on an assumed log-normal distribution
45

6. SUMMARY AND RECOMMENDATIONS
Site-specific measurements for Kd were performed on samples collected from areas ofconcern within the Hematite Site. A total of six boreholes were drilled to refusal or bedrock(-30 to 35 ft), and 18 soil samples (3 depth intervals per borehole) were collected for Kd testing,radionuclide analysis and general soil characterization procedures. The following is a summaryof primary findings from this study:
1. All samples collected consisted of very fine-grained, brown silty clay, likelycorresponding to the NSSC and DSSC HU identified in previous characterization reports[LBG 20031. However, these two layers could not be visually distinguished in the field.Furthermore, the sand/gravel HU described by LBG (2003) was encountered in four outof six boreholes but at a thickness of less than 1 ft. not enough to obtain representativesamples for Kd testing. The fine-grained nature of the soil samples was confirmed byparticle size distribution measurements, which showed the soils to consist of >96% siltand clay sized fractions and -30% clay.
2. General soil characteristics did not vary significantly over the site as shown in thesummary table below. Furthermore, there were no observable trends with depth in theseparameters.
Table 21. Summary of Hematite soil properties measured in this study
Moisture Total Carbon Total Organic Iron Manganese(%) (g/kg) Carbon (g/kg) (g/kg) (glkg)
Minimum 5.8 13% 1.36 2.2 11.1 0.216
Maximum 8.3 28% 9.49 14 21.2 1.85
3. Uranium activities were detected at significant levels in samples from the restricted areas(BHKDS), and in shallowest sample from the Tile Barn/Cistem Bum Pit (BHKD3-8).Slightly elevated U activities were also observed in the mid-depth sample from anotherlocation in the restricted areas (BHKD4-14) and the shallowest sample from theEvaporation Ponds (BHKD6-1). Technetium was not detected at significant levels in anyof the samples collected for this study.
4. Kd testing was performed following ASTM 4319-93, Standard Test Method forDistribution Ratios by the Short-term Batch Method, as recommended in the RESRADdata collection handbook. Two types of Kd tests were performed: (1) desorption testswhere a measured mass of soil was contacted with a measured volume of uncontaminatedgroundwater over a period of 14 days, and (2) adsorption tests where soil was contactedwith uncontaminated groundwater spiked to predetermined levels of U (as the uranyl ionor UO2
2+) and 9Tc (as the pertechnetate ion TcO4). The Kd tests were performed in two
46

batches, to enable modifications in procedures for the second batch of tests based on thefirst batch of results.
5. In general, steady-state conditions were achieved in the soil/water mixtures within 14days during the Kd tests. For Uranium, lower overall Kd values were observed in theadsorption tests, when compared to the desorption tests. Average Kds from the adsorptionand desorption tests were calculated (excluding data suspected to have beencompromised by high U in the contact solution prepared for the first group of tests, andone Kd measurement that was much higher than the rest of the data) and the mean of theaverages was considered the "best" estimate for U Kd for the Hematite Site. Although thedesorption tests are likely to be more representative of contaminant leaching under fieldconditions, the adsorption data was still considered to achieve a reasonable butconservative site-specific Kd for Uranium.
For Tc, significant removal of Tc was observed from the liquid phase of the soil/watermixtures within 3 days. This "apparent" sorption could be due to the combined reductionof Tc (VII) to Tc (VI) and adsorption or precipitation of the latter, rather thanelectrostatic interactions of Tc (VII) with soil mineral surfaces. The resulting Kds for Tcare significantly higher than published values, but the validity of Kd obtained from thisstudy is supported by results that were repeated in multiple soil samples at several timeintervals, and recovery of the Tc on the solid residues.
6. The following table shows the recommended Kd values for radionuclides of interest to theHematite Site. The U and Tc Kd values are site-specific in that these were measured usingsoil samples collected from the site. Because there were no distinct trends with depth inthe Kd measurements for both U and Tc, spatial variability is best addressed by assumingthat the unconsolidated sediments overlying bedrock at the Hematite Site can becharacterized by a single Kd parameter that has either a log-normal (for U) or uniform(for Tc) distribution. The Kd values for the rest of the radionuclides are based onpublished literature values.
Table 22. Recommended Kd values for RESRAD modeling at Hematite Site
Radionuclides Recommended Kd Remarksof Concern value (mL/g) _ _ _ _ _ _ _
Uranium 175 Site specific measurement with range of 6.6 and 471.4mUg; grossly approximates a lognormal distribution.Site specific measurement with range of 15.1 and 172.9
Technetium 106 mL/g; approximates a uniform distribution between 0 and200 mIJ.
Plutonium 2000 RESRAD default value, reasonable when compared topublished literature.
Thorium 60000 RESRAD default value, reasonable when compared topublished literature.
Neptunium 2 At low end of published literature values.
Americium 10000 Consistent with published literature values, more reasonableIthan default Kd of 20.
47

7. REFERENCES
Bostick, B.C., S. Fendorf, M. Bennett, P. Jardine, and S. Brooks. 2002. Uranyl surface complexesformed on subsurface media from DOE facilities. Soil Sci. Soc. Am. J. 66:99-108.
Environmental Protection Agency (EPA). 1999. Understanding Variation in PartitionCoefficient, Kd, Values, Vol. II Review of Geochemistry and Available Kd Values forCadmium, Cesium, Chromium, Lead, Plutonium, Radon, Strontium, Thorium, Tritium(312, and Uranium. EPA 402-R-99-004B.
GEO Consultants, LLC and Science Applications International Corporation, 2003 (July).Distribution Coefficient Sampling and Analysis Plan for the Hematite Site, Rev A,prepared for the Westinghouse Electric Company, Hematite Facility, Festus, MO.
Gu, B, and Dowlen, K. 1996. An Investigation of Groundwater Organics, Soil Minerals andActivated Carbon on the Complexation, Adsorption and Separation of Technetium-99,ORNL/TM-13 154, Oak Ridge National Laboratory, Oak Ridge, TN.
Interagency Steering Committee on Radiation Standards. 2003. Assessment of Radioactivity inSewage Sludge: Modeling to Assess Radiation Doses, Draft Report for Comment,NUREG-1783, U.S. Nuclear Regulatory Commission, Washington, DC.
Kaplan, D. I.; Serkiz, S. M. 2001. Quantification of thorium and uranium sorption tocontaminated sediments. Journal of Radioanalytical and Nuclear Chemistry, 248, 529-535.
Kaplan, D. I. and Seine, R. J. 1995 (March). Distribution Coefficient Values Describing Iodine,Neptunium, Selenium, Technetium, and Uranium Sorption PNL-10379, Sup. 1. PacificNorthwest Laboratory, Richland, WA
Kaplan, D. I.; Serne, R. J.; Owen, A. T.; Conca, J.; Wietsma, T. W.; Gervais, T. L. 1996(August). Radionuclide Adsorption Distribution Coefficient Measured in HanfordSediments for the Low Level Waste Performance Assessment Project. PNNL-1 1485,Pacific Northwest National Laboratory, Richland, WA.
Krupka, K. M.; Serne, R. J. 2002. Geochemical Factors Affecting the Behavior of Antimony,Cobalt, Europium, Technetium, and Uranium in Vadose Sediments. Pacific NorthwestNational Laboratory, PNNL-14126.
Leggette, Brashears and Graham, Inc. (LBG), 2003 (May). Remedial Investigation FeasibilityStudy Work Plan, Revision 0, prepared for the Westinghouse Electric Company, HematiteFacility, Festus, MO.
Science Applications International Corporation, 2003 (June). Gamma Survey Data EvaluationReport, prepared for the Westinghouse Electric Company, Hematite Facility, Festus, MO.
Senko, J., Istok, J., Suflita, J., Krumholtz, L. 2002. In-Situ Evidence for Uranium ImmobilizationandRemobilization. Environ. Sci. Technol., 26, 1491-1496.
48

Sheppard, C., Sheppard, M. and Evenden, W. 1990. A Novel Method Used to ExamineVariation in Tc Sorption Among 34 Soils, Aerated and Anoxic, J. Environ. Radioactivity,11, 215-233.
Sowder, A.G., P.M. Bertsch, and PJ. Morris. 2003J Partioning and availability of uranium andnickel in contaminated riparian sediments. Journal of Environmental Quality. 32:885-898.
Turner, D. R.; Pabalan, R. T.; Bertetti, F. P. 1998. Neptunium (V) sorption on montmorillonite:An experimental and surface complexation modeling study. Clays and Clay Minerals,46, 256-269.
Yu, C., Luiero, C., Cheng, J.-J., Jones, J. G., Wang, Y. Y., Chin, Y. P., and Faillace, E., 1993.Data Collection Handbook to Support Modeling Impacts, Argonne National Laboratory,Argonne, L.
Yu, C., Zielin, J., Cheng, J.-J., LePoire, D. J., Gnanaprajasan, E., Kamboj, S., Amish, J., WalloIII, A., William, W. A., and Peterson, H. 2001. User's Manualfor RESRAD Version 6,ANL/EAD-4, Argonne National Laboratory, Argonne, IL.
49

Appendix AData Validation Reports
A-1

DATA VALIDATION REPORT Dae:September 4,2003
To: From:
Steve Passig Jerry Everett
Laboratory: SDG#:
Severn Trent - St. Louis F3H010120
Attached you will find the results from the data validation technical review for the Westinghouse/Hematitesamples and analyses that are associated with the above referenced laboratory and sample delivery group(SDG) number. These data points have been selected for data validation and the sample index on thefollowing page specifically identifies the samples and analyses associated with this validation review.
The FUSRAP validation technical review was performed in accordance with the Contract LaboratoryProgram Data Validation Functional Guidelinesfor Evaluating Inorganic Analytical Data, and theLaboratory Data Validation Guidelines for Evaluating Radionuclide Analyses and Radiochemical DataVerification and Validation. It was based on the information and documentation supplied by the associatedlaboratory. The analyses were evaluated against criteria established in the related analytical procedures andthe Westinghouse/Hematite data quality requirements.
Attachment A to this report provides the Sample Data Summary Sheets for the samples associated with theabove referenced request. These summary sheets identify the analytical values and the qualifiers for eachsample and parameter. Attachment B outlines the validation qualifiers and reason codes used in the validationof the data.
Report Summary
Total Number of Samples 14
Total Number of Data Points 108
Total Number of Rejected Data Points 0
Percent Completeness 100.0%(approval to rejection ratio)

Date:Sample IndexSeptember 4,2003
Laborntory: SDG im
Severn Trent - St. Louis F3HO10120
WESTINGHOUSE Target AnalysesSample IDI
BHKD4-02 Iron, Manganese, Total Carbon, TOC, Isotopic UraniumTechnetium-99, percentmoisture, pH
BHKD4-14 Iron, Manganese, Total Carbon, TOC, Isotopic Uranium,Technetium-99, percentmoisture, pH
BHKD4-24 Iron, Manganese, Total Carbon, TOC, Isotopic UraniumTechnetium-99, percentmoisture, pH
BHKD5-01 Iron, Manganese, Total Carbon, TOC, Isotopic Uranium,Technetium-99, percentmoisture, pH
BHKD5-19 Iron, Manganese, Total Carbon, TOC, Isotopic Uranium,Technetium-99, percentmoisture, pH
BHKD5-27 Iron, Manganese, Total Carbon, TOC, Isotopic Uranium,Technetium-99, percentmoisture, pH
BHKD6-01 Iron, Manganese, Total Carbon, TOC, Isotopic UraniumTechnetium-99, percentmoisture, pH
BHKD6-11 Iron, Manganese, Total Carbon, TOC, Isotopic Uranium,Technetium-99, percentmoisture, Ph
BHKD6-26 Iron, Manganese, Total Carbon, TOC, Isotopic Umanium,Technetium-99, percentmoisture, pH
OB-l-KD Isotopic Uranium,Technetium-99
OB-1-ANION Chloride, Nitrate, Sulfate
OB-I-CATION Calcium, Potassium, Magnesium, Sodium
WS-14-ANION Chloride, Nitrate, Sulfate
WS-14-CATION Calcium, Potassium, Magnesium, Sodium

ANALYTICAL. CATFC.ORV! Aniang
Chloride, Nitrate, and Sulfate were determined by SW846 Method 9056A.
1. The following items (as applicable) have been addressed during the validation review:
sample custody, integrity & preservationsample handling & preparationholding timesinstrument calibration & performancedilution factorsdetection limitslaboratory background & carry-overappearance & interpretation of chromatography t
retention times'overall appearance of the data
* Quality Control:° calibration checks & blanks
- laboratory blanks (method, TCLP)° laboratory control samples
I matrix spike samplesa matrix duplicates
0 field blanks (if available)o field duplicates (if available)
t for ion chromatography only.
2. The above items were found to be acceptable, except as follows:
* None
3. Additional comments:
* Contamination with chloride was seen in the calibration blanks. Calibration blanks are runto verify that cany over does not occur and that no contamination is being introduced duringthe run. Chloride data associated with the bracketed samples were greater than five times thecontamination level. Therefore, qualification of the chloride data were not necessary.

ANAI.NTrCAT. r2AT1F.GRV! Metasd
* Metals were analyzed by Inductively Coupled Plasma (ICP).
1. The following items (as applicable) have been addressed during the validation review:
sample custody, integrity & preservationsample handling & preparationholding timesinstrument calibration & performancedilution factorsdetection limitslaboratory background & carry-overoverall appearance of the data
Quality Control:o calibration checks & blanks
0 laboratory blanks (method, TCLP)°laboratory control samples
° matrix spike samples° matrix duplicateso field blanks (if available)o field duplicates (if available)°CRDL standards°interference check standards°analytical bench spikes° serial dilutions
2. The above items were found to be acceptable, except as follows:
* Blank Contamination
The continuing calibration blank was contaminated with potassium at a concentration of1600 ug/l. This is evidence of possible laboratory contamination. The positive potassiumresult in sample OB- I-CATION was less than five times the contamination level. Thereported sample concentration was qualified with a U.
3. Additional comments:
* Contamination with iron and manganese were seen in the calibration blanks. Calibrationblanks are run to verify that carry over does not occur and that no contamination is beingintroduced during the run. Iron and manganese data associated with the bracketed sampleswere greater Dtan five times the contamination level. Therefore, qualification of iron andmanganese were not necessary.
* Detection limits in samples OB-1-CATION and WS-14-CATION have been changed.

ANALYTICAl. CATEG-ORY MiaRePllnnenis
* Total Organic Carbon and Total Carbon were determined by SW846 Method 9060: pH was determinedby SW846 Method 9045A; and percent moisture was determined by MCAWW 1603.
1. The following items (as applicable) have been addressed during the validation review:
sample custody, integrity & preservationsample handling & preparationholding timesinstrument calibration & performancedilution factorsdetection limitslaboratory background & carry-overoverall appearance of the data
* Quality Control:0 calibration checks & blanks
0 laboratory blanks (method, TCLP)° laboratory control samples
I matrix spike samplesI matrix duplicates
0 field blanks (if available)° field duplicates (if available)
2. The above items were found to be acceptable, except as follows:
* None.
3. Additional comments:
None.

ANAL! rTWAL.CATMC.RYV RainhehIpmrnlm
* Isotopic uranium was determined by alpha spectroscopy (NAS/DOE 3050RP), and technetium wasdetermined by Liquid scintillation counters (DOE TC-02-RC).
1. The following items (as applicable) have been addressed during the validation review:
sample custody, integrity & preservationsample handling & preparationholding timesinstrument calibration & performancedilution factorsdetection limitslaboratory background & carry-overoverall appearance of the data
* Quality Control:0 calibration checks & background
0 preparation blanksI laboratory control samples
0 field blanks (if available)I field duplicates (if available)
2. The above items were found to be acceptable, except as follows:
Instrument Counting Error
Several samples have reported results that are less than the MDA and the uncertainty is greater thanthe result. The non-detect results for these samples were qualified UJ.
Several samples have reported results that are greater than the MDA and the sample uncertainty is50% to 100% of the sample result. The reported values for these samples were qualified with a J.
Blank Contamination
Uranium-234 was present in the associated method blank at 0.1 0.11 pCi/g. This mayindicate that contamination could have been introduced during the laboratory preparation.The normalized absolute difference between the sample OB-1-KD and the method blank wasless than 2.58 and was qualified as estimated, J.
3. Additional comments:
MDC values for Isotopic uranium in sample BHKD6-01 have been changed.

ATTACHMENT A
WESTINGHOUSE Sample Data Summary Sheets

ATTACHMENT BKEY TO THE WESTINGHOUSE DATA VALIDATION OUALMIlERS
QUALIFIERS
Indicates that the data met all QAIQC requirements, and that the parameter has been positivelyidentified and the associated concentration value is accurate.
U Indicates that the data met all QA/QC requirements, and that the parameter was analyzed for butwas not detected above the reported sample quantitation limit.
J Indicates that the parameter was positively identified; the associated numerical value is theapproximate concentration of the parameter in the sample.
UJ Indicates that the parameter was not detected above the reported sample quantitation limitHowever, the reported quantitation limit is approximate and may or may not represent the actuallimit of quantitation necessary to accurately and precisely measure the analyte in the sample.
N The analysis indicates the presence of a parameter for which there is presumptive evidence to makea "tentative identification."
R Indicates that the sample results for the parameter are rejected or unusable due to seriousdeficiencies in the ability to analyze the sample and meet quality control criteria. The presence orabsence of the parameter cannot be verified.

Data Validation Reason Codes
Holding TimesAOI Extraction holding times were exceeded.A02 Extraction holding times were grossly exceeded.A03 Analysis holding times were exceeded.A04 Analysis holding times were grossly exceeded.A05 Samples were not preserved properly.A06 Professional judgment was used to qualify the data.
(CXMS TuningBO1 Mass calibration was in error, even after applying expanded criteria.B02 Mass calibration was not performed every 12 hours.B03 Mass calibration did not meet ion abundance.B04 Professional judgment was used to qualify the data.
Initial/Cantinnintc Calibration - Org0 niCO Initial calibration RRF was <0.05.C02 Initial calibration RSD was >30%.C03 Initial calibration sequence was not followed as required.C04 Continuing calibration RRF was <0.05.C05 Continuing calibration %D was >25%.C06 Continuing calibration was not performed at the required frequency.C07 Resolution criteria were not met.C08 RPD criteria were not met.C09 RSD criteria were not met.C10 Retention time of compounds was outside windows.Cl1 Compounds were not adequately resolved.C12 Breakdown of endrin or DDT was >20%.C13 Combined breakdown of endrin/DDT was >30%.C14 Professional judgment was used to qualify the data.
BlanksFOI Sample data were qualified as a result of the method blank.F02 Sample data were qualified as a result of the field blank.F03 Sample data were qualified as a result of the equipment rinsate.F04 Sample data were qualified as a result of the trip blank.F05 Gross contamination exists.F06 Concentration of the contaminant was detected at a level below the CRQL.F07 Concentration of the contaminant was detected at a level less than the action limit, but
greater than the CRQL.FOS Concentration of the contaminant was detected at a level that exceeds the action level.F09 No laboratory blanks were analyzed.F10 Blank had a negative value >2x's the IDL.Fl 1 Blanks were not analyzed at required frequency.F12 Professional judgment was used to qualify the data.
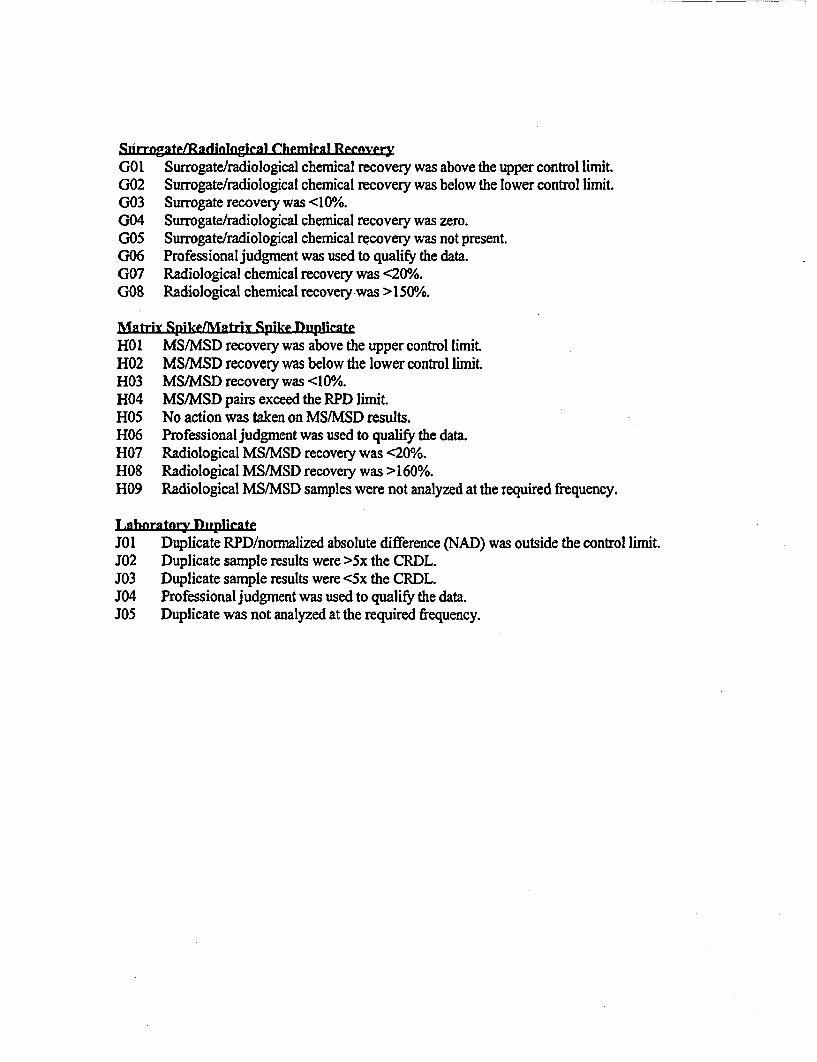
Suirrogate/Radionean Chemical ReenveryGOI Surrogate/radiological chemical recovery was above the upper control limit.G02 Surrogate/radiological chemical recovery was below the lower control limit.G03 Surrogate recovery was <10%.G04 Surrogate/radiological chemical recovery was zero.G05 Surrogate/radiological chemical recovery was not present.G06 Professional judgment was used to qualify the data.G07 Radiological chemical recovery was <20%.G08 Radiological chemical recovery was >150%.
Mntriv Spike/Mintrir Spike DuplirsteHOI MS/MSD recovery was above the upper control limitH02 MS/MSD recovery was below the lower control limit.H03 MS/MSD recovery was <10%.H04 MS/MSD pairs exceed the RPD limit.HOS No action was taken on MS/MSD results.H06 Professional judgment was used to qualify the data.H07 Radiological MS/MSD recovery was <20%.H08 Radiological MS/MSD recovery was >160%.H09 Radiological MS/MSD samples were not analyzed at the required frequency.
T .ahbnratny Tneplic ateJO Duplicate RPD/normalized absolute difference (NAD) was outside the control limit.J02 Duplicate sample results were >5x the CRDL.J03 Duplicate sample results were <5x the CRDL.J04 Professional judgment was used to qualify the data.J05 Duplicate was not analyzed at the required frequency.

Target Compound IdentificationMol Incorrect identifications were made.M02 Qualitative criteria were not met.M03 Cross contamination occurred.M04 Confirmatory analysis was not performed.M05 No results were provided.M06 Analysis occurred outside 12 hr GC/MS window.M07 Professional judgment was used to qualify the data.M08 The %D between the two pesticide/PCB column checks was >25%.
Laharatnry Control Sgmpleq (TaSC.)P01 LCS recovery was above upper control limit.P02 LCS recovery was below lower control limit.P03 LCS recovery was <50%/o.P04 No action was taken on the LCS data.P05 LCS was not analyzed at required frequency.P06 Radiological LCS recovery was <50% for aqueous samples; <40% for solid samples.P07 Radiological LCS recovery was >150% for aqueous samples; >160% for solid samples.P08 Professional judgment was used to qualify the data.
Field DuplieateQOI No action was taken on the basis of field duplicate RPDs.Q02 Radiological field duplicate normalized absolute difference (NAD) was outside the control
limit.Q03 Duplicate sample results were >5x the CRDL.Q04 Duplicate sample results were <5x the CRDL.
Radinloaieal CaflihrationROI Efficiency calibration criteria were not met.R02 Energy calibration criteria were not met.R03 Resolution calibration criteria were not metR04 Background determination criteria were not met.R05 Quench curve criteria were not met.R06 Absorption curve criteria were not met.R07 Plateau curve criteria were not met.R08 Professional judgment was used to qualify the data.
Rndinlogieal Calibratinn VerificntinnS01 Efficiency verification criteria were not met.S02 Energy verification criteria were not met.S03 Resolution verification criteria were not metS04 Background verification criteria were not met.SOS Cross-talk verification criteria were not met.S06 Professional judgment was used to qualify the data.

Radionhielide ()uantitntionTO1 Detection limits were not met.T02 Analytical uncertainties were not met and/or not reported.T03 Inappropriate aliquot sizes were used.T04 Professional judgment was used to qualify the data.T05 Analytical result is less than the associated MDA, but greater than the counting
uncertainty.T06 Analytical result is less than both the associated counting uncertainty and MDA.T07 Negative analytical result where the absolute value exceeds 2x the associated MDA.
System PerformnneeVOl High background levels or a shift in the energy calibration were observed.V02 Extraneous peaks were observed.V03 Loss of resolution was observed.V04 Peak-tailing or peak splitting that may result in inaccurate quantitation were observed.V05 Professional judgment was used to qualify the data.

U
DATA VALIDATION REPORT ISeptember 4,2003
To: From
Steve Passig Jerry Everett
Laboraory: SDG
Severn Trent - St. Louis F3G310383
Attached you will find the results from the data validation technical review for the WestinghouseHernatitesamples and analyses that are associated with the above referenced laboratory and sample delivery group(SDG) number. These data points have been selected for data validation and the sample index on thefollowing page specifically identifies the samples and analyses associated with this validation review.
The FUSRAP validation technical review was performed in accordance with the Contract LaboratoryProgram Data Validation Functional Guidelinesfor Evaluating Inorganic Analytical Data, and theLaboratory Data Validation Guidelines for Evaluating Radionuclide Analyses and Radiochemical DataVerification and Validation. It was based on the information and documentation supplied by the associatedlaboratory. The analyses were evaluated against criteria established in the related analytical procedures andthe Westinghouse/Hematite data quality requirements.
Attachment A to this report provides the Sample Data Sunmmary Sheets for the samples associated with theabove referenced request. These sumnmary sheets identify the analytical values and the qualifiers for eachsample and parameter. Attachment B outlines the validation qualifiers and reason codes used in the validationof the data.
Report Summary
Total Number of Samples 9
Total Number of Data Points 90
Total Number of Rejected Data Points 0
Percent Completeness 100.0%(approval to rejection ratio)

Sample Index Date:
September 4, 2003
Labomtory: SDG #:
Severn Trent - St. Louis J F3G310383
WESTINGHOUSE. -Target AnalysesSample ID
BHKDI-04 Iron, Manganese, Total Carbon, TOC, Isotopic UraniurnTechnetium-99, percentmoisture, pH
BHKDI-23 Iron, Manganese, Total Carbon, TOC, Isotopic Uranium,Technetium-99, percent_moisture, pH
BHKDI -28 Iron, Manganese, Total Carbon, TOC, Isotopic Uranium,Technetium-99, percentnmoisture, pH
BHKD2-04 Iron, Manganese, Total Carbon, TOC, Isotopic Uranium,Technetium-99, percentmoisture, pH
BHKD2-13 Iron, Manganese, Total Carbon, TOC, Isotopic UraniumTechnetium-99, percentmoisture, pH
BHKD2-23 Iron, Manganese, Total Carbon, TOC, Isotopic Uranium,Technetium-99, percentmoisture, pH
BHKD3-08 Iron, Manganese, Total Carbon, TOC, Isotopic UraniumTechnetium-99, percentmoisare, pH
BHKD3-16 Iron, Manganese, Total Carbon, TOC, Isotopic UraniumTechnetium-99, percentmoisture, pH
BHKD3-23 Iron, Manganese, Total Carbon, TOC, Isotopic UraniumTecknletium-99, percentmoisture, pH _

ANA.YTrAT. CATEG ORY! Metals
a Iron and manganese were analyzed by Inductively Coupled Plasma (ICP).
I. The following items (as applicable) have been addressed during the validation review:
sample custody, integrity & preservationsample handling & preparationholding timesinstrument calibration & performancedilution factorsdetection limitslaboratory background & carry-overoverall appearance of the data
* Quality Control:0 calibration checks & blanks
0 laboratory blanks (method, TCLP)°laboratory control samples
° matrix spike samplesmatrix duplicatesfield blanks (if available)
° field duplicates (if available)° CRDL standards° interference check standards° analytical bench spikesI serial dilutions
2. The above items were found to be acceptable, except as follows:
* None.
3. Additional comments:
* Contamination with iron and manganese were seen in the calibration blanks. Calibrationblanks are run to verify that carry over does not occur and that no contamination is beingintroduced during the run. Iron and manganese data associated with the bracketed sampleswere greater than five times the contamination level. Therefore, qualification of the iron andmanganese data was not necessary.
The matrix spike recovery for iron was high. The spiked sample analysis is designed toprovide information about the effect of each sample matrix on the sample preparationprocedures and the measurement methodology. When the sample concentration is greaterthan 4X the spike concentration spike recoveries are not evaluated. Therefore qualificationof the date is not necessary.
The matrix spike recovery for manganese was low. The spiked sample analysis is designedto provide information about the effect of each sample matrix on the sample preparationprocedures and the measurement methodology. When the sample concentration is greaterthan 4X the spike concentration, spike recoveries are not evaluated. Therefore qualificationof the date is not necessary.

ANALTIVTCAL. CATEG.ORY! Migeetligneatis
* Total Organic Carbon and Total Carbon were determined by SW846 Method 9060: pH was determinedby SW846 Method 9045A; and percent moisture was determined by MCAWW 160.3.
1. The following items (as applicable) have been addressed during the validation review-
sample custody, integrity & preservationsample handling & preparationholding timesinstrument calibration & performancedilution factorsdetection limitslaboratory background & carry-overoverall appearance of the data
* Quality Control:° calibration checks & blanks
° laboratory blanks (method, TCLP)° laboratory control samples
I matrix spike samplesI matrix duplicates
° field blanks (if available)° field duplicates (if available)
2. The above items were found to be acceptable, except as follows:
* None.
3. Additional comments:
The matrix spike recoveries for total carbon and total organic carbon were high. Thespiked sample analysis is designed to provide information about the effect of each samplematrix on the sample preparation procedures and the measurement methodology. When thesample concentration is greater than 4X the spike concentration spike recoveries are notevaluated. Therefore qualification of the date is not necessary.

I.E Etl XE Al # I rA DESK - E^2lcReMIClI
* Isotopic uranium was determined by alpha spectroscopy (NAS/DOE 30501RP), and technetium wasdetermined by Liquid scintillation counters (DOE TC-02-RC).
1. The following items (as applicable) have been addressed during the validation review:
sample custody, integrity & preservationsample handling & preparationholding timesinstrument calibration & performancedilution factorsdetection limitslaboratory background & carry-overoverall appearance of the data
* Quality Control:0 calibration checks & background
o preparation blanks° laboratory control samples
I field blanks (if available)0 field duplicates (if available)
2. The above items were found to be acceptable, except as follows:
Instrument Counting Error
Several samples have reported results that are less than the MDA and the uncertainty is greater thanthe result. The non-detect results for these samples were qualified UJ.
Several samples have reported results that are greater than the MDA and the sample uncertainty is50% to 1 00%/6 of the sample result. The reported values for these samples were qualified with a J.
3. Additional comments:
Contamination with technetium-99 was seen in the method blank Method blanks are run toveri*Ir that contamination is being introduced during the run. Technetium-99 data associatedwith the method blank were greater than the contamination level. Therefore, qualification ofthe data was not necessary.

ATTACBhIENT A
WESTINGHOUSE Sample Data Summary Sheets

ATTACHMENT BKEY TO TRE WESTINGHOUSE DATA VALIDATION QUALIFIERS
QUALIFIERS
= Indicates that the data met all QA/QC requirements, and that the parameter has been positivelyidentified and the associated concentration value is accurate.
U Indicates that the data met all QA/QC requirements, and that the parameter was analyzed for butwas not detected above the reported sample quantitation linit.
l Indicates that the parameter was positively identified; the associated numerical value is theapproximate concentration of the parameter in the sample.
UJ Indicates that the parameter was not detected above the reported sample quantitation limit.However, the reported quantitation limit is approximate and may or may not represent the actuallimit of quantitation necessary to accurately and precisely measure the analyte in the sample.
N The analysis indicates the presence of a parameter for which there is presumptive evidence to makea "tentative identification."
R Indicates that the sample results for the parameter are rejected or unusable due to seriousdeficiencies in the ability to analyze the sample and meet quality control criteria. The presence orabsence of the parameter cannot be verified.

Data Validation Reason Codes
Hlding TimsAOl Extraction holding times were exceeded.A02 Extraction holding times were grossly exceeded.A03 Analysis holding times were exceeded.A04 Analysis holding times were grossly exceeded.A05 - Samples were not preserved properly.A06 Professional judgment was used to qualify the data.
(CCMS TnuningBOl Mass calibration was in error, even after applying expanded criteria.B02 Mass calibration was not performed every 12 hours.B03 Mass calibration did not meet ion abundance.B04 Professional judgment was used to qualify the data.
Initial/Cnntirnlina rafihrntion - OrgnnitsC01 Initial calibration RRF was <0.05.C02 Initial calibration RSD was >30%.C03 Initial calibration sequence was not followed as required.C04 Continuing calibration RRF was <0.05.C05 Continuing calibration %/D was >25%.C06 Continuing calibration was not performed at the required frequency.C07 Resolution criteria were not met.C08 RPD criteria were not met.C09 RSD criteria were not met.C10 Retention time of compounds was outside windows.Cli Compounds were not adequately resolved.C12 Breakdown of endrin or DDT was >20%.C13 Combined breakdown of endrin/DDT was >30%.C14 Professional judgment was used to qualify the data.
Fola sF02 Sample data were qualified as a result of the method blankF02 Sample data were qualified as a result of the field blanksF03 Sample data were qualified as a result of the equipment knnte.F04 Sample data were qualified as a result of the trip blank.F05 Gross contamination exists.F06 Concentration of the contaminant was detected at a level below the CRQL.F07 Concentration of the contaminant was detected at a level less than the action limit, but
greater than the CRQL.F08 Concentration of the contaminant was detected at a level that exceeds the action level.F09 No laboratory blanks were analyzed.Fl0 Blank had a negative value >2x's the IDL.Fl1 Blanks were not analyzed at required frequency.F12 Professional judgment was used to qualify the data.

Surrngnte/Rndiologieal Chemicil ReenveryGOI Surrogate/radiological chemical recovery was above the upper control limit.G02 Surrogate/radiological chemical recovery was below the lower control limitG03 Surrogate recovery was <10%.G04 Surrogate/radiological chemical recovery was zero.G05 Surrogate/radiological chemical recovery was not present.G06 Professional judgment was used to qualify the data.G07 Radiological chemical recovery was <20%.G08 Radiological chemical recovery was >150%.
Matrir Spike/Matrir Spike Dthplicate
HOI MS/MSD recovery was above the upper control limit.H02 MS/MSD recovery was below the lower control limit.H03 MS/MSD recovery was <10%.H04 MS/MSD pairs exceed the RPD limit.HOS No action was taken on MS/MSD results.H06 Professional judgment was used to qualify the data.H07 Radiological MS/MSD recovery was <200/o.H08 Radiological MS/MSD recovery was >160%.H09 Radiological MS/MSD samples were not analyzed at the required frequency.
TIhnratnry DhvplienteJOI Duplicate RPD/normalized absolute difference (NAD) was outside the control limit.J02 Duplicate sample results were >5x the CRDL.J03 Duplicate sample results were <5x the CRDL.J04 Professional judgment was used to qualify the data.J05 Duplicate was not analyzed at the required frequency.

Tgrget Compninlnd Tdentifiratinn
MO 1 Incorrect identifications were made.M02 Qualitative criteria were not met.M03 Cross contamination occurred.M04 Confirmatory analysis was not performed.M05 No results were provided.M06 Analysis occurred outside 12 hr GCCMS window.M07 Professional judgment was used to qualify the data.M08 The %D between the two pesticide/PCB column checks was >25%.
TLihnrattry Contrnl SgimpVe (r.YC&S)
P01 LCS recovery was above upper control limit.P02 LCS recovery was below lower control limit.P03 LCS recovery was <50%.P04 No action was taken on the LCS data.P05 LCS was not analyzed at required frequency.P06 Radiological LCS recovery was <50% for aqueous samples; <40% for solid samples.P07 Radiological LCS recovery was >150% for aqueous samples; >160% for solid samples.P08 Professional judgment was used to qualify the data.
Field DuplicateQOI No action was taken on the basis of field duplicate RPDs.Q02 Radiological field duplicate normalized absolute difference (NAD) was outside the control
limit.Q03 Duplicate sample results were >5x the CRDL.Q04 Duplicate sample results were <5x the CRDL.
Radinlogieal CalibrationROI Efficiency calibration criteria were not met.R02 Energy calibration criteria were not met.R03 Resolution calibration criteria were not metR04 Background determination criteria were not met.R05 Quench curve criteria were not met.R06 Absorption curve criteria were not met.R07 Plateau curve criteria were not met.R08 Professional judgment was used to qualify the data.
Radiological Callibratinn Verification
SO1 Efficiency verification criteria were not met.S02 Energy verification criteria were not met.S03 Resolution verification criteria were not metS04 Background verification criteria were not met.S05 Cross-talk verification criteria were not met.S06 Professional judgment was used to qualify the data.

Rnd(ionnuelide (2nantitstfinnl
TOl Detection limits were not met.T02 Analytical uncertainties were not met and/or not reported.T03 Inappropriate aliquot sizes were used.T04 Professional judgment was used to qualify the data.T05 Analytical result is less than the associated MDA, but greater than the counting
uncertainty.T06 Analytical result is less than both the associated counting uncertainty and MDA.
T07 Negative analytical result where the absolute value exceeds 2x the associated MDA.
System PerformanceVOl High background levels or a shift in the energy calibration were observed.
V02 Extraneous peaks were observed.V03 Loss of resolution was observed.V04 Peak-tailing or peak splitting that may result in inaccurate quantitation were observed.
V05 Professional judgment was used to qualify the data.

U
DATA VALIDATION REPORT Date:
I_ j November 14,2003
To: From:
Steve Passig Carol Johnson
Laboratory: SDG#:
Severm Trent - St. Louis F31230103
Attached you will find the results from the data validation technical review for the Westinghouse/Hematitesamples and analyses that are associated with the above referenced laboratory and sample delivery group(SDG) number. These data points have been selected for data validation and the sample index on thefollowing page specifically identifies the samples and analyses associated with this validation review.
The Westinghouse/Hematite validation technical review was performed in accordance with the ContractLaboratory Program Data Validation Functional Guidelinesfor Evaluating Inorganic AnalyticalData, andthe Laboratory Data Validation Guidelinesfor Evaluating Radionuclide Analyses and Radiochemical DataVerification and Validation. It was based on the information and documentation supplied by the associatedlaboratory. The analyses were evaluated against criteria established in the related analytical procedures andthe Westinghouse/Hematite data quality requirements.
Attachment A to this report provides the Sample Data Summary Sheets for the samples associated with theabove referenced request. These summary sheets identify the analytical values and the qualifiers for eachsample and parameter. Attachment B outlines the validation qualifiers and reason codes used in the validationof the data.
Report Summary
Total Number of Samples 8
Total Number of Data Points2
Total Number of Rejected Data Points 2
Percent Completeness 100.0%(approval to rejection ratio)

D&M.-Sample IndexNovember 14,2003
Laboratory: ISDG# 1.Severm Treat - St. Louis IF3230103
WESTINGHOUSE Target AnalysesSample ID
BHKD5-01 Total Uranium, Conductivity, pH_
BHKDS-19 Total Uranium, Conductivity, pH
BHKD5-27 Total Uranium, Conductivity, pH
BHKD3-08 Total Uranium, Conductivity, Ph
BHCKD2-04 Total Uranium, Technetium-99, Conductivity, pH
BHKD2-13 Total Uranium, Technetium-99, Conductivity, pH
BHKD2-23 Total Uranium, Technetium-99, Conductivity, pH
OB-1 Total Uranium, Technetium-99

ANA&TTICAI. CATI.PORY Misrelhinponvg
* Specific Conductance was determined by SW846 Method 9050: pH was determined by SW846 Method9045A; and percent moisture was determined by MCAWW 160.3.
1. The following items (as applicable) have been addressed during the validation review:
sample custody, integrity & preservationsample handling & preparationholding timesinstrument calibration & performancedilution factorsdetection limitslaboratory background & carry-overoverall appearance of the data
* Quality Control:° calibration checks & blanks
I laboratory blanks (method, TCLP)° laboratory control samples
I matrix spike samples0 matrix duplicates
° field blanks (if available)I field duplicates (if available)
2. The above items were found to be acceptable, except as follows:
Holding Times for Conductivity were exceeded. resulting in the samples being qualified asestimated, J.
3. Additional comments:
* None

ANAITTICAJ. CATFEORY- Rdfinchemie1n
* Technetium was determined by Liquid scintillation counters (DOE TC-02-RC), and Total Uranium wasdetermined by Laser Phosphorimetry Method ASTM 5174-91.
1. The following items (as applicable) have been addressed during the validation review:
sample custody, integrity & preservationsample handling & preparationholding timesinstrument calibration & performancedilution factorsdetection limitslaboratory background & carry-overoverall appearance of the data
* Quality Control:0 calibration checks & background
0 preparation blanks° laboratory control samples
I field blanks (if available)° field duplicates (if available)
2. The above items were found to be acceptable, except as follows:
* Instrument Counting Error
Several samples have reported results that are less than the MDA and the uncertainty is greater thanthe result. The non-detect results for these samples were qualified UJ.
Method Blank
* Contamination with Technetium-99 and Isotopic Uranium was seen in the method blank.Method blanks are run to verify that contamination is being introduced during the run.Technetium-99 data associated with the method blank did not pass the Normalized AbsoluteDifference criteria. Samples were qualified as estimated, J.
Laboratory Control Sample
The percent recovery for Technetium-99 LCS, was above the upper control limit (UCL).Recoveries above the UCL could be the result of poor preparation or instrumentation
problems, and may indicate a high bias to the data. Only positive sample results for qualifiedas estimated, J.
3. Additional comments:None

ATTACHMENT A
WESTINGHOUSE Sample Data Summary Sheets

ATTACHMENT BKEY TO THE WESTINGHOUSE DATA VALIDATION QUALIFIERS
QUALIFIERS
Indicates that the data met all QAIQC requirements, and that the parameter has been positivelyidentified and the associated concentration value is accurate.
U Indicates that the data met all QA/QC requirements, and that the parameter was analyzed for butwas not detected above the reported sample quantitation limit.
J Indicates that the parameter was positively identified; the associated numerical value is theapproximate concentration of the parameter in the sample.
UJ Indicates that the parameter was not detected above the reported sample quantitation limit.However, the reported quantitation limit is approximate and may or may not represent the actuallimit of quantitation necessary to accurately and precisely measure the analyte in the sample.
N The analysis indicates the presence of a parameter for which there is presumptive evidence to makea "tentative identification."
R Indicates that the sample results for the parameter are rejected or unusable due to seriousdeficiencies in the ability to analyze the sample and meet quality control criteria. The presence orabsence of the parameter cannot be verified.

Data Validation Reason Codes
Hnafing TimesA01 Extraction holding times were exceeded.A02 Extraction holding times were grossly exceeded.A03 Analysis holding times were exceeded.A04 Analysis holding times were grossly exceeded.A05 Samples were not preserved properly.A06 Professional judgment was used to qualify the data.
MSlM Tnuning
B01 Mass calibration was in error, even after applying expanded criteria.B02 Mass calibration was not performed every 12 hours,B03 Mass calibration did not meet ion abundance.B04 Professional judgment was used to qualify the data.
hnitisl/Continvlina Cnufihration - OrpniesC01 Initial calibration RRF was <0.05.C02 Initial calibration RSD was >30%.C03 Initial calibration sequence was not followed as required.C04 Continuing calibration RRF was <0.05.C05 Continuing calibration %D was >25%.C06 Continuing calibration was not performed at the required frequency.C07 Resolution criteria were not met.C08 RPD criteria were not met.C09 RSD criteria were not met.CIO Retention time of compounds was outside windows.Cl1 Compounds were not adequately resolved.C12 Breakdown of endrin or DDT was >20%.C13 Combined breakdown of endrin/DDT was >30%.C14 Professional judgment was used to qualify the data.
BlrnksFOI Sample data were qualified as a result of the method blank.F02 Sample data were qualified as a result of the field blank.F03 Sample data were qualified as a result of the equipment rinsate.F04 Sample data were qualified as a result of the trip blank.F05 Gross contamination exists.F06 Concentration of the contaminant was detected at a level below the CRQL.F07 Concentration of the contaminant was detected at a level less than the action limit, but
greater than the CRQL.F08 Concentration of the contaminant was detected at a level that exceeds the action level.F09 No laboratory blanks were analyzed.FIO Blank had a negative value >2x's the IDL.Fl 1 Blanks were not analyzed at required frequency.F12 Professional judgment was used to qualify the data.

GOrrSguteoRadintrgioloal hemical ReoveryG01 Surrogate/radiological chemical recovery was above the upper control limit.(302 Surrogate/radiological chemical recovery was below the lower control limit.G03 Surrogate recovery was <10%.G04 Surrogate/radiological chemical recovery was zero.G05 Surrogate/radiological chemical recovery was not present.G06 Professional judgment was used to qualify the data.G07 Radiological chemical recovery was <20%.G08 Radiological chemical recovery was >150%.
Matrix SpikeflMtrfr Spike DuplicateHO1 MS/MSD recovery was above the upper control limit.H02 MS/MSD recovery was below the lower control limit.H03 MS/MSD recovery was <10%.H04 MS/MSD pairs exceed the RPD limit.H05 No action was taken on MS/MSD results.H06 Professional judgment was used to qualify the data.H07 Radiological MS/MSD recovery was <20%.H08 Radiological MS/MSD recovery was >160%.H09 Radiological MS/MSD samples were not analyzed at the required frequency.
TLhanratory D11plic2teJOI Duplicate RPD/normalized absolute difference (NAD) was outside the control limit.J02 Duplicate sample results were >5x the CRDL.J03 Duplicate sample results were <5x the CRDL.J04 Professional judgment was used to qualify the data.J05 Duplicate was not analyzed at the required frequency.

Target Compolind TdentifiratidnMOI Incorrect identifications were made.M02 Qualitative criteria were not met.M03 Cross contamination occurred.M04 Confirmatory analysis was not performed.M05 No results were provided.M06 Analysis occurred outside 12 hr GCUMS window.M07 Professional judgment was used to qualify the data.M08 The %D between the two pesticidelPCB column checks was >25%.
Tlahoratary Contrnl Snmpleq (aC.s)PO0 LCS recovery was above upper control limitP02 LCS recovery was below lower control limitP03 LCS recovery was <50%.P04 No action was taken on the LCS data.P05 LCS was not analyzed at required frequency.P06 Radiological LCS recovery was <50% for aqueous samples; <40% for solid samples.P07 Radiological LCS recovery was >1500/c for aqueous samples; >160% for solid samples.P08 Professional judgment was used to qualify the data.
Field DuplieateQOl No action was taken on the basis of field duplicate RPDs.Q02 Radiological field duplicate normalized absolute difference (NAD) was outside the control
limitQ03 Duplicate sample results were >5x the CRDL.Q04 Duplicate sample results were <5x the CRDL.
Radiningical CalibrationRO1 Efficiency calibration criteria were not met.R02 Energy calibration criteria were not met.R03 Resolution calibration criteria were not metR04 Background determination criteria were not met.R05 Quench curve criteria were not met.R06 Absorption curve criteria were not met.R07 Plateau curve criteria were not met.R08 Professional judgment was used to qualify the data.
Radiological Calihration VerificationSO1 Efficiency verification criteria were not met.S02 Energy verification criteria were not metS03 Resolution verification criteria were not metS04 Background verification criteria were not met.SOS Cross-talk verification criteria were not met.S06 Professional judgment was used to qualify the data.

Radinllnwlide Q(ufintitationTOI Detection limits were not met.T02 Analytical uncertainties were not met and/or not reported.T03 Inappropriate aliquot sizes were used.T04 Professional judgment was used to qualify the data.T05 Analytical result is less than the associated MDA, but greater than the counting
uncertainty.T06 Analytical result is less than both the associated counting uncertainty and MDA.T07 Negative analytical result where the absolute value exceeds 2x the associated MDA.
5'yctem PerformanieVO1 High background levels or a shift in the energy calibration were observed.V02 Extraneous peaks were observed.V03 Loss of resolution was observed.V04 Peak-tailing or peak splitting that may result in inaccurate quantitation were observed.VOS Professional judgment was used to qualify the data.

I-
DATA VALIDATION REPORT Date:
November 14, 2003
TO: From:
Steve Passig Carol Johnson
Laborxory: ISDG#.
Severn Trent- St. Louis | F3I230107
Attached you will find the results from the data validation technical review for the Westinghouse/Hematitesamples and analyses that are associated with the above referenced laboratory and sample delivery group(SDG) number. These data points have been selected for data validation and the sample index on thefollowing page specifically identifies the samples and analyses associated with this validation review.
The Westinghouse/Hematite validation technical review was performed in accordance with the ContractLaboratory Program Data Validation Functional Guidefinesfor Evaluating InorganicAnalytical Data, andthe Laboratory Data Validation Guidelinesfor Evaluating Radionuclide Analyses and Radiochemical Data
Verification and Validation. It was based on the information and documentation supplied by the associatedlaboratory. The analyses were evaluated against criteria established in the related analytical procedures and
the Westinghouse/Hematite data quality requirements.
Attachment A to this report provides the Sample Data Summary Sheets for the samples associated with the
above referenced request. These summary sheets identify the analytical values and the qualifiers for each
sample and parameter. Attachment B outlines the validation qualifiers and reason codes used in the validationof the data.
Report Summary
Total Number of Samples 7
Total Number of Data Points 24
Total Number of Rejected Data Points 2
Percent Completeness.0/(approval to rejection ratio)

Sample Index Date:
November 14,2003
Laboratory: SDG C.
Severn Trent - St. Louis F31230117
WESTINGHOUSE Target AnalysesSample ID_ _ _ _ - _-_._:_._-
BHKD5-01 Total Uranium, Conductivity, pH
BHKD5-19 Total Uranium, Conductivity, pH
BHKD5-27 Total Uranium, Conductivity, pH
BHKD3-08 Total Uranium, Conductivity, Ph
BHKD2-04 Total Uranium, Technetium-99, Conductivity, pH
BHKD2-13 Total Uranium, Technetium-99, Conductivity, pH
BHKD2-23 Total Uranium, Technetium-99, Conductivity, pH

ANAL YTTrAT. CATFGORV: Migeellanen,,g
Specific Conductance was determined by SW846 Method 9050: pH was determined by SW846 Method9045A; and percent moisture was determined by MCAWW 160.3.
1. The following items (as applicable) have been addressed during the validation review:
sample custody, integrity & preservationsample handling & preparationholding timesinstrument calibration & performancedilution factorsdetection limitslaboratory background & carry-overoverall appearance of the data
* Quality Control:° calibration checks & blanks
I laboratory blanks (method, TCLP)° laboratory control samples
° matrix spike samplesI matrix duplicates
°field blanks (if available)° field duplicates (if available)
2. The above items were found to be acceptable, except as follows:
Holding Times for Conductivity were exceeded. resulting in the samples being qualified asestimated, J.
3. Additional comments:
None

ANAITVrAll. rATECORY! Radinchemiral
* Isotopic uranium was determined by alpha spectroscopy (NASIDOE 3050/RP), and technetium wasdetermined by Liquid scintillation counters (DOE TC-02-RC), and Total Uranium was determined byLaser Phosphorimetry Method ASTM 5174-9 1.
1. The following items (as applicable) have been addressed during the validation review:
sample custody, integrity & preservationsample handling & preparationholding timesinstrument calibration & performancedilution factorsdetection limitslaboratory background & carry-overoverall appearance of the data
* Quality Control:0 calibration checks & background
a preparation blankso laboratory control samples
field blanks (if available)o field duplicates (if available)
2. The above items were found to be acceptable, except as follows:
Instrument Counting Error
Several samples have reported results that are less than the MDA and the uncertainty is greater thanthe result. The non-detect results for these samples were qualified UJ.
Method Blank
Contamination with Technetium-99 and Isotopic Uranium was seen in the method blank.Method blanks are run to verify that contamination is being introduced during the run.Technetium-99 data associated with the method blank did not pass the Normalized AbsoluteDifference criteria. Samples were qualified as estimated, J.
Laboratory Control Sample
The percent recovery for Technetium-99 LCS, was above the upper control limit (UCL).Recoveries above the UCL could be the result of poor preparation or instrumentation
problems, and may indicate a high bias to the data. Only positive sample results for qualifiedas estimated, J.
3. Additional comments:None

ATTACHMENT A
WESTINGHOUSE Sample Data Summary Sheets

ATTACHMENT B
KEY TO THE WESTINGHOUSE DATA VALIDATION OUALIFIERS
QUALMERS
= Indicates that the data met all QA/QC requirements, and that the parameter has been positivelyidentified and the associated concentration value is accurate.
U Indicates that the data met all QA/QC requirements, and that the parameter was analyzed for butwas not detected above the reported sample quantitation limit
J Indicates that the parameter was positively identified; the associated numerical value is theapproximate concentration of the parameter in the sample.
UJ Indicates that the parameter was not detected above the reported sample quantitation limitHowever, the reported quantitation limit is approximate and may or may not represent the actuallimit of quantitation necessary to accurately and precisely measure the analyte in the sample.
N The analysis indicates the presence of a parameter for which there is presumptive evidence to makea "tentative identification."
R Indicates that the sample results for the parameter are rejected or unusable due to seriousdeficiencies in the ability to analyze the sample and meet quality control criteria. The presence orabsence of the parameter cannot be verified.

Data Validation Reason Codes
Holding TimesAOI Extraction holding times were exceeded.A02 Extraction holding times were grossly exceeded.A03 Analysis holding times were exceeded.A04 Analysis holding times were grossly exceeded.A05 Samples were not preserved properly.A06 Professional judgment was used to qualify the data.
(ON/VIS TirningBOI Mass calibration was in error, even after applying expanded criteria.B02 Mass calibration was not performed every 12 hours.B03 Mass calibration did not meet ion abundance.B04 Professional judgment was used to qualify the data.
InitialC01C02C03C04C05C06C07C08C09C10C1lC12C13C14
ll(nntinning l Clibration -Organi"
Initial calibration RRF was <0.05.Initial calibration RSD was >30%.Initial calibration sequence was not followed as required.Continuing calibration RRF was <0.05.Continuing calibration %D was >25%.Continuing calibration was not performed at the required frequency.Resolution criteria were not met.RPD criteria were not met.RSD criteria were not met.Retention time of compounds was outside windows.Compounds were not adequately resolved.Breakdown of endrin or DDT was >20%.Combined breakdown of endrin/DDT was >30%.Professional judgment was used to qualify the data.
Sample data were qualified as a result of the method blank.Sample data were qualified as a result of the field blank.Sample data were qualified as a result of the equipment rinsate.Sample data were qualified as a result of the trip blank.Gross contamination exists.Concentration of the contaminant was detected at a level below the CRQL.Concentration of the contaminant was detected at a level less than the action limit, but
greater than the CRQL.Concentration of the contaminant was detected at a level that exceeds the action level.
No laboratory blanks were analyzed.Blank had a negative value >2x's the IDL.Blanks were not analyzed at required frequency.Professional judgment was used to qualify the data.
BlnkFO1F02F03F04F05F06F07
F08F09FIOFliF12

Snrrngate/Radiologia1 Chemical RenoveryGO1 Surrogate/radiological chemical recovery was above the upper control limit.G02 Surrogatetradiological chemical recovery was below the lower control limit.G03 Surrogate recovery was <10%.G04 Surrogate/radiological chemical recovery was zero.G05 Surrogate/radiological chemical recovery was not present.G06 Professional judgment was used to qualify the data.G07 Radiological chemical recovery was <20%.G08 Radiological chemical recovery was >150%.
Matriy Spike/Matrix Spike DuplicateHOI MS/MSD recovery was above the upper control limit.H02 MS/MSD recovery was below the lower control limit.H03 MS/MSD recovery was <10%.H04 MS/MSD pairs exceed the RPD limit.H05 No action was taken on MS/MSD results.H06 Professional judgment was used to qualify the data.H07 Radiological MS/MSD recovery was <20%.H08 Radiological MS/MSD recovery was >160%.H09 Radiological MS/MSD samples were not analyzed at the required frequency.
L.aboratoay DuplieateJOl Duplicate RPD/normalized absolute difference (NAD) was outside the control limit.J02 Duplicate sample results were >5x the CRDL.J03 Duplicate sample results were <5x the CRDL.J04 Professional judgment was used to qualify the data.JOS Duplicate was not analyzed at the required frequency.

Target Cnmpouind TMentifieatinuMO1 Incorrect identifications were made.M02 Qualitative criteria were not met.M03 Cross contamination occurred.M04 Confirmatory analysis was not performed.M05 No results were provided.M06 Analysis occurred outside 12 hr GUMS window.M07 Professional judgment was used to qualify the data.M08 The %D between the two pesticide/PCB column checks was >25%.
Lnhoratnry Control SnmpleK (T.C-s)P01 LCS recovery was above upper control limit.P02 LCS recovery was below lower control limit.P03 LCS recovery was <50%.P04 No action was taken on the LCS data.P05 LCS was not analyzed at required frequency.P06 Radiological LCS recovery was <50% for aqueous samples; <40% for solid samples.P07 Radiological LCS recovery was >150% for aqueous samples; >160% for solid samples.P08 Professional judgment was used to qualify the data.
Fiell ulPlicatuQ0I No action was taken on the basis of field duplicate RPDs.Q02 Radiological field duplicate normalized absolute difference (NAD) was outside the control
limit.Q03 Duplicate sample results were >Sx the CRDL.Q04 Duplicate sample results were <5x the CRDL.
Rndionngieal CalibrationROI Efficiency calibration criteria were not met.R02 Energy calibration criteria were not met.R03 Resolution calibration criteria were not metR04 Background determination criteria were not met.R05 Quench curve criteria were not met.R06 Absorption curve criteria were not met.R07 Plateau curve criteria were not met.R08 Professional judgment was used to qualify the data.
Radinlooical C-aihration VerificafonnSo1 Efficiency verification criteria were not met.S02 Energy verification criteria were not met.S03 Resolution verification criteria were not metS04 Background verification criteria were not met.S05 Cross-talk verification criteria were not met.S06 Professional judgment was used to qualify the data.

Radinnelidp Qlnantitntian
TO 1 Detection limits were not met.T02 Analytical uncertainties were not met and/or not reported.T03 Inappropriate aliquot sizes were used.T04 Professional judgment was used to qualify the data.T05 Analytical result is less than the associated MDA, but greater than the counting
uncertainty.T06 Analytical result is less than both the associated counting uncertainty and MDA.
T07 Negative analytical result where the absolute value exceeds 2x the associated MDA.
SyXtem PerfnrmanceVOl High background levels or a shift in the energy calibration were observed.V02 Extraneous peaks were observed.V03 Loss of resolution was observed.V04 Peak-tailing or peak splitting that may result in inaccurate quantitation were observed.
V05 Professional judgment was used to qualify the data.

U
DATA VALIDATION REPORT Da'e:
November 14,2003
To: Fromn:
Steve Passig Carol Johnson
Laboratory: JSDG#:Severn Trent - St Louis F31230110
Attached you will find the results from the data validation technical review for the Westinghouse/Hematitesamples and analyses that are associated with the above referenced laboratory and sample delivery group (SDG)number. These data points have been selected for data validation and the sample index on the following pagespecifically identifies the samples and analyses associated with this validation review.
The Westinghouse/Hematite validation technical review was performed in accordance with the ContractLaboratory Program Data Validation Functional Guidelinesfor Evaluating Inorganic Analytical Data; and theLaboratory Data Validation Guidelinesfor Evaluating RadiornuclideAnalyses and Radiochemical DataVerification and Validation. It was based on the information and documentation supplied by the associatedlaboratory. The analyses were evaluated against criteria established in the related analytical procedures and theWestinghouse/lematite data quality requirements.
Attachment A to this report provides the Sample Data Summary Sheets for the samples associated with the abovereferenced request. These summary sheets identify the analytical values and the qualifiers for each sample andparameter. Attachment B outlines the validation qualifiers and reason codes used in the validation of the data.
Report Summary
Total Number of Samples 7
Total Number of Data Points 24
Total Nunber of Rtected Data Points 0
Percent Completeness l00.00h(approval to rejection ratio)

Ddle:-Sample IndexNovember 14,2003
Labortory: IDG #Severn Trent - St Lous F31230110
WESTINGHOUSE Target AnalysesSample ID
BHKD5-01 Total Uranium, Conductivity, pH
BHKD5-19 Total Uranium, Conductivity, pH
BHKD5-27 Total Uranium, Conductivity, pH
BHKD3-08 Total Uranium, Conductivity, Ph
BHKD2-04 Total Uranium, Technetium-99, Conductivity, pH
BHKD2-13 Total Uranium, Tecnetium-99, Conductivity, PH
BHKD2-23 Total Uranium, Technetium-99, Conductivity, pH

ANALYTTCAr. CATEG.ORV! Wisceffanenug
* Specific Conductance was determined by SW846 Method 9050: pH was determined by SW846Method 9045A; and percent moisture was determined by MCAWW 160.3.
1. The following items (as applicable) have been addressed during the validation review:
* sample custody, integrity & preservation* sample handling & preparation* holding times* instrument calibration & performance* dilution factors* detection limits* laboratory background & carry-over* overall appearance of the data
* Quality Control:0 calibration checks & blanks° laboratory blanks (method, TCLP)° laboratory control samples
I matrix spike samples0 matrix duplicates
I field blanks (if available)0 field duplicates (if available)
2. The above items were found to be acceptable, except as follows:
* Holding Times for Conductivity were exceeded. resulting in the samples being qualified asestimated, J.
3. Additional comments:
None

ANATLV7CAT. CAT .ORRYV Rndoochemical
* Isotopic uranium was determined by alpha spectroscopy (NAS/DOE 30501RP), and technetium wasdetermined by Liquid scintillation counters (DOE TC-02-RC), and Total Uranium was determined byLaser Phosphorimetry Method ASTM 5174-91.
1. The following items (as applicable) have been addressed during the validation review:
* sample custody, integrity & preservation* sample handling & preparation* holding times* instrument calibration & performance* dilution factors* detection limits* laboratory background & carry-over* overall appearance of the data
* Quality Control:° calibration checks & background0 preparation blanksI laboratory control samples
° field blanks (if available)' field duplicates (if available)
2. The above items were found to be acceptable, except as follows:
* Instrument Counting Error
Several samples have reported results that are less than the MDA and the uncertainty is greaterthan the result The non-detect results for these samples were qualified UJ.
Method Blank
* Contamination with Technetium-99 and Isotopic Uranium was seen in the method blank.Method blanks are run to verify that contamination is being introduced during the run.Technetiun-99 data associated with the method blank did not pass the Nomalized AbsoliteDifference criteria Samples were qualified as estimated, J.
Laboratory Control Sample
The percent recovery for Technetium-99 LCS, was above the upper control liit (UCL).Recoveries above the UCL could be the result of poor preparation or instrumentationproblems, and may indicate a high bias to the data Only positive sample results for qualified asestimated, J.
3. Additional comments:None

ATTACHMENT A
WESTINGHOUSE Sample Data Summary Sheets

ATTACHMENT B
KEY TO THE WESTINGHOUSE DATA VALIDATION OUALIFIERS
QUALS
= Indicates that the data met all QAIQC requirements, and that the parameter has been positivelyidentified and the associated concentration value is accurate.
U Indicates that the data met all QA/QC requirements, and that the parameter was analyzed for butwas not detected above the reported sample quantitation limit.
J Indicates that the parameter was positively identified; the associated numerical value is the
approximate concentration of the parameter in the sample.
UJ Indicates that the parameter was not detected above the reported sample quantitation limit.However, the reported quantitation limit is approximate and may or may not represent the actual
limit of quantitation necessary to accurately and precisely measure the analyte in the sample.
N The analysis indicates the presence of a parameter for which there is presumptive evidence tomake a "tentative identification."
R Indicates that the sample results for the parameter are rejected or unusable due to seriousdeficiencies in the ability to analyze the sample and meet quality control criteria. The presence or
absence of the parameter cannot be verified.

Data Validation Reason Codes
Halding TimAOl Extraction holding times were exceeded.A02 Extraction holding times were grossly exceeded.A03 Analysis holding times were exceeded.A04 Analysis holding times were grossly exceeded.A05 Samples were not preserved properly.A06 Professional judgment was used to qualify the data.
GUMIC S TuingB01 Mass calibration was in error, even after applying expanded criteria.B02 Mass calibration was not performed every 12 hours.B03 Mass calibration did not meet ion abundance.B04 Professional judgment was used to qualify the data.
In itial/Contin u ing Calibration - OrganicsCOI Initial calibration RRF was <0.05.C02 Initial calibration RSD was >30%h.C03 Initial calibration sequence was not followed as required.C04 Continuing calibration RRF was <0.05.COS Continuing calibration %D was >25%.C06 Continuing calibration was not performed at the required frequency.C07 Resolution criteria were not met.COS RPD criteria were not met.C09 RSD criteria were not met.CIO Retention time of compounds was outside windows.ClI Compounds were not adequately resolved.C12 Breakdown of endrin or DDT was >20%.C13 Combined breakdown of endrin/DDT was >30%h.C14 Professional judgment was used to quaffy the data.
BlanksFOI Sample data were qualified as a result of the method blank.F02 Sample data were qualified as a result of the field blank.F03 Sample data were qualified as a result of the equipment rinsate.F04 Sample data were qualified as a result of the trip blank.F05 Gross contamination exists.F06 Concentration of the contaminant was detected at a level below the CRQL.F07 Concentration of the contaminant was detected at a level less than the action limit, but
greater than the CRQL.F08 Concentration of the contaminant was detected at a level that exceeds the action leveLF09 No laboratory blanks were analyzeFlO Blank had a negative value >2x's the IDL.F11 Blanks were not analyzed at required frequency.F12 Professional judgment was used to quality the data.

S urrgnate/Ra do iologionl Ch emiel RecoveryGOI Surrogate/radiological chemical recovery was above the upper control limit.G02 Surrogate/radiological chemical recovery was below the lower control limit.G03 Surrogate recovery was <10%.G04 Surrogate/radiological chemical recovery was zero.G05 Surrogate/radiological chemical recovery was not present.G06 Professional judgment was used to qualify the data.G07 Radiological chemical recovery was <0%.GOS Radiological chemical recovery was >150%.
Matrbr Spike/Mstrix Spike DiiplicsteHO1 MS/MSD recovery was above the upper control limit.H02 MS/MSD recovery was below the lower control limit.H03 MS/MSD recovery was <10%.H04 MS/MSD pairs exceed the RPD limit.H05 No action was taken on MS/MSD results.H06 Professional judgment was used to qualify the data.H07 Radiological MS/MSD recovery was <20%.H08 Radiological MS/MSD recovery was >160%.H09 Radiological MS/MSD samples were not analyzed at the required frequency.
1Laboratory DuplicateJOI Duplicate RPD/nomialized absolute difference (NAD) was outside the control limit.J02 Duplicate sample results were >5x the CRDL.J03 Duplicate sample results were <5x the CRDL.J04 Professional judgment was used to qualify the data.JOS Duplicate was not analyzed at the required frequency.

Target Conmpnund IdentificationMOI Incorrect identifications were made.M02 Qualitative criteria were not met.M03 Cross contamination occurred.M04 Confirmatory analysis was not performed.M05 No results were provided.M06 Analysis occurred outside 12 hr GCJMS window.M07 Professional judgment was used to qualify the data.MOS The %D between the two pesticidelPCB column checks was >25%.
Jaboratory Contral Samples (TSs,)PO LCS recovery was above upper control limit.P02 LCS recovery was below lower control limit.P03 LCS recovery was <50%.P04 No action was taken on the LCS data.P05 LCS was not analyzed at required frequency.P06 Radiological LCS recovery was <50% for aqueous samples; <40% for solid samples.P07 Radiological LCS recovery was >150% for aqueous samples; >160% for solid samples.P08 Professional judgment was used to qualify the data.
EFifld~lriateQOl No action was taken on the basis of field duplicate RPDs.Q02 Radiological field duplicate normalized absolute difference (NAD) was outside the control
limit.Q03 Duplicate sample results were >5x the CRDL.Q04 Duplicate sample results were <Sx the CRDL.
Radlinlogical CnlibrationROl Efficiency calibration criteria were not met.R02 Energy calibration criteria were not met.R03 Resolution calibration criteria were not metR04 Background determination criteria were not met.R05 Quench curve criteria were not met.R06 Absorption curve criteria were not met.R07 Plateau curve criteria were not met.R08 Professional judgment was used to qualiir the data.
Rasdialogical rnlibrmtion VerifimctnnSO1 Efficiency verification criteria were not met.S02 Energy verification criteria were not met.S03 Resolution verification criteria were not metS04 Background verification criteria were not met.S05 Cross-talk verification criteria were not met.S06 Professional judgment was used to qualify the data.

Radionuclide QuantitstinnTOI Detection limits were not met.T02 Analytical uncertainties were not met and/or not reported.T03 Inappropriate aliquot sizes were used.T04 Professional judgment was used to quality the data.T05 Analytical result is less than the associated MDA, but greater than the counting
uncertainty.T06 Analytical result is less than both the associated counting uncertainty and MDA.T07 Negative analytical result where the absolute value exceeds 2x the associated MDA.
System PerformanceVOl High background levels or a shift in the energy calibration were observed.V02 Extraneous peaks were observed.V03 Loss of resolution was observed.V04 Peak-tailing or peak splitting that may result in inaccurate quantitation were observed.V05 Professional judgment was used to quaker the data.

DATA VALIDATION REPORT DateI
November 14,2003
To: From:
Steve Passig Carol Johnson
Laboratory:
Severn Trent - St. Louis F31230117
Attached you will find the results from the data validation technical review for the Westinghouse/Hematitesamples and analyses that are associated with the above referenced laboratory and sample delivery group(SWD) number. These data points have been selected for data validation and the sample index on thefollowing page specifically identifies the samples and analyses associated with this validation review.
The Westinghouse/Hematite validation technical review was performed in accordance with the ContractLaboratory Program Data Validation Functional Guidelinesfor Evaluating Inorganic Analytical Data, andthe Laboratory Data Validation Guidelinesfor Evaluating Radionuclide Analyses and Radiochemical DataVerification and Validation. It was based on the information and documentation supplied by the associatedlaboratory. The analyses were evaluated against criteria established in the related analytical procedures andthe Westinghouse/Hematite data quality requirements.
Attachment A to this report provides the Sample Data Summary Sheets for the samples associated with theabove referenced request. These summary sheets identify the analytical values and the qualifiers for eachsample and parameter. Attachment B outlines the validation qualifiers and reason codes used in the validationof the data.
Report Summary
Total Number of Samples 11
Total Number of Data Points 65
Total Number of Rejected Data Points 0
Percent Completeness 100.0%/o(approval to rejection ratio)

Date:Sample IndexNovember 14,2003
Laboor.y:5DG#
Severn Trent - St. Louis F31230117
WESTINGHOUSE Target AnalysesSample ID
BHKD2-04 Isotopic Uranium, Total Uranium, Technetium-99, Conductivity, pH
BHKD2-13 Isotopic Uranium, Total Uranium, Technetium-99, Conductivity, pH
BHKD2-23 Isotopic Uranium, Total Uranium, Technetium-99, Conductivity, pH
BHKD3-08 Isotopic Uranium, Total Uranium, Technetium-99, Conductivity, pH, PercentMoisture
BHKD5-01 Total Uranium, Conductivity, pH, Percent Moisture
BHKD5-19 Isotopic Uranium, Total Uranium, Technetium-99, Conductivity, pH, PercentMoisture
BHKD5-27 Isotopic Uranium, Total Uranium, Technetium-99, Conductivity, pH, Percent
._ Moisture
BHKD5-01 Isotopic Uranium, Technetium-99
BHkD-_19 Isotopic Uranium, Technetium-99, Percent Moisture
BHKD5-27 Isotopic Uranium, Technetium-99, Percent Moisture
BHKD3-08 Isotopic Uranium, Technetium-99, Percent Moisture

ANALYTICAT. CATF.AGRV! Migrellanen:,'
a Specific Conductance was determined by SW846 Method 9050: pH was determined by SW846 Method9045A; and percent moisture was determined by MCAWW 160.3.
1. The following items (as applicable) have been addressed during the validation review:
sample custody, integrity & preservationsample handling & preparationholding timesinstrument calibration & performancedilution factorsdetection limitslaboratory background & carry-overoverall appearance of the data
* Quality Control:0 calibration checks & blanks
° laboratory blanks (method, TCLP)° laboratory control samples
I matrix spike samples0 matrix duplicates
° field blanks (if available)0 field duplicates (if available)
2. The above items were found to be acceptable, except as follows:
* None.
3. Additional comments:
None

ANALYTICAL.CATEGflRY! Rstdinchemhlen
a Isotopic uranium was determined by alpha spectroscopy (NAS/DOE 3050/RP), and technetium wasdetermined by Liquid scintillation counters (DOE TC-02-RC), and Total Uranium was determined byLaser Phosphorimetry Method ASTM 5174-91.
1. The following items (as applicable) have been addressed during the validation review:
sample custody, integrity & preservationsample handling & preparationholding timesinstrument calibration & performancedilution factorsdetection limitslaboratory background & carry-overoverall appearance of the data
* Quality Control:0 calibration checks & background
° preparation blanksI laboratory control samples
field blanks (if available)I field duplicates (if available)
2. The above items were found to be acceptable, except as follows:
* Instrument Counting Error
Several samples have reported results that are less than the MDA and the uncertainty is greater thanthe result. The non-detect results for these samples were qualified UJ.
Method Blank
* Contamination with Technetium-99 and Isotopic Uranium was seen in the method blank.Method blanks are run to verify that contamination is being introduced during the run.Technetium-99 data associated with the method blank did not pass the Normnalized AbsoluteDifference criteria. Samples were qualified as estimated, J.
* Laboratory Control Sample
The percent recovery for Technetium-99 LCS, was above the upper control limit (UCL).Recoveries above the UCL could be the result of poor preparation or instrumentation problems, andmay indicate a high bias to the data. Only positive sample results for qualified as estimated, J.
3. Additional comments:None

ATTACHMENT A
WESTINGHOUSE Sample Data Summary Sheets

ATTACHMENT B
KEY TO THE WESTINGHOUSE DATA VALIDATION qUALIFIERS
QUALIFIERS
Indicates that the data met all QA/QC requirements, and that the parameter has been positivelyidentified and the associated concentration value is accurate.
U Indicates that the data met all QA/QC requirements, and that the parameter was analyzed for butwas not detected above the reported sample quantitation limit.
J Indicates that the parameter was positively identified; the associated numerical value is theapproximate concentration of the param~eter in the sample.
U Indicates that the parameter was not detected above the reported sample quantitation limit.However, the reported quantitation limit is approximate and may or may not represent the actuallimit of quantitation necessary to accurately and precisely measure the analyte in the sample.
N The analysis indicates the presence of a parameter for which there is presumptive evidence to makea "tentative identification."
R Indicates that the sample results for the parameter are rejected or unusable due to seriousdeficiencies in the ability to analyze the sample and meet quality control criteria. The presence orabsence of the parameter cannot be verified.

Data Validation Reason Codes
Holding TimesAOl Extraction holding times were exceeded.A02 Extraction holding times were grossly exceeded.A03 Analysis holding times were exceeded.A04 Analysis holding times were grossly exceeded.A05 Samples were not preserved properly.A06 Professional judgment was used to qualify the data.
PIUMS TtningBOI Mass calibration was in error, even after applying expanded criteria.B02 Mass calibration was not performed every 12 hours.B03 Mass calibration did not meet ion abundance.B04 Professional judgment was used to qualify the data.
Tnitialr/Cntinuing rhlibration - OrganieaC01 Initial calibration RRF was <0.05.C02 Initial calibration RSD was >30%.C03 Initial calibration sequence was not followed as required.C04 Continuing calibration RRF was <0.05.C05 Continuing calibration %D was >25%.C06 Continuing calibration was not performed at the required frequency.C07 Resolution criteria were not met.C08 RPD criteria were not met.C09 RSD criteria were not met.C10 Retention time of compounds was outside windows.ClH Compounds were not adequately resolved.C12 Breakdown of endrin or DDT was >20%.C13 Combined breakdown of endrin/DDT was >30%.C14 Professional judgment was used to qualify the data.
BlanksFO 1 Sample data were qualified as a result of the method blank.F02 Sample data were qualified as a result of the field blank.F03 Sample data were qualified as a result of the equipment rinsate.F04 Sample data were qualified as a result of the trip blank.F05 Gross contamination exists.F06 Concentration of the contaminant was detected at a level below the CRQL.F07 Concentration of the contaminant was detected at a level less than the action limit, but
greater than the CRQL.F08 Concentration of the contaminant was detected at a level that exceeds the action level.F09 No laboratory blanks were analyzed.F10 Blank had a negative value >2x's the IDL.F11 Blanks were not analyzed at required frequency.F12 Professional judgment was used to qualify the data.

Suirrogste/Radinlngien] Chemicni ReenveryG01 Surrogate/radiological chemical recovery was above the upper control limit.G02 Surrogate/radiological chemical recovery was below the lower control limit.G03 Surrogate recovery was <10%.G04 Surrogate/radiological chemical recovery was zero.G05 Surrogate/radiological chemical recovery was not present.G06 Professional judgment was used to qualify the data.G07 Radiological chemical recovery was <20%.G08 Radiological chemical recovery was >150%.
Matrix SpikeMtr x Spike lnwplirlteH01 MS/MSD recovery was above the upper control limit.H02 MS/MSD recovery was below the lower control limit.H03 MS/MSD recovery was <10%.H04 MS/MSD pairs exceed the RPD limit.H05 No action was taken on MS/MSD results.H06 Professional judgment was used to qualify the data.H07 Radiological MS/MSD recovery was <20%.H08 Radiological MS/MSD recovery was >160%.H09 Radiological MS/MSD samples were not analyzed at the required frequency.
T .abratNry Dllnpiete
JOI Duplicate RPD/normalized absolute difference (NAD) was outside the control limit.J02 Duplicate sample results were >5x the CRDL.J03 Duplicate sample results were <5x the CRDL.J04 Professional judgment was used to qualify the data.J05 Duplicate was not analyzed at the required frequency.

Tiirg~et Compatind Tentific~tionMol Incorrect identifications were made.M02 Qualitative criteria were not met.M03 Cross contamination occurredM04 Confirmatory analysis was not performed.M05 No results were provided.M06 Analysis occurred outside 12 hr GC/MS window.M07 Professional judgment was used to qualify' the data.M08 The %D between the two pesticide/PCB column checks was >25%.
Tsihoratory Contrnl Samples (LCSs)P01 LCS recovery was above upper control limitP02 LCS recovery was below lower control limitP03 LCS recovery was <50%.P04 No action was taken on the LCS data.P05 LCS was not analyzed at required frequency.P06 Radiological LCS recovery was <50% for aqueous samples; <40% for solid samples.P07 Radiological LCS recovery was >150% for aqueous samples; >160% for solid samples.P08 Professional judgment was used to qualify the data.
Field MiplienteQO1 No action was taken on the basis of field duplicate RPDs.Q02 Radiological field duplicate normalized absolute difference (NAD) was outside the control
limit.Q03 Duplicate sample results were >5x the CRDL.Q04 Duplicate sample results were <5x the CRDL.
Rndinlngieal CalihrationRo1 Efficiency calibration criteria were not met.R02 Energy calibration criteria were not met.R03 Resolution calibration criteria were not metR04 Background determination criteria were not met.R05 Quench curve criteria were not met.R06 Absorption curve criteria were not met.R07 Plateau curve criteria were not met.R08 Professional judgment was used to quality the data.
Randiolngirsl Calibration VWrifirationS01 Efficiency verification criteria were not met.S02 Energy verification criteria were not met.S03 Resolution verification criteria were not metS04 Background verification criteria were not met.S05 Cross-talk verification criteria were not met.S06 Professional judgment was used to qualify the data.

Radionuclide Qymntitftian
TO1 Detection limits were not met.T02 Analytical uncertainties were not met and/or not reported.T03 Inappropriate aliquot sizes were used.T04 Professional judgment was used to qualify the data.T05 Analytical result is less than the associated MDA, but greater than the counting
uncertainty.T06 Analytical result is less than both the associated counting uncertainty and MDA.T07 Negative analytical result where the absolute value exceeds 2x the associated MDA.
System Ptrformane
VOl High background levels or a shift in the energy calibration were observed.V02 Extraneous peaks were observed.V03 Loss of resolution was observed.V04 Peak-tailing or peak splitting that may result in inaccurate quantitation were observed.V05 Professional judgment was used to qualify the data.

DATA VALIDATION REPORT Date:
|__ November 17,2003
To: From:
Steve Passig Carol Johnson
Laboworly: SDG#.
Severn Trent- St. Louis F3J140125
Attached you will find the results from the data validation technical review for the Westinghouse/Hematitesamples and analyses that are associated with the above referenced laboratory and sample delivery group(SDG) number. These data points have been selected for data validation and the sample index on thefollowing page specifically identifies the samples and analyses associated with this validation review.
The Westinghouse/Hematite validation technical review was performed in accordance with the ContractLaboratory Program Data Validation Functional Guidelinesfor Evaluating Inorganic Analytical Data andthe Laboratory Data Validation Guidelinesfor Evaluating Radionuclide Analyses and Radiochemical DataVerifIcation and Validation. It was based on the information and documentation supplied by the associatedlaboratory. The analyses were evaluated against criteria established in the related analytical procedures andthe Westinghouse/Hematite data quality requirements.
Attachment A to this report provides the Sample Data Summary Sheets for the samples associated with theabove referenced request These summary sheets identify the analytical values and the qualifiers for eachsample and parameter. Attachment B outlines the validation qualifiers and reason codes used in the validationof the data.
Report Summary
Total Number of Samples 11
Total Number of Data Points 24
Total Number of Rejected Data Points 0
Percent Completeness 100.0%1/(approval to rejection ratio)

Dae:Sample IndexNovember 17,2003
Laborxoy: D #:
Severn Trent - St Louis F3JI40125
WESTINGHOUSE Target AnalysesSample ID
BHKD4-14 Total Uranium, Technetium-99, pH
BHKD6-01 Total Uranium, Technetium-99, pH
BHKDI-04 Total Uranium, pH
BHKDI-23 Total Uranium, pH
BHKDI-28 Total Uranium, pH
BHKD3-16 Total Uranium, pH
BHKD3-23 Total Uranium, pH
BHKD4-02 Total Uranium, pH
BHKD4-24 Total Uranium, pH
BHKD6-11 Total Uranium, pH
BHKD6-26 Total Uranium, pH

ANAlYTICAl. CATEGORY! Mkceellnenou's
.1.
pH was determined by SW846 Method 9045A.The following items (as applicable) have been addressed during the validation review:
sample custody, integrity & preservationsample handling & preparationholding timesinstrument calibration & performancedilution factorsdetection limitslaboratory background & carry-overoverall appearance of the data
* Quality Control:0 calibration checks & blanks
° laboratory blanks (method, TCLP)° laboratory control samples
I matrix spike samplesI matrix duplicates
° field blanks (if available)° field duplicates (if available)
2. The above items were found to be acceptable, except as follows:
* none
3. Additional comments:
none

ANAITTICAJ. (ATFGORYV Radinchemnic2l
* Total Uranium was determined by Laser Phosphorimetry Method ASTM 5174-91, Technetium wasdetermined by Liquid scintillation counters (DOE TC-02-RC).
1. The following items (as applicable) have been addressed during the validation review:
sample custody, integrity & preservationsample handling & preparationholding timesinstrument calibration & performancedilution factorsdetection limitslaboratory background & carry-overoverall appearance of the data
* Quality Control:0 calibration checks & background
a preparation blanks° laboratory control samples
° field blanks (if available)° field duplicates (if available)
2. The above items were found to be acceptable, except as follows:None
3. Additional comments:None

ATTACHMENT A
WESTINGHOUSE Sample Data Summary Sheets

ATTACHMENT B
KEY TO THE WESTINGHOUSE DATA VALIDATION QUALIFIERS
QUALIFIERS
= Indicates that the data met all QA/QC requirements, and that the parameter has been positivelyidentified and the associated concentration value is accurate.
U Indicates that the data met all QA/QC requirements, and that the parameter was analyzed for butwas not detected above the reported sample quantitation limit.
J Indicates that the parameter was positively identified; the associated numerical value is theapproximate concentration of the parameter in the sample.
UJ Indicates that the parameter was not detected above the reported sample quantitation limit.However, the reported quantitation limit is approximate and may or may not represent the actuallimit ofquantitation necessary to accurately and precisely measure the analyte in the sample.
N The analysis indicates the presence of a parameter for which there is presumptive evidence to makea "tentative identification."
R Indicates that the sample results for the parameter are rejected or unusable due to seriousdeficiencies in the ability to analyze the sample and meet quality control criteria. The presence orabsence of the parameter cannot be verified.

Data Validation Reason Codes
Holding TiMeSAOl Extraction holding times were exceeded.A02 Extraction holding times were grossly exceeded.A03 Analysis holding times were exceeded.A04 Analysis holding times were grossly exceeded.A05 Samples were not preserved properly.A06 Professional judgment was used to qualify the data.
G(-'IMI TuninBOI Mass calibration was in error, even after applying expanded criteria.B02 Mass calibration was not performed every 12 hours.B03 Mass calibration did not meet ion abundance.B04 Professional judgment was used to qualify the data.
Tnitial/Continniina Calibration - OrganicsCOl Initial calibration RRF was <0.05.C02 Initial calibration RSD was >30%.C03 Initial calibration sequence was not followed as required.C04 Continuing calibration RRF was <0.05;C05 Continuing calibration %D was >25%.C06 Continuing calibration was not performed at the required frequency.C07 Resolution criteria were not met.C08 RPD criteria were not met.C09 RSD criteria were not met.CIO Retention time of compounds was outside windows.ClI Compounds were not adequately resolved.C12 Breakdown of endrin or DDT was >20%.C13 Combined breakdown of endrin/DDT was >30%.C14 Professional judgment was used to qualify the data.
RfnksFOl Sample data were qualified as a result of the method blank.F02 Sample data were qualified as a result of the field blank.F03 Sample data were qualified as a result of the equipment rinsate.F04 Sample data were qualified as a result of the trip blank.FOS Gross contamination exists.F06 Concentration of the contaminant was detected at a level below the CRQL..F07 Concentration of the contaminant was detected at a level less than the action limit, but
greater than the CRQL.F08 Concentration of the contaminant was detected at a level that exceeds the action level.F09 No laboratory blanks were analyzed.FlO Blank had a negative value >2x's the IDL.F1 I Blanks were not analyzed at required frequency.F12 Professional judgment was used to qualify the data.

Snrrngsate/Radinlnglcl Chemical RecaveryGO1 Surrogate/radiological chemical recovery was above the upper control limit.G02 Surrogate/radiological chemical recovery was below the lower control limit.G03 Surrogate recovery was <10%.G04 Surrogate/radiological chemical recovery was zero.G05 Surrogate/radiological chemical recovery was not present.G06 Professional judgment was used to qualify the data.G07 Radiological chemical recovery was <20%.G08 Radiological chemical recovery was >150%.
Matrix Spike/lMtrix Spike DluplicateHO1 MS/MSD recovery was above the upper control limit.H02 MS/MSD recovery was below the lower control limit.H03 MS/MSD recovery was <10%.H04 MS/MSD pairs exceed the RPD limit.H05 No action was taken on MS/MSD results.H06 Professional judgment was used to qualify the data.H07 Radiological MS/MSD recovery was <20%.H08 Radiological MS/MSD recovery was >160%.H09 Radiological MS/MSD samples were not analyzed at the required frequency.
nahomratny DnplieateJOI Duplicate RPD/normalized absolute difference (NAD) was outside the control limit.J02 Duplicate sample results were >5x the CRDL.J03 Duplicate sample results were <5x the CRDL.J04 Professional judgment was used to qualify the data.J05 Duplicate was not analyzed at the required frequency.

Target Compound IdentiflentinnMOI Incorrect identifications were made.M02 Qualitative criteria were not met.M03 Cross contamination occurred.M04 Confirmatory analysis was not performed.M05 No results were provided.M06 Analysis occurred outside 12 hr GC/MS window.M07 Professional judgment was used to qualify the data.M08 The %D between the two pesticide/PCB column checks was >25%.
TLnhbratnry Contrnl Samples (1,CSs)P01 LCS recovery was above upper control limit.P02 LCS recovery was below lower control limit.P03 LCS recovery was <50%.P04 No action was taken on the LCS data.P05 LCS was not analyzed at required frequency.P06 Radiological LCS recovery was c50% for aqueous samples; c40% for solid samples.P07 Radiological LCS recovery was >150% for aqueous samples; >160% for solid samples.P08 Professional judgment was used to qualify the data.
EiekLDnplieQOI No action was taken on the basis of field duplicate RPDs.Q02 Radiological field duplicate normalized absolute difference (NAD) was outside the control
limit.Q03 Duplicate sample results were >5x the CRDL.Q04 Duplicate sample results were <Sx the CRDL.
Rafiolongieal r'nlibrationROI Efficiency calibration criteria were not metR02 Energy calibration criteria were not met.R03 Resolution calibration criteria were not metR04 Background determination criteria were not met.R05 Quench curve criteria were not met.R06 Absorption curve criteria were not met.R07 Plateau curve criteria were not met.R08 Professional judgment was used to qualify the data.
Radinlogical Calibratinn VerifiratinnSol Efficiency verification criteria were not met.S02 Energy verification criteria were not met.S03 Resolution verification criteria were not metS04 Background verification criteria were not met.S05 Cross-talk verification criteria were not met.S06 Professional judgment was used to qualify the data.

Radinuclidle (riantitauimTOI Detection limits were not met.T02 Analytical uncertainties were not met and/or not reported.T03 Inappropriate aliquot sizes were used.T04 Professional judgment was used to qualify the data.TOS Analytical result is less than the associated MDA, but greater than the counting
uncertainty.T06 Analytical result is less than both the associated counting uncertainty and MDA.T07 Negative analytical result where the absolute value exceeds 2x the associated MDA.
System PerfhrmnnrtVOl High background levels or a shift in the energy calibration were observed.V02 Extraneous peaks were observed.V03 Loss of resolution was observed.V04 Peak-tailing or peak splitting that may result in inaccurate quantitation were observed.V05 Professional judgment was used to qualify the data.

U
DATA VALIDATION REPORT I Date1
November 17, 2003
To: From:
Steve Passig Carol Johnson
Laboratoy: SDG #:
Severn Trent - St. Louis F3J140132
Attached you will find the results from the data validation technical review for the Westinghouse/Hematitesamples and analyses that are associated with the above referenced laboratory and sample delivery group(SDG) number. These data points have been selected for data validation and the sample index on thefollowing page specifically identifies the samples and analyses associated with this validation review.
The Westinghouse/Hematite validation technical review was performed in accordance with the ContractLaboratory Program Data Validation Functional Guidelines for Evaluating Inorganic Analytical Data, and
the Laboratory Data Validation Guidelinesfor Evaluating Radionuclide Analyses and Radiochemical Data
Verification and Validation. It was based on the information and documentation supplied by the associatedlaboratory. The analyses were evaluated against criteria established in the related analytical procedures andthe Westinghouse/Hematite data quality requirements.
Attachment A to this report provides the Sample Data Summary Sheets for the samples associated with theabove referenced request. These summary sheets identify the analytical values and the qualifiers for eachsample and parameter. Attachment B outlines the validation qualifiers and reason codes used in the validationof the data.
Report Summary _'''_-_._'_-_'
Total Number of Samples 11
Total Number of Data Points 24
Total Number of Rejected Data Points 0
Percent Completeness 100.0%(approval to rejection ratio)

-
Sample Index Date:
November 17,2003
Lboratory: DG
Severn Trent - St. Louis S : F3J140132
WESTINGHOUSE Target AnalysesSample ID.
BHKD4-14 Total Uranium, Technetium-99, pH
BHKD6-01 Total Uranium, Technetium-99, pH
BHKDI-04 Total Uranium, pH
BHKDI-23 Total Uranium, pH
BHKDI-28 Total Uranium, pH
BHKD3-16 Total Uranium pH
BHKD3-23 Total Uranium, pH
BHKD4-02 Total Uranium. pH
BHKD4-24 Total Uranium, pH
BHKD6-1 1 Total Uranium, pH
BHKD6-26 Total Uranium, pH

ANALYVTICAL. CATEGORY! Ifirseplianen,,g
1.pH was determined by SW846 Method 9045A.The following items (as applicable) have been addressed during the validation review:
sample custody, integrity & preservationsample handling & preparationholding timesinstrument calibration & performancedilution factorsdetection limitslaboratory background & carry-overoverall appearance of the data
* Quality Control:0 calibration checks & blanks
° laboratory blanks (method, TCLP)° laboratory control samples
o matrix spike samples0 matrix duplicates
O field blanks (if available)0 field duplicates (if available)
2. The above items were found to be acceptable, except as follows:
none
3. Additional comments:
none

ANAT.YTTCAT. CATIFGORV Radinchemicesd
*Total Uranium was determined by Laser Phosphorimetry Method ASTM 5174-91 Technetium wasdetermined by Liquid scintillation counters (DOE TC-02-RC)
1. The following items (as applicable) have been addressed during the validation review:
sample custody, integrity & preservationsample handling & preparationholding timesinstrument calibration & performancedilution factorsdetection limitslaboratory background & carry-overoverall appearance of the data
* Quality Control:0 calibration checks & background
0 preparation blanks° laboratory control samples
O field blanks (if available)° field duplicates (if available)
2. The above items were found to be acceptable, except as follows:None
3. Additional comments:None

ATTACHMENT A
WESTINGHOUSE Sample Data Summary Sheets

ATTACHMENT B
KCEY TO THE WESTINGHOUSE DATA VALDATION QUALIFIERS
QUALIFIERS
_ Indicates that the data met all QA/QC requirements, and that the parameter has been positivelyidentified and the associated concentration value is accurate.
U Indicates that the data met all QA/QC requirements, and that the parameter was analyzed for butwas not detected above the reported sample quantitation limit.
J Indicates that the parameter was positively identified; the associated numerical value is theapproximate concentration of the parameter in the sample.
UJ Indicates that the parameter was not detected above the reported sample quantitation limit.However, the reported quantitation limit is approximate and may or may not represent the actuallimit of quantitation necessary to accurately and precisely measure the analyte in the sample.
N The analysis indicates the presence of a parameter for which there is presumptive evidence to makea "tentative identification."
R Indicates that the sample results for the parameter are rejected or unusable due to seriousdeficiencies in the ability to analyze the sample and meet quality control criteria. The presence orabsence of the parameter cannot be verified.

Data Validation Reason Codes
Hnoling 1mesAOl Extraction holding times were exceeded.A02 Extraction holding times were grossly exceeded.A03 Analysis holding times were exceeded.A04 Analysis holding times were grossly exceeded.A05 Samples were not preserved properly.A06 Professional judgment was used to qualify the data.
fcmMS THIning
B01 Mass calibration was in error, even after applying expanded criteria.B02 Mass calibration was not performed every 12 hours.B03 Mass calibration did not meet ion abundance.B04 Professional judgment was used to qualify the data.
Initiallronfinnincg Calihration - OrgniecCOI Initial calibration RRF was <0.05.C02 Initial calibration RSD was >30%.C03 Initial calibration sequence was not followed as required.C04 Continuing calibration RRF was <0.05.C05 Continuing calibration %D was >25%.C06 Continuing calibration was not performed at the required frequency.C07 Resolution criteria were not met.C08 RPD criteria were not met.C09 RSD criteria were not met.CIO Retention time of compounds was outside windows.ClH Compounds were not adequately resolved.C12 Breakdown of endrin or DDT was >20%.C13 Combined breakdown of endrin/DDT was >30%.C14 Professional judgment was used to qualify the data.
BlanksFOI Sample data were qualified as a result of the method blankF02 Sample data were qualified as a result of the field blankF03 Sample data were qualified as a result of the equipment rinsate.F04 Sample data were qualified as a result of the trip blank.F05 Gross contamination exists.F06 Concentration of the contaminant was detected at a level below the CRQL.F07 Concentration of the contaminant was detected at a level less than the action limit, but
greater than the CRQL.F08 Concentration of the contaminant was detected at a level that exceeds the action level.F09 No laboratory blanks were analyzed.FIO Blank had a negative value >2x's the IDL.Fl 1 Blanks were not analyzed at required fiequency.F12 Professional judgment was used to qualify the data.

SuirrngateIRsdinIngicaIe Chemial Reenvery
G01 Surrogate/radiological chemical recovery was above the upper control limitG02 Surrogate/radiological chemical recovery was below the lower control limit
G03 Surrogate recovery was <10%.G04 Surrogate/radiological chemical recovery was zero.G05 Surrogate/radiological chemical recovery was not presentG06 Professional judgment was used to qualify the data.G07 Radiological chemical recovery was <200/.G08 Radiological chemical recovery was >150%.
NMatriv Spike/Matrix Spike DuplicateHOI MS/MSD recovery was above the upper control limit.H02 MS/MSD recovery was below the lower control limitH03 MS/MSD recovery was <10%.H04 MS/MSD pairs exceed the RPD limit.H05 No action was taken on MSIMSD results.H06 Professional judgment was used to qualify the data.H07 Radiological MS/MSD recovery was <20%/c.H08 Radiological MS/MSD recovery was >160%/s.H09 Radiological MS/MSD samples were not analyzed at the required frequency.
L ahoratory DtuplicateJ01 Duplicate RPD/normalized absolute difference (NAD) was outside the control limit.
J02 Duplicate sample results were >5x the CRDL.J03 Duplicate sample results were <5x the CRDL.J04 Professional judgment was used to qualify the data.J05 Duplicate was not analyzed at the required frequency.

Target Canmiaind TdentifieatinnMOL Incorrect identifications were made.M02 Qualitative criteria were not met.M03 Cross contamination occurred.M04 Confirmatory analysis was not performed.M05 No results were provided.M06 Analysis occurred outside 12 hr GO/MS window.M07 Professional judgment was used to qualify the data.M08 The %D between the two pesticide/PCB column checks was >25%.
TJhnratory Contrnl Samples (TaCS)
P01P02P03P04P05P06P07P08
LCS recovery was above upper control limit.LCS recovery was below lower control limit.LCS recovery was <50%.No action was taken on the LCS data.LCS was not analyzed at required frequency.Radiological LCS recovery was <50% for aqueous samples; <40% for solid samples.Radiological LCS recovery was >150% for aqueous samples; >160% for solid samples.Professional judgment was used to qualify the data.
FietldnDuplicatQOl No action was taken on the basis of field duplicate RPDs.Q02 Radiological field duplicate normalized absolute difference (NAD) was outside the control
limit.Q03 Duplicate sample results were >5x the CRDL.Q04 Duplicate sample results were <5x the CRDL.
Raldiolngical CalibratinnROI Efficiency calibration criteria were not met.R02 Energy calibration criteria were not met.R03 Resolution calibration criteria were not metR04 Background determination criteria were not met.R05 Quench curve criteria were not met.R06 Absorption curve criteria were not met.R07 Plateau curve criteria were not met.R08 Professional judgment was used to qualify the data.
Radlinlocieail Calibratinn Verifiestinn
So1 Efficiency verification criteria were not met.S02 Energy verification criteria were not met.S03 Resolution verification criteria were not metS04 Background verification criteria were not met.S05 Cross-talk verification criteria were not met.S06 Professional judgment was used to qualify the data.

Radinvirlide (QiantitationTO1 Detection limits were not met.T02 Analytical uncertainties were not met and/or not reported.T03 Inappropriate aliquot sizes were used.T04 Professional judgment was used to qualify the data.T05 Analytical result is less than the associated MDA, but greater than the counting
uncertainty.T06 Analytical result is less than both the associated counting uncertainty and MDA.T07 Negative analytical result where the absolute value exceeds 2x the associated MDA.
System PerformaneeVOI High background levels or a shift in the energy calibration were observed.V02 Extraneous peaks were observed.V03 Loss of resolution was observed.V04 Peak-tailing or peak splitting that may result in inaccurate quantitation were observed.V05 Professional judgment was used to qualify the data.