Embed Size (px)
Citation preview
Swinburne University of Technology | CRICOS Provider 00111D | swinburne.edu.au
Swinburne Research Bank http://researchbank.swinburne.edu.au
Piratheepan, J., Gnanendran, C. T., & Arulrajah, A. (2012). Determination of c and
phi from IDT and unconfined compression testing and numerical analysis.
Originally published in Journal of Materials in Civil Engineering, 24(9), 1153–1164. Available from: http://dx.doi.org/10.1061/(ASCE)MT.1943-5533.0000493
Copyright © 2012 ASCE. This is the author’s version of the work, posted here with the permission of the publisher for your personal use. No further distribution is permitted. You may also be able to access the published version from your library. The definitive version is available at http://ascelibrary.org/.
Accep
ted M
anus
cript
Not Cop
yedit
ed
DETERMINATION OF c AND Φ FROM IDT AND
UNCONFINED COMPRESSION TESTING AND NUMERICAL
ANALYSIS
J. PIRATHEEPAN 1, C. T. GNANENDRAN 2 & A. ARULRAJAH 1
J. Piratheepan1
Lecturer,
Faculty of Engineering and Industrial Science (H38),
Swinburne University of Technology,
P.O Box 218, Hawthorn VIC 3122
Australia.
Email : [email protected]
Phone : +613-92145859
Fax : +613-92148264
C. T. Gnanendran2
Senior Lecturer,
School of Engineering and Information Technology
The University of New South Wales @ ADFA
Northcott Drive
PO Box 7916
CANBERRA BC ACT 2610
AUSTRALIA
Journal of Materials in Civil Engineering. Submitted May 13, 2011; accepted January 26, 2012; posted ahead of print January 28, 2012. doi:10.1061/(ASCE)MT.1943-5533.0000493
Copyright 2012 by the American Society of Civil Engineers
Accep
ted M
anus
cript
Not Cop
yedit
ed
Ph: +(61) 2 6268 8977
Fax: +(61) 2 6268 8337
Arul Arulrajah1
Associate Professor,
Faculty of Engineering and Industrial Science (H38),
Swinburne University of Technology,
P.O Box 218, Hawthorn VIC 3122
Australia.
Email : [email protected]
Phone : +613-92145741
Fax : +613-92148264
Corresponding Author:
Dr. Piratheepan Jegatheesan
Faculty of Engineering and Industrial Science (H38),
Swinburne University of Technology,
P.O Box 218, Hawthorn VIC 3122
Australia.
Email : [email protected]
Phone : +613-92145859
Fax : +613-92148264
Journal of Materials in Civil Engineering. Submitted May 13, 2011; accepted January 26, 2012; posted ahead of print January 28, 2012. doi:10.1061/(ASCE)MT.1943-5533.0000493
Copyright 2012 by the American Society of Civil Engineers
Accep
ted M
anus
cript
Not Cop
yedit
ed
Abstract
This paper presents an alternative criterion (simplified method) to determine the cohesion (c)
and internal angle of friction ( ) properties for two granular materials lightly stabilised with
slag-lime and general blend (GB) cement-flyash using indirect diametral tensile (IDT)
strength and unconfined compressive strength (UCS). The c and values of the stabilised
materials obtained based on this criterion were related to the IDT strength and UCS. The
results suggest that the c and can be estimated using this criterion and the c can be
accurately related to either the IDT strength or UCS for lightly cementitiously stabilised
granular materials. However, the IDT strength is a better characteristic than the UCS to
estimate the c. In order to validate the criterion, the c and obtained from the proposed
criterion were input in the numerical analyses of IDT testing with Mohr – Coulomb failure
criterion using FLAC2D finite difference software. The predicted tensile stress – horizontal
diametrical deformation numerical results were compared with the corresponding
experimental results. Based on this numerical analysis, it was found that the c and
parameters estimated from this method predicted the experimental results well in the elastic
region but over predicted the ultimate stress.
Key words: IDT test, stabilised materials, GB cement-flyash, unconfined compression test,
Cohesion, internal angle of friction.
Journal of Materials in Civil Engineering. Submitted May 13, 2011; accepted January 26, 2012; posted ahead of print January 28, 2012. doi:10.1061/(ASCE)MT.1943-5533.0000493
Copyright 2012 by the American Society of Civil Engineers
Accep
ted M
anus
cript
Not Cop
yedit
ed
Introduction
Shear strength of geological materials such as soils and rocks is often determined by Mohr-
Coulomb failure theory. In which, the shear strength is assumed to vary linearly with the
applied normal stress through two shear strength parameters commonly known as the
cohesion (c) and the angle of internal friction (Φ). Normally these properties are determined
through laboratory triaxial tests. Although the Mohr-Coulomb theory is widely used to
determine the shear strength properties of soils, it is applicable to lightly cementitiously
stabilised soils or aggregate bases and many researchers have carried out studies on cement
treated soils and aggregates using triaxial tests (e.g. Ismail et al. 2002; Lo et al. 2003).
However, the triaxial test needs very expensive equipment and consumes too much time for
sample preparation and testing, which is not suitable for routine laboratory or field
experiment practice. Therefore, an alternative approach was proposed to determine c - Φ
properties for asphalt concrete base material using Indirect Diametrical tensile (IDT) testing
and Unconfined Compression (UC) testing by Christensen and Bonaquist (2002).
UC testing is one of the most common and simple tests that can be carried out with minimum
laboratory facilities to determine the unconfined compression strength (UCS) of cohesive
soils and stabilised materials (Basha et al. 2005; Kolias et al. 2005a; Lim and Zollinger 2003;
Peethamparan and Olek 2008; Peethamparan et al. 2008; Piratheepan et al. 2010). Carneiro
and Barcellos (1952), two Brazilian engineers, originally developed the IDT test, known as
Brazilian test, to measure tensile strength of brittle materials by applying a compressive load
along two opposite generators of a cylinder. This test was later adopted by asphalt industry as
a common test method to determine the tensile strength and resilient modulus of hot mix
asphalt (Kennedy and Hudson 1968; Schmidt 1972). In an IDT testing, the stress state at the
vicinity of the centre of the sample is the same as that at the bottom of the cementitiously
stabilised (or asphalt) base layer in a pavement structure as schematically shown in Figure 1.
Journal of Materials in Civil Engineering. Submitted May 13, 2011; accepted January 26, 2012; posted ahead of print January 28, 2012. doi:10.1061/(ASCE)MT.1943-5533.0000493
Copyright 2012 by the American Society of Civil Engineers
Accep
ted M
anus
cript
Not Cop
yedit
ed
Behaviour of cementitiously stabilised granular materials can be analysed using the Mohr-
Coulomb failure theory. According to this theory, the strength of a material such as the
stabilised material depends upon both cohesion (c) and internal angle of friction ( ). For a
simple shear loading with an applied normal stress σ, the shear stress at failure τmax
is given
by the following equation:
max tanc (1)
Where
c = cohesion
= angle of internal friction, degrees
σ = normal stress
The Mohr-Coulomb theory is often represented graphically by plotting a series of Mohr
circles representing stress states at incipient failure under increasing levels of confining stress
and then drawing a tangent to these circles, which represents the Mohr-Coulomb failure
envelope. Then c and are determined using the failure envelope. This method can be used
to determine c and of cementitiously stabilised granular materials by IDT and UC testings.
Figure 2 shows the Mohr circles for the stress state in the samples at failure under IDT and
UC testings. The magnitude of compressive stress at failure is three times the tensile stress in
IDT testing (i.e. y-IDT = 3 x-IDT). Thus, the mean principal (or normal) stress, p, value is ( 1
+ 3)/2 = ( y-IDT + x-IDT)/2 = (3 x-IDT - x-IDT)/2 = x-IDT = IDT (remembering that the IDT
strength x-IDT is negative (tensile)). In other word, the p value if simply equal to the absolute
value of the IDT strength. Similarly, the maximum shear stress, q, value is ( 1 - 3)/2 = ( y-
IDT - x-IDT)/2 = (3 x-IDT + x-IDT)/2 = 2 x-IDT = 2 IDT, or, simply put, q is equal to twice the
IDT strength. c is the UCS of the sample having the diameter to height ratio of around 1:1
and the same density as that of the IDT sample. Thus, p = q = c/2.
Journal of Materials in Civil Engineering. Submitted May 13, 2011; accepted January 26, 2012; posted ahead of print January 28, 2012. doi:10.1061/(ASCE)MT.1943-5533.0000493
Copyright 2012 by the American Society of Civil Engineers

Accep
ted M
anus
cript
Not Cop
yedit
ed
From Figure 2;
cot sin2 2
c c c (2)
2 ( cot )sinIDT IDT c (3)
1
(2) cot 12 sin
cc
2
(3) cot 1sinIDTc
4
(2), (3) sin2
c IDT
c IDT
a
Thus,
1sin ( )a (4)
(2 )(3)
cosIDT a
c (5)
Or
(1 )2 cosc a
c (6)
The advantage of this approach is that it is much quicker and simpler compared with the
standard protocol and does not require a sophisticated triaxial testing facility or any other
special equipment. The IDT testing, being a measure of tensile strength is in fact a good
indicator of mixture cohesion.
Journal of Materials in Civil Engineering. Submitted May 13, 2011; accepted January 26, 2012; posted ahead of print January 28, 2012. doi:10.1061/(ASCE)MT.1943-5533.0000493
Copyright 2012 by the American Society of Civil Engineers
Accep
ted M
anus
cript
Not Cop
yedit
ed
Experimental Investigation Undertaken
The experimental investigation carried out involved the study of the IDT strength and UCS
characteristics of two different granular materials stabilised lightly with slag lime and flyash.
Granular base materials obtained from two sources stabilized with 3–5 % slag-lime and 1.5 %
GB cement-flyash binders under the optimum moisture content (OMC) from standard Proctor
compaction conditions were chosen for this investigation. One of the parent materials,
hereafter referred to as granular base material 1 (BM1), selected was a freshly quarried
granular base material obtained locally in Canberra, Australia. This was classified as a WG—
well graded sandy gravel with some fines according to the Unified Soil Classification
System. The other material selected for this research was also a granular material, classified
as WG - well graded granular base material, obtained from Queensland, Australia. This is
hereafter referred as granular base material 2 (BM2). Further details of the parent materials
and binders can be found in Gnanendran and Piratheepan (2008; 2009; 2010) and Piratheepan
et al (2010).
Obtaining representative samples of such granular materials is very difficult and it often leads
to inconsistency of particle proportions in samples, resulting in considerable variability of
properties determined from different samples. To minimize such inconsistency, the
reconstituted materials with unchanged (or consistent) gradings shown in Figure 3 were
adopted for this research. These were achieved by sieving a large batch of granular material
from each material through standard sieves, separating the materials into different particle
size ranges in different containers and then remixing them at suitable weight proportions to
get the specified unchanged grading. It is noted that the reconstituted materials excluded
particle sizes greater than 19 mm.
Journal of Materials in Civil Engineering. Submitted May 13, 2011; accepted January 26, 2012; posted ahead of print January 28, 2012. doi:10.1061/(ASCE)MT.1943-5533.0000493
Copyright 2012 by the American Society of Civil Engineers

Accep
ted M
anus
cript
Not Cop
yedit
ed
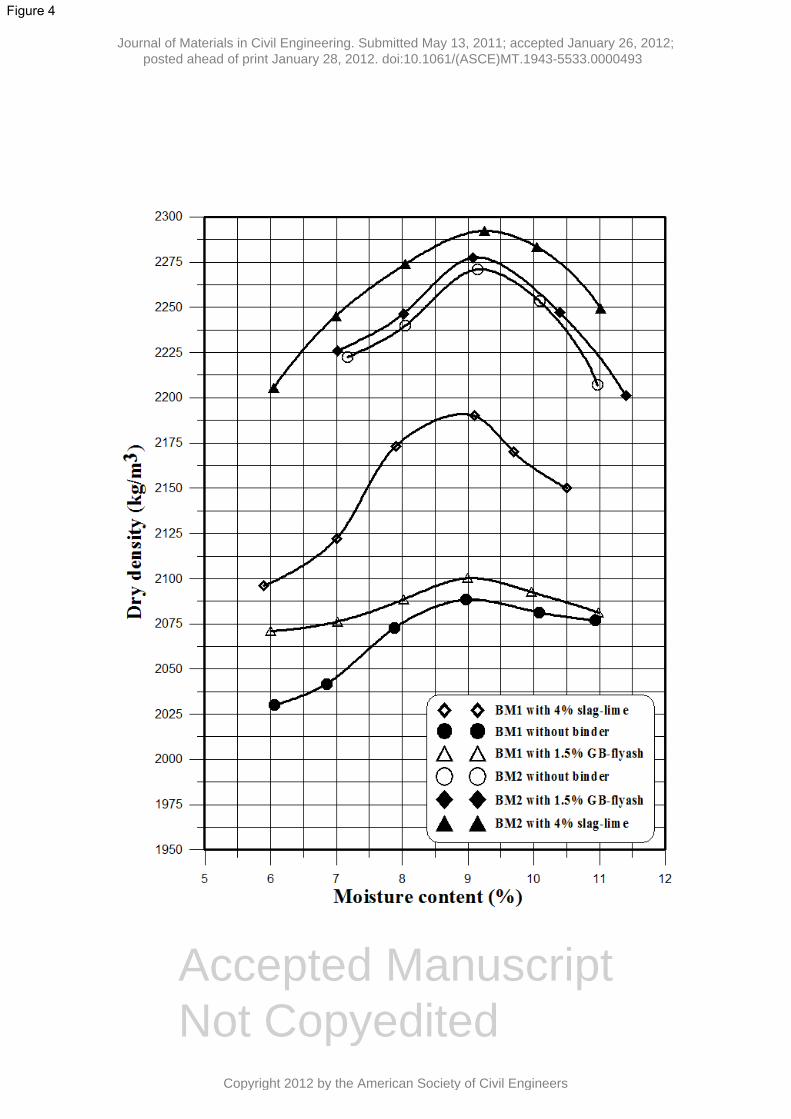
The moisture content (MC) - dry density relationships of the reconstituted materials as well
as the stabilized materials (i.e. the reconstituted materials stabilised with binders) were
determined initially in accordance to ASTM D698-91 (2007) for this investigation (see
Figure 4). The Atterberg limits determined on the material passing the No. 40 (opening size
of 0.425 mm) sieve in accordance to ASTM D4318 (2005) for BM1 were liquid limit = 18
and plastic limit = 15 and for BM2 were liquid limit = 25.2 and plastic limit = 20.6.
The IDT and UC tests were conducted on 7-days cured samples for GB cement–flyash
stabilised materials and 28-days cured samples for slag-lime stabilised materials. The IDT
test samples (150 mm diameter and approximately 85 – 90 mm thickness) were prepared by
gyratory compaction with 500-kPa vertical pressure and 250 gyrations and the UC test
samples were prepared and tested according to AS 1141.51. The loadings applied in both IDT
and UC tests were displacement control of 1 mm/min.
Verification of c – Parameters from numerical analysis
In order to assess the validity and applicability of the criterion to lightly cementitiously
stabilised granular base materials and to validate the material properties (c and ) obtained by
the proposed method, a series of numerical analyses were carried out using the finite
difference stress analysis software FLAC2D. The calculated c and were input in Mohr –
coulomb built – in – model in FLAC2D finite difference software and the monotonic load
numerical results were compared with the actual experimental results.
Modelling with FLAC 2D
The IDT testing is performed on a cylindrical specimen of the material loaded diametrically
between platens of a testing machine. The IDT strength is then approximately determined
using an analytical expression from corresponding peak load at failure assuming that the
Journal of Materials in Civil Engineering. Submitted May 13, 2011; accepted January 26, 2012; posted ahead of print January 28, 2012. doi:10.1061/(ASCE)MT.1943-5533.0000493
Copyright 2012 by the American Society of Civil Engineers

Accep
ted M
anus
cript
Not Cop
yedit
ed
material is homogeneous, linearly elastic and isotropic (Hondros 1959; Vuttukuri et al. 1974).
Details of the IDT test conditions performed in this investigation are shown in Figure 5. In
this verification investigation, the loading area is defined by 2α, which is the angular distance
over which the applied force, F, is assumed to be distributed radially.
The dimensions of the IDT specimens used in this investigation are 150 mm diameter (75
mm radius) and 85 - 90 mm thickness. The other material parameters for the analysis were
obtained for the experimental study carried out in this investigation.
The analytical solutions for the stress component normal to the loading diameter, σθ, and the
stress component along the loading diameter, σr, are given by the expressions (see Vuttukuri
et al. 1974):
2 2
0 012 4 2
0 0 0
1 sin 2 1
tan tan
1 2 cos 2 1
r rr rF
rt r r rr r r
(7)
2 2
0 012 4 2
0 0 0
1 sin 2 1
tan tan
1 2 cos 2 1r
r rr rF
rt r r rr r r
(8)
Where r0 is the radius of the specimen, t is the thickness and r is the distance from the centre
of the specimen. It is noted that the compressive stress was considered as negative in this
investigation.
The tensile strength of the material, σθc, at the centre of the specimen is
Journal of Materials in Civil Engineering. Submitted May 13, 2011; accepted January 26, 2012; posted ahead of print January 28, 2012. doi:10.1061/(ASCE)MT.1943-5533.0000493
Copyright 2012 by the American Society of Civil Engineers

Accep
ted M
anus
cript
Not Cop
yedit
ed
0 0
sin 21c F F
r t r t (9)
This approximation is used to determine the IDT strength of the material. It is assumed that
the failure is independent of stresses that develop normal to the disk face, and is a plane-
strain solution.
Details of geometry and boundary conditions
A 40 × 40 size grid was generated to represent the 2D numerical model for the IDT specimen.
In this investigation, only the top half of the cylindrical specimen was modelled, because of
the symmetry of the IDT testing. The boundary conditions were applied to the model such
that the model was fixed in y direction at x = 0 m. The generated grid and the boundary
conditions for the numerical model are shown in Figure 6 and Figure 7 respectively.
Results and Discussion
Experimental and Analytical Results
Results of the proposed method to determine c and from UCS and IDT strength values for
four different stabilised mixtures (two granular materials stabilised with slag-lime and GB
cement-flyash) stabilised with various binder contents are given in Table 1. The cohesion
values obtained from the proposed method was plotted against the IDT strength values in
Figure 8. It can be noted that the cohesion values were related to the IDT strength with a
good coefficient of correlation (R2 = 0.998). Thus a good relationship was observed between
the IDT strength and cohesion:
1.846 IDTc Strength (10)
Journal of Materials in Civil Engineering. Submitted May 13, 2011; accepted January 26, 2012; posted ahead of print January 28, 2012. doi:10.1061/(ASCE)MT.1943-5533.0000493
Copyright 2012 by the American Society of Civil Engineers

Accep
ted M
anus
cript
Not Cop
yedit
ed
Where c is cohesion of the stabilised material
From this observation, it can be concluded that the mixture cohesion can be accurately
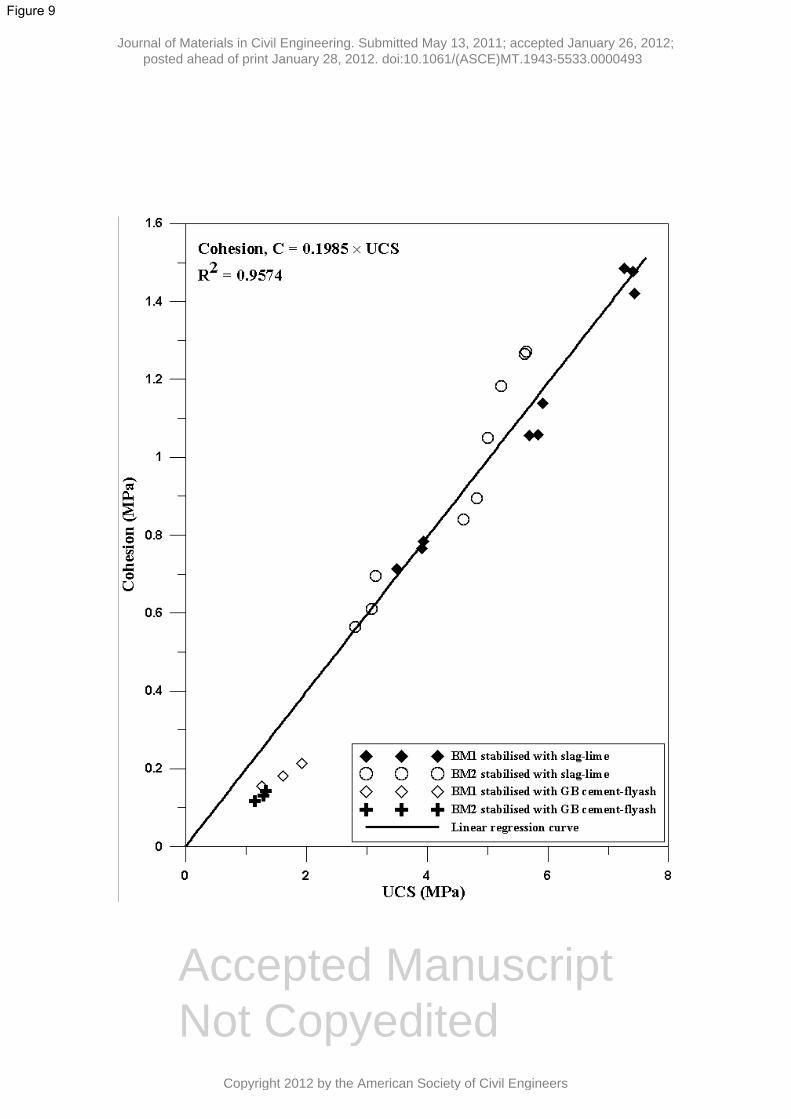
estimated from the IDT strength. Similarly, a good relationship was developed between the
mixture cohesion and UCS with a high coefficient of correlation (R2 = 0.9574) as shown in
Figure 9. From the observations made in this investigation, both the IDT and the UC tests can
therefore be used to estimate the cohesion of cementitiously stabilised granular base materials
regardless of the material and binder types. Moreover, the determination of c and by this
method (using IDT strength and UCS) is more accurate than confined compression tests (i.e.
conventional triaxial tests). Because the separation between the confined stress test data in –
space (V in Figure 10) is generally much smaller than is usually the case using UCS and
IDT strengths (U in Figure 10). Also, the IDT strength data is very close to the vertical axis
and the cohesion is defined by the intercept of the failure envelope on the vertical axis.
Therefore, small variations in the UCS and IDT strength values make very little variations in
the c and estimates. Thus, the proposed method for the determination of the fundamental
properties of cementitiously stabilised granular materials provides both a better estimate of
the friction angle (the slope of the failure envelope) and the cohesion (intercept).
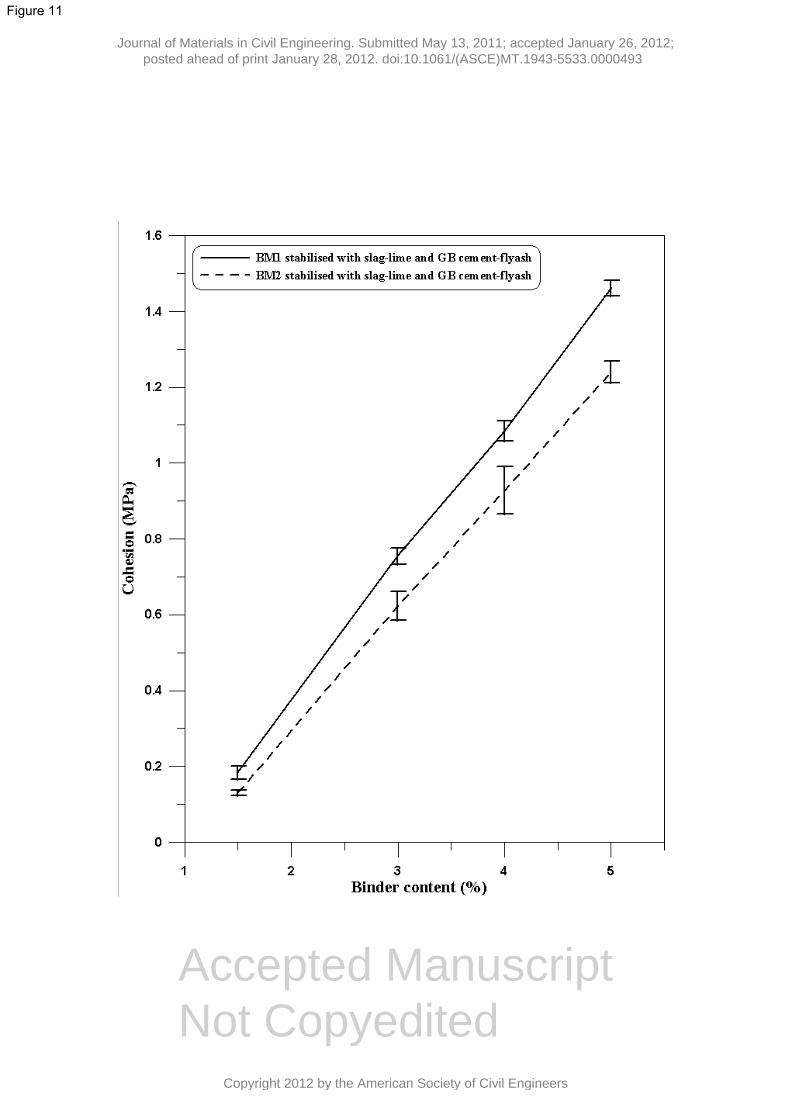
Figure 11 illustrates the variation of cohesion with BC for various stabilised mixtures. The
cohesion shows almost a linear variation with the BC for the two granular materials stabilised
with slag-lime and GB cement-flyash and the cohesion of stabilised BM1 was always higher
than that of the stabilised BM2. It was found from the figure that the cohesion increased by
an average of 36% for stabilised BM1 and 32% for stabilised BM2 with respect to the
cohesion value of the corresponding material stabilised with 4% slag-lime, when the BC was
increased by 1%. This trend indicates that the use of slag–lime and GB cement-flyash in
granular materials dramatically enhances the cohesion of the granular materials investigated
Journal of Materials in Civil Engineering. Submitted May 13, 2011; accepted January 26, 2012; posted ahead of print January 28, 2012. doi:10.1061/(ASCE)MT.1943-5533.0000493
Copyright 2012 by the American Society of Civil Engineers
Accep
ted M
anus
cript
Not Cop
yedit
ed
in this study (i.e. 36 and 32% are substantial increment). It is also noted that the variations of
cohesion with BC were different for different granular materials and not different for
different binders.
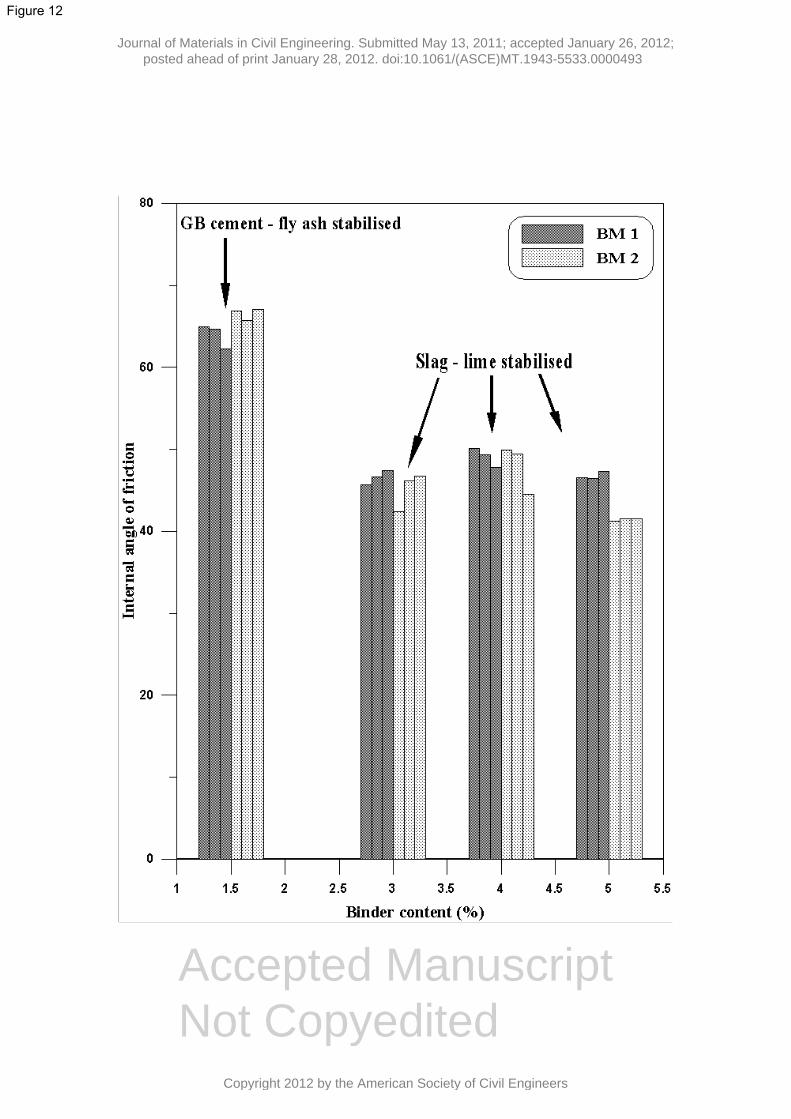
The variation of with binder content shows (see Figure 12) not a clear pattern and it varies
between 40 – 50° for the materials stabilised with slag-lime and between 64°-66° for the
materials stabilised with GB cement – flyash. It can be noted that the values are always
higher for BM1 than that for BM2 and the similar trend was observed for the variation of c
with BC.
However, the values of c and can be dependent on other factors such as the densities of the
IDT and UC test specimens, height to diameter ratio of the UC test specimens and the testing
conditions including the rate of loading. To study the effect of the above mentioned factors,
the UCS and IDT strength results of several studies reported by other researchers were used
to develop the relationships. The relationship is very strong; assuming that the intercept is
zero, the mixture cohesion can be accurately estimated as 1.75-1.83 times the IDT strength
with a R2
value of 96 percent and above (see Figure 13).
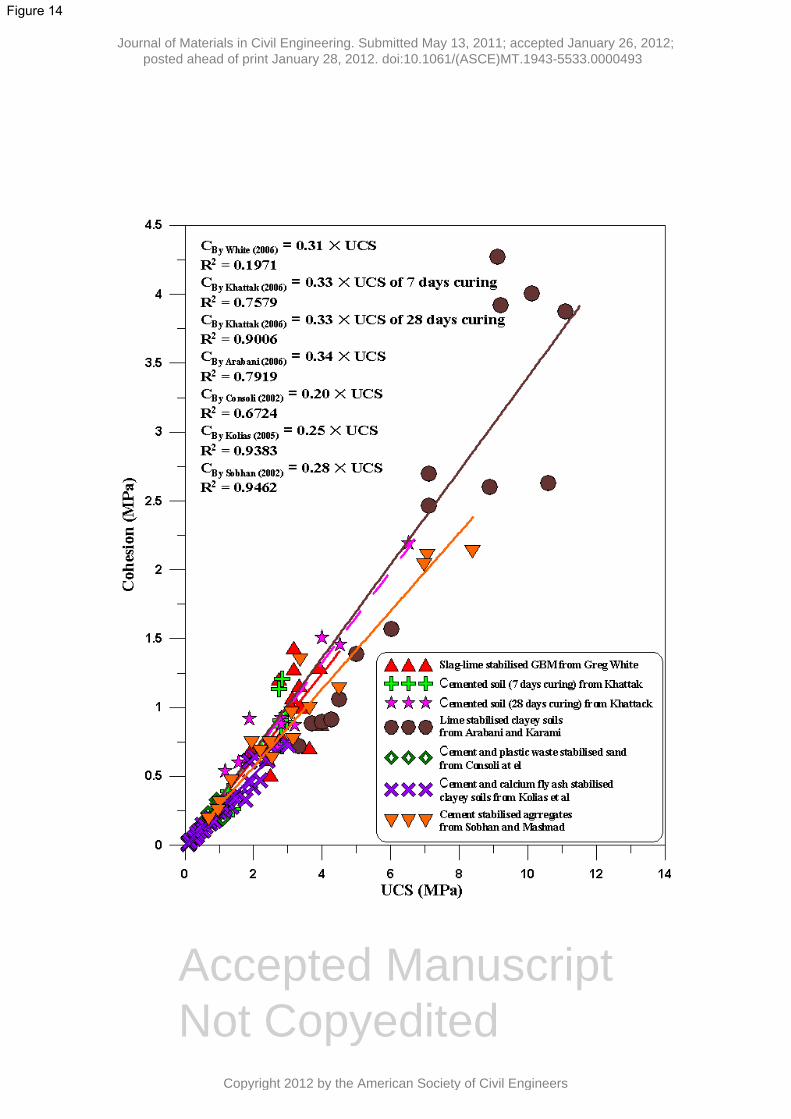
White, G. (2006) conducted an experimental program to characterize granular base materials
stabilised cementitiously with slag-lime in terms of IDT strength and UCS (diameter to
height ration of 1:2). UCS and IDT tests were carried out on stabilised base material
specimens (28 days curing) prepared with gyratory compaction method with a vertical
deformation rate of 1 mm/min. The IDT strength and UCS results were utilised in this study
to evaluate the c and using the simplified method proposed. The c values were calculated
and plotted against the corresponding IDT strength and UCS values in Figure 13 and Figure
14 respectively. The developed relationship between c and IDT strength (cWhite = 1.80 IDT
Journal of Materials in Civil Engineering. Submitted May 13, 2011; accepted January 26, 2012; posted ahead of print January 28, 2012. doi:10.1061/(ASCE)MT.1943-5533.0000493
Copyright 2012 by the American Society of Civil Engineers

Accep
ted M
anus
cript
Not Cop
yedit
ed
strength) is very strong with a R2
value of 0.9823, while the relationship between c and UCS
(cWhite = 0.31 UCS) is very poor with a R2
value of 0.1971.
Khattak and Alrashidi (2006) carried out a laboratory investigation on four different fiber
reinforced soils stabilised with 10% Type-1 Portland cement. The UCS tests were carried out
according to ASTM D 1633 (1994), in which a 101.6 mm diameter by 116 mm high
(diameter to height ration of 1:1.14) specimen was loaded at an axial strain rate of 1 mm/min
using the material testing system (MTS). The IDT tests were performed in accordance to the
modified AASHTO T 245 method, in which a stabilised specimen of 101.6 mm diameter by
63.5 mm height (diameter to height ratio of 1:0.625) was loaded to failure at 51 mm/min
deformation rate. The UCS and IDT samples were tested at 7 and 28 days curing period. The
calculated cohesion values using the simplified method were plotted against the
corresponding IDT strength and UCS values in Figure 13 and Figure 14 respectively. The
developed relationships between c and IDT strength for 7 and 28 days cured samples (cKhattak,7
= 1.79 IDT strength and cKhattak,28 = 1.77 IDT strength ) are very strong with R2
values of
0.9933 and 0.9942 respectively, while the relationships between c and UCS are: cKhattak, 7 =
0.33 UCS and cKhattak, 28 = 0.33 UCS with R2
values of 0.7579 and 0.9006 respectively.
UCS and IDT tests were carried out on three fine-grained clayey soils stabilised with high
calcium fly ash and cement by Kolias et al. (2005b). In this study, the IDT and UCS samples
were prepared with static compaction method (BS 1924, test 10) at the optimum moisture
content and cured for 7, 28 and 90 days. Samples of 50 mm diameter by 100 mm height
(diameter to height ratio of 1:2) were tested with a constant deformation rate of 1 mm/s in
both IDT and split tensile testings at different curing ages. The test results were utilised in
this study and the calculated c values were plotted against IDT strength and UCS in Figure 13
and Figure 14 respectively. The developed relationship between c and IDT strength (cKolias =
Journal of Materials in Civil Engineering. Submitted May 13, 2011; accepted January 26, 2012; posted ahead of print January 28, 2012. doi:10.1061/(ASCE)MT.1943-5533.0000493
Copyright 2012 by the American Society of Civil Engineers

Accep
ted M
anus
cript
Not Cop
yedit
ed
1.76 IDT strength) is very strong with a R2
values of 0.999, while the relationship between
c and UCS (cKolias = 0.25 UCS) is also very strong with a R2
values of 0.9383.
Consoli et al. (2002) reported a laboratory investigation of evaluating UCS and split tensile
strength characteristics on polyethylene terephthalate fiber reinforced sand stabilised with
rapid hardening Portland cement varying from 0 to 7 % by weight. The UCS and split tensile
tests were conducted according to ASTM D 1633 (1990a) and ASTM C 496 (1990b). In both
tests, cemented specimens cured for 3 days of 50 mm diameter by 100 mm height (diameter
to height ratio of 1:2) were tested at a strain rate of 1.14%/min. the calculated c values from
the results of this study was plotted against IDT strength and UCS in Figure 13 and Figure 14
respectively. The developed relationship between c and IDT strength (cConsoli = 1.83 IDT
strength) is very strong with a R2
values of 0.9687, while the relationship between c and UCS
(cConsolis = 0.20 UCS) is with a R2
values of 0.6724.
Arabani and Veis Karami (2006) conducted UCS and IDT testings on 5 different clayey
sands stabilised with 3, 6 and 9% lime. The cylindrical stabilized specimens for both UCS
and IDT testings were of 50 mm diameter and 100 mm height (diameter to height ratio of
1:2). The UCS tests were conducted according to Iranian Code for Highway Design based on
AASHTO T 220 with a constant strain rate of 0.5 mm/min and the IDT tests were conducted
according to Iranian Code for Highway Design. The curing time of both tensile and
compressive samples was similar (i.e. 3 days). The developed relationship between c and IDT
strength (cArabani = 1.81 IDT strength) in this study is very strong with a R2
values of 0.994,
while the relationship between c and UCS (cArabani = 0.34 UCS) is with a R2
values of
0.7919.
Journal of Materials in Civil Engineering. Submitted May 13, 2011; accepted January 26, 2012; posted ahead of print January 28, 2012. doi:10.1061/(ASCE)MT.1943-5533.0000493
Copyright 2012 by the American Society of Civil Engineers

Accep
ted M
anus
cript
Not Cop
yedit
ed
Sobhan and Mashnad (2002) carried out an experimental investigation including UC and split
tensile testings on a granular soil chemically stabilised with cement and fly ash, and
mechanically reinforced with recycled plastic strips (high-density polyethylene (HDPE)). The
specimens were prepared with maximum of 12% cement and 10% fly ash by dry weight of
the mix and contained an additional 0.25 - 0.80 % fibre of recycled plastic waste. The split
tensile (ASTM C 496) and UC testings were performed on 101.6 mm diameter by 190.5 mm
height (diameter to height ratio of 1:1.875) specimens cured at 28 days. The developed
relationship between c and IDT strength (cSobhan = 1.75 IDT strength) in this study is very
strong with a R2
values of 0.9992, while the relationship between c and UCS (cSobhan = 0.28
UCS) is also very strong with a R2
values of 0.9462.
The cohesion values plotted in Figure 13 against the corresponding IDT strength values for
the selected studies performed previously by several authors show that the relationships
derived between cohesion and IDT strength were very strong with high coefficient of
regressions and the cohesion varied from 1.75 to 1.83 times the IDT strength. Therefore,
these relationships are very close or almost the same. On the other hand, the relationships
derived between cohesion and UCS from all previous studies were scattered and the cohesion
varied from 0.2 to 0.34 times the UCS. The variations of the relationships between cohesion
and UCS could be due to the factors such as the density and the height to diameter ratio of the
UC test samples. However, the relationships derived between cohesion and IDT strength
were very close even though the densities and the height to diameter ratios of both IDT and
UC test specimens were different. Because, as discussed earlier, the IDT strength data is very
close to the vertical axis and the cohesion is defined by the intercept of the failure envelop on
the vertical axis. Therefore, the variations in the UCS and IDT strength values make very
little variation in the cohesion estimate. Therefore, it can be concluded that the IDT strength
Journal of Materials in Civil Engineering. Submitted May 13, 2011; accepted January 26, 2012; posted ahead of print January 28, 2012. doi:10.1061/(ASCE)MT.1943-5533.0000493
Copyright 2012 by the American Society of Civil Engineers

Accep
ted M
anus
cript
Not Cop
yedit
ed
is a better characteristic than the UCS to determine the cohesion of a lightly cementitiously
stabilised granular material.
Numerical Analysis
The input parameters for the built – in Mohr – Coulomb model in FLAC are stiffness
modulus, Poisson’s ratio, cohesion, internal angle of friction and density. Figure 15 shows
typical stress strain curves from the experimental study for BM1 stabilised with 4% slag-lime
binder at OMC and the corresponding numerical analysis curve with the c and (c = 1.0105
MPa and = 50°) estimated from the simplified analysis. The stress – deformation plot from
numerical analysis with the input parameters c and calculated from Mohr – coulomb failure
criterion predicted the experimental results in the elastic region but over predicted the
ultimate stress. The ultimate IDT strength determined from the experiment study was 0.555
MPa, whereas the strength value obtained from the numerical analysis was 0.713 MPa, which
is 28.5 % higher than the experimental value. However, the maximum diametral horizontal
tensile deformations at the ultimate stress were the same for both the experimental and
numerical stress-deformation curves. The difference in ultimate strengths could be due to
either the estimated c and values were not accurate or the assumed loading area was
inappropriate.
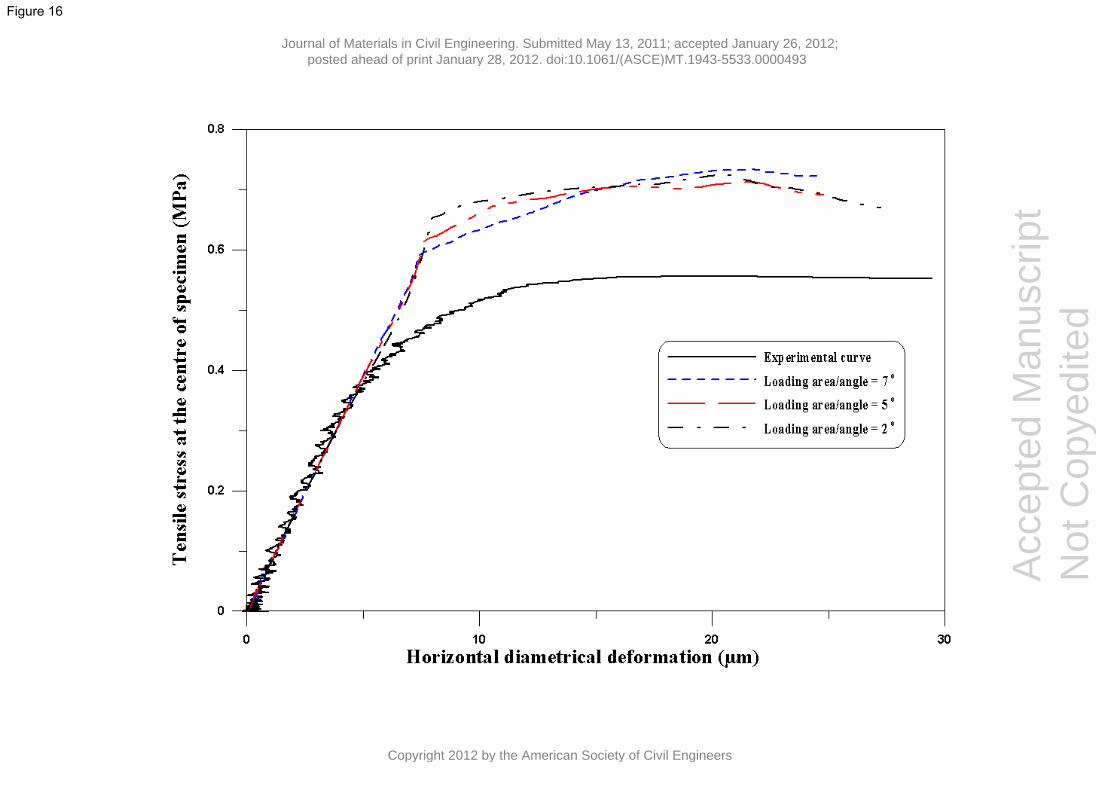
The loading area was defined by 2α as discussed earlier (see Figure 5). To determine the
loading area over which the vertical load was applied, three cases of loading area were
considered: 2°; 5° and 7°. Figure 16 shows the variations of tensile stress at the centre of the
specimen with the horizontal diametral deformation for the three different loading areas
considered. It can be noted that the variation of stress with the deformation and the ultimate
strength for the 3 different loading angles were almost the same (see Figure 16 and Table 2).
However, the applied stresses or the loads were different for different loading angles. Table 2
Journal of Materials in Civil Engineering. Submitted May 13, 2011; accepted January 26, 2012; posted ahead of print January 28, 2012. doi:10.1061/(ASCE)MT.1943-5533.0000493
Copyright 2012 by the American Society of Civil Engineers

Accep
ted M
anus
cript
Not Cop
yedit
ed
presents the details of the numerical analysis performed on different loading angles. The
failure load applied to the specimen during the actual experiment was 11.718 kN and the
failure load for the 5° loading angle from the numerical analysis was the closest to the
experimental value (the percentage difference was 16.5%). The percentage differences for the
other failure loads for 2° and 7° were 115% and 19.6% respectively. Therefore, it is
concluded that the best loading angle is 5° and this value was then used for the remaining
analysis.
Even though the loading angle of 5° predicts the failure load closest to the actual
experimental value, the IDT strength (ultimate stress) predicted from numerical analysis was
always higher than the experimental value (0.555 MPa). This could be because the c and
values determined from the simplified method are slightly varied from the actual values of
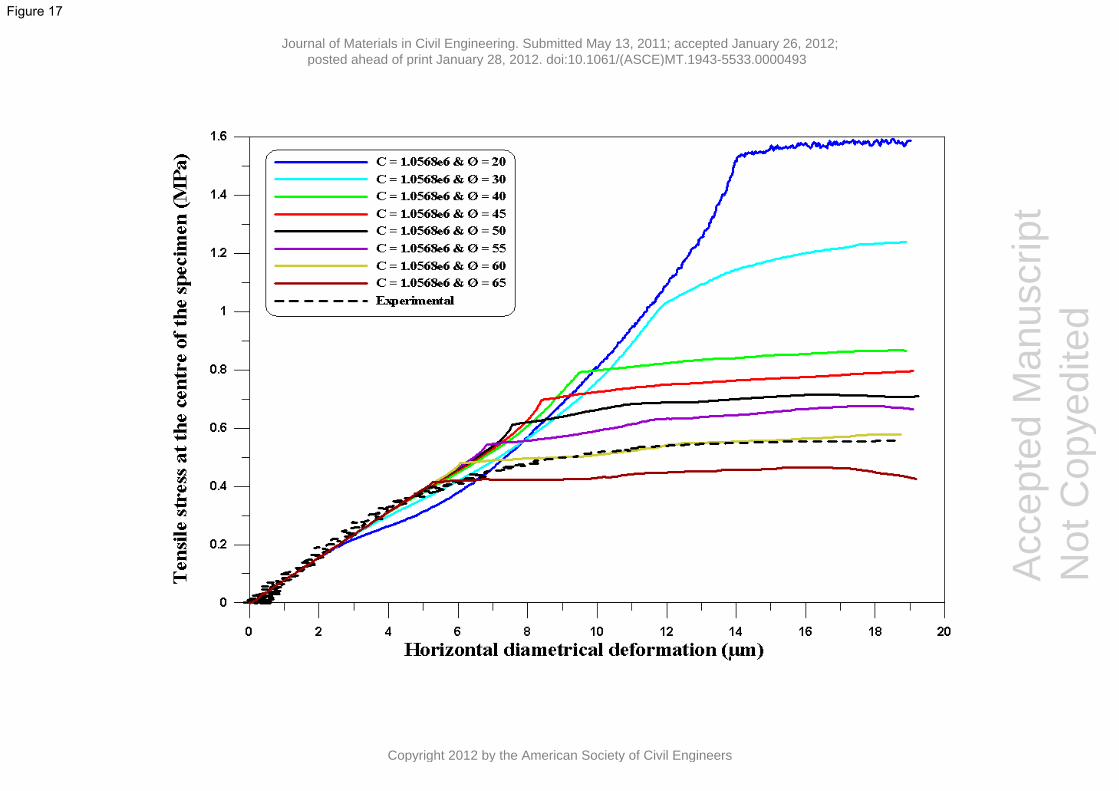
the stabilised material. Initially, a number of runs were performed for specimen of BM1
stabilised with 4% slag – lime to see the effects of on the model by changing the internal
angle of friction from 20 to 65 while keeping all other parameters constant. Figure 17 shows
the variation of horizontal tensile stress at the centre of the specimen versus horizontal
diametrical deformation from the numerical analysis for various values. It can be clearly
noted that the ultimate IDT strength is dependent on and does not affect the slope of the
linear part of the curve (i.e. stiffness modulus does not depend on ). As can be seen in
Figure 17, the IDT strength decreases with the increase of . From the numerical analysis
performed, the best value predicting the experimental result is 60°, which is 10° higher
from the value determined from the simplified method. Similarly, the c value was
determined such that the numerical analysis predicted the experimental curve and the c value
determined was 0.82 MPa (see Figure 18).
Journal of Materials in Civil Engineering. Submitted May 13, 2011; accepted January 26, 2012; posted ahead of print January 28, 2012. doi:10.1061/(ASCE)MT.1943-5533.0000493
Copyright 2012 by the American Society of Civil Engineers
Accep
ted M
anus
cript
Not Cop
yedit
ed
However, the failure load applied for = 60° and c = 1.0568 MPa was 12.386 kN and for c =
0.82 MPa and = 50° was 9.069 kN. Therefore, it can be inferred from the results obtained in
the numerical analysis that a combination of adjusted c and can predict the experimental
stress-deformation behaviour and the failure load. Figure 19 shows such an attempt to find
the combination of adjusted c and predicting the stress-deformation curve and the failure
load. The failure load for this case is 11.224 kN, which is very close to the experimental
failure load (11.718 kN), and the corresponding c and are 0.89 MPa and 56°.
Table 3 presents the best combinations of c and and the corresponding failure loads for the
four different stabilised mixes used in this investigation. The results presented in Table 3
show that the c and values determined from simplified method predicted the IDT strength
in the numerical analysis always higher than the experimental values except for the materials
stabilised with GB cement-flyash. For the materials stabilised with GB cement-flyash, the c
and values determined from the simplified method predicted the IDT strength and the
failure load exactly the same as experimental values. However, the adjusted c values for the
slag-lime stabilised materials have a unique variation with the c values determined from the
simplified method (see Figure 20). On the other hand, the adjusted values for the slag-lime
stabilised materials are about 6° higher than the values calculated by simplified method.
Figure 21 presents some typical results of the IDT testing compared with the results of the
numerical simulation. The numerical model reproduces the experimental results with the
adjusted values of c and from simplified methods. It is noted that the input stiffness
modulus used for the numerical analysis was determined from the experimental IDT study
and the Poisson’s ratio assumed was 0.2. The stress-deformation curves from the numerical
analysis presented in Figure 21 do not exactly agree but agree reasonably well with the
corresponding experimental curves. In particular, the predicted and experimental curves agree
Journal of Materials in Civil Engineering. Submitted May 13, 2011; accepted January 26, 2012; posted ahead of print January 28, 2012. doi:10.1061/(ASCE)MT.1943-5533.0000493
Copyright 2012 by the American Society of Civil Engineers
Accep
ted M
anus
cript
Not Cop
yedit
ed
very well in the elastic region and the numerical model predicts the failure load quite
accurately.
On the basis of the results presented in Table 3 and Figure 21, the c and values determined
from the simplified method are still very useful although they do not exactly predict the
experimental results. Therefore, the simplified method should be used only as an
approximation for the determination of c and at this stage. The shear strength parameters
determined from the simplified method might be same or different from the values
determined using triaxial test. Therefore, a separate study should be carried out in the next
phase of this research to achieve a correlation between triaxial c and and simplified c and .
Conclusions
This paper presents an alternative approach to determine the c and properties for lightly
cementitiously stabilised granular materials using IDT strength and UCS. The estimated c
and values obtained based on this approach were related to the IDT strength and UCS. A
comparison study on the relationships between c and IDT strength and c and UCS was also
performed with the help of previous investigations. Based on the results discussed in this
study, it was concluded that the c and can be estimated using IDT strength and UCS values
for lightly cementitiously stabilised granular materials. Moreover, the mixture cohesion (c)
can be accurately related to either the IDT strength or UCS. However, the IDT strength is a
better characteristic than the UCS to estimate the cohesion of a lightly cementitiously
stabilised granular material.
In order to validate the method to estimate the c - parameters of lightly cementitiously
stabilised granular base materials from IDT test data, the c and obtained from the proposed
approach were input in the numerical analyses of IDT testing with Mohr – Coulomb failure
Journal of Materials in Civil Engineering. Submitted May 13, 2011; accepted January 26, 2012; posted ahead of print January 28, 2012. doi:10.1061/(ASCE)MT.1943-5533.0000493
Copyright 2012 by the American Society of Civil Engineers

Accep
ted M
anus
cript
Not Cop
yedit
ed
criterion using FLAC2D finite difference software. The predicted tensile stress – horizontal
diametrical deformation numerical results were compared with the corresponding
experimental results. Based on this numerical investigation, it was found that the c and
parameters estimated from the simplified method predicted well the experimental results in
the elastic region for all materials but over predicted the ultimate stress for most of the
materials. Moreover, it was concluded that the simplified method should be used only as an
approximation for the determination of c and of lightly cementitiously stabilised materials.
Acknowledgements
The writers would like to thank Mr. David Sharp and Mr. Jim Baxter of SEIT,
UNSW@ADFA for their technical assistance during the experimental work reported in this
paper. The contribution of Blue Circle Southern Cement Pty Ltd for providing the binders is
acknowledged and appreciated.
Journal of Materials in Civil Engineering. Submitted May 13, 2011; accepted January 26, 2012; posted ahead of print January 28, 2012. doi:10.1061/(ASCE)MT.1943-5533.0000493
Copyright 2012 by the American Society of Civil Engineers
Accep
ted M
anus
cript
Not Cop
yedit
ed
References
Arabani, M., and Veis Karami, M. (2006). "Geomechanical Properties of Lime Stabilized Clayey Sands." The Arabian Journal for Science and Engineering, 32(1B), 15.
ASTM-D698. (2007). "Test Method for Laboratoiy Compaction Characteristics of Soil Using Standard Effort (12,400 ft-lbf/ft3 (600kN.m/m3))." Annual Book of ASTM Standards, Vol. 04.08, ASTM International, West Conshohocken, PA, USA.
ASTM-D4318. (2005). "Standard Test Methods for Liquid Limit, Plastic Limit, and Plasticity Index of Soils." Annual Book of ASTM Standards, Vol. 04.08, ASTM International, West Conshohcken, PA, USA.
Basha, E. A., Hashim, R., Mahmud, H. B., and Muntohar, A. S. (2005). "Stabilization of residual soil with rice husk ash and cement." Construction and Building Materials, 19(448 - 453).
Carneiro, F. L. L. B., and Barcellos, A. (1952). "Concrete Tensile Strength." RILEM Bulletin, 13, pp. 97-126.
Christensen, W. D., and Bonaquist, R. (2002). "Use of Strength Tests for Evaluating the Rut Resistance of Asphalt Concrete." Asphalt Paving Technology, Association of Asphalt Paving Technologists-Proceedings of the Technical Sessions, 71, 692-711.
Consoli, N. C., Montardo, J. P., Prietto, P. D. M., and Pasa, G. S. (2002). "Engineering Behavior of a Sand Reinforced with Plastic Waste." ASCE Journal of Geotechnical and Geoenvironmental Engineering, 128(6), 462-472.
Gnanendran, C. T., and Piratheepan, J. (2008). "Characterization of a Lightly Stabilized Granular Material by Indirect Diametrical Tensile Testing." International Journal of Pavement Engineering 9(6), 445 - 456.
Gnanendran, C. T., and Piratheepan, J. (2009). "Indirect Diametrical Tensile Testing With Internal Displacement Measurement and Stiffness Determination." Geotechnical Testing Journal ASTM 32(1), 45 - 54.
Gnanendran, C. T., and Piratheepan, J. (2010). "Determination of Fatigue Life of a Granular Base Material Lightly Stabilized with Slag Lime from Indirect Diametral Tensile Testing." ASCE's Journal of Transportation Engineering, 136(8), 736 - 745.
Hondros, G. (1959). "The Evaluation of Poisson’s Ratio and The Modulus of Materials of Low Tensile Resistance by The Brazilian (Indirect Tensile) Test with Particular Reference to Concrete." Australian Journal of Applied Science, 10(3), 243–268.
Ismail, M. A., Joer, H. A., Sim, W. H., and Randolph, M. F. (2002). "Effect of Cement Type on Shear Behavior of Cemented Calcareous Soil." ASCE's Journal of Geotechnical and Geoenvironmental Engineering, 128(6), 520 - 529.
Journal of Materials in Civil Engineering. Submitted May 13, 2011; accepted January 26, 2012; posted ahead of print January 28, 2012. doi:10.1061/(ASCE)MT.1943-5533.0000493
Copyright 2012 by the American Society of Civil Engineers
Accep
ted M
anus
cript
Not Cop
yedit
ed
Kennedy, T. W., and Hudson, W. R. (1968). "Application of the Indirect Tensile Test To Stabilised Materials." Highway Research Record(235), 36-48.
Khattak, M. J., and Alrashidi, M. (2006). "Durability and mechanistic characteristics of fiber reinforced soil-cement mixtures." International Journal of Pavement Engineering, 7(1), 53 - 62.
Kolias, S., Kasselouri-Rigopoulou, V., and Karahalios, A. (2005a). "Stabilisation of clayey soils with high calcium fly ash and cement." Cement and Concrete Composites, 27, 301 - 313.
Kolias, S., Kasselouri-Rigopoulou, V., and Karahalios, A. (2005b). "Stabilisation of clayey soils with high calcium fly ash and cement." Cement and Concrete Composites, 27(2), 301-313.
Lim, S., and Zollinger, D. G. (2003). "Estimation of the Compressive Strength and Modulus of Elasticity of Cement-Treated Aggregate Base Materials." transportation Research Record: Journal of the Transportation Research Board, 1837, 30 - 38.
Lo, S.-C. R., Lade, P. V., and Wardani, S. P. R. (2003). "An Experimental Study of the Mechanics of Two Weakly Cemented Soils." Geotechnical Testing Journal ASTM, 26(3), 1-14.
Peethamparan, S., and Olek, J. (2008). "Study of the Effectiveness of Cement Kiln Dusts in Stabilizing Na-Montmorillonite Clay." ASCE Journal of Materials in Civil Engineering, 20(2), 137–146.
Peethamparan, S., Olek, J., and Diamond, S. (2008). "Physicochemical Behavior of Cement Kiln Dust-Treated Kaolinite Clay " Transportation Research Record: Journal of the Transportation Research Board, 2059, 80-88.
Piratheepan, J., Gnanendran, C. T., and LO, S.-C. R. (2010). "Characterization of Cementitiously Stabilised Granular Materials for Pavement Design Using Unconfined Compression and IDT Testings with Internal Displacement Measurements." ASCE's Journal of Materials in Civil Engineering 22(5), 495 - 505.
Schmidt, R. J. (1972). "A Practical Method for Measuring the Resilient Modulus of Asphalt-Treated Mixes." Highway Research Record, Highway Research Board(404), 22-32.
Sobhan, K., and Mashnad, M. (2002). "Tensile Strength and Toughness of Soil--Cement--Fly-Ash Composite Reinforced with Recycled High-Density Polyethylene Strips." Journal of Materials in Civil Engineering, 14(2), 177-184.
Vuttukuri, V. S., Lama, R. D., and Saluja, S. S. (1974). "Handbook on Mechanical Properties of Rocks." 1, Clausthal, Germany: Trans Tech., 1974.
White, G. (2006). "Laboratory Characterization of Cementitiously Stabilized Pavement Materials." M. Eng. thesis, University of New South Wales at Australian Defence Force Academy.
Journal of Materials in Civil Engineering. Submitted May 13, 2011; accepted January 26, 2012; posted ahead of print January 28, 2012. doi:10.1061/(ASCE)MT.1943-5533.0000493
Copyright 2012 by the American Society of Civil Engineers
Accep
ted M
anus
cript
Not Cop
yedit
ed
List of Figures
Figure 1 Stresses in IDT sample and pavement
Figure 2 Mohr’s circle representing IDT and UC testing
Figure 3 Particle size distributions of granular base parent materials
Figure 4 Variation of dry density with moisture content
Figure 5 The IDT test configuration
Figure 6 FLAC mesh for the analysis IDT testing
Figure 7 Boundary conditions and the applied loading for the numerical analysis
Figure 8 Variation of Cohesion with IDT strength
Figure 9 Variation of cohesion with UCS
Figure 10 Mohr’s circle for triaxial and the proposed method
Figure 11 Variation of cohesion with binder content
Figure 12 Variation of internal angle of friction with binder content
Figure 13 Variation of Cohesion with IDT strength from various investigations
Figure 14 Variation of Cohesion with UCS from various investigations
Figure 15 Typical stress-deformation curves for experiment and numerical analysis
Figure 16 Stress-deformation curves for different loading areas
Figure 17 Stress-deformation curves for different internal angle of friction
Figure 18 Stress-deformation curves for BM1 stabilised with 4% slag-lime
Figure 19 Stress-deformation curves for experiment and numerical analysis with adjusted c and
for BM1 stabilised with 4% slag-lime
Figure 20 Variation of adjusted cohesion with the cohesion from simplified method
Journal of Materials in Civil Engineering. Submitted May 13, 2011; accepted January 26, 2012; posted ahead of print January 28, 2012. doi:10.1061/(ASCE)MT.1943-5533.0000493
Copyright 2012 by the American Society of Civil Engineers

Accep
ted M
anus
cript
Not Cop
yedit
ed
Figure 21 Typical variations of stress versus tensile deformation: (a) BM1 stabilised with 5%
slag-lime; (b) BM2 stabilised with 3% slag-lime; (c) BM2 stabilised with 5% slag-lime; and (d)
BM2 stabilised with 1.5% GB cement-flyash
Journal of Materials in Civil Engineering. Submitted May 13, 2011; accepted January 26, 2012; posted ahead of print January 28, 2012. doi:10.1061/(ASCE)MT.1943-5533.0000493
Copyright 2012 by the American Society of Civil Engineers

Accep
ted M
anus
cript
Not Cop
yedit
ed
List of Tables
Table 1 c and values calculated from the proposed simplified method
Table 2 Estimated stresses and loads for different loading areas
Table 3 Comparison of c, and failure load from the numerical analysis by FLAC2D
Journal of Materials in Civil Engineering. Submitted May 13, 2011; accepted January 26, 2012; posted ahead of print January 28, 2012. doi:10.1061/(ASCE)MT.1943-5533.0000493
Copyright 2012 by the American Society of Civil Engineers

Acc
epte
d M
anus
crip
t N
ot C
opye
dite
d
Journal of Materials in Civil Engineering. Submitted May 13, 2011; accepted January 26, 2012; posted ahead of print January 28, 2012. doi:10.1061/(ASCE)MT.1943-5533.0000493
Copyright 2012 by the American Society of Civil Engineers

Acc
epte
d M
anus
crip
t N
ot C
opye
dite
d
Journal of Materials in Civil Engineering. Submitted May 13, 2011; accepted January 26, 2012; posted ahead of print January 28, 2012. doi:10.1061/(ASCE)MT.1943-5533.0000493
Copyright 2012 by the American Society of Civil Engineers

Accepted Manuscript Not Copyedited
Journal of Materials in Civil Engineering. Submitted May 13, 2011; accepted January 26, 2012; posted ahead of print January 28, 2012. doi:10.1061/(ASCE)MT.1943-5533.0000493
Copyright 2012 by the American Society of Civil Engineers
Accepted Manuscript Not Copyedited
Journal of Materials in Civil Engineering. Submitted May 13, 2011; accepted January 26, 2012; posted ahead of print January 28, 2012. doi:10.1061/(ASCE)MT.1943-5533.0000493
Copyright 2012 by the American Society of Civil Engineers

Accepted Manuscript Not Copyedited
Journal of Materials in Civil Engineering. Submitted May 13, 2011; accepted January 26, 2012; posted ahead of print January 28, 2012. doi:10.1061/(ASCE)MT.1943-5533.0000493
Copyright 2012 by the American Society of Civil Engineers

Acc
epte
d M
anus
crip
t N
ot C
opye
dite
d
Journal of Materials in Civil Engineering. Submitted May 13, 2011; accepted January 26, 2012; posted ahead of print January 28, 2012. doi:10.1061/(ASCE)MT.1943-5533.0000493
Copyright 2012 by the American Society of Civil Engineers

Acc
epte
d M
anus
crip
t N
ot C
opye
dite
d
Journal of Materials in Civil Engineering. Submitted May 13, 2011; accepted January 26, 2012; posted ahead of print January 28, 2012. doi:10.1061/(ASCE)MT.1943-5533.0000493
Copyright 2012 by the American Society of Civil Engineers

Accepted Manuscript Not Copyedited
Journal of Materials in Civil Engineering. Submitted May 13, 2011; accepted January 26, 2012; posted ahead of print January 28, 2012. doi:10.1061/(ASCE)MT.1943-5533.0000493
Copyright 2012 by the American Society of Civil Engineers
Accepted Manuscript Not Copyedited
Journal of Materials in Civil Engineering. Submitted May 13, 2011; accepted January 26, 2012; posted ahead of print January 28, 2012. doi:10.1061/(ASCE)MT.1943-5533.0000493
Copyright 2012 by the American Society of Civil Engineers

Acc
epte
d M
anus
crip
t N
ot C
opye
dite
d
Journal of Materials in Civil Engineering. Submitted May 13, 2011; accepted January 26, 2012; posted ahead of print January 28, 2012. doi:10.1061/(ASCE)MT.1943-5533.0000493
Copyright 2012 by the American Society of Civil Engineers
Accepted Manuscript Not Copyedited
Journal of Materials in Civil Engineering. Submitted May 13, 2011; accepted January 26, 2012; posted ahead of print January 28, 2012. doi:10.1061/(ASCE)MT.1943-5533.0000493
Copyright 2012 by the American Society of Civil Engineers
Accepted Manuscript Not Copyedited
Journal of Materials in Civil Engineering. Submitted May 13, 2011; accepted January 26, 2012; posted ahead of print January 28, 2012. doi:10.1061/(ASCE)MT.1943-5533.0000493
Copyright 2012 by the American Society of Civil Engineers

Accepted Manuscript Not Copyedited
Journal of Materials in Civil Engineering. Submitted May 13, 2011; accepted January 26, 2012; posted ahead of print January 28, 2012. doi:10.1061/(ASCE)MT.1943-5533.0000493
Copyright 2012 by the American Society of Civil Engineers
Accepted Manuscript Not Copyedited
Journal of Materials in Civil Engineering. Submitted May 13, 2011; accepted January 26, 2012; posted ahead of print January 28, 2012. doi:10.1061/(ASCE)MT.1943-5533.0000493
Copyright 2012 by the American Society of Civil Engineers

Acc
epte
d M
anus
crip
t N
ot C
opye
dite
d
Journal of Materials in Civil Engineering. Submitted May 13, 2011; accepted January 26, 2012; posted ahead of print January 28, 2012. doi:10.1061/(ASCE)MT.1943-5533.0000493
Copyright 2012 by the American Society of Civil Engineers
Acc
epte
d M
anus
crip
t N
ot C
opye
dite
d
Journal of Materials in Civil Engineering. Submitted May 13, 2011; accepted January 26, 2012; posted ahead of print January 28, 2012. doi:10.1061/(ASCE)MT.1943-5533.0000493
Copyright 2012 by the American Society of Civil Engineers
Acc
epte
d M
anus
crip
t N
ot C
opye
dite
d
Journal of Materials in Civil Engineering. Submitted May 13, 2011; accepted January 26, 2012; posted ahead of print January 28, 2012. doi:10.1061/(ASCE)MT.1943-5533.0000493
Copyright 2012 by the American Society of Civil Engineers

Acc
epte
d M
anus
crip
t N
ot C
opye
dite
d
Journal of Materials in Civil Engineering. Submitted May 13, 2011; accepted January 26, 2012; posted ahead of print January 28, 2012. doi:10.1061/(ASCE)MT.1943-5533.0000493
Copyright 2012 by the American Society of Civil Engineers

Acc
epte
d M
anus
crip
t N
ot C
opye
dite
d
Journal of Materials in Civil Engineering. Submitted May 13, 2011; accepted January 26, 2012; posted ahead of print January 28, 2012. doi:10.1061/(ASCE)MT.1943-5533.0000493
Copyright 2012 by the American Society of Civil Engineers

Acc
epte
d M
anus
crip
t N
ot C
opye
dite
d
Journal of Materials in Civil Engineering. Submitted May 13, 2011; accepted January 26, 2012; posted ahead of print January 28, 2012. doi:10.1061/(ASCE)MT.1943-5533.0000493
Copyright 2012 by the American Society of Civil Engineers

Acc
epte
d M
anus
crip
t N
ot C
opye
dite
d
Journal of Materials in Civil Engineering. Submitted May 13, 2011; accepted January 26, 2012; posted ahead of print January 28, 2012. doi:10.1061/(ASCE)MT.1943-5533.0000493
Copyright 2012 by the American Society of Civil Engineers

Table 1 c and values calculated from the proposed simplified method
Material Binder type Binder content
/ (%) Sample number UCS / (MPa)
IDT strength / (MPa)
Cohesion / (MPa)
Internal angle of friction / (°)
BM1 Slag-lime 3 1 3.498 0.388 0.7131 45.64 BM1 Slag-lime 3 2 3.946 0.423 0.7843 46.64 BM1 Slag-lime 3 3 3.921 0.410 0.7652 47.36 BM1 Slag-lime 4 1 5.832 0.550 1.0572 50.14 BM1 Slag-lime 4 2 5.697 0.555 1.0568 49.29 BM1 Slag-lime 4 3 5.910 0.608 1.1393 47.83 BM1 Slag-lime 5 1 7.406 0.798 1.4776 46.49 BM1 Slag-lime 5 2 7.434 0.803 1.4859 46.42 BM1 Slag-lime 5 3 7.269 0.762 1.4213 47.28 BM2 Slag-lime 3 1 3.153 0.387 0.6949 42.43 BM2 Slag-lime 3 2 2.811 0.306 0.5651 46.19 BM2 Slag-lime 3 3 3.082 0.329 0.6107 46.76 BM2 Slag-lime 4 1 4.602 0.438 0.8398 49.90 BM2 Slag-lime 4 2 4.830 0.469 0.8939 49.38 BM2 Slag-lime 4 3 5.012 0.576 1.0495 44.55 BM2 Slag-lime 5 1 5.222 0.664 1.1838 41.22 BM2 Slag-lime 5 2 5.644 0.712 1.2714 41.50 BM2 Slag-lime 5 3 5.621 0.709 1.2660 41.50 BM1 GB - flyash 1.5 1 1.924 0.083 0.2141 64.90 BM1 GB – flyash 1.5 2 1.614 0.071 0.1817 64.63 BM1 GB – flyash 1.5 3 1.259 0.065 0.1556 62.23 BM2 GB – flyash 1.5 1 1.293 0.048 0.1321 66.90 BM2 GB – flyash 1.5 2 1.328 0.054 0.1429 65.71 BM2 GB - flyash 1.5 3 1.147 0.042 0.1163 67.07
Accepted Manuscript Not Copyedited
Journal of Materials in Civil Engineering. Submitted May 13, 2011; accepted January 26, 2012; posted ahead of print January 28, 2012. doi:10.1061/(ASCE)MT.1943-5533.0000493
Copyright 2012 by the American Society of Civil Engineers

Table 2 Estimated stresses and loads for different loading areas
Loading angle/area (2α)
Ultimate stress / (MPa)
Maximum applied pressure /(MPa)
Maximum applied load / (kN)
2° 0.725 42.83 25.141
5° 0.713 23.27 13.660
7° 0.733 16.05 9.421
Accepted Manuscript Not Copyedited
Journal of Materials in Civil Engineering. Submitted May 13, 2011; accepted January 26, 2012; posted ahead of print January 28, 2012. doi:10.1061/(ASCE)MT.1943-5533.0000493
Copyright 2012 by the American Society of Civil Engineers
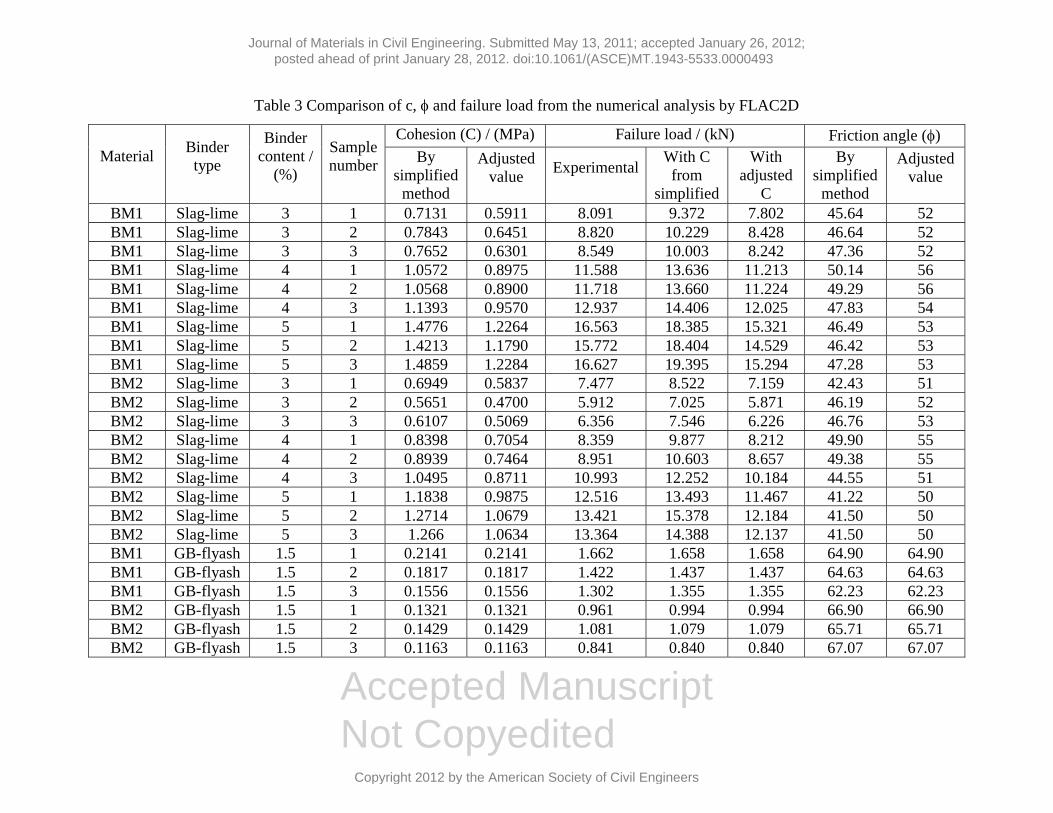
Table 3 Comparison of c, and failure load from the numerical analysis by FLAC2D
Material Binder type
Binder content /
(%)
Sample number
Cohesion (C) / (MPa) Failure load / (kN) Friction angle ( ) By
simplified method
Adjusted value
Experimental With C from
simplified
With adjusted
C
By simplified
method
Adjusted value
BM1 Slag-lime 3 1 0.7131 0.5911 8.091 9.372 7.802 45.64 52 BM1 Slag-lime 3 2 0.7843 0.6451 8.820 10.229 8.428 46.64 52 BM1 Slag-lime 3 3 0.7652 0.6301 8.549 10.003 8.242 47.36 52 BM1 Slag-lime 4 1 1.0572 0.8975 11.588 13.636 11.213 50.14 56 BM1 Slag-lime 4 2 1.0568 0.8900 11.718 13.660 11.224 49.29 56 BM1 Slag-lime 4 3 1.1393 0.9570 12.937 14.406 12.025 47.83 54 BM1 Slag-lime 5 1 1.4776 1.2264 16.563 18.385 15.321 46.49 53 BM1 Slag-lime 5 2 1.4213 1.1790 15.772 18.404 14.529 46.42 53 BM1 Slag-lime 5 3 1.4859 1.2284 16.627 19.395 15.294 47.28 53 BM2 Slag-lime 3 1 0.6949 0.5837 7.477 8.522 7.159 42.43 51 BM2 Slag-lime 3 2 0.5651 0.4700 5.912 7.025 5.871 46.19 52 BM2 Slag-lime 3 3 0.6107 0.5069 6.356 7.546 6.226 46.76 53 BM2 Slag-lime 4 1 0.8398 0.7054 8.359 9.877 8.212 49.90 55 BM2 Slag-lime 4 2 0.8939 0.7464 8.951 10.603 8.657 49.38 55 BM2 Slag-lime 4 3 1.0495 0.8711 10.993 12.252 10.184 44.55 51 BM2 Slag-lime 5 1 1.1838 0.9875 12.516 13.493 11.467 41.22 50 BM2 Slag-lime 5 2 1.2714 1.0679 13.421 15.378 12.184 41.50 50 BM2 Slag-lime 5 3 1.266 1.0634 13.364 14.388 12.137 41.50 50 BM1 GB-flyash 1.5 1 0.2141 0.2141 1.662 1.658 1.658 64.90 64.90 BM1 GB-flyash 1.5 2 0.1817 0.1817 1.422 1.437 1.437 64.63 64.63 BM1 GB-flyash 1.5 3 0.1556 0.1556 1.302 1.355 1.355 62.23 62.23 BM2 GB-flyash 1.5 1 0.1321 0.1321 0.961 0.994 0.994 66.90 66.90 BM2 GB-flyash 1.5 2 0.1429 0.1429 1.081 1.079 1.079 65.71 65.71 BM2 GB-flyash 1.5 3 0.1163 0.1163 0.841 0.840 0.840 67.07 67.07
Accepted Manuscript Not Copyedited
Journal of Materials in Civil Engineering. Submitted May 13, 2011; accepted January 26, 2012; posted ahead of print January 28, 2012. doi:10.1061/(ASCE)MT.1943-5533.0000493
Copyright 2012 by the American Society of Civil Engineers