Embed Size (px)
Citation preview

DETERMINATION OF AROMA COMPOUNDS AND EXOPOLYSACCHARIDES FORMATION BY
LACTIC ACID BACTERIA ISOLATED FROM TRADITIONAL YOGURTS
A Thesis Submitted to the Graduate School of Engineering and Sciences of
Izmir Institute of Technology in Partial Fulfillment of the Requirements for the Degree of
MASTER OF SCIENCE
in Biotechnology
by Elif Sinem ÇELİK
December 2007 İZMİR

We approve the thesis of Elif Sinem ÇELİK Assist. Prof. Dr. Figen KOREL Supervisor Prof. Dr. Şebnem HARSA Co-Supervisor Assoc. Prof. Dr. Durmuş ÖZDEMİR Co-Supervisor Assoc. Prof. Dr. Canan TARI Committee Member Assist. Prof. Dr. Alper ARSLANOĞLU Committee Member 6 December 2007 Date
Prof. Dr. Hasan BÖKE
Dean of the Graduate School of Engineering and Science
Prof. Dr. Semra ÜLKÜ Head of the Departmant of Biotecnology and Bioengineering

ACKNOWLEDGEMENTS
Many persons have contributed either directly or indirectly to my thesis, I would
like to mention them and show my gratitude.
First of all, I would like to thank my supervisor Assist. Prof. Dr. Figen KOREL
for her all kinds of support and encouragement and also I would like to thank my co-
supervisor Prof. Dr. Şebnem HARSA and Assoc. Prof. Dr. Durmuş ÖZDEMİR for
their all kind of support and help.
I would like to thank Assist. Prof. Dr. Sevcan ÜNLÜTÜRK from Department of
Food Engineering, Assoc. Prof. Dr. Sami DOĞANLAR and Assoc. Prof. Dr. Anne
FRARY from Department of Molecular Biology and Genetics, Esra YÜCEL from
Environmental Research Center at İzmir Institute of Technology for their guidance and
support. I would also like to thank Pınar Dairy Company for providing sterile milk and
Or-Köy Dairy Plant for providing evaporated milk for yogurt production.
Finally, I want to express my thankfullness to my friends; Hatice Yavuzdurmaz,
Oylum Erkuş, Burcu Okuklu, Mert Sudağıdan, F. Işık Üstok, Fatih Y.G. Yener,
Mehmet R. Atılgan, Deniz Göl, Betül Öztürk for their help.
Lastly, I offer sincere thanks to my family members for their support and love.

iv
ABSTRACT
DETERMINATION OF AROMA COMPOUNDS AND
EXOPOLYSACCHARIDES FORMATION BY LACTIC ACID
BACTERIA ISOLATED FROM TRADITIONAL YOGURTS
Yogurt, consumed widely around the world, is a fermented milk product
as a result of the lactic acid fermentation by addition of starter cultures containing
Streptococcus thermophilus and Lactobacillus delbrueckii ssp. bulgaricus. The
most important criteria for yogurt production is the selection of starter cultures
since each culture affects the end-product quality differently. Our natural flora and
traditional flavor have been continously changing due to the introduction of
imported commercial starter cultures. Because of the necessity to preserve our
natural starter cultures and to increase the availability of them for industrial use,
these cultures must be isolated from artisanal yogurts, genetically characterized
and investigated regarding their technological properties. Aims of our study were
to determine the technological and organoleptic properties of starter cultures
previously isolated and genetically characterized and to assess the feasibility of
near-infrared (NIR) spectroscopy for determining the yogurt quality.
Total of 20 different yogurt samples were produced using combinations of
5 Streptococcus thermophilus and 4 Lactobacillus delbrueckii ssp. bulgaricus
strains. Yogurt samples were stored at 4 °C for 21 days. Chemical, physical,
microbial and organoleptic analyses for samples were conducted at predetermined
days.
As a conclusion, it was found that 4 Streptococcus thermophilus and 4
Lactobacillus delbrueckii ssp. bulgaricus yogurt isolates have potential to be used
in dairy industry regarding their high technological and organoleptic
characteristics. In addition, NIR spectroscopy technique could be used
successfully on yogurt samples to predict total solids, fat, pH, syneresis, and
microbial counts of yogurts based on the calibration models (Genetic Algoritm).

v
ÖZET
GELENEKSEL YOĞURTLARDAN İZOLE EDİLEN LAKTİK
ASİT BAKTERİLERİNİN AROMA BİLEŞİKLERİ VE
EKZOPOLİSAKKARİT ÜRETİMLERİNİN BELİRLENMESİ
Dünyada yaygın olarak tüketilen yoğurt, süte katılan Streptococcus
thermophilus ve Lactobacillus bulgaricus starter kültürlerinin laktik asit
fermentasyonu sonucu oluşan fermente bir üründür. Her bir kültürün son ürün
kalitesini farklı etkilemesi sebebiyle yoğurt yapımındaki en önemli husus,
kullanılacak kültürün seçimidir. Doğal floramızı ve Anadolu’ya özgü damak
tadımızı kaybetmemizin nedeni endüstriyel yoğurt üretiminde çoğunlukla
yurtdışından ithal edilen starter kültürlerin kullanılmasıdır. Coğrafyamıza özgü
floramızı korumak ve bunun endüstriyel çapta kullanımını arttırmak için,
geleneksel yöntemle yapılmış yoğurtlardan söz konusu bakterilerin saflaştırılıp,
genetik olarak tanımlanması ve teknolojik özelliklerinin belirlenmesi
gerekmektedir. Bu bilgiler ışığında, çalışmamızın amaçları, geleneksel yöntemle
yapılmış yoğurtlardan önceden izole edilmiş ve genetik olarak tanımlanmış yoğurt
kültürlerini hem teknolojik hem de organoleptik özelliklerini incelemek ve Yakın
İnfrared (NIR) Spektroskopi yönteminin yoğurt kalitesini belirlemede
kullanılabilirliğini belirlemektir.
Toplam 5 adet Streptococcus thermophilus ve 4 adet Lactobacillus
bulgaricus kültürün kombinasyonlarıyla 20 çeşit yoğurt örneği yapılmıştır.
Örnekler 21 gün boyunca 4 °C’da depolanmıştır. Örneklerde kimyasal, fiziksel,
mikrobiyolojik ve duyusal analizler önceden belirlenmiş günlerde yapılmıştır.
Bu araştırmanın sonucunda, 4 adet Streptococcus thermophilus and 4 adet
Lactobacillus bulgaricus yogurt izolatının yoğurt endüstrisinde kullanılabilir
teknolojik ve duyusal özelliklere sahip oldukları görülmüştür. Ayrıca bu
çalışmada kullanılan NIR spektroskopi yöntemi, kuru madde, yağ, serum
ayrılması, pH ve mikrobiyal sayım gibi bazı analizlerin yapılmasına gerek
kalmadan başarılı ve güvenilir olarak kullanılabileceğini göstermiştir.

vi
TABLE OF CONTENTS
LIST OF FIGURES................................................................................................ ix
LIST OF TABLES ................................................................................................. xi
CHAPTER 1 INTRODUCTION............................................................................. 1
1.1. Definition and History of Yogurt ................................................. 1
1.2. Manufacture of Yogurt ................................................................ 2
1.3. Yogurt Types ................................................................................. 5
1.4. Yogurt Fermentation ................................................................... 6
1.5. Composition of Yogurt.................................................................. 6
1.5.1. Total Solids Content ............................................................... 9
1.5.2. Carbohydrates.......................................................................... 9
1.5.3. Lactic Acid .............................................................................. 9
1.5.4. Protein.................................................................................... 10
1.5.5. Fat .......................................................................................... 11
1.5.6. Vitamins and Minerals........................................................... 12
CHAPTER 2 STARTER CULTURES AND FERMENTATION OF
YOGURT...................................................................................... 14
2.1. Yogurt Starter Culture ................................................................. 14
2.1.1. Streptococcus salivarius spp. thermophilus
(Streptococcus thermophilus) ............................................... 15
2.1.2. Lactobacillus delbruecki spp. bulgaricus
(Lactobacillus bulgaricus)..................................................... 16
2.1.3. Fermentation.......................................................................... 17
CHAPTER 3 TEXTURE....................................................................................... 19
3.1. Texture of Yogurt ........................................................................ 19
3.2. Polysaccharides ........................................................................... 20
3.3. Exopolysaccharides ..................................................................... 21
3.4. Chemical Composition of EPS Produced by Lactic Acid
Bacteria........................................................................................ 21
3.5. Classification of EPS Produced by Lactic Acid Bacteria............ 22
3.5.1. Homopolysaccharides ........................................................... 22

vii
3.5.2. Heteropolysaccharides.............................................................. 23
3.6. EPS Phenotypes........................................................................... 24
3.7. Biosynthesis of EPS by Lactic Acid Bacteria ............................. 25
3.8. Isolation and Quantification Methods of EPS............................. 26
3.9. Effects of EPS Production on Rheological Properties of
Yogurt.......................................................................................... 28
3.10. Applications of EPSs Produced by Lactic Acid Bacteria.......... 29
CHAPTER 4 NEAR-INFRARED SPECTROSCOPY TECHNIQUE ................. 30
4.1. Near-Infrared (NIR) Spectroscopy ............................................. 30
4.2. Applications of NIR Spectroscopy in Food Analysis.................. 33
CHAPTER 5 AROMA.......................................................................................... 35
5.1. Aroma Compounds...................................................................... 35
5.2. Flavor Formation ........................................................................ 35
CHAPTER 6 SENSORY EVALUATION ........................................................... 42
6.1. Sensory Analysis ........................................................................ 42
CHAPTER 7 MATERIALS AND METHODS ................................................... 46
7.1. Materials ...................................................................................... 46
7.1.1. Chemicals .............................................................................. 46
7.1.2. Media ..................................................................................... 46
7.1.3. Selection of Streptococcus thermophilus and
Lactobacillus bulgaricus Isolates ........................................... 46
7.2. Methods ....................................................................................... 48
7.2.1. Single Strain Analyses .......................................................... 48
7.2.1.1. Coagulation of Yogurt Isolates ................................... 48
7.2.1.2. Acid Production of Yogurt Isolates ............................. 48
7.2.1.3. Acetaldehyde Formation of Yogurt Isolates ............... 48
7.2.1.4. EPS Purification and Quantification in Yogurt
Isolates ........................................................................ 49
7.2.2. Selection of Yogurt Isolates .................................................. 49
7.2.3. Yogurt Analyses .................................................................... 49
7.2.3.1. Total Solids, Fat and Protein Contents of Milk
and Yogurt Samples.................................................. 50
7.2.3.2. pH and Titratable Acidity of Yogurt Samples ............. 50
7.2.3.3. Syneresis of Yogurt Samples ....................................... 50

viii
7.2.3.4. Apparent Viscosity of Yogurt Samples ....................... 51
7.2.3.5. Amount of EPS in Yogurts ......................................... 51
7.2.3.6. Lactic Acid Bacteria Counts ........................................ 51
7.2.3.7. NIR Spectroscopy of Yogurts ...................................... 51
7.2.3.8. Analysis of Aroma Compounds................................... 52
7.2.3.9. Sensory Evaluation of Yogurts .................................... 54
7.2.3.10. Data Analysis ............................................................. 54
CHAPTER 8 RESULTS AND DISCUSSION ..................................................... 56
8.1. Single Strain Analyses Results.................................................... 56
8.1.1. Coagulation of Yogurt Isolates.............................................. 56
8.1.2. Acid Production of Yogurt Isolates ....................................... 57
8.1.3. Acetaldehyde Production of Yogurt Isolates......................... 59
8.1.4. Amount of EPS in Yogurt Isolates ........................................ 59
8.2. Selection of Yogurt Isolates ........................................................ 61
8.3. Yogurt Analyses Results ............................................................. 61
8.3.1. Total Solids, Fat, and Protein Contents of Yogurt
Samples................................................................................... 61
8.3.2. pH and Titratable Acidity of Yogurt Samples....................... 63
8.3.3. Syneresis of Yogurt Samples................................................. 66
8.3.4. Apparent Viscosity of Yogurt Samples ................................. 68
8.3.5. Amount of EPS in Yogurts .................................................... 68
8.3.6. Lactic Acid Bacteria Counts.................................................. 69
8.3.7. NIR Spectroscopy of Yogurts................................................ 73
8.3.8. Analysis of Aroma Compounds ............................................ 78
8.3.9. Sensory Evaluation of Yogurts.............................................. 81
CHAPTER 9 CONCLUSION............................................................................... 83
REFERENCES...................................................................................................... 86
APPENDIX A CHEMICALS USED IN EXPERIMENTS ................................. 95
APPENDIX B PROCEDURES FOR ACETALDEHYDE AND EPS
DETERMINATION...................................................................... 97

ix
LIST OF FIGURES
Figure Page Figure 1.1. Process for yogurt manufacturing.................................................... 5
Figure 2.1. The growth of Yoghurt Starter Bacteria ........................................ 15
Figure 2.2. Relationship between starter bacteria in milk
fermentation................................................................................... 17
Figure 3.1. Structure of the EPS Subunits........................................................ 22
Figure 3.2. Diagram of the conversion of lactose, galactose
and glucose to EPS and to glycolysis in lactic
acid bacteria ................................................................................... 26
Figure 4.1. GA optimization method steps ...................................................... 33
Figure 5.1. Overview of general protein conversion pathways
relevant for flavor formation in dairy
fermentations ................................................................................. 36
Figure 5.2. Pathway for the conversion of citrate to diacetyl
and other compounds..................................................................... 37
Figure 5.3. Overview of general protein conversion pathways
relevant for flavor formation in dairy
fermentations ................................................................................. 39
Figure 8.1. The pH decrease in samples 13 and 18 during 21
days of storage ............................................................................... 64
Figure 8.2. The lactic acid bacteria counts for sample 9
during 21 days of storage............................................................... 70
Figure 8.3. The NIR spectra of yogurt samples between 1000
and 2500 nm.. ................................................................................ 73
Figure 8.4. Actual versus genetic inverse least squares
(GILS)-predicted total solids of yogurt samples ........................... 74
Figure 8.5. Actual versus genetic inverse least squares
(GILS)-predicted fat contents of yogurt samples .......................... 74
Figure 8.6. Actual versus genetic inverse least squares
(GILS)-predicted pH values of yogurt samples............................. 75

x
Figure 8.7. Actual versus genetic inverse least squares
(GILS)-predicted syneresis of yogurt samples .............................. 75
Figure 8.8. Actual versus genetic inverse least squares
(GILS)-predicted lactic acid bacteria counts of
yogurt samples ............................................................................... 76
Figure 8.9. The chromatogram of volatile compounds in
yogurt sample................................................................................. 79

xi
LIST OF TABLES
Table Page
Table 1.1. Chemical composition of different milk sources
used in production of yogurt .............................................................. 7
Table 1.2 The average nutritional contents of full-fat,
reduced-fat, and non-fat yogurts ........................................................ 8
Table 1.3. Volatile fatty acid content of raw milk and yogurt ......................... 11
Table 1.4. Vitamin contents of milk and yogurt ............................................... 13
Table 5.1. Compounds contributing to yogurt aroma........................................ 41
Table 7.1. Streptococcus thermophilus isolates ................................................ 47
Table 7.2. Lactobacillus bulgaricus isolates ..................................................... 47
Table 7.3. Sample numbers given to each different
combination of yogurt isolates ......................................................... 50
Table 7.4. GC-MS conditions............................................................................ 53
Table 7.5. Target volatile compound ions in SIM program .............................. 54
Table 7.6. Descriptive hedonic scale used for sensory
evaluation of yogurt samples ........................................................... 55
Table 8.1. Curd formation of S. thermophilus isolates..................................... 56
Table 8.2. Curd formation of L. bulgaricus isolates.......................................... 57
Table 8.3. The acid production of S. thermophilus strains................................ 58
Table 8.4. The acetaldehyde production of L. bulgaricus
strains ............................................................................................... 59
Table 8.5. Amount of EPS produced by L. bulgaricus isolates ........................ 60
Table 8.6. Amount of EPS produced by S. thermophilus
isolates.............................................................................................. 61
Table 8.7. Total solids, fat and protein contents of yogurts .............................. 63
Table 8.8. The pH values of yogurt samples during 21 days of
storage .............................................................................................. 65
Table 8.9. The pH values and titratable acidity of yogurt
samples at day 1 ............................................................................... 66

xii
Table 8.10. Syneresis of yogurt samples ............................................................. 67
Table 8.11. Apparent viscosities of yogurt samples............................................ 68
Table 8.12. Amount of EPS in yogurts................................................................ 69
Table 8.13. Viable lactic acid bacteria counts of yogurt samples
during 21 days of storage ........................................................... 71-72
Table 8.14. Results of calibration sets for total solids, fat, pH,
syneresis, and microbial counts determined
previously with standart error of calibration (SEC)......................... 77
Table 8.15. Predicted total solids, fat, pH, syneresis, and
microbial counts in the prediction set with standart
error of prediction (SEP).................................................................. 78
Table 8.16. Contents of the volatile compounds in the yogurt
samples............................................................................................. 80
Table 8.17. Sensory scores for yogurt samples ................................................... 82

1
CHAPTER 1
INTRODUCTION
1.1. Definition and History of Yogurt
Yogurt is a fermented milk product containing a mixture of Streptococcus
salivarius ssp. thermophilus (Streptococcus thermophilus) and Lactobacillus
delbrueckii ssp. bulgaricus (Lactobacillus bulgaricus) which convert lactose into lactic
acid (Tamime and Marshall 1997). In some countries, less traditional bacteria such as
Lactobacillus helveticus and Lactobacillus delbrueckii ssp. lactis are used with the main
starter culture (McKinley 2005).
There are no records available stating the origin of yogurt, but it is believed that
its beneficial influence on human health and nutrition has existed in many civilizations
for a long period of time. It is thought that the origin of yogurt was the Middle East. In
fact, the production of milk in the Middle East has always been seasonal. Intensive
animal production has never really existed, so that, it was restricted to no more that a
few months of the year. For this reason, the production of milk is limited. In addition,
keeping milk fresh was difficult due to subtropical climate and contamination by
microorganisms from air, animal, feeding stuff or hands of milker (Tamime and
Robinson 1985).
Yogurt has been produced popularly in warmer regions around the
Mediterranean and Middle Eastern for centuries. Moreover, yogurt is considered as
belonging to nomadic people living in that part of the world. For instance, the use of
yogurt by ancient Turks is recorded in books, “Divan-ı Lugati’t Türk” by “Kaşgarlı
Mahmut” and “Kutadgu Bilig” by “Yusuf Has Hacib” which were written in the 11th
century. The word “yogurt” is mentioned in different sections and its use by nomadic
Turks is described in both books (Anon 2007a). In more recent times, yogurt became
widespread in Europe used in clinically for diarrhoea treatment of Emperor Francis I of
France by consuming yogurt (Tamime and Robinson 1985).
Nomadic people have gradually devised a fermentation process which brought
under control the souring of milk. They started heating milk over an open fire in order
to concentrate it slightly, to modify the properties of the casein, to eradicate any

2
pathogenic microorganisms present in milk, to encourage the fermentation of milk to
take place at a slightly higher temperature and also to ensure a gradual selection of
lactic acid bacteria capable of tolerating high levels of lactic acid, and of giving the
product its distinctive flavor. At the end of this procedure, sour milk is produced which
is named as yogurt. It is fact that, yogurt production was an intuitive process for the
milk preservation (Tamime and Robinson 1985).
Thereafter, yogurt was kept in animal skin especially by nomadic people. They
invented hanging yogurt in animal skin result in more concentrated product to consume
in long period. However, it was not effectual because spoilage was the main problem.
For this reason, salted yogurt became popular. Similar methods were used by the
Turkish, Armenian, and Egyptians and as well as other societies. Each society found the
best appropriate preservation methods for their needs, for instance, salting and drying,
heating for a few hours over low fires of a special type of wood that called smoked
yogurt, or keeping salted and dried yogurt in olive oil or tallow. Another method that
Turkish, Lebanese, Syrian, Iranian and Iraqi used was mixing concentrated yogurt with
wheat that is called kishk (Tamime and Robinson 1985).
After the refrigeration became widespread, these traditional methods lost
popularity except among certain communities in Middle East. In the following years,
new trends such as fruit yogurts gained interest. Thus, over the years, the method of
yogurt production has changed little by the improvement of new technologies although
the essential steps are still the same. In addition, as the health benefits of yogurt are
proved, consuming is increased by the years (Tamime and Robinson 1985).
1.2. Manufacture of Yogurt
In dairy industry, there is not only one type of manufacturing process or
incubation temperature and time because these depend on yogurt type as well as the
factory conditions. However, no matter which method is employed, the fermented dairy
product must be appropriate to national and international standards, additionally be
healthy and has best organoleptic characteristics (Akın 2006). The flow diagram of
manufacturing steps for yogurt production is given in Figure 1.1 and the basic
manufacturing steps for any types of yogurts are as follows:
Filtration: Any cellular matter and other contaminants present in milk are
separated by filtration.

3
Checking the presence of antibiotics: Presence of antibiotics is checked due to
their negative effects on the starter bacteria.
Standardization of milk: Fat and solids-non-fat content in milk are standardized
for good quality yogurt. For this purpose, fat content of milk reduced or increased for
the type of the yogurt. Thus, solids-non-fat content in milk fortified to required level
which is legal standards of the country. Generally, skim milk powder is added to milk or
evaporation under vacuum is used in order to increase the solids-non-fat content.
Homogenization: Milk is homogenized to prevent lypolysis before heat
treatment (Tekinşen 1997). Homogenization causes some chemical changes in milk.
Firstly, fat globule size is reduced so cream line formation is prevented. Secondly,
casein micelles are destroyed by the homogenization, thus, hydrophilicity and water
binding capacity are increased. Then, reduced size of fat globules is adsorbed by casein
micelles so the volume of non-water soluble substances is increased and consequently
viscosity is increased. In addition, protein-protein interaction and salt balance are
changed so as to decrease in the protein stabilization. At the end of the homogenization,
milk became whiter and the yogurt made from that milk is more viscous and flavor is
homogeneously distributed all over the container. However, as a result of phospholipids
in the skim milk phase, pumping of yogurt milk may cause foaming in the incubation
tank (Yaygın 1999).
Heat treatment (Pasteurization): The aim of this process is to eliminate the
pathogens and other undesirable microorganisms, stimulate the starter bacteria and
change the physicochemical properties of the milk constituents such as increasing the
solid level of milk. In addition, heat treatment leads to production of some aroma
compounds. On the other hand, sometimes heat treatment has some disadvantages due
to the formation of some by-products which have an inhibitory effect on the growth of
starter bacteria. Heat treatments at 80-85 ºC for 30 min or 90-95 ºC for 5 min are the
most commonly used in dairy industry. By the heat treatment, pH and oxygen content of
milk are reduced and serum proteins like β–lactoglobulin and α–lactalbumin are
denaturated. Subsequently, hydrophilicity of casein increases and syneresis decreases.
As a result, it is important to choose most appropriate heat treatment for the type of
yogurt process (Akın 2006).
Inoculation: After heat treatment, milk is cooled to 40-45 °C and inoculated with
the starter bacteria, Streptococcus thermophilus and Lactobacillus bulgaricus in 1:1
ratio. Although inoculation level varies between 1-4%, the optimum level is 2%. When

4
the inoculation level is less than 2%, the production of acidity slows down and the
fermentation takes longer than the usual and there may be contamination risk because of
the unsuitable conditions. On the other hand, immoderate inoculation levels result in
fast and too much acidity production that causes unwanted aroma formation as well as
the texture of yogurt breaks.
Inoculation types may differ depending on the production capacity of yogurt
manufacturing plants. The first type is the inoculation of starter culture into yogurt
vessels one by one in small-scale plants. This is the most common method used in
Turkey due to cream formation on the surface of the yogurt. Nevertheless, this method
needs too much manpower, time and may cause any problems such as miss inoculation,
contamination or process conditions which are not the same in all vessels. The second
one is the inoculation of starter cultures in large milk tanks and then filled to yogurt
vessels which leads to the production of more homogenous yogurts. Another method is
the direct injection of yogurt starter cultures in sterile milk tanks and immediately filled
into vessels (Akın 2006, Yaygın 1999).
Incubation (Fermentation): After inoculation, incubation takes place at optimum
temperature of 43 ºC in incubation room or cabinet and process ends between 2.5 and 3
hours. Rarely, at lower temperatures around 30-38 ºC prolong the incubation time up to
7-8 hours which mostly prevent post-acidification and increase the formation of aroma
compounds as well as viscosity. As a result, incubation time affects the quality of final
product (Tamime and Robinson 1985).
Cooling and Storage: If yogurts are not cooled immediately at the end of the
fermentation, starter cultures continue to grow. The acidity continues to decrease and
causes syneresis on the surface of yogurts. Yogurts are generally cooled by two
different ways. These are one-phase cooling and two-phase cooling. In the first one,
yogurts are cooled to 5 or 10 ºC just after fermentation and stored until distribution to
the market. In the second one the temperature decreases to 37 ºC and then 10 ºC.
Finally, all yogurts are stored at 4 ºC for 1-2 days before sale due to maturation of
viscosity and aroma of yogurt (Akın 2006).

5
Figure 1.1. Process for yogurt manufacturing
(Source: Duboc and Mollet 2001)
1.3. Yogurt Types
Yogurt is mainly classified based on its chemical composition (full-fat, reduced-
fat and low-fat), manufacturing type (set and stirred yogurt), flavor type or post-
incubation process. Other types of yogurts found in the market are lactose hydrolysed
yogurt, drinking yogurt, concentrated yogurt, frozen yogurt, carbonated yogurt,
Heat treatment Homogenization
Homogenization Heat treatment
Cool to incubation temperature
Inoculate
Fill retailable containers Fill tank
Fermentation Fermentation
Stir, homogenize
Cool to stop fermentation
Fill containers
Storage
Cool to stop fermentation
Storage
Formulation (protein, fat, sugars additives)
Milk
Set yogurt Stirred yogurt

6
dried/instant yogurt, dietetic/therapeutic yogurt and soy-milk yogurt (Tamime and
Robinson 1985).
Probiotic yogurts gained high popularity during the last two decades due to their
health benefits. Probiotic bacteria are the live microbial feed supplements which
beneficially affect the host animal by improving their intestinal microbial balance.
Lactobacillus acidophilus and Bifidobacterium spp. are most commonly used probiotics
in dairy industry. They secrete lactic and acetic acids, which lower the pH of the colonic
content, help to inhibit the development of invasive pathogens such as E. coli, and also
compete successfully for space and nutrients against pathogenic or putrefactive bacteria.
In addition, high population levels may stimulate the immune system of the host (Akın
2006).
1.4. Yogurt Fermentation
The use of Streptococcus thermophilus and Lactobacillus bulgaricus is partly
historical in origin as they have frequently been isolated from natural yogurt produced
in Middle East where the high ambient temperature has led to the selection of
thermophilic microflora in fermented dairy products. Continuing with the tradition is
reasonable because of synergistic interaction of these organisms (Robinson 1999).
As the bacteria grow, they use lactose as an energy source and produce lactic
acid which lowers the pH and makes the yogurt’s taste as sour. Initially S. thermophilus
ferments the lactose. L. bulgaricus, which is more acid tolerant, continues to ferment the
remaining lactose. During this process the pH drops from 6.5 to around 4.5. This
inhibits the growth of spoilage microbes. The presence of lactic acid causes the
structure of the milk protein to change which gives yogurt its special thickened texture.
The lactic acid also gives the yogurt its sharp taste. Other products of lactic acid
fermentation such as acetaldehyde give the yogurt its characteristic aroma (Tamime and
Robinson 1985).
1.5. Composition of Yogurt
Nutritional content of yogurt is similar to the nutritional content of milk
(McKinley 2005). However, variations in the quality of yogurt depend on the type of
milk. In yogurt production, usually fresh cow’s milk and also sheep milk are used as a

7
raw material. For yogurt production the solids-non-fat (SNF), lactose, protein and
mineral contents of cow’s milk is approximately 8.5-9.0 %, 4.5 %, 3.3%, and 0.7 %,
respectively. Chemical composition of different milk source used in production of
yogurt is given in Table 1.1. The average nutritional contents of full-fat, reduced-fat and
non-fat yogurts are given in Table 1.2.
Table 1.1. Chemical composition of different milk sources used in production of yogurt.
(Source: Akın 2006)
Milk Source
Fat (%)
Water (%)
Total Solids (%)
Protein (%)
Lactose (%)
Ash (%)
Cow 3.7-3.9 87.4 12.7 3.3-3.4 47-4.8 0.7 Goat 4.5 87.0 12.3 2.9-3.3 4.1-4.6 0.6-0.8 Sheep 7.4 81.7 19.3 4.5-5.6 4.4-4.8 0.9-1.0 Buffalo 8.0 82.1 17.9 4.2 4.9 0.8

8
Table 1.2. The average nutritional contents of full-fat, reduced-fat, and non-fat yogurts.
(Source: Akın 2006)
Contents Full-Fat Yogurt Reduced-Fat Yogurt Low-Fat Yogurt
Milk solid non fat (%) - ≥ 8 ≥ 8
Energy kcal 70 84 76
KJ 293 351 318
Water (g) 87.0 78.9 80.0
Protein (g) 3.8 4.0 3.5
Fat (g) 3.8 0.9 0.1
Lactose (g) 4.6 6.3 5.5
Other sugars (g) 0 9.0 10.0
Ash (g) 0.8 0.9 0.9
Calcium (Ca) (mg) 120 130 120
Phosphorus (P) (mg) 92 110 100
Iron (Fe) (mg) 0.46 0.2 0.1
Sodium (Na) (mg) 48 60 60
Potassium (K) (mg) 157 150 150
Vitamin A (IU) 100 32 0
Vitamin B1 (mg) 0.04 0.05 0.03
Vitamin B2 (mg) 0.18 0.20 0.15
Niacin (mg) 0.1 0.1 0.1
Proteins and minerals (calcium and phosphorus) increase the basic structure of
gel. Therefore, lactose is the main energy source for the starter culture (Robinson 1999).
Nevertheless, composition of fresh milk varies from day to day due to several factors
such as feeding type, age and health of animal, climatic conditions and also season of
the year. Hence, milk has to be standardized in order to overcome these compositional
variations of milk (Tamime and Robinson 1985).
Due to nutritional similarity between yogurt and milk, yogurt is the best
alternative in human diet being an excellent source of protein, calcium, phosphorus,
riboflavin (vitamin B2), thiamin (vitamin B1), vitamin B12 and also folate, niacin,
magnesium and zinc (McKinley 2005).

9
1.5.1. Total Solids Content
In general, high levels of solid in yogurt increase viscosity of the end-product.
As a result, milk is fortified before yogurt production. Optimum total solids content in
yogurt should be 15-16%. There are several methods for the fortification of milk.
Traditionally, skim milk powder (SMP) is used to enrich the milk before fermentation.
However, availability of other dairy ingredients, such as whey protein concentrates
(WPCs), may provide a cost-effective alternative to skim milk powder. Evaporation of
milk is commonly used method to obtain the desirable total solids content. The removal
of water from the milk under vacuum improves the stability of the coagulum and
reduces syneresis during storage. Moreover, evaporation of goat’s milk not only
improves the consistency, but also reduces the goaty flavor of the end-product (Tamime
and Robinson 1985).
1.5.2 Carbohydrates
Lactose is the dominant disaccharide in milk comparing to other mono- and
disaccharides present in yogurt. The yogurt fermentation uses only a small proportion of
the milk lactose and, as a result, yogurt normally has low lactose content (3-4%). The
presence of (initially) viable starter cultures in yogurt can be beneficial to lactose
utilization since lactose in milk provides as the energy source for yogurt starter cultures
(Tamime and Robinson 1985).
Lactose is utilized by the starter cultures especially Streptococcus thermophilus.
The amount of lactase (β-galactosidases) activation of Streptococcus thermophilus is 3
fold more than Lactobacillus bulgaricus’ lactase activation and it increases during
incubation. In human body, lactose is hydrolyzed into glucose and galactose by the
intracellular β-galactosidases in small intestine. However, hydrolysis rate of lactose is
slower than other sugars so that lactose cannot be hydrolyzed completely.
1.5.3. Lactic Acid
Lactic acid is the end product of lactose hydrolysis. Lactose can hydrolyze by
homofermentative and heterofermentative ways. Differences in the amount of lactic
10
acid produced depend on the starter culture, milk type, and manufacturing and storage
conditions.
Furthermore, lactic acid is produced in D(-) and L(+) forms. L(+) lactic acid is
produced during the early fermentation. In contrast, D(-) lactic acid production starts
from about the second hour of fermentation and increases continuously. High
fermentation temperature and long time storage can cause an increase in the
concentration of D(-) lactic acid, thus, the ratio of L(+) / D(-) decreases. On the other
hand, World Health Organization (WHO) reported that there is no limit for the
consumption of L(+) lactic acid. On the contrary, the concentration of D(-) lactic acid
that could be taken per day should be 0-100 mg/kg body weight and should not be used
in infant and children diet due to low digestion (Akın 2006).
It is agreed that the typical yogurt flavor is caused by lactic acid which imparts
an acidic and refreshing taste (Chaves, et al. 2002). Besides, more important trait is that
its increasing effect on regulation of hydrolysis of casein, and adsorption of some amino
acids, peptides, lactose and minerals as well. Other organic acids present in yogurt are
mainly citric and acetic acids, fatty acids and hypuric acid which is present in skim milk
(Akın 2006).
1.5.4. Protein
Lactic acid bacteria partially hydrolyze proteins and the amount of free amino
acids in fermented dairy products increase. Moreover, pre-hydrolysis of these proteins
may be useful for people who are lacking of digestion enzymes. Therefore, proteins of
yogurt are more digestible than the proteins found in milk even though the protein
contents of milk and yogurt are similar. This makes yogurt more preferable than liquid
milk (Akın 2006).
Protein in milk plays an important role in the formation of coagulum. As a
result, viscosity of the product is directly proportional to the level of protein present
(Tamime and Robinson 1985). Heat treatment in the manufacturing of yogurt may cause
protein denaturation which induces the reduction of immunological disease. In addition,
decrease in the amount of the urea in the manufacturing is beneficial to nutritional value
of yogurt (Akın 2006).

11
1.5.5. Fat
The fat content of yogurt varies from 0.1% to 10% depending on the yogurt
standards described by each country in the World (Tamime and Robinson 1985). Either
homogenization of milk or lypolysis eases the digestion of fat present in acidic milk
products. Yogurt manufacturing using cow’s milk leads to an increase in saturated fatty
acid content, but a decrease in total acid content. The contents of stearic, oleic, linoeic,
and palmitic acids decrease. Volatile fatty acids have an important effect on
organoleptic properties of yogurt, but have limited nutritional value. The volatile fatty
acid content of raw milk and yogurt are given in Table 1.3.
Table 1.3. Volatile fatty acid content of raw milk and yogurt.
(Source: Akın 2006)
Raw Milk Yogurt Volatile Fatty Acids
mg % mg %
Citric acid 229.6 89.4 232.40 28.1
Lactic acid 8.82 3.4 486.45 58.9
Succinic acid 0 0 18.95 2.3
Fumaric acid 1.10 0.4 8.41 1.0
Categlutaric acid 0.74 0.3 0.87 0.1
Pyruvic acid 0.09 0 2.38 0.3
Formic acid 1.33 0.5 19.51 2.4
Acetic acid 8.35 3.2 43.80 5.3
Propionic acid 0.74 0.3 1.78 0.2
n-Butyric acid 0.35 0.1 0.70 0.1
n-Valeric aid 0.20 0.1 - 0
Caproic acid 1.04 0.4 1.32 0.2
Caprylic acid 2.88 1.1 6.63 0.8
Lauric acid 1.72 0.7 2.58 0.3

12
1.5.6. Vitamins and Minerals
Vitamins act as co-factors in metabolic reactions. Fermented dairy products are
rich sources of vitamins. The yogurt starter cultures utilize some vitamins present in
milk during fermentation for their growth. This factor contributes to a reduction of the
nutritional properties of the product. However, the quantities consumed depend on the
rate of the inoculation, the strain of yogurt starter cultures and the fermentation
conditions (Tamime and Robinson 1985).
Folic acid (Vitamin B9) is the most important vitamin for some lactic acid
bacteria. Folic acid produced by S. thermophilus in milk fermentation, is subsequently
used for growth of L. bulgaricus. By selecting high folic acid-producing strains or by
using relatively high amounts of S. thermophilus compared to L. bulgaricus,
manufactured yogurts could contain high folic acid (Tamime and Robinson 1985).
Since folic acid is an essential component in human nutrition, it is important to get
enough folic acid in diet. However, it is conspicuously absent or present at very low
levels in many food products, so yogurts manufactured using high folic acid producing
strains have critical importance.
Concentration of Vitamin B is generally higher in fermented milk products, but
yogurt made from skim milk may sometimes have less Vitamin B. Although milk
contains low levels of ascorbic acid (vitamin C), it is lost almost completely during
manufacturing as well as transportation. The vitamin content of yogurt depends on milk
type, animal feeding, medium composition, manufacturing process, fermentation
conditions and starter culture activation (Tamime and Robinson 1985). The vitamin
content of milk and yogurt is given in Table 1.4.
Generally, the mineral content of yogurt is similar to milk. Yogurt is an
excellent calcium source for people suffering from lactose intolerance. Moreover,
calcium supplied by yogurt may be better absorbed and utilized than calcium made
available in other forms (McKinley 2005).
The acidity of yogurt is thought to increase the absorption of certain minerals
including calcium, phosphorous and magnesium compared with other dairy products
and may reduce the inhibitory effect of some compounds such as phytic acid which is
known to interfere with mineral absorption (particularly calcium). Yogurt is also good
source of phosphorus which serves many functions in the body and is necessary for
healthy bones and teeth as well as energy production, cell membrane structure, tissue

13
growth and regulation of pH levels in the body. Magnesium, potassium, zinc, selenium,
iron, iodine and chloride are also found in yogurt (The Dairy Council 2007).
Table 1.4. Vitamin contents of milk and yogurt.
(Source: Tamime and Robinson 1985)
Milk Yogurt Vitamins (Units/100 g)
Whole Skim Full Fat Low Fat
Vitamin A(IU) 148 - 140 70
Thiamin (B1)(µg) 37 40 30 42
Riboflavin(B2)(µg) 160 180 190 200
Pyridoxine(B6)(µg) 46 42 46 46
Cyanocobalamine(B12)(µg) 0.39 0.4 - 0.23
Vitamin C(mg) 1.5 1.0 - 0.7
Vitamin D(IU) 1.2 - - -
Vitamin E(IU) 0.13 - - Trace
Folic acid(µg) 0.25 - - 4.1
Nicotin acid(µg) 480 - - 125
Pantothenic acid(µg) 371 370 - 380
Biotin(µg) 3.4 1.6 1.2 2.6
Choline(mg) 12.1 4.8 - 0.6

14
CHAPTER 2
STARTER CULTURES AND FERMENTATION OF YOGURT
2.1. Yogurt Starter Culture
Lactic acid bacteria are able to lower pH rapidly by acid production. They
produce many flavor compounds which are commonly used in food and feed industry.
Lactic acid bacteria used for yogurt production are thermophilic, such as Streptococcus
salivarius ssp. thermophilus (Streptococcus thermophilus) and Lactobacillus
delbrueckii ssp. bulgaricus (Lactobacillus bulgaricus). In some countries, Lactobacillus
helveticus and Lactobacillus delbrueckii ssp. lactis are sometimes mixed with the starter
culture (McKinley 2005). Yogurt is generally inoculated with 1:1 ratio of Streptococcus
thermophilus and Lactobacillus bulgaricus (Tamime and Robinson 1985). The growth
association between Streptococcus thermophilus and Lactobacillus bulgaricus is termed
symbiosis. The rate of acid production in mixed culture is greater than the rate of acid
production using single strain (Tamime and Robinson 1985). The growth of yogurt
starter bacteria is given in Figure 2.1.
These organisms are claimed to impart nutritional and health benefits to
consumers due to their probiotic activities which are able to proliferate or even survive
for a long period of time in human gastrointestinal tract (Gardini, et al. 1999). “The
main role of yogurt starter culture in the production of yogurt is acidification through
the conversion of lactose into lactic acid, creation of the viscous texture by the
production of exopolysaccharides, and development of the typical yogurt flavor”
(Chaves, et al. 2002).

15
Figure 2.1. The growth of Yoghurt Starter Bacteria.
(Source: Tamime and Robinson 1985)
2.1.1. Streptococcus salivarius ssp. thermophilus (Streptococcus
thermophilus)
Streptococcus thermophilus (S. thermophilus) belongs to the thermophilic group
of lactic acid bacteria. It is normally in association with one or several Lactobacillus
species. S. thermophilus is Gram-positive, spherical to ovoid, nonmotile coccus, 0.7-0.9
µm in diameter, occurring in pairs and chains. The bacterium has an optimum growth
temperature of 37-42 ºC. It ferments a limited number of sugars including lactose,
fructose, sucrose and glucose. S. thermophilus is highly adapted to the dairy
environment and in the wild, can only be isolated from milk. It is found at low levels in
raw milks obtained from a variety of animals. S. thermophilus shares many phenotypic
and genetic properties of the other lactic acid bacteria mostly S. salivarius, although
there is a difference in the species level by DNA-DNA hybridization (Kılıç 2001).
S. thermophilus is a homofermentative bacterium, fermenting lactose via the
Embden-Meyerhof-Parnas pathway (EMP) to L(+) lactic acid. When it is grown in
milk, lactose is transported into the cell in association with the removal of galactose via
an antiport system. Lactose is hydrolyzed by β-galactosidase, but only glucose is
metabolized further via the EMP to L(+) lactic acid.
Although S. thermophilus has a protein-rich habitat, its proteolytic activity is
limited. S. thermophilus strains require free amino acids for growth. These include

16
glutamic acid, histidine, methionine, cysteine, valine, leucine, isoleucine, tryptophan,
arginine and tyrosine. These bacteria grow well on media containing hydrolyzed protein
(Robinson 1999).
S. thermophilus tends to have fewer plasmids than other lactic acid bacteria. The
plasmid-free state is more common and observed plasmids are small. In contrast to the
mesophilic lactococci where plasmids determine metabolic functions critical for use in
dairy fermentations, S. thermophilus plasmids are usually cryptic. The largest S.
thermophilus plasmid described is 25.5 Kb (Salminen, et al. 2004).
S. thermophilus is traditionally paired with L. bulgaricus in the manufacturing of
yogurt. The typical yogurt flavor is due to the lactic acid in combination with various
carbonyls and other compounds produced by thermal degradation of lipids, lactose and
proteins during heat treatment of milk. A major metabolite of S. thermophilus and
contributor to yogurt flavor is acetaldehyde. The acetaldehyde/acetone ratio in the
yogurt is important in determining flavor balance (Tamime and Robinson 1985).
2.1.2. Lactobacillus delbrueckii ssp. bulgaricus (Lactobacillus
bulgaricus)
Lactobacillus bulgaricus (L. bulgaricus) is first defined by Bulgarian scientist
Grigoroff in 1900. Owing to similarities like G+C ratio in DNA structure, lactic acid
production and concentration, cell wall structure, almost same with Lactobacillus
delbrueckii spp. lactis, it is hard to differentiate L. bulgaricus morphologically.
However, L. bulgaricus cannot utilize maltose unlike L. lactis.
L. bulgaricus is isolated from cheese and fermented milk products and ferments
the smallest range of carbohydrates (glucose, lactose and fructose). Like S.
thermophilus, it is Gram-positive, but occurs in milk as short rods 0.5-0.8 µm x 2.0-9.0
µm with rounded ends. It has a homofermentative metabolism and gives D(-) lactic
acid. The optimum growth temperature is 42-45 ºC (Robinson 1999).
L. bulgaricus is galactose-negative. When growing in milk it transports the
lactose into the cell in association with the expulsion of galactose via an antiport
system, similar to S. thermophilus. Inside the cell, lactose is hydrolyzed by β-
galactosidase with only glucose being fermented to D(-) lactate via the EMP.
L. bulgaricus is more proteolytic than S. thermophilus and milk provides a range
of amino acids that stimulate the growth of S. thermophilus strains. The growth of L.
17
bulgaricus in milk benefits from the stimulation of formic acid and possibly carbon
dioxide and pyruvate produced by S. thermophilus (Robinson 2002).
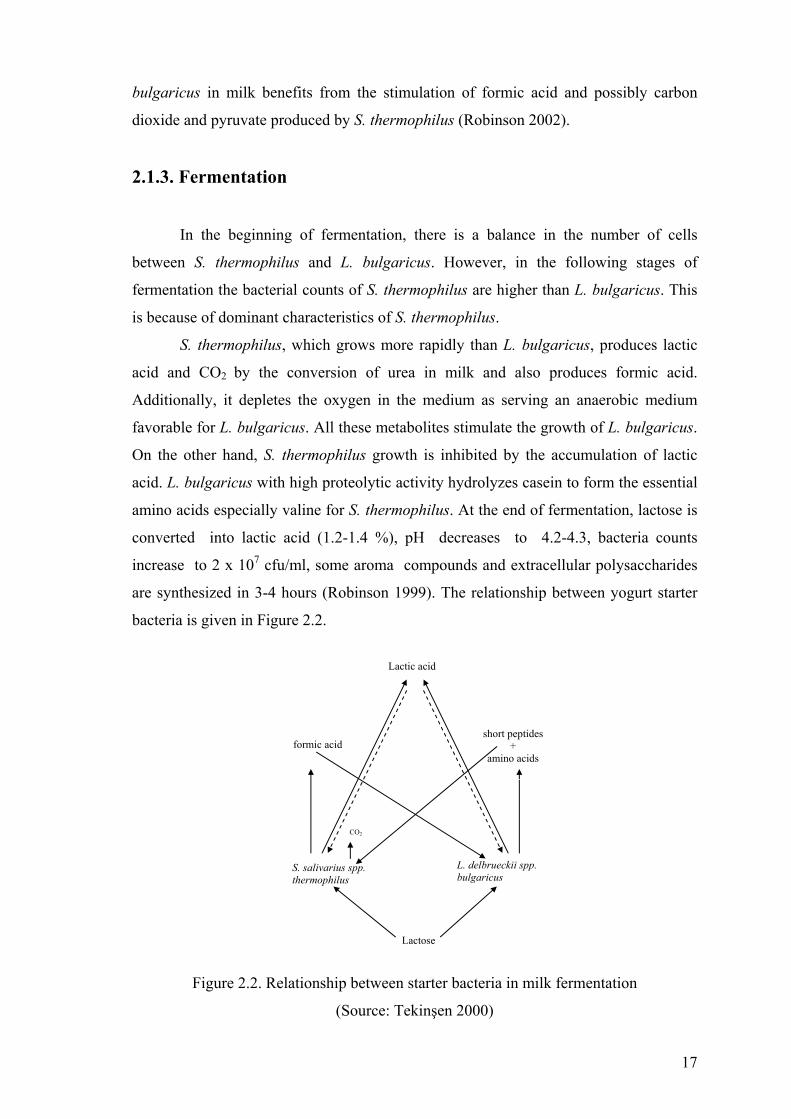
2.1.3. Fermentation
In the beginning of fermentation, there is a balance in the number of cells
between S. thermophilus and L. bulgaricus. However, in the following stages of
fermentation the bacterial counts of S. thermophilus are higher than L. bulgaricus. This
is because of dominant characteristics of S. thermophilus.
S. thermophilus, which grows more rapidly than L. bulgaricus, produces lactic
acid and CO2 by the conversion of urea in milk and also produces formic acid.
Additionally, it depletes the oxygen in the medium as serving an anaerobic medium
favorable for L. bulgaricus. All these metabolites stimulate the growth of L. bulgaricus.
On the other hand, S. thermophilus growth is inhibited by the accumulation of lactic
acid. L. bulgaricus with high proteolytic activity hydrolyzes casein to form the essential
amino acids especially valine for S. thermophilus. At the end of fermentation, lactose is
converted into lactic acid (1.2-1.4 %), pH decreases to 4.2-4.3, bacteria counts
increase to 2 x 10⁷ cfu/ml, some aroma compounds and extracellular polysaccharides
are synthesized in 3-4 hours (Robinson 1999). The relationship between yogurt starter
bacteria is given in Figure 2.2.
Lactic acid
Lactose
L. delbrueckii spp. bulgaricus
S. salivarius spp. thermophilus
short peptides+
amino acids formic acid
CO2
Figure 2.2. Relationship between starter bacteria in milk fermentation
(Source: Tekinşen 2000)

18
These two organisms give a characteristic flavor to yogurt which any other
fermented milk products have. It is due to mainly acetaldehyde production by S.
thermophilus and more extendedly L. bulgaricus. There are two possible pathways for
the production of acetaldehyde. First one is the conversion of threonine to glycine by
threonine aldolase. Second metabolic pathway may be the transformation of pyruvate
by α-carboxylase that results in acetaldehyde production. The rate of formation of
acetaldehyde by these two organisms depends on not only many chemical and
environmental factors but also strain type. Other compounds such as diacetyl, acetone,
free fatty acids, amino acids, keto and hydroxy acids produced by starter cultures
contribute to the flavor of yogurt as well.
In addition to flavor compounds, yogurt starter cultures produce extracellular
polysaccharides like glucans or polymers consist of glucose, galactose and rhamnose in
different ratio. These by-products enhance the texture of yogurt.
CH3.CH(OH).CH(NH2).COOH CH2.(NH2)COOH + CH3.CHO Threonine Glycine Acetaldehyde

19
CHAPTER 3
TEXTURE
3.1. Texture of Yogurt
The texture of yogurt is a crucial attribute for consumer acceptance (Britten and
Giroux 2001). The texture of yogurt is based on the amount and functionality of the
individual components comprising yogurt gel, and on the interaction between the
components as well as on the technological steps in the production process. Moreover,
milk composition and process influence yogurt stability and rheological properties such
as firmness, consistency, adhesiveness, and cohesiveness (Tamime and Robinson 1985).
To improve texture and prevent syneresis, stabilizers and polysacharide-producing
cultures have been used (Escalante, et al. 1998).
Denaturation of protein during heat treatment of milk is an advantage in yogurt
production because it increases the binding between water and protein molecules. As a
result, texture of yogurt improves. However, fat solids reduction in yogurt has been
associated with poor texture, where the fat removed is commonly substituted by skim
milk powder, sodium caseinate, or whey protein concentrates (WPCs) (Tamime and
Robinson 1985). Addition of milk solids is a routine method to improve the texture of
milk products. As an alternative method to improve texture, whey protein concentrates
(WPCs) may provide increased quality. Even though the effect of WPCs on texture and
physical properties of yogurt is inconsistent due to opposite results by some authors,
one of the studies reported that WPCs enrich the water-binding capacity of yogurts
(Sodini, et al. 2005). Therefore, a novel process transglutaminase (TG) addition in
fermentation is used to strengthen the gel formation of yogurt providing the cross-
linking of protein molecules (Bönisch, et al. 2007).
Ünal et al. (2003) investigated the addition of polysaccharide such as locust
bean gum (LBG) into milk and its effect on physical properties by response surface
methodology. The researchers found that the amount of LBG and dry matter content
were critical because overdose could cause decrease in viscosity and increase in
syneresis.

20
Syneresis (whey separation) on the surface of set type yogurt is considered as a
defect. Using ropy-EPS (ropy-exopolysaccharide) producing starter cultures, syneresis
could be overcome since non-EPS starter cultures had the highest level of syneresis
(Amatayakul, et al. 2006).
Many processing problems such as low viscosity and high syneresis, which
occur during yogurt production, may be solved by increasing the total solids of milk or
addition of stabilizers such as LBG. However, fortification of milk by these ingredients
may affect the taste and aroma of the final product adversely. Moreover, the use of
some stabilizers are restricted or prohibited in some European countries (Amatayakul, et
al. 2005). For this reason, EPS-producing starter cultures are preferred as they improve
the rheological properties of fermented milk. The gel structure and viscosity of the
products are affected by the gel formation conditions, as well as the amount and the
type of the EPSs produced. Ropy EPS-producing strains also increase the viscosity of
yogurt when compared to yogurt made with non-ropy cultures and improve the texture
(Marshall and Rawson 1997). The rheological behavior of the polysaccharides is also
related to their three-dimensional structure. In addition to the viscosifying effect of the
polysaccharides, the interactions between the EPSs and the milk proteins, e.g. caseins,
also play a role in the improvement of the texture. The microorganisms and/or the EPSs
that they produce may affect the protein aggregation, thereby affecting the physical
properties of the milk gel. One of the recent studies showed that the rheological
properties of stirred yogurt were affected by the type of EPS producing strains used,
suggesting an effect due to the interaction between the polymer and milk proteins
(Marshall and Rawson 1999).
3.2. Polysaccharides
Polysaccharides are defined as high molecular-weight polymers composed of
saccharide subunits. The chemical reactions and pathways resulting in the formation of
polysaccharides, polymers of more than 10 monosaccharide residues are joined by
glycosidic linkages (Telefoncu 1992). In the major classification, there are two types of
polysaccharides synthesized by organisms. These are intracellular polysaccharides and
extracellular polysaccharides. Intracellular polysaccharides are produced by plants
(starch, inulin), animals (glycogen), and microorganisms (glycogen). Extracellular

21
polysaccharides (exopolysaccharides EPS) occur widely among bacteria and microalgae
and less frequently among yeasts and fungi (Degeest and De Vuyst 2000).
3.3. Exopolysaccharides
Like any other bacteria, lactic acid bacteria are able to produce several types of
polysaccharides that are classified according to their location in the cell (Degeest, et al.
2001). Microbial exopolysaccharides occur as capsules (capsular exopolysaccharides
CPS) which are covalently bounded to the cell surface or secreted as slime form in cell
environment. Some bacteria produce only capsular EPS, but some produce only slime
(ropy) form, whereas, in some cases, bacteria can produce both forms of EPSs (Yang, et
al. 1999, Broadbent, et al. 2003). The mesophilic heteropolysaccharide producing lactic
acid bacteria have much more widespread ability to form CPS than the thermophilic
heteropolysaccharide producing ones. However, synthesis of CPS and ropy behavior is
almost strain dependent (Mozzi, et al. 2006).
Bacterial exopolysaccharides (EPSs) are long-chain polysaccharides consisting
of branched, repeating units of sugar derivates which are mainly glucose (D-glucose),
galactose (D-galactose), rhamnose (L-rhamnose), mannose, N-acetylglucosamine, N-
acetylgalactosamine, D-glucuronic acid etc. in different ratios (Welman and Maddox
2003, Vaningelgem, et al. 2004a).
3.4. Chemical Composition of EPS Produced by Lactic Acid Bacteria
In the beginning of the EPS studies, it was found that EPS was a molecule like
protein. The following studies had showed that EPS had a carbohydrate structure with
α- and β-linkages in different types. That difference depends on the formation of main
carbohydrate molecules (D-galactose, D-glucose and L-rhamnose) present in different
ratios. Moreover, EPS-producing lactic acid bacteria can produce not only one type of
polysaccharide but also different types of polysaccharides due to fermentation
conditions. In addition, it is possible that same strain is able to produce high-molecular-
mass and low- molecular-mass EPS fractions which do not differ in monomeric
composition (De Vuyst and Degeest 1999).
The basic structures of EPS units from some type of S. thermophilus and L.
bulgaricus are given in Figure 3.1.

22
Figure 3.1. Structure of the EPS Subunits (a) Structure of the EPS subunit from Streptococcus thermophilus SY89 and SY102. (b) Structure of the EPS subunit from Streptococcus thermophilus IMDO1, IMDO2, IMDO3, NCFB 859 and strain `21'. (c) Structure of the EPS subunit from Lactobacillus delbrueckii subsp. bulgaricus strains LY03, strain `24' and strain `25' (Source: Marshall, et al. 2001)
3.5. Classification of EPS Produced by Lactic Acid Bacteria
Depending on their composition and mechanism of biosynthesis, bacterial EPSs
can be divided into two classes: homopolysaccharides (HoPS) and
heteropolysaccharides (HePS).
3.5.1. Homopolysaccharides
Homopolysaccharides are the polymers composed of one type of
monosaccharide (Vaningelgem, et al. 2003). HoPS are subdivided into four groups: α-
D-glucans such as dextrans composed of mainly α-1,6-linked glucose molecules and
generally produced by Leuconostoc mesenteroides subsp. mesenteroides, Leuconostoc
mesenteroides subsp. dextranicum, Streptococcus mutans and Streptococcus sobrinus ,
β-D-glucans composed of β-1,3-linked glucose molecules and produced by Pediococcus
spp. and Streptococcus spp., fructans, composed of β-2,6-linked D-fructose molecules
like levan produced by S. salivarius and finally others that are mainly polygalactans

23
composed of structurally identical repeating units with different glycosidic linkages.
HoPSs are synthesized in the presence of a specific substrate such as sucrose. By the
way, the energy needed is provided by the hydrolysis of sucrose (De Vuyst and Degeest
1999).
3.5.2. Heteropolysaccharides
Heteropolysaccharides are the polymers of repeating units that are composed of
two or more types of monosaccharides (Degeest, et al. 2001, Welman and Maddox
2003, Vaningelgem, et al. 2003). They often differ from HoPSs by monosaccharide
composition, linkage types between polymer units, branching, molecular weight,
monosaccharide charge and also by the ability to interact with milk proteins
(Vaningelgem, et al. 2004a). HePS synthesis is different from HoPS synthesis due to
formation of intracellular precursor repeating units and having isoprenoid glycosyl
carried lipids in the process (Ruas-Madiedo and Reyes-Gavilan 2005). The structure of
the repeating unit of a LAB heteropolysaccharide produced by S. thermophilus was first
determined. The molecular mass of HePS varies from 104 to 9x10⁶ Da (Vaningelgem, et
al. 2004a).
HePS are mainly produced by mesophilic lactic acid bacteria such as
Lactococcus lactis, Lactobacillus sakei, Lactobacillus rhamnosus, and Lactobacillus
casei and thermophilic lactic acid bacteria such as Lactobacillus acidophilus,
Lactobacillus delbrueckii subsp. bulgaricus, Lactobacillus helveticus, and
Streptococcus thermophilus (Yang, et al. 1999, Vaningelgem, et al. 2004a). Although
HePSs are strain dependent, their production are influenced by the environmental
conditions like bacterial growth phase, medium composition (carbon and nitrogen
source), pH and temperature (Vaningelgem, et al. 2004b, Aslım, et al. 2006). As EPS
production is growth associated in thermophilic LAB strains, the EPS biosynthesis
pathway is very complex (De Vuyst, et al. 1998). As a result, it is necessary to elucidate
either which factor has a considerable effect or in which step of the EPS biosynthesis
leads to a production of different polymer product. Furthermore, the EPS produced by
lactic acid bacteria is unstable as a result of environmental factors.
Cerning et al. (1992) studied the influence of the carbon source on the
production of EPS by ropy strains of L. lactis ssp. lactis CNRZ in milk and reported that
incubation at 25 °C instead of 30 °C and addition of 5% glucose stimulated EPS

24
production although the cell numbers were low. Some other researchers optimized the
fermentation conditions for S. thermophilus LY03. According to the results of this
study, fermentation temperature of 42 °C, constant pH of 5.5 and peptone and yeast
extract as a nitrogen source equilibrated with carbon source are the most important
fermentation parameters that best EPS yield (352 mg polymer dry mass (PDM) / L) was
obtained under these conditions (De Vuyst, et al. 1998). Similar results were determined
by Degeest and De Vuyst (2000), but additionally it was reported that any of the
carbohydrate source had an effect on the monomer composition of EPS produced by S.
thermophilus LY03. Moreover, the enzymes such as α-phosphoglucomutase, UDP-
galactose 4-epimerase, and UDP-glucose pyrophosphorylase involved in the
biosynthesis of EPS were stimulated by the certain type of carbon source (glucose for S.
thermophilus LY03) which was depended on the strain. As a conclusion, under these
circumstances the amount of EPS production was increased.
3.6. EPS Phenotypes
EPS phenotype is described as the bacteria having ropy or slime characteristics,
for instance, EPS-producing bacteria is generally known as ropy strains. There are many
ways to determine the ropiness of the bacteria. One of them is the measurement of
macroscopic appearance of ropy EPS-producing lactic acid bacteria on the surface of
agar plates. By this method, the resistances to flow through serological pipettes and
structure of viscous strands during free fall from pipette tips are measured. Another
method is to determine the ropiness of strain grown on ruthenium red milk agar by its
color since ruthenium red stains the bacterial cell wall and the colonies grown on the
agar surface are pink in nonropy strains. In contrast, white colonies are ropy strains
(Stingele, et al. 1996). However, in the study of Lactobacillus delbrueckii spp.
bulgaricus CNRZ 1187 showed that white (ropy) colonies produce less EPS than pink
colonies (Bouzar, et al. 1996). As a result, ruthenium red is not able to differentiate all
types of EPS-producing strains. Moreover, ruthenium red method was developed for
ropy strains of Streptococcus thermophilus and also valid for certain types of EPS
(Bouzar, et al. 1996). Confocal scanning laser microscopy (CSLM), scanning electron
microscopy (SEM) techniques are not only used for the determination of the EPS
phenotype but also used for the determination of rheological properties of fermented
milk product (Hassan, et al. 2002, Goh, et al. 2005a).
25
3.7. Biosynthesis of EPS by Lactic Acid Bacteria
EPS biosynthesis is explained by the sugar conversion (gylcolysis) like other
cell polysaccharides which is generally used for the cell wall. EPSs are synthesized by
the bacteria in the cytoplasm. In addition, the EPS biosynthesis is an energy demanding
process. The polymerization of the repeating unit is complex and involves several
enzymes and proteins consecutively. Phosphoglutomutase (PGM) is an enzyme which
has an important role in the conversion of glucose-6-phosphate to glucose-1-phosphate,
between the catabolic and anabolic pathways of sugar conversion. The sugar
nucleotides are formed by Glucose-1-phosphate due to serve as a branch point which is
necessary for monosaccharide polymerization. Subsequently, the monosaccharide
repeating unit is carried by several EPS specific enzymes. At last, several gene products
on the EPS gene cluster (glycosyl-transferases) provide sugars to link so as to form the
repeating unit. However, the mechanism of polymerization of the repeating unit in
LAB, and its subsequent export from the cell, is unclear (Marshall, et al. 2001, Welman
and Maddox 2003).
The total yield of EPS produced by lactic acid bacteria strains varies between
0.150 to 0.600 g/L under optimum growth conditions (Degeest, et al. 2001). In addition,
growth conditions and medium composition have effects on the total yields of EPS.
However, EPS producing ability is not a stable characteristic by some lactic acid
bacteria because of the loss of plasmids especially in the mesophilic strains (Bouzar, et
al. 1997).
Although there are many researches about the determination of amount of EPS,
monomer composition and also the EPS production ability of single strain lactic acid
bacteria, there were limited number of studies about mixed strains behavior. Bouzar et
al. (1997) reported that EPS in mixed-strain cultures was produced faster than in single-
strain cultures and that the composition of the EPS is very different. EPS biosyntesis
diagram is given in Figure 3.2.

26
Figure 3.2. Diagram of the conversion of lactose, galactose and glucose to EPS and to
glycolysis in lactic acid bacteria (glucose uptake not shown). In lactose utilizing galactose negative strains (e.g. Lactobacillus delbrueckii subsp. bulgaricus), galactose is not metabolized and is expelled from the cell via a lactose/galactose antiport system. (Source: Welman and Maddox 2003).
3.8. Isolation and Quantification Methods of EPS
Lactic acid bacteria fermentation in milk results in formation of weak gel due to
aggregation of casein micelles and also complex medium comprised bacterial cells,
lactose, lactic acid and other components mainly EPS. For this reason, careful isolation

27
and purification is necessary so as to separate EPS from non-EPS components in
fermentation medium (Goh, et al. 2005b).
There are several EPS isolation methods present and choosing the most
appropriate method for EPS isolation and purification depends on the complexity of the
culture medium. Among them, dialysis against water is the simplest one. In this method,
bacterial cells are centrifuged and then ethanol or acetone precipitation for protein
removal may be used to concentrate the EPS produced by thermophilic and mesophilic
lactic acid bacteria strains. If the medium is more complex, additional purification is
needed to reduce protein content and other components that have to be removed. For
this purpose, generally trichloroacetic acid (TCA) (De Vuyst, et al. 1998, Marshall and
Rawson 1999, Amatayakul, et al. 2006), some type of enzymes such as pronase E from
Streptomyces griseus (Bouzar, et al. 1996, Bouzar, et al. 1997) or membrane filtration
techniques such as microfiltration, ultrafiltration (UF) and diafiltration are used (Yang,
et al. 1999).
In the TCA method, EPS is concentrated with ethanol or sometimes with
acetone (Stingele, et al. 1996, De Vuyst, et al. 1998). The aim of enzyme digestion is to
hydrolyze or precipitate the proteins. Heat treatment is sometimes followed after
pronase treatment and then UF or evaporation is used. In this method, TCA and enzyme
precipitation may be used consecutively. Filtration methods have centrifugation, ethanol
precipitation steps and also filtration through synthetic membrane due to purification of
EPS. In addition, in some cases, other treatments such as ion-exchange columns, Dnase
digestion (Shihata and Shah 2002), SDS-PAGE protein removal, size exclusion
chromatography are used because highly pure EPS is required (Ruas-Madiedo and
Reyes-Gavilan 2005).
After the isolation step, EPS production can be expressed as the dextran
equivalent miligrams of dextran per milliliter. Even though dextran and phenol-
sulphuric acid methods are commonly used, proteins and other carbohydrates which are
not EPS could be determined using these methods. Although these methods are simple
and cheap, they always have a risk of determination of low molecular weight
carbohydrates. In order to decrease inaccuracy, HPLC method is used. Recently, near-
infrared spectroscopy (NIRS) method is used for the lactose, lactic acid and EPS yields
in culture media. The results of this method show high correlation coefficients with
HPLC and phenol sulphuric acid method. NIRS method could be useful for rapid
monitoring of EPS and lactic acid production (Ruas-Madiedo and Reyes-Gavilan 2005).

28
The monomer composition, the sequence and ring size of the constituting
monosaccharides, the location of the glycosidic linkages and the type of
noncarbohydrate structure constituents determine the primary structure of EPS
molecule. Therefore, the qualitative and quantitative determinations of EPS
monosaccharides are determined by HPLC (Degeest, et al. 2002), high-performance
anion-exchange chromatography pulse amperometric detection (HPAEC-PAD) and gas
chromatography/mass spectrometry (GC/MS) (Ruas-Madiedo and Reyes-Gavilan
2005). HPLC involves separation of monosaccharides by ion-exchange columns.
HPAEC-PAD is used for the identification and quantification of mono- and
oligopolysaccharides. Moreover, it is very sensitive and selective for the analysis of
sugar compounds although having the low resolving power is the main disadvantage
(Ruas-Madiedo and Reyes-Gavilan 2005).
The molar mass of EPS is generally determined by gel permeation
chromatography or alternatively fast protein liquid chromatography (FPLC) in which
EPS concentration determined by phenol sulphuric acid and than molar mass and radius
gyration (Rg) simultaneously determined by gel permeation chromatography using a
multiangle laser light scattering detector coupled online with the refractive index (RI)
detector in the HPLC system (Ruas-Madiedo and Reyes-Gavilan 2005).
As a conclusion, researchers have been combining all these methods in order to
isolate, purify and quantify the EPS. For this purpose, Goh et al. (2005b) tried to
improve the EPS assay that gave reproducible results with higher accuracy. This assay
was based on the comparison of the methods that were widely used for EPS isolation.
This assay includes the Flavourzyme for protein hydrolysis, optimum ethanol
concentration for maximum dextran recovery and most appropriate centrifugation
regime to minimize EPS loss.
3.9. Effects of EPS Production on Rheological Properties of Yogurt
The use of EPS-producing cultures is commonly used as a substitute for
commercial stabilizers in yogurt manufacturing due to reduction of syneresis and
improvement of product texture and viscosity. Some researchers reported that some
EPS-producing (ropy) lactic acid bacteria showed a higher viscosity and a lower degree
of syneresis compared with non-EPS-producing lactic acid bacteria (Bouzar, et al. 1996,
Folkenberg, et al. 2006). In contrast, several studies reported that no direct correlation

29
was found between the amounts of EPS produced by strain and the rheological
properties of fermented milk products. However, rheology of fermented milk product
depends not only on the quantity of EPS present, but also on the structure and apparent
molecular mass of the polymer and the physical state of the proteins, particularly
caseins (Hassan, et al. 2003, Petry, et al. 2003, Welman and Maddox 2003). Therefore,
the increase in viscosity may be related to the changes in physical properties of the milk
proteins due to the pH decline (Aslım, et al. 2006).
3.10. Applications of EPSs Produced by Lactic Acid Bacteria
The exact functions of EPS for the bacterial cells have not been completely
elucidated. It is known that EPSs not only play a role in the protection of the microbial
cells against desiccation, phagocytosis and phage attact, antibiotics or toxic compounds,
but also have lots of benefits for human health and for applications in dairy industry.
Some studies have indicated that EPS may have immunostimulatory, antitumoral,
antiulcer effects or cholesterol-lowering activity (Aslım, et al. 2006, Lin and Chang
Chien 2007).
Many polysaccharides and stabilizers are used in food industry as viscosifying,
water binding, gel forming and thickening agent (Looijesteijn, et al. 2000). These are
mostly plant carbohydrates (starch, gum, pectin and alginate) or animal hydrocolloids
(gelatin and casein) (Vaningelgem, et al. 2004b). In addition, xanthan produced by
Xanthomanas campestris was used firstly as a microbial EPS (De Vuyst, et al. 1998).
Nevertheless, its use is not allowed in most European countries and U.S. EPS producing
lactic acid bacteria are gained popularity of being safe and used as natural stabilizers.
Moreover, recently there is an increasing interest for EPS producing dairy cultures
because of high consumer demand for smooth and creamy yogurt products. EPS
formation by lactic acid bacteria during the production of fermented milk products
either acts as a viscosifying, emulsifying agent or imparts favorable rheological
properties. Furthermore, it was reported that EPS from food grade organisms,
particularly lactic acid bacteria, has potential as food additives and functional food
ingredients with both health and economic benefits (Welman and Maddox 2003).

30
CHAPTER 4
NEAR-INFRARED SPECTROSCOPY TECHNIQUE
4.1. Near-Infrared (NIR) Spectroscopy
Recently, NIR Spectroscopy is a popular method for simultaneous chemical
analysis and is being studied extensively in a number of fields, such as biotechnology,
pharmaceutical industry and process monitoring due to its potential as an on-line,
nondestructive and noninvasive analysis (Wittrup and Norgaard 1998). The NIR
Spectroscopy covers the wavelength range between 780-2500 nm (Burns and Ciurczak
2001). Samples are illuminated with a near-infrared light source and the reflected or
transmitted light is recorded. The energy difference between the illuminating radiation
and the reflected or transmitted radiation at each wavelength, constitutes the absorbance
spectrum of the sample (Asimopoylos, et al. 2004). Most of the absorption bands
observed in this region are due to overtones and combinations of the fundamental mid-
IR molecular vibrational bands. The most commonly observed bands arise from the C-
H, O-H or N-H bonds in the molecules, eventough all the fundamental vibrational
modes can have overtones (Burns and Ciurczak 2001).
Computers and automation technology have many advantages such as being fast
which make it possible to produce hundreds of spectra in few minutes for a given
sample that contains multiple components. In addition, it is important to choose the
most suitable calibration method. Especially multivariate calibration deals with data of
instrument responses measured on multiple wavelengths for a sample that usually
contains more than one component (Özdemir and Öztürk 2006).
There are many multivariate calibration methods used in NIR Spectroscopy such
as inverse least squares (ILS), genetic inverse least squares (GILS), classical least
squares (CLS), partial least square (PLS). ILS is a method that is based on the inverse of
Beer’s Law where the concentration of an analyte is modeled as a function of
absorbance. GILS is modified version of original ILS method in which a small set of
wavelengths is selected from a full spectral data matrix. By the development of
optimum solution, genetic algorithm (GA) has been applied to a number of wavelength
selection problems (Özdemir and Öztürk 2006).

31
CLS method is founded in using the Beer-Lambert Law to extend the calculation
of the absorptivity coefficients across a much larger portion of the spectrum than the
much simpler Least Squares Regression method.
A = K . C + EA (Eq. 4.1)
where A is the absorbance of a single sample of known concentration, K is the constant,
C is the known concentration and EA is the errors in the calculation of the absorbance
(Thermo Scientific 2007).
CLS method has a major disadvantage which all the interfering species must be
known and their concentrations are included in the model However, ILS method can
eliminate this problem by modeling the concentration of a component as a function of
absorbance (Özdemir and Öztürk 2006).
The ILS model for m calibration samples with n wavelengths for each spectrum
is described by :
C = AP + EC (Eq. 4.2)
where C is the m x l matrix of the component concentrations, A is the m x n matrix of
the calibration spectra, P is the n x l matrix of the unknown calibration coefficients
relating l component concentrations to the spectral intensities and EC is the m x l matrix
of errors in the concentrations not fit the model. In the calibration step. ILS minimizes
the squared sum of the residuals in the concentrations.
The biggest advantage of ILS is that equation (1) can be reduced for the analysis
of single component at a time since the analysis is based on an ILS model invariant with
respect to the number of chemical components in the analysis. The reduced model is
given as :
c = Ap + ec (Eq. 4.3)
where c is the m x l vector of concentrations for the component that is being analyzed, p
is n x l vector of calibration coefficients and ec is the m x l vector of concentration
residuals unfit for the model. During the calibration step, the least-squares estimate of p
is :

32
pˆ = (A′ A)–1A′ · c (Eq. 4.4)
where pˆ is the vector of estimated calibration coefficients.
Once pˆ is calculated, the concentration of the analyte of interest can be
predicted with the equation below.
cˆ = a′ · pˆ (Eq. 4.5)
where cˆ is the scalar estimated concentration and a is the spectrum of the unknown
sample. Due to the ability to predict one component at a time without knowing the
concentrations of interfering species, ILS has became one of the most frequently used
calibration methods (Özdemir 2007).
On the other hand, ILS has a major disadvantage of being restricted by the
number of wavelengths in a spectrum which are much more than the calibration
samples. In this situation, several wavelength selection strategies, such as stepwise
wavelength selection and all possible combination searches are avaliable to built an ILS
model in order to fit the data best (Özdemir 2007).
Recently, GA is global search and optimisation methods which are based upon
the principles of natural evolution and selection as developed by Darwin. GA is simple
and consist of five basic steps including initialization of a gene population, evaluation
of the population, selection of the parent genes for breeding and mating, crossover and
mutation, and finally replacing parents with their offspring as given in Figure 4.1. The
names of the steps are taken from the biological foundation of the algoritm (Özdemir
and Öztürk 2006).

33
Figure 4.1. GA optimization method steps
(Source: Özdemir and Öztürk 2006)
GA is implemented to GILS for selecting wavelengths in order to build
multivariate calibration models with reduced data set. GILS follows the same basic
steps as other GAs model, but it is unique in the way it encodes genes. The term gene is
used to describe the collection of instrumental responses in GILS method. The term
population is used to describe the collection of individual genes in the current
generation.
4.2. Applications of NIR Spectroscopy in Food Analysis
Most samples are analyzed by conventional chemical analyses, such as the
Kjeldahl procedure for total N or ammonium-N or Gerber method for fat. These
procedures can be time consuming and expensive, and also generate chemical wastes
(Reeves and Van Kessel 2000).
Due to the fact that, routine analytical methods used for food products such as
dairy products are destructive, expensive, time and labor consuming, the NIR
spectroscopy has been used to measure the content of various constituents in milk, milk
Initilization of Gene Population (from the collection of instrumental response)
Evaluate& Rank the Population
Selection of the Genes for Breeding
Single Point Crossover & Mutation
Replacing the Parent Genes with their Offsping
TERMINATE ? YES
Selection of the Best
NO
34
powder, whey, cheese and yogurt (Tsenkova, et al. 1999). The NIR spectroscopy is
widely used in the food industry as a quality control tool.
Tsenkova et al. (1999), investigated the potential of NIR spectroscopy for
measurement of fat, total protein and lactose in unhomogenized milk. Researchers
found that spectral region and sample thickness were the significant factors for the
determination of milk fat and total protein. This study showed that the NIR
spectroscopy was an adequate method for determination of milk constituents.
Shao et al. (2007) examined the feasibility of using Visible NIR (Vis/NIR)
spectroscopy to detect the sugar and acid contents of yogurt through using a hybrid
model called PC-ANN, which combined principle component analysis (PCA) with
artificial neural network. At the same time, the models established via chemometrics
partial least square (PLS) regression were also established, in order to find sensitive
wavelengths corresponding to sugar and acidity contents of yogurt through the
regression coefficient of PLS. The sugar content was measured by a sugar content meter
and acidity was measured by a pH meter analytically. Their study indicated that it is
possible to use a non-destructive technique to measure the sugar contents and acidity of
yogurt using Vis/NIR spectroscopy. By the use of PC-ANN hybrid model, they
established a correlation between the absorbance spectra and the parameters of sugar
content and acidity. The results showed an excellent prediction performance and were
encouraging with a correlation coefficient of 0.92 and 0.91, the root mean square errors
of calibration (RMSEP) of 0.33 and 0.04 for sugar content and acidity. On the other
hand, the results showed that it was difficult to select one or a few wavelengths for
accurate prediction of the sugar content or acidity of yogurt and it is necessary to use a
wider spectrum or even an entire spectrum for sugar content and acidity prediction.
He et al. (2007), studied sugar content of yogurt by Vis/NIR spectroscopy with
PLS model. Their sdudy showed 0.934 correlation coefficient between predicted and
measured values of 25 yogurt samples. Hence, the spectroscopy technique was reliable
and acceptable in predicting the sugar content of yogurt. In the studty of Sultaneh and
Rohm (2007), it was evaluated that the application of NIR spectroscopy was
undoubtedly necessary for performing rapid methods in the determination of solids and
protein content in cheese curd. Partial least squares (PLS) regression was used to build
statistical models between curd moisture or curd protein content and the predictors and
the calibration models resulted in coefficients of determination of R2 = 0.994 for total
solids and R2 = 0.985 for protein content for unhomogenized curd.

35
CHAPTER 5
AROMA
5.1. Aroma Compounds
Flavor is a crucial characteristic of foods as the sensory characteristics play an
important role in product acceptance by consumers. In fermented dairy products, flavor
perception is strongly based on the volatile components (Kalviainen, et al. 2003). Most
commercial yogurts are produced by the action of two microorganisms, S. thermophilus
and L. delbrueckii subsp. bulgaricus, which grow simultaneously to give the desired
flavor, mouthfeel and texture to the yogurt. Several flavor compounds have been
isolated from natural yogurts. The most prominent ones are mainly lactic acid which
imparts an acidic and refreshing taste, and a mixture of various carbonyl compounds
like acetaldehyde, ethanol, acetone, diacetyl and 2-butanone. However, among them,
acetaldehyde is considered as the major flavor compound for the typical yogurt aroma
reported by several researchers (Chaves, et al. 2002, Ott, et al. 1997). Both the ratio and
balance between these flavor compounds must be taken into account due to their effect
on yogurt flavor, for instance, the ratio between acetaldehyde and acetone of 2.8 is
considered optimum (Gardini, et al. 1999, Chaves, et al. 2002). On the other hand, a
greater number of volatile organic compounds identified in yogurt are not only
produced by starter culture but also originated from milk (Beshkova, et al. 1998).
5.2. Flavor Formation
Flavor formation is accumulated by a series of biochemical processes in which
the starter cultures provide the enzymes. There are three main pathways responsible for
the formation that are identified as the conversions of lactose (glycolysis), fat
(lipolysis), and caseins (proteolysis). In the case of glycolysis, firstly lactose converted
to lactate and then a fraction of the intermediate pyruvate is converted to various flavor
compounds such as diacetyl, acetoin, acetaldehyde, or acetic acid. Lipolysis caused by
the formation of free fatty acids, which can be precursors of flavor compounds such as
methylketones, secondary alcohols, esters and lactones. However, in some cases, in

36
fermented dairy products, mostly cheeses, the basis of the flavor formation depends on
the enzymatic degradation of proteins (caseins) into peptides and amino acids that
subsequently results in volatile aroma compounds. Formation and breakdown of casein
is important because it prevents the accumulation of bittertasting peptides. Flavor
forming pathways originating from proteins are shown in Figure 4.1.
Figure 5.1. Overview of general protein conversion pathways relevant for flavor formation in dairy fermentations. (Source: Smit, et al. 2005)
Diacetyl (butanedione or 2,3-butanedione, CH3COCOCH3) is a natural
byproduct of fermentation. Diacetyl is defined as the butter aroma for being an essential
flavor component for many dairy products. It is produced during conversion of the citric
acid to pyruvate in milk by specific citrate-utilizing LAB and pyruvate is further
converted the precursor for diacetyl. Some authors reported that diacetyl was only
produced by S. thermophilus although others reported that L. bulgaricus produced large
amounts of diacetyl. In mixed cultured yogurt, active diacetyl production was measured
during the first 4 h and also in the cooling step with maximum concentration in
Bulgarian yogurt (Beshkova, et al. 1998). Diacetyl formation is given in Figure 4.2.

37
Figure 5.2. Pathway for the conversion of citrate to diacetyl and other compounds. The reactions are catalyzed by the following enzymes: (1) citrate lyase; (2) oxaloacetate synthase; (3) pyruvate decarboxylase; (4) acetolactate synthase; (5) acetolactate decarboxylase; (6) diacetyl reductase; (7) acetoin reductase. Reaction 8 is the oxidative conversion of a-acetolactate to diacetyl. (Source: Marsili 2002).
Butanone (CH3COC2H5) is a ketone, also known as methyl ethyl ketone (MEK).
It is a colorless liquid with a sharp and sweet odor. Acetone (also known as propanone,
dimethyl ketone, 2-propanone, propan-2-one and β-ketopropane, CH3COCH3) is the
simplest representative of the ketones (Anon 2007b).
Acetaldehyde, (CH3CHO), is an organic chemical compound which is volatile at
room temperature and pressure. In addition, it is colorless liquid with a fruity smell
(Miyake and Shibamoto 1993). Acetaldehyde is produced by yogurt bacteria, S.
thermophilus and L. bulgaricus, as being a major component of the typical yogurt
flavor. The exact mechanism of acetaldehyde production has not been well established
(Smit, et al. 2005).
Acetaldehyde can be derived from amino acid (especially threonine, methionine
and valine), nucleotide, and pyruvate metabolism in bacteria. In the liver, the enzyme
alcohol dehydrogenase converts ethanol into acetaldehyde, which is then further
converted into harmless acetic acid by acetaldehyde dehydrogenase. Acetaldehyde is
more toxic than ethanol and is responsible for many hangover symptoms (Smit, et al.
2005).
With regard to two major possibilities in acetaldehyde production, pyruvate is
converted to Acetyl-Coenzyme A by the pyruvate formate lyase or the pyruvate
dehydrogenase or threonine is converted by the threonine aldolase which results in

38
glycine and acetaldehyde. Besides, acetaldehyde can be produced by acetate conversion
as part of the acetate utilization rescue pathway. It is reported that threonine aldolase
(TA) is the major enzyme activity involved in acetaldehyde production in the yogurt
bacterium S. thermophilus whereas high activation of TA in the lactobacilli than in the
streptococci is also reported (Chaves, et al. 2002). The amount of acetaldehyde
produced by the bacteria is between 17 and 41 mg/l during yogurt fermentation
(Bongers, et al. 2004). Acetaldehyde formation is given in Figure 4.3.
Acetaldehyde production of S. thermophilus was investigated under control of
specific enzyme serine hydroxymethyltransferase (SHMT) which had an important role
in the production of acetaldehyde. Because SHMT possesses TA activity, acetaldehyde
production during fermentation could be correlated with TA. In addition,
supplementation of the growth medium with L-threonine resulted in an increase in
acetaldehyde production. Nevertheless, the role of TA in acetaldehyde formation in
mixed yogurt cultures has not been understood completely (Chaves, et al. 2002).
During milk fermentation, acetaldehyde production in mixed culture was
occurred immediately after milk coagulation which was in log phase (Beshkova, et al.
1998). However, during storage the amount of acetaldehyde decreased because of the
hydrolysis by microbial enzymes in order to form other substances such as ethanol
(Güler-Akın 2005). Diacetyl and 2,3-pentanedione increased slightly in yogurt made by
mixed cultures during storage at 4 °C due to basal metabolic activity of lactic acid
bacteria (Ott, et al. 1999).
The two yogurt starter L. delbrueckii ssp. bulgaricus and S. thermophilus are
able to produce acetaldehyde. It has been reported by some authors that L. delbrueckii
subsp. bulgaricus is a greater acetaldehyde producer than S. thermophilus, although
other authors have reported the opposite (Ott, et al. 1999, Chaves, et al. 2002). In fact,
the production of acetaldehyde by lactic acid bacteria is strain dependent (Chaves, et al.
2002).
Ott et al. (2000) reported that the yogurt made by only L. bulgaricus resulted in
very similar to the yogurt made by both L. bulgaricus and S. thermophilus. In contrast,
yogurt made by S. thermophilus was extremely different from the product obtained in
the presence of L. bulgaricus. It had a higher butter, sweet, cooked creamy and cottage
cheese aroma. Consequently, it is reported that S. thermophilus does not have a distinct
effect on the production of yogurt flavor. It was also reported that there was a positive
correlation between flavor and acidity. However, viscosity and ropiness were correlated

39
negatively with acidity and flavor (Ott, et al. 2000). In general, it was reported that non-
polysaccharide-producing strains of yogurt bacteria produced high levels of
acetaldehyde (37 mg/l). In contrast, ropy or viscous strains produce low levels of
acetaldehyde (27.6 and 10.4 mg/l) (Ott, et al. 2000, Bongers, et al. 2004).
Figure 5.3. Overview of the different metabolic pathways in LAB that could lead to acetaldehyde formation. Acetyl-CoA, acetyl coenzyme A (Source : Chaves, et al. 2002).
Özer and Atasoy (2002) had studied the acetaldehyde production ability of
viscous and nonviscous yogurt starter cultures, the effects of supplementation with
amino acids in viscous culture medium and also the effect of heat treatment of starter
cultures. It was reported that yogurts made with nonviscous starter cultures showed
significantly low acetaldehyde production (14.4 mg/l) than viscous starter culture (39.3
mg/l). However, fortification of viscous culture with threonine (22.7-31.0 mg/l),
methionine (24.8-33.7 mg/l) and β-galactosidase (28.9 mg/l) led to an increase on
acetaldehyde production. Heat treatment had also same effect on final product (20.7

40
mg/l) due to stimulating the activity of aldehyde dehydrogenase and more importantly
TA.
Headspace and simultaneous distillation and extraction methods have been
commonly used for the determination of yogurt flavor volatiles; however, these
techniques can alter the composition of sensitive aroma compounds. Recently, a variety
of low-temperature headspace procedures have been used to extract volatiles from
yogurt. Using this technique, researchers detected some different volatiles in the
headspace of yogurt. These odor impact chemicals are shown in Table 4.1. Therefore,
acetaldehyde can be measured spectrophotometrically by using an acetaldehyde
determination kit. The basis of the kit based on the acetaldehyde dehyrogenase
reduction of NAD to NADH (Chaves, et al. 2002).
Gallardo-Escamilla et al. (2005) used the proton transfer reaction-mass
spectrometry (PTR-MS) technique which allows analysis of volatile compounds present
in a sample without the requirements for separation by gas chromatography. PTR-MS
performs ionization of volatile compounds by proton transfer from hydronium ions
(H3O+) followed by mass spectrometry. The various ions are separated in a mass
analyzer due to their mass to charge ratio (m/z), and a detector counts the emerging
ions. In this technique, absolute headspace concentrations can be calculated without
calibration or need of standards on the basis of ion counts per second detected by the
instrument and then transformed into parts per million (ppm), or parts per billion (ppb).

41
Table 5.1. Compounds contributing to yogurt aroma
(Source: Ott, et al.1999).
Retention index
Compound Odor descriptors
716 Acetaldehyde Fresh,green,plungent 757 Dimethyl sulphide Milk,lactone-like,sulphury,warm 995 2,3-Butanedione Butter,diacetyl,vanilla 1082 2,3-Pentanedione Butter,vanilla,milk 1120 2-Methylthiophene Gasoline,plastic,sytrene 1221 3-Methyl-2-butenal Metalic,aldehydic,herbaceous 1322 1-Octen-3-one Mushroom,earthy 1406 Dimethyl trisulphide Sulphury,hydrogen sulphide,feacal 1424 1-Nonen-3-one Mushroom,earthy 1462 Acetic acid Plungent,acidic,vinegar 1479 Methional Soup,cooked vegatables,plungent,sulphury 1551 (cis,cis)-Nonenal + 2-
methyltetrahydrothiopen-3-one Green,leather,sulphury
1680 2-Phenylacelaldehyde Flowery 1684 3-Methylbutyric acid Sweaty,cheese,soy sauce,flowery 1715 Unidentified Flowery,warm,camel 1750 Unidentified Metallic 1882 Caproic acid Rancid.flowery 1896 Guaiacol Bacon,phenolic,smoked,spicy 2002 Benzothiazole Bumt,rubbery 2043 Unidentified Hydrocarbon,chemical,bumt rubber
42
CHAPTER 6
SENSORY EVALUATION
6.1. Sensory Analysis
Sensory analysis involves the measurement of food characteristics such as taste,
texture, appearance, odor, and after taste. Panelists are selected for their keen sense of
taste, smell, and sight and are specially trained to provide consistent and accurate
results. Tests are designed to obtain best answer questions about the product
(Meilgaard, et al. 1999).
Lactic acid bacteria have been used to improve the preservation, sensorial
characteristics and nutritional value of products like milk, meat and vegetables. A large
variety of dairy products with different flavor, texture and health-promoting properties
can be obtained from milk using different technologies and starter cultures. Rapid
acidification, microbial preservation of milk, formation of specific flavors, texturing
capacities and health benefits are the important features of the starter bacteria. During
bacterial growth, fermentation of lactose causes both acidification of milk and
production of antimicrobial compounds which inhibit the growth of pathogenic bacteria
of possible contaminants in the fermented products. Moreover, acidification leads to
neutralization of the negative charges on the milk proteins, resulting in coagulation. The
acid also gives pleasant fresh and mild acid taste to fermented products, such as yogurt
and cheese. Furthermore, by the conversion of sugars, organic acids, proteins or fats,
typical aroma and flavor components are produced. Additionally, several lactic acid
bacteria strains can contribute to improve the texture and viscosity of fermented
products by the synthesis of exopolysaccharides (EPSs) (Ruas-Madiedo, et al. 2002).
The quality and the consumer acceptability of fermented dairy products like
yogurt is generally determined by the sensory perception which is a complex process
and influenced by many factors, such as the content of flavor compounds, texture, and
appearance (Smit, et al. 2005). The composition and type of milk proteins particularly
may have a great impact on the yogurt texture and on its flavor attributes (Janhoj, et al.
2006).

43
Attributes and definitions used for sensory profiling of set yogurts are:
• Serum: The volume of separated serum on the surface of yogurt (Amatayakul, et
al. 2006).
• Ropiness (Ropiness of serum): The spoon is placed on the surface and pulled up,
and the ropy property is evaluated; the longer the thread becomes before it
breaks, the ropier the product (Meilgaard, et al. 1999).
• Clean cut: A spoonful of yogurt is removed, and the edges of the cut are
evaluated. (absent = very rough; high = smooth) (Meilgaard, et al. 1999).
• Gel firmness: A spoonful of yogurt is placed on the untouched surface of the
remaining yogurt, and a slight pressure is applied with the spoon; at high gel
firmness, the yogurt breaks in flakes (resembling boiled egg white), whereas
yogurt with low gel firmness is soft (Meilgaard, et al. 1999).
• Mouth thickness: Perceived as the degree of thickness when swallowing the
yogurt at normal-high eating rate; high mouth thickness corresponds to a thick
product that takes a long time to swallow (Meilgaard, et al. 1999).
Attributes and definitions used for sensory profiling of stirred yogurts are:
After twenty times stirring
• Shiny: The shininess is evaluated. (absent = gritty, rough; high = shiny, smooth)
(Meilgaard, et al. 1999).
• Gel firmness: A spoonful of yogurt is placed on the untouched surface of the
remaining yogurt, and it is observed for how long the structure is retained; high
gel firmness corresponds to a long time of structural integrity (Meilgaard, et al.
1999).
• Ropiness: A spoonful of yogurt is pulled from the sample, and the ropy property
is evaluated; the longer the thread becomes before it breaks, the ropier the
product (Meilgaard, et al. 1999).
• Mouth thickness: Perceived as the degree of thickness when swallowing the
yogurt at normal-high eating rate; high mouth thickness corresponds to a thick
product that takes a long time to swallow (Meilgaard, et al. 1999).
• Creaminess: The intensity of creamy flavor (Meilgaard, et al. 1999).
Moreover, flavor and odor of yogurt have sensory attributes named as sour,
sweet, salty, off-flavor, irritating, bitter, skim milk like overheated and butter (Jaworska,
et al. 2005).

44
Overall sensory quality of the product can be evaluated using quantitative
descriptive analysis (QDA) which describes all sensations perceived when evaluating a
product sample. Sensory properties of each product, like appearance, odor, texture and
flavor, are determined using several descriptors, which are then quantitatively measured
using an appropriate scale. The multidimensional sensory image of a product is given
by the resulting descriptive analysis. This method is also used for the comparison of
many products as well. The results of QDA indicate sensory attributes, thus it
differentiates samples from each other.
Jaworska et al. (2005) evaluated the influence of sensory and texture properties
of natural yogurts on their QDA and acceptability. Their results suggested that sensory
texture properties (thickness and smoothness) were not significantly correlated with
consumer acceptability of natural yogurts. However, in analytical panel evaluation,
smoothness (creaminess) appeared to be of more importance for overall sensory quality
than thickness, as demonstrated by a higher and statistically significant correlation.
Furthermore, viscosity correlated well with the sensory thickness of the yogurts tested.
Negative sensory attributes (off-flavor and bitterness) were of critical importance for
consumer acceptability of the product. Regardless of the texture properties, the
acceptance of yogurts tested decreased strongly above the threshold value.
Janhoj et al. (2006) reported that creaminess was one of the key attributes for
consumer acceptance of fermented low-fat dairy products. In stirred yogurt, both the
presence of protein particles and the additional factors from the fluid milk (appearance,
flavor) may be important for the creaminess. For this purpose, the researchers
investigated the effect of protein content on creaminess using four different milk protein
sources. It was found that the sensory perception of creaminess in low-fat yogurt was
clearly dependent on protein source.
EPS-producing yogurt bacteria are used extensively for the yogurt production as
an important texture modifying resource although it is not always correlated. For
instance, Folkenberg et al. (2006) studied the texture profile analysis of EPS-producing
bacteria compared to non-EPS-producing bacteria. They performed the sensory
evaluation by a panel of four to five trained assessors. The assessors developed
vocabularies including gel firmness, ropiness, creaminess and mouth thickness and
focusing on texture properties by describing differences between samples during three
training sessions. Finally, they reported that fermentation with EPS-producing strains
resulted in yogurts with high ropiness, high mouth thickness, and high creaminess in

45
contrast to non-EPS-producing bacteria but low gel firmness and low spontaneous
syneresis (Folkenberg, et al. 2006).
Syneresis or spontaneous whey separation on the surface of set yogurt is
considered as a defect which could be reduced or eliminated by increasing the level of
milk solids to < 15%. In addition to this, stabilizers like starch, gelatine and vegetable
gum, or exopolysaccharide (EPS)-producing starter cultures are used as alternatives.
Because of consumer awareness of natural products, the use of stabilizers is restricted in
some countries (Amatayakul, et al. 2006).

46
CHAPTER 7
MATERIALS AND METHODS
7.1. Materials
7.1.1. Chemicals
The chemicals and their catalog codes are given in the Appendix A.
7.1.2. Media
MRS and M17 media were used for activation and enumeration of
Lactobacillus bulgaricus and Streptococcus thermophilus activation and enumeration,
respectively. The single strains were grown in sterile milk (12% total solids and 3.5%
fat) supplied from Pınar Dairy Company, Pınarbaşı, İzmir. Evaporated milk used for
yogurt production (14-17% total solids) was supplied from Or-Köy Dairy Plant, Urla,
İzmir.
7.1.3. Selection of Streptococcus thermophilus and Lactobacillus
bulgaricus isolates
In total 14 artisanal yogurt samples obtained from Toros and İskenderun regions
of Turkey in 2005 (13 from “Toros” region and 1 from İskenderun) were used for the
isolation of yogurt starter bacteria. Yogurts, which had been produced traditionally,
were selected according to their organoleptic properties such as aroma, viscosity, and
acidity. Total of 66 Streptococcus thermophilus and 72 Lactobacillus bulgaricus
isolates were obtained. The isolates were genetically identified by Erkuş (2007). The
isolates were stored at -80°C in 20% (v/v) glycerol stock solutions for further analysis.
The glycerol stock solutions were prepared by mixing 0.5 ml of active cultures with 0.5
ml sterile MRS and M17 broth for L. bulgaricus and S. thermophilus, respectively, with
0.5 ml 40% glycerol in eppendorf tubes. Thus, the resulting suspension included 20%
glycerol. The frozen stock cultures were prepared in triplicate and only one set was used

47
for the experiments for avoiding any contamination or loss of activity. The isolate codes
were given in Tables 7.1 and 7.2. All isolates were tested for their yogurt producing
properties which were coagulation, growth time, acid production, acetaldehyde and
exopolysaccharide (EPS) formation.
Table 7.1. Streptococcus thermophilus isolates
29 68 95-1 TY20 TY41 TY65 38c 71 95-2 TY21 TY44 TY70
39a 74 97-1 TY23 TY45 TY71
47 77a 97-2 TY24 TY47 TY75
50 77b TY8 TY25 TY53 TY77
52 78 TY9 TY26 TY55 TY78
60 79 TY10 TY27 TY57 TY79
62 85 TY12 TY29 TY61 TY81
65 90b TY14 TY31 TY62 TY82
66a 94 TY15 TY32 TY63
66b 94a TY17 TY38 TY63-2
Table 7.2. Lactobacillus bulgaricus isolates
16 48 79 TY15 TY36b TY77a 22 49 TY5 TY16 TY40 TY77b
22b 51 TY5b TY17 TY41 TY79
24 53 TY6 TY20 TY42 TY80
25 54 TY7 TY21 TY43 TY83
26 57 TY8 TY22a TY45 TY85
30 62 TY9a TY22b TY65 TY86
30b 64 TY9b TY23 TY68 TY87
33 69 TY10 TY24 TY69 TY88
33b 71 TY11 TY27a TY70 TY90
34 76 TY14a TY30 TY71 TY91
44 77 TY14b TY34 TY73 TY92

48
7.2. Methods
7.2.1. Single Strain Analyses
7.2.1.1. Coagulation of Yogurt Isolates
S. thermophilus and L. bulgaricus were activated separately using M17 broth
(pH 6.9) and MRS broth (pH 6.2), respectively. Inoculum of 1%, taken from stock
cultures, was transferred to M17 or MRS broths depending on the culture and then
incubated at 42 °C for 16 h. Then both bacteria, separately, were inoculated at 2% into
sterile milk and incubated at 42 °C for 16 h. The isolates were selected based on their
formation of coagulation (curd). The experiments were duplicated.
7.2.1.2. Acid Production of Yogurt Isolates
The ability of acid production of S. thermophilus was determined instead of L.
bulgaricus since S. thermophilus initiates the fermentation process in yogurt
manufacturing by increasing the acidity. Selected S. thermophilus strains (based on their
coagulation formation) are initially cultured in M17 broth and incubated at 42 °C for 16
h. Then, activated cultures were inoculated into sterile milk individually at 2% and
incubated at 42 °C for 7 h. The pH of the samples during 7 h of incubation was
determined using a pH meter (Metrohm 744 pH meter, Switzerland) every hour. Lactic
acid concentrations of the samples were also determined by following method 947.05 of
the AOAC (1999) at every hour during 7 h of fermentation. S. thermophilus isolates
having pH around 4.60-4.70 at 4-5 h of incubation were selected for further analyses.
7.2.1.3. Acetaldehyde Formation of Yogurt Isolates
The stock cultures of S. thermophilus and L. bulgaricus strains were activated as
described in section 7.2.1.1. The activated cultures were inoculated at 2% into sterile
milk and were incubated at 42 °C until pH 4.6. Then incubated samples were stored at 4
°C overnight. Acetaldehyde formation of S. thermophilus and L. bulgaricus strains were
determined spectrophotometrically using an acetaldehyde determination kit (Boehringer

49
Mannheim, R-Biopharm AG, Darmstadt, Germany) based on the enzymatic
(acetaldehyde dehydrogenase) reduction of NAD to NADH+ (Chaves, et al. 2002).
7.2.1.4. EPS Purification and Quantification in Yogurt Isolates
The samples produced from separate yogurt isolates were prepared as described
in section 7.2.1.3. The EPS purification was performed according to the method
described by Goh, et al. (2005b). Chemical analysis for the determination of total
carbohydrate amount was adapted from the phenol-sulphuric acid method described by
Dubois et al. (1956).
7.2.2. Selection of Yogurt Isolates
The yogurt isolates that decrease pH to 4.60-4.70 up to 5 h, produce high
amounts of acetaldehyde and EPS were selected. After this selection, the isolates were
used to produce yogurt samples. The evaporated and pasteurized milk (%14-17 total-
solids), obtained from Or-Köy Dairy Plant, and inoculated with 3% of S. thermophilus
and L. bulgaricus strains in 1:1 ratio. The inoculated samples were incubated at 42 °C
till the pH decreased to 4.60 value (approximately 3-4 h). Incubated yogurt samples
were stored at 4 °C overnight. Then, they were tested for their organoleptic properties
based on their appearance, syneresis, consistency with spoon, consistency in mouth,
flavor, aroma, and overall acceptability by our research group. Consequently, yogurts
having the best organoleptic properties were chosen for the further yogurt production.
7.2.3. Yogurt Analyses
Pasteurized milk, obtained from Or-Köy Dairy Plant, was inoculated with 3% of of S.
thermophilus and L. bulgaricus strains in 1:1 ratio. The inoculated samples were
incubated at 42 °C until pH 4.50-4.60 (approximately 3-4 h). The incubated yogurt
samples were kept at 4 °C overnight. The yogurt samples were stored at 4 °C for 21
days and the following analyses were conducted. The combinations of selected isolates
which were used for yogurt manufacturing are given in Table 7.3 and sample numbers
were assigned for each different combination.

50
Table 7.3. Sample numbers given to each different combination of yogurt isolates
Combination of isolates Sample No Combination of
isolates Sample No
95-1 x 54 1 95-1 x TY30 11 TY24 x 54 2 TY24 x TY30 12 TY47 x 54 3 TY47 x TY30 13 TY55 x 54 4 TY55 x TY30 14 TY63-2 x 54 5 TY63-2 x TY30 15 95-1 x 25 6 95-1 x 22 16 TY24 x 25 7 TY24 x 22 17 TY47 x 25 8 TY47 x 22 18 TY55 x 25 9 TY55 x 22 19 TY63-2 x 25 10 TY63-2 x 22 20
7.2.3.1. Total Solids, Fat and Protein Contents of Milk and Yogurt
Samples
Total solids of milk and yogurt samples at day 1 were measured gravimetrically
(Turkish Standards Institute 1989, AOAC 1999). Fat content of milk and yogurt
samples at day 1 were determined by butyrometers using the Gerber method (Turkish
Standards Institute 1989). Protein content of yogurt samples at day 1 was assessed by
Kjeldahl method 991.20 of the AOAC (1999) using 6.38 as the nitrogen conversion
factor. The fat and protein contents of the samples were determined in duplicate and
total solids were determined in triplicate.
7.2.3.2. pH and Titratable Acidity of Yogurt Samples
The pH of yogurt samples was measured using a digital pH meter (Metrohm
744, Switzerland) at days 1, 7, 14, and 21. Titratable acidity of yogurt samples was
assessed in duplicate samples following method 947.05 of the AOAC (1999) at day 1.
The titratable acidity was expressed as % lactic acid.
7.2.3.3. Syneresis of Yogurt Samples
Syneresis of yogurt samples at days 1, 7, 14, 21 was determined in triplicate as
described by Rodarte et al. (1993). Each sample (10 ml) was centrifuged (Hettich-
Universal 320R, Tuttlingen, Germany) at 5000 rpm for 20 min at 4 ºC. The clear

51
supernatant was decanted and measured. Syneresis was based on the volume of clear
supernatant per 100 ml yogurt.
7.2.3.4. Apparent Viscosity of Yogurt Samples
Yogurts were produced in 600 ml beakers for the apparent viscosity
measurements. Apparent viscosity of yogurt samples was measured at 10ºC using
Brookfield DV-II-Pro Viscometer, USA with LV4 spindle at a speed of 100 rpm in
circulating water bath at day 1 in triplicate. Yogurt samples were stirred for 20 s
clockwise and 20 s counterclockwise. Results were recorded in centipoise.
7.2.3.5. Amount of EPS in Yogurts
Amount of EPS in yogurts were determined by the same assay used for the
yogurts made by individual strains (Section 7.2.1.4). The amount of EPS in yogurt
samples was determined at day 1.
7.2.3.6. Lactic Acid Bacteria Counts
The S. thermophilus and L. bulgaricus counts were determined using M17 (pH
6.9) and MRS (pH 6.3) agars, respectively, at days 1, 7, 14, and 21. The yogurt samples
(1 ml) were decimally diluted in 9 ml sterile peptone water (0.1%) and 1 ml aliquot
dilutions were pour plated and incubated anaerobically at 45 ºC 48 h for L. bulgaricus
and aerobically at 42 ºC 48 h for S. thermophilus. Anaerobic conditions were created
using AnaeroGen in plastic anaerobic jars (Oxoid). Plates having 25-250 colonies were
counted and the results expressed as log colony forming units per milliliter (log cfu/ml).
7.2.3.7. NIR Spectroscopy of Yogurts
Spectra of yogurt samples were collected using a Bio-Rad Excalibur FTS 3000
NX Fourier Transform Near-Infrared Spectrometer (Bio-Rad Laboratories Europe Ltd.,
UK) between 4000 and 10000 cm-1 wave number. This spectrometer was equipped with
a 250 W tungsten-halogen source, a calcium floride beam splitter and a lead selenide
detector. Diffuse reflectance (DRIFT) measurement was done with 128 scan and 16

52
cm-1 resolution. All spectra were then transferred to a computer where data processing
programs were installed. The GILS methods were written in MATLAB programming
language using Matlab 5.3 (MathWorks Inc., Natick. MA). Yogurt samples were
prepared in duplicate and three measurements were taken from each sample. The
spectra of each sample were used to determine the total solids, fat, pH, syneresis, and
lactic acid bacteria counts of the yogurt samples.
7.2.3.8. Analysis of Aroma Compounds
Pasteurized milk (10 ml) and 3 % starter culture were put into 20 ml glass vials
(Agilent, USA) and sealed with 20-mm aluminum crimp caps (Agilent, USA) with dark
gray septa (Agilent, USA) and shaken slightly to mix the content. All samples were
incubated at 43 ºC for 3-4 h. The vials were kept at 4 ºC overnight and aroma profiling
of the samples was determined at day 1 in duplicate. Yogurt samples were analyzed for
acetaldehyde, ethanol, acetone, diacetyl and methyl ethyl ketone (MEK) using an
automated headspace sampler (Agilent 7694, USA) followed by a gas chromatograph
(GC) (Agilent 6890N, USA). The GC was equipped with a mass spectrometry (MS)
detector (Agilent 5973Nms, USA) to identify and quantify these volatile compounds.
The stock standard solution was prepared with 20 ppm acetaldehyde (Fluka,
Spain), 5 ppm ethanol (Merck, Germany), 1 ppm acetone (Merck, Germany), 5 ppm
diacetyl (Merck, Germany) and 0.5 ppm MEK (Merck, Germany) in deionized water.
Five calibration points were chosen and standard solutions were prepared which contain
1 µl, 2 µl, 4 µl, 6 µl, and 10 µl stock standard solution. Calibration curve was calculated
by least-square regression from these five points and the R2 values for the linearized
calibration curves were 0.999.
In the static headspace method, yogurt samples were placed in a headspace vial
and an aliquot of the closed airspace above the water phase was sampled directly to the
gas chromatographic column with split injection. The samples were heated and shaken
for 60 min in the headspace sampler to achieve volatilization of volatile compounds
present in yogurt. The operating conditions for the headspace sampler and the GC/MS
system are shown in Table 7.4. The column was temperature programmed to facilitate
the separation of compounds which were then detected with the mass spectrometer.
Identification of the volatile compounds eluting from the GC column was
accomplished by comparing their measured mass spectra and retention times to
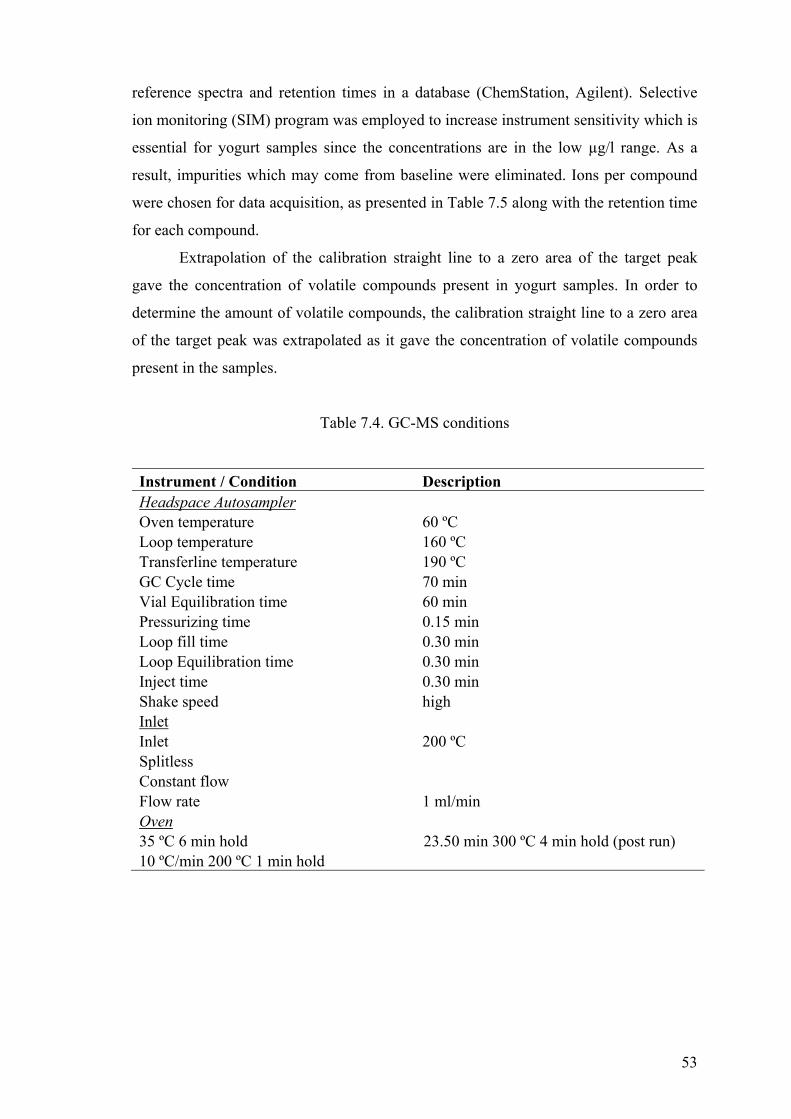
53
reference spectra and retention times in a database (ChemStation, Agilent). Selective
ion monitoring (SIM) program was employed to increase instrument sensitivity which is
essential for yogurt samples since the concentrations are in the low µg/l range. As a
result, impurities which may come from baseline were eliminated. Ions per compound
were chosen for data acquisition, as presented in Table 7.5 along with the retention time
for each compound.
Extrapolation of the calibration straight line to a zero area of the target peak
gave the concentration of volatile compounds present in yogurt samples. In order to
determine the amount of volatile compounds, the calibration straight line to a zero area
of the target peak was extrapolated as it gave the concentration of volatile compounds
present in the samples.
Table 7.4. GC-MS conditions
Instrument / Condition Description Headspace Autosampler Oven temperature Loop temperature Transferline temperature GC Cycle time Vial Equilibration time Pressurizing time Loop fill time Loop Equilibration time Inject time Shake speed Inlet Inlet Splitless Constant flow Flow rate
60 ºC 160 ºC 190 ºC 70 min 60 min 0.15 min 0.30 min 0.30 min 0.30 min high 200 ºC 1 ml/min
Oven 35 ºC 6 min hold 23.50 min 300 ºC 4 min hold (post run) 10 ºC/min 200 ºC 1 min hold

54
Table 7.5. Target volatile compound ions in SIM program
Compound Retention Time (min) Ion Dwell (msec)
Acetaldehyde 0.00 41, 43 20
Ethanol,
Acetone 1.58
31, 42, 43, 46,
58 20
Diacetyl, MEK 2.30 42, 43, 45, 60 20
7.2.3.9. Sensory Evaluation of Yogurts
The yogurt samples were evaluated at day 1 by a 10-member trained sensory
panel. Panelists were chosen among the graduate students and faculty in the Food
Engineering Department at IYTE (8 females, 2 males aged 23-32) and they were
frequent yogurt consumers. Panelists were trained twice in a group discussion with
reference samples having good and bad quality attributes. Verbal descriptors which is
given in Table 7.6, from the Yogurt Standard (TS1330) of the Turkish Standards
Institute (1989) had been discussed during training. Yogurt samples at day 1 were coded
and presented to panelists at 8 °C in 200 ml commercial yogurt containers under typical
daylight room conditions. Panelists independently evaluated each sample for
appearance, consistency on the spoon, consistency in the mouth, odor, flavor, and
overall acceptability using a descriptive hedonic scale of 1-5 (with 5 being the highest
attribute score) as presented in Table 7.6. Samples were randomly ordered at the
beginning of the panel and each panelist received the samples in the same order. Total
of 8 samples were presented to the panelists in one session. Two replicate evaluation
sessions were conducted.
7.2.3.10. Data Analysis
Two replications were conducted for all analyses and the sensory evaluation.
Results of the total solids, fat, and protein contents, pH, titratable acidity, syneresis,
apparent viscosity, EPS, lactic acid bacteria counts, aroma compounds and sensory
scores were analyzed by one-way analysis of variance using MINITAB® release 13
(Minitab Inc., State College, USA) and Duncan significance test. Significance was
accepted at p<0.05.

55
Table 7.6. Descriptive hedonic scale used for sensory evaluation of yogurt samples
Sensory Attributes Descriptions of the attributes Scores
Glossy, having milk color, no whey(liquid) separation occurred, no cracks and gas bubbles, clean appearance, homogeneous 5
Having milk color, no whey separation, no cracks and gas bubbles 4
Dull, few cracks, some whey separation occurred, clean appearance 3
Appearance
Not having milk color, many cracks and gas bubbles, whey separation occurred, dirty appearance 1-2
Thick on spoon, having normal texture, homogeneous, thick after stirring, no immediate whey separation occurred 5
Thick on spoon, having normal texture, thick after stirring, some whey separation occurred 4
Not too fluid on spoon, fluid after stirring, immediate whey separation occurred 3
Consistency on spoon
Free running from spoon, too fluid after stirring, immediate and much whey separation occurred 1-2
Having very good texture, homogeneous 5 Having good texture, homogeneous 4 Fluid in the mouth, not having good texture 3
Consistency in mouth
Too fluid while squeezing one spoonful of the sample between tongue and palate 1-2
Having specific (normal) yogurt odor 4-5 Not having normal yogurt odor 3 Odor Not having normal yogurt odor and having foreign odor 1-2 Normal yogurt flavor, some sourness 4-5 Sour, some bitterness, having foreign flavor 3 Flavor Too sour, bitter, having foreign flavor 1-2 Excellent 5 Good 4 Neither good or bad 3 Bad 2
Overall Acceptability
Very Bad 1

56
CHAPTER 8
RESULTS AND DISCUSSION
8.1. Single Strain Analyses Results
8.1.1. Coagulation of Yogurt Isolates
Activated cultures were inoculated into 10 ml sterile milk and incubated for 12-16 h.
Out of 57 S. thermophilus isolates in which coagulation was observed , 25 of them
formed curd after 16 h of incubation and 7 S. thermophilus isolates did not form any
curd. Coagulation occurred in all of the L. bulgaricus isolates. Curd formation of S.
thermophilus isolates and L. bulgaricus isolates are given in Table 8.1 and Table 8.2.
Table 8.1. Curd formation of S. thermophilus isolates
29 + 68 - 95-1 ++ TY20 + TY41 ++ TY65 + 38c + 71 + 95-2 ++ TY21 + TY44 ++ TY70 ++ 39a + 74 + 97-1 + TY23 + TY45 ++ TY72 ++ 47 - 77a + 97-2 + TY24 ++ TY47 ++ TY75 ++ 50 ++ 77b + TY8 ++ TY25 ++ TY53 ++ TY77 + 52 ++ 78 - TY9 ++ TY26 + TY55 ++ TY78 + 60 - 79 ++ TY10 ++ TY27 ++ TY57 ++ TY79 - 62 + 85 - TY12 + TY29 ++ TY61 ++ TY81 - 65 ++ 90b + TY14 + TY31 ++ TY62 + TY82 ++ 66a ++ 94 ++ TY15 + TY32 + TY63 + 66b ++ 94a + TY17 ++ TY38 ++ TY63-2 ++
(-) no curd (++) curd formed in 12-16 h (+) curd formed after 12-16 h

57
Table 8.2. Curd formation of L. bulgaricus isolates
16 ++ 48 + 79 ++ TY15 + TY36b + TY77a ++ 22 ++ 49 + TY5 ++ TY16 + TY40 + TY77b ++ 22b ++ 51 ++ TY5b ++ TY17 ++ TY41 + TY79 ++ 24 ++ 53 + TY6 ++ TY20 ++ TY42 + TY80 ++ 25 ++ 54 ++ TY7 ++ TY21 ++ TY43 + TY83 ++ 26 ++ 57 ++ TY8 ++ TY22a ++ TY45 + TY85 + 30 ++ 62 + TY9a ++ TY22b ++ TY65 + TY86 + 30b ++ 64 + TY9b ++ TY23 ++ TY68 ++ TY87 + 33 ++ 69 + TY10 ++ TY24 ++ TY69 ++ TY88 + 33b ++ 71 + TY11 ++ TY27a ++ TY70 ++ TY90 ++ 34 ++ 76 + TY14a++ TY30 ++ TY71 ++ TY91 ++ 44 ++ 77 + TY14b++ TY34 + TY73 + TY92 ++
(-) no curd (++) curd formed in 12-16 h (+) curd formed after 12-16 h
8.1.2. Acid Production of Yogurt Isolates
S. thermophilus isolates in which coagulation occurred were examined for acid
production versus time. The most important criteria in order to choose a coccus strain
for yogurt production for further studies was the acid production ability of S.
thermophilus strains in 4-5 h. Out of 57, 38 of S. thermophilus strains decreased pH
below 4.60. Among these, 18 isolates decreased pH to 4.60-4.70 in 4-5 h. These strains
were selected for the organoleptic analyses. The acid production abilities of 18 S.
thermophilus strains are given in Table 8.3.

58
Table 8.3. The acid production of S. thermophilus strains
Incubation Time Isolate number 1 h 2 h 3 h 4 h 5 h 6 h 7 h 95-1 6.34 5.83 4.96 4.68 4.48 4.29 4.20 TY24 6.27 5.76 4.92 4.61 4.41 4.23 4.14 TY47 6.29 5.85 4.98 4.68 4.49 4.24 4.17 TY55 6.33 5.80 4.96 4.68 4.47 4.26 4.15 TY63-2 6.39 5.89 5.10 4.74 4.50 4.28 4.18 50 6.36 6.21 5.41 4.85 4.64 4.44 4.28 52 6.40 6.18 5.28 4.81 4.62 4.45 4.33 66a 6.41 6.24 5.58 5.19 4.92 4.73 4.55 66b 6.36 6.15 5.40 4.92 4.69 4.53 4.42 77b 6.42 6.28 5.74 5.13 4.88 4.76 4.63 85 6.39 6.22 5.39 4.96 4.70 4.44 4.29 90b 6.32 5.88 5.08 4.75 4.51 4.31 4.22 94a 6.44 6.27 5.91 5.34 4.86 4.59 4.48 95-2 6.21 5.50 4.83 4.64 4.47 4.31 4.20 TY8 6.21 5.31 4.84 4.62 4.48 4.33 4.21 TY9 6.35 5.82 5.10 4.69 4.55 4.43 4.37 TY10 6.49 6.11 5.27 4.70 4.51 4.35 4.31 TY17 6.45 5.91 5.20 4.62 4.45 4.34 4.31 TY25 6.52 6.14 5.31 4.74 4.53 4.38 4.30 TY29 6.54 6.32 5.49 4.83 4.59 4.44 4.32 TY38 6.54 6.44 6.27 5.47 4.95 4.65 4.56 TY41 6.48 6.20 5.57 4.86 4.47 4.40 4.35 65 6.47 6.35 5.81 4.99 4.50 4.40 4.33 TY44 6.34 5.95 4.92 4.50 4.30 4.24 4.19 TY45 6.37 6.09 5.09 4.63 4.39 4.31 4.27 TY53 6.32 5.93 5.32 4.72 4.50 4.40 4.35 74 6.45 6.33 6.21 5.89 5.50 4.98 4.63 79 6.48 6.30 5.88 5.22 4.76 4.55 4.33 94 6.48 6.21 5.60 5.16 4.91 4.78 4.58 97 6.43 6.17 6.00 5.72 5.33 4.92 4.67 TY61 6.45 6.16 5.73 5.11 4.76 4.57 4.40 TY31 6.43 6.26 5.72 5.33 4.80 4.61 4.41 TY27 6.46 5.92 4.99 4.67 4.46 4.32 4.19 TY57 6.45 6.19 5.61 5.14 4.77 4.52 4.38 TY70 6.45 6.06 5.21 4.74 4.50 4.25 4.14 TY75 6.44 6.06 5.51 4.89 4.60 4.40 4.29 TY72 6.44 6.30 5.52 4.90 4.64 4.40 4.29 TY82 6.43 6.12 5.41 4.84 4.53 4.37 4.28

59
8.1.3. Acetaldehyde Production of Yogurt Isolates
L. bulgaricus isolates were examined for their acetaldehyde production. The
level of acetaldehyde produced by 55 of L. bulgaricus strains were ranged in between
1.2-31.5 mg/l. On the other hand, 17 of L. bulgaricus strains and all S. thermophilus
strains did not produce acetaldehyde in a remarkable level. Ayhan et al. (2005) reported
that the domestic S. thermophilus and L. bulgaricus strains, which they studied,
produced 25 to 55 mg/l and 27.28 to 47.74 mg/l acetaldehyde, respectively. Only 7 of L.
bulgaricus strains which had the highest acetaldehyde production were chosen for the
organoleptic analyses. The acetaldehyde production of L. bulgaricus strains are given in
Table 8.4.
Table 8.4. The acetaldehyde production of L. bulgaricus strains
Isolate number
Acetaldehyde (mg/l)
Isolate number
Acetaldehyde(mg/l)
Isolate number
Acetaldehyde (mg/l)
16 22.80 64 6.50 TY24 28.10 22 26.17 71 1.50 TY27a 5.20 22b 24.10 76 5.20 TY30 26.80 24 24.10 77 16.56 TY40 3.00 25 26.95 79 20.80 TY41 6.00 26 20.60 TY5b 18.80 TY68 5.60 30 23.70 TY7 5.10 TY69 8.20 30b 21.40 TY8 4.00 TY70 8.60 33 22.20 TY9a 3.50 TY71 6.50 33b 23.50 TY11 8.50 TY77a 31.50 34 20.20 TY14a 10.40 TY77b 27.70 44 24.50 TY14b 17.30 TY79 4.20 48 14.40 TY16 16.20 TY80 14.50 49 6.80 TY17 5.40 TY90 16.10 53 23.60 TY20 15.00 TY91 6.50 54 30.80 TY21 1.20 TY92 8.00 57 16.00 TY22a 11.20 TY43 22.50 62 2.40 TY22b 5.30 TY9b 13.00
8.1.4. Amount of EPS in Yogurt Isolates
The EPS amounts of the yogurt isolates were determined and are given in Tables
8.5 and 8.6. The EPS production by lactobacilli strains during growth in milk was
ranged from 2.56 to 94.45 mg/l, while streptococci strains’ was between 3.40 and 45.32
mg/l. Aslım et al. (2006) reported that EPS production by lactobacilli strains and

60
streptococci strains during growth in milk were 36 to 314 mg/l and 24 to 140 mg/l,
respectively. The researchers indicated that the EPS production by lactobacilli strains
was lower than streptococci strains and similar results were obtained by Frengova et al.
(2000). They reported that the polymer forming of thermophilic streptococci was lower
than that of the lactobacilli and the quantities of EPS produced by different strains
varied considerably. In fact, our findings were contradicting with the results of other
researchers since in this study EPS produced by streptococci strains was lower than the
EPS produced by lactobacilli strains. Even though the EPS amounts were determined;
mainly acid production and acetaldehyde formation of the isolates were taken into
account for choosing the isolates.
Table 8.5. Amount of EPS produced by L. bulgaricus isolates
Isolate Number
EPS (µg/ml)
Isolate Number
EPS (µg/ml) Isolate Number
EPS (µg/ml)
16 37.75 79 7.26 TY36b 4.68 22 11.80 TY5 8.25 TY40 9.52 22b 8.77 TY5b 15.23 TY41 6.72 24 11.45 TY6 18.61 TY42 16.48 25 6.78 TY7 12.45 TY43 5.33 26 6.25 TY8 13.57 TY45 17.38 30 12.11 TY9a 18.23 TY65 14.99 30b 9.08 TY9b 5.46 TY68 10.99 33 2.56 TY10 6.21 TY69 12.57 33b 7.09 TY11 16.48 TY70 56.82 34 31.66 TY14a 11.19 TY71 72.59 44 4.21 TY14b 16.29 TY73 44.39 48 5.07 TY15 26.43 TY77a 3.40 49 11.13 TY16 16.07 TY77b 3.30 51 12.48 TY17 28.64 TY79 38.26 53 34.16 TY20 10.96 TY80 31.25 54 61.25 TY21 19.33 TY83 26.79 57 11.47 TY22a 14.23 TY85 11.64 62 11.39 TY22b 10.96 TY86 6.42 64 11.47 TY23 6.81 TY87 11.46 69 15.21 TY24 26.35 TY88 7.29 71 14.25 TY27a 5.38 TY90 14.11 76 13.75 TY30 94.45 TY91 7.59 77 4.75 TY34 31.47 TY92 11.99

61
Table 8.6. Amount of EPS produced by S. thermophilus isolates
Isolate Number EPS (µg/ml) Isolate
Number EPS (µg/ml) Isolate Number EPS (µg/ml)
29 11.99 97-1 23.48 TY41 5.07 38c 20.24 97-2 30.99 TY44 16.07 39a 12.11 TY8 26.43 TY45 2.56 50 11.29 TY9 9.49 TY47 4.21 52 75.26 TY10 3.40 TY53 9.08 62 31.22 TY12 4.15 TY55 17.07 65 37.75 TY14 4.43 TY57 14.23 66a 11.78 TY15 17.68 TY61 14.73 66b 8.17 TY17 10.19 TY62 9.55 71 17.26 TY20 16.28 TY63 4.41 74 6.24 TY21 9.29 TY63-2 21.36 77a 20.44 TY23 9.34 TY65 9.52 77b 6.42 TY24 37.51 TY70 5.53 79 14.11 TY25 7.87 TY72 7.84 90b 7.85 TY26 25.48 TY75 14.48 94 8.17 TY27 35.46 TY77 3.76 94a 9.22 TY29 9.13 TY78 16.94 95-1 5.08 TY31 45.32 TY82 19.70 95-2 22.62 TY38 31.58
8.2. Selection of Yogurt Isolates
Combination of 7 L. bulgaricus and 18 S. thermophilus strains were used for the
yogurt production and they were evaluated by our research group based on their
organoleptic properties. The yogurt samples were evaluated based on their appearance,
syneresis, consistency with spoon, consistency in mouth, flavor, aroma, and overall
acceptability (data not shown). The results showed that yogurts made by combination of
4 L. bulgaricus and 5 S. thermophilus strains could be chosen for further studies.
8.3. Yogurt Analyses Results
8.3.1. Total Solids, Fat, and Protein Contents of Yogurt Samples
Total solids content of yogurt samples varied between 14.50% and 17.64%. This
variation occurred due to the total solids content of pasteurized milk (14-17%) since no

62
skim milk or WPI was added to increase the total solids content. Total solids of yogurt
are shown in Table 8.7.
Fat contents of yogurts were varied between 2.40% and 3.35% as given in Table
8.7. No additional cream was added during standardization of milk to increase its fat
content. Since these lactic acid bacteria utilized for yogurt production were artisanal
cultures, other bacteria coming from any other ingredients (cream, skim milk powder,
etc.) were avoided. The reason for this variation could also be due to differences of milk
composition in different seasons of the year.
Protein contents of yogurts given in Table 8.7 were ranged from 3.81% to
4.39%. Whereas Ayar and Akın (2001) determined the higher protein content of yogurt
ranged between 4.68 and 6.02 in their research while our findings were found to be
lower than theirs. In the Turkish Food Codex (2001), protein content of yogurt must be
at least 4%. The results showed that samples 14, 16, 17, 18, 19 and 20 had acceptable
amount of protein.
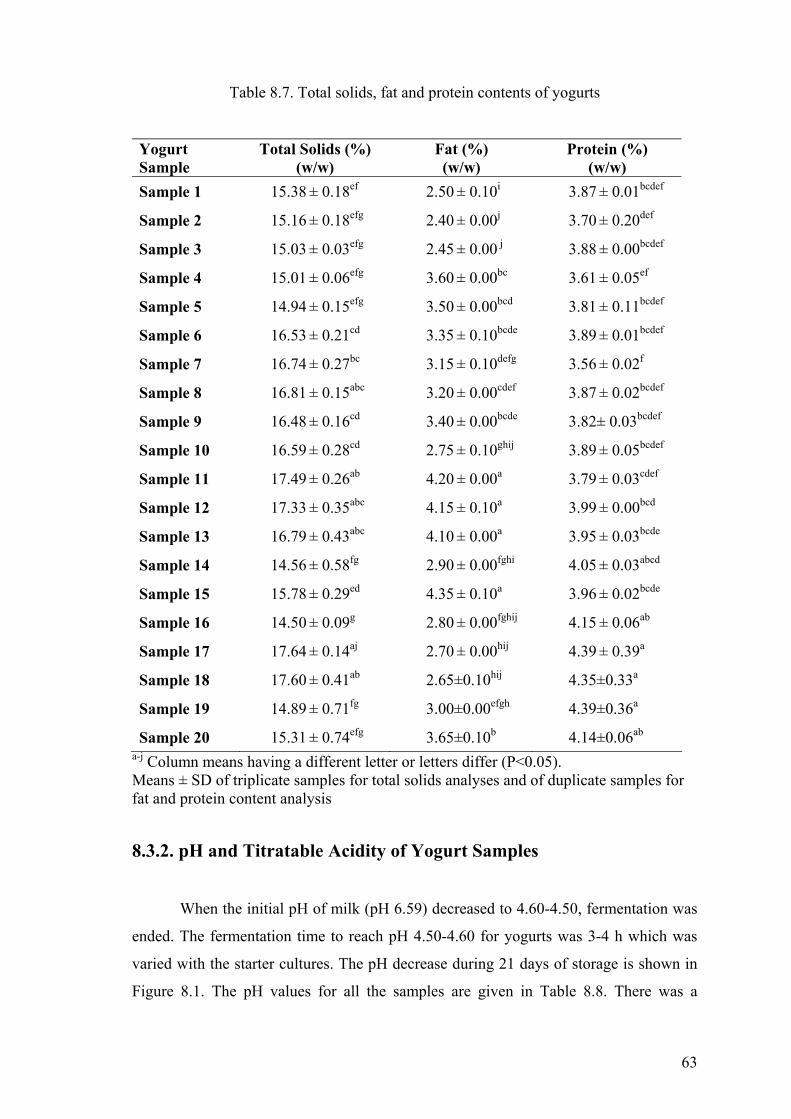
63
Table 8.7. Total solids, fat and protein contents of yogurts
a-j Column means having a different letter or letters differ (P<0.05). Means ± SD of triplicate samples for total solids analyses and of duplicate samples for fat and protein content analysis
8.3.2. pH and Titratable Acidity of Yogurt Samples
When the initial pH of milk (pH 6.59) decreased to 4.60-4.50, fermentation was
ended. The fermentation time to reach pH 4.50-4.60 for yogurts was 3-4 h which was
varied with the starter cultures. The pH decrease during 21 days of storage is shown in
Figure 8.1. The pH values for all the samples are given in Table 8.8. There was a
Yogurt Sample
Total Solids (%) (w/w)
Fat (%) (w/w)
Protein (%) (w/w)
Sample 1 15.38 ± 0.18ef 2.50 ± 0.10i 3.87 ± 0.01bcdef
Sample 2 15.16 ± 0.18efg 2.40 ± 0.00j 3.70 ± 0.20def
Sample 3 15.03 ± 0.03efg 2.45 ± 0.00 j 3.88 ± 0.00bcdef
Sample 4 15.01 ± 0.06efg 3.60 ± 0.00bc 3.61 ± 0.05ef
Sample 5 14.94 ± 0.15efg 3.50 ± 0.00bcd 3.81 ± 0.11bcdef
Sample 6 16.53 ± 0.21cd 3.35 ± 0.10bcde 3.89 ± 0.01bcdef
Sample 7 16.74 ± 0.27bc 3.15 ± 0.10defg 3.56 ± 0.02f
Sample 8 16.81 ± 0.15abc 3.20 ± 0.00cdef 3.87 ± 0.02bcdef
Sample 9 16.48 ± 0.16cd 3.40 ± 0.00bcde 3.82± 0.03bcdef
Sample 10 16.59 ± 0.28cd 2.75 ± 0.10ghij 3.89 ± 0.05bcdef
Sample 11 17.49 ± 0.26ab 4.20 ± 0.00a 3.79 ± 0.03cdef
Sample 12 17.33 ± 0.35abc 4.15 ± 0.10a 3.99 ± 0.00bcd
Sample 13 16.79 ± 0.43abc 4.10 ± 0.00a 3.95 ± 0.03bcde
Sample 14 14.56 ± 0.58fg 2.90 ± 0.00fghi 4.05 ± 0.03abcd
Sample 15 15.78 ± 0.29ed 4.35 ± 0.10a 3.96 ± 0.02bcde
Sample 16 14.50 ± 0.09g 2.80 ± 0.00fghij 4.15 ± 0.06ab
Sample 17 17.64 ± 0.14aj 2.70 ± 0.00hij 4.39 ± 0.39a
Sample 18 17.60 ± 0.41ab 2.65±0.10hij 4.35±0.33a
Sample 19 14.89 ± 0.71fg 3.00±0.00efgh 4.39±0.36a
Sample 20 15.31 ± 0.74efg 3.65±0.10b 4.14±0.06ab

64
significant decrease of pH over time for each sample. The highest pH value obtained at
day 1 was 4.56 (sample 18) and it decreased to pH 4.26 at day 21. The highest pH
decrease was observed in Sample 13 (from pH 4.50 to pH 4.14).
The pH and titratable acidity (% lactic acid) were also measured for the samples
used for the sensory analyses at day 1 as given in Table 8.9. The pH values ranged from
4.52 (samples 1 and 11) to 4.32 (samples 9 and 19). There was a significant difference
among the samples 1, 5, 9, 11, 15, and 19 at day 1. The titratable acidity of yogurt
samples varied between 8.64% and 9.05% and samples 1, 5, 17, 18, 19, and 20 were
significantly different than sample 9 (P<0.05). The pH decrease could be responsible
for the variability of titratable acidity. In addition, acid production is directly related to
lactose metabolism by yogurt starters and amino acids (Özer and Atasoy 2002).
sample 18
4.56
4.424.35
4.264.204.304.404.504.60
0 10 20 30
Storage time(day)
pH v
alue
sample 13
4.504.36
4.19 4.144.104.204.304.404.504.60
0 10 20 30
Storage time (day)
pH v
alue
Figure 8.1. The pH decrease in samples 13 and 18 during 21 days of storage

65
Table 8.8. The pH values of yogurt samples during 21 days of storage
Yogurt Sample
Time (days) pH Yogurt
Sample Time (days) pH
1 4.51 ±0.02 a 1 4.42 ±0.01 a
7 4.38 ±0.04 b 7 4.30 ±0.00 b 14 4.29 ±0.08 c 14 4.27 ±0.00 c
Sample 1
21 4.29 ±0.00 c
Sample 11
21 4.28 ±0.00 d 1 4.48 ±0.01 a 1 4.45 ±0.01 a
7 4.38 ±0.09ab 7 4.36 ±0.01 b
14 4.33 ±0.07bc 14 4.25 ±0.00 c
Sample 2
21 4.26 ±0.02 c
Sample 12
21 4.31 ±0.01 d
1 4.45 ±0.05 a 1 4.50 ±0.00 a 7 4.36 ±0.03 b 7 4.36 ±0.02 b
14 4.30 ±0.03 b 14 4.19 ±0.01 c
Sample 3
21 4.34 ±0.08 b
Sample 13
21 4.14 ±0.02 d
1 4.42 ±0.01 a 1 4.37 ±0.05 a
7 4.36 ±0.03 b 7 4.31 ±0.08ab
14 4.25 ±0.01 c 14 4.20 ±0.10bc
Sample 4
21 4.19 ±0.01 d
Sample 14
21 4.17 ±0.07 c
1 4.48 ±0.02 a 1 4.54 ±0.02 a
7 4.40 ±0.00 b 7 4.43 ±0.00 b
14 4.30 ±0.02 c 14 4.29 ±0.01 c
Sample 5
21 4.20 ±0.02 d
Sample 15
21 4.26 ±0.00 d
1 4.30 ±0.01 a 1 4.47 ±0.07 a
7 4.19 ±0.02 b 7 4.31 ±0.06 b
14 4.20 ±0.00 b 14 4.21 ±0.05bc
Sample 6
21 4.21 ±0.01 b
Sample 16
21 4.17 ±0.09 c
1 4.48 ±0.00 a 1 4.50 ±0.11 a 7 4.31 ±0.00 b 7 4.36 ±0.05 b 14 4.27 ±0.00 c 14 4.28 ±0.10 b
Sample 7
21 4.19 ±0.01 d
Sample 17
21 4.23 ±0.02 b 1 4.47 ±0.00 a 1 4.56 ±0.02 a
7 4.29 ±0.05 b 7 4.42 ±0.08 b
14 4.23 ±0.01 c 14 4.35 ±0.10bc
Sample 8
21 4.30 ±0.01 d
Sample 18
21 4.26 ±0.05 c
1 4.31 ±0.00 a 1 4.54 ±0.07 a
7 4.19 ±0.01 b 7 4.31 ±0.03 b
14 4.20 ±0.02 c 14 4.26 ±0.01bc
Sample 9
21 4.31 ±0.01 d
Sample 19
21 4.23 ±0.05 c
1 4.46 ±0.00 a 1 4.52 ±0.00 a
7 4.40 ±0.00 b 7 4.41 ±0.01 b
14 4.31 ±0.01 c 14 4.31 ±0.02 c
Sample 10
21 4.27 ±0.01 d
Sample 20
21 4.23 ±0.01 d
a-d Column means within each sample having a different letter or letters differ (P<0.05). Means ± SD of duplicate samples

66
Table 8.9. The pH values and titratable acidity of yogurt samples at day 1
Yogurt Sample pH
Titratable acidity
(% lactic acid)
Yogurt Sample pH
Titratable acidity
(% lactic acid)
Sample 1 4.52±0.02 a 9.05 ± 0.03 a Sample 11 4.52 ± 0.02 a 8.90 ± 0.08ab
Sample 2 4.45±0.04ab 8.91 ± 0.08ab Sample 12 4.45 ± 0.04ab 8.90 ± 0.05ab
Sample 3 4.44±0.06ab 8.89 ± 0.05ab Sample 13 4.44 ±0.06ab 8.83 ± 0.01ab
Sample 4 4.42±0.02ab 8.85 ± 0.02ab Sample 14 4.42 ± 0.02ab 8.89 ± 0.01ab
Sample 5 4.48±0.01 a 8.97 ± 0.05 a Sample 15 4.48 ± 0.01 a 8.90 ± 0.03ab
Sample 6 4.41±0.02ab 8.83 ± 0.01ab Sample 16 4.41 ± 0.02ab 8.82 ± 0.02ab
Sample 7 4.40±0.01ab 8.81 ± 0.03ab Sample 17 4.40 ± 0.01ab 8.95 ± 0.02 a
Sample 8 4.39±0.01ab 8.79 ± 0.01ab Sample 18 4.39 ± 0.01ab 8.97 ± 0. 01 a
Sample 9 4.32±0.07 b 8.64 ± 0.03 b Sample 19 4.32 ± 0.07 b 8.93 ± 0.05 a
Sample 10 4.40±0.04ab 8.81 ± 0.05ab Sample 20 4.40 ± 0.04ab 9.02 ± 0.00 a a-b Column means having a different letter or letters differ (P<0.05). Means ± SD of duplicate samples
8.3.3. Syneresis of Yogurt Samples
Syneresis of yogurt samples at days 1, 7, 14, and 21 are given in Table 8.10 and
ranged between 42.0% and 55.8%. Syneresis was decreased in nearly all yogurt samples
during 21 days of storage. This could be as a result of metabolic activity of yogurt
starter cultures and decrease in net pressure in the protein matrix which causes decrease
of syneresis (Güler-Akın and Akın 2007). The highest syneresis decrease was observed
in sample 20 and the lowest one was occurred in samples 2 and 3. The average syneresis
decrease was about 4-7 %. No significant difference was observed among the samples
1, 2, 3, 9, 14, 17, and 18 during 21 days of storage (P<0.05).

67
Table 8.10. Syneresis of yogurt samples
Yogurt Sample Time Syneresis (%)
(v/v) Yogurt Sample Time Syneresis (%)
(v/v) 1 55.8±0.20 1 45.4±0.10b
7 55.8±0.38 7 49.6±0.10a 14 53.3±0.41 14 44.6±0.10b
Sample 1
21 53.3±0.41
Sample 11
21 42.5±0.00c
1 55.0±0.00 1 45.0± 0.00b
7 55.4±0.25 7 47.9±0.25a
14 55.4±0.37 14 44.6±0.10b
Sample 2
21 56.7±0.20
Sample 12
21 42.9±0.10b
1 56.7±0.41 1 50.0±0.00a
7 57.1±0.33 7 47.9±0.10b
14 52.9±0.25 14 45.0±0.00c
Sample 3
21 55.0±0.00
Sample 13
21 45.0±0.00c
1 62.1±0.10a 1 57.5±0.27
7 53.8±0.21b 7 55.0±0.00 14 52.9±0.10b 14 54.2±0.13
Sample 4
21 53.3±0.13b
Sample 14
21 55.0±0.55 1 60.0±0.00a 1 50.4±0.10a
7 56.3±0.14b 7 50.0±0.00b 14 54.2±0.13c 14 45.4±0.10b
Sample 5
21 55.0±0.00bc
Sample 15
21 43.8±0.14c
1 50.0±0.00a 1 57.1±0.10a
7 50.0±0.00a 7 54.9±0.14b 14 50.4±0.10a 14 54.2±0.13b
Sample 6
21 45.4±0.10b
Sample 16
21 53.8±0.14b
1 50.0± 0.00a 1 55.8±0.38 7 50.0±0.00a 7 51.7±0.38 14 50.0±0.00a 14 55.0±0.00
Sample 7
21 47.9±0.10b
Sample 17
21 51.3±0.41 1 50.4±0.10a 1 54.2±0.47 7 51.3±0.14a 7 52.5±0.22 14 50.0±0.00a 14 53.8±0.41
Sample 8
21 47.9± 0.10b
Sample 18
21 50.4±0.43 1 51.3±0.14 1 56.3±0.14a
7 50.4±0.10 7 52.0±0.35b
14 50.8±0.26 14 55.0±0.00ab
Sample 9
21 49.2±0.13
Sample 19
21 54.2±0.13ab
1 55.0±0.00a 1 61.7±0.13a
7 51.7±0.20b 7 54.6±0.10bc
14 50.4±0.10b 14 56.7±0.13b
Sample 10
21 50.0±0.00b
Sample 20
21 52.9±0.25c
a-b Column means within each sample having a different letter or letters differ (P<0.05). Means ± SD of triplicate samples

68
8.3.4. Apparent Viscosity of Yogurt Samples
The apparent viscosities of yogurt samples are shown in Table 8.11. The
apparent viscosity measurements of yogurt samples ranged between 725.85 and 1321.75
cp. The highest apparent viscosity was obtained for sample 2 which was 1321.75±64.70
cp, while the lowest viscosity was obtained for the Sample 7 which was 725.85±26.15
cp. The results indicated that there was no correlation between the EPS production and
viscosity. The highest apparent viscosity values did not correspond to the highest EPS
yield. This result was also confirmed with the findings of Bouzar et al. (1996).
Table 8.11. Apparent viscosities of yogurt samples
Yogurt Sample Viscosity (cp) Yogurt
Sample Viscosity (cp)
Sample 1 1115.76±192.78cde Sample 11* 1061.77±72.98de
Sample 2* 1321.75±64.70a Sample 12 1276.73±64.21ab
Sample 3 1161.75±62.04bcd Sample 13 1209.24±94.60abc
Sample 4 1176.75±62.04abcd Sample 14 1099.77±54.94cde
Sample 5 1112.76±94.60cde Sample 15 1205.74±32.19abcd
Sample 6* 1003.79±86.71e Sample 16* 1061.77±163.07de
Sample 7* 725.85±26.15f Sample 17 1157.75±118.10bcd
Sample 8* 843.82±93.77f Sample 18 1133.76±54.06bcde
Sample 9* 986.79±123.0e Sample 19* 1201.74±50.31abcd
Sample 10* 829.82±71.57f Sample 20 1191.75±88.30abcd a-f Column means having a different letter or letters differ (P<0.05). Means ± SD of triplicate samples * indicates only one replication 8.3.5. Amount of EPS in Yogurts
The amounts of EPS in yogurt samples are given in Table 8.12. The highest EPS
content of yogurt was found in sample 17 which was 62.63±3.18 µg/ml. The EPS
contents of yogurts were significantly different from each other. The reason for this
difference could be due to the varying EPS producing abilities of these cultures. In
addition, total solids and protein contents as well as fermentation conditions could affect
EPS yield. On the other hand, EPS production in yogurt samples was higher than EPS

69
production in yogurt isolates which could be due to stimulated growth of mix culture
although it has not well established (Shihata and Shah 2002). Frengova et al. (2000)
reported the maximum concentration of 720-860 mg EPS/l after full coagulation of
milk.
Table 8.12. Amount of EPS in yogurts
Yogurt Sample EPS (µg/ml) Yogurt
Sample EPS (µg/ml)
Sample 1 41.35±5.29bcde Sample 11 25.01±2.72ef
Sample 2 32.56±5.05def Sample 12 21.19±1.53f
Sample 3 45.31±2.01bcd Sample 13 26.76±4.44ef
Sample 4 39.34±3.22cde Sample 14 21.73±2.90f
Sample 5 40.98±1.59bcde Sample 15 20.65±0.14f
Sample 6 62.36±7.30a Sample 16 40.00±5.63cde
Sample 7 54.60±3.60abc Sample 17 62.63±3.18a
Sample 8 57.12±5.95ab Sample 18 56.66±6.31ab
Sample 9 55.31±0.95abc Sample 19 39.87±3.64cde
Sample 10 52.06±5.51abc Sample 20 46.22±1.13abcd a-f Column means having a different letter or letters differ (P<0.05). Means ± SD of triplicate samples
8.3.6. Lactic Acid Bacteria Counts
Viable lactic acid bacteria counts of yogurt samples during storage are shown in
Table 8.13. S. thermophilus counts were higher in almost all samples due to the
stimulated growth of Streptococcus species. Both L. bulgaricus and S. thermophilus
counts were decreased about 1 log cycle during storage. Similar results were reported
by Birollo et al. (2000), Güler-Akın and Akın (2007). Figure 8.2 represents L.
bulgaricus, S. thermophilus, and total lactic acid bacteria counts during 21 days of
storage for sample 9.

70
sample 9
8.008.208.408.608.809.009.209.40
0 10 20
Time (days)
LA
B C
ount
s (lo
g cf
u/m
l)
S. thermophilus
L. bulgaricus
TOTAL
Figure 8.2. The lactic acid bacteria counts for sample 9 during 21 days of storage

71
Table 8.13. Viable lactic acid bacteria counts of yogurt samples during 21 days of storage
Yogurt Sample Time S. thermophilus
(log cfu/ml) L. bulgaricus (log cfu/ml)
Total LAB (log cfu/ml)
Yogurt Sample Time S. thermophilus
(log cfu/ml) L. bulgaricus (log cfu/ml)
Total LAB (log cfu/ml)
1 9.23±0.07 8.29±0.15 9.28±0.07 1 9.13±0.01a 9.00±0.08a 9.38±0.03a
7 9.27±0.16 8.31±0.09 9.32±0.14 7 8.93±0.03ab 8.94±0.03a 9.25±0.01b
14 9.23±0.15 8.12±0.13 9.26±0.13 14 8.47±0.02b 8.70±0.06b 8.90±0.03c Sample
1 21 9.38±0.22 8.12±0.23 9.40±0.22
Sample 6
21 8.54±0.59ab 8.47±0.04c 8.61±0.05d
1 9.01±0.11 8.34±0.42a 9.07±0.09 1 9.06±0.02a 8.91±0.05a 9.30±0.02a
7 9.15±0.06 8.01±0.32ab 9.18±0.08 7 8.99±0.08b 8.56±0.10b 9.13±0.03b
14 9.09±0.04 7.87±0.41ab 9.13±0.05 14 8.88±0.12bc 8.41±0.05c 9.01±0.08c Sample
2 21 9.02±0.16 7.06±0.64b 9.03±0.16
Sample 7
21 8.78±0.02c 8.51±0.07bc 8.97±0.01c
1 8.99±0.01 8.28±0.14ab 9.07±0.01 1 8.85±0.02a 8.89±0.02a 9.17±0.02a
7 8.97±0.09 8.31±0.09a 9.06±0.06 7 8.84±0.01a 8.80±0.02b 9.12±0.02a
14 9.00±0.05 8.21±0.19ab 9.07±0.06 14 8.72±0.10b 8.60±0.03c 8.97±0.06b Sample
3 21 8.93±0.04 8.02±0.11b 8.99±0.03
Sample 8
21 8.55±0.04c 8.17±0.05d 8.70±0.03c
1 9.27±0.01a 8.94±0.05a 9.44±0.01a 1 8.94±0.01a 8.90±0.08a 9.22±0.04a
7 9.13±0.02b 8.86±0.03a 9.31±0.02b 7 8.93±0.08a 8.64±0.11b 9.07±0.08b
14 8.92±0.02c 8.67±0.05b 9.11±0.02c 14 8.83±0.04ab 8.21±0.19c 8.95±0.04bc Sample
4 21 8.60±0.04d 8.20±0.05c 8.75±0.03d
Sample 9
21 8.76±0.10b 8.16±0.08c 8.85±0.08c
1 9.08±0.04 8.91±0.03a 9.30±0.01a 1 8.79±0.05a 9.09±0.04a 9.27±0.01a
7 8.96±0.02 8.64±0.09a 9.13±0.04a 7 8.61±0.08b 8.68±0.51ab 8.83±0.06b
14 8.78±0.04 8.20±0.15b 8.88±0.05b 14 8.62±0.09b 8.28±0.03bc 8.79±0.06b Sample
5 21 8.45±0.60 7.77±0.10c 8.34±0.18c
Sample 10
21 8.44±0.08c 8.10±0.11c 8.60±0.08c
a-d Column means having a different letter or letters differ (P<0.05). (cont. on next page) Means ± SD of triplicate samples
71

72
Table 8.13. (cont.) Viable lactic acid bacteria counts of yogurt samples during 21 days of storage
Yogurt Sample Time S. thermophilus
(log cfu/ml) L. bulgaricus (log cfu/ml)
Total LAB (log cfu/ml)
Yogurt Sample Time S. thermophilus
(log cfu/ml) L. bulgaricus (log cfu/ml)
Total LAB (log cfu/ml)
1 9.19±0.02 8.98±0.04ab 9.40±0.02a 1 9.32±0.27 8.87±0.14a 9.45±0.23a
7 9.12±0.01 8.91±0.02ab 9.33±0.01b 7 9.18±0.13 8.54±0.36ab 9.28±0.17ab
14 9.22±0.51 9.04±0.49a 9.19±0.01c 14 9.15±0.07 8.78±0.51ab 9.36±0.12ab Sample
11 21 8.80±0.07 8.49±0.06b 8.98±0.04d
Sample 16
21 9.03±0.12 8.10±0.10b 9.08±0.11b
1 9.18±0.03a 8.82±0.06a 9.34±0.03a 1 9.06±0.24 8.90±0.02a 9.30±0.15a
7 8.94±0.02b 8.68±0.04b 9.13±0.01b 7 8.92±0.11 8.19±0.08bc 9.00±0.09b
14 8.86±0.11bc 8.48±0.06c 9.01±0.06c 14 9.11±0.07 8.29±0.03b 9.17±0.06ab Sample
12 21 8.73±0.04c 8.06±0.07d 8.81±0.03d
Sample 17
21 9.07±0.03 7.90±0.29c 9.10±0.04b
1 9.09±0.09a 8.82±0.01a 9.28±0.05a 1 8.81±0.06 8.68±0.13 9.06±0.06
7 8.97±0.05a 8.62±0.06a 9.13±0.02b 7 8.81±0.03 8.37±0.35 8.97±0.09
14 8.83±0.03b 8.35±0.04a 8.95±0.03c 14 8.77±0.17 8.35±0.24 8.94±0.05 Sample
13 21 8.65±0.06c 7.76±0.51b 8.74±0.05d
Sample 18
21 8.78±0.24 8.36±0.06 8.93±0.16
1 9.24±0.03a 8.55±0.08a 9.32±0.02a 1 9.03±0.13a 8.76±0.09 9.22±0.11a
7 9.07±0.11b 7.99±0.44ab 9.13±0.07b 7 8.95±0.12ab 7.93±0.62 8.98±0.12ab
14 9.05±0.05b 7.60±0.00b 9.06±0.05b 14 9.02±0.03ab 8.15±0.26 9.08±0.06a Sample
14 21 9.00±0.08b 7.68±0.35b 9.03±0.06b
Sample 19
21 8.73±0.23b 8.10±0.41 8.79±0.20b
1 9.04±0.02a 9.04±0.53a 9.23±0.01a 1 9.23±0.03a 8.97±0.01a 9.42±0.03a
7 8.96±0.03b 8.65±0.01a 9.13±0.02b 7 9.08±0.01b 8.87±0.01b 9.29±0.01b
14 8.89±0.02c 8.52±0.05ab 9.04±0.02c 14 8.52±0.05c 8.72±0.05c 8.93±0.05c Sample
15 21 8.79±0.03d 8.04±0.07b 8.86±0.03d
Sample 20
21 8.30±0.08d 8.30±0.04d 8.60±0.05d
a-d Column means having a different letter or letters differ (P<0.05). Means ± SD of triplicate samples
72

73
8.3.7. NIR Spectroscopy of Yogurts
The NIR spectra of total solids, fat, pH, syneresis, and microbial counts between
1000 nm and 2500 nm are shown in Figure 8.3. The reference data were randomly
divided into two data sets: a calibration subset containing two-thirds of all data and a
validation subset containing the remaining data (one-third). Hence, 30 of 38 samples
were used to build calibration set and the remaining 8 samples were reserved for
prediction set to test the performance of the models. Because of the random nature of
the GILS method, the program was set to run 30 times with 20 genes and 50 iterations.
0
0.2
0.4
0.6
0.8
1
1.2
1.4
1.6
1000 1300 1600 1900 2200 2500
Wavelength (nm)
Abs
orba
nce
Figure 8.3. The NIR spectra of yogurt samples between 1000 and 2500 nm
The R2 value of actual versus predicted actual graphs of total solids, fat, pH,
syneresis, and microbial counts were 0.9499, 0.9954, 0.9282, 0.9747, and 0.9247,
respectively, and are given in Figures 8.4 - 8.8. These meant that analyses results were
calculated with least error by program. Standard error of calibration (SEC) and standard
error of prediction (SEP) results are shown in Tables 8.14 and 8.15. The results of NIR

74
spectroscopy showed that NIR spectroscopy analysis was applicable on yogurt analysis
as well.
Figure 8.4. Actual versus genetic inverse least squares (GILS)-predicted total solids of yogurt samples
Figure 8.5. Actual versus genetic inverse least squares (GILS)-predicted fat contents of yogurt samples
y = 0.9499x + 0.7788R2 = 0.9499
13.50
14.50
15.50
16.50
17.50
18.50
13.50 14.50 15.50 16.50 17.50 18.50
Actual Total Solids (w/w %)
Pred
icte
d T
otal
Sol
ids (
w/w
%
CalibrationValidation
y = 0.9954x + 0.0142R2 = 0.9954
2.00
2.50
3.00
3.50
4.00
4.50
2 2.5 3 3.5 4 4.5
Actual Fat (w/w %)
Pred
icte
d Fa
t (w
/w %
CalibrationValidation

75
Figure 8.6. Actual versus genetic inverse least squares (GILS)-predicted
pH values of yogurt samples
Figure 8.7. Actual versus genetic inverse least squares (GILS)-predicted
syneresis of yogurt samples
y = 0.9282x + 0.3206R2 = 0.9282
4.30
4.50
4.70
4.30 4.40 4.50 4.60 4.70
Actual pH
Pred
icte
d pH
CalibrationValidation
y = 0.9747x + 1.3925R2 = 0.9747
44.00
46.00
48.00
50.00
52.00
54.00
56.00
58.00
60.00
62.00
64.00
44.00 49.00 54.00 59.00 64.00Actual Syneresis (v/v %)
Pred
icte
d Sy
nere
sis (v
/v %
)
CalibrationValidation

76
Figure 8.8. Actual versus genetic inverse least squares (GILS)-predicted
lactic acid bacteria counts of yogurt samples
y = 0.9247x + 0.6886R2 = 0.9247
8.50
9.00
9.50
10.00
8.50 8.70 8.90 9.10 9.30 9.50 9.70 9.90
Actual LAB Counts (log cfu/ml)
Pred
icte
d L
AB
Cou
nts (
log
cfu/
ml
CalibrationValidation

77
Table 8.14. Results of calibration sets for total solids, fat, pH, syneresis, and microbial counts determined previously with standart error of calibration (SEC)
Calibration set
Total Solids (%) (w/w)
Fat (%) (w/w) pH Syneresis
(%) (w/w)
Microbial Counts
(log cfu/ml)
Sample
no
Actual Pred. Actual Pred. Actual Pred. Actual Pred. Actual Pred. 1 14.44 14.14 2.8 2.77 4.43 4.44 5.67 5.65 9.26 9.22 2 14.42 14.38 2.8 2.81 4.58 4.55 5.92 5.98 9.48 9.41 3 14.53 14.27 2.8 2.80 4.55 4.59 5.83 5.79 9.10 9.16 4 15.40 15.65 3.1 3.11 4.49 4.48 5.50 5.55 9.13 9.14 5 14.40 14.69 2.9 2.84 4.59 4.57 5.75 5.80 9.31 9.31 6 15.51 15.66 2.8 2.80 4.50 4.50 5.50 5.56 9.06 9.08 7 15.25 14.84 2.2 2.18 4.53 4.53 5.67 5.74 9.27 9.28 8 15.32 15.16 2.4 2.44 4.47 4.45 5.50 5.41 8.99 8.96 9 15.06 15.27 2.4 2.36 4.48 4.46 5.33 5.39 9.08 9.11
10 15.01 15.03 2.5 2.53 4.42 4.40 6.00 5.89 9.06 9.10 11 14.98 14.65 2.6 2.62 4.40 4.42 5.50 5.42 9.30 9.27 12 14.15 14.27 3.2 3.23 4.34 4.35 6.00 5.91 9.33 9.34 13 14.80 15.36 3.6 3.61 4.53 4.54 6.25 6.04 8.85 8.89 14 15.06 14.81 3.5 3.45 4.42 4.44 6.25 6.23 9.04 9.03 15 15.05 15.06 3.4 3.38 4.47 4.47 6.00 5.95 8.78 8.76 16 17.66 17.60 4.2 4.19 4.43 4.42 4.50 4.48 9.57 9.51 17 17.26 17.06 4 3.99 4.44 4.43 4.50 4.47 9.20 9.30 18 14.75 14.77 2.4 2.42 4.50 4.50 5.00 5.04 9.20 9.28 19 17.90 18.01 2.4 2.32 4.50 4.48 5.00 5.04 9.31 9.22 20 15.99 15.78 4.4 4.34 4.55 4.54 5.00 5.12 8.91 8.89 21 16.46 16.57 3.4 3.37 4.36 4.39 5.00 4.98 9.15 9.14 22 16.58 16.21 3.4 3.39 4.35 4.32 5.00 4.98 9.46 9.43 23 13.70 14.30 3.2 3.20 4.49 4.49 5.00 5.12 9.24 9.13 24 18.04 17.94 3.2 3.29 4.47 4.47 5.00 4.93 9.00 9.12 25 16.37 16.16 3.4 3.46 4.31 4.33 5.25 5.41 9.06 9.01 26 16.46 16.67 2.8 2.83 4.46 4.48 5.50 5.44 9.11 9.15 27 15.83 15.83 3.6 3.60 4.52 4.51 6.25 6.29 9.11 9.14 28 14.98 14.86 3.4 3.41 4.41 4.41 6.25 6.29 9.13 9.18 29 14.85 15.06 3.6 3.65 4.48 4.51 6.00 6.12 8.74 8.72 30 16.39 16.53 3 3.01 4.48 4.47 5.00 4.91 9.01 8.94
SEC 0.26 0.04 0.02 0.08 0.05 Pred.: Prediction

78
Table 8.15. Predicted total solids, fat, pH, syneresis, and microbial counts in the prediction set with standart error of prediction (SEP)
Pred.: Prediction 8.3.8. Analysis of Aroma Compounds
The chromatogram of volatile compounds, acetaldehyde, ethanol, acetone,
diacetyl, and methyl ethyl ketone (MEK) is given in Figure 8.8. The amounts these
volatile compounds differed widely among yogurts produced with 20 different culture
combinations, as given in Table 8.16. The acetaldehyde, ethanol, acetone, diacetyl, and
MEK contents of the yogurt samples were varied between 13.442-25.44 mg/l, 1.488-
7.022 mg/l, 0.280-0.541 mg/l, 0.425-1.789 mg/l, and 0.041-0.107 mg/l, respectively.
The acetaldehyde was considered as the most prominent compound for the typical
yogurt aroma (Gadrini, et al. 1999). Acetaldehyde was normally occurring in between
17 and 41 mg/l (Abrahamsen, et al. 1978, Tamime and Deeth 1980). Among 20
different yogurts, 11 of them showed acetaldehyde production over 20 mg/l and sample
20 had the highest acetaldehyde content (25.444 mg/l). Diacetyl was produced in large
amounts by sample 16. Sample 10 showed the highest production of ethanol (7.022
mg/l) and acetone (0.541 mg/l). MEK was detected in only 7 samples with very low
levels. The results also showed that sample 10 had the best aroma profile because of
having nearly the highest levels of all volatile compounds.
Prediction set
Total Solids (%) (w/w)
Fat (%) (w/w) pH Syneresis
(%) (w/w)
Microbial Counts
(log cfu/ml)
Sample no
Actual Pred. Actual Pred. Actual Pred. Actual Pred. Actual Pred. 1 14.56 14.57 2.8 2.6 4.52 4.55 5.75 5.81 9.65 9.63 2 15.04 15.51 2.8 3.0 4.49 4.55 5.50 5.30 9.25 9.24 3 17.48 17.80 4.2 4.4 4.42 4.36 4.50 4.74 9.11 9.15 4 17.18 16.38 4.2 4.3 4.46 4.46 4.50 4.68 9.16 9.15 5 15.58 15.47 4.4 4.3 4.54 4.54 5.00 5.28 8.95 8.92 6 16.56 16.59 3.2 3.0 4.47 4.45 5.00 4.89 9.36 9.34 7 16.45 16.45 2.6 2.3 4.46 4.45 5.50 5.12 9.01 9.17 8 16.40 16.46 3.4 3.6 4.31 4.32 5.00 4.91 9.28 9.17
SEP 0.35 0.20 0.03 0.22 0.07

79
Figure 8.9. The chromatogram of volatile compounds in yogurt sample (acetaldehyde, ethanol, acetone, diacetyl, and methyl ethyl ketone
(MEK)
79

80
Table 8.16. Contents of the volatile compounds in the yogurt samples
a-ı Column means having a different letter or letters differ (P<0.05). Means ± SD of duplicate samples
Yogurt Sample
Acetaldehyde (mg/l)
Ethanol (mg/l)
Acetone (mg/l)
Diacetyl (mg/l)
MEK (mg/l)
Sample 1 19.959±0.52abcd 4.126±0.29cde 0.557±0.02ab 1.186±0.10abcd -
Sample 2 17.561±1.15abcd 1.866±0.08ghı 0.424±0.04ab 1.306±0.02abc 0.095±0.01b
Sample 3 17.212±0.01abcd 4.218±0.56cde 0.497±0.01ab 0.780±0.01bcde -
Sample 4 15.886±0.22abcd 4.380±0.44dc 0.495±0.01ab 0.971±0.03abcde 0.107±0.01b
Sample 5 24.213±0.23ab 2.050±0.09ghı 0.489±0.03ab 0.343±0.00e -
Sample 6 18.337±0.14abcd 6.067±0.09ab 0.394±0.01b 1.394±0.03ab -
Sample 7 18.831±0.33abcd 3.382±1.08defg 0.418±0.07ab 1.364±0.27ab 0.061±0.01b
Sample 8 21.715±2.84abc 2.480±0.06fgh 0.464±0.00ab 0.856±0.05abcde -
Sample 9 22.894±1.34abc 1.713±0.11ghı 0.425±0.01ab 0.425±0.02e -
Sample10 23.395±1.58ab 7.022±0.99a 0.541±0.04ab 1.221±0.02abcd -
Sample11 23.698±0.01ab 5.585±0.03abc 0.511±0.01ab 0.797±0.01bcde -
Sample12 15.800±0.86de 2.637±0.05hı 0.383±0.03a 1.597±0.02abcde 0.089±0.00ab
Sample13 23.405±1.20e 3.745±0.35ı 0.499±0.02ab 0.651±0.04bcde -
Sample14 22.707±4.62a 4.374±0.27dc 0.538±0.09ab 0.571±0.08de 0.070±0.04b
Sample15 24.933±1.03bcde 2.040±0.23hı 0.441±0.02ab 0.642±0.04cde -
Sample16 13.442±2.69cde 3.789±0.26cdef 0.389±0.07b 1.789±0.032a -
Sample17 13.692±1.67bcde 2.673±0.97efgh 0.280±0.01b 1.067±0.07abcde 0.064±0.01b
Sample18 23.495±0.12ab 2.046±0.11ghı 0.483±0.00ab 0.684±0.05bcde -
Sample19 20.736±1.00abc 1.488±0.09hı 0.426±0.02ab 0.732±0.05bcde 0.041±0.01b
Sample20 25.444±0.59a 2.717±0.09efgh 0.472±0.01ab 1.176±0.01abcd -

81
8.3.9. Sensory Evaluation of Yogurts
The sensory scores given for each yogurt sample are shown in Table 8.17. The
Yogurt Standard of the Turkish Standards Institute (1989) stated that the total score of a
yogurt evaluated by panelists was required to be at least 20 based on the sum of the
scores given to yogurt’s appearance, consistency on spoon, consistency in mouth, odor
and flavor. Total of 12 yogurt samples met this requirement having total score over 20.
The sum of sensory scores for sample 2 was the highest among the other samples which
was 22.7. This could be due to its highest apparent viscosity and caused the sample to
obtain high scores of appearance, consistency on spoon and consistency in mouth. In
fact, this sample had the lower amounts of volatile compounds, but the overall
acceptance of the product, 4.75 ± 0.40, was the highest among the rest of the samples.
This result showed that overall acceptance of the sample not only affected by taste, but
also appearance and consistency on spoon and consistency in mouth could influence the
consumers’ preferences.

82
Table 8.17. Sensory scores for yogurt samples
Yogurt Sample Appearance Consistency
on spoon Consistency
in mouth Odor Flavor Overall Acceptance
Sample 1 3.75±0.90ab 3.60±0.90cd 3.45±0.70bc 4.15±0.50abc 3.65±0.70cde 3.75 ±0.70bc Sample 2 4.25±0.80ab 4.60±0.50a 4.65±0.60a 4.65±0.50a 4.55±0.50a 4.75±0.40a Sample 3 3.55±0.70ab 3.60±0.80cd 3.40±0.80bc 4.30±0.60abc 3.75±0.70cde 3.70±0.70bc Sample 4 3.40±0.90b 3.45±0.70cd 3.35±0.70c 3.95±0.50bc 3.65±0.50cde 3.55±0.50c Sample 5 4.40±0.80a 3.80±1.00abcd 3.60±0.80bc 4.35±0.50abc 4.05±0.60abcde 4.05±0.50abc Sample 6 3.55±0.80ab 3.75±0.70abcd 3.55±0.70bc 3.95 ±0.60bc 3.85±0.70abcde 3.7 0±0.60bc Sample 7 3.70±0.70ab 4.30±0.70abc 3.80±0.60bc 4.20±0.60abc 4.10±0.80abce 4.15±0.70abc Sample 8 4.20±0.80ab 4.50±0.60ab 4.10±0.50abc 4.50±0.50abc 4.15±0.50abcd 4.35±0.60ab Sample 9 4.10±0.80ab 4.10±0.90abcd 3.90±0.60abc 4.15±0.60abc 4.15±0.70abcd 4.10±0.60abc Sample 10 3.70±0.60ab 4.10±0.60abcd 4.10±0.60abc 4.25±0.60abc 4.00±0.70abcde 4.15±0.70abc Sample 11 4.35±0.70a 3.80±0.60abcd 3.80±0.80bc 4.20±0.50abc 3.85±0.60abcde 4.00±0.60bc Sample 12 4.15±0.90ab 4.30±0.70abc 4.20±0.80ab 4.55±0.60ab 4.50±0.50ab 4.40±0.60ab Sample 13 3.60±0.80ab 3.75±0.80abcd 3.60±0.40bc 4.10±0.80abc 3.50±0.80de 3.60±0.60abc Sample 14 3.60±0.90ab 3.40±1.00d 3.35±1.00c 3.90±0.70c 3.35±0.70e 3.45±0.80c Sample 15 3.50±0.80ab 4.05±0.70abcd 4.15±0.70abc 4.45±0.50abc 4.25±0.60abc 4.05±0.50abc Sample 16 4.15±1.00ab 3.65± 1.00bcd 3.60±0.80bc 4.20±0.80abc 3.80±0.90bcde 4.05±0.90abc Sample 17 3.40±0.80b 4.20±0.80abcd 3.90±0.60abc 4.15±0.40abc 4.20±0.40abcd 4.10±0.40abc Sample 18 4.35±0.90a 4.20±0.40abcd 3.90±0.70abc 4.25±0.40abc 4.05±0.50abcde 4.15±0.60abc Sample 19 4.00±0.90ab 4.30±0.70abc 4.05±0.60abc 4.15±0.40abc 3.90±0.60abcde 4.15±0.60abc Sample 20 3.55±0.90ab 3.80±0.80cd 3.75±0.60bc 4.25±0.60abc 4.05±0.70abcde 4.15±0.70abc
a-e Column means having a different letter or letters differ (P<0.05). Means ± SD of duplicate samples 82

83
CHAPTER 9
CONCLUSION
Objective of this study is to determine the technological and organoleptic
properties of L. bulgaricus and S. thermophilus yogurt starter bacteria isolated and
identified. Hence, curd formation, titratable acidity, acetaldehyde and EPS production
of yogurt bacteria were determined in order to select the cultures having best properties
and manufactured yogurts using them for the observation of these culture’s
bioavailability with respect to yogurt analyses. At the end of the study:
• Out of 64 S. thermophilus isolates, 57 of them formed curd. Out of 57 S.
thermophilus isolates, 38 of them decreased the pH below 4.60 in 7 h. Among
these, 18 of S. thermophilus isolates decreased the pH below 4.60-4.70 in 4-5 h.
These strains were selected for the organoleptic analyses. All 72 L. bulgaricus
isolates formed curd, but 54 of them produced a remarkable level of
acetaldehyde, ranged between 1.2 and 31.5 mg/l. The EPS production by S.
thermophilus and L. bulgaricus in milk was 3.40 to 45.32 mg/L, 2.56-94.45
mg/L, respectively. Results indicated that 18 S. thermophilus and 7 L.
bulgaricus could be used for the manufacturing of yogurt.
• Yogurt samples made by the combination of the selected isolates had total solids
content of 14.50-17.64%, fat contents of 2.40-3.35%, and protein contents of
3.81-4.39%.
• Titratable acidities of day 1 yogurts were varied from 8.64 to 9.05%. There was
a significant decrease of pH over time (from day 1 to day 21) for each sample.
Syneresis of yogurt samples ranged from 42.0 to 55.8% during 21 days of
storage.
• The apparent viscosities were in between 725.85 and 1321.75 cp, and the EPS
amounts were in between 20.65 and 62.63 µg/ml. Although the highest apparent
viscosity was obtained in sample 2, this sample had low amount of EPS
production. In contrast, sample 17 had the highest amount of EPS and high
apparent viscosity. As a result, it was observed that there was no correlation
between EPS production and apparent viscosity of the isolates used for yogurt
manufacturing.

84
• During 21 days of storage, viable lactic acid bacteria counts of yogurt samples
were decreased about 1 log cycle.
• NIR Spectroscopy analysis was successfully carried out for total solids, fat, pH,
syneresis, and microbial counts with the R2 of predicted versus actual graph
values; 0.9499, 0.9954, 0.9282, 0.9747, and 0.9247, respectively.
• The volatile aroma compounds of yogurt samples were obtained as 13.442-25.44
mg/l of acetaldehyde, 1.488-7.022 mg/l of ethanol, 0.280-0.541 mg/l of acetone,
0.425-1.789 mg/l of diacetyl and 0.041-0.107 mg/l of MEK. It was confirmed
that acetaldehyde was the most noticeable aroma compound in yogurt. Among
yogurt samples, sample 10 had the best aroma profile because it contained
almost the highest levels of all volatile compounds. It was also observed that
sample 17 produced low level of acetaldehyde (13.69 mg/l) but the highest level
of EPS (62.63 µg/ml) and sample 15 with high level of acetaldehyde (24.94
mg/l) but the lowest amount of EPS (20.65 µg/ml). It could be concluded that
the strains used in sample 17 could be polysaccharide-producing strains and the
strains used in sample 15 could be non-polysaccharide-producing strains.
• Out of 20 yogurt samples, 12 of them had the total of sensory scores over 20
which was required by Yogurt Standard of the Turkish Standards Institute
(1989).
• In general, sensory evaluation results showed that out of 12 samples liked by
panelists, the starter culture isolates used in 6 of these samples (sample 2, 5, 10,
11, 15 and 18) could be used in dairy industry for their following characteristics;
• Sample 2: highest sensory score, highest apparent viscosity
• Sample 5: sensory score over 20, high level of acetaldehyde
• Sample 10: sensory score over 20, almost highest level of all aroma
compounds
• Sample 11: sensory score over 20, high level of acetaldehyde
• Sample 15: sensory score over 20, high level of acetaldehyde, high level
of apparent viscosity
• Sample 18: sensory score over 20, high level of acetaldehyde, high level
of apparent viscosity, high level of EPS production
• The isolate used in samples 5, 10 and 15 was the same S. thermophilus isolate
(TY63-2), the isolate used in samples 15 and 18 was the same isolate L.

85
bulgaricus isolate (22) and the isolate used in samples 2 and 5 was the same L.
bulgaricus isolate (54). It was interesting that TY63-2 S. thermophilus yogurt
isolate had a bioavailability with all types of L. bulgaricus isolates.
• In conclusion, among S. thermophilus isolates TY63-2, 95-1, TY47 and TY24,
and all L. bulgaricus isolates 22, 25, 54 and TY30 have potential to be used as
starter cultures in dairy industry. Further studies are needed to investigate their
preservation, and enhancement of EPS and acetaldehyde production.

86
REFERENCES
Abrahamsen, R.K, A. Svensen, G.N. Tufto. 1978. Some bacteriological and biochemical activities during the incubation of yogurt from goat’s and cow’s milk. 20th International Dairy Congress, Paris, IE, 828.
Akın, N. 2006. Modern Yoğurt Bilimi ve Teknolojisi. Selçuk Üniversitesi Ziraat Fakültesi, Gıda Mühendisliği Bölümü, Konya.
Amatayakul, T., A.L. Halmos, F. Sherkat, N.P. Shah, 2005. Physical characteristics of yogurts made using exopolysaccharide-producing starter cultures and varying casein to whey protein ratios. International Dairy Journal 16:40-51.
Amatayakul, T., F. Sherkat, N.P. Shah. 2006. Syneresis in set yogurt as affected by EPS starter cultures and levels of solids. Society of Dairy Technology 59:216-221.
Anon. 2007a. Yogurt tarihçesi. http://tr.wikipedia.org/wiki/Yo%C4%9Furt (accessed May 2007)
Anon. 2007b. Butanone. http://en.wikipedia.org/wiki/Butanone. (accessed May 2007)
AOAC. Official Methods of Analysis of AOAC International. 1999. Maryland, USA: AOAC International.
Asimopoylos, G., S. Savvidis, N. Asimopoylos. 2004. On – line monitoring of dairy products with the use of NIR technology. Acta Montanistica Slovaca 9 : 36-40.
Aslım, B., Y. Beyatli, Z.N. Yuksekdag. 2006. Productions and monomer compositions of exopolysaccharides by Lactobacillus delbrueckii subsp. bulgaricus and Streptococcus thermophilus strains isolated from traditional home-made yoghurts and raw milk. International Journal of Food Science and Technology 41:973–979.
Ayar, A., N. Akın. 2001. Farklı bileşimlerde hazırlanan aromalı yoğurtların bazı duyusal ve kimyasal özelliklerinin belirlenmesi üzerine bir araştırma. Dünya Gıda 6(10):65-69.

87
Ayhan K., F. Durlu-Özkaya, N. Tunail. 2005. Commercially important characteristics of Turkish origin domestic strains of Streptococcus thermophilus and Lactobacillus delbrueckii ssp. bulgaricus. International Journal of Dairy Technology 58(3):150-157.
Birollo, G.A., J.A. Reinheimer, C.G. Vinderola. 2000. Viability of lactic acid microflora
in different types of yogurt. Food Research International 33:799-805.
Beshkova, D., E. Simova, G. Frengova, Z. Simov. 1998. Production of flavour compounds by yoghurt starter cultures. Journal of Industrial and Biotechnology 20:180-186.
Bongers, R.S., M.H.N. Hoefnagel, M. Kleerebezem. 2004. High-level acetaldehyde
production in Lactococcus lactis by metabolic engineering. Applied Environmental Microbiology 71(2):1109-1113.
Bouzar, F., J. Cerning, M. Desmazeaud. 1996. Exopolysaccharide production in milk by Lactobacillus delbrueckii spp. bulgaricus CNRZ 1187 and by two colonial variants. Journal of Dairy Science 79:205-211.
Bouzar, F., J. Cerning, M. Desmazeaud. 1997. Exopolysaccharide production and texture-promoting abilities of mixed-strain starter cultures in yogurt production. Journal of Dairy Science 80:2310-2317.
Bönisch, M.P., M. Huss, S. Lauber, U. Kulozik. 2007. Yogurt gel formation by means of enzymatic protein cross-linking during microbial fermentation. Food Hydrocolloids 21:585-595.
Britten, M., H.J. Giroux. 2001. Acid-induced gelation of whey protein polymers: Effects of pH and calcium concentration during polymerization. Food Hydrocolloids 15:609-617.
Broadbent, D.J. McMahon, D.L. Welker, C.J. Oberg and S. Moineau. 2003. Biochemistry, genetics, and applications of exopolysaccharide production in Streptococcus thermophilus. Journal of Dairy Science 86:407–423.
Burns and D.A., Ciurczak, W.E. 2001. Handbook of near-infrared analysis. New York: Marcel Dekker.
Cerning, J., C. Bouillanne, M. Landon, Y. Desmazeaud. 1992. Isolation and characterization of exopolysaccharides from slime-forming mesophilic lactic acid bacteria. Journal of Dairy Science 75:692-699.
Chaves, A.C.S.D., M. Fernandez, A.L.S. Lerayer, I. Mierau, M. Kleerebezem, J.
Hugenholtz. 2002. Metabolic engineering of acetaldehyde production by Streptococcus thermophilus. Applied Environmental Microbiology 68(11):5656-5662.

88
De Vuyst, L., F. Vanderveken, S. Van De Ven, B. Degeest. 1998. Production by and isolation of exopolysaccharides from Streptococcus thermophilus grown in a milk medium and evidence for their growth-associated biosynthesis. Journal of Applied Microbiology 84:1059-1068.
De Vuyst, L., B. Degeest. 1999. Heteropolysaccharides from lactic acid bacteria. FEMS Microbiology Reviews 23(2):153-177.
Degeest, B., L. De Vuyst. 2000. Correlation of activities of the enzymes α- phosphoglucomutase, UDP-galactose 4-epimerase, and UDP-glucose pyrophosphorylase with exopolysaccharide biosynthesis by Streptococcus thermophilus LY03. Applied and Environmental Microbiology 66(8):3519–3527.
Degeest, B., L. De Vuyst, F. Vaningelgem. 2001. Microbial physiology, fermentation kinetics, and process engineering of heteropolysaccharide production by lactic acid bacteria. International Dairy Journal 11:747–757.
Degeest, B., L. De Vuyst, F. Mozzi. 2002. Effect of medium composition and temperature and pH changes on exopolysaccharide yields and stability during Streptococcus thermophilus LY03 fermentations. International Journal of Food Microbiology 79:161– 174.
Duboc, P., B. Mollet. 2001. Applications of exopolysaccharides in the dairy industry. International Dairy Journal 11:759–768.
Dubois, M., K.A. Gilles, J.K. Hamilton, P.A. Rebers, F. Smith. 1956. Colorimetric method for determination of sugars and related substances. Analytical Chemistry 28(3):350-356.
Erkuş, O. 2007. Isolation, phenotypic and genotypic characterization of yogurt starter bacteria. İzmir Institute of Technology Thesis of MS.
Escalante, A., C. Wacher-Rodarte, M. Garcia-Garibay, A. Farres. 1998. Enzymes involved in carbohydrate metabolism and their role on exopolysaccharide production in Streptococcus thermophilus. Journal of Applied Microbiology 84:108-114.
Folkenberg, D.M., P. Dejmek, A. Skriver, H.S. Guldager, R. Ipsen. 2006. Sensory and rheological screening of exopolysaccharide producing strains of bacterial yoghurt cultures. International Dairy Journal 16:111-118.
Frengova, G.I., E.D. Simova, D.M. Beshkova, Z.I. Simov. 2000. Production and monomer composition of exopolysaccharides by yogurt starter cultures. Canadian Journal of Microbiology 46(12):1123–1127.

89
Gallardo-Escamilla, F.J., A.L. Kelly, C.M. Delahunty. 2005. Influence of starter culture on flavor and headspace volatile profiles of fermented whey and whey produced from fermented milk. Journal of Dairy Science 88:3745–375.
Gardini, F., R. Lanciotti, M.E. Guerzoni, S. Torriani. 1999. Evaluation of aroma production and survival of Streptococcus thermophilus, Lactobacillus delbrueckii subsp. bulgaricus and Lactobacillus acidophilus in fermented milks. International Dairy Journal 9:125-134.
Güler-Akın, M.B. 2005. The effects of different incubation temperatures on the acetaldehyde content and viable bacteria counts of bio-yogurt made from ewe’s milk. Society of Dairy Technology 58(3):174-179.
Güler-Akın, M.B., S.M. Akın. 2007. Effects of cysteine and different incubation temperatures on the microflora, chemical composition and sensory characteristics of bio-yogurt made from goat’s milk. Food Chemistry 100:788-793.
Goh, K.K.T., R.D. Haisman, H. Singh. 2005a. Examination of exopolysaccharide produced by Lactobacillus delbrueckii subsp. bulgaricus using confocal laser scanning and scanning microscopy techniques. Journal of Food Science 70(4):224-229.
Goh, K.K.T., R.D. Haisman, R.H. Archer, H. Singh. 2005b. Evaluation and modification of existing methods for the quantification of exopolysaccharides in milk-based media. Food Research International 38:605-613.
Hassan, A.N., J.F. Frank, K.B. Qvist. 2002. Direct observation of bacterial exopolysaccharides in dairy products using confocal scanning laser microscopy. Journal of Dairy Science 85:1705–1708.
Hassan, A. N., R. Ipsen, T. Janzen, K.B. Qvist. 2003. Microstructure and rheology of yogurt made with cultures differing only in their ability to produce exopolysaccharides. Journal of Dairy Science 86:1632-1638.
He Y., D. Wu, S. Feng, X. Li. 2007. Fast measurement of sugar content of yogurt using
Vis/NIR-Spectroscopy. International Journal of Food Properties 10(1):1-7.
Janhoj, T., C.B. Petersen, M. Frost, B.R. Ipsen. 2006. Sensory and rhelogical characterization of low-fat stirred yogurt. Journal of Texture Studies 37:276–299.
Jaworska, D., B. Waszkiewicz-Robak, W. Kolanowski, F. Swiderski. 2005. Relative
importance of texture properties in the sensory quality and acceptance of natural yoghurts. International Journal of Dairy Technology 58(1):39-46.

90
Kalviainen N., K. Roininen, H. Tuorila. 2003. The relative importance of texture, taste and aroma on a yogurt-type snack food preference in the young and the elderly. Food Quality and Preference 14:177-186.
Kılıç, S. 2001. Süt Endüstrisinde Laktik Asit Bakterilerileri. No: 542 İzmir: Ege Üniversitesi Ziraat Fakültesi Yayınları.
Lin, T.Y., M.F. Chang Chien. 2007. Exopolysaccharides production as affected by lactic acid bacteria and fermentation time. Food Chemistry 100:1419-1423.
Looijesteijn, P.J., W.H.M. Van Casteren, R. Tuinier, C.H.L. Doeswijk-Voragen, J. Hugenholtz. 2000. Influence of different substrate limitations on the yield, composition and molecular mass of exopolysaccharides produced by Lactococcus lactis subsp. cremoris in continuous cultures. Journal of Applied Microbiology 89:116-122.
McKinley, M.C. 2005. The nutrition and health benefits of yoghurt. Society of Dairy Technology 58(1):1-12.
Marshall, V.M., H.L. Rawson. 1997. Effect of ‘ropy’ strains of Lactobacillus delbruecci spp. bulgaricus and Streptococcus thermophilus on rheolgy of stirred yoghurt. International Journal of Food Science and Technology 32:213-220.
Marshall, V.M., H.L. Rawson. 1999. Effects of exopolysaccharide-producing strains of thermophilic lactic acid bacteria on the texture of stirred yoghurt. International Journal of Food Science and Technology 34:137-143.
Marshall, V.M., A.P. Laws, Y. Gu, F. Levander, P. Radström, L. De Vuyst, B. Degeest, F. Vaningelgem, H. Dunn, M. Elvin. 2001. Exopolysaccharide-producing strains of thermophilic lactic acid bacteria cluster into groups according to their EPS structure. Letters in Applied Microbiology 32:433-437.
Marsili, R. 2002. Flavours and off-flavours in dairy foods. Dean Foods Technical Center, USA. Elsevier Science Ltd. 1069-1081.
Meilgaard, M., Civille, V.G., Carr, B.T., eds. 1999. Sensory Evaluation Techniques (3rd Editition). New York: CRC Press.
Miyake T., T. Shibamoto 1993. Quantitative analysis of acetaldehyde in foods and beverages. Journal of Agricultural and Food Chemistry 41:1968-1970.
Mozzi, F., F. Vaningelgem, E.M. Hébert, R. Van der Meulen, M.R. Foulquié Moreno, G. Font de Valdez, Luc De Vuyst. 2006. Diversity of heteropolysaccharide-producing lactic acid bacterium strains and their biopolymers. Applied and Environmental Microbiology 72(6):4431–4435.

91
Ott, A., J.E. Germond, L.B. Fay, A. Chaintreau. 1997. Determination and origin of the aroma compounds of yogurt flavor. Journal of Agricultural and Food Chemistry 45:850-858.
Ott, A., J.E. Germond, M. Baumgartner, A. Chaintreau. 1999. Aroma comparisons of traditional and mild yogurts: Headspace gas chromatography quantification of volatiles and origin of α-diketones. Journal of Agricultural and Food Chemistry 47:2379-2385.
Ott, A., J.E. Germond, M. Baumgartner, A. Chaintreau. 2000. Sensory investigation of yoghurt flavour perception: Mutual influence of volatiles and acidity. Journal of Agricultural and Food Chemistry 48:441-450.
Özer, B., F. Atasoy. 2002. Effect of addition of amino acids, treatment with β-galactosidase and use of heat shocked cultures on the acetaldehyde level in yoghurt. Society of Dairy Technology 55(4):166-170.
Özdemir, D., B. Öztürk. 2006. Genetic multivare calibration for near infrared spectroscopic determination of protein, moisture, dry mass, hardness and other residues of wheat. International Journal of Food Science and Technology 41:12-21.
Özdemir, D. 2007. Near Infrared Spectroscopic Determination of Olive Oil Adulteration with Sunflower and Corn Oil. Journal of Food and Drug Analysis 15:40-47.
Petry, S., S. Furlan, E. Waghorne, L. Saulnier, J. Cerning, E. Maguin. 2003. Comparison of the thickening properties of four Lactobacillus delbrueckii subsp. bulgaricus strains and physicochemical characterization of their exopolysaccharides. FEMS Microbiology Letters 221:285-291.
Reeves, J. B., J. S. Van Kessel. 2000. Near-Infrared Spectroscopic Determination of Carbon, Total Nitrogen, and Ammonium-N in Dairy Manures. Journal of Dairy Science 83:1829–1836.
Robinson, R.K. 1999. “Fermented Milks: Yoghurt” ” in Encyclopedia of Dairy Science,
edited by H. Roginski, J. Fuquay, P. Fox (Academic Press, United Kingdom).
Robinson, R.K. 2002. “Fermented Milks: Yoghurt, Role of Starter Cultures” in Encyclopedia of Dairy Science, edited by H. Roginski, J. Fuquay, P. Fox (Academic Press, United Kingdom).
Rodarte, C.W., M.V Galvan, A. Farres, F. Gallardo, V.E. Marshall, M.G. Garibay. 1993. Yogurt production from reconstituted skim milk powders using different polymer and non-polymer forming starter cultures. Journal of Dairy Research 60:247-254.

92
Ruas-Madiedo, P.R., J. Hugenholtz, P. Zoon. 2002. An overview of the functionality of exopolysaccharides produced by lactic acid bacteria. International Dairy Journal 12:163–171.
Ruas-Madiedo, P. R., C.G. De Los Reyes-Gavilan. 2005. Methods for the screening, isolation, and characterization of exopolysaccharides produced by lactic acid bacteria Journal of Dairy Science. 88:843–856.
Salminen, S., A.V. Wright, A. Ouwehand, eds. 2004. Lactic Acid Bacteria: Microbiological and Functional Aspects. New York: Marcel Dekker.
Shao, Y., Y. He., S. Feng. 2007. Measurement of yogurt internal quality through using Vis/NIR spectroscopy. Food Research International 40:835–841.
Shihata, A., N.P. Shah. 2002. Influence of addition of proteolytic strains of Lactobacillus delbrueckii subsp. bulgaricus to commercial ABT starter cultures on texture of yoghurt, exopolysaccharide production and survival of bacteria. International Dairy Journal 12:765–772.
Sodini, I., J. Montella, P. S. Tong. 2005. Physical properties of yogurt fortified with various commercial whey protein concentrates. Journal of the Science of Food and Agriculture 85:853–859.
Smit, G., B.A. Smit, W.J.M. Engels. 2005. Flavour formation by lactic acid bacteria and biochemical flavour profiling of cheese products. FEMS Microbiology Reviews 29(3):591–610.
Stingele, F., J.R. Neeser, B. Mollet. 1996. Identification and characterization of the eps
(Exopolysaccharide) gene cluster from Streptococcus thermophilus Sfi6. Journal of Bacteriology 178(6):1680–1690.
Sultaneh, A., H. Rohm. 2007. Using near infrared spectroscopy for the determination of total solids and protein content in cheese curd. International Journal of Dairy Technology 60(4):241-244.
Tamime, A.Y. and H.C. Deeth. 1980. Yogurt: technology and biochemistry. Journal of Food Protection 43:939-997.
Tamime, A.Y. and Robinson, R.K. 1985. Yoghurt Science and Technology. UK: Pergamon Press.
Tamime, A.Y., Marshall, V.M.E., eds. 1997. Microbiology and Biochemistry of Cheeses and Fermented Milks. London:Blackie Academic.

93
Tekinşen, C. 2000. Süt Ürünleri Teknolojisi. Konya: Selçuk Üniversitesi Basımevi.
Telefoncu, A.1992. Tıp ve Fen Bilimleri İçin Biyokimya. Kırklareli:Sermet Matbaası.
The Dairy Council. 2007. Minerals in yogurt. http://www.milk.co.uk/page.aspx?intPageID=84 (accessed June 2007)
Thermo Scientific. 2007. Algorithms-The Beer Lambert Law, Classical Least Squares (CLS). http://www.thermo.com/com/cda/resources/resources_detail/1,2166,13320,00.html. (accessed December 2007)
Tsenkova. R., S. Atanassova, K. Toyoda, Y. Ozaki, K. Itoh, T. Fearn. 1999. Near-Infrared Spectroscopy for Dairy Management of Unhomogenized Milk Composition Journal of Dairy Science 82:2344-2351.
Turkish Standards Institute. Turkish Standards Institute, Ankara, Turkey.1989. Yoghurt Standard (TS 1330).
Ünal, B., S. Metin, D.N. Işıklı. 2003. Use of response surface methodology to describe the combined effect of storage time, locust bean gum and dry matter of milk on the physical properties of low-fat set yogurt. International Dairy Journal 13:909-916.
Vaningelgem, C.F, M. Zamfir, F. Mozzi, T. Adriany, M. Vancanneyt, J. Swings, L. De Vuyst. 2003. Biodiversity of exopolysaccharides produced by Streptococcus thermophilus strains is reflected in their production and their molecular and functional characteristics. Applied and Environmental Microbiology 70:900-912.
Vaningelgem, F., R. Van der Meulen, M. Zamfir, T. Adriany, A.P. Laws, L. De Vuyst 2004a. Streptococcus thermophilus ST 111 produces a stable high-molecular-mass exopolysaccharide in milk-based medium. International Dairy Journal 14:857- 864.
Vaningelgem, F., M. Zamfir, T. Adriany, L. De Vuyst. 2004b. Fermentation conditions affecting the bacterial growth and exopolysaccharide production by Streptococcus thermophilus ST 111 in milk-based medium. Journal of Applied Microbiology 97:1257-1273.
Yang, Z., E. Huttunen, M. Staaf, G. Widmalm, H. Tenhu. 1999. Separation, purification and characterisation of extracellular polysaccharides produced by slime-forming Lactococcus lactis ssp. cremoris strains. International Dairy Journal 9:631-638.

94
Welman, A.D., I.S. Maddox, 2003. Exopolysaccharides from lactic acid bacteria: Perspectives and challenges. Trends in Biotechnology 2(6):269-273.
Wittrup C., L. Norgaard. 1998. Rapid near infrared spectroscopic screening of chemical parameters in semi-hard cheese using chemometrics. Journal of Dairy Science 81:1803-1809.
Yaygın, H. 1999. Yoğurt Teknolojisi. Yayın No: 75. Antalya: Akdeniz Üniversitesi
Basımevi.

95
APPENDIX A
CHEMICALS USED IN EXPERIMENTS
Table A.1. Chemicals Used in Experiments
No Chemical Code
1 MRS Broth Merck 1.10661
2 M17 Broth Merck 1.15029
3 MRS Agar Merck 1.10660
4 M17 Agar Merck 1.15108
5 Bacteriological Pepton Oxoid LP037
6 Yeast extract Merck A 1.03753
7 Lablemco Meat Extract Oxoid LP029
8 Sodium Acetate Sigma S2889
9 Agar AppliChem A0949
10 D(+) Glucose AppliChem A3666
11 D(+) Lactose Sigma L3750
12 Triammonium citrate Sigma A1332
13 MgSO4.7H2O Merck 1.05886
14 MnSO4.4H2O Merck 1.02786
15 K2HPO4 Sigma P8281
16 Tween 80 AppliChem A1390
(cont. on next page)
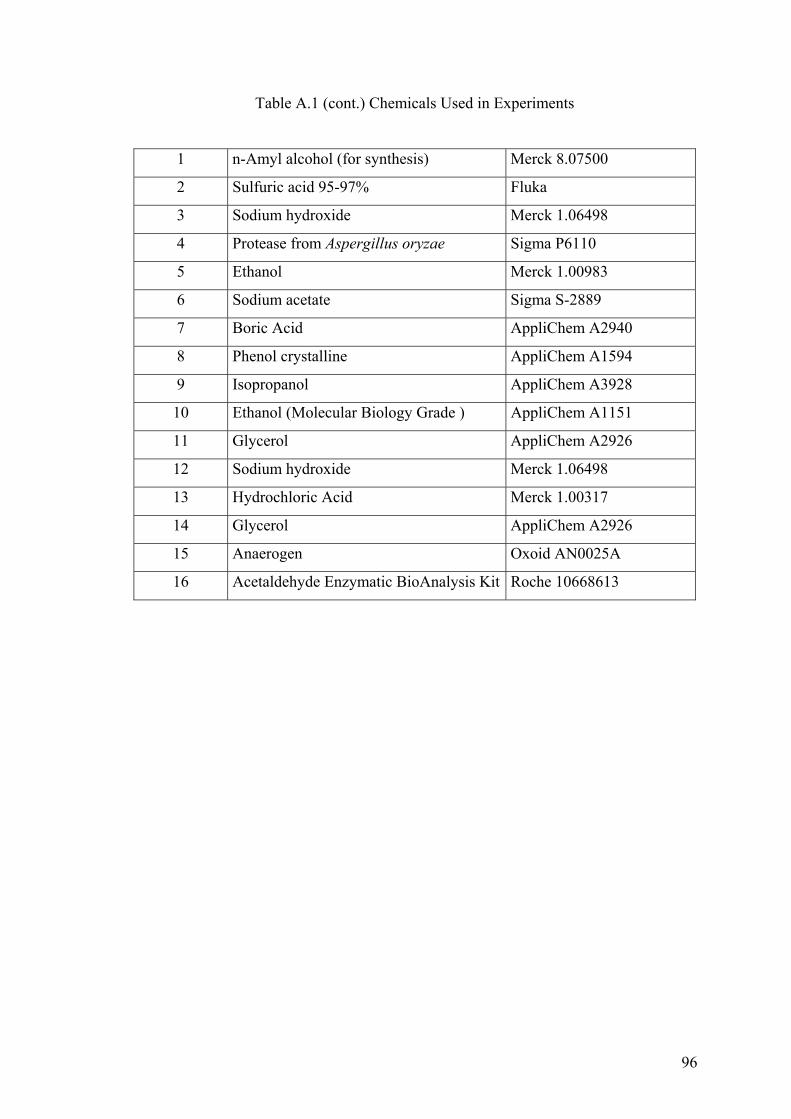
96
Table A.1 (cont.) Chemicals Used in Experiments
1 n-Amyl alcohol (for synthesis) Merck 8.07500
2 Sulfuric acid 95-97% Fluka
3 Sodium hydroxide Merck 1.06498
4 Protease from Aspergillus oryzae Sigma P6110
5 Ethanol Merck 1.00983
6 Sodium acetate Sigma S-2889
7 Boric Acid AppliChem A2940
8 Phenol crystalline AppliChem A1594
9 Isopropanol AppliChem A3928
10 Ethanol (Molecular Biology Grade ) AppliChem A1151
11 Glycerol AppliChem A2926
12 Sodium hydroxide Merck 1.06498
13 Hydrochloric Acid Merck 1.00317
14 Glycerol AppliChem A2926
15 Anaerogen Oxoid AN0025A
16 Acetaldehyde Enzymatic BioAnalysis Kit Roche 10668613

97
APPENDIX B
PROCEDURES FOR ACETALDEHYDE AND EXOPOLYSACCHARIDES
B.1. Acetaldehyde Determination Procedures
The main steps in acetaldehyde determination procedures were as follows:
• 40 mg yogurt were weighted accurately into a falcon tube
• 4 ml citric acid (20% w/v) was added
• Mixture was stirred slightly and transferred into a 50 ml falcon tube and
subsequently filled up to the 50 ml mark with distilled water
• Each mixture was filtered through a fluted filter paper. Clear filtered
solution was used for the enzymatic analysis
• 200 μl clear yogurt solution was firstly mixed with the reaction mixture
which did not contain enzyme and measured spectrophotometrically at
340 nm.
• This solution was mixed with the enzyme solution and final absorbance
was read at 340 nm.
• The last two steps were done for the blank solution which did not contain
yogurt solution.
• Lastly, the amount of acetaldehyde in the yogurt sample was determined
by the equation given below
ΔA = (A2-A1)sample - (A2-A1)blank (Eq. 1)
ΔA = Absorbance difference of yogurt sample and blank solution
A2sample = Absorbance of yogurt sample with enzyme
A1sample = Absorbance of yogurt sample without enzyme
A2blank = Absorbance of blank solution with enzyme
A1blank = Absorbance of blank solution without enzyme

98
The general equation for calculating the concentration of acetaldehyde:
C = V x MW x ΔA (g/l) (Eq. 2) ε x d x v x 1000 V = final volume (ml) v = sample volume (ml) MW = molecular weight of the substance to be assayed (g/mol) d = light path (cm) ε = extinction coefficient of NADH at: 340 nm = 6.3 (l × mmol-1 × cm-1) Hg 365 nm = 3.4 (l × mmol-1 × cm-1) Hg 334 nm = 6.18 (l × mmol-1 × cm-1) It follows for acetaldehyde:
C = 3.250 x 44.05 x ΔA = 0.7158 x ΔA (g acetaldehyde/l sample soln.) ε x 1.00 x 0.200 x 1000 ε
Content acetaldehyde = C acetaldehyde (g/l sample soln.) x 100 (g/100g) (Eq. 3) Weight sample in g/l sample soln.
B.2. EPS Determination Procedures
The revised protocol for EPS assay was carried out as follows:
• Swirl to mix culture medium in bottle to ensure homogeneity
• Adjust the pH of the sample to pH 7 with NaOH
• Add 100 μL of filter-sterilized Protease(10% w/w) to 10mL of sample
• Incubate the sample at 50 °C in a shaker (Forma Orbital Shaker, Thermo
Electron Corporation, USA) for 4 h.
• Vortex the sample for approximately 15s
• Pipette 2.9 ml of distilled water and 7 ml of chilled absolute ethanol into
the falcon tube
• Pipette 100 μL of culture medium into the falcon tube
• Leave the sample overnight at 4°C

99
• Centrifuge samples (maximum of 8 tubes at a time) at 27,000g, 4°C for
40 min (J-A 20 Fixed Angle Rotor, Beckman Coulter Avanti, USA)
• After centrifugation, carefully decant supernatant (separate it from
pellet)
• Invert the tubes on a piece of paper towel for approximately 10 min
• Pipette 3 ml of distilled water to re-suspend the pellet in the centrifuge
tube
• Pipette 7 ml of chilled 99.7% ethanol into the centrifuge tube
• Repeat step 8-10
• Re-suspend pellet in 1 ml of distilled water
• Transfer the sample to an eppendorf tube
• Prepare a blank sample using distilled water (1 ml)
• Add 1 ml of 5% (w/v) phenol solution to the sample and mix using a
vortex for 15 s
• Add 5 ml of concentrated sulphuric acid directly to sample
• Mix the sample thoroughly using a vortex
• Leave the sample to stand for 30 min
• Read absorbance at 485 nm (Shimadzu-UV-Visible Spectrophotometer,
Japan). Use the blank as the reference sample
• Obtain the amount of EPS from the glucose standard curve
• Amount of EPS is multiplied by 10 to account for the dilution factor
• Amount of EPS = EPS of the test sample – EPS of control sample