Embed Size (px)
Citation preview

nn
UNIVERSITAT ROVIRA I VIRGILI GRAPE PHENOLIC MATURITY; DETERMINATION METHODS AND CONSEQUENCES ON WINE PHENOLIC COMPOSITION Nikolaos Kontoudakis ISBN:978-84-693-7682-9/DL:T-1754-2010

nn
Nikolaos Kontoudakis
Grape phenolic maturity; Determination methods and
consequences on wine phenolic composition
Ph Doctoral Thesis
Directed by Dr. Fernando Zamora and Dr. Joan Miquel Canals
Departament de Bioquímica i Biotecnologia
Tarragona 2010
UNIVERSITAT ROVIRA I VIRGILI GRAPE PHENOLIC MATURITY; DETERMINATION METHODS AND CONSEQUENCES ON WINE PHENOLIC COMPOSITION Nikolaos Kontoudakis ISBN:978-84-693-7682-9/DL:T-1754-2010

nn
UNIVERSITAT ROVIRA I VIRGILI GRAPE PHENOLIC MATURITY; DETERMINATION METHODS AND CONSEQUENCES ON WINE PHENOLIC COMPOSITION Nikolaos Kontoudakis ISBN:978-84-693-7682-9/DL:T-1754-2010

nn
UNIVERSITAT ROVIRA I VIRGILI GRAPE PHENOLIC MATURITY; DETERMINATION METHODS AND CONSEQUENCES ON WINE PHENOLIC COMPOSITION Nikolaos Kontoudakis ISBN:978-84-693-7682-9/DL:T-1754-2010

nn
UNIVERSITAT ROVIRA I VIRGILI GRAPE PHENOLIC MATURITY; DETERMINATION METHODS AND CONSEQUENCES ON WINE PHENOLIC COMPOSITION Nikolaos Kontoudakis ISBN:978-84-693-7682-9/DL:T-1754-2010

nn
Departament de Bioquímica i Biotecnologia
C/ Marcel·lí Domingo s/n
43007 Tarragona
Telf: 977 558043
Fax: 977 558232
Fernando Zamora Marín i Joan Miquel Canals, professors del Departament de Bioquímica i
Biotecnologia de la Universitat Rovira i Virgili,
CERTIFIQUEM:
Que aquest treball, titulat “Grape phenolic maturity; Determination methods and consequences
on wine phenolic composition”, que presenta Nikolaos Kontoudakis per a l’obtenció del títol de
Doctor, ha estat realitzat sota la nostra direcció al Departament de Bioquímica i Biotecnologia
d’aquesta universitat i que acompleix els requeriments per poder optar a Menció Europea.
Tarragona, 6 de Maig de 2010
Fernando Zamora Marín Joan Miquel Canals
UNIVERSITAT ROVIRA I VIRGILI GRAPE PHENOLIC MATURITY; DETERMINATION METHODS AND CONSEQUENCES ON WINE PHENOLIC COMPOSITION Nikolaos Kontoudakis ISBN:978-84-693-7682-9/DL:T-1754-2010

nn
UNIVERSITAT ROVIRA I VIRGILI GRAPE PHENOLIC MATURITY; DETERMINATION METHODS AND CONSEQUENCES ON WINE PHENOLIC COMPOSITION Nikolaos Kontoudakis ISBN:978-84-693-7682-9/DL:T-1754-2010

nn
Acknowledgements
Original Greek English Translation
Σα βγείς στον πηγαιµό για την Ιθάκη,
να εύχεσαι νάναι µακρύς ο δρόµος,
γεµάτος περιπέτειες, γεµάτος γνώσεις.
....
Η Ιθάκη σ' έδωσε το ωραίο ταξίδι.
Χωρίς αυτήν δεν θά βγαινες στον δρόµο.
Αλλο δεν έχει να σε δώσει πια.
Κι αν πτωχική την βρεις, η Ιθάκη δεν σε γέλασε.
Ετσι σοφός που έγινες, µε τόση πείρα,
ήδη θα το κατάλαβες η Ιθάκες τι σηµαίνουν.
When you set out on your journey to Ithaca,
pray that the road is long,
full of adventure, full of knowledge.
...
Ithaca has given you the beautiful voyage.
Without her you would have never set out on the road.
She has nothing more to give you.
And if you find her poor, Ithaca has not deceived you.
Wise as you have become, with so much experience,
you must already have understood what Ithacas mean.
K. Καβάφης, 1911. C. Cavafis, 1911.
As Odysseys everyone has its ‘Ithaca’; put its targets and want to make them true. One of mine
‘Ithaca’s’ was to realize a doctorate in Oenology. This target now is almost realized. It wasn’t an easy
‘travel’, however, it offers my many experiences and it was full of emotions. At this long trip, I
wasn’t alone. Many persons help me all this time to get here, where I am now. The contact with all
those people, from the beginning until now, filled me with strength and courage and I am grateful
to them.
First of all, I would like to thank me first contacts in Spain, when I was still in Greece and I was
looking over for a PhD program. I contacted first with the university of Salamanca and then with
the university of Rovila I Virgili. They really tried to understand me necessities and give me the
possible alternatives to satisfy them. After those contacts I decided to go to Tarragona and begun to
find a group to work with them. I came in touch with my actual supervisors expressing my interest
in wine technology. They trust me from the beginning and they encourage me to every step of me
work. Of course it was little bit difficult at least the first months, as I didn’t speak Spanish, but
UNIVERSITAT ROVIRA I VIRGILI GRAPE PHENOLIC MATURITY; DETERMINATION METHODS AND CONSEQUENCES ON WINE PHENOLIC COMPOSITION Nikolaos Kontoudakis ISBN:978-84-693-7682-9/DL:T-1754-2010
nn
finally we could communicate with any problem, with the build of a relation of respect and
understanding. For that reason I would like to express my gratitude to make me part of the group.
From the first days in the laboratory the technicians of our department as also the workers of the
experimental winery of the university were a great support in every moment. Actually, they solved
every problem that appears and without their help it would have been difficult to make any work.
For that reason I would like to thank them, as also the actual secretariat of biotechnology
department for their support. Moreover, I would like to thank the professors of the department that
they were there to give me advises at every question that I had.
My instants in Port, permits me to know the other part of Iberian Peninsula. I become in contact
with the group of professors and students of the department of chemistry that works with
polyphenols. They make a really good work and permit me to have a better knowledge about this
group of compounds. They accept me and made my stay there comfortable and I am glad that I visit
their town and laboratory.
These lines serve to show my appreciation to all the friends and colleagues that I made in Tarragona.
With my arrival in the town, I began to know people, form Catalonia, Spain, Europe, Latin America,
Africa…The most of them doctorates like me, some of them colleagues of the laboratory, but all good
friends. We shared good and bad moments, in the work, out of the work and we developed
relationships that I hope their will withstand through the time.
With one of these relationships we share more than a friendship. She became my partner, ‘mi
pequeñita’, who stand by me every moment. She is a follower traveler for the next ‘Ithacas’.
Finally, I would like to thanks my family, especially my parents, my brother and my grandfathers,
for their support all these years. Great part of this endeavor belongs to them and it would have been
impossible without their encouragement and perseverance.
Now let the ‘muse’ to narrate us the records…
UNIVERSITAT ROVIRA I VIRGILI GRAPE PHENOLIC MATURITY; DETERMINATION METHODS AND CONSEQUENCES ON WINE PHENOLIC COMPOSITION Nikolaos Kontoudakis ISBN:978-84-693-7682-9/DL:T-1754-2010

nn
Dedicated to
my parents, my brother and mi pequeñita.
UNIVERSITAT ROVIRA I VIRGILI GRAPE PHENOLIC MATURITY; DETERMINATION METHODS AND CONSEQUENCES ON WINE PHENOLIC COMPOSITION Nikolaos Kontoudakis ISBN:978-84-693-7682-9/DL:T-1754-2010

nn
UNIVERSITAT ROVIRA I VIRGILI GRAPE PHENOLIC MATURITY; DETERMINATION METHODS AND CONSEQUENCES ON WINE PHENOLIC COMPOSITION Nikolaos Kontoudakis ISBN:978-84-693-7682-9/DL:T-1754-2010

nn
I�DEX
I. I�TRODUCTIO� 5
1. Phenolic composition of grapes and wines ………………………………… 5
1.1. Non- flavonoids...……….…………………………………………... 6
1.1.1. Phenolic acids …………………………………………...... 6
1.1.2. Stilbenes ………………………………………………….. 7
1.2. Flavonoids …………………………………………………………. 8
1.2.1. Flavonols ……………………………………………….… 9
1.2.2. Flavanonols and flavones ……………………………..… 9
1.2.3. Flavanols …………………………………………………. 10
1.2.4. Anthocyanins …………………………………………..… 12
2. Anthocyanins and proantocyanidin evolution during berry ripening 14
2.1. Factors influencing phenolic synthesis and accumulation during berry ripening …………………………………………………….…
15
2.2. Influence of phenolic composition of grapes on wine composition and its sensoriality; the phenolic maturity concept …………………………………………………………………….…
17
2.3. Methods for determining phenolic maturity …………….………… 19
3. Anthocyanins and proanthocyanidin evolution during winemaking and aging ………………………………………………………………..........….
20
3.1. Extraction kinetics of anthocyanins and flavan-3-ols during red winemaking …………………………………………………….…...
20
3.2. Evolution of phenolic compounds during wine aging ………….… 22
3.3. Sensory implications of phenolic compounds …………………..... 29
UNIVERSITAT ROVIRA I VIRGILI GRAPE PHENOLIC MATURITY; DETERMINATION METHODS AND CONSEQUENCES ON WINE PHENOLIC COMPOSITION Nikolaos Kontoudakis ISBN:978-84-693-7682-9/DL:T-1754-2010

nn
4. Impact of climate change on grape maturity; implications on wine composition and quality …………………………………………..……….
31
4.1. The Climate Change …………………………………………….… 31
4.2. Impact of climate change on grape maturity; implications on wine quality ……………………………………………………………….
32
4.3. Winemaking techniques for reducing impact of climate change on wine quality …………………………………………………………
36
References ……………………………………………………………….… 39
II. HYPOTHESIS A�D OBJECTIVES …………………………………...………. 53
III. RESULTS …………………………………………………………………..……. 59
i. Comparison of methods for estimating phenolic maturity in grapes: Correlation between predicted and obtained parameters …………………
61
ii. Influence of the heterogeneity of grape phenolic maturity at harvest time on wine composition and quality …………………………………………..…..
81
iii. Use of unripened grapes harvested during cluster thinning as a method for obtaining wines with lower pH and ethanol content ……………………….
107
iv. Influence of wine pH in the changes of color and polyphenol composition induced by micro-oxygenation …………………………………….………
131
IV. DISCUSSIO� A�D PERSPECTIVES ……………………………...…………. 159
V. GE�ERAL CO�CLUSIO�S ……………………………………………..……. 171
UNIVERSITAT ROVIRA I VIRGILI GRAPE PHENOLIC MATURITY; DETERMINATION METHODS AND CONSEQUENCES ON WINE PHENOLIC COMPOSITION Nikolaos Kontoudakis ISBN:978-84-693-7682-9/DL:T-1754-2010
nn
I.I�TRODUCTIO�
UNIVERSITAT ROVIRA I VIRGILI GRAPE PHENOLIC MATURITY; DETERMINATION METHODS AND CONSEQUENCES ON WINE PHENOLIC COMPOSITION Nikolaos Kontoudakis ISBN:978-84-693-7682-9/DL:T-1754-2010

nn
UNIVERSITAT ROVIRA I VIRGILI GRAPE PHENOLIC MATURITY; DETERMINATION METHODS AND CONSEQUENCES ON WINE PHENOLIC COMPOSITION Nikolaos Kontoudakis ISBN:978-84-693-7682-9/DL:T-1754-2010

nn
Introduction
5
I�TRODUCTIO�
Wine has a long recorded history that goes back more than 7.5 thousand years. The earliest
suspected wine residues come from the early to mid-fifth millennium b.c. – Hajji Firuz Tepe, in
the northern Zagros Mountains of Iran (Duque et al. 2005). In ancient times, wine was
considered to be a magical, spontaneous gift of nature and has been highly regarded by high
society, witnessing essential in any important event.
Nowadays, wine is an integral component of the culture of many countries and is expanding in
new ones. Consumers in the traditional producer countries as also in the ‘new world’, demand
for high quality wines. Especially, for the red wines consumers are looking to find wines with
deep red color, full body, soft tannins and fruit scents. To obtain these characteristics one of the
essential parameters is that grapes have achieved a high grape phenolic maturity.
This introduction focuses on the importance of grape phenolic compounds in wine quality, the
importance of predicting phenolic maturity and the probable consequences that a high phenolic
maturity can produce in wine characteristics.
1. Phenolic composition of grapes and wines
Phenolic compounds represent a large group of molecules which are present in grape and wine
with an essential role in enology. The phenolic compounds of the grapes contribute to wine
organoleptic characteristics such as color, taste, astringency and bitterness and their capacity for
aging (Ribéreau-Gayon et al. 2006). The antioxidant properties of phenolic compounds have
also been associated the moderate consume of red wine with health-promoting effects (Pitsavos
et al. 2005). This phenomena was initially known as ‘‘French paradox’’ (Renaud and de
Lorgeril 1992). More recently, a special interest has been devoted to phenolic compounds for
their anticarcenogenic ability (Block 1992) and the neuroprotective effect (Ma et al. 2010).
From a chemical standpoint, the phenolic compounds dispose a benzenic ring directly attached
by one or more hydroxyl groups. Their reactivity is due to the acid character of the phenolic
function and to the nucleophilic character of the benzene ring (Monagas et al. 2005).
UNIVERSITAT ROVIRA I VIRGILI GRAPE PHENOLIC MATURITY; DETERMINATION METHODS AND CONSEQUENCES ON WINE PHENOLIC COMPOSITION Nikolaos Kontoudakis ISBN:978-84-693-7682-9/DL:T-1754-2010

nn
Introduction
6
Phenolic compounds can be classified in various ways. The most common classification is based
on the distinction in flavonoid compounds with a C3-C6-C3 skeleton and non-flavonoid
compounds. Each group is further divided into several families (Figure 1), with share structural
features that confer specific properties such as color, aroma and taste (Cheynier et al. 2006).
Figure-1. Classification of phenolic compounds (adapted from Zamora 2003).
Grapes have flavonoid compounds mainly in the skin, seeds and stem and non-flavonoid mainly
in pulp but also in the other parts of the grapes (Zamora 2003).
1.1. �on- flavonoid
The non-flavonoid compounds present in grapes and wine are phenolic acids and stilbenes.
1.1.1. Phenolic acids
Phenolic acid compounds are divided into hydroxybenzoic and hydroxicinnamic acids.
Hydroxybenzoic acids are derived from benzoic acid and possess a C6-C1 skeleton. Grapes
Benzoic acids
Phenolic acids
Non flavonoids Cinamic acids
Stilbenes
Flavonols
Flavononols and flavones
Flavonoids Catechins
Flavanols Procyanidins
Condensed tannins
Prodelphinidins
Anthocyanins
UNIVERSITAT ROVIRA I VIRGILI GRAPE PHENOLIC MATURITY; DETERMINATION METHODS AND CONSEQUENCES ON WINE PHENOLIC COMPOSITION Nikolaos Kontoudakis ISBN:978-84-693-7682-9/DL:T-1754-2010
nn
Introduction
7
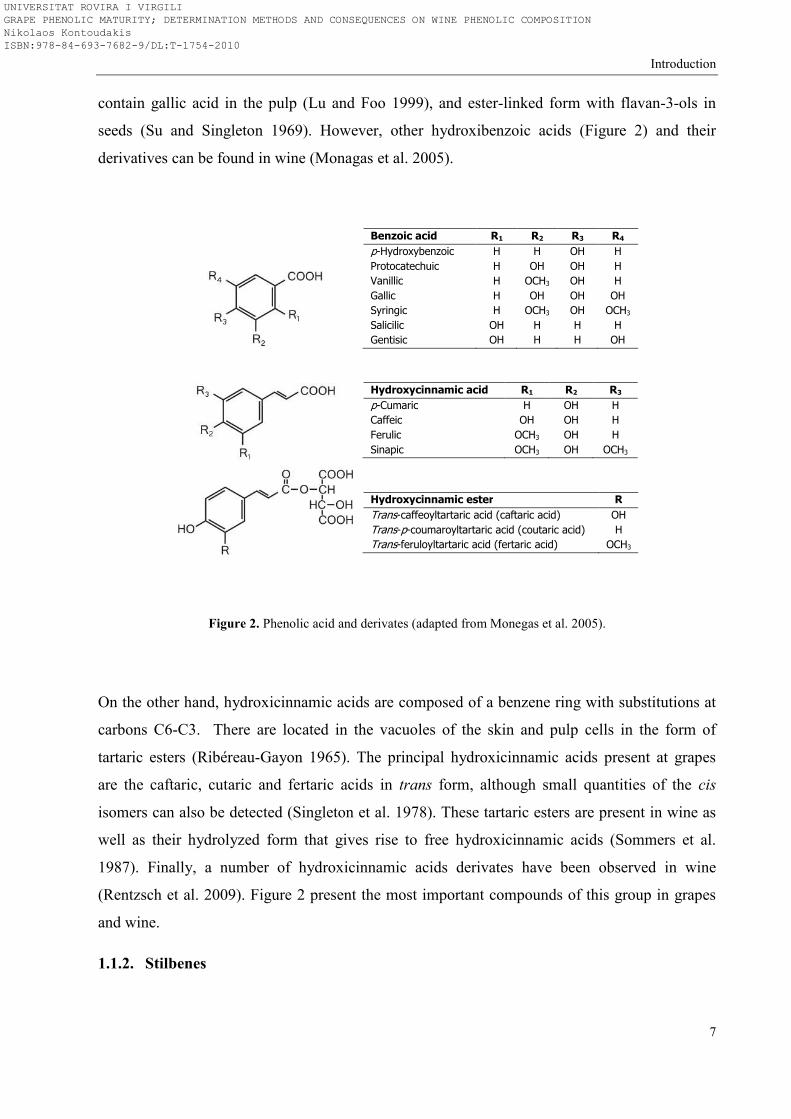
contain gallic acid in the pulp (Lu and Foo 1999), and ester-linked form with flavan-3-ols in
seeds (Su and Singleton 1969). However, other hydroxibenzoic acids (Figure 2) and their
derivatives can be found in wine (Monagas et al. 2005).
Figure 2. Phenolic acid and derivates (adapted from Monegas et al. 2005).
On the other hand, hydroxicinnamic acids are composed of a benzene ring with substitutions at
carbons C6-C3. There are located in the vacuoles of the skin and pulp cells in the form of
tartaric esters (Ribéreau-Gayon 1965). The principal hydroxicinnamic acids present at grapes
are the caftaric, cutaric and fertaric acids in trans form, although small quantities of the cis
isomers can also be detected (Singleton et al. 1978). These tartaric esters are present in wine as
well as their hydrolyzed form that gives rise to free hydroxicinnamic acids (Sommers et al.
1987). Finally, a number of hydroxicinnamic acids derivates have been observed in wine
(Rentzsch et al. 2009). Figure 2 present the most important compounds of this group in grapes
and wine.
1.1.2. Stilbenes
Benzoic acid R1 R2 R3 R4
p-Hydroxybenzoic
Protocatechuic
Vanillic
Gallic
Syringic
Salicilic
Gentisic
H
H
H
H
H
OH
OH
H
OH
OCH3
OH
OCH3
H
H
OH
OH
OH
OH
OH
H
H
H
H
H
OH
OCH3
H
OH
Hydroxycinnamic acid R1 R2 R3
p-Cumaric
Caffeic
Ferulic
Sinapic
H
OH
OCH3
OCH3
OH
OH
OH
OH
H
H
H
OCH3
Hydroxycinnamic ester R
Trans-caffeoyltartaric acid (caftaric acid)
Trans-p-coumaroyltartaric acid (coutaric acid)
Trans-feruloyltartaric acid (fertaric acid)
OH
H
OCH3
UNIVERSITAT ROVIRA I VIRGILI GRAPE PHENOLIC MATURITY; DETERMINATION METHODS AND CONSEQUENCES ON WINE PHENOLIC COMPOSITION Nikolaos Kontoudakis ISBN:978-84-693-7682-9/DL:T-1754-2010

nn
Introduction
8
Stilbenes are formed by an ethene double bond substituted with a benzene ring on both carbon
atoms of the double bond. The most abundant is the trans-resveratrol. Its chemical structure and
its glucoside derivatives are shown in Figure 3.
Stilbenes can also occur in oligomeric and polymeric form and have been identified in grapevine
and wine (Rentzsch et al. 2009).
It appears that the plant synthesize these compounds as a defense respond to fungal infection
and ultraviolet light irradiation, in leaves, roots and berry skin (Langcake and Pryce 1976,
Jeandet et al. 1991), although there have been detected in other parts of berry especially in seeds
of muscadine grapes (Vitis rotundifolia) (Ector et al. 1996).
Figure 3. Stilbenes (adapted from Monegas et al. 2005).
Stilbenes have no significance in the organoleptic characteristics of wine, however, due to their
potential antioxidative, anticarcinogenic and neuroprotective effects are considered to play a
relevant role in human health (Pérez-López et al. 2009).
1.2. Flavonoids
Flavonoids are characterized by a basic skeleton of 15 carbon atoms (C6-C3-C6) of 2-phenyl-
benzopyrene type and are divided in four major subclasses on the base of the oxidation state of
the pyran ring: the flavonols, the flavanonols and flavones, the flavanols and the anthocyanins
Stilbene R1 R2 R3
Trans-resveratrol
Trans-resveratrol-3-O -glucoside (piceid)
Trans-resveratrol-2-C -glucoside
Trans-astringin
H
H
H
OH
H
glc
H
glc
H
H
glc
H
UNIVERSITAT ROVIRA I VIRGILI GRAPE PHENOLIC MATURITY; DETERMINATION METHODS AND CONSEQUENCES ON WINE PHENOLIC COMPOSITION Nikolaos Kontoudakis ISBN:978-84-693-7682-9/DL:T-1754-2010

nn
Introduction
9
(Cheynier et al. 2000). Among them, flavanols and anthocyanins are the most abundant in grape
and wine and are particularly important to the quality of red wine.
1.2.1. Flavonols
Flavonols are yellow pigments that act as protectors against the ultraviolet light irradiation (Flint
et al. 1985). They are mainly found at grape skin (Cheynier and Rigaud 1986), although they
have also been detected in the pulp (Pereira et al., 2006). In grapes they are present mainly in
the glycosilated form of the four main aglycones (Figure 4). In wine the aglycone form is also
observed, but it is probably originated by the hydrolysis of the glycosilated forms during the
winemaking process (Cheynier et al. 2000).
Figure 4. Flavonol (adapted from Monegas et al. 2005).
1.2.2. Flavanonols and flavones
Flavanonols astilbin and engeletin are the most common compounds of this group (Figure 5).
They have been identified in the skin and wine of white grapes (Trousdale and Singleton, 1983),
in grape pomace (Lu and Foo, 1999), in grape stems (Souquet et al., 2000) and also in red wine
(Vitrac et al., 2001).
Flavonol R1 R2 R3
Kaempferol
Kaempferol-3-O -glucoside
Kaempferol-3-O -galactoside
Kaempferol-3-O -glucuronide
Quercetin
Quercetin-3-O -glucoside
Quercetin-3-O -glucoronide
Myricetin
Myricetin-3-O -glucoside
Myricetin-3-O -glucuronide
Isorhamnetin
Isorhamnetin-3-O -glucoside
H
H
H
H
OH
OH
OH
OH
OH
OH
OCH3
OCH3
H
H
H
H
H
H
H
OH
OH
OH
H
H
H
glc
gal
gluc
H
glc
gluc
H
glc
gluc
H
glc
gal=galactose; glc=glucose; gluc=glucuronide acid
UNIVERSITAT ROVIRA I VIRGILI GRAPE PHENOLIC MATURITY; DETERMINATION METHODS AND CONSEQUENCES ON WINE PHENOLIC COMPOSITION Nikolaos Kontoudakis ISBN:978-84-693-7682-9/DL:T-1754-2010

nn
Introduction
10
Flavones present a similar structure with flavonols (Figure 5). The compounds that are detected
in wine are apigenin, baicalein and luteolin (Wang and Huang, 2004).
Figure 5. Structure of flavononols and flavones.
1.2.3. Flavanols
Flavanols or flavan-3-ols are found in high concentrations in grapes seed, skin and stem
(Escribano-Bailón et al. 1995, Prieur et al. 1994, Souquet et al. 1996, Souquet et al, 2000, Su
and Singleton 1969). They play an important role in wine organoleptic characteristics and they
are found on monomeric, oligomeric and polymeric form.
Flavan-3-ols monomers are often referred as "catechins" and are distinguished by the degree of
hydroxylation of the B ring (Figure 6). In their structure they have two asymmetric carbons (C2
and C3), which makes possible the existence of four optical isomers for each catechin, the (+)/(-
) catechin and (+)/(-) epicatechin. Moreover, the present of a third OH group at the aromatic B
ring leads to the corresponding (+)/(-) gallocatechin and (+)/(-) epigallocatechin. In nature, these
monomers are found as such, although the methylated, glycosylated or acylated derivatives of
them can also be found, mainly the esterified derivatives by gallic acid at C3 position.
In grapes the major flavan-3-ols monomers are (+)-catechin, its isomer (-)-epicatechin and in a
relative high concentration (–)-epicatechin-3-gallate (Cheynier et al. 2000). Also, to a lesser
concentration, (+)-gallocatechin (Piretti et al., 1976), (-)-epigallocatechin (Escribano-Bailón et
al. 1995), (+)-catechin-3-gallate and (+)-gallocatechin-3-gallate (Lee and Jaworski et al. 1990)
UNIVERSITAT ROVIRA I VIRGILI GRAPE PHENOLIC MATURITY; DETERMINATION METHODS AND CONSEQUENCES ON WINE PHENOLIC COMPOSITION Nikolaos Kontoudakis ISBN:978-84-693-7682-9/DL:T-1754-2010

nn
Introduction
11
are detected. Nevertheless, flavan-3-ols monomers represent only a small proportion inasmuch
as the major part of flavan-3-ols is in oligomeric and polymeric form (Zamora 2003).
Flavan-3-ols oligomers and polymers are also known as proanthocyanidins or condensed
tannins. The term tannin refers to the capacity to 'tan' animal hide, which is done by reacting
with the proteins of the animal’s skin. When condensed tannins heated under mineral acid
solution they are hydrolyzed to red anthocyanidin pigments, as result of the acid-catalyze
cleavage of the interflavanic bond, hence the term proanthocyanidins. Proanthocyanidins that
are hydrolyzed to cyanidins are known as procyanidins and are composed from (+)-catechin and
(-)-epicatechin. Nevertheless, in the event that the polymers consist of (+)-gallocatechin and/or
(-)-epigallocatechin units, the acid hydrolysis results in delphinidins and therefore is defined as
prodelphinidins (Porter et al. 1986).
In function of the interflavanic bond nature, proanthocyanidins are distinguished to B-type and
A-type (Figure 6). B-type are those in which links are established between carbon 4 of a flavan-
Figure 6. Flavan-3-ol monomers and dimers of type-A and type-B (adapted from Terrier et al. 2009).
(+)-catechin: R=H, R1=OH, R2=H
(-)-epicatechin: R=H, R1=H, R2=OH
(-)-epicatechin 3-gallate: R=H, R1=H, R2=O-G
(+)-gallocatechin: R=OH, R1=OH, R2=H
(-)-epigallocatechin: R=OH, R1=H, R2=OH
(+)-gallocatechin 3-gallate: R=OH, R1=H, R2=O-G
(-)-epigallocatechin 3-gallate: R=OH, R1=O-G, R2=H
UNIVERSITAT ROVIRA I VIRGILI GRAPE PHENOLIC MATURITY; DETERMINATION METHODS AND CONSEQUENCES ON WINE PHENOLIC COMPOSITION Nikolaos Kontoudakis ISBN:978-84-693-7682-9/DL:T-1754-2010

nn
Introduction
12
3-ol unit (considered ‘‘upper subunit’’ or ‘‘extension’’) and carbons 8 or 6 of another monomer
(called ‘‘lower subunit’’). From the B-type proanthocyanins identified in grapes, B1, Ec-
(4β→8)-Cat, has been reported to be the main oligomer in skins, whereas all C4→C8
proanthocyanidin dimers are usually found in seeds, with the B2, Cat-(4β→8)-Ec, as the most
abundant one (González-Manzano et al. 2004).
Proanthocyanidins of type-A, that are compounds with an C4→C8 or C6 bond and an additional
ether type C2→C7 or C5 bond, have been mention to be present in grapes and wine (Vivas de
Gaulejaac et al. 2001).
1.2.4. Anthocyanins
Anthocyanins (from the Greek anthos-ανθός flower and kyanos-κυανός purple) are mainly
located in the grape skin tissue of red grapes and are responsible for red wine color (Zamora
2003). Also there are some few teinturier varieties that also contain anthocyanins in the pulp
(Castillo-Muñoz et al. 2009).
Anthocyanidin R1 R2Cyanidin
Delphinidin
Peonidin
Petunidin
Malvidin
OH
OH
OCH3
OCH3
OCH3
H
OH
H
OH
OCH3
Figure 7. Anthocyanins (adapted from Monagas et al. 2005).
The anthocyanins are water-soluble pigments, consisting of an aglycon (or anthocyanidin),
derived from the ion flavylium or phenyl-2-benzopyrilium variously substituted, that is attached
to one or more sugar molecules, which in turn can be esterified with different organic acids. The
UNIVERSITAT ROVIRA I VIRGILI GRAPE PHENOLIC MATURITY; DETERMINATION METHODS AND CONSEQUENCES ON WINE PHENOLIC COMPOSITION Nikolaos Kontoudakis ISBN:978-84-693-7682-9/DL:T-1754-2010

nn
Introduction
13
anthocyanins of grapes and wine from Vitis vinifera are the 3-O-monoglucosides and the 3-O-
acylated monoglucosides of the anthocyanidins, delphinidin, cyanidin, petunidin, peonidin and
malvidin. They differ from each other by the number and position of the hydroxyl and methoxyl
groups located in the B-ring of the molecule as shown in Figure 7 (Monagas. and Bartolomé
2009). Moreover, pelargonidin-based anthocyanins have also been detected at red grapes and
wines (Castillo-Muñoz et al. 2009).
Figure 8. Anthocyanin equilibrium depends on the pH (adapted from Ribéreau-Gayon et al. 2006).
Acylation occurs at the C-6 position of the glucose molecule by esterification with acetic, p-
coumaric or caffeic acids (Mazza and Miniati 1993) and lately reported with lactic acid
(Alcalde-Eon et al. 2006). In grapes and wine predominates the 3-O-acetylmonoglucosides and
3-O-coumaroylmonoglucosides of the five main anthocyanidins. The malvidin- and peonidin-3-
O-caffeoylmonoglucosides are found in low concentrations (Ribéreau-Gayon 1968, Baldi et al.
1995). Also the presence of the 3-O-caffeoylmonoglucosides of cyanidin, delphinidin and
petunidin has been reported in few cases (Vidal et al. 2004b). Additionally, it has been recently
UNIVERSITAT ROVIRA I VIRGILI GRAPE PHENOLIC MATURITY; DETERMINATION METHODS AND CONSEQUENCES ON WINE PHENOLIC COMPOSITION Nikolaos Kontoudakis ISBN:978-84-693-7682-9/DL:T-1754-2010

nn
Introduction
14
confirmed the existence of 3,5-diglucosides in grapes and wine (Vidal et al. 2004b, Castillo-
Muñoz et al. 2009), 3,7-diglucosides in wine (Alcalde-Eon et al. 2006) and also anthocyanin
oligomers up to trimers in grape skin extract.
Anthocyanins in aqueous solution exist in the form of four basic structures, the flavylium cation,
the quinoidal anhydrous base, the hemiketal o carbinol pseudo-base and the chalcone base.
There are in equilibrium, depending on the pH (Figure 8). The relative amounts of each of the
structural forms that coexist in equilibrium are a function of pH of the medium and its
substituents. At very acidic pH (pH <2) anthocyanins are mainly in the form of flavylium cation.
The flavylium cation is highly colored and appears red. As pH increases, the flavylium cation
quickly disappears to give rise by deprotonation at several quinoidal base forms which have
bluish color. Another reaction that occurs is the flavylium cation hydration leading to the
formation of colorless carbinol pseudobases. Both reactions occurred simultaneously in
accordance with the equilibrium constants. On the other hand, in weakly acidic medium, when
the temperature of the solutions is high, pseudobase carbinol can be converted to a cis or trans
chalcone by opening the pyrilium ring. The chalcones can be neutrals and colorless or can be
ionized and take a slight yellow color. Reversion to flavylium form by decreasing the pH occurs
much more slowly in the case of the trans than in the case of the cis form, indicating that trans
form could be irreversible.
At the pH of the wine we can consider that there is a balance among the different forms. The red
flavylium form is present only in a small proportion while the major proportion of anthocyanins
is found in colorless or weakly colored forms.
2. Anthocyanins and proantocyanidin evolution during berry ripening
Grape berries development consist of two successive sigmoid growth cycles, which are
separated by a short lag-phase (Coombe 1992). The first period-berry formation-begins after
anthesis, with the fruit set, the cell division-enlargement and with the seeds approaching their
full size. At this phase proanthocyanidins and their respective monomers are accumulated in
seed (epidermis, inner cells of the soft seed coat, and inner cell layer of the inner integument)
(Cadot et al. 2006) and the vacuoles of the grape skin cells (Amrani Joutei and Glories 1995).
UNIVERSITAT ROVIRA I VIRGILI GRAPE PHENOLIC MATURITY; DETERMINATION METHODS AND CONSEQUENCES ON WINE PHENOLIC COMPOSITION Nikolaos Kontoudakis ISBN:978-84-693-7682-9/DL:T-1754-2010

nn
Introduction
15
The lag-phase characterized by little change in berry size, the seed embryo development and the
hardening of the seed coat. The third period-berry ripening- begins at veraison with the onset of
sugar accumulation, the berry softening and an increase in berry size. Parallel, anthocyanins
accumulation in the vacuoles of the skin begins in veraison and rich their maximum
concentration around harvest period (Kennedy et al. 2002, Canals et al. 2005). A decrease in the
total amount of antocyanins just before harvest and/or during over-ripening has been observed in
some works (Mateus et al. 2002, Ryan et al. 2003, Fournand et al. 2006). On the other hand,
proanthocyanidins and flavan-3-ol monomers were maximal in skin and seed before veraison
(Downey et al. 2003). After veraison their behavior is not very clear. Some authors describe a
decrease in skin proanthocyanidins, flavan-3-ol monomers and in the mean degree of
polymerization but others an increase (de Freitas et al. 2000, Kennedy et al. 2001, Habertson et
al. 2002, Kennedy at al. 2002). The flavan-3-ol concentration of seeds diminishes after veraison
and until the harvest, which could be explained by oxidation (Kennedy et al. 2000, Downey et
al. 2003).
In addition, except the quantitative changes that occur during grape development also qualitative
modification has been observed. It is noted a change in the proportional flavan-3-ol
composition. More specific it seems that the proportion of (-)-epicatechin-3-gallate diminish, the
(-)-epicatechin increase and the (+)-catechin has small variation during berry ripening (Kennedy
et al. 2000, Kennedy et al. 2002, Pastor del Rio and Kennedy 2006). The average degree of
polymerization increases with maturity (Downey et al. 2003) although there are studies that
present a decline (Kennedy et al. 2000, Kennedy et al. 2002). Finally, the total amount of berry
proanthocyanidins throughout ripening seems to be decreased (de Freitas et al. 2000, Harbertson
et al. 2002) even though an increase has also been reported (Delgado 2004, Canals et al. 2005).
2.1. Factors influencing phenolic synthesis and accumulation during berry ripening
Phenolic biosynthesis and accumulation through berry ripening is affected by different factors as
genotype, environment and cultural practices.
It is obvious that Vitis vinifera cultivars determine the biosynthesis and accumulation of
phenolic compounds of grapes and therefore wine. They determine the quantitative as also the
UNIVERSITAT ROVIRA I VIRGILI GRAPE PHENOLIC MATURITY; DETERMINATION METHODS AND CONSEQUENCES ON WINE PHENOLIC COMPOSITION Nikolaos Kontoudakis ISBN:978-84-693-7682-9/DL:T-1754-2010

nn
Introduction
16
qualitative phenolic composition. It is characteristic that anthocyanin profile can be used as
chemical markers with the aim of classifying red-grape varieties and wines. Besides the variety,
intravarietal heterogeneity is a factor that induces a very different behavior among the different
clones. It should be noted that most researches in the development of clones have been directed
towards obtaining high yielding clones, resulting in a decrease of color and phenolic
compounds. Therefore, the choice of clone is almost as important as variety.
In additional, rootstock genotypes is related with water and gas exchange status (Candolfi-
Vasconcelos et al. 1994), canopy growth (Koundouras et al. 2008), and yield (Ezzahouani et al.
2005). For that reason, rootstock is possibly affecting phenolic composition (Doazan 1996,
Koundardas et al. 2009). Moreover, the rootstock can also influence the harvest date. Therefore
the choice of rootstock should also take into account their overall influence on the quality of the
raw material.
Environmental factors (topographical, agro-pedological, climatic), usually described by the
French term “terroir”, have been acknowledged to influence grape and wine quality. Sunlight
exposure and temperature are two factors with certain impact on phenolic composition of grapes
(Spayd et al. 2002). Low diurnal and night temperatures have been reported to favor
anthocyanin accumulation whereas high temperatures reduce their concentration. On the
contrary, anthocyanin accumulation seems to be increased linearly with increasing sunlight
exposure. Apart from the concentration, ultraviolet light exposure and temperature are related
with alterations in anthocyanin composition (Downey et al. 2006).
Water conditions have been recognized as one of the most important factors that determine wine
quality. Vine water status has been mentioned to influence accumulation of phenolic compounds
in grapes with a clear positive effect of water deficit on berry phenolic composition (Esteban et
al. 2001). For that reason, rainfall distribution and efficiency are of great importance as also the
soil water storage capacity. Moreover, in relation with the soil characteristics, soil depth,
structure, texture and mainly fertility affect phenolic composition (Downey et al. 2006).
Furthermore, macroclimatic characteristics like topography, latitude and altitude may affect the
grape composition. It was observed an increase in anthocyanin concentration with increasing
altitude from 100-150 meters to above 250 meters. Altitude also affected flavan-3-ol
composition (Mateus et al. 2001, 2002).
UNIVERSITAT ROVIRA I VIRGILI GRAPE PHENOLIC MATURITY; DETERMINATION METHODS AND CONSEQUENCES ON WINE PHENOLIC COMPOSITION Nikolaos Kontoudakis ISBN:978-84-693-7682-9/DL:T-1754-2010

nn
Introduction
17
Agricultural practices modulate the expression of phenolic composition of grapes throughout the
grape ripening process. Cultural aspects such as training system (Zoecklein et al. 2008), row
vine spacing, pruning, bunch thinning, bud and leaf removal as well as the water and fertilize
management (Esteban et al. 2001, González-Neves et al. 2002, Delgado et al. 2004, Poni et al.
2009) noted to have an influence on phenolic biosynthesis and accumulation. Agronomic
practices like conventional, organic or biodynamic systems are also shown to have a relation
with berry phenolic composition (Reeve et al. 2005, Vian et al. 2006).
Finally, other factors that may have an impact in phenolic composition of grapes are the vine
age (Reynolds et al. 2007) and pathogenesis (Amati et al. 1996).
2.2. Influence of phenolic composition of grapes on wine composition and its sensoriality;
the phenolic maturity concept
For the production of high quality wines is crucial, without any doubt, the degree of ripeness of
the grapes. It should be noted that the maturation process affects not only the concentration of
sugars and acids in berries, but also exerts, as it was already mentioned, a large effect on the
phenolic composition of the grapes.
Anthocyanins and flavan-3-ols composition of the grapes at the harvest time have a great
influence on wine color and color stability during wine aging. Consequently, more ripen grapes,
would permit the elaboration of wines with deep red color. The ripen grapes, besides having a
higher concentration of anthocyanins, present also a greater extractability of phenolic
compounds from grape skin. Differences of polysaccharides, based on galactose and arabinose,
together with the cellulose content and the degree of methylation of the pectins could be
responsible for different anthocyanin extractability, keeping in mind that differences on the
thickness or density of the skin cell-wall could also influence the extractability (Ortega-Regules
et al. 2006).
Additionally, flavan-3-ols composition of grapes, especially originated from seeds, affects the
astringency and the tannic intensity of the grapes and wines. The tendency is to diminish as the
maturity degree increases (Llaudy et al. 2008). This fact is related not only with the total
quantity of flavan-3-ols since sometimes samples containing higher contents in flavano-3-ols
can exhibit less astringency and tannic intensity than others with lower ones (Ferrer-Gallego et
UNIVERSITAT ROVIRA I VIRGILI GRAPE PHENOLIC MATURITY; DETERMINATION METHODS AND CONSEQUENCES ON WINE PHENOLIC COMPOSITION Nikolaos Kontoudakis ISBN:978-84-693-7682-9/DL:T-1754-2010
nn
Introduction
18
al. 2010). It has been suggested that the qualitative profile of grapes can affect these sensorial
parameters. In fact, the degree of galloylation correlates well with astringency (Vidal et al.
2003). For that reason a decrease of galloylation during grape maturity may diminish
astringency of grapes and wines. Moreover, the greatest the degree of polymerization the
greatest the astringency (Vidal et al. 2003), so the degree of polymerization of the grape
proanthocyanidins at the harvest time will have an effect on wine astringency.
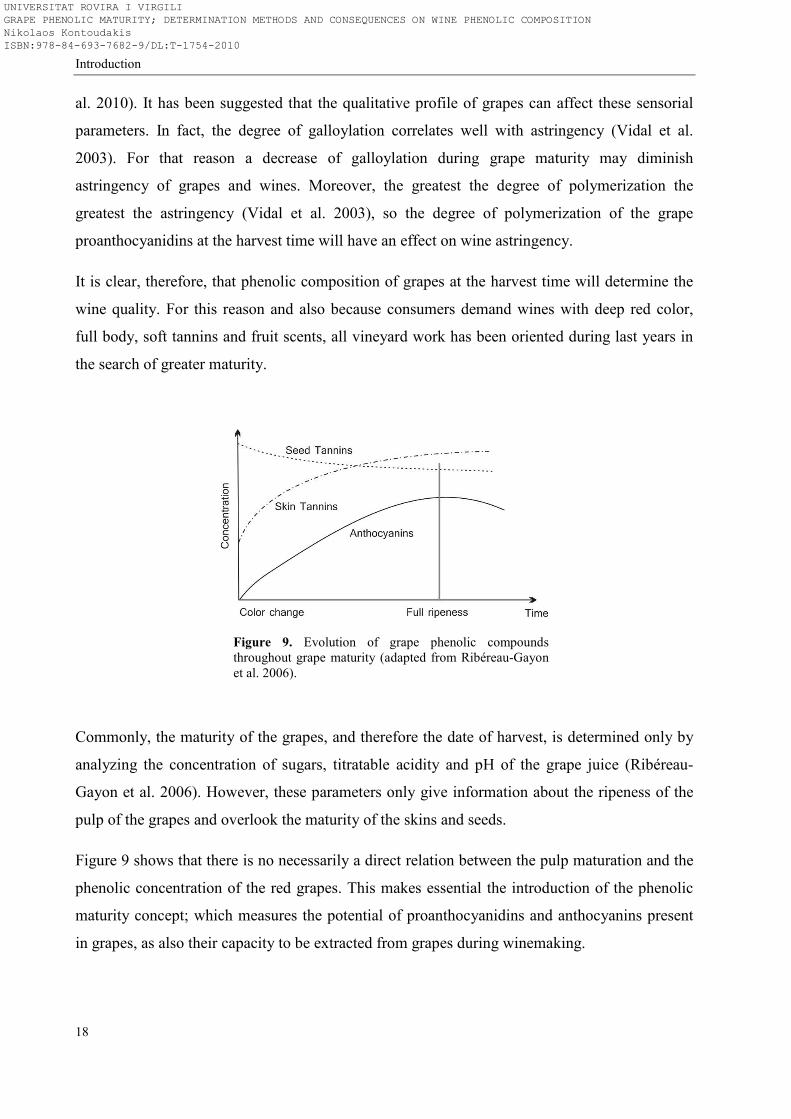
It is clear, therefore, that phenolic composition of grapes at the harvest time will determine the
wine quality. For this reason and also because consumers demand wines with deep red color,
full body, soft tannins and fruit scents, all vineyard work has been oriented during last years in
the search of greater maturity.
Figure 9. Evolution of grape phenolic compounds throughout grape maturity (adapted from Ribéreau-Gayon et al. 2006).
Commonly, the maturity of the grapes, and therefore the date of harvest, is determined only by
analyzing the concentration of sugars, titratable acidity and pH of the grape juice (Ribéreau-
Gayon et al. 2006). However, these parameters only give information about the ripeness of the
pulp of the grapes and overlook the maturity of the skins and seeds.
Figure 9 shows that there is no necessarily a direct relation between the pulp maturation and the
phenolic concentration of the red grapes. This makes essential the introduction of the phenolic
maturity concept; which measures the potential of proanthocyanidins and anthocyanins present
in grapes, as also their capacity to be extracted from grapes during winemaking.
UNIVERSITAT ROVIRA I VIRGILI GRAPE PHENOLIC MATURITY; DETERMINATION METHODS AND CONSEQUENCES ON WINE PHENOLIC COMPOSITION Nikolaos Kontoudakis ISBN:978-84-693-7682-9/DL:T-1754-2010

nn
Introduction
19
2.3. Methods for measuring phenolic maturity
The determination of phenolic maturity is very useful for deciding the optimum harvest date.
Furthermore, the knowledge of phenolic ripeness of the grapes can be very useful for the
classification of grapes at the winery in accordance with their level of quality and even to
influence, by the adequate winemaking method, on the level of phenolic compounds extraction
(Zamora 2003).
In recent years, several methods have been proposed to determine the phenolic maturity. Among
the different techniques that have been development, the most applied methods are based on
obtaining extracts from grapes with maceration in different solvents. Probably the most used
method is that described by Glories (Glories and Agustin 1993., Saint-Cricq de Gaulejac et al.
1998). Nowadays, other methods are also used like the ITV method (Dupuch, 1993, Lamadon
1995, Cayla et al. 2002) developed by the Institut Français de la Vigne et du Vin and the method
proclaimed by Iland (2004). However, all these methods are slow, laborious and require the
participation of well-trained technicians.
Recently, the group of Celotti has proposed an extraction using microwaves that permits
accelerate the extraction time (Celotti et al. 2007a). Besides, another method, Cromoenos, has
begun to be popular, especially in Spain, as allows very rapid and easy determination
(Cromoenos 2010). In addition, it should be noted that the techniques FTIR (Fourier Transform
Infrared) are already being applied in the analysis of the extracts, which should allow more
complex analytical results achieved at present (Dubernet et al. 2000).
The principle of these methods consists on rapidly extraction of the anthocyanins and
proanthocyanidins from the skins and partial extraction of seeds proanthocyanidins, with
roughly crushing of grapes and maceration in the proposed solvent and subsequent analysis of
the parameters that are considered more appropriate. In that way it can be assessed the phenolic
maturity of the grapes and the phenolic content of the future wine.
Moreover, the last years have been presented techniques that consist on the determination of the
physical characteristics of the grapes, directly at the vineyard. Such methods are the skin texture
parameters, like the grape skin hardness and thickness (Segade et al. 2008), the direct
measurement of the color absorption of the grape skins, based on the screening of fruit
UNIVERSITAT ROVIRA I VIRGILI GRAPE PHENOLIC MATURITY; DETERMINATION METHODS AND CONSEQUENCES ON WINE PHENOLIC COMPOSITION Nikolaos Kontoudakis ISBN:978-84-693-7682-9/DL:T-1754-2010

nn
Introduction
20
chlorophyll fluorescence, that allows both flavan-3-ol and anthocyanin contents of intact berry
skin to be measured (Celotti et al. 2007b, Cerovic et al. 2008) and the most advanced method,
the analysis of multispectral airborne high resolution images (Lamb et al. 2004). These
techniques reduce drastically the analysis time, but need more experimentation to demonstrate
their reliability and repeatability.
Finally, the methods based on tasting grape berries and seeds have been introduced in recent
years (Le Moigne et al. 2008). These methods are really very useful for determining grape
maturity. However, tasting methods require experience, a laborious sampling and their
parameterization is very difficult. For all those reasons, tasting methods are applied mainly to
small and highly controlled vineyards.
3. Anthocyanins and proantocyanidin evolution during winemaking and aging
Immediately after the harvest the winemaking process begins. During this process the diffusion
and extraction of the grape phenolic compounds take place and a perpetual evolution of the
phenolic composition of the must at beginning and of the wine later occurs with the participation
of biochemical and chemical phenomena.
3.1. Extraction kinetics of anthocyanins and flavan-3-ols during red winemaking
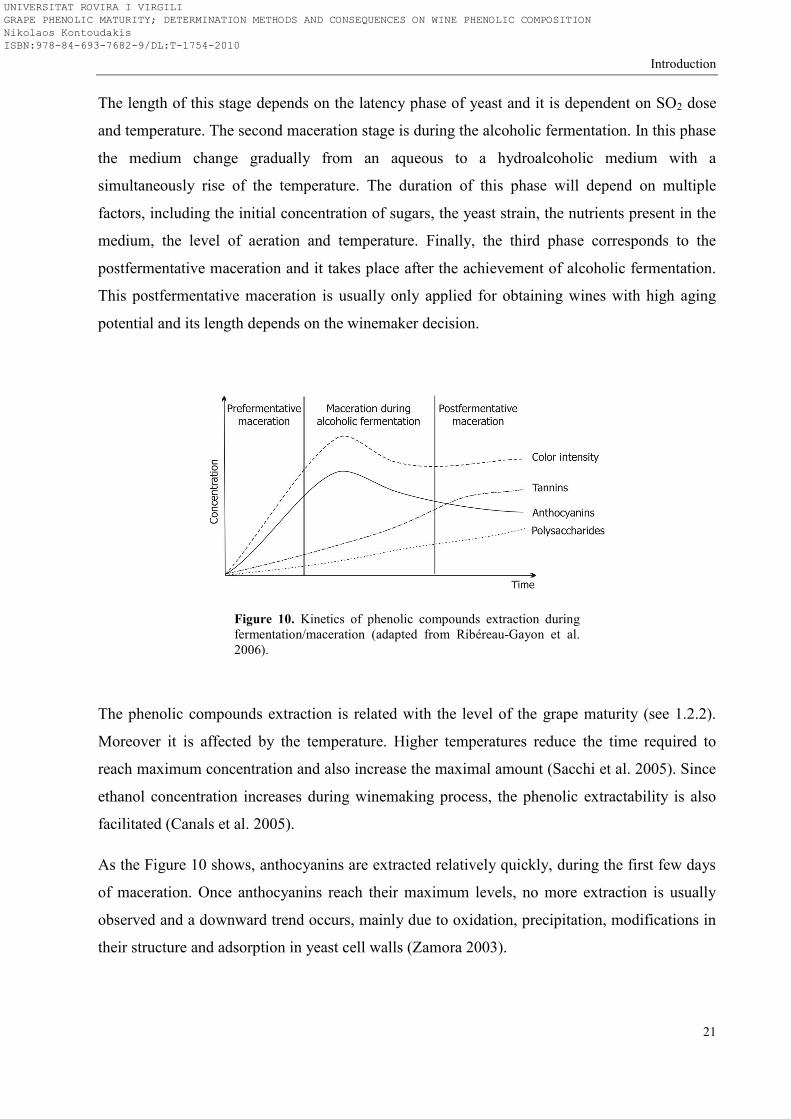
The winemaking of red wines is a complex process in which two phenomena take place
simultaneously: alcoholic fermentation and maceration. It is the superposition of both
phenomena which affects the kinetics of solubilization of most of the molecules of wine
organoleptic impact (Zamora 2003). Figure 10 shows the kinetics of phenolic compounds
extraction during fermentation / maceration (Ribéreau-Gayon et al. 2006).
According to this figure, the maceration is composed of three stages. The first one is the
prefermentative maceration, which is the period before the beginning of the alcoholic
fermentation. Therefore, takes place in an aqueous medium at generally moderate temperatures.
UNIVERSITAT ROVIRA I VIRGILI GRAPE PHENOLIC MATURITY; DETERMINATION METHODS AND CONSEQUENCES ON WINE PHENOLIC COMPOSITION Nikolaos Kontoudakis ISBN:978-84-693-7682-9/DL:T-1754-2010
nn
Introduction
21
The length of this stage depends on the latency phase of yeast and it is dependent on SO2 dose
and temperature. The second maceration stage is during the alcoholic fermentation. In this phase
the medium change gradually from an aqueous to a hydroalcoholic medium with a
simultaneously rise of the temperature. The duration of this phase will depend on multiple
factors, including the initial concentration of sugars, the yeast strain, the nutrients present in the
medium, the level of aeration and temperature. Finally, the third phase corresponds to the
postfermentative maceration and it takes place after the achievement of alcoholic fermentation.
This postfermentative maceration is usually only applied for obtaining wines with high aging
potential and its length depends on the winemaker decision.
Figure 10. Kinetics of phenolic compounds extraction during fermentation/maceration (adapted from Ribéreau-Gayon et al. 2006).
The phenolic compounds extraction is related with the level of the grape maturity (see 1.2.2).
Moreover it is affected by the temperature. Higher temperatures reduce the time required to
reach maximum concentration and also increase the maximal amount (Sacchi et al. 2005). Since
ethanol concentration increases during winemaking process, the phenolic extractability is also
facilitated (Canals et al. 2005).
As the Figure 10 shows, anthocyanins are extracted relatively quickly, during the first few days
of maceration. Once anthocyanins reach their maximum levels, no more extraction is usually
observed and a downward trend occurs, mainly due to oxidation, precipitation, modifications in
their structure and adsorption in yeast cell walls (Zamora 2003).
UNIVERSITAT ROVIRA I VIRGILI GRAPE PHENOLIC MATURITY; DETERMINATION METHODS AND CONSEQUENCES ON WINE PHENOLIC COMPOSITION Nikolaos Kontoudakis ISBN:978-84-693-7682-9/DL:T-1754-2010

nn
Introduction
22
Flavan-3-ols are extracted more slowly. At the beginning of the maceration when the
temperature is still moderate and alcohol concentration is still low, the extraction is very slow.
However, as the alcoholic fermentation progresses, alcohol and temperature increases which
favor flavan-3-ols extraction (Canals et al. 2005, Sacchi et al. 2005).
It is also necessary to distinguish between the flavan-3-ols released by skins and seeds because
their extraction kinetic is different. The flavan-3-ols of the skins starts to be dissolved at the
same time that anthocyanins, although their release is slower and longer. In contrast, the flavan-
3-ols of the seeds do not begin to dissolve until the middle of fermentation.
Flavan-3-ols extraction increases throughout fermentation and maceration. At the beginning of
the maceration flavan-3-ols composition is characterized by an important presence of skins
flavan-3-ols. The extension of maceration process leads to a progressively increase of seeds
flavan-3-ols, which become predominant with a main influence on the qualitative composition
of wine flavan-3-ols (González-Manzano et al. 2004, Llaudy et al. 2008). For that reason,
depending on the wine style, it is necessary to adapt the extraction of flavan-3-ols. It is also
possible to select the proportion of skin and seed flavan-3-ols using one or more winemaking
techniques that affect differently phenolic extraction (Zamora 2003, Sacchi et al. 2005).
3.2. Evolution of phenolic compounds during wine aging
The changes in phenolic composition which take place during winemaking and aging involve
two processes. The first process involves enzymatic reactions and occurs mostly at the early
stages of winemaking while the second one involves chemical reactivity of the phenolic
compounds and begins during winemaking process and continues during aging.
Enzymatic reactions
Enzymatic oxidation and degradation involves mainly the polyphenoloxidases (PPO). These
reactions are more important for white wines while in red wines are not so important. Generally,
catechins are poor substrates for grape PPO and also proanthocyanidins and anthocyanins
cannot be oxidized directly by grape PPO due to steric hindrance (Cheynier et al. 2000).
However, they can react with the enzymatically generated caffeoyltartaric acid quinine through
UNIVERSITAT ROVIRA I VIRGILI GRAPE PHENOLIC MATURITY; DETERMINATION METHODS AND CONSEQUENCES ON WINE PHENOLIC COMPOSITION Nikolaos Kontoudakis ISBN:978-84-693-7682-9/DL:T-1754-2010

nn
Introduction
23
coupled oxidation and nucleophilic condensation reactions (Cheynier and Ricardo da Silva
1991, Sanri-Manchado et al. 1995, 1997).
Also the β-glucosidase activity is responsible for the breakdown of the glucosidic bond of the
anthocyanidin-3-glucosides. The released anthocyanidins are more unstable and are rapidly
degraded leading to losses in wine color (Monagas and Bartolomé 2009).
Chemical reactions
Several chemical reactions taking place during the winemaking and aging, with an important
influence on the color, the stability of the color, the body and the astringency of the wine.
As it has already mentioned (see 1.2.4.) in a slight acidic medium, as is the wine, anthocyanins
are present in four structural forms that are in equilibrium depending on the pH, with the
predomination of the less colored and colorless forms. Moreover, anthocyanins react with the
bisulfite ions (HSO3-) at the C-4 position of the flavylium cation resulting in the formation of a
colorless adduct which is stable at the wine pH (Berke et al. 1998). The proportion of the
anthocyanins that are trapped as colorless bisulfate adducts is according to pH and the amount of
sulfite added in must or wine (Ribéreau et al. 2006).
More complex reaction with the participation of anthocyanins and other phenolic compounds
has led to propose the existence of copigmentation phenomenon. Copigmentation is a solution
phenomenon in which the planar polarisable nuclei of the colored forms of the anthocyanins and
other non-colored organic components form molecular associations or complexes (Boulton
2001). They form vertical stacking complexes held by low energy bonds (Van der Waals,
hydrophobic interactions) that are stabilized by the disposal of the sugar molecules on the
outside, which among them there are established hydrogen bonds. Water molecules cannot enter
in the interior of these complexes and thus copigmentation prevents hydration of anthocyanins
and fading, making the equilibrium to shift to colored forms of anthocyanins. This normally
results in increased absorbance intensity (hyperchromism) and a positive shift in the visible
wavelength (bathochromism), with the color becoming purple (Asen et al. 1972).
Several compounds are studied to be as potential anthocyanin copigments. Copigments may be
phenolic compounds, alkaloids, amino acids, organic acids, nucleotides, polysaccharides
(Robinson and Robinson 1931, Asen et al. 1972, Mazza and Brouillard 1990). In additional,
intramolecular copigmentation has also been mentioned as a possible mechanism occurring with
UNIVERSITAT ROVIRA I VIRGILI GRAPE PHENOLIC MATURITY; DETERMINATION METHODS AND CONSEQUENCES ON WINE PHENOLIC COMPOSITION Nikolaos Kontoudakis ISBN:978-84-693-7682-9/DL:T-1754-2010
nn
Introduction
24
the association of the anthocyanins positively charged pyrylium nucleus and their aromatic
residues of their own molecule, as well as the self-association of them and the interaction with
metal cations (metal complexation) (Asen et al. 1972, Brouillard 1981).
Among red wine compounds, flavonoids, hydroxycinnamic acids appears to be the most
promising compounds to act as anthocyanins copigments. Flavan-3-ols present small strength of
copigmentation in comparison with the other compounds, due to their non-planar structure
(Gómez-Míguez et al. 2006). However, as there are present in great amounts in red wines their
copigmentation with anthocyanins can contribute significantly in wine color of red young wines
(González-Manzano et al. 2009). However, important differences can be present in their ability
to interact with anthocyanins through the different structure and stereochemistry of flavan-3-ol
(Berké and De Freitas, 2005).
Generally, the factors that influence the copigmentation are pH, ethanol, temperature, molecular
structure of the copigments and concentration ratio between anthocyanins and copigments
(Boulton 2001).
The copigmentation is of great interest as it seems to contribute significantly to the color of
young red wines. It is also possible that copigmentation would be the first step in the formation
of new pigments that determine the color of aged red wines (Brouillard and Dangles 1994).
The formation of pigments with direct condensation between anthocyanins and flavan-3-ols has
been suggested (Jurd and Somers 1970, Somers 1971). There have been proposed two different
mechanisms for this type of reactions, the anthocyanin-flavan-3-ol (A-F) and the flavan-3-ol-
anthocyanin (F-A) direct condensation reaction (Figure 11).
The anthocyanin-flavan-3-ol direct condensation reaction starts with the nucleophilic attack of
the C-8 or C-6 position of the flavan-3-ol to the electrophilic C-4 position of the anthocyanin in
the form of flavylium cation, giving rise to either a flavene which can later undergo an oxidative
reorganization to give rise to the formation of yellowish pigments with a possible xanthylium
structure (Jurd and Somers 1970, Somers 1971, Santos-Buelga et al. 1995), although this
proposal has been questioned (Santos-Buelga et al. 1999), or to a colorless bicyclic condensation
product (Bishop and Nagel 1984, Remy-Tanneau et al. 2003).
In the case of the F-A direct condensation reaction, the proposal mechanism suggest that
carbocations generated from the acid-catalyzed interflavanic bond cleavage of the
UNIVERSITAT ROVIRA I VIRGILI GRAPE PHENOLIC MATURITY; DETERMINATION METHODS AND CONSEQUENCES ON WINE PHENOLIC COMPOSITION Nikolaos Kontoudakis ISBN:978-84-693-7682-9/DL:T-1754-2010

nn
Introduction
25
proanthocyanidins act as electrophilic agents and react with the nucleophilic C-6 or C-8 position
of the anthocyanin in its hydrated hemiketal form, giving rise to a colorless pigment (Halsam
1980, Cheynier et al. 2000). These carbocations may also react with flavan-3-ols (flavan-3-ol-
flavan-3-ol condensation reaction) generating new proanthocyanidin molecules that can increase
their degree of polymerization or can decrease it if an excess of monomeric flavan-3-ols is
present in the medium (Halsam 1980).
Direct condensation reactions between anthocyanins and flavanol monomers are strongly related
to pH, due to electrophilic and nucleophilic characters of the anthocyanins and flavan-3-ols. F-A
Figure 11. Main chemical reactions of anthocyanins during winemaking and aging (adapted from Monagas and Bartolomé 2009).
UNIVERSITAT ROVIRA I VIRGILI GRAPE PHENOLIC MATURITY; DETERMINATION METHODS AND CONSEQUENCES ON WINE PHENOLIC COMPOSITION Nikolaos Kontoudakis ISBN:978-84-693-7682-9/DL:T-1754-2010

nn
Introduction
26
adducts are formed at low pH values and A-F adducts above pH 3.8 (Salas et al. 2003).
Temperature seems to favor formation of the latter as well as flavan-3-ol size (Malien-Aubert et
al. 2002). These pigments appear to have an increased resistance to sulfite bleaching and to the
pH effect (Salas et al. 2003). The products of both mechanisms have been detected in wine
fractions (Remy et al. 2000, Vivar-Quintana et al. 2002).
Other possible mechanisms (Figure 11 and 12) that have been suggested are the condensation
reactions mediated by aldehydes (anthocyanin-anthocyanin, flavan-3-ol-flavan-3-ol and
anthocyanin-flavan-3-ol). The main aldehyde that undergoes this type of condensation reactions
is acetaldehyde, which is present in wine is originated from the yeast metabolism (Romano et al.
1994) during alcoholic fermentation and from the oxidation of ethanol in the presence of
polyphenols (Wildenradt and Singleton 1974). Other aldehydes like propionaldehyde,
isovaleraldehyde, isobutyraldehyde and benzaldehyde are present in wine in fewer
concentrations, with the exception of the Port wines (Pissarra et al. 2005). Moreover, other
substances such as glyoxylic acid, which result from oxidation of tartaric acid (Fulcrand et al.
1997), furfural, 5-hydroxymethylfurfural and vainillin that can be extracted in wine from barrels
(Es-Safi et al. 2000, Sousa et al. 2007) are also aldehydes which may participate in this type of
reactions.
Timberlake and Bridle (1976) proposed that the aldehyde, in the form of carbocation, reacts
with the flavan-3-ol at position C-6 or C-8 of the phloroglucinol ring, and after dehydratation,
the flavan-3-ol aldehyde adduct can react with anthocyanins or flavan-3-ols giving rise to new
structures that are linked by an ethyl bridge (Figure 11 and 12).
Flavan-3-ol-anthocyanin acetaldehyde-mediated pigments have a purplish color and greater
color intensity than anthocyanins. Their color is more stable against pH changes and there are
only partially bisulfate bleached. Nevertheless, these pigments are more sensitive to degradation
in aqueous solution than anthocyanin. Moreover, the cleavage of the ethyl bridges may cause the
formation of new precursor compounds which can react with other polyphenols and be
responsible of reorganizations and new condensation reactions (Escribano-Bailón et al. 2001).
The formation of pigments between proanthocyanidin oligomers and anthocyanins has been
observed (Francia-Aricha et al. 1997, Vivar-Quintana et al. 1999). In the presence of enough
acetaldehyde concentration, condensed pigments are progressing rapidly towards larger
UNIVERSITAT ROVIRA I VIRGILI GRAPE PHENOLIC MATURITY; DETERMINATION METHODS AND CONSEQUENCES ON WINE PHENOLIC COMPOSITION Nikolaos Kontoudakis ISBN:978-84-693-7682-9/DL:T-1754-2010

nn
Introduction
27
structures by incorporating new ethyl-flavanol units, reaching a critical mass in which pigments
precipitate, leading to loss of color (Rivas-Gonzalo et al. 1995).
Flavan-3-ols also undergo condensation reactions with each other mediated by acetaldehyde,
which give rise in colorless pigments. The polymers that can be formed through these reactions
are unstable and undergo other reactions. These ethyl linkages are very labile and can cleave
into vinylflavanol oligomers which can then react with anthocyanins to produce flavanyl-
pyranoanthocyanins (Fulcrand et al. 2006). Other aldehydes such as glyoxilic acid or furfural, as
it was quoted above, undergo condensation reactions and form xanthylium salts (Figure 12).
The formation of pigments resulting from the acetaldehyde-mediated condensation between
anthocyanins has been proved in synthetic medium and these pigments were later found in red
wine (Atanasova et al. 2002b).
It is necessary to keep in mind that in general the availability of acetaldehyde in wine is limited
by the presence of sulfite. Nevertheless, acetaldehyde presents an important role in the evolution
of wine color depending on the wine physicochemical characteristics and the conditions that is
stored.
The factors that mainly affect the acetaldehyde production are the oxygen, the pH and the
temperature. The reaction rate is higher in the present of oxygen and at acidic pH, since the
formation of acetaldehyde and its protonated form are favored under these conditions (Rivas-
Gonzalo et al. 1995, Atanasova et al. 2002a). On the other hand, the formation of ethyl-bridged
pigments is slower in low temperatures and the formed compounds are more stable in relation to
their degradation and precipitation (Rivas-Gonzalo et al. 1995).
Over the last decades, several studies showed that a number of cycloaddition reactions occurs
between anthocyanins and other small molecules in red wine, such as acetaldehyde (vitisin B)
(Bakker and Timberlake 1997, Vivar-Quintana et al. 1999), acetoacetic acid (He et al. 2006),
pyruvic acid (vitisin A) (Fulcrand et al. 1998, Mateus et al. 2001), vinylphenol (Fulcrand et al.
1996, Schwarz et al. 2003b), vinylguaiacol (Hayasaka and Asenstorfer 2002), vinylcatechol
(pinotin A) (Schwarz et al. 2003a), and vinylcatechin (Cruz et al. 2008) giving rise to new
families of anthocyanin-derived pigments called pyranoanthocyanins (Figure 11).
This type of pigments present more stability at color changes of pH and at SO2 bleaching in
comparison with natural anthocyanins from grapes (Sarni-Manchado et al. 1996, Bakker and
UNIVERSITAT ROVIRA I VIRGILI GRAPE PHENOLIC MATURITY; DETERMINATION METHODS AND CONSEQUENCES ON WINE PHENOLIC COMPOSITION Nikolaos Kontoudakis ISBN:978-84-693-7682-9/DL:T-1754-2010

nn
Introduction
28
Timberlake 1997, France-Aricha et al. 1997). This fact together with theirs red-orange hues
similar to that acquired during red wine aging, has suggested that they may play a crucial role in
color changes that occur in wine red during aging.
Recently, a new class of anthocyanin-derivate pigments, named portisins (Figure 11), was
detected and isolated directly from Port red wines (Mateus et al. 2003). This type of pigments
appears to display a bluish color under acidic conditions. Its formation mechanism appears to
occur between a pyranoanthocyanin moiety and a flavan-3-ol molecule through a vinyl bridge.
Figure 12. Reaction of flavanols with glyoxilic acid and condensation reactions mediated by acetaldehyde during winemaking and aging (adapted from Monagas and Bartolomé 2009).
Moreover, other compounds newly displaying a structure similar to that of the other reported
portisins were detected. These new pigments were shown to possibly arise from the reaction
between carboxypyranoanthocyanins and hydroxycinnamic acids (caffeic, coumaric, sinapic,
and ferulic acids) (Oliveira et al. 2007).
Finally, during the wine-maturing processes in oak barrels or with the addition of oak chips,
hydrolysable tannins are dossolved in the wine. It is suggested that condensation reactions
UNIVERSITAT ROVIRA I VIRGILI GRAPE PHENOLIC MATURITY; DETERMINATION METHODS AND CONSEQUENCES ON WINE PHENOLIC COMPOSITION Nikolaos Kontoudakis ISBN:978-84-693-7682-9/DL:T-1754-2010
nn
Introduction
29
among anthocyanins and the C-glycosidic ellagitannins can take place with a possible
bathochromic effect in wine color, however more research is necessary (Chassaing et al. 2010).
3.3. Sensory implications of phenolic compounds
The phenolic composition of grapes and wine has a significant importance on wine quality.
Specifically, the most abundant compounds, anthocyanins and flavan-3-ols, and their reactivity
during winemaking and aging define the wine color, astringency, bitterness and the evolution of
all these sensory attributes.
Anthocyanins are structurally dependent on the conditions and the composition of the wine
medium. The pH of the wine and the presence of sulfites provoke discoloration of the
anthocyanins. However, red young wines appear to have intense red color as product of different
mechanism. Copigmentation is one of the main mechanisms that provoke the color stabilization
(Boulton 2001). Also it is possible that copigmentation is the first stage in the formation of new
more stable pigments thus affecting wine color stability (Brouillard and Dangles 1994). As it
has shown above, depending on the type of anthocyanins and copigments and also of their
concentrations, there would be variations in wine color and intensity. It is believed that the
contributions of copigmentation in young wines color is quite high and gradually diminish
during aging (Hermosín Gutiérrez et al. 2005).
The anthocyanin-flavan-3-ol direct condensation through the two different mechanisms, produce
colorless compounds or give rise to the formation of yellowish xanthylium pigments (see
1.3.2.). The contribution of these pigments pigments, that present violet hues, seem to contribute
more indirectly than directly in wine color. These compounds are found in very small amounts
in wine, most probable as result of their instability that provokes their cleavage. Their
contribution in wine color it seems to be negligible as there are present in low concentrations.
In addition, ethyl-linked moieties after the cleavage can react again and give ethyl-bridge
derivatives or flavan-pyranoanthocyanins (see 1.3.2.). Besides, in the presence of enough
acetaldehyde concentration, ethyl-linked pigments polymerized giving rise progressively to
large polymers that after a critical size will precipitate (Rivas-Gonzalo et al. 1995), which
indirectly leads to the gradual change of the color.
UNIVERSITAT ROVIRA I VIRGILI GRAPE PHENOLIC MATURITY; DETERMINATION METHODS AND CONSEQUENCES ON WINE PHENOLIC COMPOSITION Nikolaos Kontoudakis ISBN:978-84-693-7682-9/DL:T-1754-2010

nn
Introduction
30
The formation of the more stable pyranoanthocyanins seems to promote the change of the initial
purple-red color in hues more oranges. Although they appear in very small concentrations, as
they present stability under pH value and sulfite bleaching, it is possible that their contribution
in color is significant. On the other hand, portisins appears a blue color and they are found in
small amounts mainly in Port wines. However, it is believed that these pigments contribute in
wine color change (Mateus et al. 2003).
Other pigments that have been mentioned (see 1.3.2), like caftaric acid-anthocyanin adducts,
anthocyanin-ellagitannins or anthocyanin monomers are found in very low concentrations in
wine and more studies need to define their importance on wine color.
All these progressive structural changes appear to result in gradually shift of the initial purple-
red color to reddish-brown hues. Furthermore, phenolic compounds are responsible for essential
organoleptic features of red wine, like astringency and bitterness.
Bitterness is one of the basic tastes and is mainly induced by flavan-3-ols. It has been
demonstrated that bitterness decreases from monomer to trimer flavan-3-ols (Peleg et al. 1999).
Bitterness intensity is higher when ethanol level increases. Additionally, since bitterness is a
taste sensation resulting from an interaction between bitter compounds and specific tongue
receptors, the bitterness increase could be directly related to the increase of the bitter compound
concentration (Fontoin et al. 2008). Finally, it seems that ethyl-bridged flavan-3-ols formed
during wine aging could increase bitterness (Vidal et al. 2004a).
As opposed to bitterness, astringency is a tactile sensation most commonly described as drying,
roughing and puckering of the epithelium of the oral cavity. American Society for the Testing of
Materials define astringency as the complex sensation due to shrinking, drawing or puckering of
the epithelium as a result of exposure to substances such as alums or tannins. (ASTM, 1989).
Although the basic mechanism of astringency is not yet well understood, it suggested that oral
astringency results primarily from the precipitation of salivary proteins, which impairs the
natural lubrication of oral surfaces (Green et al. 1993). Wine proanthocyanidins can interact and
precipitate salivary proteins.
Astringency sensation depends on flavan-3-ols concentration and chemical structure, although
concentration appears to be less important than chemical structure (see 1.2.2.). From monomer
to trimer astringency increases (Peleg et al. 1999). Also at larger proanthocyanidin polymers the
perception of the astringency increases with the molecular weight as well as with the degree of
UNIVERSITAT ROVIRA I VIRGILI GRAPE PHENOLIC MATURITY; DETERMINATION METHODS AND CONSEQUENCES ON WINE PHENOLIC COMPOSITION Nikolaos Kontoudakis ISBN:978-84-693-7682-9/DL:T-1754-2010
nn
Introduction
31
galloylation (Vidal et al. 2003). However, there are different opinions about the influence of
high molecular weight proanthocyanidins in astringency. Some authors have reported that
proanthocyanidins with mean molecular size bigger than 7 are insoluble and unable to contribute
in astringency (Lee 1990). However, more recent studies have shown that high polymerized
proanthocyanidins are soluble in wine-like water-alcoholic solution and are very astringent
(Vidal et al. 2003).
The astringency in general is considered to decrease during wine aging. Some of the
condensation reactions that take place between anthocyanins and flavan-3-ols may contribute to
the declination of wine astringency (Vidal et al. 2004a). One other theory is that
proanthocyanidins undergo cleavage reactions by acid catalysis, thereby becoming smaller and
reducing astringency (Cheynier et al. 2006).
The flavan-3-ols astringency is related not only with their chemical structure and concentration.
Ethanol content and pH of wine also affects astringency of proanthocyanidins. It is observed that
the increase of ethanol content and pH diminish astringency (Fontoin et al. 2008).
4. Impact of climate change on grape maturity; implications on wine composition and
quality
4.1. The Climate Change
Climate change is certainly one of the most studied scientific issues of the last years. Although
there is a big debate about the impact of human activity on the climate change and especially on
the impact of the anthropogenic greenhouse gas emissions (Crowley 2000, Barnett et al. 2005),
insurance is that the climate is changing. An increasing number of observations give a more
complete picture of global warming (IPCC 2007, Barnett et al. 2005, Mears and Wentz 2005)
during the past century and the early of the last one. The Intergovernmental Panel on Climate
Change 2007 (IPCC Forth Assessment Report) mentioned that the tendency of global warming
at the 20th century was 0.6 ± 0.2°C and the decade of 90s was the warmest of the century (IPCC
2007). Eleven of the twelve years between 1995 and 2006 were in the rank among the 12
warmest years of global surface temperature since 1850. NASA mention that January 2000 to
December 2009 was the warmest decade on record and the 2009 was the second warmest year
UNIVERSITAT ROVIRA I VIRGILI GRAPE PHENOLIC MATURITY; DETERMINATION METHODS AND CONSEQUENCES ON WINE PHENOLIC COMPOSITION Nikolaos Kontoudakis ISBN:978-84-693-7682-9/DL:T-1754-2010

nn
Introduction
32
since recordkeeping began (NASA 2010).
The IPCC (2007) emphasized that the majority of the warming over the last 50 years has likely
been attributed by the increase of the emissions of carbon dioxide (CO2) and other greenhouse
gases, like methane (CH4), nitrous oxide (N2O), hydrofluorocarbons (HFCs), perfluorocarbons
(PFCs) and sulphurhexafluoride (SF6), produced mainly by burning fossil fuels and contributed
by land-use change and deforestation. Levels of carbon dioxide in January 2010 appears to be
389 parts per million (ppm), much higher than any other time in the past (NOAA 2010).
Greenhouse gases trap incoming heat near the surface of the Earth and are the key factors
causing the rise in temperatures. There are also other key factors such as volcanic eruptions,
sun's irradiance, oscillations of sea surface temperature in the tropics, and changes in aerosol
levels. Overall, the evidence suggests that these effects are not enough to account for the global
warming observed since 1880. Especially, volcanic eruptions in 2009 have not had a significant
impact and solar irradiance decreased although the global surface temperature was continued
increasing (NASA 2010).
If the emission of greenhouse gases continues with the same intensity, the estimation of mean
global surface air temperature, while recognizing deep uncertainties, will probably be between
2-6°C until the end of the century (IPCC 2007).
The most obvious effects of the climate change will be on one hand the sea level rise. A higher
temperature means more speed in the thawing of large masses of continental ice, Arctic and
Antarctic (Church 2001, Mitrovica et al. 2001, Huybrechts and Joughin 2005). On the other
hand, will bring increased risks associated with extreme weather events. There will be more heat
waves and floods, the incidence of hurricanes, typhoons and cyclones will increase in certain
areas of the planet, while in others the drought and desertification are inevitable (IPCC 2007).
This probable rise of mean global temperatures will have an important impact on natural and
human system, like asymmetry ecological responses (Walther et al. 2002), extinction risk for
both flora and fauna spans (Thomas et al. 2004), risk for water resources (Arnell et al. 1999),
decrease of global food production (Parrya et al. 2004) and risk for human health (McMichael et
al. 2006).
4.2. Impact of climate change on grape maturity; implications on wine quality
UNIVERSITAT ROVIRA I VIRGILI GRAPE PHENOLIC MATURITY; DETERMINATION METHODS AND CONSEQUENCES ON WINE PHENOLIC COMPOSITION Nikolaos Kontoudakis ISBN:978-84-693-7682-9/DL:T-1754-2010

nn
Introduction
33
Certainly, the consequences of climate change on agriculture in general (Rosenzweigb et al.
2004, IPCC 2007) and viticulture in particular (Jones et al. 2005) are of great importance. In this
sense, the research of Jones et al. (2005) is very illustrative about the influence that will have for
the wine quality. Jones et al. (2005) have studied the change of temperature at the growing
season in 27 of the most prominent wine growing regions worldwide during the period 1950-
1999. They found that average growing season temperatures warmed 1.26 ºC and dormant
season temperatures 1.38 ºC. Although this warming was not uniform, greatest in western U.S
and Europe, (Iberian Peninsula, Southern France, and parts of Washington and California
reached an increase more than 2.5 ºC), less in Chile, Australia and South Africa, has promoted
the quality of wines in all areas, with the sole exception of the Rhine Valley. This phenomenon
happened because the average temperature was close to the optimum growing season
temperature for the cultivars adapted well to the climate of each region, thus encouraging the
correct maturation of the grapes.
Using climate models warming, recent research on the projected climate changes in wine
regions worldwide predict continued warming for the period 2000-49. The model output used in
this analysis, Hadley Centre climate model-HadCM3, (Pope et al. 2000) comes from the SRES
A2 scenario (Special Report on Emissions Scenarios) and represents mid-range predictions
compared to the other climate models (Houghton et al. 2001). This model projected an increase
of 2.04 ºC on average for growing season temperatures and parallel predict a warming during
dormant period. The temperature increase predicted to be greater in the Northern Hemisphere-
NH- (2.11 ◦C) than in the Southern Hemisphere-SH- (1.71 ◦C). This warming will divert most
of the actual vineyards of their optimal temperatures such as the vineyards of California
(Nemani et al. 2001, Jones 2005, Jones et al. 2005, White et al. 2006), Australia (Webb 2006),
South Africa (Carter 2006) and Europe with more negative influences in Iberian Peninsula
(Kenny and Harrison 1993, Schultz 2002, Jones 2005).
Grapevine regions can be categorized (Figure 13) taking in account temperature-based
parameters (e.g. degree days, mean temperature of the warmest month, average growing-season
temperatures, etc.) for the production of high quality wines in regions with cool, intermediate,
warm, and hot climates (Jones 2007). A possible warming of 2 ºC that is predicted for the period
2000-2049 can provoke, for example, the transformation of one region with cool climate to one
with intermediate and push a region outside the ability to ripen correctly existing varieties with
obvious consequence in wine quality. This occurs because each cultivar has an optimum average
UNIVERSITAT ROVIRA I VIRGILI GRAPE PHENOLIC MATURITY; DETERMINATION METHODS AND CONSEQUENCES ON WINE PHENOLIC COMPOSITION Nikolaos Kontoudakis ISBN:978-84-693-7682-9/DL:T-1754-2010
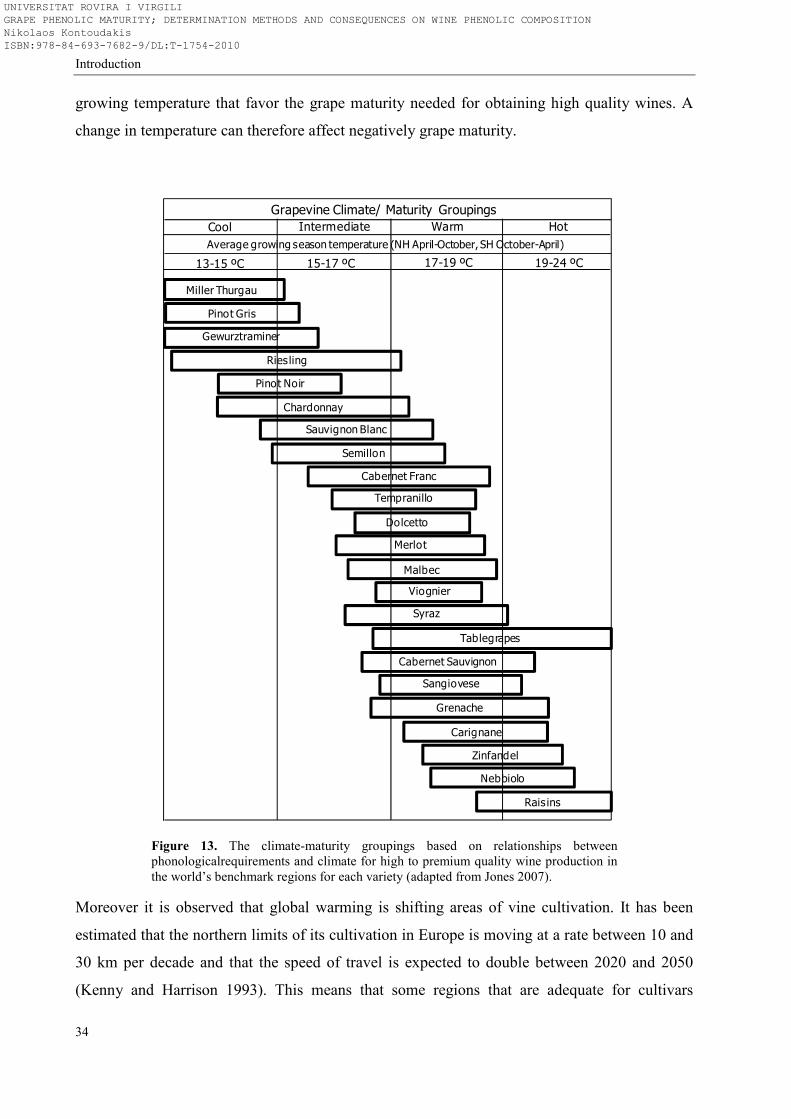
nn
Introduction
34
growing temperature that favor the grape maturity needed for obtaining high quality wines. A
change in temperature can therefore affect negatively grape maturity.
Grapevine Climate/ Maturity Groupings
Miller Thurgau
Pinot Gris
Gewurztraminer
Ries ling
Pinot Noir
Chardonnay
Sauvignon Blanc
Semillon
Cabernet Franc
Tempranillo
Dolcetto
Merlot
Malbec
Viognier
Syraz
Tablegrapes
Cabernet Sauvignon
Sangiovese
Grenache
Carignane
Zinfandel
Nebbiolo
Rais ins
13-15 ºC 15-17 ºC 17-19 ºC 19-24 ºC
Average growing season temperature (NH April-October, SH October-April)
Cool Intermediate HotWarm
Figure 13. The climate-maturity groupings based on relationships between phonologicalrequirements and climate for high to premium quality wine production in the world’s benchmark regions for each variety (adapted from Jones 2007).
Moreover it is observed that global warming is shifting areas of vine cultivation. It has been
estimated that the northern limits of its cultivation in Europe is moving at a rate between 10 and
30 km per decade and that the speed of travel is expected to double between 2020 and 2050
(Kenny and Harrison 1993). This means that some regions that are adequate for cultivars
UNIVERSITAT ROVIRA I VIRGILI GRAPE PHENOLIC MATURITY; DETERMINATION METHODS AND CONSEQUENCES ON WINE PHENOLIC COMPOSITION Nikolaos Kontoudakis ISBN:978-84-693-7682-9/DL:T-1754-2010

nn
Introduction
35
adapted well to the climate of the region conditions, could not be suitable at the future, without
the adoption of appropriate adaptive measures, and other regions that until now appeared as
unsuitable wine grape production regions under warmer temperature scenarios may become
more suitable for the production of high quality wines.
In the light of these previsions there is no doubt that climate change will affect the quality of
grape and wines well adapted in the viticulture regions that are now growing. The increase of
temperature and the evolution of rainfall distribution and efficiency (IPCC 2007) as also point
potential evaporation change (Webb 2006) will probable affect the vine and grape physiology
and biochemistry. Although rise in CO2 concentration in the atmosphere may increase
grapevine photosynthesis and grape production without causing negative impacts on the quality
of grapes and red wine (Gonçalves et al. 2009), water availability and increase of temperatures
will probable affect negatively. Schultz (2000) illustrates the probable effects of the possible
increase in surface level ultraviolet UV-B radiation due to depletion of stratospheric ozone on
grape physiology and production (Table 1).
UV-B effects Possible relevance for grape production
• activation of genes of the phytopropanoid pathway
• inactivation (damage) of photosystem II and of photosynthetic enzymes
• reduced chlorophyll and carotenoid concentration
• effects on nitrogen metabolism (via carbon supply or direct effects on key enzymes)
• thicker leaves, wax composition
• photo-oxidation of indole acetic acid (IAA, auxin), UV-B absorption by tryptophan
• increase in ascorbic acid and glutathione content through the formation of free radicals
• flowering and phenology
• alterations in soil microflora and fauna
� accumulation of flavonoids and anthocyanins (color formation and wine composition)
� decreased photosynthesis
� decreased photosynthesis � altered aroma compounds ? � xanthophylls, leaf and berry energy balance?
� decreased amino acid concentration (yeast
metabolism, fermentation kinetics, higher alcohol formation, secondary aromatic compounds)
� more disease resistance � possible formation of o-aminoacetophenone
(off-flavor in white wine)
� photoprotection, sulfur metabolism, induction of enzyme activities?
� may be affected in some varieties � nutrient availability
Table 1. Effects of the possible increase in surface level ultraviolet UV-B radiation due to depletion of stratospheric ozone on grape physiology and production (adapted from Schultz 2000).
UNIVERSITAT ROVIRA I VIRGILI GRAPE PHENOLIC MATURITY; DETERMINATION METHODS AND CONSEQUENCES ON WINE PHENOLIC COMPOSITION Nikolaos Kontoudakis ISBN:978-84-693-7682-9/DL:T-1754-2010

nn
Introduction
36
The most enlightened effects from climate change would be: inhibition of photosynthesis, partial
or total inhibition of berry development and biosynthesis, inhibition of ripening, loss of fruit
volume with consequences on yield and the increase of sugar content at the harvest time.
It is clear that if at the maturity period the temperature is higher than the optimum, the pulp of
the grapes mature more rapidly, reaching high concentrations of sugar, low acid concentrations
and thereby the period between veraison and industrial maturity decline, making it more
difficult to reach the proper aromatic and phenolic grapes maturity (Zamora 2005), resulting in
unbalanced wines with high pH and alcoholic content.
High pH values in wines implies some problems such as less color, less antiseptic effectiveness
of sulfur dioxide and higher risk of microbiological spoilage (Beech et al. 1979). On the other
hand, high alcohol concentration is very likely to provoke stuck and sluggish alcoholic
fermentation and to inhibit malolactic fermentation. Moreover, an excess of alcohol is
unpleasant. Moreover, wines with high alcohol content are imposed with higher tax rates in
some countries.
It is a verifiable fact that most of the wines have gradually increased their alcohol content in
recent years and winemakers are really concerned about the problem. The tendency of higher
alcohol levels is studied in many viticulture areas with more characteristic the case of Alsace
region which potential alcoholic levels of Riesling at harvest moment have increased 2.5% (v/v)
between 1972-2003 (Duchêne and Schneider 2005).
4.3. Winemaking techniques for reducing impact of climate change on wine quality
Several techniques have been proposed to mitigate climate impacts. Firstly, it is necessary to
study varieties, clones of vines and rootstocks (Main et al. 2002) that may be able to retard pulp
sugar accumulation and acid consumption at a certain regional conditions. Additionally, the
translation of the vineyards to other production regions can be a positive move (Schultz 2000).
These solutions maybe are the most suitable but require considerable time and inversions to
study and replace the existing vineyards. Moreover, other possible available options for
managing excessive alcohols in the vineyard can be the correct election of training system, row
UNIVERSITAT ROVIRA I VIRGILI GRAPE PHENOLIC MATURITY; DETERMINATION METHODS AND CONSEQUENCES ON WINE PHENOLIC COMPOSITION Nikolaos Kontoudakis ISBN:978-84-693-7682-9/DL:T-1754-2010

nn
Introduction
37
vine spacing, pruning, bunch thinning, bud and leaf removal as also the adequate water
management (Reynolds et al. 1996, Bruce et al. 2008, Mandelli et al. 2008, Poli et al. 2009).
The harvest of grapes at early stage of ripening can be adapted but with negative effects in wine
quality since the phenolic and aromatic maturity would not achieve the levels for the production
of high quality wines. Other solution is the addition of water and mineral acids to the grape juice
before the beginning of the fermentation but except the fact that it is strictly forbidden in the
most of the winemaking countries, there is the possible of alternating the wine quality. Finally,
the blending of wines with high alcoholic concentration with other with low concentration is an
alternative solution when the wine with low alcoholic concentration do not present the
disadvantages described above.
The use of Glucose oxidase (EC 1.1.3.4) has been also proposed to obtain less alcoholic wines
(Pickering et al. 1998). This enzyme break down glucose into gluconic acid, but is deactivated
in the presence of alcohol in concentrations greater than about 1% by volume. They therefore
need to be added to must before it has begun fermenting.
However, the high gluconic acid concentration in wine is undesirable. Moreover, this enzyme
use oxygen as substrate and consequently it is necessary to aerate excessively the grape juice to
operate adequately which may involve an oxidation of other wine components (Pickering et al.
1999).
It is proposed the selection of Saccharomyce cerevisiae strains with a lower yield transformation
of sugar into ethanol. However, the possibility of selecting a strain that produce less ethanol is
limited by the fact that oenological strains present similar yields. Alcoholic fermentation carried
out with non-Saccharomyces yeasts (Ciani and Ferraro 1996) can be a possible alternative
solution but there is the possibility of produce unbalanced wines. The combination of non-
Saccharomyces with Saccharomyce cerevisiae yeasts can be a promising answer.
The investigations about yeast and alcohol products are focused mainly on the genetically
modified organisms. Several metabolic engineering strategies have been proposed (Dequin and
Barre 1994, De Barros Lopes et al. 2000, Remize et al. 2000, Malherbe et al. 2003, Heux et al.
2006). These strategies are based on metabolic redirection of sugars in the must by reducing
ethanol production and increasing the cell biomass or fermentation end products such as
glycerol or lactic acid. But genetically modified products, and especially genetically modified
wine, are not accepted from the most of the consumers. So, more studies are necessary about the
UNIVERSITAT ROVIRA I VIRGILI GRAPE PHENOLIC MATURITY; DETERMINATION METHODS AND CONSEQUENCES ON WINE PHENOLIC COMPOSITION Nikolaos Kontoudakis ISBN:978-84-693-7682-9/DL:T-1754-2010

nn
Introduction
38
possible environmental and human health risks of these yeasts and it is also necessary to study
how they affect the wine characteristics.
Several other technological innovations during winemaking process have been proposed to
remove alcohol and decrease pH. Vacuum distillation methods using either evaporators or
distillation column are widely applied in wine industry for alcohol reduction, being the spinning
cone column probably the more utilized (Pickering 2000). In addition, membrane processes
have been applied during the last years to reduce sugar content in must or alcohol in wine.
Among diverse methods (dialysis (Regan 1990), membrane contactors (Diban et al. 2008),
pervaporation (Takács et al. 2007) and reverse osmosis (Bui et al. 1986), the reverse osmosis is
the most popular. Other techniques that maybe can be applied for reducing alcoholic content of
wines are the use of supercritical fluid extraction (Ruiz-Rodrigueza et al. 2010) and the
adsorption (on resins or on silica gels) (Pickering 2000).
The pH decrease can be achieved by adding organic acids however when the pH is too high the
result is questionable. The reduction treatments are based basically at cationic exchange
columns and electrodyalisis techniques (Walker et al. 2004). These physical methods are
effective but involve the use of large and expensive equipment and many winemakers have
concerns about their effects on wine quality.
UNIVERSITAT ROVIRA I VIRGILI GRAPE PHENOLIC MATURITY; DETERMINATION METHODS AND CONSEQUENCES ON WINE PHENOLIC COMPOSITION Nikolaos Kontoudakis ISBN:978-84-693-7682-9/DL:T-1754-2010

nn
Introduction
39
References
Alcalde-Eon, C., Escribano-Bailón, M.T., Santos-Buelga, C. and Rivas-Gonzalo, J.C. (2006) Changes in the detailed pigment composition of red wine during maturity and ageing: A comprehensive study. Analytica Chimica Acta 563, 238-254.
Amati, A., Piva, A., Castellari, M. and Arfelli, G. (1996) Preliminary studies on the effect of Oidium tuckeri on the phenolic composition of grapes and wine. Vitis 35, 149-150.
Amrani Joutei, K., and Y. Glories. (1995) Tannins and anthocyanins of grape berries: Localization and extraction technique. Revue Française d'Oenologie 153, 28-31.
Arnell, N.W. (1999) Climate change and global water resources. Global Environmental Change 9, 31-49.
Asen, S., Stewart, R.N., Norris, K.H. (1972) Copigmentation of anthocyanins in plant tissues and its effect on color. Phytochemistry 11, 1139-1144.
ASTM, 1989 American Society for the Testing of Materials. (1989). Standard definition of terms relating to sensory evaluation of materials and products. In: Annual book of ASTM
standards (Vol. 15.07, pp. 2) Philadelphia, USA.
Atanasova, V., Fulcrand, H., Cheynier, V. and Moutounet, M. (2002a) Effect of oxygenation on polyphenol changes occurring in the course of wine-making. Analytica Chimica Acta 458 (1), 15-27.
Atanasova, V., Fulcrand, H., Le Guernevé, C., Cheynier, V. and Moutounet, M. (2002b) Structure of a new dimeric acetaldehyde malvidin 3-glucoside condensation product. Tetrahedron Letters 43 (35), 6151-6153.
Bakker, J. and Timberlake, C.F. (1997) Isolation, identification, and characterization of new color-stable anthocyanins occurring in some red wines. Journal of Agricultural and Food
Chemistry 45, 35-43.
Baldi, A., Romani, A., Mulinacci, N., Vincieri, F.F. and Casetta, B. (1995) HPLC/MS Application to Anthocyanins of Vitis vinifera L. Journal of Agricultural and Food Chemistry 43 (8), 2104-2109.
Block, G. (1992) A role for antioxidants in reducing cancer risk. 1utrition Reviews 50 (7), 207-213.
Barnett, T, Zwiers, F., Hegerl, G., Allen, M., Crowley, T., Gillett, N., Hasselmann, K., Jones, P., Santer, B., Schnur, R., Stott, P., Taylor, K. and Tett, S. (2005) Detecting and attributing external influences on the climate system: A review of recent advances. Journal of Climate 18 (9), 1291-1314.
Beech, F.W., Burroughs, L.F., Timberlake, C.F. and Whiting, G.C. (1979) Progres recents sur l’aspect chimique et antimicrobienne de l’anhidride sulfureux. Bulletin de l’OIV 52, 1001-1022.
Berké, B., Chèze, C., Vercauteren, J. and Deffieux, G. (1998) Bisulfite addition to anthocyanins: Revisited structures of colourless adducts. Tetrahedron Letters 39 (32), 5771-5774.
Berké, B. and De Freitas, V.A.P. (2005) Influence of procyanidin structures on their ability to complex with oenin. Food Chemistry 90 (3), 453-460.
UNIVERSITAT ROVIRA I VIRGILI GRAPE PHENOLIC MATURITY; DETERMINATION METHODS AND CONSEQUENCES ON WINE PHENOLIC COMPOSITION Nikolaos Kontoudakis ISBN:978-84-693-7682-9/DL:T-1754-2010

nn
Introduction
40
Bishop, P.D. and Nagel, C.W. (1984) Characterization of the condensation product of malvidin 3,5-diglucoside and catechin. Journal of Agricultural and Food Chemistry 32 (5), 1022-1026.
Boulton, R. (2001) The copigmentation of anthocyanins and its role in the color of red wine: A critical review. American Journal of Enology and Viticulture 52 (2), 67-87.
Brouillard, R. (1981) Origin of the exceptional colour stability of the Zebrina anthocyanin. Phytochemistry 20 (1), 143-145.
Brouillard, R. and Dangles, O. (1994). Anthocyanin molecular-interactions – the first step in the formation of new pigments during wine aging. Food Chemistry 51(4), 365–371.
Bui, K., Dick, R., Moulin, G. and Galzy, P. (1986) A Reverse Osmosis for the Production of Low Ethanol Content Wine. American Journal of Enology and Viticulture 37, 297-300.
Cadot, Y., Miñana-Castelló, M.T. and Chevalier, M. (2006) Anatomical, Histological, and Histochemical Changes in Grape Seeds from Vitis vinifera L. cv Cabernet franc during Fruit Development. Journal of Agricultural and Food Chemistry 54, 9206-9215.
Canals, R., Llaudy, M.C., Valls, J., Canals, J.M. and Zamora, F. (2005) Influence of ethanol concentration on the extraction of color and phenolic compounds from the skin and seeds of tempranillo grapes at different stages of ripening. Journal of Agricultural and Food
Chemistry 53 (10), 4019-4025.
Candolfi-Vasconcelos, M.C., Koblet, W., Howell, G.S., and Zweifel, W. (1994) Influence of defoliation, rootstock, training system and leaf position on gas exchange of Pinot noir grapevines. American Journal of Enology and Viticulture 45, 173-180.
Carter,S. (2006) The Projected Influence of Climate Change on the South African Wine Industry. Interim Report IR 06-043, International Institute for Applied System Analysis.
Cayla, L., Cottereau, P. and Renard, R. (2002) Estimation de la maturité phénolique des raisins rouges par la méthode I.T.V. standard. Revue Française d’Oenologie 193, 10-16.
Celotti, E., Carcereri de Prati, G. and Fiorini, P. (2007a) Modern approach to the red grape quality management. http://www.infowine.com/
Celotti E., Della Vedova T., Ferrarini R. and Martinand S. (2007b) The use of reflectance for monitoring phenolic maturity curves in red grapes. Italian Journal of Food Science, 19, 91-100.
Cerovic, Z.G., Moise, N., Agati, G., Latouche, G., Ben Ghozlen, N. and Meyer, S. (2008) New portable optical sensors for the assessment of winegrape phenolic maturity based on berry fluorescence. Journal of Food Composition and Analysis 21, 650-654.
Chassaing, S., Lefeuvre, D., Jacquet, R., Jourdes, M., Ducasse, L., Galland, S., Grelard, A., Saucier, C., Teissedre, P.L., Dangles, L. and Quideau, S. (2010) Physicochemical studies of new anthocyano-ellagitannin hybrid pigments: About the origin of the influence of oak C-glycosidic ellagitannins on wine color. European Journal of Organic Chemistry 2010 (1), 55-63.
Cheynier, V. and Rigaud, J. (1986) HPLC Separation and Characterization of Flavonols in the Skins of Vitis vinifera var. Cinsault. American Journal of Enology and Viticulture 37 (4), 248-252.
UNIVERSITAT ROVIRA I VIRGILI GRAPE PHENOLIC MATURITY; DETERMINATION METHODS AND CONSEQUENCES ON WINE PHENOLIC COMPOSITION Nikolaos Kontoudakis ISBN:978-84-693-7682-9/DL:T-1754-2010
nn
Introduction
41
Cheynier, V. and Ricardo Da Silva, J.M. (1991) Oxidation of grape procyanidins in model solutions containing trans-caffeoyltartaric acid and polyphenol oxidase. Journal of
Agricultural and Food Chemistry 39 (6), 1047-1049.
Cheynier, V., Moutounet, M. and Sanri-Manchado, P. (2000) Los compuestos fenólicos. In: Enología: Fundamentos científicos y tecnológicos (pp. 114-136) Ed. C. Flancy, AMV Ediciones, Madrid, Spain.
Cheynier, V., Dueñas-Paton, M., Salas, E., Maury, C., Souquet, J.-M., Sarni-Manchado, P. and Fulcrand, H. (2006) Structure and Properties of Wine Pigments and Tannins. American
Journal of Enology and Viticulture 57(3), 298-305.
Church, J.A. (2001) Climate change. How fast are sea levels rising? Science 294, 802-803.
Cian., M. and Ferraro, L. (1996) Enhanced Glycerol Content in Wines Made with Immobilized Candida stellata Cells. Applied and environmental microbiology 62, 128-132.
González-Manzano, S., Rivas-Gonzalo, J.C. and Santos-Buelga, C. (2004) Extraction of flavan-3-ols from grape seed and skin into wine using simulated maceration. Analytica Chimica
Acta 513 (1), 283-289.
Coombe, B.G. (1992) Research on Development and Ripening of the Grape Berry. American
Journal of Enology and Viticulture 43 (1), 101-110.
Cromoenos.(2010) http://bioenos.com/cromoenos/index.php.
Crowley, T.J. (2000) Causes of Climate Change Over the Past 1000 Years. Science 289, 270-277.
Cruz, L., Teixeira,N., Silva, A.M.S., Mateus, N., Borges, J. and de Freitas, V. (2008) Role of vinylcatechin in the formation of pyranomalvidin-3-glucoside-(+)-catechin. Journal of
Agricultural and Food Chemistry 56, 10980-10987.
De Barros Lopes, M., Rehman, A.U., Gockowiak, H., Heinrich, A.J., Langridge, P. and Henschke, P.A. (2000) Fermentation properties of a wine yeast overexpressing the Saccharomyces cerevisiae glycerol 3-phosphate dehydrogenase gene (GPD2). Australian
Journal of Grape and Wine Research 6, 208-215.
De Freitas, V.A.P., Glories, Y. and Monique, A. (2000) Developmental changes of procyanidins in grapes of red Vitis vinifera varieties and their composition in respective wines. American
Journal of Enology and Viticulture 51 (4), 397-403.
Delgado, R., Martín, P., Del Álamo, M. and González, M.-R. (2004) Changes in the phenolic composition of grape berries during ripening in relation to vineyard nitrogen and potassium fertilisation rates . Journal of the Science of Food and Agriculture 84 (7), 623-630.
Dequin, S. and Barre, P. (1994) Mixed lactic acid-alcoholic fermentation by Saccharomyces cerevisiae expressing the Lactobacillus casei L(+)-LDH. 1ature Biotechnology 12, 173–177.
Diban, N., Athes, V., Bes, M. and Souchon, I. (2008) Ethanol and aroma compounds transfer study for partial dealcoholization of wine using membrane contactor. Journal of membrane
science 311, 136-146.
Doazan, J.P., Gazeau, O. and Bertrand, A. (1996) Incidence du porte-greffe sur différents composés du vin en relation avec l’analyse sensorielle. Œnologie 95, 85-89.
UNIVERSITAT ROVIRA I VIRGILI GRAPE PHENOLIC MATURITY; DETERMINATION METHODS AND CONSEQUENCES ON WINE PHENOLIC COMPOSITION Nikolaos Kontoudakis ISBN:978-84-693-7682-9/DL:T-1754-2010

nn
Introduction
42
Downey, M.O., Harvey, J.S. and Robinson, M. (2003) Analysis of tannins in seeds and skins of Shiraz grapes throughout berry development. Australian Journal of Grape and Wine
Research 9, 15–27.
Downey, M.O., Dokoozlian, N.K. and Krstic, M.P. (2006) Cultural practice and environmental impacts on the flavonoid composition of grapes and wine: A review of recent research. American Journal of Enology and Viticulture 57 (3), 257-268.
Dubernet, M., Dubernet, M., Dubernet, V., Lerch, M., Coulomb, S. and Traineau, I. (2000) Analyse objective de la qualité des vendanges par spectroscopie infrarouge à transformée de Fourier et réseaux de neurones. Revue Française d’œnologie 185, 18-21.
Duchêne, E. and Schneider, C. (2005) Grapevine and climatic changes: a glance at the situation in Alsace. Agronomy for Sustainable Development 24, 93-99.
Dupuch, V. (1993) Appréciation de la metière phénolique des vins rouges; application à la détermination de la date de récolte. In: Actes du Colloque Journé technique du CIVB (pp. 62-69) Burdeos, France.
Duque, M.C., Montero, F. and Yáñez, F (2005). Origen, historia y evolución del cultivo de la vid. Enólogos 38.
Ector, B.J., Magee, J.B., Hegwood, C.P. and Coign, M.J. (1966) Resveratrol Concentration in Muscadine Berries, Juice, Pomace, Purees, Seeds, and Wines. American Journal of Enology
and Viticulture 47 (1), 57-62.
Es-Safi, N.E., Cheynier, V. and Moutounet, M. (2000) Study of the Reactions between (+)-Catechin and Furfural Derivatives in the Presence or Absence of Anthocyanins and Their Implication in Food Color Change. Journal of Agricultural and Food Chemistry 48 (12), 5946-5954.
Escribano-Bailón, M.T., Guerra, M.T., Rivas-Gonzalo, J.C. and Santos-Buelga, C. (1995) Proanthocyanidins in skins from different grape varieties. Zeitschrift für Lebensmittel-
Untersuchung und -Forschung 200 (3), 221-224.
Escribano-Bailón, M.T., Alvarez-Garcia, M., Rivas-Gonzalo, J.C., Heredia, F.J. and Santos-Buelga, C. (2001) Color and stability of pigments derived from acetaldehyde-mediated condensation between malvidin 3-O-glucoside and (+)-catechin. J Journal of Agricultural
and Food Chemistry 49, 1213-1217.
Esteban, M.A., Villanueva, M.J. and Lissarrague, J.R. (2001) Effect of irrigation on changes in the anthocyanin composition of the skin of cv Tempranillo (Vitis Vinifera L.) grape berries during ripening. Journal of the Science of Food and Agriculture 81, 409-420.
Ezzahouani, A. and Williams, L.E. (2005) Performance of Dattier de Beyrouth and Alphonse Lavalle´e grapevines on eight rootstocks under dryland conditions. Journal international des
sciences de la vigne et du vin 39, 91-94.
Ferrer-Gallego, R., García-Marino, M., Miguel Hernández-Hierro, J., Rivas-Gonzalo, J.C. and Escribano-Bailón, M.T. (2010) Statistical correlation between flavanolic composition, colour and sensorial parameters in grape seed during ripening . Analytica Chimica Acta 660 (1-2), 22-28.
UNIVERSITAT ROVIRA I VIRGILI GRAPE PHENOLIC MATURITY; DETERMINATION METHODS AND CONSEQUENCES ON WINE PHENOLIC COMPOSITION Nikolaos Kontoudakis ISBN:978-84-693-7682-9/DL:T-1754-2010
nn
Introduction
43
Flint, S.D., Peter W. Jordan, P.W. and Caldwell, M.M. (1986) plant protective response to enhanced uv-b radiation under field conditions: leaf optical properties and photosynthesis. Photochemistry and Photobiology 41, 95-99.
Fontoin, H., Saucier, C., Teissedre, P.L. and Glories, Y. (2008) Effect of pH, ethanol and acidity on astringency and bitterness of grape seed tannin oligomers in model wine solution. Food
Quality and Preference 19 (3), 286-291.
Fournand, D., Vicens, A., Sidhoum, L., Souquet, J.-M., Moutounet, M. and Cheynier, V. (2006) Accumulation and extractability of grape skin tannins and anthocyanins at different advanced physiological stages. Journal of Agriculture and Food Chemistry 54, 7331-7338.
Francia-Aricha, E.M., Guerra, M.T., Rivas-Gonzalo, J.C. and Santos-Buelga. C. (1997) New anthocyanin pigments formed after condensation with flavanols. Journal of Agricultural and
Food Chemistry 45, 2262-2266.
Fulcrand, H., Cameira dos Santos, P., Sarni-Manchado, P., Cheynier, V. and Favre-Bonvin, J. (1996) Structure of new anthocyanin derived wine pigments. Journal of the Chemical
Society, Perkin Transactions 1 7, 735-739.
Fulcrand, H., Cheynier, V., Oszmianski, J. and Moutounet, M. (1997) An oxidized tartaric acid residue as a new bridge potentially competing with acetaldehyde in flavan-3-ol condensation. Phytochemistry 46 (2), 223-227.
Fulcrand, H., Benabdeljalil, C., Rigaud, J., Cheynier, V. and Moutounet, M. (1998) A new class of wine pigments generated by reaction between pyruvic acid and grape anthocyanins. Phytochemistry 47, 1401-1407.
Fulcrand, H., Dueñas, M., Salas, E. and Cheynier, V. (2006) Phenolic Reactions during Winemaking and Aging. American Journal of Enology and Viticulture 57 (3), 289-297.
Glories Y. and Augustin M. (1993). Maturité phénolique du raisin, conséquences technologiques: application aux millésimes 1991 et 1992. In: Proceedings Colloque Journée
Technique du CIVB (pp. 56-61) Bordeaux, France.
Gómez-Míguez, M., González-Manzano, S., Teresa Escribano-BailóN, M., Heredia, F.J. and Santos-Buelga, C. (2006) Influence of different phenolic copigments on the color of malvidin 3-glucoside. Journal of Agricultural and Food Chemistry 54 (15), 5422-5429.
Gonçalves, B., Falco, V., Moutinho-Pereira, J., Bacelar, E., Peixoto, F. and Correia, C. (2009) Effects of elevated CO2 on grapevine (Vitis vinifera L.): Volatile composition, phenolic content, and in vitro antioxidant activity of red wine. Journal of Agricultural and Food
Chemistry 57 (1), 265-273.
Gonzalez-Manzano, S., Rivas-Gonzalo, J.C., and Santos-Buelga, C. (2004) Extraction of flavan-3-ols from grape seed and skin into wine using simulated maceration. Analytica Chimica
Acta 513, 283-289.
González-Manzano, S., Dueñas, M., Rivas-Gonzalo, J.C., Escribano-Bailón, M.T. and Santos-Buelga, C. (2009) Studies on the copigmentation between anthocyanins and flavan-3-ols and their influence in the colour expression of red wine. Food Chemistry 114 (2), 649-656.
González-Neves, G., Gil1, G. and Ferrer, M. (2002) Effect of Different Vineyard Treatments on the Phenolic Contents in Tannat (Vitis vinifera L.) Grapes and their Respective Wines. Food
Science and Technology International 8, 315-321.
UNIVERSITAT ROVIRA I VIRGILI GRAPE PHENOLIC MATURITY; DETERMINATION METHODS AND CONSEQUENCES ON WINE PHENOLIC COMPOSITION Nikolaos Kontoudakis ISBN:978-84-693-7682-9/DL:T-1754-2010

nn
Introduction
44
Green, B.G. (1993) Oral astringency: a tactile component of flavor. Acta Psychology 84, 125-199.
Halsam, E. (1980) In vino veritas: Oligomeric procyanidins and the ageing of red wines. Phytochemistry 19 (12), 2577-2582.
Harbertson, J.F., Kennedy, J.A. and Adams, D.O. (2002) Tannin in Skins and Seeds of Cabernet Sauvignon, Syrah, and Pinot noir Berries during Ripening. American Journal of Enology and
Viticulture 53, 54-59.
Hayasaka, Y. and Asenstorfer, R.E. (2002) Screening for potential pigments derived from anthocyanins in red wine using nanoelectrospray tandem mass spectrometry. Journal of
Agricultural and Food Chemistry 50, 756-761.
He, J., Santos-Buelga, C., Silva, A.M.S., Mateus, N. and De Freitas, V. (2006) Isolation and structural characterization of new anthocyaninderived yellow pigments in aged red wines. Journal of Agricultural and Food Chemistry 54, 9598-9603.
Hermosín Gutiérrez, I.H., Lorenzo, E.S.P., Espinosa, A.V. (2005) Phenolic composition and magnitude of copigmentation in young and shortly aged red wines made from the cultivars, Cabernet Sauvignon, Cencibel, and Syrah. Food Chemistry 92 (2), 269-283.
Heux, S., Sablayrolles, J.M., Cachon, R. and Dequin, S. (2006) Engineering a Saccharomyces cerevisiae wine yeast that exhibits reduced ethanol production during fermentation under controlled microoxygenation conditions. Applied and Environmental Microbiology 72, 5822-5828.
Houghton, J.T., Ding, Y., Griggs, D.J., Noguer, M, van der Linden, P.J. and Xiaosu, D. (2001) The Scientific Basis. In: Climate Change 2001: Contribution of the Working Group 1 to the
Third Assessment of the Intergovernmental Panel on Climate Change. Ed. Cambridge University Press, Cambridge, UK.
Huybrechts, P. and Joughin I. (2005) Ice-sheet and sea-level changes. Science 310, 456-460.
IPCC (2007) Summary for Policymakers. In: Climate Change 2007: The Physical Science
Basis. Contribution of Working Group I to the Fourth Assessment Report of the
Intergovernmental Panel on Climate Change. Eds. S. Solomon, D. Qin, M. Manning, Z. Chen, M. Marquis, K.B. Averyt, M. Tignor and H.L. Miller, Cambridge University Press, Cambridge, UK and New York.
Iland, P., Bruer, N., Edwards, G., Weeks, S. and Wikes, E. (2004) Chemical Analysis of Grape
and Wine: Techniques and Concepts Ed. P. Iland Wine Promotion, Campeltown, Australia.
Jackson D.I. and Lombard P.B. (1993) Environmental and Management Practices Affecting Grape Composition and Wine Quality - A Review. American Journal of Enology and
Viticulture 44(4), 409-430.
Jeandet, P., Bessis, R. and Gautheron, B. (1991) The Production of Resveratrol (3,5,4'-trihydroxystilbene) by Grape Berries in Different Developmental Stages. American Journal
of Enology and Viticulture 42 (1), 41-46.
Jones, G.V. (2005) Climate change in the western United States grape growing regions. Acta
Horticulturae 689, 41-60.
Jones, G.V., White, M.A. and Cooper, O.R. (2005) Climate change and global wine quality. Climatic Change 73, 319-343.
UNIVERSITAT ROVIRA I VIRGILI GRAPE PHENOLIC MATURITY; DETERMINATION METHODS AND CONSEQUENCES ON WINE PHENOLIC COMPOSITION Nikolaos Kontoudakis ISBN:978-84-693-7682-9/DL:T-1754-2010

nn
Introduction
45
Jones G.V. (2007) Climate change: observations, projections, and general implications for viticulture and wine production www.infowine.com
Jurd, L. and Somers, T.C. (1970) The formation of xanthylium salts from proanthocyanidins. Phytochemistry 9 (2), 419-427.
Kennedy, J.A., Troup, G.J., Pilbrow, J.R., Hutton, D.R., Hewitt, D., Hunter, C.R., Ristic, R., Iland, P. and Jones, G.P. (2000) Development of seed polyphenols in berries from Vitis
vinifera L. cv. Shiraz. Australian Journal of Grape and Wine Research 6, 244–254.
Kennedy, J.A., Hayasaka, Y., Vidal, S., Waters, E.J. and Jones, G.P. (2001) Composition of Grape Skin Proanthocyanidins at Different Stages of Berry Development. Journal of
Agricultural and Food Chemistry 49 (11), 5348-5355.
Kennedy, J.A., Matthews, M.A. and Waterhouse, A.L. (2002) Effect of maturity and vine water status on grape skin and wine flavonoids. American Journal of Enology and Viticulture 53, 268-274.
Koundouras, S., Tsialtas, J.T., Zioziou, E. and Nikolaou, N. (2008) Rootstock effects on the adaptive strategies of grapevine (Vitis vinifera L. cv. Cabernet Sauvignon) under contrasting water status: Leaf physiological and structural responses. Agriculture, Ecosystems and
Environment 128, 86-96.
Koundouras, S., Hatzidimitriou, E., Karamolegkou, M., Dimopoulou, E., Kallithraka, S., Tsialtas, J.T., Zioziou, E., Nikolaou, N. and Kotseridis, Y. (2009) Irrigation and Rootstock Effects on the Phenolic Concentration and Aroma Potential of Vitis vinifera L. cv. Cabernet Sauvignon Grapes. Journal of Agricultural and Food Chemistry 57 (17), 7805-7813.
Kenny, G.H., Harrison, P. A. (1993) The effects of climatic variability and change on grape suitability in Europe. Journal of Wine Research 4, 163-183.
Lamadon, F. (1995) Protocole pour l’évaluation de la richesse polyphénolique des raisins. Revue
des Oenologes 76, 37-38.
Lamb, D.W., Weedon, M.M. and Bramley, R.G.V. (2004) Using remote sensing to predict grape phenolics and colour at harvest in a Cabernet Sauvignon vineyard: Timing observations against vine phenology and optimising image resolution Australian Journal of Grape and
Wine Research 10, 46-54.
Langcake, P. and Pryce, R.J. (1976) The production of resveratrol by Vitis vinifera and other members of the Vitaceae as a response to infection or injury. Physiological Plant Pathology 9 (1), 77-86.
Le Moigne, M., Symoneaux, R. and Jourjon, F. (2008) How to follow grape maturity for wine professionals with a seasonal judge training? Food Quality and Preference 19 (8), 672-681.
Lee, C.Y. and Jaworski, A.W. (1990) Identification of Some Phenolics in White Grapes. American Journal of Enology and Viticulture 41(1), 87-89.
Llaudy, M.C., Canals, R., Canals, J.M., Rozes, N., Arola, L. and Zamora, F. (2004) New Method for Evaluating Astringency in Red Wine Journal of Agricultural and Food
Chemistry 2004, 52, 742-746.
Llaudy, M.C., Canals, R., Canals, J.M. and Zamora, F. (2008) Influence of ripening stage and maceration length on the contribution of grape skins, seeds and stems to phenolic
UNIVERSITAT ROVIRA I VIRGILI GRAPE PHENOLIC MATURITY; DETERMINATION METHODS AND CONSEQUENCES ON WINE PHENOLIC COMPOSITION Nikolaos Kontoudakis ISBN:978-84-693-7682-9/DL:T-1754-2010

nn
Introduction
46
composition and astringency in wine-simulated macerations. European Food Research and
Technology 226 (3), 337-344.
Lu, Y. and Yeap Foo, L. (1999) The polyphenol constituents of grape pomace. Food Chemistry
65, 1-8.
Ma, L., Cao, T.T., Kandpal, G., Warren, L., Fred Hess, J., Seabrook, G.R. and Ray, W.J. (2010) Genome-Wide Microarray Analysis of the Differential Neuroprotective Effects of Antioxidants in Neuroblastoma Cells Overexpressing the Familial Parkinson’s Disease a-Synuclein A53T Mutation. 1eurochemical Research 35 (1), 130–142.
Malherbe, D.F., du Toit, M., Cordero Otero, R.R., van Rensburg, P. and Pretorius, I.S. (2003) Expression of the Aspergillus niger glucose oxidase gene in Saccharomyces cerevisiae and its potential applications in wine production. Applied Microbiology and Biotechnology 61, 502-511.
Malien-Aubert, C., Dangles, O. and Amiot, M.J. (2002) Influence of procyanidins on the color stability of oenin solutions. Journal of Agricultural and Food Chemistry 50 (11), 3299-3305.
Mandelli, F., Miele, A., Rizzon, L.A. and Zanus, M.C. (2008) Effect of summer pruning on the physicochemical composition of the merlot grape must. Revista Brasileira de Fruticultura 30 (3), 667-674.
Main, G., Morris, J. and Striegler, K. (2002) Rootstock effects on chardonel productivity, fruit, and wine composition. American Journal of Enology and Viticulture 53 (1), 37-40.
Mateus, N., Marques, S., Gonçalves, A.C., Machado, J.M. and De Freitas, V. (2001) Proanthocyanidin composition of red Vitis vinifera varieties from the Douro valley during ripening: Influence of cultivation altitude. American Journal of Enology and Viticulture 52 (2), 115-121.
Mateus, N., Silva, A.M.S., Vercauteren, J. and De Freitas, V. (2001) Occurrence of anthocyanin-derived pigments in red wines. Journal of Agricultural and Food Chemistry 49 (10), 4836-4840.
Mateus, N., Machado, J.M. and V. de Freitas. (2002) Developmental changes of anthocyanins in Vitis vinifera grapes grown in the Douro Valley and concentration in respective wines. Journal of the Science of Food and Agriculture 82, 1689-1695.
Mateus, N., Silva, A.M.S., Rivas-Gonzalo, J.C., Santos-Buelga, C. and De Freitas, V. (2003) A new class of blue anthocyanin-derived pigments isolated from red wines. J. Agric. Food
Chemistry 51, 1919–1923.
Mazza, G. and Brouillard, R. (1990) The mechanism of co-pigmentation of anthocyanins in aqueous solutions. Phytochemistry 29 (4), 1097-1102.
Mazza G. and Miniati, E. (1993) Anthocyanins in Fruits, Vegetables, and Grains. Ed. Mazza G. and Miniati, E., CRS Press, Boka Raton, Florida, USA.
McMichael, A.J., Woodruff, R.E. and Hales, S. (2006) Climate change and human health: Present and future risks. Lancet 367, 859-869.
Mears, C.A. and Wentz. F.J. (2005) The Effect of Diurnal Correction on Satellite-Derived Lower Tropospheric Temperature. Science 309, 1548-1551.
UNIVERSITAT ROVIRA I VIRGILI GRAPE PHENOLIC MATURITY; DETERMINATION METHODS AND CONSEQUENCES ON WINE PHENOLIC COMPOSITION Nikolaos Kontoudakis ISBN:978-84-693-7682-9/DL:T-1754-2010

nn
Introduction
47
Mitrovica, J.X., Tamisiea, M.E., Davis, J.L. and Milne, G.A. (2001) Recent mass balance of polar ice sheets inferred from patterns of global sea-level change. 1ature 409, 1026-1029.
Monagas, M. and Bartolomé, B. (2009) Anthocyanins and anthocyanin-derived compounds. In:Wine Chemistry and Biochemistry (pp. 437-462) Eds. Moreno-Arribas, M.V. and Polo, C.M. Springer, NY, USA.
Monagas, M., Bartolomé, B. and Gómez-Cordovés, C. (2005) Updated Knowledge About the presence of phenolic compounds in wine. Critical Reviews in Food Science and 1utrition 45 (2), 85-118.
Muñoz, N.C., González, M.F., Alonso, S.G., Romero, E.G. and Gutiérrez, I.H. (2009) Red-color related phenolic composition of garnacha tintorera (Vitis vinifera L.) grapes and red wines. Journal of Agricultural and Food Chemistry 57 (17), 7883-7891.
NASA. (2010) http://www.giss.nasa.gov/research/news/20100121
Nemani, R.R., White, M.A., Cayan, D.R., Jones, G.V., Running, S.W., Coughlan, J.C. and Peterson, D.L. (2001) Asymmetric warming over coastal California and its impact on the premium wine industry. Climate Research 19 (1), 25-34.
NOAA. (2010) http://www.esrl.noaa.gov/gmd/ccgg/trends
Oliveira, J., de Freitas, V., Silva, A.M.S. and Mateus, N. (2007) Reaction between hydroxycinnamic acids and anthocyanin-pyruvic acid adducts yielding new portisins. Journal
of Agricultural and Food Chemistry 55, 6349-6356.
Ortega-Regules, A., Romero-Cascales, I., Ros-García, J.M., López-Roca, J.M. and Gómez-Plaza, E. (2006) A first approach towards the relationship between grape skin cell-wall composition and anthocyanin extractability. Analytica Chimica Acta 563, 26-32.
Parry, M.L., Rosenzweig, C., Iglesias, A., Livermore, M. and Fischer, G. (2004) Effects of climate change on global food production under SRES emissions and socio-economic scenarios. Global Environmental Change 14 (1), 53-67.
Pastor del Rio, J.L. and Kennedy, J.A. (2006) Development of proanthocyanidins in Vitis vinifera L. cv. Pinot noir grapes and extraction into wine. American Journal of Enology and
Viticulture 57 (2), 125-132.
Peleg, H., Gacon, K., Schlich, P. and Noble, A.C. (1999) Bitterness and astringency of flavan-3-ol monomers, dimers and trimers Journal of the Science of Food and Agriculture 79 (8), 1123-1128.
Pereira, G.E., Gaudillere, J.-P., Pieri, P., Hilbert, G., Maucourt, M., Deborde, C., Moing, A. and Rolin, D. (2006) Microclimate influence on mineral and metabolic profiles of grape berries. Journal of Agricultural and Food Chemistry 54 (18), 6765-6775.
Pérez-López, F.R., Chedraui, P., Haya, J. and Cuadros, J.L. (2009) Effects of the Mediterranean diet on longevity and age-related morbid conditions. Maturitas 64 (2), 67-79.
Piretti, M.V., Ghedini, M. and Serrazanetti, G. (1976) Isolation and identification of the polyphenolic and terpenoid constituents of Vitis vinifera v. Trebbiano variety. Annali di
Chimica 66, 429-437.
UNIVERSITAT ROVIRA I VIRGILI GRAPE PHENOLIC MATURITY; DETERMINATION METHODS AND CONSEQUENCES ON WINE PHENOLIC COMPOSITION Nikolaos Kontoudakis ISBN:978-84-693-7682-9/DL:T-1754-2010

nn
Introduction
48
Pickering, G.J., Heatherbell, D.A. and Barnes, M.F. (1998) Optimising glucose conversion in the production of reduced alcohol wine using glucose oxidase. Food Research International 31, 685-692.
Pickering, G.J., Heatherbell, D.A. and Barnes, M.F. (1999) The production of reduced-alcohol wine using glucose oxidase treated juice. Part I. Composition. American Journal of Enology
and Viticulture 50, 291-298.
Pickering, G.J. (2000) Low- and Reduced-alcohol Wine: A Review. Journal of Wine Research 11, 129–144.
Pissarra, J., Lourenço, S., González-Paramás, A.M., Mateus, N., Santos Buelga, C., Silva, A.M.S. and De Freitas, V. (2005) Isolation and structural characterization of new anthocyanin-alkyl-catechin pigments. Food Chemistry 90 (1-2), 81-87.
Pitsavos, C., Makrilakis, K., Panagiotakos, D.B., Chrysohoou, C., Ioannidis, I., Dimosthenopoulos, C., Stefanadis, C. and N. Katsilambros. (2005) The J-shape effect of alcohol intake on the risk of developing acute coronary syndromes in diabetic subjects: the CARDIO2000 II Study. Diabetic Medicine 22, 243-248.
Poni, S., Bernizzoni, F., Civardi, S. and Libelli, N. (2009) Effects of pre-bloom leaf removal on growth of berry tissues and must composition in two red vitis vinifera L. cultivars. Australian
Journal of Grape and Wine Research 15 (2), 185-193.
Pope, V.D., Gallani, M.L., Rowntree, P.R., and Stratton, R.A. (2000) The impact of new physical parameterizations in the Hadley Centre climate model-HadAM3. Climate Dynamics 16, 123-146.
Prieur, C., Rigaud, J., Cheynier, V., Moutounet, M. (1994) Oligomeric and polymeric procyanidins from grape seeds. Phytochemistry 36 (3), 781-784.
Reeve, J.R., Carpenter-Boggs, L., Reganold, J.P., York, A.L., McGourty, G. and McCloskey, L.P. (2005) Soil and winegrape quality in biodynamically and organically managed vineyards. American Journal of Enology and Viticulture 56 (4), 367-376.
Regan, J. (1990) Production of alcohol-free and low-alcohol beers by vacuum distillation and dialysis. Fermentation 3 (4), 235.
Remize, F., Andrieu, E. and Dequin, E. (2000) Engineering of the Pyruvate Dehydrogenase Bypass in Saccharomyces cerevisiae: Role of the Cytosolic Mg2+ and Mitochondrial K+ Acetaldehyde Dehydrogenases Ald6p and Ald4p in Acetate Formation during Alcoholic Fermentation. Applied and Environmental Microbiology 66, 3151-3159.
Remy, S., Fulcrand, H., Labarbe, B., Cheynier, V. and Moutounet, M. (2000) First confirmation in red wine of products resulting from direct anthocyanin-tannin reactions. Journal of the
Science of Food and Agriculture 80 (6), 745-751.
Remy-Tanneau, S., Le Guernevié, C., Meudec, E. and Cheynier, V. (2003) Characterization of a colorless anthocyanin-flavan-3-ol dimer containing both carbon-carbon and ether interflavanoid linkages by NMR and mass spectrometry. Journal of Agricultural and Food
Chemistry 51 (12), 3592-3597.
Renaud, S. and de Lorgeril, M. (1992) Wine, alcohol, platelets, and the French paradox for coronary heart disease. Lancet 339, 1523–1526.
UNIVERSITAT ROVIRA I VIRGILI GRAPE PHENOLIC MATURITY; DETERMINATION METHODS AND CONSEQUENCES ON WINE PHENOLIC COMPOSITION Nikolaos Kontoudakis ISBN:978-84-693-7682-9/DL:T-1754-2010

nn
Introduction
49
Rentzcch, M., Wilkens, A. and Winterhalter, P. (2009) Non-flavonoid phenolic compounds. In: Wine Chemistry and Biochemistry (pp. 509-527) Eds Moreno-Arribas, M.V. and Polo, C.M. Springer, NY, USA.
Reynolds, A.G., Wardle, D.A. and Naylor, A.P. (1996) Impact of Training System, Vine Spacing, and Basal Leaf Removal on Riesling. Vine Performance, Berry Composition, Canopy Microclimate, and Vineyard Labor Requirements. American Journal of Enology and
Viticulture 47 (1), 63-76.
Reynolds, A.G., Pearson, E.G., De Savigny, C., Coventry, J. and Strommer, J. (2007) Interactions of vine age and reflective mulch upon berry, must, and wine composition of five vitis vinifera cultivars. International Journal of Fruit Science 7 (4), 85-119.
Ribéreau-Gayon, P. (1965) Identification d’esters des acides cinnamiques et de l’acide tartrique dans les limbes et les baies de Vitis Vinifera. Comptes rendus hebdomadaires des seances de
l"Academie des sciences 260, 341-343.
Ribéreau-Gayon, P. (1968) Anthocyans. In : Les Composes Phenoliques des Vegetaux (202-254) Ed. Dunod, Bordeaux, France.
Ribéreau-Gayon, R., Glories, Y., Maujean, A. and Dubourdieu, D. (2006) Phenolic compounds. In: Handbook of Enology (vol. 2, pp. 141-204) Eds John Wiley & sons, Chichester, UK.
Rivas-Gonzalo, J.C., Bravo-Haro, S. and Santos-Buelga. C. (1995) Detection of compounds formed through the reaction of malvidin 3-monoglucoside and catechin in the presence of acetaldehyde. Journal of Agricultural and Food Chemistry 43, 1444-1449.
Robinson, G.M. and Robinson, R. (1931) A survey of anthocyanins. Biochemistry Journal 25, 1687–1705.
Romano, P., Suzzi, G., Turbanti, L. and Polsinelli, M. (1994) Acetaldehyde production in Saccharomyces cerevisiae wine yeasts. Microbiology Letters 118, 213-218.
Ruiz-Rodrigueza, A., Fornarib, T., Hernándezb, E.J., Señoransb, F.J. and Reglerob, G. (2010) Thermodynamic modeling of dealcoholization of beverages using supercritical CO2: Application to wine samples. The Journal of Supercritical Fluids doi:10.1016/j.supflu.2009.12.011.
Ryan, J.-M. and Revilla, E. (2003) Anthocyanin composition of Cabernet Sauvignon and Tempranillo grapes at different stages of ripening. Journal of Agriculture and Food Chemistry 51, 3372-3378.
Sacchi, K.L., Bisson, L.F. and Adams, D.O. (2005) A review of the effect of winemaking techniques on phenolic extraction in red wines. American Journal of Enology and Viticulture
56 (3), 197-206.
Saint-Cricq de Gaulejac, N., Vivas, N. and Glories, Y. (1998) Maturation phénolique des raisins rouges relation avec la qualité des vins comparaison des cépages Merlot et Tempranillo. Progrès Agricole et Viticole 115, 306-318.
Salas, E., Fulcrand, H., Meudec, E. and Cheynier, V. (2003) Reactions of Anthocyanins and Tannins in Model Solutions. Journal of Agricultural and Food Chemistry 51 (27), 7951-7961.
UNIVERSITAT ROVIRA I VIRGILI GRAPE PHENOLIC MATURITY; DETERMINATION METHODS AND CONSEQUENCES ON WINE PHENOLIC COMPOSITION Nikolaos Kontoudakis ISBN:978-84-693-7682-9/DL:T-1754-2010
nn
Introduction
50
Santos-Buelga, C., Bravo-Haro, S. and Rivas-Gonzalo, J.C. (1995) Interactions between catechin and malvidin-3-monoglucoside in model solutions. Zeitschrift für Lebensmittel-
Untersuchung und -Forschung 201 (3), 269-274.
Santos-Buelga, C., Frauda-Aricha, E.M., De Pascual-Teresa, S. and Rivas-Gonzalo, J.C. (1999) Contribution to the identification of the pigments responsible for the browning of anthocyanin-flavanol solutions. European Food Research and Technology 209 (6), 411-415.
Sarni-Manchado, P., Fulcrand, H., Souillol, V., Souquet, J.M. and Cheynier, V. (1995) Mechanisms of anthocyanin degradation in grape must-like model solutions. Journal of the
Science of Food and Agriculture 69 (3), 385 – 391.
Sarni-Manchado, P., Cheynier, V. and Moutounet, M. (1997) Reactions of polyphenoloxidase generated caftaric acid o-quinone with malvidin 3-O-glucoside. Phytochemistry 45 (7), 1365-1369.
Schultz, H.R. (2002) How may climate change affect viticulture in Europe? ACE Revista
d’Enologia 22, 10-14.
Schwarz, M., Jerz, G. and Winterhalter, P. (2003a) Isolation and structure of pinotin A, a new anthocyanin derivative from Pinotage wine. Vitis 42, 105-106.
Schwarz, M., Wabnitz, T.C. and Winterhalter, P. (2003b) Pathway leading to the formation of anthocyanin-vinylphenol adducts and related pigments in red wines. Journal of Agricultural
and Food Chemistry 51, 3682–3687.
Segade, S.R., Rolle, L., Gerbi, V. and Orriols, I. (2008) Phenolic ripeness assessment of grape skin by texture analysis. Journal of Food Composition and Analysis 21, 644- 649.
Singleton, V.L., Timberlake, C.F., and Lea, A.G.H. (1978) The phenolic cinnamate of white grapes and wine. Journal of the Science of Food and Agriculture 29, 403-410.
Somers, T.C. (1971) The polymeric nature of wine pigments. Phytochemistry 10 (9), 2175-2186.
Somers, T.C., Vérette, E. and Pocock, K.F. (1987) Hydroxycinnamate esters of Vitis vinifera: Changes during white vinification, and effects of exogenous enzymic hydrolysis. Journal of
the Science of Food and Agriculture 40, 67-68.
Souquet, J.-M., Cheynier, V., Brossaud, F. and Moutounet, M. (1996) Polymeric proanthocyanidins from grape skins. Phytochemistry 43, 509-512.
Souquet, J.M., Labarbe, B., Le Guernevé, C., Cheynier, V. and Moutounet, M. (2000) Phenolic composition of grape stems. Journal of Agricultural and Food Chemistry 48, 1076-1080.
Sousa, C., Mateus, N., Silva, A.M.S., González-Paramás, A.M., Santos-Buelga, C. and Freitas, V.d. (2007) Structural and chromatic characterization of a new Malvidin 3-glucoside-vanillyl-catechin pigment. Food Chemistry 102 (4), 1344-1351.
Spayd, S.E., Tarara, J.M., Mee, D.L. and Ferguson, J.C. (2002) Separation of sunlight and temperature effects on the composition of Vitis vinifera cv. Merlot berries. American Journal
of Enology and Viticulture 53 (3), 171-182.
Takács,L., Vatai, G. and Korány, K. (2007) Production of alcohol free wine by pervaporation. Journal of Food Engineering 78, 118-125.
UNIVERSITAT ROVIRA I VIRGILI GRAPE PHENOLIC MATURITY; DETERMINATION METHODS AND CONSEQUENCES ON WINE PHENOLIC COMPOSITION Nikolaos Kontoudakis ISBN:978-84-693-7682-9/DL:T-1754-2010

nn
Introduction
51
Terrier, N., Poncet-Legrand, C. and Cheynier, V. (2009) Flavanols, Flavonols and Dihydroflavonols. In:Wine Chemistry and Biochemistry (pp. 463-507) Eds. Moreno-Arribas, M.V. and Polo, C.M. Springer, NY, USA.
Timberlake, C. F. and Bridle, P. (1976) Interactions between anthocyanins phenolic compounds and acetaldehyde. American Journal of Enology and Viticulture 27 (3), 97-105.
Trousdale, E.K., and Singleton, V.L. (1983) Astilbin and engeletin in grape and wine. Phytochemistry 22 (2) 619-620.
Thomas, C.D., Cameron, A., Green, R.E., Bakkenes, M., Beaumont, L.J., Collingham, Y.C., Erasmus, B.F.N. et al. (2004) Extinction risk from climate change. 1ature 427, 145-148.
Tsai Su, C. and Singleton, V.L. (1969) Identification of three flavan-3-ols from grapes. Phytochemistry 8 (8), 1553-1558.
Vian, M.A., Tomao, V., Coulomb, P.O., Lacombe, J.M. and Dangles, O. (2006) Comparison of the anthocyanin composition during ripening of Syrah grapes grown using organic or conventional agricultural practices. Journal of Agricultural and Food Chemistry 54 (15), 5230-5235.
Vidal, S., Francis, L., Guyot, S., Marnet, N., Kwiatkowski, M., Gawel, R., Cheynier, V. and Waters, E.J. (2003) The mouth-feel properties of grape and apple proanthocyanidins in a wine-like medium. Journal of the Science of Food and Agriculture 83 (6), 564-573.
Vidal, S., Francis, L., Noble, A., Kwiatkowski, M., Cheynier, V. and Waters, E. (2004a) Taste and mouth-feel properties of different types of tannin-like polyphenolic compounds and anthocyanins in wine. Analytica Chimica Acta 513 (1), 57-65.
Vidal, S., Hayasaka, Y., Meudec, E., Cheynier, V. and Skouroumounis, G. (2004b) Fractionation of Grape Anthocyanin Classes Using Multilayer Coil Countercurrent Chromatography with Step Gradient Elution. Journal of Agricultural and Food Chemistry 52 (4), 713-719.
Vitrac, X., Castagnino, C., Waffo-Téguo, P., Delaunay, J-C., Vercauteren, J., Monti, J-P., Deffieux, G. and Mérillon, J-M. (2001) Polyphenols Newly Extracted in Red Wine from Southwestern France by Centrifugal Partition Chromatography. Journal of Agricultural and
Food Chemistry 49, 5934-5938.
Vivar-Quintana, A.M., Santos-Buelga. C., Francia-Aricha, E.M. and Rivas-Gonzalo, J.C. (1999) Formation of anthocyanin-derived pigments in experimental red wine. Food Science and
Technology International 5(4), 347-352.
Vivar-Quintana, A.M., Santos-Buelga, C. and Rivas-Gonzalo, J.C. (2002) Anthocyanin-derived pigments and colour of red wines. Analytica Chimica Acta 458 (1), 147-155.
Vivas De Gaulejac, N., Vivas, N., Absalon, C. and Nonier, M.F. (2001) Identification of procyanidin A2 in grape and wine of Vitis vinifera L. CV. Merlot noir and Cabernet sauvignon. Journal International des Sciences de la Vigne et du Vin 35 (1), 51-56.
Walker, T., Morris, J., Threlfall, R. and Main, G. (2004) Quality, sensory and cost comparison for pH reduction of syrah wine using ion exchange or tartaric acid. Journal of Food Quality 27, 483-496.
Walther, G.-R., Post, E., Convey, P., Menzel, A., Parmesan, C., Beebee, T.J.C., Fromentin, J.-M., et al. (2002) Ecological responses to recent climate change. 1ature 416, 389-395.
UNIVERSITAT ROVIRA I VIRGILI GRAPE PHENOLIC MATURITY; DETERMINATION METHODS AND CONSEQUENCES ON WINE PHENOLIC COMPOSITION Nikolaos Kontoudakis ISBN:978-84-693-7682-9/DL:T-1754-2010

nn
Introduction
52
Wang, S-P and Huang, K-J. (2004) Determination of flavonoids by high-performance liquid chromatography and capillary electrophoresis. Journal of Chromatography A 1032, 273–279.
Webb L.B. (2006) The impact of projected greenhouse gas-induced climate change on the Australian wine industry. PhD Thesis. University of Melbourne, Australia.
White, M.A., Diffenbaugh, N.S., Jones, G.V., Pal, J.S. and Giorgi, F. (2006) Extreme heat reduces and shifts United States premium wine production in the 21st century. Proceedings
of the 1ational Academy of Sciences of the United States of America 103 (30), 11217-11222.
Wildenradt H. L. and Singleton V. L. (1974) The production of aldehydes as a result of oxidation of polyphenolic compounds and its relation to wine aging. American Journal of
Enology and Viticulture 25 (2), 119-126.
Zamora, F. (2003) Elaboración y crianza del vino tinto; aspectos científicos y prácticos. Ed. Mundi-Prensa, AMV Ediciones, Madrid, Spain.
Zamora, F. (2005) El cambio climático: una amenaza para nuestra viticultura. Enólogos 39, 28-31.
Zoecklein, B.W., Wolf, T.K., Pélanne, L., Miller, M.K. and Birkenmaier, S.S. (2008) Effect of vertical shoot-positioned, Smart-Dyson, and Geneva double-curtain training systems on viognier grape and wine composition. American Journal of Enology and Viticulture 59 (1), 11-21.
UNIVERSITAT ROVIRA I VIRGILI GRAPE PHENOLIC MATURITY; DETERMINATION METHODS AND CONSEQUENCES ON WINE PHENOLIC COMPOSITION Nikolaos Kontoudakis ISBN:978-84-693-7682-9/DL:T-1754-2010

nn
II.HYPOTHESIS A�D OBJECTIVES
UNIVERSITAT ROVIRA I VIRGILI GRAPE PHENOLIC MATURITY; DETERMINATION METHODS AND CONSEQUENCES ON WINE PHENOLIC COMPOSITION Nikolaos Kontoudakis ISBN:978-84-693-7682-9/DL:T-1754-2010

nn
UNIVERSITAT ROVIRA I VIRGILI GRAPE PHENOLIC MATURITY; DETERMINATION METHODS AND CONSEQUENCES ON WINE PHENOLIC COMPOSITION Nikolaos Kontoudakis ISBN:978-84-693-7682-9/DL:T-1754-2010

nn
Hypothesis and objectives
55
HYPOTHESIS A�D OBJECTIVES
During the last years, consumers demand wines with deep red color, full body, soft tannins and
fruit scents. Those characteristics can be only achieved with grapes that have reached a high
phenolic maturity. Very well-ripe grapes have a high concentration of anthocyanins that
proportionate wines with deep red color. Additionally, full ripen grapes present low astringency
and bitterness probably due to the diminution of the proportion of seed proanthocyanidins which
are very galloylated. On the contrary, unripe grapes can lead to wines with poor color as also
high levels of bitterness and astringency.
At this point, it is essential to introduce the phenolic maturity notion. This concept makes
reference to the potential of proanthocyanidins and anthocyanins presents in grapes, as also to
their structure and capacity to be extracted from grapes during winemaking. Consequently,
oenologists are very interested in phenolic maturity measurement in order to know which will be
the color intensity and the final polyphenol composition of their wines. The aim is to facilitate
the decision of the harvest day and/or even to separate grapes in function of their real quality. In
recent years, several methods have been proposed to measure phenolic maturity. Among the
different techniques that have been developed, the most applied of them are based on obtaining
extracts from grapes with maceration in different solvents. Although these methods are
commonly employed by some wineries there is a lack of scientific information about their
exactitude, precision and especially their real predictive capacity. Indeed, only few studies
correlate the phenolic composition of the grapes with the color and phenolic composition of the
corresponding wines.
On the other hand, all these methods only provide the average value of a representative sample
from the whole grape vineyard and do not consider any possible heterogeneity in their degree of
maturity. Winemakers know that the presence of a non-negligible proportion of unripe berries at
the harvest time can considerably alter wine characteristics and that the only solution is the
manual elimination of unripe berries with a grape sorting table for minimizing its negative
impact.
In view of the above, the main objectives of the first part of this thesis were:
• To compare three of the most used methods for measuring the phenolic maturity of
grapes at the harvest time - Glories, ITV and Cromoenos - in order to determine their
UNIVERSITAT ROVIRA I VIRGILI GRAPE PHENOLIC MATURITY; DETERMINATION METHODS AND CONSEQUENCES ON WINE PHENOLIC COMPOSITION Nikolaos Kontoudakis ISBN:978-84-693-7682-9/DL:T-1754-2010

nn
Hypothesis and objectives
56
predictive effectiveness on the color and phenolic composition of the corresponding
wines.
• To study the heterogeneity of the grapes, according to their density, during the grape
ripening and determine its real influence on wine characteristics.
Once we achieved those objectives, we focused on the probably implications that well-ripe
grapes could have at wine quality. Grapes with very high phenolic maturity frequently have high
sugar and low acid concentration; thereby the obtained wines have the inconvenience of
presenting very high pH and alcohol content. During recent years this tendency seems to be
increasing especially as result of the climate change.
To mitigate the excess of pH and alcoholic concentration of wines we proposed the following
objective:
• To study the use of unripe grapes harvested during cluster thinning as a new winemaking
procedure for partially reducing the wine pH and alcoholic content.
During last years, micro-oxygenation has begun to be a common application technique in
several wineries. Most authors have suggested that the reactions induced by oxygen produce
wine color stabilization and astringency decrease. In fact, all winemakers know that micro-
oxygenation is very useful for stabilizing color, for improving structure and body, and for
decreasing the astringency, bitterness and herbaceous characters of wine. Therefore, its
employment in wines obtained with insufficiently-ripe grapes is highly recommended.
As it is already mentioned, well-ripe grapes probably lead to wines with high pH and
insufficiently-ripe grapes generally produce wines with low pH. The pH conditions the
equilibrium among the different anthocyanin forms and has an unquestionable impact on wine
color. On the other hand, anthocyanins can act, depending on pH, as electrophiles in the
flavylium form or as nucleophiles in the hemiketal form. Therefore, it is quite logical that pH
can influence the reactivity of anthocyanins. Moreover, the first step on the reactions induced by
oxygen implies the formation of ethanal from ethanol. Subsequently, ethanal must capture a
proton and become into a carbocation which will react with flavanols to start the process of
formation of ethyl bridges. Therefore it is also logical that pH exert a non-negligible influence
on these mechanisms.
UNIVERSITAT ROVIRA I VIRGILI GRAPE PHENOLIC MATURITY; DETERMINATION METHODS AND CONSEQUENCES ON WINE PHENOLIC COMPOSITION Nikolaos Kontoudakis ISBN:978-84-693-7682-9/DL:T-1754-2010

nn
Hypothesis and objectives
57
In this context, it is logical to consider that the proton concentration, and consequently the pH,
affects the process of this reaction. For that reason it would be interesting to study how wines
with different pH evolve with the application of micro-oxygenation.
Bearing in mind this observation we proposed the following objective:
• To study the influence of wine pH on the effectiveness of micro-oxygenation.
This research is part of a more general project developed by the Oenological Technology
Research Group of the Department of Biochemistry and Biotechnology of the Rovira i Virgili
University in Tarragona, Spain (project: AGL2007-66338 and CDTI (Project CENIT Demeter).
An international stage has been done completed at the Chemistry Department of the Porto
University down the supervision of the professor Dr. Victor de Freitas.
UNIVERSITAT ROVIRA I VIRGILI GRAPE PHENOLIC MATURITY; DETERMINATION METHODS AND CONSEQUENCES ON WINE PHENOLIC COMPOSITION Nikolaos Kontoudakis ISBN:978-84-693-7682-9/DL:T-1754-2010

UNIVERSITAT ROVIRA I VIRGILI GRAPE PHENOLIC MATURITY; DETERMINATION METHODS AND CONSEQUENCES ON WINE PHENOLIC COMPOSITION Nikolaos Kontoudakis ISBN:978-84-693-7682-9/DL:T-1754-2010

nn
UNIVERSITAT ROVIRA I VIRGILI GRAPE PHENOLIC MATURITY; DETERMINATION METHODS AND CONSEQUENCES ON WINE PHENOLIC COMPOSITION Nikolaos Kontoudakis ISBN:978-84-693-7682-9/DL:T-1754-2010

UNIVERSITAT ROVIRA I VIRGILI GRAPE PHENOLIC MATURITY; DETERMINATION METHODS AND CONSEQUENCES ON WINE PHENOLIC COMPOSITION Nikolaos Kontoudakis ISBN:978-84-693-7682-9/DL:T-1754-2010

nn
III.RESULTS
UNIVERSITAT ROVIRA I VIRGILI GRAPE PHENOLIC MATURITY; DETERMINATION METHODS AND CONSEQUENCES ON WINE PHENOLIC COMPOSITION Nikolaos Kontoudakis ISBN:978-84-693-7682-9/DL:T-1754-2010

nn
UNIVERSITAT ROVIRA I VIRGILI GRAPE PHENOLIC MATURITY; DETERMINATION METHODS AND CONSEQUENCES ON WINE PHENOLIC COMPOSITION Nikolaos Kontoudakis ISBN:978-84-693-7682-9/DL:T-1754-2010

nn
i. Comparison of methods for estimating phenolic maturity in
grapes: Correlation between predicted and obtained parameters
Nikolaos Kontoudakis, Mireia Esteruelas, Francesca Fort, Joan Miquel Canals, Fernando
Zamora
Departament de Bioquímica i Biotecnologia, Facultat d’Enologia de Tarragona, Universitat
Rovira i Virgili, Campus de Sescelades, C/ Marcel.li Domingo, s/n. 43007-Tarragona, Spain.
Analytica Chimica Acta 660 (2010) 127–133.
UNIVERSITAT ROVIRA I VIRGILI GRAPE PHENOLIC MATURITY; DETERMINATION METHODS AND CONSEQUENCES ON WINE PHENOLIC COMPOSITION Nikolaos Kontoudakis ISBN:978-84-693-7682-9/DL:T-1754-2010

nn
UNIVERSITAT ROVIRA I VIRGILI GRAPE PHENOLIC MATURITY; DETERMINATION METHODS AND CONSEQUENCES ON WINE PHENOLIC COMPOSITION Nikolaos Kontoudakis ISBN:978-84-693-7682-9/DL:T-1754-2010

nn
Results (i)
63
Abstract
With the aim of determining the real predictive ability of three methods for measuring phenolic
maturity (Glories, ITV and Cromoenos), representative grapes of Merlot, Cabernet sauvignon,
Grenache and Tempranillo were harvested at three different ripening levels. The grapes were
vinified by triplicate and were also used for phenolic maturity estimation. After that, colour
intensity, CIELAB coordinates, anthocyanins by spectrometry and HPLC and total phenolics
were analysed in wines and also in the different extracts from the three extraction methods.
Statistical analysis of data was carried out to determine the real performance of prediction of the
different methods. Glories method predicted reasonably the color intensity, CIELAB
coordinates and the concentration of anthocyanins and total phenolics in wine although it needs
a lot of time and it requires working carefully. On the other hand, Cromoenos method predicted
similarly or even better the color and phenolic composition of wine. This method also presents
the advantage of being much faster and easier to apply. In contrast, although the ITV method
provided reasonable results for anthocyanins and total phenolic compounds its colour prediction
was not adequate.
Keywords: Phenolic maturity, Glories, Institut Français de la Vigne et du Vin, method,
Cromoenos, Predictive ability
UNIVERSITAT ROVIRA I VIRGILI GRAPE PHENOLIC MATURITY; DETERMINATION METHODS AND CONSEQUENCES ON WINE PHENOLIC COMPOSITION Nikolaos Kontoudakis ISBN:978-84-693-7682-9/DL:T-1754-2010

nn
Results (i)
64
1. Introduction
One of the most important parameters for obtaining high quality red wines is probably the
ripeness of the grapes at the harvest time. Commonly, the grape maturity, and therefore the
decision of harvesting, is to be taken only after analyzing sugar concentration, titratable acidity
and the pH of the grape juice [1]. However, these parameters only provide information about the
pulp ripeness and overlook the real degree of skins and seeds maturities [2].
The maturity of skins and seeds is considered as a key factor for red winemaking because they
are the major source of phenolic compounds which are dissolved into the wine during
maceration process [1,3]. Anthocyanins, the molecules responsible of red wine color,
accumulate gradually in the skins during ripening [4-6]. However, anthocyanins are not always
easily extracted from skins, and low extraction levels can lead to poorly colored wines, even
though if the anthocyanins concentration in the original grapes is sufficient [7]. Therefore, the
extractability of anthocyanins is also one of the main factors affecting their future concentration
in wine [2,7]. Moreover, the extractability of anthocyanins increases throughout grape ripening
[1]. In fact, it has been verified that the maceration of skins from well-ripened grapes in a model
wine solution originated a greater anthocyanin concentration and higher color intensity [8].
Grape skins and seeds also contain many other phenolic compounds that are incorporated into
the wine during the maceration process. Among these, proanthocyanidins, also known as
condensed tannins, have a major role in wine quality [1]. Unlike proanthocyanidins from seeds,
proanthocyanidins from skins contain prodelphinidins and have a higher degree of
polymerization and a lower proportion of galloylated subunits [8]. Proanthocyanidins contribute
to long-term color stability by combining with anthocyanins [1]. Besides, proanthocyanidins are
also associated with such texture sensations as body and astringency [8,9].
Nowadays, deeply colored and full-bodied wines are highly valued by the market. However,
these kind of wines require fully ripen grapes or on the contrary there is a risk of obtaining very
bitter and astringent wines if the maceration technique applied provokes an overextraction of
tannins. Consequently, winemakers are very interested in phenolic maturity measurement in
order to know which will be the color intensity and the final polyphenol composition of the
wine. The aim is to facilitate the decision of the day of harvest or even to separate grapes in
function of their real quality. Several methods for measuring phenolic maturity have been
UNIVERSITAT ROVIRA I VIRGILI GRAPE PHENOLIC MATURITY; DETERMINATION METHODS AND CONSEQUENCES ON WINE PHENOLIC COMPOSITION Nikolaos Kontoudakis ISBN:978-84-693-7682-9/DL:T-1754-2010

nn
Results (i)
65
proposed using different techniques, such as the skin texture measurement [10], the direct
measurement of the color absorption of the grape skins [11] and even the analysis of
multispectral airborne high resolution images [12]. Nevertheless, these methods still remain
experimental and are not usually employed by wineries. Nowadays, the most applied methods
are based on obtaining extracts from grapes by means of maceration in different solvents [7, 13-
17]. Among them, Glories method [7, 18] and ITV method [16,19] are probably the most
employed. However, all these methods are slow, laborious and require the participation of well-
trained technicians. Recently, another method, Cromoenos, has been proposed [20]. This
method uses two commercial reagents and specific equipment for extracting phenolic
compounds, enabling results easily in just 10 minutes.
Although these methods are commonly employed by some wineries there is not a clear criterion
for selecting which one of these methods is the most appropriate. This is probably due to the
lack of scientific information about their exactitude, precision and especially their real predictive
capacity. In fact, to our knowledge there are only few studies which have tried to correlate the
phenolic composition of the grapes with the color and phenolic composition of the
corresponding wines [21-23]. The aim of this study was the comparison of three methods of
measuring phenolic maturity, Glories [7], ITV [13] and Cromoenos [20] in order to determine
their predictive performance on the color and phenolic composition of the corresponding wines.
2. Materials and methods
2.1. Materials
2.1.1. Chemicals
Methanol, acetonitrile and formic acid were HPLC grade were purchased from Panreac
(Barcelona, Spain). Malvidin-3-O-glucoside chloride was purchased from Extrasynthès (Genay,
France). The rest of the chemicals were of high purity and were purchased from Panreac
(Barcelona, Spain).
2.1.2. Grape samples
UNIVERSITAT ROVIRA I VIRGILI GRAPE PHENOLIC MATURITY; DETERMINATION METHODS AND CONSEQUENCES ON WINE PHENOLIC COMPOSITION Nikolaos Kontoudakis ISBN:978-84-693-7682-9/DL:T-1754-2010

nn
Results (i)
66
This study was carried out with grapes of the cultivars Vitis vinifera cv. Merlot, Cabernet
sauvignon, Grenache and Tempranillo. Grapes were harvested from the experimental vineyard
belonging to the Enology Faculty in Tarragona (Rovira i Virgili University) at Constantí
(Tarragona) in 2007 at three levels of ripeness.
For each cultivar, the grapes were only collected from the two central rows of each plot. For
obtaining random samples and for avoiding picking grapes from the same vine, every third vine
was marked.
The first harvest was collected three weeks after veraison and only from the marked vines. The
second harvest was carried out five weeks after veraison collecting only grapes from the vines
right next to the marked ones. Finally, the third harvest was done 7 weeks after veraison picking
only grapes from the remaining vines.
All bunches were manually destemed and the grapes were randomly grouped and used
immediately for standard and phenolic maturity measurements and also for winemaking.
2.2. Methods
All the maturity analysis and vinifications were carried out by triplicate.
2.2.1. Standard maturity analysis.
One hundred grape berries were weighted and used for determining the sugar content, the
titratable acidity and the pH according with the analytical methods recommended by the OIV
[25]. Sugar concentration was measured using a refractometer (Fabre réfractométres, Sarl
Germain, France). The titratable acidity was measured by titrimetry using NaOH 0.1 N and
Bromothymol blue as indicator. The pH was measured using a pHmeter (micropH 2002, Crison,
Barcelona, Spain). Table 1 shows the sugar content, the probable alcoholic degree, the titratable
acidity, pH and the weight of 100 berries of the four cultivars at the three different maturity
levels in which they were harvested.
UNIVERSITAT ROVIRA I VIRGILI GRAPE PHENOLIC MATURITY; DETERMINATION METHODS AND CONSEQUENCES ON WINE PHENOLIC COMPOSITION Nikolaos Kontoudakis ISBN:978-84-693-7682-9/DL:T-1754-2010

nn
Results (i)
67
Table 1. Evolution of standard parameters of grapes throughout ripening.
All data expressed the arithmetic average of three replicates ± standard deviation. S: sugar concentra tion, PDA:probable alcoholic degree , TA: titratable acidity, W: weight of 100 berries. Different letter indicates theexistence of sta tistically significant differences.
Cultivars ParametersWeeks after veraison
3 5 7
Merlot
S (g/L) 201.1 ± 0.1a 233.9 ± 0.1b 242.4 ± 0.1c
PAD (% v/v) 12.0 ± 0.1a 13.9 ± 0.1b 14.4 ± 0.1c
TA (g/l) 6.65 ± 0.16a 5.42 ± 0.03b 4.67 ± 0.23c
pH 3.23 ± 0.01a 3.39 ± 0.01b 3.45 ± 0.01c
W (g) 147.7 ± 2.4a 150.1 ± 1.7a 169.4 ± 6.1b
Cabernet Sauvignon
S (g/L) 185.1 ± 0.1a 207.6 ± 1.9b 222.2 ± 0.1c
PAD (% v/v) 11.0 ± 0.1a 12.3 ± 0.2b 13.2 ± 0.1c
TA (g/l) 8.95 ± 0.23a 6.90 ± 0.40b 5.65 ± 0.09c
pH 3.07 ± 0.01a 3.14 ± 0.02b 3.28 ± 0.01c
W (g) 135.1 ± 0.7a 137.6 ± 3.5a 153.6 ± 5.0b
Grenache
S (g/L) 221.0 ± 1.9a 233.9 ± 0.1b 233.4 ± 0.9b
PAD (% v/v) 12.0 ± 0.3a 13.9 ± 0.1b 13.9 ± 0.2b
TA (g/l) 5.58 ± 0.17a 4.03 ± 0.03b 3.90 ± 0.01c
pH 3.07 ± 0.01a 3.30 ± 0.01b 3.30 ± 0.03b
W (g) 200.9 ± 5.06a 203.9 ± 5.8a 222.2 ± 5.7b
Tempranillo
S (g/L) 194.1 ± 1.0a 203.6 ± 0.1b 233.9 ± 1.7c
PAD (% v/v) 11.5 ± 0.2a 12.1 ± 0.1b 13.9 ± 0.3c
TA (g/l) 5.85 ± 0.15a 4.46 ± 0.05b 4.20 ± 0.01c
pH 3.15 ± 0.01a 3.23 ± 0.03b 3.28 ± 0.01c
W (g) 209.2 ± 5.9a 216.9 ± 15.2ab 223.9 ± 8.46b
2.2.2. Phenolic maturity analysis.
Six hundred grape berries from the four grape varieties and from the different ripening stages
were milled by triplicate for 1 minute using a blender (Krups GMBH, F575, Solingen,
Germany). This extract was used for the measurement of phenolic maturity using the Glories
method, the ITV method and the Cromoenos method.
2.2.2.1. Glories method
It has been applied a modification of the methodology previously described by Professor Glories
[7,18]. The modification consisted in the use of two buffers to guarantee the conservation of the
pH throughout the maceration period. Samples of 50 g of the extract were macerated for 4 hours
in two different buffers. First buffer was oxalic acid 0.3 M (pH 1.00) and the second buffer was
phosphoric acid 0.3 M (pH 3.2). The pH of both buffers was adjusted using NaOH solution (0.2
N). The samples were manually shacked every half hour. After 4 h, the macerated samples were
UNIVERSITAT ROVIRA I VIRGILI GRAPE PHENOLIC MATURITY; DETERMINATION METHODS AND CONSEQUENCES ON WINE PHENOLIC COMPOSITION Nikolaos Kontoudakis ISBN:978-84-693-7682-9/DL:T-1754-2010

nn
Results (i)
68
centrifuged (12,000 rpm, 10 min) in a Biofuge primo centrifuge (Heraus, Osterode, Germany)
and used for colour measurement and for anthocyanins and total phenolic compounds content.
2.2.2.2. ITV method
It has been applied the methodology previously described by Dupuch [13]. Samples of 50 g of
the extract were macerated for 1 h after the addition of 15 mL of ethanol (96 %) and 85 mL of
HCl (0.1 %). The samples were manually shacked every 15 minutes. After 1 h, the macerated
samples were centrifuged (12,000 rpm, 10 min) in a Biofuge primo centrifuge (Heraus,
Osterode, Germany) and used for colour measurement and for anthocyanins and total phenolic
compounds content.
2.2.2.3. Cromoenos method
This method use specific equipment and reagents provided by the manufacturer (Bioenos,
Cariñena, Spain) [20]. Samples of 40 mL of the extract were introduced in the thermoextractor
after the addition of 1 mL of reagent A, 4 mL of reagent B and 40 mL of deionised water. Once
upon the temperature arrives till 80 ºC (environ 2 min) 1 mL of the sample was centrifuged
(13,400 rpm; 2 min) in a Hermle Z233 MK2 centrifuge (Wehingen, Germany).
60 µL of the the supernatant were diluted till 4 mL with HCl 2 % (v/v). This solution was used
for the measurement of the absorbance at 520 and 280 nm. The predicted colour intensity of the
corresponding wines were obtained by means of the software supplied by the manufacturer after
introducing the absorbances at 520 and 280 nm as well as the cultivar name, the probable
alcoholic degree, titratable acidity and pH. Simultaneously, this solution was also used for the
determination of anthocyanins and total phenolic compounds content.
2.2.2.4. Modified Cromoenos method
A modification of the Cromoenos was also applied to the measurement of the color. 500 µL of
the supernatant were diluted with 1 mL of a synthetic solution containing 4 g of tartaric acid L-1
and 13 % (v/v) ethanol adjusted at a pH of 3.80. This solution was selected after some previous
UNIVERSITAT ROVIRA I VIRGILI GRAPE PHENOLIC MATURITY; DETERMINATION METHODS AND CONSEQUENCES ON WINE PHENOLIC COMPOSITION Nikolaos Kontoudakis ISBN:978-84-693-7682-9/DL:T-1754-2010
nn
Results (i)
69
assays (data not shown) because the mixture with the Cromoenos extract presented a pH similar
than that of most of the wines of the region (pH 3.50). This mixture was directly used for colour
measurements.
2.2.3. Winemaking procedure.
For each variety and ripening stage, the grapes were harvested and manually destemed. After
that, the berries were randomly distributed in three groups of eight kilos each one, crushed with
a semi-automatic crusher machine (Gual, Villafranca del Penedès, Spain), sulphited (100 mg of
K2S2O5 L-1) and introduced in 10 L tanks. All tanks were immediately inoculated with 200 mg
L-1 of selected yeast (DV10, Martin Vialatte, Epernay, France) and maintained at a room
temperature of 25 ± 1 ºC. All these microvinifications were controlled diary by measuring the
temperature and the density of the must. Each day a punch down was carried out to favour
phenolic compounds dissolution. After 14 days of maceration, the wines were racked, sulphited
(100 mg of K2S2O5 L-1) and refrigerated for three weeks at 4 ºC. Hence, malolactic fermentation
was inhibited to avoid possible variations in the rhythm of this transformation that could affect
differently each wine. After that, wines were decanted and bottled. All the samples were stocked
at 15 ± 1 ºC until the moment of the analysis.
2.2.4. Wine and phenolic extract analysis
With the aim of making directly comparable extracts and wines, the results of grape extracts
were corrected considering the applied dilution factors and a theoretical yield of 80 % between
the volume of wine and the weight of the grapes.
2.2.4.1. Colour parameters.
The color intensity (CI) was estimated using the method described by Glories [26]. The
CIELAB parameters, lightness (L*), chroma (C*), hue (H*), redness (a*) and yellowness (b*)
were determined according to Ayala et al. [27].
UNIVERSITAT ROVIRA I VIRGILI GRAPE PHENOLIC MATURITY; DETERMINATION METHODS AND CONSEQUENCES ON WINE PHENOLIC COMPOSITION Nikolaos Kontoudakis ISBN:978-84-693-7682-9/DL:T-1754-2010
nn
Results (i)
70
2.2.4.2. Phenolic compounds.
The total anthocyanins concentration was determined spectrophotometrically using the method
described by Niketic-Aleksic and Hrazdrina [28]. HPLC analyses of anthocyanins were carried
out with an Agilent (1100 series) liquid chromathograph and Waters Spherisorb column (ODS2)
in accordance with the method described by González-SanJosé [14]. The anthocyanin standard
curves were made using malvidin-3-glucoside (Extrasynthase, Lyon, France). The total phenolic
index (TPI) was determined by measuring absorbance at 280 nm [2] and expressed as
absorbance units [1].
2.2.5. Statistics.
All of the data are expressed as the arithmetic average ± standard deviation from three
replicates. Linear regressions as well as Fisher’s correlation analysis were carried out using
Statview (software for Macintosh). Statistical comparisons between values were established
with a one-factor ANOVA and Schffee test using SPSS software.
3. Results and discussion
Table 1 shows the sugar content, probable alcoholic degree, titratable acidity, pH and the weight
of 100 berries of the four cultivars at the three selected harvest maturity levels. The four
cultivars presented the expected evolution in all parameter. The first harvest presented an
insufficient maturity inasmuch as the probable alcoholic degree and pH were relatively low and
the titratable acidity relatively high in relation to the potentiality of each one of these cultivars.
In contrast, the grapes of the third harvest were very ripe because their probable alcoholic
degree and pH were relatively high and their titratable acidity comparatively low. The grapes of
the second harvest of the four cultivars presented intermediate values.
Figure 1 shows the linear regression analysis between the color intensity of the different wines
and their corresponding predicted values obtained by applying the different phenolic maturity
methods. These results indicate that Glories and Cromoenos methods originated reasonably
linear regression coefficients (r2 = 0.8489 and 0.8869 respectively), whereas the ITV method did
UNIVERSITAT ROVIRA I VIRGILI GRAPE PHENOLIC MATURITY; DETERMINATION METHODS AND CONSEQUENCES ON WINE PHENOLIC COMPOSITION Nikolaos Kontoudakis ISBN:978-84-693-7682-9/DL:T-1754-2010
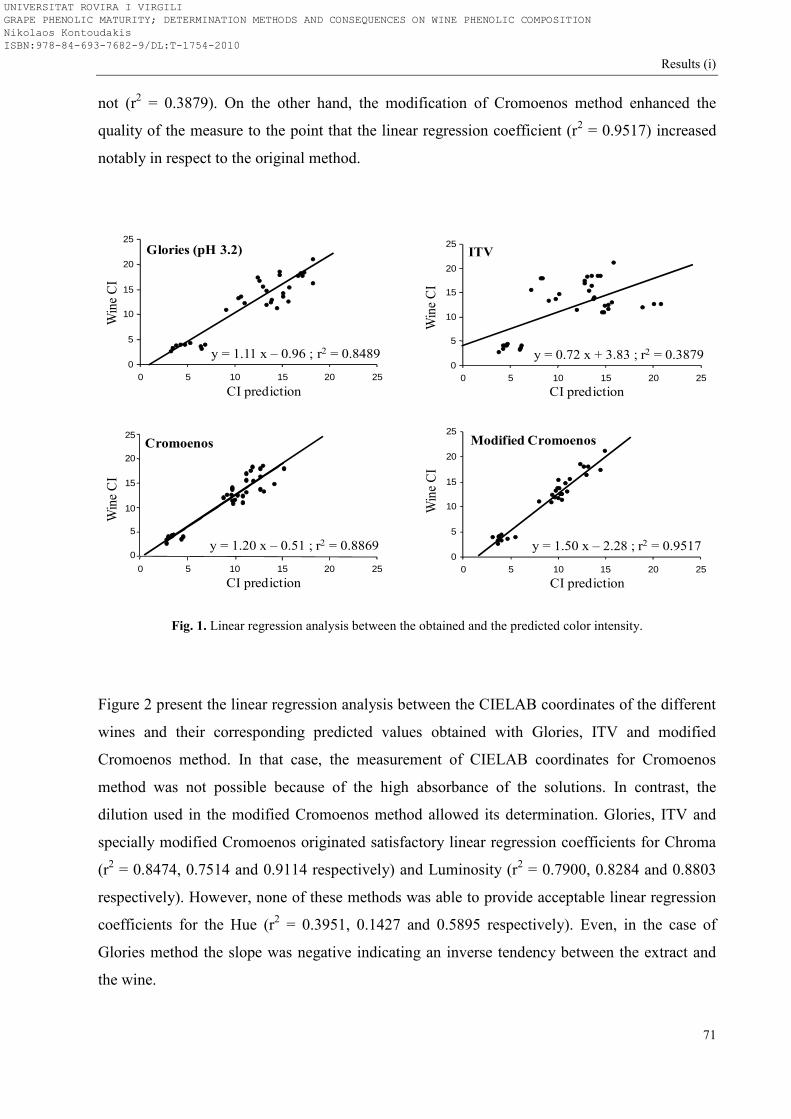
nn
Results (i)
71
not (r2 = 0.3879). On the other hand, the modification of Cromoenos method enhanced the
quality of the measure to the point that the linear regression coefficient (r2 = 0.9517) increased
notably in respect to the original method.
0
5
10
15
20
25
0 5 10 15 20 25
y = 0.72 x + 3.83 ; r2 = 0.3879
ITV
Win
e C
I
CI prediction
Win
e C
I
CI prediction
y = 1.50 x – 2.28 ; r2 = 0.9517 0
5
10
15
20
25
0 5 10 15 20 25
Modified Cromoenos
Win
e C
I
CI prediction
0
5
10
15
20
25Cromoenos
y = 1.20 x – 0.51 ; r2 = 0.8869
0 5 10 15 20 25
y = 1.11 x – 0.96 ; r2 = 0.8489
CI prediction
Win
e C
I
Glories (pH 3.2)
0
5
10
15
20
25
0 5 10 15 20 25
Fig. 1. Linear regression analysis between the obtained and the predicted color intensity.
Figure 2 present the linear regression analysis between the CIELAB coordinates of the different
wines and their corresponding predicted values obtained with Glories, ITV and modified
Cromoenos method. In that case, the measurement of CIELAB coordinates for Cromoenos
method was not possible because of the high absorbance of the solutions. In contrast, the
dilution used in the modified Cromoenos method allowed its determination. Glories, ITV and
specially modified Cromoenos originated satisfactory linear regression coefficients for Chroma
(r2 = 0.8474, 0.7514 and 0.9114 respectively) and Luminosity (r2 = 0.7900, 0.8284 and 0.8803
respectively). However, none of these methods was able to provide acceptable linear regression
coefficients for the Hue (r2 = 0.3951, 0.1427 and 0.5895 respectively). Even, in the case of
Glories method the slope was negative indicating an inverse tendency between the extract and
the wine.
UNIVERSITAT ROVIRA I VIRGILI GRAPE PHENOLIC MATURITY; DETERMINATION METHODS AND CONSEQUENCES ON WINE PHENOLIC COMPOSITION Nikolaos Kontoudakis ISBN:978-84-693-7682-9/DL:T-1754-2010
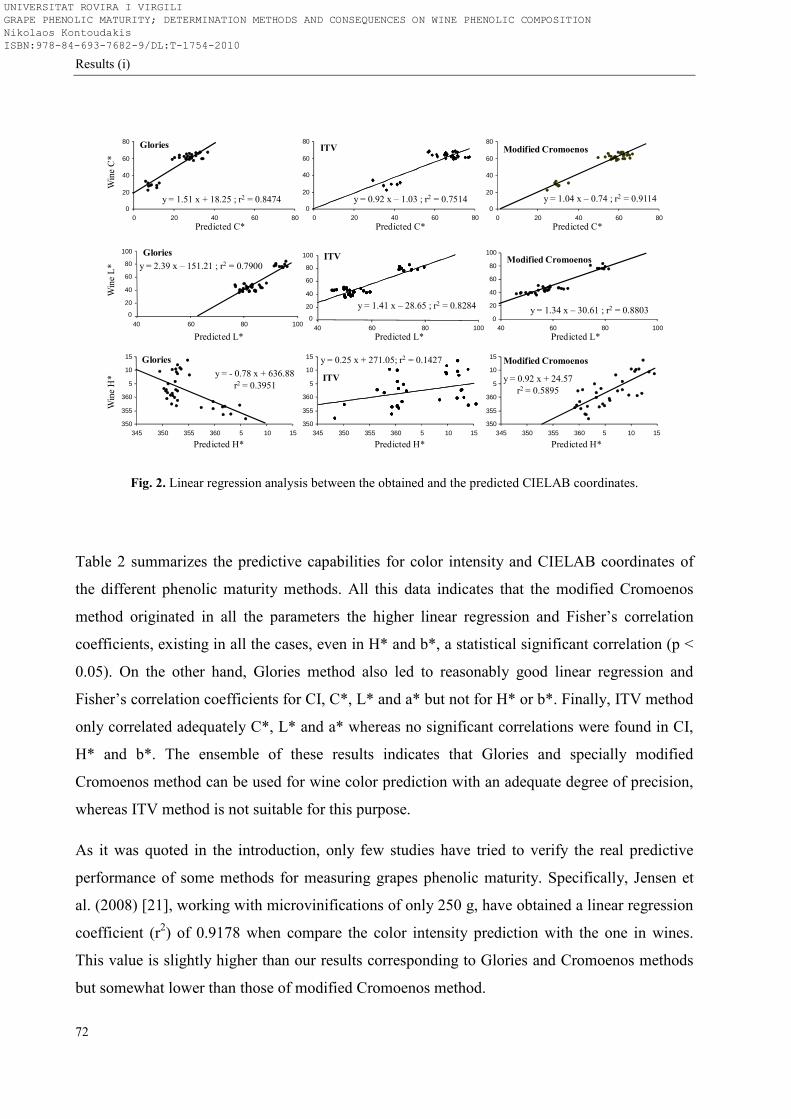
nn
Results (i)
72
W
ine
H*
Predicted H*
y = - 0.78 x + 636.88r2 = 0.3951
350
355
360
5
10
15
345 350 355 360 5 10 15
Glories
Predicted H*
y = 0.92 x + 24.57r2 = 0.5895
350
355
360
5
10
15
345 350 355 360 5 10 15
Modified Cromoenos
Win
e C
*
y = 1.51 x + 18.25 ; r2 = 0.84740
20
40
60
80
0 20 40 60 80
Glories
Predicted C*
Win
e L
*
Glories
0
20
40
60
80
100
40 60 80 100
y = 2.39 x – 151.21 ; r2 = 0.7900
Predicted L*
y = 0.92 x – 1.03 ; r2 = 0.75140
20
40
60
80
0 20 40 60 80
ITV
Predicted C*
0
20
40
60
80
0 20 40 60 80
y = 1.04 x – 0.74 ; r2 = 0.9114
Modified Cromoenos
Predicted C*
ITV
0
20
40
60
80
100
40 60 80 100
y = 1.41 x – 28.65 ; r2 = 0.8284
Predicted L*
0
20
40
60
80
100
40 60 80 100
y = 1.34 x – 30.61 ; r2 = 0.8803
Modified Cromoenos
Predicted L*
Predicted H*
350
355
360
5
10
15
345 350 355 360 5 10 15
ITV
y = 0.25 x + 271.05; r2 = 0.1427
Fig. 2. Linear regression analysis between the obtained and the predicted CIELAB coordinates.
Table 2 summarizes the predictive capabilities for color intensity and CIELAB coordinates of
the different phenolic maturity methods. All this data indicates that the modified Cromoenos
method originated in all the parameters the higher linear regression and Fisher’s correlation
coefficients, existing in all the cases, even in H* and b*, a statistical significant correlation (p <
0.05). On the other hand, Glories method also led to reasonably good linear regression and
Fisher’s correlation coefficients for CI, C*, L* and a* but not for H* or b*. Finally, ITV method
only correlated adequately C*, L* and a* whereas no significant correlations were found in CI,
H* and b*. The ensemble of these results indicates that Glories and specially modified
Cromoenos method can be used for wine color prediction with an adequate degree of precision,
whereas ITV method is not suitable for this purpose.
As it was quoted in the introduction, only few studies have tried to verify the real predictive
performance of some methods for measuring grapes phenolic maturity. Specifically, Jensen et
al. (2008) [21], working with microvinifications of only 250 g, have obtained a linear regression
coefficient (r2) of 0.9178 when compare the color intensity prediction with the one in wines.
This value is slightly higher than our results corresponding to Glories and Cromoenos methods
but somewhat lower than those of modified Cromoenos method.
UNIVERSITAT ROVIRA I VIRGILI GRAPE PHENOLIC MATURITY; DETERMINATION METHODS AND CONSEQUENCES ON WINE PHENOLIC COMPOSITION Nikolaos Kontoudakis ISBN:978-84-693-7682-9/DL:T-1754-2010

nn
Results (i)
73
Table 2. Comparison between the predictive capabilities for color intensity and CIELAB coordinates of the differentmethods.
Predicted parameter Method Slope (m)Y Intercept
(b)r2
Fisher's correlation coefficient
Significance
Color intensity
Glories (pH 3.2) 1.11 -0.96 0.8489 0.9214 ***
ITV 0.21 -3.83 0.3879 0.5624 ns
Cromoenos 1.20 -0.51 0.8869 0.9418 ***
Modified Cromoenos 1.50 -2.28 0.9517 0.9756 ***
C*
Glories (pH 3.2) 1.51 18,25 0.8474 0.9205 ***
ITV 0.92 -1.03 0.7514 0.8668 ***
Modified Cromoenos 1.05 0.74 0.9114 0.9547 ***
L*
Glories (pH 3.2) 2.39 -151.21 0.7900 0.8888 ***
ITV 1.41 -28.65 0.8284 0.9102 ***
Modified Cromoenos 1.34 -30.61 0.8803 0.9382 ***
H*
Glories (pH 3.2) -0.78 636.88 0.3951 0.5756 ns
ITV 0.25 271.05 0.1427 0.3778 ns
Modified Cromoenos 0.92 24.57 0.5895 0.7678 *
a*
Glories (pH 3.2) 1.54 18.45 0.8283 0.9101 ***
ITV 1.11 -14.15 0.8145 0.9025 ***
Modified Cromoenos 1.14 -6.38 0.9015 0.9495 ***
b *
Glories (pH 3.2) -1.36 -0.17 0.1625 0.4031 ns
ITV 0.14 2.44 0.0604 0.2458 ns
Modified Cromoenos 0.96 -14.82 0.6456 0.8035 **
All data represent the statistical comparison of 36 wines and their corresponding phenolic maturity extracts. ns: nonsignificant.
p < 0.05.p < 0.01.p < 0.005.
*
**
***
Other studies have tried to correlate grape phenolics with the final wine composition [23,24] but
none of them have directly compared the grape extract color with the wine color. Finally,
González-Neves et al. (2002) [29] have directly compared the color and the concentration of
anthocyanin and other phenolic compounds of wines with the parameters obtained by the
Glories method. In this experiment, authors obtained good statistical correlations when they
compare the total polyphenols in wine with the anthocyanin extracted at pH 3.2 and between the
color intensity and the anthocyanin extracted at pH 1.0. Other parameters presented significant
correlation coefficient but not at the same level.
Figure 3 shows the linear regression analysis between the anthocyanins concentration, measured
by spectrophotometry, of the different wines and their corresponding predicted values obtained
by applying the different phenolic maturity methods. Glories method originated reasonably good
linear regression coefficients at both pH. Specifically, r2 was 0.7897 at pH 1.0 and 0.8809 at pH
3.2. According to Glories method, the anthocyanin concentration obtained at pH 1.0 represent
UNIVERSITAT ROVIRA I VIRGILI GRAPE PHENOLIC MATURITY; DETERMINATION METHODS AND CONSEQUENCES ON WINE PHENOLIC COMPOSITION Nikolaos Kontoudakis ISBN:978-84-693-7682-9/DL:T-1754-2010

nn
Results (i)
74
all the anthocyanins present in the skins whereas anthocyanin concentration obtained at pH 3.2
represent all the anthocyanin extractable in a standard winemaking. These results are in
agreement with this postulate since the slope at pH 3.2 is close to 1 (0.96) suggesting that
extraction at this pH was very similar to that obtained in the wine. Moreover, the slope at pH 1.0
is close to 0.5 (0.52), suggesting that during winemaking were extracted about 50% of all
anthocyanins present.
Glories (pH 1.0)
y = 0.52 x + 59.60 ; r2 = 0.78970
200
400
600
800
1000
1200
0 400 800 1200 1600 2000 2400Win
e A
ntoc
yani
n(m
g L
-1)
Antocyanin prediction (mg L-1 )
ITV
y = 0.64 x + 45.20 ; r2 = 0.82590
200
400
600
800
1000
1200
0 400 800 1200 1600 2000 2400Win
e A
ntoc
yani
n (m
g L
-1)
Antocyanin prediction (mg L-1 )
0
200
400
600
800
1000
1200
0 400 800 1200 1600 2000 2400
y = 0.96 x -45.92 ; r2 = 0.8809
Glories (pH 3.2)
Antocyanin prediction (mg L-1 )
0
200
400
600
800
1000
1200
0 400 800 1200 1600 2000 2400
Cromoenos
y = 0.44 x + 55.40 ; r2 = 0.8170
Antocyanin prediction (mg L-1 )
Win
e A
ntoc
yani
n (m
g L
-1)
Win
e A
ntoc
yani
n (m
g L
-1)
Fig. 3. Linear regression analysis between the obtained and the predicted anthocyanin concentration.
The other two methods, ITV and Cromoenos, also provided reasonably linear regression
coefficients for anthocyanin concentration (r2 = 0.8259 and r2 = 0.8170 respectively). However,
the obtained slopes are in both cases quite lower than 1.0 (0.64 and 0.44) indicating that both
methods overextracted anthocyanins in relation to what happens during winemaking.
Other authors have tried to correlate the spectrophotometric anthocyanin concentration of the
extracts and the final wine anthocyanin concentration. González-Neves et al. (2004) [23] and
Romero-Cascales et al. (2005) [24], using the Glories method have obtained linear regression
coefficients of 0.7225 and 0.8742 respectively, whereas Jensen et al. (2008) [21], using other
methodology [15] obtained better results (0.9025). Our results are comparable and confirm that
the three methods predict reasonably the future wine anthocyanin concentration.
UNIVERSITAT ROVIRA I VIRGILI GRAPE PHENOLIC MATURITY; DETERMINATION METHODS AND CONSEQUENCES ON WINE PHENOLIC COMPOSITION Nikolaos Kontoudakis ISBN:978-84-693-7682-9/DL:T-1754-2010

nn
Results (i)
75
Figure 4 shows the linear regression analysis between the total phenolic index (TPI) of the
different wines and their corresponding predicted values obtained by applying the different
phenolic maturity methods. For this parameter, the three methods provided reasonably good
linear regression coefficients (between 0.8028 and 0.8839) and comparables to those previously
described in the bibliography [21,23,24]. However, the slopes were in all the cases lower than
1.0 suggesting that all three methods produce an overextraction of phenolic compounds.
Specifically, Glories method presented a slope of 0.75 which indicates an overextraction of
around 33 %, which can be considered not very high. However, ITV and Cromoenos presented
slopes considerably lower, 0.36 and 0.19, thus implying very high overextraction (around three
and five folds more than in wine). This overextraction is probably because the conditions of
extraction of all methods are very drastic and involve the complete crushing of seeds.
Win
e TP
I
TPI prediction
Glories (pH 3.2)
y = 0.75 x + 11.31 ; r2 = 0.88390
10
20
30
40
50
60
70
40 80 120 160 200 2400
ITV
0
10
20
30
40
50
60
70
0 40 80 120 160 200 240
y = 0.36 x + 16.61 ; r2 = 0.8028
Win
e TP
I
TPI prediction
y = 0.19 x + 14.93 ; r2 = 0.8180
Cromoenos
0
10
20
30
40
50
60
70
0 40 80 120 160 200 240
TPI prediction
Win
e TP
I
Fig. 4. Linear regression analysis between the obtained and the predicted TPI.
Table 3 summarizes the predictive capabilities for anthocyanins, measured by
spectrophotometry, and TPI of the different phenolic maturity methods. This table also include
the statistical comparison between the anthocyanin analysis by HPLC of the wines and the
extracts obtained by the different methods. The three methods provide reasonably linear
regression and Fisher’s correlation coefficients in anthocyanins (by spectrophotometry) and TPI,
existing in all the cases a statistical significant correlation (p < 0.001). When the statistical
UNIVERSITAT ROVIRA I VIRGILI GRAPE PHENOLIC MATURITY; DETERMINATION METHODS AND CONSEQUENCES ON WINE PHENOLIC COMPOSITION Nikolaos Kontoudakis ISBN:978-84-693-7682-9/DL:T-1754-2010

nn
Results (i)
76
analysis was applied to the total anthocyanins measured by HPLC the linear regression and
Fisher’s correlation coefficients of all the methods decreased considerably although the
existence of a statistical significance in the correlation was maintained in all the cases. It is
necessary to remark that the slopes were in the three methods quite lower than 1.0 confirming
that an overextraction of anthocyanins has taken place especially in the ITV and Cromoenos
methods. These results are in agreement to the few data previously described [21,23,24] and can
be considered as quite satisfactory.
Table 3. Comparison between the predictive capabilities for phenolic compounds of the different methods.
Predicted parameter Method Slope (m) Y Intercept (b) r2 Fisher's correla tioncoefficient
Significance
Total anthocyanins by spectrophotometry
Glories (pH 3.2) 0.96 - 46 0.8809 0.9386 ***
ITV 0.74 45 0.8259 0.9088 ***
Cromoenos 0.44 55 0.8170 0.9039 ***
Total anthocyanins by HPLC
Glories (pH 3.2) 0.48 101 0.4884 0.6988 *
ITV 0.21 137 0.4515 0.6719 *
Cromoenos 0.19 117 0.5680 0.7536 **
Total anthocyanins monoglucosides
Glories (pH 3.2) 0.31 122 0.4172 0.6459 *
ITV 0.16 128 0.4808 0.6934 *
Cromoenos 0.17 100 0.6152 0.7843 **
Total acyla ted anthocyanins
Glories (pH 3.2) 0.97 1.0 0.9017 0.9499 ***
ITV 0.49 -19.1 0.8864 0.9441 ***
Cromoenos 0.33 11.4 0.8908 0.9438 ***
Total acetilated anthocyanins
Glories (pH 3.2) 0.88 3.4 0.9531 0.9763 ***
ITV 0.47 0.7 0.9698 0.9848 ***
Cromoenos 0.36 5.1 0.9180 0.9581 ***
Total coumarylated anthocyanins
Glories (pH 3.2) 0.47 18.4 0.2989 0.5468 ns
ITV 0.11 22.1 0.2814 0.5302 ns
Cromoenos 0.12 17.5 0.4143 0.6431 *
TPI
Glories (pH 3.2) 0.75 11.3 0.8839 0.9402 ***
ITV 0.36 16.6 0.8028 0.8961 ***
Cromoenos 0.19 14.9 0.8180 0.9044 ***
All data represent the sta tistica l comparison of 36 wines and their corresponding phenolic maturity extracts. ns: non significant.p < 0.05.p < 0.01.p < 0.005.
*
**
***
When this statistical analysis was applied to the monoglucosides, the acetylated and the
coumarylated anthocyanins, the results varied in function of the anthocyanins group.
Specifically, the monoglucosides presented a very similar behaviour than total anthocyanins as it
was expected due to the great proportion of this anthocyanins type. However, acetylated and
coumarylated anthocyanins behaves in a different manner. The three methods provide very good
linear regression and Fisher’s correlation coefficients in acetylated anthocyanins. However, in
the case of coumarylated anthocyanins the results were quite worst, being only significant in the
case of Cromoenos method (Table 3).
UNIVERSITAT ROVIRA I VIRGILI GRAPE PHENOLIC MATURITY; DETERMINATION METHODS AND CONSEQUENCES ON WINE PHENOLIC COMPOSITION Nikolaos Kontoudakis ISBN:978-84-693-7682-9/DL:T-1754-2010
nn
Results (i)
77
3. Conclusions
It can be concluded that the three studied methods for measuring phenolic maturity can be used
for predicting some of the characteristics of the future wines. Specifically, the three methods
provide very good linear regression and correlation coefficients for anthocyanins by
spectrophotometry and TPI. However, only Glories and Cromoenos offer good results for color
parameters. Moreover, in the case of Cromoenos, a simple modification allows to considerably
enhance its performances. Nevertheless, all three methods provide somewhat worse results when
were applied to compare the anthocyanins measured by HPLC.
Another consideration to bear in mind are the cost and the easiness of the manipulation process
of the three methods. Glories and ITV method do not use any specific equipment or specific
reactive. However, both methods are slow, laborious and require the participation of well-
trained technicians which represents a not negligible cost for the winery. On the other hand,
Cromoenos needs specific equipment and reactives, which represent a cost of around 7.5 €
sample-1. Nevertheless, this method enables results easily in just 10 minutes thereby reducing
the cost of labor necessary. Consequently, Cromoenos method presents the best balance between
its predictive ability and its simplicity of use, making it a very good analytical procedure for
wineries.
Acknowledgments
We thank CICYT (AGL2007-66338) and CDTI (Project CENIT Demeter) for financial support.
References
[1] P. Ribereau-Gayon, Y. Glories, A. Maujean, D. Dubourdieu, Handbook of Enology, vol.
2. John Wiley & sons, Ltd, Chichester, 1999
[2] F. Zamora, Enólogos. 18 (2002) 24.
UNIVERSITAT ROVIRA I VIRGILI GRAPE PHENOLIC MATURITY; DETERMINATION METHODS AND CONSEQUENCES ON WINE PHENOLIC COMPOSITION Nikolaos Kontoudakis ISBN:978-84-693-7682-9/DL:T-1754-2010

nn
Results (i)
78
[3] R. Canals, M.C. Llaudy, J.M. Valls, J.M. Canals, F. Zamora, J. Agric. Food Chem. 53
(2005) 4019.
[4] P. Lanaridis, I. Bena-Tzourou, J. Int. Sci. Vigne Vin. 31 (1997) 205.
[5] J.A. Fernández-López, V. Hidalgo, L. Almela, J.M. López Roca, J. Sci. Food Agric. 58
(1992) 153.
[6] M.C. Llaudy, R. Canals, J.M. Canals, F. Zamora, Eur. Food Res. Technol. 226 (2008) 337.
[7] Y. Glories, M. Agustin, Proceedings Colloque Journée Technique du CIVB, Bordeaux,
1993, p. 56.
[8] S. Vidal, L. Francis, S. Guyot, N. Marnet, M. Kwiatkowski, R. Gawel, V. Cheynier, E.J.
Waters, J. Sci. Food Agric. 83 (2003) 564.
[9] M.C. Llaudy, R. Canals, J.M. Canals, N. Rozes, L. Arola, F. Zamora, J. Agric. Food
Chem. 52 (2004) 742.
[10] S.R. Segade, L. Rolle, V. Gerbi, I. Orriols, J. Food Compos. Anal. 21 (2008) 644.
[11] E. Celotti, T. Della Vedova, R. Ferrarini, S. Martinand, Ital. J. Food Sci. 19 (2007) 91.
[12] D.W. Lamb, M.M. Weedon, R.G.V. Bramley, Aust. J. Grape Wine Res. 10 (2004) 46.
[13] Dupuch, V. Proceedings Colloque Journée Technique du CIVB, Bordeaux, 1993, p. 62.
[14] M. González-SanJosé, C. Diez, G. Santa María, J.L. Garrido, An. Quím. 84 (1988) 290.
[15] P. Iland, N. Bruer, G. Edwards, S. Weeks, E. Wikes, Chemical Analysis of Grape and
Wine: Techniques and Concepts. P. Illand Wine Promotion, Campeltown, 2004
[16] F. Lamadon, Rev. Œnolog. Techniq. Vitvinic. Œnol. 76 (1995) 37.
[17] C. Venencie, M.N. Uveira, S. Guiet, Rev. Fran. Œnol. 167 (1997) 36.
[18] N. Saint-Cricq, N. Vivas, Y. Glories. Prog. Agric. Viticol. 115 (1998) 13.
[19] L. Cayla, P. Cottereau, R. Renard, Rev. Fran. Œnol. 193 (2002) 10.
[20] Cromoenos. http://bioenos.com/cromoenos/index.php
[21] J.S. Jensen, S. Demiray, M. Egebo, A.S. Meyer. J. Agric. Food Chem. 56 (2008) 1105.
[22] P. Iland, The Aust. Grapegrower and Winemaker. 285 (1987) 29.
UNIVERSITAT ROVIRA I VIRGILI GRAPE PHENOLIC MATURITY; DETERMINATION METHODS AND CONSEQUENCES ON WINE PHENOLIC COMPOSITION Nikolaos Kontoudakis ISBN:978-84-693-7682-9/DL:T-1754-2010
nn
Results (i)
79
[23] G. González-Neves, D. Charamelo, J. Balado, L. Barreiro, R. Bochicchio, G. Gatto, G.
Gil, A. Tessore, A. Carbonneau, M. Moutounet, Anal. Chim. Acta. 513 (1) (2004) 191.
[24] I. Romero-Cascales, A. Ortega-Regules, J.M. Lopez-Roca, J.I. Fernandez-Fernandez, E.
Gomez-Plaza, Am. J. Enol. Vitic. 56 (2005) 212.
[25] O.I.V. Le recueil des méthodes internationales d’analyse des vins et des moûts, vols I, II,
Sect 3. O.I.V, Paris, 2005.
[26] Y. Glories, Connais Vigne Vin 18 (1984) 195.
[27] F. Ayala, J.F. Echávarri, A.I. Negueruela, Am. J. Enol. Vitic. 48 (1997) 357.
[28] G.K. Niketic-Aleksic, G.Hrazdrina, Lebensmittel-Wissenschaft Technol. 5 (5) (1972) 163.
[29] G. González-Neves, G. Gil, M. Ferrer, Food Sci. Technol. Int. 8 (2002) 315.
UNIVERSITAT ROVIRA I VIRGILI GRAPE PHENOLIC MATURITY; DETERMINATION METHODS AND CONSEQUENCES ON WINE PHENOLIC COMPOSITION Nikolaos Kontoudakis ISBN:978-84-693-7682-9/DL:T-1754-2010

UNIVERSITAT ROVIRA I VIRGILI GRAPE PHENOLIC MATURITY; DETERMINATION METHODS AND CONSEQUENCES ON WINE PHENOLIC COMPOSITION Nikolaos Kontoudakis ISBN:978-84-693-7682-9/DL:T-1754-2010

nn
ii. Influence of the heterogeneity of grape phenolic maturity on wine
composition and quality
Nikolaos Kontoudakisa, Mireia Esteruelasa, Francesca Forta, Joan Miquel Canalsa,
Victor de Freitasb, Fernando Zamoraa
aDepartament de Bioquímica i Biotecnologia, Facultat d’Enologia de Tarragona, Universitat
Rovira i Virgili, Campus de Sescelades, C/ Marcel.li Domingo, s/n. 43007-Tarragona, Spain.
bCentro de Investigaçao em Química, Departamento de Química, Faculdade de Ciências,
Universidade do Porto, Rua do Campo Alegre 687, 4169-007 Porto, Portugal.
Submited to Food Chemistry (FOODCHEM-D-09-03796).
UNIVERSITAT ROVIRA I VIRGILI GRAPE PHENOLIC MATURITY; DETERMINATION METHODS AND CONSEQUENCES ON WINE PHENOLIC COMPOSITION Nikolaos Kontoudakis ISBN:978-84-693-7682-9/DL:T-1754-2010

nn
UNIVERSITAT ROVIRA I VIRGILI GRAPE PHENOLIC MATURITY; DETERMINATION METHODS AND CONSEQUENCES ON WINE PHENOLIC COMPOSITION Nikolaos Kontoudakis ISBN:978-84-693-7682-9/DL:T-1754-2010
nn
Results (ii)
83
Abstract
Nowadays, consumers demand red wines with deep color, soft tannins and fruit scents, but these
wines can only be obtained from grapes with complete phenolic maturity. Diverse methods have
been proposed for measuring phenolic maturity. However, all these methods only provide the
average value and do not consider any possible heterogeneity. Throughout ripening, grapes were
separated according to their density, which revealed the existence of a large heterogeneity.
Grapes at harvest were also separated by density in three groups. The higher the density of the
grapes the higher ethanol content, pH, color intensity, total phenolic index and anthocyanin and
proanthocyanidin concentrations, and the lower the titratable acidity and bitterness of the wines.
When the grapes were denser the wines were also better balanced in flavor and mouthfeel
sensation. These results suggest that grape heterogeneity may influence the final wine
composition and quality and therefore it should be consider at harvest.
Keywords: Phenolic maturity, Heterogeneity, Red wine color, Phenolic compounds,
Anthocyanin
UNIVERSITAT ROVIRA I VIRGILI GRAPE PHENOLIC MATURITY; DETERMINATION METHODS AND CONSEQUENCES ON WINE PHENOLIC COMPOSITION Nikolaos Kontoudakis ISBN:978-84-693-7682-9/DL:T-1754-2010

nn
Results (ii)
84
1. Introduction
One of the major factors affecting red wine quality is the real degree of phenolic maturity in the
grapes at harvest time (Ribereau-Gayon, Glories, Maujean & Dubourdieu, 2006). Most of
wine’s sensory attributes such as color, body, and tactile and taste sensations like as, astringency
and bitterness, are directly associated with the composition of anthocyanins and
proanthocyanidins (Arnold & Noble, 1978; Gawel, 1998; Noble, 1990; Vidal et al., 2003) and
this composition is strongly affected by ripeness (Canals et al., 2005; Llaudy, Canals, Canals, &
Zamora, 2008).
Anthocyanins are only present in grape skins whereas proanthocyanidins are present in skins
and seeds (Ribereau-Gayon et al., 2006). Seed proanthocyanidins are made up of (+)-catechin,
(–)-epicatechin and (–)-epicatechin-3-gallate (Kennedy, Matthewa, & Waterhouse, 2002; Prieur,
Rigaud, Cheynier, & Moutounet, 1994), whereas skin proanthocyanidins have a much lower
proportion of (–)-epicatechin-3-gallate and also contain (–)-epigallocatechin (Gonzalez-
Manzano, Rivas-Gonzalo, & Santos-Buelga, 2004; Souquet, Cheynier, Brossaud, & Moutounet,
1996).
Molecular sizes and the monomeric composition of proanthocyanidins in particular have a large
influence on the sensation of astringency. More specifically, the greater degree of
polymerization and the greater percentage of galloylation, will cause a greater sensation of
astringency (Herderich & Smith, 2005; Vidal et al., 2003; Vivas & Glories, 1996).
It is generally considered that ripeness strongly influences the phenolic composition of red
wines (O´-Marques, Reguinga, Laureano, & Ricardo-da-Silva, 2005; Ryan & Revilla, 2003). It
has been reported, for example, that insufficiently ripened grapes have a lower extractability of
anthocyanins and proanthocyanidins from skins and a higher extractability of proanthocyanidins
from seeds (Canals et al., 2005; Peyrot des Gachons & Kennedy, 2003). For this reason, it is
generally thought that insufficiently ripened grapes may produce more astringent and bitter
wines because their seeds can release a higher amount of proanthocyanidins, which are highly
galloylated (Romeyer, Macheix, & Sapis, 1986).
Consequently, for the last two decades winemakers have been very interested in the concept of
“Phenolic Maturity”. The reason for this is very simple. Consumers demand wines with deep red
UNIVERSITAT ROVIRA I VIRGILI GRAPE PHENOLIC MATURITY; DETERMINATION METHODS AND CONSEQUENCES ON WINE PHENOLIC COMPOSITION Nikolaos Kontoudakis ISBN:978-84-693-7682-9/DL:T-1754-2010

nn
Results (ii)
85
color, full body, soft tannins and fruit scents, and this kind of wine can only be obtained from
grapes that have reached complete phenolic maturity. If this is not the case, wines may present
bitter and astringent sensations and a poor color.
This interest has led to several investigations to try and find effective methodologies for
determining the real level of phenolic ripeness in grapes and thus provide a better criterion for
deciding the optimum time of harvest. In fact, various methods for measuring phenolic maturity
have been proposed (Celotti, Della Vedova, Ferrarini, & Martinand, 2007; Dupuch, 1993;
Glories, & Agustin, 1993).
Some of these methods can predict reasonably well the phenolic maturity and especially the
color intensity of a wine (Kontoudakis et al., 2010). However, all these methods only provide
the average value of a representative sample from the whole grape vineyard and do not consider
any possible heterogeneity in their degree of maturity.
In a vineyard, grapes do not ripen homogeneously. Each cluster and even each berry matures at
different rates through the influence of multiple factors. The location of vines in the vineyard
(exposure, altitude, soil composition, temperature, humidity, vine density, etc.), the position of
the cluster on the vine and even the position of the berries in the cluster can produce some
differences in the ripening rate (Haselgrove et al., 2000; Smart, Robinson, Due, & Brien, 1985).
Furthermore, an uneven grape ripeness can affect the quality of the final product. The presence
of a non-negligible percentage proportion of unripe berries can considerably increase the
appearance of bitter and astringent characters in wine.
Several studies are focused on the influence of grapes harvested at different stages of maturity
on wine phenolic composition and quality (Canals et al., 2005; Gambuti, Strollo, Lecce, &
Moio, 2007; Llaudy et al., 2008; Pérez-Magariño, & González-San José, 2006). However, to our
knowledge, none of them study the extent and the impact of grape heterogeneity. Since this
aspect has not been investigated in detail to date, the aim of this study was to determine the real
influence of the heterogeneity in the degree of grape ripeness on wine composition and quality.
2. Materials and methods
2.1. Chemicals
UNIVERSITAT ROVIRA I VIRGILI GRAPE PHENOLIC MATURITY; DETERMINATION METHODS AND CONSEQUENCES ON WINE PHENOLIC COMPOSITION Nikolaos Kontoudakis ISBN:978-84-693-7682-9/DL:T-1754-2010

nn
Results (ii)
86
Methanol, acetonitrile, formic acid and acetic acid were HPLC-grade and were purchased from
Panreac (Barcelona, Spain). Malvidin-3-O-glucoside chloride, (+)-catechin, (-)-epicatechin, (-)-
epigallocatechin and (-)-epicatechin-3-O-gallate were purchased from Extrasynthès (Genay,
France). TSK Toyopearl gel HW-40(S) was purchased from Tosoh (Japan). Ovoalbumin,
phloroglucinol and L-ascorbic were purchased from Sigma (Madrid, Spain). The rest of the
chemicals were of high purity and were purchased from Panreac (Barcelona, Spain).
2.2. Grapes
This study was carried out with grapes of the cultivar Vitis vinifera cv. Cabernet sauvignon from
the experimental vineyard at Constantí (AOC Tarragona) which belongs to the Enology Faculty
in Tarragona of the Rovira i Virgili University. The grapes were collected in 2007 and 2008 and
were only taken from the two central rows of the plot.
2.3. Maturity controls
Six hundred grapes were randomly collected at one, three, five and seven weeks after veraison.
One hundred berries were used for measuring the sugar content, titratable acidity, pH and
weight. Solutions of NaCl of 100 to190 g/l were prepared and to analyze ripening heterogeneity
according to the methodology previously described (Fournand et al., 2006). These solutions had
densities comprised between 1020 and 1120 mg/ml. One hundred berries were introduced to the
less dense solution (1020 mg/ml). The floating berries were considered that have the same
density than the solution. There were separated from sank berries and were counted. After that,
sank berries were removed and introduced to the following denser solution (1031.1 mg/ml). The
same process was repeated with all NaCl solutions. All these measurements were done in
triplicate.
2.4. Winemaking procedure
Seven weeks after veraison, 70 kg of grapes were harvested and manually destemmed. Grapes
were separated into three groups by flotation in two solutions of sucrose of different
concentrations. Sucrose solutions of 232 g/l and 244 g/l were used for the 2007 vintage and of
244 g/L and 256 g/l for the 2008 vintage. These solutions presented the following densities at
UNIVERSITAT ROVIRA I VIRGILI GRAPE PHENOLIC MATURITY; DETERMINATION METHODS AND CONSEQUENCES ON WINE PHENOLIC COMPOSITION Nikolaos Kontoudakis ISBN:978-84-693-7682-9/DL:T-1754-2010

nn
Results (ii)
87
20ºC: 1090 mg/l and 1095 mg/l for the 2007 vintage and 1095 mg/l and 1100 mg/l for the 2008
vintage. These solutions were chosen each year to adapt it to the maturity conditions of the
vintage.
Table 1. Evolution of standard parameters of grapes throughout ripening.
Parameters VintageWeeks after veraison
1 3 5 7
S (g/L)2007 154.3 ± 3.9a 185.1 ± 0.1b 207.6 ± 1.9c 222.2 ± 1.3d
2008 176.7 ± 1.7a 190.8 ± 2.3b 197.8 ± 5.6b 206.5 ± 1.0c
PAD (% v/v)2007 9.17 ± 0.23a 11.0 ± 0.3b 12.3 ± 0.2c 13.2 ± 1.9d
2008 10.50 ± 0.10a 10.9 ± 0.1b 11.6 ± 0.2c 12.3 ± 0.1d
TA (g/l)2007 13.34 ± 0.10a 8.95 ± 0.23b 6.90 ± 0.40c 5.65 ± 0.09d
2008 14.10 ± 0.09a 9.45 ± 0.05b 7.03 ± 0.49c 6.55 ± 0.35c
pH2007 2.82 ± 0.01a 3.07 ± 0.02b 3.14 ± 0.02c 3.28 ± 0.01d
2008 2.90 ± 0.02a 3.05 ± 0.02b 3.16 ± 0.02c 3.21 ± 0.01c
W (g)2007 109.1 ± 1.a 120.4 ± 0.7b 137.6 ± 3.5b 153.6 ± 5.1c
2008 115.1 ± 3.8a 117.6 ± 3.5ab 124.2 ± 5.8b 127.1 ± 0.5c
All data are expressed as the arithmetic average of three replicates ± standard deviation (n=3). S: sugar concentration,PAD: prabable alcoholic degree, TA: tit ra table acidity, W: weight of 100 berries. Statistical analysis: one-factorANOVA and Scheffe’ s test (both p=0.05). Different letters indicates the existence of statistically significantdifferences between values of the same vintage.
After that, the berries of each lot were randomly distributed into three groups of four kilograms,
crushed with a semi-automatic crusher machine (Gual, Villafranca del Penedès, Spain),
sulphited (100 mg of K2S2O5/l) and introduced in six liter tanks. All tanks were immediately
inoculated with 200 mg/l of selected yeast (DV10, Martin Vialatte, Epernay, France) and
maintained at a room temperature of 25 ± 1 ºC. All these microvinifications were controlled
daily by measuring the temperature and the density of the must. Each day a punch down was
carried out to encourage the extraction of phenolic compounds. After 14 days of maceration, the
wines were racked, sulphited (100 mg of K2S2O5/l) and refrigerated for three weeks at 4 ºC.
After that, wines were decanted and bottled. All the samples were stored at 15 ± 1 ºC until the
moment of the analysis.
UNIVERSITAT ROVIRA I VIRGILI GRAPE PHENOLIC MATURITY; DETERMINATION METHODS AND CONSEQUENCES ON WINE PHENOLIC COMPOSITION Nikolaos Kontoudakis ISBN:978-84-693-7682-9/DL:T-1754-2010

nn
Results (ii)
88
2.5. Standard grape and wine analysis
The analytical methods recommended by the OIV (O.I.V., 2005) were used to determine sugar
content, probable alcoholic degree, titratable acidity and the pH of the grapes and the ethanol
content, titratable acidity and pH of the wines.
2.6. Color parameters
The color intensity (CI) was estimated using the method described by Glories (1984). The
CIELAB coordinates, lightness (L*), chroma (C*), hue (h*), red-greenness (a*) and yellow-
blueness (b*) were determined according to Ayala, Echávarri and Negueruela (1997) and the
data were processed with the MSCV® software (Ayala et al., 2001). The total colour difference
(∆Eab*) between two samples was obtained using the expression: ∆Eab* = [(∆L*)2 + (∆a*)2 +
(∆b*)2]1/2 (Pérez-Magariño & González-Sanjose, 2003). All absorbance measurements were
taken with a Helios Alpha (Thermo Fisher Scientific Inc.,Waltman, MA) UV–vis
spectrophotometer using quartz cells of 1 mm path length.
2.7. Anthocyanin Analysis
The total anthocyanin content was determined by spectrophotometry using the method described
by Niketic-Alksic and Hrazdina (1972). Free and combined anthocyanins were calculated using
the PVPP index (Glories, 1984). Reversed-phase HPLC analyses of anthocyanins and the
anthocyanin-derived pigments Vitisin A and Vitisin B were carried out with an Agilent 1200
series liquid chromathograph (HPLC-DAD) and an Agilent Zorbax Eclipse XDB-C18, 4.6 x
250mm 5µm column (Agilent Technologies, Santa Clara, USA) in accordance with the method
described by González-San José, Diez, Santa María, & Garrido. (1988). Anthocyanins and
anthocyanin-derived compounds were quantified at 520 nm as malvidin-3-glucoside, using
malvidin-3-glucoside chloride as an external standard.
2.8. Analysis of Flavanols
UNIVERSITAT ROVIRA I VIRGILI GRAPE PHENOLIC MATURITY; DETERMINATION METHODS AND CONSEQUENCES ON WINE PHENOLIC COMPOSITION Nikolaos Kontoudakis ISBN:978-84-693-7682-9/DL:T-1754-2010
nn
Results (ii)
89
2.8.1. HPLC and HPLC-ESI-MS analysis of Catechins and Oligomeric Proanthocyanidins
20 ml of wine was extracted thrice with 20 ml of ethyl acetate to analyze the catechins and
oligomeric proanthocyanidins. The wine extract was evaporated under vacuum (Buchi
rotavoporate, Flawil, Switzerland) and then redissolved with methanol. This wine extract was
fractionated through a TSK Toyopearl HW-40(s) gel column (250mm x 16mm) using purified
methanol as described previously (De Freitas, & Glories, 1999). Flow rate was regulated at 0.8
ml/min using a peristaltic pump (Gilson, Middleton, USA). This gave us three fractions of 120
ml each one. The first fraction contained procyanidin monomers, (+)-catechin and (-)-
epicatechin, the second fraction contained procyanidin dimers and trimers and the third fraction
contained procyanidin trimers and tetramers (De Freitas, Glories, Bourgeios, & Vitry, 1998). All
fractions were evaporated and redissolved on 1 ml synthetic solution (12% ethanol, 4 g/l tartaric
acid and pH 3.2).
Quantitative analysis was carried out by reverse-phase HPLC (Merck-Hitachi L6200,
Darmstadt, Germany) using two Beckman Ultrasphere C18 ODS columns (250 × 4.6 mm, 5µm)
(Beckman Coulter, Fullerton, USA) connected in series and protected with a guard column
packed with the same packing. The chromatograms were monitored at 280nm using a UV
detector and in accordance with the method of De Freitas and Glories (1999). The procyanidin
monomers and dimers were identified by comparing its retention time with that of the pure
compound and by ESI-MS analysis. Trimers and tetramers were identified by ESI-MS analysis.
Mass spectrometry analyses were performed using a Finnigan Surveyor series liquid
chromatography equipped with a Thermo Finnigan (Hypersil Gold) reversed-phase column (150
mm × 4.6 mm, 5 µm, C18) thermostated at 25 °C. The samples were analyzed using the same
solvents, gradients, injection volume, and flow rate for HPLC analysis. Double-online detection
was done by a photodiode spectrophotometer and mass spectrometry. The mass detector was a
Finnigan LCQ DECA XP MAX quadrupole ion trap (Finnigan Corp., San Jose, CA) equipped
with an atmospheric pressure ionization (API) source and using an electrospray ionization (ESI)
interface. The vaporizer and the capillary voltages were 5 kV and 4 V, respectively. The
capillary temperature was set at 325 °C. Nitrogen was used as both sheath and auxiliary gas at
flow rates of 90 and 25, respectively (in arbitrary units). Spectra were recorded in positive ion
mode between m/z 250 and 1500.
UNIVERSITAT ROVIRA I VIRGILI GRAPE PHENOLIC MATURITY; DETERMINATION METHODS AND CONSEQUENCES ON WINE PHENOLIC COMPOSITION Nikolaos Kontoudakis ISBN:978-84-693-7682-9/DL:T-1754-2010

nn
Results (ii)
90
2.8.2. Analysis of Proanthocyanidins following acid catalysis with phloroglucinol
Acid-catalysis cleavage in the presence of excess phloroglucinol (Kennedy & Jones, 2001) was
used to analyze monomeric proanthocyanidin composition and its mean degree of
polymerization (mDP). 10ml of wine was evaporated under a low pressure vacuum (Univapo
100 ECH, Uni Equip, Martinsried, Germany). After that it was resuspended in 6 ml distilled
water and then applied to Set Pak Plus tC18 Environmental cartridges (Waters, Milford, USA)
that had been previously activated with 10 ml methanol and 15 ml water. The sample was
washed with 15 ml distilled water and then the proanthocyanidins were eluted with 12 ml
methanol, immediately evaporated under vacuum and later eluted in 2ml methanol. Finally, 100
µl of this sample were reacted with 100 µl phloroglucinol solution (0.2N HCl in methanol,
containing 100g/l phloroglucinol and 20 g/l ascorbic acid) at 50 ºC for 20 min. The reaction was
stopped by adding 1000 µL of 40 mM aqueous sodium acetate (Kennedy & Jones, 2001).
Reversed-phase HPLC analysis (Agilent serie 1200 HPLC-DAD) was carried out according to
the method of Kennedy and Jones (2001). The monomers (+)-catechin, (-)-epicatechin, (-)-
epicaechin-3-O-gallate were identified by comparing its retention time with that of the pure
compounds. The phoroglucinol adducts of (+)-catechin, (-)-epicatechin, (-)-epigallocatechin and
(-)-epicatechin-3-O-gallate were identified by HPLC-TOF analysis. Analyses were performed
with Agilent 1200 series HPLC using an Agilent 6210 time of flight (TOF) mass spectrometer
equipped with an electrospray ionization (ESI) system. Elution was carried out under the same
HPLC analysis conditions as described by Kennedy and Jones (2001). The capillary voltage was
3.5 kV. Nitrogen was used as both dry gas at a flow rate of 12 l/min at 350 ºC and nebulizer gas
at 60 psi. Spectra were recorded in positive ion mode between m/z 50 and 2400. This assay was
also carried out without addition of phloroglucinol in order to measure the quantity of
proanthocyanidin monomers naturally present in the wines.
The number of terminal subunits were considered as the difference between total monomers
without phoroglucinol and thus obtained in the analysis performed without phloroglucinol
addition. The addition of all phloroglucinol adducts was consider as the extension subunits of
the proanthocyanidins. The mean degree of polymerization (mDP) was calculated by adding
terminal and extension subunits (in moles) and dividing by terminal subunits. The total
proanthocyanidin concentration was considered as the addition of all terminal and extension
subunits. Because acid catalysis with phloroglucinol is not completely efficient, the real yield of
UNIVERSITAT ROVIRA I VIRGILI GRAPE PHENOLIC MATURITY; DETERMINATION METHODS AND CONSEQUENCES ON WINE PHENOLIC COMPOSITION Nikolaos Kontoudakis ISBN:978-84-693-7682-9/DL:T-1754-2010

nn
Results (ii)
91
the reaction was measured using a pure B2 proanthocyanidin dimer [(-)-epicatechin-(4→8)-(-)-
epicatechin]. This yield was used to calculate the total proanthocyanidin concentration.
2.9. Other Phenolic Compounds
The total phenolic index (TPI) was determined by measuring the absorbance at 280 nm
(Ribereau-Gayon et al., 2006). Proanthocyanidin concentration was also estimated by
precipitation with methyl cellulose (Sarneckis et al., 2006).
2.10. Astringency Index
Astringency index was estimated using ovoalbumin as a precipitation agent and tannic acid
solutions as standards in accordance with in accordance with Llaudy et al.’s method (2004).
2.11. Sensory Analysis
All the wines were tasted by a group of 10 expert enologists from the Rovira i Virgili University
6 weeks after bottling. Dark glasses were used to prevent the influence of color intensity. Three
sensory triangle tests were conducted to compare the three wines in pairs. In all the cases, the
first objective was to recognize the different wines and after then indicate which was their
favorite and for what reason.
2.12. Statistics
All the physical and chemical data are expressed as the arithmetic average ± of the standard
deviation from three replicates. One-factor ANOVA and Scheffe`s test were carried out with
SPSS software. The level of significance of sensory triangle tests was determined following
Jackson’s method (2002).
3. Results and discussion
UNIVERSITAT ROVIRA I VIRGILI GRAPE PHENOLIC MATURITY; DETERMINATION METHODS AND CONSEQUENCES ON WINE PHENOLIC COMPOSITION Nikolaos Kontoudakis ISBN:978-84-693-7682-9/DL:T-1754-2010

nn
Results (ii)
92
Table 1 shows the evolution of standard parameters of grapes throughout ripening. In both
vintages the sugar content, the probable alcoholic degree, the pH and the weight of 100 berries
increased and the titratable acidity decreased during ripening as expected. According to these
parameters, vintage 2007 reached a greater level of technological maturity than vintage 2008
although both vintages can be considered normal. However, these parameters were measured
using an ensemble of 100 berries randomly collected; therefore, only the average value of each
parameter is reflected and the berries’ heterogeneity is not considered.
Figure 1. Distribution of grapes densities throughout ripening.
2007 1st week
3rd week
5th week7th week
0
10
20
30
40
50
60
Perce
ntage
(%)
0
10
20
30
40
50
1060 1070 1080 1090 1100 1110 1120 1130
Density (mg/L)
Perce
ntage
(%)
1st week
3rd week
5th week7th week
2008
To determine the real dispersion of these parameters, several assays were performed using
solutions of NaCl of increasing concentration. Separating the grapes that floated from those that
sank and counting them made it possible to determine the density distribution of berries
throughout the maturation process (Figure 1). A quick glance at the figure shows a Gaussian
bell-shaped distribution in both vintages and at all sampling points. These data confirm that a
non-negligible heterogeneity is present from the beginning of the maturation process until the
moment of harvest. Consequently, this heterogeneity implies that a considerable percentage of
unripe grapes are harvested and introduced into the vinification tanks. Since unripe grapes
provide a lower sugar content, higher acidity, fewer anthocyanins and in particular more seed
UNIVERSITAT ROVIRA I VIRGILI GRAPE PHENOLIC MATURITY; DETERMINATION METHODS AND CONSEQUENCES ON WINE PHENOLIC COMPOSITION Nikolaos Kontoudakis ISBN:978-84-693-7682-9/DL:T-1754-2010

nn
Results (ii)
93
tannins (Llaudy et al., 2008), their presence can increase bitterness and astringency and
therefore adversely affect the final quality of wine.
Table 2. Wine Parameters.
All data are expressed as the arithmetic average of three replicates ± standard deviation (n=3). TA: titratableacidity. Statistical analysis: one-factor ANOVA and Scheffe’ s test (both p=0.05). Different letters indicates theexistence of statistically significant differences between values of the same vintage.
Parameters Vintage Low density Medium density High density
Ethanol (% v/v)2007 12.2±0.1a 13.2±0.1b 14.2±0.1c
2008 11.0±0.1 a 12.7±0.2 b 13.7±0.2 c
TA (g of tartaric acid/L)2007 5.90±0.35a 5.85±0.30a 5.35±0.09b
2008 6.17±0.15a 6.00±0.10ab 5.93±0.06b
pH2007 3.56±0.02a 3.61±0.03b 3.66±0.03c
2008 3.18±0.01a 3.30±0.02b 3.35±0.01a
Table 2 shows the standard parameters of the wines. As was expected, the higher the density of
grapes the higher ethanol content and pH of wines. In contrast, the titratable acidity showed the
opposite tendency in both vintages. These data confirm that the existing heterogeneity in grape
densities also affects the wine composition, at least where the standard parameters are
concerned.
Table 3 shows the color parameters of the wines of both vintages. In general, the wines from the
2007 vintage that have a higher level of technological maturity indicators also presented higher
values of Color Intensity (CI) and Chroma (C *), and lower Luminosity (L*) values (more dark
color) than those of 2008.
An overall view of these data indicates that the density of the grapes significantly influences the
wine color. Specifically, the higher the density of grapes the higher the CI, C* and red-
greenness (a*). On the other hand, L* had the opposite tendency for both years. The other
CIELAB coordinates, hue (h*) and yellow-blueness (b*) did not show uniform behavior. On
one hand, h* tended to increase with the density of the grapes in the 2007 wines whereas it
tended to decrease in the 2008 wines. On the other hand, b * also tended to increase with the
density of the grapes in the 2007 wines whereas it was erratic in the 2008 wines.
UNIVERSITAT ROVIRA I VIRGILI GRAPE PHENOLIC MATURITY; DETERMINATION METHODS AND CONSEQUENCES ON WINE PHENOLIC COMPOSITION Nikolaos Kontoudakis ISBN:978-84-693-7682-9/DL:T-1754-2010

nn
Results (ii)
94
Table 3. Color Parameters.
Parameters Vintage Low density Medium density High density
CI2007 17.13±0.40a 19.62±1.01b 21.80±0.73c
2008 9.17±0.49a 12.05±1.13b 14.80±1.29c
C*2007 67.71±0.22a 68.88±0.21b 69.60±0.25c
2008 48.13±2.70a 54.43±2.13b 59.02±1.39c
L*2007 40.90±0.95a 38.53±1.14b 36.30±0.56c
2008 57.35±1.63a 48.83±3.05b 42.83±2.29c
h*2007 11.87±0.71a 15.22±1.96b 19.27±1.23c
2008 14.51±1.31a 9.38±1.32b 8.61±1.60b
a*2007 65.26±0.38a 66.44±0.46b 66.59±0.13b
2008 46.57±2.33a 53.69±2.30b 58.34±1.21c
b*2007 13.93±0.78a 18.08±2.32b 22.94±1.56c
2008 11.09±0.05a 8.84±0.89b 9.84±0.58c
All data are expressed as the arithmetic average of three replicates ± standard deviation (n=3). CI: colorintensity, C*: chroma, L*: luminosity, h*= hue, a*= red-grenness and b*= yellow-blueness. Statisticalanalysis: one-factor ANOVA and Scheffe’ s test (both p=0.05). Different letters indicates the existence ofstatistically significant differences between values of the same vintage.
Table 4 presents the total color differences (∆Eab*) among wines of the same vintage. The
human eye can generally distinguish two colors when ∆Eab* ≥ 1 (Pérez-Magariño & González-
Sanjose, 2003). However, it is also generally accepted that tasters can only distinguish the color
of two wines through the glass when ∆Eab* ≥ 5 units (Pérez-Magariño & González-Sanjose,
2003). In fact, the differences that can be distinguished by the human eye also depend on the
color intensity, because the discriminating capacity becomes less accurate when color
perception reaches the saturation level. In our experimental conditions, the three wines obtained
for both vintages all had ∆Eab* differences greater than 5 units. Therefore, the existing color
differences among the wines obtained from grapes of different densities are great enough to be
detected by the human eye even when the wines come from grapes of relatively close densities.
These data confirm that the existing heterogeneity in the maturity of the grapes has a real impact
on wine color because the presence of less dense grapes may affect the visual quality of wine.
UNIVERSITAT ROVIRA I VIRGILI GRAPE PHENOLIC MATURITY; DETERMINATION METHODS AND CONSEQUENCES ON WINE PHENOLIC COMPOSITION Nikolaos Kontoudakis ISBN:978-84-693-7682-9/DL:T-1754-2010

nn
Results (ii)
95
Table 4. Total color differences (∆eab*) amongwines.
All data are expressed as the average of three replicates ±standard deviation (n=3). Values in dark grey correspond to2007 vintage. Values en clear grey correspond to 2008vintage.
Low Medium High
Low - 4.9±1.7 10.1±1.1
Medium 10.1±1.2 - 5.5±0.9
High 17.5±0.5 7.76±1.2 -
Table 5 shows the anthocyanin concentration, measured by spectrophotometry, of the wines of
both vintages. Parallel to what was observed in the color, the total anthocyanin concentration of
wines from the 2007 vintage was also higher than that of 2008, reconfirming the greater
maturity of this vintage. In both years, the density of the grapes also played a key role in the
anthocyanin concentration of the wines. The higher the grape density, the higher the
anthocyanin concentration in the wine. This behavior was similar for free anthocyanins and also
for anthocyanins combined to flavanols. The higher anthocyanin concentration found in denser
grapes can mainly due to the higher concentration of anthocyanins in the skins and also maybe
to the higher ethanol concentration of these grapes which exerts a significant effect on
anthocyanin extraction during winemaking (Canals et al., 2005).
Table 5. Spectrophotometric Analysis of Antocyanins.
All data are expressed as the arithmetic average of three replicates ± standard deviation (n=3). Sta tistical analysis: one-factor ANOVA and Scheffe’ s test (both p=0.05). Different letters indicates the existence of sta tistica lly sign ificantdifferences between values of the same vintage.
Parameters Vintage Low density Medium density High density
Free anthocyanins (mg/L)2007 559±26a 801±10b 806±23b
2008 283±15a 474±58b 666±54c
Combined anthocyanins (mg/L) 2007 165±9a 221±21b 302±34c
2008 133±11a 177±3b 212±17c
Total anthocyanin (mg/L)2007 725±35a 1021±11b 1108±49c
2008 415±25a 651±61b 878±38c
UNIVERSITAT ROVIRA I VIRGILI GRAPE PHENOLIC MATURITY; DETERMINATION METHODS AND CONSEQUENCES ON WINE PHENOLIC COMPOSITION Nikolaos Kontoudakis ISBN:978-84-693-7682-9/DL:T-1754-2010

nn
Results (ii)
96
Anthocyanins were also analyzed by HPLC (Table 6) and the overall results were similar to
those obtained by spectrophotometry, although the values were significantly lower. This is
because spectrophotometric analysis overestimates the total anthocyanin concentration because
it also detects other pigments (Rivas-Gonzalo, Gutierrez, Hebrero, & Santos-Buelga, 1992),
whereas HPLC only detects free anthocyanins (Rivas-Gonzalo, 2003). Furthermore, conversion
of spectrophotometric data to anthocyanin concentration is necessarily imprecise, because many
different pigments showing different extinction coefficients contribute to the absorbance.
Table 6. HPLC Analysis of Anthocyanins and Anthocyanin-Derived Pigments.
All data are expressed as the arithmetic average of three replicates ± standard deviation (n=3). Sta tistical analysis: one-factor ANOVA and Scheffe’ s test (both p=0.05). Different letters indicates the existence of sta tistica lly sign ificantdifferences between values of the same vintage.
Parameters Vintage Low density Medium density High density
Anthocyanidin-3-monoglycosides (mg/L)2007 194.3±3.7a 229.4±15.1b 242.1±13.9b
2008 72.4±4.1a 173.2±34.9b 228.2±18.6c
Acetyla ted anthocyanins (mg/L)2007 61.7±1.3a 68.0±3.9b 70.2±4.1b
2008 27.5±0.9a 68.1±14.9b 91.5±6.1c
p-Coumaroylanthocyanins (mg/L)2007 12.0±3.8a 16.9±0.4b 20.7±0.7b
2008 4.2±0.1a 12.5±3.6b 19.0±1.7c
Total free anthocyanins (mg/L)2007 275.4±1.8a 313.4±19.5b 351.0±18.7b
2008 104.2±4.2a 253.8±53.4b 338.7±26.1c
Vitisin A (mg/L)2007 0.10±0.01a 0.15±0.01b 0.21±0.04c
2008 10.20±0.65a 11.53±0.56ab 13.97±1.56b
Vitisin B (mg/L)2007 3.17±1.50a 5.14±0.73ab 5.49±0.68b
2008 2.04±0.41a 3.28±0.37b 4.36±0.84b
The total anthocyanin concentration measured by HPLC was also higher in wines from 2007
than in those from 2008 when wines of same grape density were compared, confirming again
the greater maturity of this vintage. As with spectrophotometry, HPLC also showed that the
density of the grapes had a large influence on wine anthocyanin concentration. The higher the
density of the grapes, the higher the anthocyanin concentration of the wines. A similar tendency
was observed in anthocyanidin-3-monoglucosides and in acetylated and coumarylated
anthocyanins as well as in derived pigments such as vitisin A and vitisin B. Together these
results indicate that the density of the grapes greatly affects the concentration of the principal
molecules responsible for wine color. In particular, the presence of a high proportion of less
dense grapes in the whole harvest can lower the anthocyanin concentration below expected
UNIVERSITAT ROVIRA I VIRGILI GRAPE PHENOLIC MATURITY; DETERMINATION METHODS AND CONSEQUENCES ON WINE PHENOLIC COMPOSITION Nikolaos Kontoudakis ISBN:978-84-693-7682-9/DL:T-1754-2010

nn
Results (ii)
97
levels, which corroborate again that the grape heterogeneity may be more important than is
commonly thought.
Table 7 shows the results for total phenolic compounds, proanthocyanidins, measured by means
of a precipitation with methyl-cellulose, and astringency. The total phenolic indexes (TPI) and
proanthocyanidin concentration of 2007 wines were once more greater than those of 2008 when
similar densities were compared. Again it was confirmed that the maturity of the 2007 vintage
was higher. In this case the trends were also very clear and indicated that the density of the
grapes had a strong influence on the final quality of wine. Both the IPT and proanthocyanidin
concentration of the wine increased significantly with the density of the grapes. As with the
anthocyanins, there are two causes for this. First, denser grapes have a higher proanthocyanin
accumulation and second, more these compounds are extracted due to the higher ethanol
concentration in the wines obtained from these grapes (Canals et al., 2005). The astringency of
the wines was also measured and presented behavior that was parallel to that of the
proanthocyanidins.
Table 7. Total Phenolic Compounds, Proanthocyanidins and Related Parameters.
All data are expressed as the arithmetic average of three replicates ± standard deviation (n=3). Sta tistical analysis: one-factor ANOVA and Scheffe’ s test (both p=0.05). Different letters indicates the existence of sta tistica lly sign ificantdifferences between values of the same vintage.
Parameters Vintage Low density Medium density High density
TPI2007 39.9±2.0a 49.1±1.6b 51.8±1.3b
2008 35.4±1.8a 40.8±2.7b 49.9±3.4c
Proanthocyanidins (mg epicatechin/L)2007 992.3±129.9a 1112.7±240.5a 1570.5±350.1a
2008 886.5±65.8a 836.4±50.1a 1321.8±+215.5b
Astringency Index (g tannic acid/L)2007 0.159±0.009a 0.202±0.005b 0.231±0.004c
2008 0.086±0.003a 0.096±0.013a 0.142±0.030b
Table 8 shows the results of the analysis of wine proanthocyanidins obtained by acid-catalysis in
the presence of excess phloroglucinol (2008 vintage only). The results of the proanthocyanidin
concentration measured by this method do not exactly match those
obtained by precipitation with methyl-cellulose. However, the tendencies observed by both
methods are very similar, the proanthocyanidin concentration of the wines being higher when
the density of the grapes was greater. Moreover, when the density of the berries increased, the
UNIVERSITAT ROVIRA I VIRGILI GRAPE PHENOLIC MATURITY; DETERMINATION METHODS AND CONSEQUENCES ON WINE PHENOLIC COMPOSITION Nikolaos Kontoudakis ISBN:978-84-693-7682-9/DL:T-1754-2010

nn
Results (ii)
98
proportion of (+)-catechin significantly decreased and the proportion of (-)-epigallocatechin
significantly increased. Meanwhile, the proportions of the other two monomers, (-)-epicatechin
and (-)-epicatechin-3-O-gallate remained constant. Since epigallocatechin is only present in skin
proanthocyanidins (Souquet et al., 1996) these data indicate that the contribution of skins to the
wine proanthocyainidin concentration increases when the grapes are denser and therefore riper.
It seems therefore that denser grapes provide more proanthocyanidins which would produce
more tannic wines with a greater capacity for aging. In contrast, less dense grapes would
produce slight wines without capacity for aging. Hence, the grape heterogeneity can affect these
attributes.
Table 8. Analysis of Total Proanthocyanidins and Related Parameters Following Acid-Catalysis in the Present ofExcess Phloroglucinol for the wines of 2008.
All data are expressed as the arithmetic average of three replicates ± standard deviation (n=3). mDP, mean Degree ofPolymerization. Statistical analysis: one-factor ANOVA and Scheffe’ s test (both p=0.05). Different letters indicatesthe existence of sta tistica lly significant differences between values of the same vintage.
Parameters Low density Medium density High density
Total proanthocyanidins (mg/l) 639.1±92.5a 715.4±168.6ab 1006.2±191.9b
mDP 3.70±0.22a 4.71±0.48b 4.91±0.25b
(+)-Catechin (%) 16.8±0.4a 13.3±1.7b 12.1±0.4b
(-)-Epicatechin (%) 62.0±0.2a 61.8±1.6a 60.6±0.9a
(-)-Epigallocatechin (%) 18.2±0.8a 21.7±1.0b 24.1±0.9c
(-)-Epicatechin Galla te(%) 2.9±0.1a 3.2±0.2a 3.2±0.2a
Total proanthocyanidins (µmol/L) 585±115a 572±59a 683±101a
Molecular weight average (Da) 1100±66a 1403±145b 1466±76b
The mean degree of polymerization (mDP) of proanthocyanidins of the wines obtained with the
grapes of medium and high density present similar values. However, the mDP of the wine
obtained with berries of low density was significantly lower. This data confirms that the degree
of polymerization of proanthocyanidins is higher when the grapes are riper. Also it would
suggest that the lower density grapes mainly provide seed proanthocyanidins since the mDP of
skin proanthocyanidins are higher than the mDP of seed proanthocyanidins (Prieur et al.,1994;
Souquet et al., 1996). These results agree with those of Kennedy et al. (2002) who have found
that the degree of proanthocyanidin polymerization increases with maturity.
UNIVERSITAT ROVIRA I VIRGILI GRAPE PHENOLIC MATURITY; DETERMINATION METHODS AND CONSEQUENCES ON WINE PHENOLIC COMPOSITION Nikolaos Kontoudakis ISBN:978-84-693-7682-9/DL:T-1754-2010
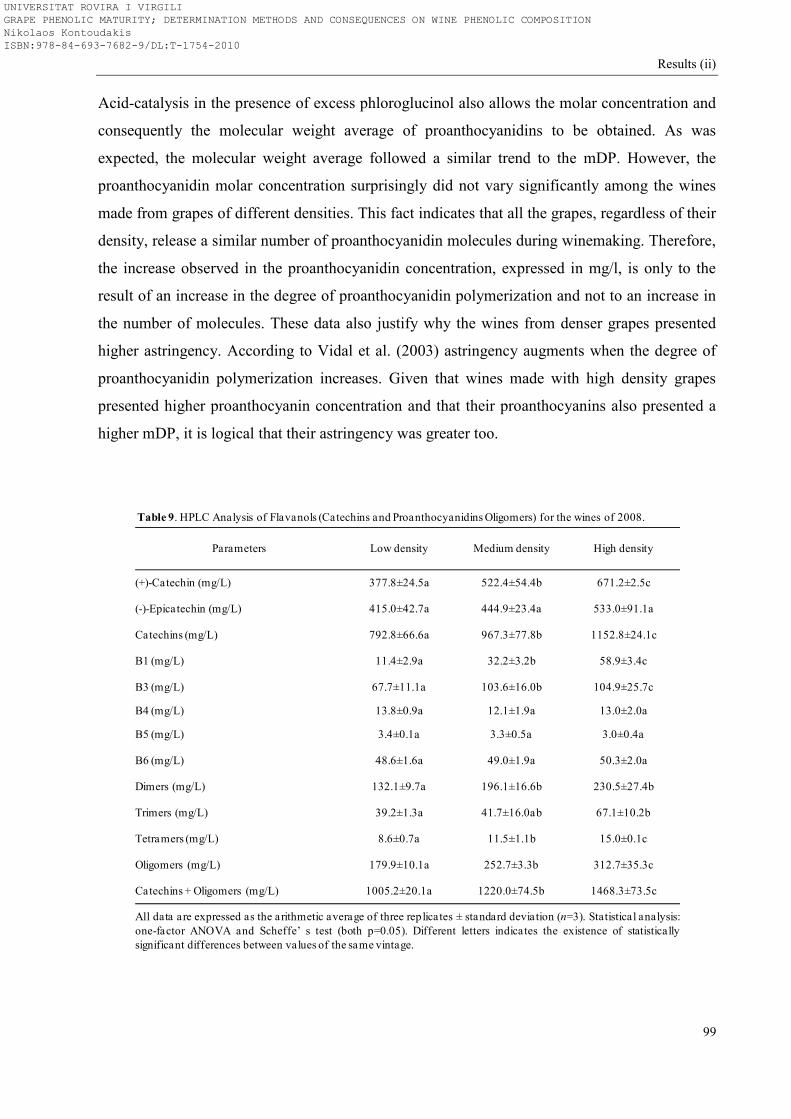
nn
Results (ii)
99
Acid-catalysis in the presence of excess phloroglucinol also allows the molar concentration and
consequently the molecular weight average of proanthocyanidins to be obtained. As was
expected, the molecular weight average followed a similar trend to the mDP. However, the
proanthocyanidin molar concentration surprisingly did not vary significantly among the wines
made from grapes of different densities. This fact indicates that all the grapes, regardless of their
density, release a similar number of proanthocyanidin molecules during winemaking. Therefore,
the increase observed in the proanthocyanidin concentration, expressed in mg/l, is only to the
result of an increase in the degree of proanthocyanidin polymerization and not to an increase in
the number of molecules. These data also justify why the wines from denser grapes presented
higher astringency. According to Vidal et al. (2003) astringency augments when the degree of
proanthocyanidin polymerization increases. Given that wines made with high density grapes
presented higher proanthocyanin concentration and that their proanthocyanins also presented a
higher mDP, it is logical that their astringency was greater too.
Table 9. HPLC Analysis of Flavanols (Catechins and Proanthocyanidins Oligomers) for the wines of 2008.
All data are expressed as the arithmetic average of three replicates ± standard deviation (n=3). Statistical analysis:one-factor ANOVA and Scheffe’ s test (both p=0.05). Different letters indicates the existence of statisticallysignificant differences between values of the same vintage.
Parameters Low density Medium density High density
(+)-Catechin (mg/L) 377.8±24.5a 522.4±54.4b 671.2±2.5c
(-)-Epicatechin (mg/L) 415.0±42.7a 444.9±23.4a 533.0±91.1a
Catechins (mg/L) 792.8±66.6a 967.3±77.8b 1152.8±24.1c
B1 (mg/L) 11.4±2.9a 32.2±3.2b 58.9±3.4c
B3 (mg/L) 67.7±11.1a 103.6±16.0b 104.9±25.7c
B4 (mg/L) 13.8±0.9a 12.1±1.9a 13.0±2.0a
B5 (mg/L) 3.4±0.1a 3.3±0.5a 3.0±0.4a
B6 (mg/L) 48.6±1.6a 49.0±1.9a 50.3±2.0a
Dimers (mg/L) 132.1±9.7a 196.1±16.6b 230.5±27.4b
Trimers (mg/L) 39.2±1.3a 41.7±16.0ab 67.1±10.2b
Tetramers (mg/L) 8.6±0.7a 11.5±1.1b 15.0±0.1c
Oligomers (mg/L) 179.9±10.1a 252.7±3.3b 312.7±35.3c
Catechins + Oligomers (mg/L) 1005.2±20.1a 1220.0±74.5b 1468.3±73.5c
UNIVERSITAT ROVIRA I VIRGILI GRAPE PHENOLIC MATURITY; DETERMINATION METHODS AND CONSEQUENCES ON WINE PHENOLIC COMPOSITION Nikolaos Kontoudakis ISBN:978-84-693-7682-9/DL:T-1754-2010

nn
Results (ii)
100
Table 9 presents the HPLC analysis of flavanols (catechins and oligomers). Also in this case, the
density of the berries significantly affected the concentration of proanthocyanidin monomers
and oligomers. The total monomer concentration increased when the density of the grapes was
higher. This augmentation mainly occurs due to the increase of (+)-catechin concentration while
(-)-epicatechin concentration remained at similar levels. On the other hand, the wine
concentration of proanthocyanidin dimers also increased when the grapes were denser.
However, this increased was only due to dimers B1 and in particular B3 whereas other dimers
such as B4, B5 and B6 present similar values in all wines. The trimers and tetramers followed a
similar profile to the dimers. The denser the grapes, the higher their concentration. This increase
in oligomers agrees with the previously mentioned results concerning the mDP.
The sensory triangular tests were carried out by comparing in pairs the three wines obtained
from the different density grapes. Only 5 of 10 tasters were able to differentiate between the
high density wines and the medium density wines. This result was not statistically significant (p
> 0.05). In contrast, all the tasters distinguished the low density wine when it was compared
with the medium or high density wine, being the results statistically significant (p < 0.05). All
these sensory analyses were done in dark glasses to prevent the tasters from being influenced by
the color. Therefore, these differences must be attributed to flavors and/or mouth sensation and
not wine color. In all cases, the tasters preferred wines from denser grapes. The reason given
was that these wines had a higher fruit and floral scents. Also there were better balanced as there
were sweeter, less acidic and less bitter than the low density wines.
4. Conclusions
It can be concluded that the heterogeneity of the grapes at the moment of the harvest is more
important that it is usually thought. The ensemble of all the grapes always has a proportion of
very well ripened grapes, another proportion of sufficiently ripened grapes and finally a
proportion of less ripened grapes. This fact must be taken into account because the presence of
less ripened grapes can affect seriously the final composition and consequently the quality of the
wine. These less ripened grapes diminish the final ethanol content, pH, anthocyanin
concentration, color intensity, total phenolic index and proanthocyanidin concentration and
increase titratable acidity. Moreover, these lower density grapes contribute less polymerized
UNIVERSITAT ROVIRA I VIRGILI GRAPE PHENOLIC MATURITY; DETERMINATION METHODS AND CONSEQUENCES ON WINE PHENOLIC COMPOSITION Nikolaos Kontoudakis ISBN:978-84-693-7682-9/DL:T-1754-2010

nn
Results (ii)
101
proanthocyanidins, lower proportions of (-)-epigallocatechin and higher proportions of (+)-
catechin. These data suggest that lower density grapes release more seed proanthocyanidins than
skin proanthocyanidins. Finally, the sensory comparison of wines leaves no doubt because as
the wine obtained from lower density grapes was always recognized in all the triangle trials and
was considered as less balanced and bitterer. Further research is needed to determine how this
heterogeneity can be measured easily and quickly. Only in this way will winemakers have the
tools which enable them to take the heterogeneity of the grapes into account in their maturity
controls and even to consider the possibility of applying a sorting table for eliminating the
unripe grapes.
Acknowledgments
We thank CICYT (AGL2007-66338) and CDTI (Project CENIT Demeter) for financial support.
References
Arnold, R., & Noble, A. C. (1978). Bitterness and astringency of grape seed phenolics in a
model solution. American Journal of Enology and Viticulture, 29, 150–152.
Ayala, F., Echávarri, J. F., & Negueruela, A. I. (1997). A new simplified method for measuring
the color of wines I. Red and rose wines. American Journal of Enology and Viticulture, 48,
357-363.
Ayala, F., Echávarri, J. F., & Negueruela, A. I. (2001).
http://www.unizar.es/negueruela/MSCVes.zip.
Canals, R., Llaudy, M. C., Valls, J., Canals, J. M, & Zamora, F. (2005). Influence of Ethanol
Concentration on the Extraction of Color and Phenolic Compounds from the Skin and Seeds
of Tempranillo Grapes at Different Stages of Ripening. Journal of Agricultural and Food
Chemistry, 53, 4019-4025.
UNIVERSITAT ROVIRA I VIRGILI GRAPE PHENOLIC MATURITY; DETERMINATION METHODS AND CONSEQUENCES ON WINE PHENOLIC COMPOSITION Nikolaos Kontoudakis ISBN:978-84-693-7682-9/DL:T-1754-2010

nn
Results (ii)
102
Celotti, E., Della Vedova, T., Ferrarini, R., & Martinand, S. (2007). The use of reflectance for
monitoring phenolic maturity curves in red grapes. Italian Journal of Food Science, 19, 91-
100.
De Freitas, V., Glories, Y. (1999). Concentration and compositional changes of procyanidins in
grape seeds and skin of white Vitis vinífera varieties. Journal of the Science of Food and
Agriculture, 79, 1601-1606.
De Freitas, V. A. P., Glories, Y., Bourgeois, G., & Vitry, C. (1998). Characterisation of
oligomeric and polymeric procyanidins from grape seeds by liquid secondary ion mass
spectrometry. Phytochemistry, 49, 5, 1435-1441.
Dupuch, V. (1993). Appréciation de la metière phénolique des vins rouges; application à la
détermination de la date de récolte. Actes du Colloque “Journé technique du CIVB” 21
janvier 1993, Bordeaux, pp 62-69.
Fournand, D., Vicens, A., Sidhoum, L., Souquet, J. M., Moutounet, M., & Cheynier, C. (2006).
Accumulation and Extractability of Grape Skin Tannins and Anthocyanins at Different
Advanced Physiological Stages. Journal of Agricultural and Food Chemistry. 54, 7331-7338.
Gambuti, A., Strollo, D., Lecce, L. & Moio, L. (2007). The effect of grape ripeness stages on
polyphenol content of aglianico (Vitis vinifera L.) wine aged for two years. Acta
Horticulturae, 754, 449-456.
Gawel, R. (1998). Red wine astringency: a review. Australian Journal of Grape and Wine
Research, 4, 74–98.
Glories, Y. (1984). La couleur des vins rouges. 1e`re partie: Les equilibres des anthocyanes et
des tannins. Connaisance de la Vigne et du Vin, 18, 195–217.
Glories, Y., & Agustin, M. (1993). Maturité phénolique du raisin, conséquences technologiques;
application aux millésimes 1991 et 1992. Actes du Colloque “Journé technique du CIVB” 21
janvier 1993, Bordeaux, pp 56-61.
Gonzalez-Manzano, S., Rivas-Gonzalo, J.C., & Santos-Buelga, C., (2004). Extraction of flavan-
3-ols from grape seed and skin into wine using simulated maceration. Analytica Chimica
Acta, 513, 283–289.
González-San José, M., Diez, C., Santa María, G., & Garrido, J. L. (1988). Análisis por
cromatografía líquida de alta eficacia de los pigmentos antociánicos de uvas de Vitis vinifera
L. Anales de Química, 84, 290–293.
UNIVERSITAT ROVIRA I VIRGILI GRAPE PHENOLIC MATURITY; DETERMINATION METHODS AND CONSEQUENCES ON WINE PHENOLIC COMPOSITION Nikolaos Kontoudakis ISBN:978-84-693-7682-9/DL:T-1754-2010

nn
Results (ii)
103
Haselgrove, L., Botting, D., van Heeswijck, R., Høj, P. B., Dry, P. R., Ford, C., & P.G. Iland, P.
G. (2000). Canopy microclimate and berry composition: The effect of bunch exposure on the
phenolic composition of Vitis vinifera L cv. Shiraz grape berries. Australian Journal of
Grape and Wine Research, 6, 141–149.
Herderich, M.J., & Smith, P. A. (2005). Analysis of grape and wine tannins: methods,
applications and challenges. Australian Journal of Grape and Wine Research, 11, 205–214.
Jackson, R. S. (2002). Quantitative (technical) wine assessment In: Jackson (Ed.), Wine Tasting.
A Professional Hand Book (pp. 113-186). Birlighton: Academic Press.
Kennedy, J. A., & Jones, G.P. (2001). Analysis of proanthocyanidin cleavage products
following acid-catalysis in the presence of excess phloroglucinol. Journal of Agricultural and
Food Chemistry, 49, 1740-1746.
Kennedy, J. A., Matthewa, M. A., & Waterhouse, A. L. (2002). Effect of maturity and vine
water status on grape skin and wine flavonoides. American Journal of Enology and
Viticulture, 53(4), 268–274.
Kontoudakis, N., Esteruelas, M., Fort, F., Canals, J.M., Zamora, F. (2010). Comparison of
methods for estimating phenolic maturity in grapes: Correlation between predicted and
obtained parameters. Analytica Chimica Acta, 660, 127–133.
Llaudy, M. C., Canals, R., Canals, J. M., Rozes, N., Arola, Ll., & Zamora, F. (2004). New
method for evaluating astringency in red wine. Journal of Agricultural and Food
Chemistry,52, 742-746.
Llaudy, M. C., Canals, R., Canals, J. M., & Zamora, F. (2008). Influence of ripening stage and
maceration length on the contribution of grape skins, seeds and stems to phenolic
composition and astringency in wine-simulated macerations. European Food Research and
Technology, 226, 337–344.
Niketic-Aleksic, G. K., & Hrazdrina, G. (1972). Quantitaive analysis of the anthocyanin content
in grape juices and wine. Lebensmittel-Wissen Technolog, 5 (5), 163-165.
Noble, A. C. (1990). Bitterness and astringency in wine. In Rouseff, R. L., Bitterness in foods
and beverages, development in food science, vol. 25 (pp. 145–158). New York: Elsevier.
O.I.V. (2005). Le recueil des méthodes internationales d’analyse des vins et des moûts, vols I,
II, Sect 3. Paris: O.I.V.
UNIVERSITAT ROVIRA I VIRGILI GRAPE PHENOLIC MATURITY; DETERMINATION METHODS AND CONSEQUENCES ON WINE PHENOLIC COMPOSITION Nikolaos Kontoudakis ISBN:978-84-693-7682-9/DL:T-1754-2010

nn
Results (ii)
104
O´-Marques, J., Reguinga, R., Laureano, O., & Ricardo-da-Silva, J.M. (2005). Changes in grape
seed, skins and pulp condensed tannins during berry ripening: effect of fruit pruning. Ciência
Tècnica Vitivinicola, 20(1), 35–52.
Pérez-Magariño, S., & González-Sanjose, M.L. (2003). Application of absorbance values used
in wineries for estimating CIELAB parameters in red wines. Food Chemistry, 81, 301–306.
Pérez-Magariño, S. & González-San José, M.L. (2006). Polyphenols and colour variability of
red wines made from grapes harvested at different ripeness grade. Food Chemistry, 96 (2),
197-208.
Peyrot des Gachons, C., & Kennedy, J.A. (2003). Direct method determining seed and skin
proanthocyanidin extraction into red wine. Journal of Agricultural and Food Chemistry, 51,
5877–5881.
Prieur, C., Rigaud, J., Cheynier, V., & Moutounet, M. (1994). Oligomeric and polymeric
procyanidins from grape seeds. Phytochemistry, 36, 781–784.
Ribereau-Gayon, P., Glories, Y., Maujean, A., & Dubourdieu, D. (2006). Phenolic Compounds.
In Handbook of enology, Volume 2, The Chemistry of Wine, Stabilization and Treatments
(pp. 141-204). Chichester: John Wiley & sons, Ltd.
Rivas-Gonzalo, J.C., (2003). Analysis of anthocyanins. In: Santos-Buelga, C., Williamson, G.,
Methods in Polyphenols Analysis (pp. 338–358). Cambridge: The Royal Society of
Chemistry.
Rivas-Gonzalo, J.C., Gutierrez, Y., Hebrero, E., & Santos-Buelga, C. (1992). Comparisons of
Methods for the Determination of Anthocyanins in Red Wines. American Journal of Enology
and Viticulture, 43(2), 210–214.
Romeyer, F. M., Macheix, J. J., & Sapis, J. C. (1986). Changes and importance of oligomeric
procyanidins during maturation of grape seed. Phytochemistry, 25(1), 219–221.
Ryan, J.M., & Revilla, E. (2003). Anthocyanin composition of Cabernet sauvignon and
Tempranillo grapes at different stages of ripening. Journal of Agricultural and Food
Chemistry, 51, 3372–3378.
Sarneckis, C. J., Dambergs, R. G., Jones, P., Mercurio, M., Herderich, M. J., & Smith, P. A.
(2006). Quantification of condensed tannins by precipitationwith methyl cellulose:
development and validation of an optimised tool for grape and wine analysis. Australian
Journal of Grape and Wine Research, 12, 39-49.
UNIVERSITAT ROVIRA I VIRGILI GRAPE PHENOLIC MATURITY; DETERMINATION METHODS AND CONSEQUENCES ON WINE PHENOLIC COMPOSITION Nikolaos Kontoudakis ISBN:978-84-693-7682-9/DL:T-1754-2010

nn
Results (ii)
105
Smart, R. E., Robinson, J. B., Due, G. R., & Brien, C. J. (1985). Canopy microclimate
modification for the cultivar Shiraz. I. Definition of canopy microclimate. Vitis, 24, 17-31.
Souquet, J. M., Cheynier, V., Brossaud, F., & Moutounet, M. (1996). Polimeric
Proanthocyanidins from grape skins. Phytochemistry, 43, 509–512.
Vidal, S., Francis, L., Guyot, S., Marnet, N., Kwiatkowski, M., Gawel, R., Cheynier, V., &
Waters, E. J. (2003). The mouth-feel properties of grape and apple proanthocyanidins in a
winelike medium. Journal of the Science of Food and Agriculture, 83(6), 564–573.
Vivas, N., & Glories, Y. (1996). Role of oak wood ellagitannins in the oxidation process of red
wines during aging. American Journal of Enology and Viticulture, 47, 103–107.
UNIVERSITAT ROVIRA I VIRGILI GRAPE PHENOLIC MATURITY; DETERMINATION METHODS AND CONSEQUENCES ON WINE PHENOLIC COMPOSITION Nikolaos Kontoudakis ISBN:978-84-693-7682-9/DL:T-1754-2010

UNIVERSITAT ROVIRA I VIRGILI GRAPE PHENOLIC MATURITY; DETERMINATION METHODS AND CONSEQUENCES ON WINE PHENOLIC COMPOSITION Nikolaos Kontoudakis ISBN:978-84-693-7682-9/DL:T-1754-2010

nn
iii. Use of unripe grapes harvested during cluster thinning as a
method for reducing alcohol content and pH of wine
Nikolaos Kontoudakis, Mireia Esteruelas, Francesca Fort, Joan Miquel Canals, Fernando
Zamora
Departament de Bioquímica i Biotecnologia, Facultat d’Enologia de Tarragona, Universitat
Rovira i Virgili, Campus de Sescelades, C/ Marcel.li Domingo, s/n. 43007-Tarragona, Spain.
Submited to Journal of Grape and Wine Research (AJGWR-10-044).
UNIVERSITAT ROVIRA I VIRGILI GRAPE PHENOLIC MATURITY; DETERMINATION METHODS AND CONSEQUENCES ON WINE PHENOLIC COMPOSITION Nikolaos Kontoudakis ISBN:978-84-693-7682-9/DL:T-1754-2010

nn
UNIVERSITAT ROVIRA I VIRGILI GRAPE PHENOLIC MATURITY; DETERMINATION METHODS AND CONSEQUENCES ON WINE PHENOLIC COMPOSITION Nikolaos Kontoudakis ISBN:978-84-693-7682-9/DL:T-1754-2010

nn
Results (iii)
109
Abstract
Background and Aims: Deep red full-bodied wines can only be obtained from grapes with
complete phenolic maturity which frequently produce wines with high pH and alcohol content.
The present study focuses on a new procedure for simultaneously reducing pH and ethanol
content.
Methods and Results: Grapes from cluster thinning were used to produce a very acidic low-
alcohol wine. The wine was treated with high doses of charcoal and bentonite. This odorless and
colorless wine was used to reduce pH and ethanol content when the grapes reached complete
phenolic maturity. The anthocyanin and proanthocyanidin concentrations, the mean degree of
polymerization and the monomeric composition of proanthocyanidin of reduced-alcohol wines
were similar than those of their corresponding controls. Since the pH was lower, the color of the
reduced-alcohol wines was more intense. No significant differences were found between
reduced-alcohol wines and their controls by triangle sensory tests using dark glasses for two of
the three studied cultivars.
Conclusion: The proposed procedure may be useful for reducing simultaneously the alcohol
content and the pH of wines.
Significance of the Study: The proposed procedure allows decreasing simultaneously alcohol
and pH. Moreover, it is very easy to apply and does not require specific equipment.
Keywords: Reduced-Alcohol Wine, pH Reduction, Color, Phenolic Compounds
UNIVERSITAT ROVIRA I VIRGILI GRAPE PHENOLIC MATURITY; DETERMINATION METHODS AND CONSEQUENCES ON WINE PHENOLIC COMPOSITION Nikolaos Kontoudakis ISBN:978-84-693-7682-9/DL:T-1754-2010

nn
Results (iii)
110
Introduction
Nowadays, strongly colored full-bodied red wines are highly appreciated by the market.
However, producing this kind of wine requires an intense extraction of phenolic compounds
from the cap during winemaking and this can cause bitterness, excess of astringency and
herbaceous smells if the grapes are not ripe enough. In fact, grape maturity strongly influences
the phenolic composition of red wines (O´-Marques et al. 2005, Ryan and Revilla 2003).
Insufficiently ripened grapes have a lower extractability of anthocyanins and proanthocyanidins
from skins and a higher extractability of proanthocyanidins from seeds (Canals et al. 2005,
Peyrot des Gachons and Kennedy 2003). Consequently, it is generally thought that insufficiently
ripened grapes can release a higher amount of seed proanthocyanidins, which are highly
galloylated (Romeyer et al. 1986). This is probably the reason why poorly matured grapes often
produce astringent bitter wines.
For this reason, winemakers are very interested in measuring phenolic maturity so that they can
harvest grapes that are ripe as possible. Nevertheless, grapes with very high phenolic maturity
frequently present high sugar and low acid concentrations. Consequently, the resulting wines
have the drawback of very high pH and alcohol content. High pH values in wines cause such
problems as less color and less antiseptic effectiveness of sulfur dioxide (Beech et al. 1979). On
the other hand, excess ethanol may cause stuck and sluggish fermentation (Bisson 1999), and
can also alter the sensory balance of the wine (Williams 1972, Fischer and Noble 1994).
Moreover, high-alcohol wines have higher tax rates in some countries and are sometimes not
well accepted by consumers.
It is a verifiable fact that most wines have gradually increased their alcohol content and pH in
recent years and winemakers are concerned about the problem. Some authors even consider that
climate change may increase this tendency (Tate 2001, Duchêne and Schneider 2005, Jones et
al. 2005). The increase in temperature and the changes in rainfall distribution will probable
affect vine and grape physiology, and impact on wine composition and quality. If the
temperature during ripening is higher than the optimal, the grape pulp matures faster, and the pH
and sugar concentration are too high. Thereby the period between veraison and industrial
maturity decline, which makes it more difficult to reach the proper aromatic and phenolic
maturity, and leads to unbalanced wines (Zamora 2003, 2005). Moreover, it is observed that
UNIVERSITAT ROVIRA I VIRGILI GRAPE PHENOLIC MATURITY; DETERMINATION METHODS AND CONSEQUENCES ON WINE PHENOLIC COMPOSITION Nikolaos Kontoudakis ISBN:978-84-693-7682-9/DL:T-1754-2010

nn
Results (iii)
111
global warming is shifting areas of vine cultivation. It has been estimated that the northern limits
of its cultivation in Europe is moving at a rate between 10 and 30 km per decade and that the
speed of travel is expected to double between 2020 and 2050 (Kenny and Harrison 1993). This
means that some regions that are nowadays adequate for grape growing could not be suitable at
the future, without the adoption of appropriate adaptive measures. In contrast, other regions that
until now appeared as unsuitable for wine grape production because of its warmer temperature
may become more suitable in the future for wine production.
Several techniques have been proposed to mitigate climate impacts. One is to harvest grapes at
an early stage of ripening. However, this is not a good solution because grapes have not reached
an adequate phenolic and aromatic maturity, which would certainly produce bitter and
herbaceous wines. Another is to add water and mineral acids to the grape juice before the
fermentation begins. This reduces the sugar concentration and pH but has a general negative
effect on wine quality because it dilutes all the other compounds, and although this practice is
authorized in some countries, it is strictly forbidden in others. It is also possible to reduce this
problem by blending high-alcohol wines with low-alcohol wines. However, a sufficient volume
of low-alcohol wine, which does not present the disadvantages described above, is required.
Other possibilities are to introduce new cultivars, modify culture techniques and even move
vineyards to other production areas to delay pulp sugar accumulation and acid consumption
(Schultz 2000). It should be taken into account that all the work on clonal selection in recent
years has aimed to obtain grapevines that can quickly produce high sugar content. Now we need
to retrace our steps and search for the old vines that are best adapted to the new climate
conditions. This solution is probably the best one but it requires long and laborious studies and a
considerable economic investment to replant most of the vineyards.
Glucose oxidase (EC 1.1.3.4) has also been proposed as one way of obtaining less alcoholic
wines (Pickering et al. 1998). However, it has two drawbacks. It oxidize glucose by generating a
very high concentration of gluconic acid in wine. Moreover, it uses oxygen as a substrate so the
grape juice needs to be excessively aerated which may oxidize other wine components
(Pickering et al. 1999).
The use of yeast with a lower ethanol yield production has also been proposed. However, it
seems that natural Saccharomyce cerevisiae strains present similar yields, which leads to an
impasse unless genetically modified organisms (Dequin and Barre 1994, Malherbe et al. 2003)
or non-Saccharomyces yeasts are used (Ciani and Ferraro 1996).
UNIVERSITAT ROVIRA I VIRGILI GRAPE PHENOLIC MATURITY; DETERMINATION METHODS AND CONSEQUENCES ON WINE PHENOLIC COMPOSITION Nikolaos Kontoudakis ISBN:978-84-693-7682-9/DL:T-1754-2010

nn
Results (iii)
112
However, nowadays the most commonly used methods for modifying alcohol content and pH
are probably physical ones. In fact, several physical techniques have been applied to partially
reduce the sugar concentration in grape juice or the alcohol in wine. Some of the proposed
methods are supercritical fluid extraction, vacuum distillation and membrane techniques (Bui et
al. 1986, Sykes et al. 1992, Pickering 2000, Takács et al. 2007, Diban et al. 2008, Ruiz-
Rodrigueza et al. 2010). Of these, the most frequently used in the wine industry are the spinning
cone column and reverse osmosis system (Pickering 2000). To decrease wine pH, on the other
hand, physical methods such as cationic exchange columns and electrodyalisis are the most used
(Bonorden et al.1986, Walker et al. 2004). These physical methods are effective but involve
bulky and expensive equipment and many winemakers have concerns about their effects on
wine quality.
The present study focuses on a new winemaking process for simultaneously reducing the pH
and alcohol content of wine. It involves using the grape berries collected during cluster thinning.
Grape growers often remove some of the grape clusters at the beginning of the veraison in order
to improve the development ones remaining. These clusters, which are usually left on the
ground of the vineyard, can be harvested and used to obtain a highly acidic wine with a very low
degree of alcohol. Once alcoholic fermentation has ended, this wine can be treated with a very
high dose of charcoal and bentonite in order to completely eliminate phenolic compounds and
herbaceous smells. This odorless and colorless wine can be used later, when the rest of the
grapes have reached the complete phenolic maturity to reduce pH and ethanol content.
Materials and Methods
Chemicals and reagents
Methanol, acetonitrile, formic acid and acetic acid were HPLC-grade and purchased from
Panreac (Barcelona, Spain). Malvidin-3-O-glucoside chloride, (+)-catechin, (-)-epicatechin, (-)-
epigallocatechin and (-)-epicatechin 3-O-gallate were purchased from Extrasynthès (Genay,
France). Ovoalbumin, phloroglucinol and L-ascorbic were purchased from Sigma (Madrid,
Spain). Charcoal and bentonite were purchased by Martin Vialatte (Epernay, France). The rest
of the chemicals were of high purity and were purchased from Panreac (Barcelona, Spain).
UNIVERSITAT ROVIRA I VIRGILI GRAPE PHENOLIC MATURITY; DETERMINATION METHODS AND CONSEQUENCES ON WINE PHENOLIC COMPOSITION Nikolaos Kontoudakis ISBN:978-84-693-7682-9/DL:T-1754-2010

nn
Results (iii)
113
Winemaking procedure
The yield of the vineyards of the cultivar Vitis vinifera cv. Grenache can sometimes be reduced
by applying cluster thinning in order to improve the phenolic maturity. During the vintage 2008
just at the beginning of the veraison, the clusters of this cultivar were thinned in the
experimental vineyard belonging to the Enology Faculty in Tarragona (Rovira i Virgili
University) at Constantí (AOC Tarragona). Five hundred kg of the grapes were not rejected but
taken to the experimental winery instead.
The grapes were crushed (Delta E2, Bucher Vaslin, Chalonnes sur Loire-France) and lightly
pressed in a pneumatic press (M-15c, Marzola, Logroño, Spain) until 250 L of grape juice was
obtained. The must was immediately sulphited with 100 mg of K2S2O5/L and placed in a 100 L
stainless steel tank. The grape juice was allowed to settle for 20 hours, racked to another tank
and inoculated with selected yeast (EC 1118, Lallemand, Montreal, Canada). Alcoholic
fermentation was carried out at 18 ± 1 ºC. When it has finished, the tank was sulphited with 100
mg of K2S2O5/L and treated with 5 g/L of charcoal and 1 g/L of bentonite to obtain the absolute
discoloration and deodorization. This low-ethanol wine presented the following analytical
parameters: 5 % (v/v) of ethanol content, 17.8 g of tartaric acid/l of titratable acidity and pH
2.64. Then, it was conserved at 4 ºC.
Subsequently, grapes of the cultivar Vitis vinifera cv. Cabernet Sauvignon and Merlot from the
vineyards of Juvé & Camps in Mediona (AOC Penedes) and Bobal from the vineyards of
Dominio de la Vega in San Antonio (AOC Requena) were harvested at two different ripening
stages. The first harvest (H1) was carried out when the probable degree of alcohol was between
13.0 and 14.0 %. The second harvest (H2) was carried out when the grapes reached optimum
phenolic maturity.
For each cultivar, 60 Kg (H1) or 120 Kg (H2) of grapes were collected and manually
destemmed. After that, berries were randomly distributed into three lots (H1) or six lots (H2) of
eight kilograms each. Then the grapes were crushed with a semi-automatic crusher machine
(Gual, Villafranca del Penedès, Spain), sulphited (100 mg of K2S2O5/L) and placed in ten-liter
tanks. Three tanks from the first harvest (H1) and also three tanks from the second harvest
(CH2) were used without any of the low-ethanol wine being added. The other three tanks from
the second harvest (RAH2) were used for the reduction alcohol experiment. Specifically, a part
of the total volume of the grape juice was extracted and replaced with the same volume of low-
UNIVERSITAT ROVIRA I VIRGILI GRAPE PHENOLIC MATURITY; DETERMINATION METHODS AND CONSEQUENCES ON WINE PHENOLIC COMPOSITION Nikolaos Kontoudakis ISBN:978-84-693-7682-9/DL:T-1754-2010

nn
Results (iii)
114
alcohol wine. This volume (V) was calculated for each sample with the aim of reproducing the
probable alcoholic degree of the corresponding wine from the first harvest. The following
equation was used to calculate the exact volume (V) to be replaced in each sample:
V (liters) = 6.4 (G2-G1)/(G2-5)
where 6.4 is the yield of grape juice (in liters) from 8 kg of grapes, G2 is the probable degree of
alcohol of the grape juice, G1 is the degree of alcohol of the wine from the first harvest, and 5%
is the degree of alcohol of the low-alcohol wine. Specifically, the volume of grape juice replaced
by the low-alcohol wine was 0.85 L for Cabernet Sauvignon, 1.50 L for Merlot and 2.00 L for
Bobal.
All tanks were inoculated with 200 mg/L of selected yeast (EC1118, Lallemand, Montreal,
Canada) and maintained at a room temperature of 25 ± 1 ºC until the end of the
maceration/fermentation process. All these microvinifications were controlled daily by
measuring the temperature and the density of the must. Every day, a manual punch down was
carried out to improve the extraction of phenolic compounds. After 14 days of maceration, the
wines were decanted, bottled and inoculated with 100 mg/L of the lactic bacteria, Oenococcus
oeni (Vitilactic F, Martin Vialatte, Epernay, France). Once malolactic fermentation had finished,
all the wines were racked, sulphited (100 mg of K2S2O5/L) and refrigerated for three weeks at 4
ºC. Finally, all samples were stored at 15 ± 1 ºC until analysis.
Standard grape and wine analysis
The analytical methods recommended by the OIV (O.I.V. 2005) were used to determine sugar
content, probable alcohol content, titratable acidity, the pH of the grapes and their ethanol
content, the titratable acidity and the pH of the wines.
Color parameters
UNIVERSITAT ROVIRA I VIRGILI GRAPE PHENOLIC MATURITY; DETERMINATION METHODS AND CONSEQUENCES ON WINE PHENOLIC COMPOSITION Nikolaos Kontoudakis ISBN:978-84-693-7682-9/DL:T-1754-2010

nn
Results (iii)
115
The color intensity (CI) was estimated using the method described by Glories (1984b). The
CIELab coordinates, lightness (L*), chroma (C*), hue (h*), red-greenness (a*) and yellow-
blueness (b*) were determined according to Ayala et al. (1997) and the data were processed
with the MSCV software (Ayala et al. 2001). The total colour difference (∆Eab*) between two
samples was obtained using the expression: ∆Eab* = [(∆L*)2 + (∆a*)2 + (∆b*)2]1/2 (Pérez-
Magariño and González-Sanjose 2003). All absorbance measurements were taken with a Helios
Alpha (Thermo Fisher Scientific Inc.,Waltman, MA) UV–vis spectrophotometer using quartz
cells with a path length of 1 mm.
Anthocyanin analysis
Reversed-phase HPLC analyses of anthocyanins and the anthocyanin-derived pigments Vitisin
A and Vitisin B were carried out with an Agilent 1200 series liquid chromatograph (HPLC-
DAD) and an Agilent Zorbax Eclipse XDB-C18, 4.6 x 250mm 5µm column (Agilent
Technologies, Santa Clara, USA) in accordance with the method described by González-San
José et al. (1988). Anthocyanin standard curves were made using malvidin-3-glucoside.
Analysis of proanthocyanidins following acid catalysis with phloroglucinol
Acid-catalysis cleavage in the presence of excess phloroglucinol was used to analyze
monomeric proanthocyanidin composition and its mean degree of polymerization (mDP). The
samples were prepared and analyzed by reversed-phase HPLC according to the method
described by Kennedy and Jones (2001). The monomers (+)-catechin, (-)-epicatechin, (-)-
epicatechin-3-O-gallate were identified by comparing their retention times with those of the
pure compounds. The phoroglucinol adducts of (+)-catechin, (-)-epicatechin, (-)-
epigallocatechin and (-)-epicatechin-3-O-gallate were identified by HPLC-TOF analysis.
Analyses were performed with Agilent 1200 series HPLC using an Agilent 6210 time of flight
(TOF) mass spectrometer equipped with an electrospray ionization (ESI) system. Elution was
carried out under the same HPLC analysis conditions as described by Kennedy and Jones
(2001). The capillary voltage was 3.5 kV. Nitrogen was used as both dry gas at a flow rate of 12
l/min at 350 ºC and nebulizer gas at 60 psi. Spectra were recorded in positive ion mode between
UNIVERSITAT ROVIRA I VIRGILI GRAPE PHENOLIC MATURITY; DETERMINATION METHODS AND CONSEQUENCES ON WINE PHENOLIC COMPOSITION Nikolaos Kontoudakis ISBN:978-84-693-7682-9/DL:T-1754-2010
nn
Results (iii)
116
m/z 50 and 2400. This assay was also carried out without addition of phloroglucinol so that the
quantity of proanthocyanidin monomers naturally present in the wines could be measured.
The number of terminal subunits were considered as the difference between total monomers
without phoroglucinol and thus obtained in the analysis performed without phloroglucinol
addition. The number of extension subunits was considered as the addition of all the
phloroglucinol adduct. The mean degree of polymerization (mDP) was calculated by adding the
number of terminal and extension subunits (in moles) and dividing by the number of terminal
subunits. The total proanthocyanidin concentration was considered as the addition of all terminal
and extension subunits. Because acid catalysis with phloroglucinol is not completely efficient,
the real yield of the reaction was measured using a pure B2 proanthocyanidin dimer [(-)-
epicatechin-(4→8)-(-)-epicatechin]. This yield was used to calculate the total proanthocyanidin
concentration.
Other phenolic compounds
The total phenolic index (TPI) was determined by measuring the absorbance at 280 nm
(Ribereau-Gayon et al. 2006). The proanthocyanidin concentration was also estimated by
precipitation with methyl cellulose (Sarneckis et al. 2006).
Astringency index
The astringency index was estimated using ovoalbumin as a precipitation agent and tannic acid
solutions as standards in accordance with Llaudy et al.’s method (2004).
Sensory analysis
All the wines were tasted by a group of 10 expert enologists from the Rovira i Virgili University
6 weeks after bottling. Two previous training sessions of tasting were carried out to standardize
criteria among the panelists. Dark glasses were used to prevent them from being influenced by
color intensity (Norton and Johnson 1987, Stillman 1993). Three sensory triangle tests were
conducted for each cultivar to compare the three wines in pairs. In all the cases, the main
UNIVERSITAT ROVIRA I VIRGILI GRAPE PHENOLIC MATURITY; DETERMINATION METHODS AND CONSEQUENCES ON WINE PHENOLIC COMPOSITION Nikolaos Kontoudakis ISBN:978-84-693-7682-9/DL:T-1754-2010

nn
Results (iii)
117
objective was to recognize the different wine and after then indicate which of them was
preferred for its olfactory and/or tasting sensations.
Statistics
All the physical and chemical data are expressed as the arithmetic average ± the standard
deviation from three replicates. One-factor ANOVA and Scheffe’s test s test were carried out
with SPSS software. The level of significance of sensory triangle tests was determined
following Jackson’s method (2002).
Results and discussion
The fermentation times were, in general, closely related with the sugar concentration of the
different grape juices. The higher sugar concentration the slower alcoholic fermentation. More
specifically, H1 and RAH2 fermentations were finished in a range of 7-8 days, while Merlot and
Cabernet Sauvignon CH2 fermentations were completed in a range of 8-10 days. In the case of
CH2 Bobal, the fermentation took longer to be ended (12-14 days) probably because of their
higher sugar content.
Standard wine parameters are shown in Table 1. Naturally, wines from the first harvest (H1) had
higher titratable acidity, lower ethanol content and lower pH (Table 1) than the corresponding
control wines from the second harvest (CH2), which indicated that the three grape varieties had
really ripened during the period between the first and the second harvest. Moreover, the wines
from the second harvest reached very high degrees of alcohol, more than 15 % in the three
cultivars, and also high pH values (more than 3.75 for Merlot and Bobal).
As expected, all the wines to which part of their juice had been replaced by the low-alcohol
wine (RAH2) had a lower ethanol content and pH than their corresponding controls (CH2). In
fact, the ethanol content, the pH and the titratable acidity of the RAH2 wines were closer to
those of the corresponding H1 wines than to those of their corresponding CH2 wines for the
three cultivars. Specifically, RAH2 wines had 0.9 % (Cabernet Sauvignon), 1.7 % (Merlot) and
3.0 % (Bobal) less alcohol content than their corresponding CH2 wines. These results are quite
UNIVERSITAT ROVIRA I VIRGILI GRAPE PHENOLIC MATURITY; DETERMINATION METHODS AND CONSEQUENCES ON WINE PHENOLIC COMPOSITION Nikolaos Kontoudakis ISBN:978-84-693-7682-9/DL:T-1754-2010

nn
Results (iii)
118
conclusive and show that replacement of some of the grape juice by the low-alcohol wine can be
useful for obtaining reduced-alcohol wines with a lower pH.
Table 1. Standard wine parameters.
Cultivar ParametersH1 H2
CH2 RAH2
Cabernet Sauvignon
Ethanol (% v/v) 14.0± 0.1a 15.4 ± 0.1b 14.5 ± 0.1c
TA (g/L) 6.50 ± 0.13a 5.90 ± 0.04b 6.72 ± 0.19a
pH 3.48 ± 0.02a 3.55 ± 0.02b 3.46 ± 0.03a
Merlot
Ethanol (% v/v) 13.4 ± 0.1a 15.9 ± 0.1b 14.2 ± 0.1c
TA (g/L) 7.00 ± 0.17a 6.35 ± 0.24b 7.15 ± 0.09c
pH 3.45 ± 0.01a 3.76 ± 0.03b 3.55 ± 0.07c
Bobal
Ethanol (% v/v) 13.2 ± 0.1a 16.9 ± 0.1b 13.9 ± 0.1c
TA (g/L) 7.45 ± 0.09a 6.70 ± 0.05b 8.94 ± 0.06c
pH 3.46 ± 0.01a 3.80 ± 0.01b 3.34 ± 0.08c
TA: t itratable acidity, H1: first harvest, H2: second harvest, CH2: control wines of H2, RAH2: reducedalcohol wines from H2. All data are expressed as the average of the three replicates ± standard deviation (n =3). Statistical analysis: one-factor ANOVA and Scheffe´s test (both p < 0.05). Different letters indicate theexistence of statistically significant differences.
The results corresponding to anthocyanin concentration (Table 2) indicates that the wines from
the second harvest (H2) presented higher total anthocyanin concentrations than their
corresponding H1 wines and no statistically significant differences were found between the CH2
and the RAH2 wines in the three cultivars. These results confirm that the riper grapes produced
wines with a higher anthocyanin concentration in the three studied cultivars (Bautista-Ortin et
al. 2006, Fournand et al. 2006). The increase of total anthocyanins throughout ripening was
mainly due to anthocyanidin-3-monoglucosides although the same trend was observed in acetyl
and p-coumaryl anthocyanidins.
Contrary to what was expected, the anthocyanin concentrations of RAH2 wines of the three
cultivars were similar to those of their controls (CH2). Theoretically, the extraction of some of
the grape juice and the replacement by the low-alcohol wine should remove some of the
anthocyanins, specifically those extracted during the crushing process and also the anthocyanins
solved during the short time of skin contact. It has also been reported that higher ethanol content
favors anthocyanin extraction throughout skin contact (Canals et al. 2005).
UNIVERSITAT ROVIRA I VIRGILI GRAPE PHENOLIC MATURITY; DETERMINATION METHODS AND CONSEQUENCES ON WINE PHENOLIC COMPOSITION Nikolaos Kontoudakis ISBN:978-84-693-7682-9/DL:T-1754-2010

nn
Results (iii)
119
One possible explanation for these paradoxical results may be due to the lower pH values of
RAH2 wines. A lower pH may favor anthocyanin extraction during winemaking compensating
the positive effect of ethanol. A lower pH may also protect anthocyanins against oxidation by
means of two mechanisms: it shifts the equilibrium of anthocyanins from carbinol towards to the
formation of flavylium cation (Glories, 1984a) and it inhibits the polyphenol oxidase activity of
the grape juice (Rapeanu et al. 2006).
Cultivar ParametersH1 H2
CH2 RAH2
Cabernet Sauvignon
Anthocyanidin-3-monoglucosides 131.9 ± 11.9a 184.7 ± 12.5b 191.5 ± 21.0b
Acetylated anthocyanidins 46.7 ± 6.4a 66.5 ± 4.5b 69.1 ± 8.1b
p-Coumaroylanthocyanidins 6.5 ± 1.7a 11.0 ± 0.6b 11.0 ± 1.1b
Total anthocyanins 185.1 ± 32.5a 262.2 ± 17.8b 271.7 ± 30.5b
Merlot
Anthocyanidin-3-monoglucosides 135.7 ± 13.9a 187.0 ± 20.2b 201.9 ± 4.2b
Acetylated anthocyanidins 42.3 ± 4.5a 47.9 ± 3.2ab 49.2 ± 1.2b
p-Coumaroylanthocyanidins 13.4 ± 2.0a 17.5 ± 1.1b 19.3 ± 0.4c
Total anthocyanins 191.4 ± 20.2a 252.4 ± 24.7b 270.5 ± 4.8b
Bobal
Anthocyanidin-3-monoglucosides 241.7 ± 21.1a 293.1 ± 15.2b 320.6 ± 45.6b
Acetylated anthocyanidins 18.5 ± 1.0a 18.9 ± 0.7a 19.7 ± 2.1a
p-Coumaroylanthocyanidins 18.4 ± 2.2a 22.5 ± 1.5b 24.1 ± 3.0b
Total anthocyanins 278.6 ± 24.4a 334.5 ± 17.5b 364.4 ± 51.0b
Table 2. Concentration of anthocyanins (mg /L) determined by HPLC.
H1: first harvest, H2: second harvest, CH2: control wines of H2, RAH2: reduced alcohol wines from H2. All data are expressed asthe average of the three replicates ± standard deviation (n = 3). Statistical analysis: one-factor ANOVA and Scheffe´s test (both p <0.05). Different letters indicate the existence of statistically significant differences.
Color intensity and CIELab coordinates are shown in Table 3. In the three cultivars the color
intensity, and C* of the CH2 wines were higher and the L* lower than the equivalent values of
the corresponding H1 wines. Other authors have found similar results (Canals et al 2005,
Gambuti et al. 2007), which confirms that the riper grapes generally produce more intensely
colored wines.
On the other hand, the Merlot and Bobal RAH2 wines showed higher color intensity, and C*
and lower L* than their corresponding controls (H2) although the anthocyanin concentrations of
Cabernet Sauvignon and Bobal were similar. The same trend was observed with Cabernet
Sauvignon wines although the results were not statistically significant. Therefore, the more
intense color of all RAH2 wines was probably because the lower pH of RAH2 wines increased
UNIVERSITAT ROVIRA I VIRGILI GRAPE PHENOLIC MATURITY; DETERMINATION METHODS AND CONSEQUENCES ON WINE PHENOLIC COMPOSITION Nikolaos Kontoudakis ISBN:978-84-693-7682-9/DL:T-1754-2010

nn
Results (iii)
120
the proportion of the anthocyanins’ flavylium cation (Glories 1984a). Indeed, the changes in
color parameters were greater in Merlot and even more so in Bobal because the alcohol decrease
was greater, which led to a considerable decrease in the pH. Another possible cause is that a
lower concentration of ethanol in the RAH2 wines favors copigmentation (Canals et al. 2005).
Cultivar ParametersH1 H2
CH2 RAH2
Cabernet Sauvignon
CI 9.3 ± 0.8a 12.6 ± 0.5b 13.9 ± 2.3b
C* 44.54 ± 1.13a 58.54 ± 0.66b 60.63 ± 2.47b
L* 42.19 ± 2.62a 48.50 ± 3.12b 47.37 ± 5.72b
h* 1.97 ± 0.67a 2.78 ± 0.98a 2.73 ± 1.36a
a* 36.21±1.45a 58.44 ± 0.63b 60.26 ± 2.13b
b* 0.69 ±0.47a 3.39 ± 0.52b 2.79 ± 1.42b
Merlot
CI 8.7 ± 0.9a 12.6 ± 1.5b 17.0 ± 1.9c
C* 55.57 ± 2.64a 59.06 ± 1.65b 66.57 ± 1.42c
L* 60.27 ± 2.80a 50.70 ± 5.00b 42.17 ± 2.57c
h* 2.83 ± 0.75a 7.47 ± 1.66b 15.04 ± 2.73c
a* 55.50 ± 2.60a 58.44 ± 1.41a 63.89 ± 0.64b
b* 2.76 ± 0.84a 7.48 ± 2.08b 17.30 ± 3.41c
Bobal
CI 10.6 ± 1.4a 15.8 ± 0.8b 22.9 ± 1.7c
C* 57.08 ± 1.56a 59.28 ± 0.20b 67.38 ± 1.23c
L* 52.33 ± 4.06a 36.63 ± 1.42b 34.05 ± 1.06c
h* 1.67 ± 0.08a 9.92 ± 0.86b 17.88 ± 1.39c
a* 56.19 ± 0.57a 58.39 ± 0.05b 63.62 ± 0.66c
b* 1.60 ± 0.14a 10.22 ± 0.91b 24.76 ± 3.05c
Table 3. Color Intensity and ClELab coordinates.
H1: first harvest, H2: second harvest, CH2: control wines of H2, RAH2: reduced alcohol wines from H2. All dataare expressed as the average of the three replicates ± standard deviation (n = 3). Statistical analysis: one-factorANOVA and Scheffe´s test (both p < 0.05). Different letters indicate the existence of statistically signif icantdifferences.
However, for winemakers it is much more important to know whether the human eye can really
distinguish between the colors of two wines, than whether there are statistically significant
differences between these parameters. Consequently, the total color differences (∆Eab*) were
calculated (Table 4) in order to determine if the human eye is really capable of distinguishing
between the different wines. The human eye can generally distinguish two colors when ∆Eab* ≥
1 (Pérez-Magariño and González-Sanjose 2003). However, it is also generally accepted that
UNIVERSITAT ROVIRA I VIRGILI GRAPE PHENOLIC MATURITY; DETERMINATION METHODS AND CONSEQUENCES ON WINE PHENOLIC COMPOSITION Nikolaos Kontoudakis ISBN:978-84-693-7682-9/DL:T-1754-2010

nn
Results (iii)
121
tasters can only distinguish the color of two wines through the glass when ∆Eab* ≥ 5 units
(Pérez-Magariño and González-Sanjose 2003). In fact, the differences that can be distinguished
by the human eye also depend on the color intensity, because discriminating capacity is less
accurate when color perception reaches saturation level. In our experimental conditions, the
differences in ∆Eab* between H1 wines and all their corresponding H2 wines (CH2 and RAH2)
were greater than 5 units. Therefore, it can be conclude that all the H2 wines could be clearly
distinguished from their corresponding H1 wines with the naked eye. The differences in ∆Eab*
between RAH2 and CH2 wines of Merlot and Bobal were also greater than 5 units, indicating
that the differences in color were sufficiently large to be distinguished by the human eye. In the
case of Cabernet Sauvignon, the difference in ∆Eab* between RAH2 and CH2 wines was only
3.9, probably because the alcohol reduction and consequently the decrease in its pH were lower
than in the other cultivars.
Cultivar H1 vs CH2 H1 vs RAH2 H2 vs RAH2
CabernetSauvignon
22.6 ± 0.8 24.7 ± 1.9 3.9 ± 1.4
Merlot 11.8 ± 3.0 25.3 ± 2.1 16.3 ± 1.4
Bobal 14.9 ± 1.9 25.6 ± 3.8 13.6 ± 3.9
Table 4. Total color differences (∆Eab*) amongwines.
H1: first harvest, H2: second harvest, CH2: control wines of H2, RAH2: reduced alcoholwines from H2. All data are expressed as the average of the three replicates ± standarddeviation (n = 3).
The total phenolic compounds, proanthocyanidin concentration, measured by precipitation with
methyl-cellulose, and the astringency index are shown in Table 5. The total phenolic indexes
(TPI), proanthocyanidin concentrations and the astringency indexes of all the H2 wines were
significantly higher than their corresponding H1 wines. This data confirms that the riper grapes
produced the more tannic wines. Other authors have found similar results (Llaudy et al., 2008,
Kennedy et al. 2002). On the other hand, the proanthocyanidin concentrations of the RAH2
wines from the three cultivars were similar to those of their corresponding CH2 wines,
indicating that replacing part of their grape juice by low-alcohol wine had not affected their
tannicity. However some small differences were detected in the TPI and astringency index.
UNIVERSITAT ROVIRA I VIRGILI GRAPE PHENOLIC MATURITY; DETERMINATION METHODS AND CONSEQUENCES ON WINE PHENOLIC COMPOSITION Nikolaos Kontoudakis ISBN:978-84-693-7682-9/DL:T-1754-2010
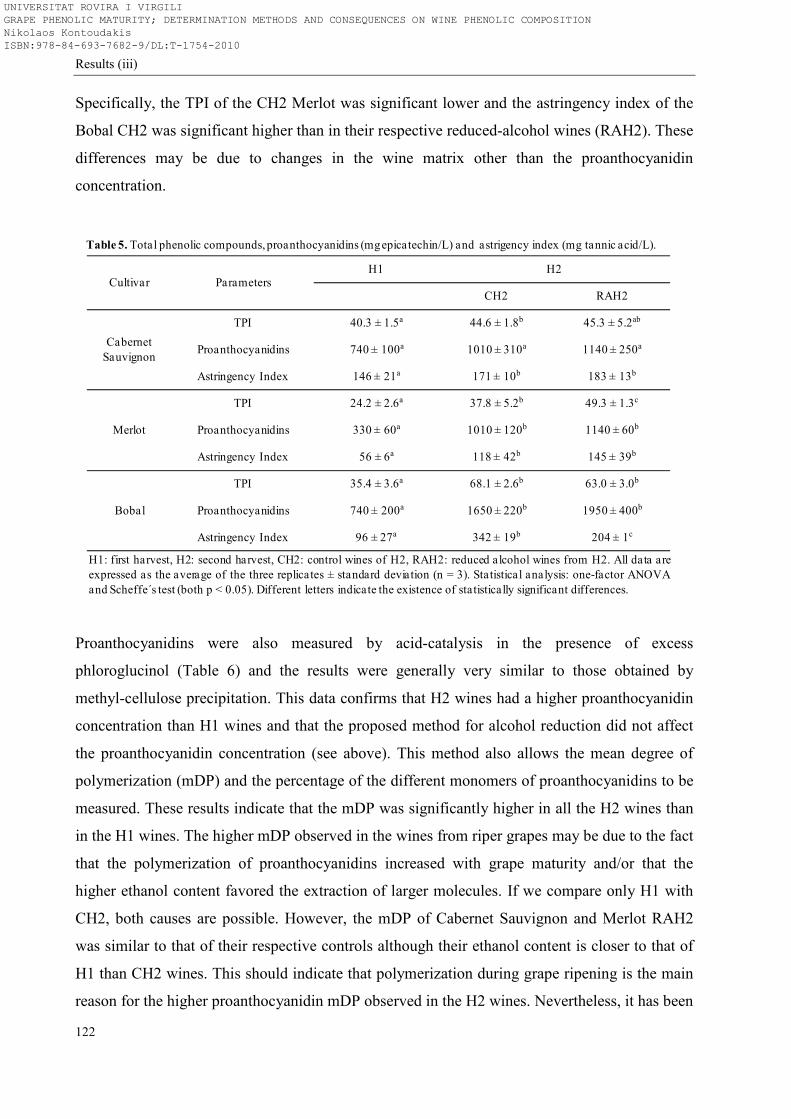
nn
Results (iii)
122
Specifically, the TPI of the CH2 Merlot was significant lower and the astringency index of the
Bobal CH2 was significant higher than in their respective reduced-alcohol wines (RAH2). These
differences may be due to changes in the wine matrix other than the proanthocyanidin
concentration.
Cultivar ParametersH1 H2
CH2 RAH2
Cabernet Sauvignon
TPI 40.3 ± 1.5a 44.6 ± 1.8b 45.3 ± 5.2ab
Proanthocyanidins 740 ± 100a 1010 ± 310a 1140 ± 250a
Astringency Index 146 ± 21a 171 ± 10b 183 ± 13b
Merlot
TPI 24.2 ± 2.6a 37.8 ± 5.2b 49.3 ± 1.3c
Proanthocyanidins 330 ± 60a 1010 ± 120b 1140 ± 60b
Astringency Index 56 ± 6a 118 ± 42b 145 ± 39b
Bobal
TPI 35.4 ± 3.6a 68.1 ± 2.6b 63.0 ± 3.0b
Proanthocyanidins 740 ± 200a 1650 ± 220b 1950 ± 400b
Astringency Index 96 ± 27a 342 ± 19b 204 ± 1c
H1: first harvest, H2: second harvest, CH2: control wines of H2, RAH2: reduced alcohol wines from H2. All data areexpressed as the average of the three replicates ± standard deviation (n = 3). Statistical analysis: one-factor ANOVAand Scheffe´s test (both p < 0.05). Different letters indicate the existence of statistically significant differences.
Table 5. Total phenolic compounds, proanthocyanidins (mg epicatechin/L) and astrigency index (mg tannic acid/L).
Proanthocyanidins were also measured by acid-catalysis in the presence of excess
phloroglucinol (Table 6) and the results were generally very similar to those obtained by
methyl-cellulose precipitation. This data confirms that H2 wines had a higher proanthocyanidin
concentration than H1 wines and that the proposed method for alcohol reduction did not affect
the proanthocyanidin concentration (see above). This method also allows the mean degree of
polymerization (mDP) and the percentage of the different monomers of proanthocyanidins to be
measured. These results indicate that the mDP was significantly higher in all the H2 wines than
in the H1 wines. The higher mDP observed in the wines from riper grapes may be due to the fact
that the polymerization of proanthocyanidins increased with grape maturity and/or that the
higher ethanol content favored the extraction of larger molecules. If we compare only H1 with
CH2, both causes are possible. However, the mDP of Cabernet Sauvignon and Merlot RAH2
was similar to that of their respective controls although their ethanol content is closer to that of
H1 than CH2 wines. This should indicate that polymerization during grape ripening is the main
reason for the higher proanthocyanidin mDP observed in the H2 wines. Nevertheless, it has been
UNIVERSITAT ROVIRA I VIRGILI GRAPE PHENOLIC MATURITY; DETERMINATION METHODS AND CONSEQUENCES ON WINE PHENOLIC COMPOSITION Nikolaos Kontoudakis ISBN:978-84-693-7682-9/DL:T-1754-2010

nn
Results (iii)
123
reported than ethanol plays a non-negligible role in the proanthocyanidin extraction (Canals et
al. 2005) and the results obtained seem to confirm this. In this regard, the proanthocyanidin
concentration, measured by phoroglucinolysis, of all RAH2 wines tended to be lower than that
of their respective controls although it was only significant in the case of Merlot. Moreover, the
mDP of RAH2 Bobal wine was slightly but significantly lower than its respective CH2. RAH2
Bobal wine was precisely the sample in which alcohol was most drastically reduced (3%) and it
is quite logical that this difference hinders the extraction of larger molecules. In the other
cultivars, the difference in ethanol content was not so important and therefore the differences in
mDP were not significant.
Cultivar ParametersH1 H2
CH2 RAH2
Cabernet Sauvignon
Proanthocyanidins (mg/L) 703.6 ± 31.3a 1104 ± 183.4b 940.1 ± 197.8b
mDP 4.35 ± 0.09a 6.54 ± 0.20b 6.34 ± 0.14b
(+)-Catechin (%) 18.6 ± 0.4a 12.4 ± 0.5b 13.1 ± 0.4b
(-)-Epicatechin (%) 56.2 ± 1.5a 54.6 ± 1.2a 55.0 ± 0.7a
(-)-Epicatechin-3-O-gallate (%) 4.5 ± 0.1a 4.8 ± 0.4a 4.3 ± 0.2a
(-)-Epigallocatechin (%) 20.5 ± 0.9a 28.2 ± 0.1b 28.4 ± 0.7b
Merlot
Proanthocyanidins (mg/L) 427.0 ± 115.5a 1070.1 ± 17.2b 969.9 ± 41.4c
mDP 2.72 ± 0.13a 4.80 ± 1.84b 4.43 ± 0.36b
(+)-Catechin (%) 26.2 ± 2.2a 21.8 ± 1.4b 19.0 ± 2.1b
(-)-Epicatechin (%) 57.8 ± 0.7a 57.6 ± 0.1a 57.6 ± 1.9a
(-)-Epicatechin-3-O-gallate (%) 4.4 ± 0.4a 4.9 ± 0.2b 5.7 ± 0.3c
(-)-Epigallocatechin (%) 11.6 ± 1.3a 16.5 ± 0.6b 17.7 ± 0.7b
Bobal
Proanthocyanidins (mg/L) 761.4 ± 54.0a 1648.3 ± 38.0b 1573.5 ± 78.6b
mDP 6.60 ± 0.14a 9.54 ± 0.30b 8.77 ± 0.34c
(+)-Catechin (%) 18.9 ± 0.3a 11.3 ± 0.6b 13.2 ± 1.1c
(-)-Epicatechin (%) 54.5 ± 0.8a 60.4 ± 0.3b 57.5 ± 1.0c
(-)-Epicatechin-3-O-gallate (%) 3.2 ± 0.1a 3.6 ± 0.3a 3.6 ± 0.3a
(-)-Epigallocatechin (%) 23.3 ± 1.0a 24.7 ± 0.5b 25.6 ± 0.2b
H1: first harvest, H2: second harvest, CH2: control wines of H2, RAH2: reduced alcohol wines from H2. All data areexpressed as the average of the three replicates ± standard deviation (n = 3). Statistical analysis: one-factor ANOVA andScheffe´s test (both p < 0.05). Different letters indicate the existence of statistically significant differences.
Table 6. HPLC Analysis of Total Proanthocyanidins and Related Parameters Following Acid –Catalysis in the Presentof Excess Phloroglucinol.
On the other hand, grape ripening also affected the proportion of the different proanthocyanidin
monomers. Specifically, the proportion of (+)-catechin significantly decreased and the
proportion of (-)-epigallocatechin significantly increased in the three cultivars throughout
UNIVERSITAT ROVIRA I VIRGILI GRAPE PHENOLIC MATURITY; DETERMINATION METHODS AND CONSEQUENCES ON WINE PHENOLIC COMPOSITION Nikolaos Kontoudakis ISBN:978-84-693-7682-9/DL:T-1754-2010

nn
Results (iii)
124
maturation. In contrast, the proportions of (-)-epicatechin and (-)-epicatechin-3-O-gallate
remained almost unchanged. Only slight but significant fluctuations were detected. In particular,
the proportion of (-)-epicatechin-3-O-gallate in Merlot and the proportion of (-)-epicatechin in
Bobal tended to increase with maturation.
Since epigallocatechin is only present in skin proanthocyanidins (Souquet et al. 1996) the
changes in the proportion of this monomer in the three cultivars seems to indicate that the
contribution of skins to the wine proanthocyainidin concentration increases when the grapes are
riper.
Only slight differences were found in the proanthocyanidin monomer proportion between the
reduced-alcohol wines (RAH2) and their respective controls (CH2). In fact their compositions
were very much closer to CH2 wines than to H1 wines, which indicate that grape ripening has a
greater influence on wine proanthocyanin composition than other factors such as ethanol content
or pH.
Table 7. Sensory analysis (triangular test)
H1: first harvest, H2: second harvest, CH2: control wines of H2, RAH2: Reduced Alcohol
wines from H2. n.s: non significant.
CultivarsTriangular
testPositive
identificationsp
Preferences
Flavor Taste
Cabernet Sauvignon
H1 vs CH2 7/10 0.05 2/5 1/6
H1 vs RAH2 5/10 ns 1/4 2/3
CH2 vs RAH2 4/10 ns 2/2 3/1
Merlot
H1 vs CH2 7/10 0.05 1/6 2/5
H1 vs RAH2 7/10 0.05 3/4 3/4
CH2 vs RAH2 3/10 ns 2/1 1/2
Bobal
H1 vs CH2 8/10 0.005 2/6 7/1
H1 vs RAH2 9/10 0.001 4/5 8/1
CH2 vs RAH2 9/10 0.001 4/5 9/0
The sensory triangular tests were carried out by comparing the three wines of each cultivar by
pairs (Table 7). As it was quoted above, the color differences among wines were in some cases
so evident that all sensory analyses were done in dark glasses. It is well known that color has a
non-negligible effect on the sensory appreciation of flavor and texture (Norton and Johnson,
UNIVERSITAT ROVIRA I VIRGILI GRAPE PHENOLIC MATURITY; DETERMINATION METHODS AND CONSEQUENCES ON WINE PHENOLIC COMPOSITION Nikolaos Kontoudakis ISBN:978-84-693-7682-9/DL:T-1754-2010
nn
Results (iii)
125
1987; Stillman, 1993). Therefore, using dark glasses, the highlighted differences could be
attributed to flavors and/or mouth sensation, without color interfering. Tasters were able to
significantly distinguish the wines of the first harvest from the controls of the second one. As
was expected due that H1 grapes were in all the cases less ripe than CH2 grapes. Consequently,
the differences in ethanol content, acidity, and polyphenols composition between these wines
were noticeable. In the case of Cabernet Sauvignon and Merlot, tasters preferred CH2 wines
than H1, by both nose and mouth sensations. The results from Bobal evaluation were less clear.
In fact, tasters appreciated the riper flavor of CH2 wines but they preferred H1 in mouth,
probably by the excessive alcohol content in CH2 samples which made them too aggressive in
the palate.
Tasters were also able to distinguish between H1 and RAH2 wines in the case of Merlot and
Bobal but they were unable to differentiate between Cabernet Sauvignon H1 and RAH2 wines.
That is also logical because the differences in maturity of Cabernet Sauvignon grapes from the
first and the second harvest were lower than in the case of the other two cultivars. In fact,
analytically RAH2 and H1 wines of Cabernet are more similar than the other equivalent pairs
(Tables 1 to 6). On the other hand, Cabernet Sauvignon RAH2 was the sample in which the
addition of low-alcohol wine was the lowest. The preferences of the tasters have not sense in the
case of Cabernet sauvignon inasmuch as they did not differentiate the wines. However, they
preferred by slight majority the CH2 than H1 wines, by their aroma complexity, of both Merlot
and Bobal cultivar; as well in the case of CH2 Merlot wines tasting sensations were appreciated.
In apparently contradiction, tasters’ preference by H1 than RAH2 Bobal wine could be justified
by the excessive acidity provided by the addition of the low alcohol wine into RAH2 wine.
Finally, tasters were able to distinguish between CH2 and RAH2 wines only for Bobal cultivar;
unexpectedly, the panel was not able to differentiate these wines for the other two cultivars. It is
clear that RAH2 and CH2 of Bobal were very different because it was the experiment in which
the addition of low-alcohol wine was higher. In fact, RAH2 wine was actually very acidic and
almost all panelists can distinguish it. However, in the case of Cabernet Sauvignon and Merlot,
although the differences in the ethanol content were quite high, the other analytical parameters
were not so different and in most of the cases minor than the differences between H1 and CH2.
Since tasters were unable to distinguish between CH2 and RH2 wines of Cabernet and Merlot,
the preferences are meaningless. In the case of Bobal, tasters preferred by slight majority the
aroma of RAH2 wine, but in contrast all of them preferred the CH2 by palate sensations. This
clear preference was very likely due to the excessive acidity of the RAH2 wine. That is a main
UNIVERSITAT ROVIRA I VIRGILI GRAPE PHENOLIC MATURITY; DETERMINATION METHODS AND CONSEQUENCES ON WINE PHENOLIC COMPOSITION Nikolaos Kontoudakis ISBN:978-84-693-7682-9/DL:T-1754-2010

nn
Results (iii)
126
consideration to take into account in future experiences because it should be prevented that the
reduction of alcohol content do not produces an excessive acidification of wine.
It can be concluded then that the proposed procedure may be useful for partially reduction of
alcohol content and simultaneously decreasing pH of wines. The color of the reduced-alcohol
wines obtained was better than their corresponding controls and their phenolic composition was
similar. Moreover, the procedure proposed in this paper does not require specific equipments
and is very easy to apply in standard wineries. Further experimentation is needed to better adapt
the process to obtain more balanced wines without the problems of excess alcohol and high pH.
Acknowledgments
We thank CICYT (AGL2007-66338) and CDTI (Project CENIT Demeter) for financial support.
References
Ayala, F., Echávarri, J. F. and Negueruela, A. I. (1997) A new simplified method for measuring
the color of wines I. Red and rose wines. American Journal of Enology and Viticulture, 48,
357-363.
Ayala, F., Echávarri, J. F. and Negueruela, A. I. (2001)
http://www.unizar.es/negueruela/MSCVes.zip.
Bautista-Ortín, A.B., Fernández-Fernández, J.I., López Roca, J.M. and Gómez Plaza, E. (2006)
The effect of grape ripening stage on red wine color. Journal International des Sciences de la
Vigne et du Vin 40, 15–24.
Beech, F.W., Burroughs, L.F., Timberlake, C.F. and Whiting, G.C. (1979) Progres recents sur
l’aspect chimique et antimicrobienne de l’anhidride sulfureux. Bulletin de l’OIV 52, 1001-
1022.
Bisson, L.F. (1999) Stuck and sluggish fermentations. American Journal of Enology and
Viticulture 50, 107-119.
Bonorden, W.R., Nagel, C.W., Powers, J.R. (1986) The adjustment of high pH/high titratable
acidity wines by ion exchange. American Journal of Enology and Viticulture 37, 143-148.
UNIVERSITAT ROVIRA I VIRGILI GRAPE PHENOLIC MATURITY; DETERMINATION METHODS AND CONSEQUENCES ON WINE PHENOLIC COMPOSITION Nikolaos Kontoudakis ISBN:978-84-693-7682-9/DL:T-1754-2010

nn
Results (iii)
127
Bui, K., Dick, R., Moulin, G. and Galzy, P. (1986) A Reverse Osmosis for the Production of
Low Ethanol Content Wine. American Journal of Enology and Viticulture 37, 297-300.
Canals, R., Llaudy, M. C., Valls, J., Canals, J. M and Zamora, F. (2005) Influence of Ethanol
Concentration on the Extraction of Color and Phenolic Compounds from the Skin and Seeds
of Tempranillo Grapes at Different Stages of Ripening. Journal of Agricultural and Food
Chemistry 53, 4019-4025.
Ciani, M. and Ferraro, L. (1996) Enhanced Glycerol Content in Wines Made with Immobilized
Candida stellata Cells. Applied and environmental microbiology 62, 128–132.
Dequin, S. and Barre, P. (1994) Mixed lactic acid-alcoholic fermentation by Saccharomyces
cerevisiae expressing the Lactobacillus casei L(+)-LDH. Nature Biotechnology 12, 173–177.
Diban, N., Athes, V., Bes, M. and Souchon, I. (2008) Ethanol and aroma compounds transfer
study for partial dealcoholization of wine using membrane contactor. Journal of membrane
science 311, 136-146.
Duchêne, E. and Schneider, C. (2005) Grapevine and climatic changes: a glance at the situation
in Alsace. Agronomy for Sustainable Development 24, 93-99.
Fischer, U. and Noble, A.C. (1994) The effect of ethanol, catechin concentration, and pH on
sourness and bitterness of wine. American Journal of Enology and Viticulture 45, 6-10.
Fournand, D., Vicens, A., Sidhoum, L., Souquet, J.-M., Moutounet, M. and Cheynier., V. (2006)
Accumulation and extractability of grape skin tannins and anthocyanins at different advanced
physiological stages, Journal of Agriculture and Food Chemistry 54, 7331-7338.
Gambuti, A., Strollo, D., Lecce, L. and Moio, L. (2007) The effect of grape ripeness stages on
polyphenol content of aglianico (Vitis vinifera L.) wine aged for two years. Acta
Horticulturae 754, 449-456.
Glories, Y. (1984a) La couleur des vins rouges. 1ère partie: Les equilibres des anthocyanes et
des tanins. Connaisance Vigne Vin, 18, 195-217.
Glories, Y. (1984b) La couleur des vins rouges. 2ème partie: Mesure, origine et interpretation
Connaisance Vigne Vin, 18, 253-271.
González-San José, M., Diez, C., Santa María, G. and Garrido, J.L. (1988) Análisis por
cromatografía líquida de alta eficacia de los pigmentos antociánicos de uvas de Vitis vinifera
L. Anales de Química 84, 290–293.
Jackson, R.S. (2002) Quantitative (technical) wine assessment. In: Wine Tasting. A Professional
Hand Book. Ed. R.S. Jackson (Academic Press: Birlighton) pp. 113-186.
UNIVERSITAT ROVIRA I VIRGILI GRAPE PHENOLIC MATURITY; DETERMINATION METHODS AND CONSEQUENCES ON WINE PHENOLIC COMPOSITION Nikolaos Kontoudakis ISBN:978-84-693-7682-9/DL:T-1754-2010

nn
Results (iii)
128
Jones, G.V., White, M.A. and Cooper, O.R. (2005) Climate change and global wine quality.
Climatic Change 73, 319-343.
Kennedy, J. A. and Jones, G.P. (2001) Analysis of proanthocyanidins cleavage products
following acid-catalysis in the presence of excess phloroglucinol. Journal of Agricultural and
Food Chemistry 49, 1740-1746.
Kennedy, J.A., Matthews, M.A. and Waterhouse, A.L. (2002) Effect of Maturity and Vine
Water Status on Grape Skin and Wine Flavonoids. American Journal of Enology and
Viticulture 53, 268-274.
Kenny, G.H. and Harrison, P.A. (1993) The effects of climatic variability and change on grape
suitability in Europe. Journal of Wine Research 4, 163-183.
Llaudy, M.C., Canals, R., Canals, J.M., Rozes, N., Arola, Ll. and Zamora, F. (2004) New
method for evaluating astringency in red wine. Journal of Agricultural and Food Chemistry
52, 742-746.
Llaudy, M.C., Canals, R., Canals, J.M. and Zamora, F. (2008) Influence of ripening stage and
maceration length on the contribution of grape skins, seeds and stems to phenolic
composition and astringency in a wine simulated macerations. European Food Research and
Technology 226, 337-344.
Malherbe, D.F., du Toit, M., Cordero Otero, R.R., van Rensburg, P. and Pretorius, I.S. (2003)
Expression of the Aspergillus niger glucose oxidase gene in Saccharomyces cerevisiae and
its potential applications in wine production. Applied Microbiology and Biotechnology 61,
502–511.
Norton, W.E. and Johnson, F.P. (1987) The influence of intensity of color on perceived flavor
characteristics. Medical Science Research: Psychology and Psychiatry 15, 329-330.
O.I.V. (Organización Internacional de la Viña y el Vino) (2005) Le recueil des méthodes
internationales d’analyse des vins et des moûts, vols I-II, Sect 3.
O´-Marques, J., Reguinga, R., Laureano, O. and Ricardo-da-Silva, J.M. (2005) Changes in grape
seed, skins and pulp condensed tannins during berry ripening: effect of fruit pruning. Ciência
Tècnica Vitivinicola 20 35–52.
Pérez-Magariño, S. and González-Sanjose, M.L. (2003) Application of absorbance values used
in wineries for estimating CIELAB parameters in red wines. Food Chemistry 81, 301–306.
UNIVERSITAT ROVIRA I VIRGILI GRAPE PHENOLIC MATURITY; DETERMINATION METHODS AND CONSEQUENCES ON WINE PHENOLIC COMPOSITION Nikolaos Kontoudakis ISBN:978-84-693-7682-9/DL:T-1754-2010

nn
Results (iii)
129
Peyrot des Gachons, C. and Kennedy, J.A. (2003) Direct method determining seed and skin
proanthocyanidin extraction into red wine. Journal of Agricultural and Food Chemistry 51,
5877–5881.
Pickering, G.J., Heatherbell, D.A. and Barnes, M.F. (1998) Optimising glucose conversion in
the production of reduced alcohol wine using glucose oxidase. Food Research International
31, 685-692.
Pickering, G.J., Heatherbell, D.A. and Barnes, M.F. (1999) The production of reduced-alcohol
wine using glucose oxidase treated juice. Part I. Composition. American Journal of Enology
and Viticulture 50, 291-298.
Pickering, G.J. (2000) Low- and Reduced-alcohol Wine: A Review. Journal of Wine Research
11, 129–144.
Rapeanu, G., Van Loey, A., Smout, S. and Hendrickx, M. (2006) Biochemical characterization
and process stability of polyphenoloxidase extracted from Victoria grape (Vitis vinifera ssp.
Sativa) Food Chemistry 94, 253-261.
Ribereau-Gayon, P., Glories, Y., Maujean, A. and Dubourdieu, D. (2006) Phenolic Compounds
In: Handbook of enology, Vol 2: The chemistry of wine stabilization and treatments. Ed. P.
Ribéreau-Gayon (John Wiley & Sons Ltd: Chichester) pp. 141-204.
Ruiz-Rodrigueza, A., Fornarib, T., Hernándezb, E.J., Señoransb, F.J. and Reglerob, G. (2010)
Thermodynamic modeling of dealcoholization of beverages using supercritical CO2:
Application to wine samples. The Journal of Supercritical Fluids
doi:10.1016/j.supflu.2009.12.011
Romeyer, F. M., Macheix, J. J. and Sapis, J. C. (1986) Changes and importance of oligomeric
procyanidins during maturation of grape seed. Phytochemistry 25, 219–221.
Ryan, J.M. and Revilla, E. (2003) Anthocyanin composition of Cabernet Sauvignon and
Tempranillo grapes at different stages of ripening. Journal of Agricultural and Food
Chemistry 51, 3372–3378.
Sarneckis, C.J., Dambergs, R.G., Jones, P., Mercurio, M., Herderich, M.J. and Smith, P.A.
(2006) Quantification of condensed tannins by precipitationwith methyl cellulose:
development and validation of an optimised tool for grape and wine analysis. Australian
Journal of Grape and Wine Research 12, 39-49.
Schultz, H. R. (2000) Climate change and viticulture; a European perspective on climatology,
carbon dioxide and UV-B effects. Australian Journal of Grape and Wine Research, 6, 2-12.
UNIVERSITAT ROVIRA I VIRGILI GRAPE PHENOLIC MATURITY; DETERMINATION METHODS AND CONSEQUENCES ON WINE PHENOLIC COMPOSITION Nikolaos Kontoudakis ISBN:978-84-693-7682-9/DL:T-1754-2010
nn
Results (iii)
130
Souquet, J. M., Cheynier, V., Brossaud, F. and Moutounet, M. (1996) Polimeric
Proanthocyanidins from grape skins. Phytochemistry 43, 509–512.
Stillman, J.A. (1993) Color influences flavor identification in fruit flavored beverages. Journal
of Food Science 58, 810-812.
Sykes, S.J., Casimir, D.J. and Prince, R.G.H. (1992) Recent advances in spinning cone column
technology. Food Australia 44, 462-464.
Takács,L., Vatai, G. and Korány, K. (2007) Production of alcohol free wine by pervaporation,
Journal of Food Engineering 78, 118-125.
Tate, A.B. (2001) Global warming's impact on wine. Journal of Wine Research 12, 95-109.
Walker, T., Morris, J., Threlfall, R. and Main G. (2004) Quality, sensory and cost comparison
for pH reduction of syrah wine using ion exchange or tartaric acid. Journal of Food Quality
27, 483–496.
Williams, A.A. (1972) Flavour effects of ethanol in alcoholic beverages. Flavour Industry 3, 604
607.
Zamora, F. (2003) Factores que determinan la composición en compuestos fenólicos de la uva.
In: Elaboración y crianza del vino tinto: Aspectos científicos y prácticos Ed. A. Madrid
(AMV ediciones: Madrid) pp. 70-88.
Zamora, F. (2005) El cambio climático: una amenaza para nuestra viticultura. Enólogos 39, 28-
31.
UNIVERSITAT ROVIRA I VIRGILI GRAPE PHENOLIC MATURITY; DETERMINATION METHODS AND CONSEQUENCES ON WINE PHENOLIC COMPOSITION Nikolaos Kontoudakis ISBN:978-84-693-7682-9/DL:T-1754-2010
nn
iv. Influence of wine pH in the changes of color and polyphenol
composition induced by micro-oxygenation
Nikolaos Kontoudakis, Elena González, Mariona Gil, Mireia Esteruelas, Francesca Fort, Joan
Miquel Canals, Fernando Zamora
Departament de Bioquímica i Biotecnologia, Facultat d’Enologia de Tarragona, Universitat
Rovira i Virgili, Campus de Sescelades, C/ Marcel.li Domingo, s/n. 43007-Tarragona, Spain.
To be submited to Journal of Agricultural and Food Chemistry.
UNIVERSITAT ROVIRA I VIRGILI GRAPE PHENOLIC MATURITY; DETERMINATION METHODS AND CONSEQUENCES ON WINE PHENOLIC COMPOSITION Nikolaos Kontoudakis ISBN:978-84-693-7682-9/DL:T-1754-2010

nn
UNIVERSITAT ROVIRA I VIRGILI GRAPE PHENOLIC MATURITY; DETERMINATION METHODS AND CONSEQUENCES ON WINE PHENOLIC COMPOSITION Nikolaos Kontoudakis ISBN:978-84-693-7682-9/DL:T-1754-2010

nn
Results (iv)
133
Abstract
The presence of oxygen in red wine leads to the transformation of ethanol into ethanal which
after capturing a proton will react with flavanols to start the process of formation of ethyl
bridges. Wine pH also conditions the equilibrium among the different anthocyanin structures
and may consequently affect anthocyanins reactivity. Consequently, the aim of this paper was to
study how the pH can affect the changes induced by micro-oxygenation in two wines with
different phenolic composition. The differences observed in micro-oxygenation wines in
comparison to their controls were, in general, greater when the pH was more acidic.
Specifically, the differences found in color intensity, anthocyanin concentration, PVPP Index,
ethyl-linked pigments, type B vitisins, polymeric pigments and ethylidene-bridged flavanols
between micro-oxygenated wines and their corresponding controls were higher at lower pH. On
the contrary, the effects of micro-oxygenation when the pH was less acidic were much smaller
and sometimes practically nonexistent.
Keywords: Wine, pH, phenolic compounds, color, micro-oxygenation
UNIVERSITAT ROVIRA I VIRGILI GRAPE PHENOLIC MATURITY; DETERMINATION METHODS AND CONSEQUENCES ON WINE PHENOLIC COMPOSITION Nikolaos Kontoudakis ISBN:978-84-693-7682-9/DL:T-1754-2010

nn
Results (iv)
134
Introduction
Phenolic compounds are one of the main determinants of the quality of red wines.
Anthocyanins, which are the main responsible of the color of red wine, are extracted from grape
skins during the maceration and fermentation processes. Other phenolic compounds, present in
skins and seeds, are also extracted. Among these compounds, proanthocyanidins, also known as
condensed tannins, are the main determinant of texture sensations such as body, bitterness and
astringency (1-3). The molecular size and monomeric composition of proanthocyanidins seem to
be related to the sensation of astringency: the greater the degree of polymerization and the
greater the percentage of galloylation, the greater is the sensation of astringency (3,4).
During winemaking and aging, phenolic compounds undergo progressive structural changes
with an undoubted influence in wine organoleptic characteristics. In particular, anthocyanins,
which are unstable, present a high chemical reactivity giving rise to new more stable pigments.
Different mechanisms have been proposed to explain the formation of new pigments. Some of
them imply the direct condensation of anthocyanins and flavanols without the participation of
oxygen (5-7). But probably, the reactions in which oxygen is involved have utmost importance.
During winemaking and aging, the presence of small quantities of oxygen leads to the formation
of ethanal from ethanol. The ethanal can in turn react with flavanols to induce the formation of a
very reactive carbocation that quickly reacts either with another flavanol molecule or with an
anthocyanin, producing ethyl-bridged flavanol-flavanol or flavanol-anthocyanin oligomers (8).
However, it has recently been shown that the compounds formed by ethyl bridges are unstable
and that its cleavage can originate new compounds (9).
On the other hand, cycloaddition reactions between anthocyanins and other small molecules can
produce a new family of anthocyanin-derived pigments called pyranoanthocyanins. Specifically,
the reaction with pyruvic acid or ethanal generates vitisin A or B respectively (10-13). In
addition, the reaction with vinylphenol can generate vinylphenol adducts (14,15), and finally the
previously formed ethylidene-bridged compounds can dissociate and generate vinylphenol
adducts (16,17).
All those reactions result in gradually shift of the initial purple-red color to reddish-brown hues.
Additionally, astringency diminishes but the mechanism because it happens it is not so clear.
Theoretically, the formation of ethyl bridges should increase the degree of polymerization of the
UNIVERSITAT ROVIRA I VIRGILI GRAPE PHENOLIC MATURITY; DETERMINATION METHODS AND CONSEQUENCES ON WINE PHENOLIC COMPOSITION Nikolaos Kontoudakis ISBN:978-84-693-7682-9/DL:T-1754-2010

nn
Results (iv)
135
flavanoles which should increase the astringency (3). However, what happens is exactly the
opposite. One possible explanation may be the condensation reactions that take place between
anthocyanins and flavanols which can diminish the astringency (4). Even some authors have
suggested that the cleavage reactions of proanthocyanidins by acid catalysis may be the cause of
the observed reduction of the astringency (18).
The reactivity of phenolic compounds is affected by several factors such as temperature, pH,
and free SO2 concentration (19,20) but probably the oxygen exposure is the main determinant
(21-23). In fact, wines are traditionally aged in oak barrels because the porosity of the wood, the
interstices between staves, and the bunghole allow the entry of small amounts of oxygen which
can induce all the above quoted reactions (24).
Nevertheless, oak aging is an expensive and laborious process that cannot be used for all wines.
Micro-oxygenation (MOX) has therefore been proposed for reproducing, and even accelerating,
the transformations of color and phenolic compounds that take place during oak aging (25,26).
MOX technique consists on providing a controlled flow of oxygen into the wine in the form of
microbubbles through the injection of gaseous oxygen using a microdiffuser (27).
Since its appearance, MOX has become a common application technique in wineries worldwide.
It is believed that MOX stabilize the color and decrease the astringency, bitterness and
herbaceous characters of wine (28). The influence of MOX on the wine quality depends on
several parameters with the most important of them to be the moment and the duration of the
application, the dose of the oxygen and the composition of the initial wine.
Several publications in the literature have studied the influence of MOX on wine color,
composition, and sensory attributes (21, 26, 28-30). To our knowledge, however, none of these
have studied the influence of wine pH on the effectiveness of MOX. The pH condition the
equilibrium among four different anthocyanin structures. The flavylium cation (red) is the main
form at very acid pH but its concentration decrease progressively when pH augments, which
originate the appearance of the quinoidal base (blue) and the hemiketal form (colorless) and the
chalcone (slightly yellow) (31). Depending on pH, anthocyanins can act as electrophiles in the
flavylium form or as nucleophiles in the hemiketal form (32). Therefore, it is quite logical that
pH can influence the reactivity of anthocyanins with oxygen. Moreover, the first step on the
reactions induced by oxygen implies the formation of ethanal from ethanol. Subsequently,
ethanal must capture a proton and become into a carbocation which will react with flavanols to
UNIVERSITAT ROVIRA I VIRGILI GRAPE PHENOLIC MATURITY; DETERMINATION METHODS AND CONSEQUENCES ON WINE PHENOLIC COMPOSITION Nikolaos Kontoudakis ISBN:978-84-693-7682-9/DL:T-1754-2010

nn
Results (iv)
136
start the process of formation of ethyl bridges. Therefore it is also logical that the proton
concentration exert a non-negligible influence on this mechanism. In this paper, therefore, we
study how the pH can affect the changes induced by MOX in two wines with different phenolic
composition.
Materials and methods
Chemicals. Methanol, acetonitrile, formic acid and acetic acid were HPLC-grade and were
purchased from Panreac (Barcelona, Spain). Malvidin-3-O-glucoside chloride, (+)-catechin, (-)-
epicatechin and (-)-epicatechin-3-O-gallate were purchased from Extrasynthès (Genay, France).
Phloroglucinol, L-ascorbic, 4-methylcatechol and 4-dimethylaminocinnamaldehyde (DMACH)
were purchased from Sigma (Madrid, Spain). The rest of the chemicals were of high purity and
were purchased from Panreac (Barcelona, Spain).
Wines. This study was carried out with two Cabernet Sauvignon wines from the 2008 vintage of
the AOC Penedes. These wines were selected because of its different phenolic composition. The
wine A had a very low phenolic content, whereas the wine B had a very high phenolic content.
Specifically the standard parameters of the wine A at the start of the experiment were: ethanol
content, 12.5%; titratable acidity, 5.2 g of tartaric acid/L; volatile acidity, 0.42 g of acetic
acid/L; pH, 3.5 free SO2, 20 mg/L. The standard parameters of the wine B at the start of the
experiment were: ethanol content, 12.8%; titratable acidity, 5.9 g of tartaric acid/L; volatile
acidity, 0.49 g of acetic acid/L; pH, 3.5 free SO2, 20 mg/L.
All racking of the wines were made with previous drainage with argon to ensure that only
received the dose of oxygen corresponding to the micro-oxygenation. 4,500 L of both wines
were divided in three stainless steel tanks of 1,500 L. The first tanks of each wine was added
with NaOH 2M to increase the pH up to 3.9. The second tank of each wine was added with
H2SO4 2M to diminish pH down to 3.1 and it was also added a complementary volume of
distilled water to equal the total volume added to the first tanks. Finally, a similar total volume
of distilled water was added to the third tank to minimize the dilution effect without altering the
pH. After that, wines were pumped without aeration with the aim to homogenize them and were
UNIVERSITAT ROVIRA I VIRGILI GRAPE PHENOLIC MATURITY; DETERMINATION METHODS AND CONSEQUENCES ON WINE PHENOLIC COMPOSITION Nikolaos Kontoudakis ISBN:978-84-693-7682-9/DL:T-1754-2010

nn
Results (iv)
137
left to stand for 24 h. Twenty four glass bottles (750 mL), previously drained with argon, were
filled with each wine and sealed with 49 mm natural cork. The bottled wines were considered as
controls. Simultaneously, each one of the 6 different wines (wine A and B at three different pH)
was racked to three MOX tanks previously drained with argon for carrying out the experiment in
triplicate.
Micro-Oxygenation Equipment. The multiple diffuser microoxygenator (VISIO 2/6-Oenodev,
France) was connected to each one of MOX stainless steel tanks of 165 L. These tanks were 2.5
m in height, had a diameter of 0.30 m, and were equipped with a ceramic diffuser placed at 10
cm above the bottom of the tank. These dimensions were necessary so that the oxygen bubbles
produced during micro-oxygenation would have a sufficient height of displacement to guarantee
their complete dissolution.
Experimental Conditions. All wines, controls and micro-oxygenated, were kept at a
temperature of 16 ± 2 °C. MOX were carried out for 3 months with an oxygen flow of 15 mg/L
per month. After that, 24 glass bottles (750 mL), previously drained with argon, were filled with
each tank and sealed with 49 mm natural cork. Analyses were done immediately after bottling
and also 8 months later.
Color parameters. The color intensity (CI) was estimated using the method described by
Glories (33). The CIELAB coordinates, lightness (L*), chroma (C*), hue (H*), were determined
according to Ayala et al. (34) and the data were processed with the MSCV® software (35). All
absorbance measurements were taken with a Helios Alpha (Thermo Fisher Scientific Inc.,
Waltman, MA) UV–vis spectrophotometer using quartz cells of 1 mm path length.
Anthocyanin Analysis. The total anthocyanin content was determined by spectrophotometry
using the method described by Niketic-Alksic and Hrazdina (36). The PVPP index was
calculated according to Glories (33).
UNIVERSITAT ROVIRA I VIRGILI GRAPE PHENOLIC MATURITY; DETERMINATION METHODS AND CONSEQUENCES ON WINE PHENOLIC COMPOSITION Nikolaos Kontoudakis ISBN:978-84-693-7682-9/DL:T-1754-2010
nn
Results (iv)
138
HPLC Analyses of Anthocyanins and Derived Pigments. Reversed-phase HPLC analyses of
anthocyanins and the anthocyanin-derived pigments were carried out with an Agilent 1200
series liquid chromathograph (HPLC-DAD) and an Agilent Zorbax Eclipse XDB-C18, 4.6 x
250mm 5µm column (Agilent Technologies, Santa Clara, USA) according to the method
described by Cano-López et al. (29). As solvents were used 4.5% aqueous formic acid (solvent
A) and acetonitrile (solvent B) at a flow rate of 0.8 mL/min. Elution was performed with a
gradient starting with 10% B to reach 15% B at 30 min, 15.2% B at 45 min, 18% B at 60 min,
25% B at 100 min and 25 to 100% B in 20 min. Chromatograms were recorded at 520 nm and
anthocyanin standard curves were made using malvidin-3-O-glucoside chloride.
Compounds were identified by comparing their UV spectra recorded with the diode array
detector and those reported in the literature (37). In addition, to confirm each peak identity
analyses were performed with Agilent 1200 series HPLC using an Agilent 6210 time of flight
(TOF) mass spectrometer equipped with an electrospray ionization (ESI) system. Elution was
carried out under the same HPLC analysis conditions as described by Cano-López (29). The
capillary voltage was 3.5 kV. Nitrogen was used as both dry gas at a flow rate of 12 L/min at
350 ºC and nebulizer gas at 60 psi. Spectra were recorded in positive ion mode between m/z 50
and 2400.
Analysis of Proanthocyanidins following acid catalysis with phloroglucinol. Acid-catalysis
cleavage in the presence of excess phloroglucinol (38) was used to analyze monomeric
proanthocyanidin composition and its mean degree of polymerization (mDP). 10 mL of wine
was evaporated under a low pressure vacuum (Univapo 100 ECH, Uni Equip, Martinsried,
Germany). After that it was resuspended in 6 ml distilled water and then applied to Set Pak Plus
tC18 Enviromental cartridges (Waters, Milford, USA) that had been previously activated with
10 mL methanol and 15 mL water. The sample was washed with 15 mL distilled water and then
the proanthocyanidins were eluted with 12 mL methanol, immediately evaporated under vacuum
and later redissolved in 2 mL methanol. Finally, 100 µL of this sample were reacted with 100
µL phloroglucinol solution (0.2N HCl in methanol, containing 100g/L phloroglucinol and 20
g/L ascorbic acid) at 50 ºC for 20 min. The reaction was stopped by adding 1000 µL of 40 mM
aqueous sodium acetate (38). Reversed-phase HPLC analysis (Agilent serie 1200 HPLC-DAD)
was carried out according to the method of Kennedy and Jones (38). As solvents were used 1%
aqueous acetic acid (solvent A) and methanol (solvent B) at a flow rate of 1 mL/min. The
UNIVERSITAT ROVIRA I VIRGILI GRAPE PHENOLIC MATURITY; DETERMINATION METHODS AND CONSEQUENCES ON WINE PHENOLIC COMPOSITION Nikolaos Kontoudakis ISBN:978-84-693-7682-9/DL:T-1754-2010

nn
Results (iv)
139
elution conditions were 1.0 mL/min. Elution was performed with a gradient starting with 5% B
for 10 min, a linear gradient from 5 to 20% B in 20 min, a linear gradient from 20 to 40% B in
25 min. The column was then washed with 90% B for 10 min and reequilibrated with 5% B for
5 min before the next injection. The monomers (+)-catechin, (-)-epicatechin, (-)-epicaechin-3-O-
gallate were identified by comparing its retention time with that of the pure compounds. The
phoroglucinol adducts of (+)-catechin, (-)-epicatechin, (-)-epigallocatechin and (-)-epicatechin-
3-O-gallate were identified by HPLC-TOF analysis. Analyses were performed with Agilent
1200 series HPLC using an Agilent 6210 time of flight (TOF) mass spectrometer equipped with
an electrospray ionization (ESI) system. Elution was carried out under the same HPLC analysis
conditions as described by Kennedy and Jones (38). The capillary voltage was 3.5 kV. Nitrogen
was used as both dry gas at a flow rate of 12 L/min at 350 ºC and nebulizer gas at 60 psi.
Spectra were recorded in positive ion mode between m/z 50 and 2400. This assay was also
carried out without addition of phloroglucinol in order to measure the quantity of
proanthocyanidin monomers naturally present in the wines.
The number of terminal subunits were considered as the difference between total monomers
without phoroglucinol and thus obtained in the analysis performed without phloroglucinol
addition. The number of extension subunits was considered as the addition of all the
phloroglucinol adduct. The mean degree of polymerization (mDP) was calculated by adding
terminal and extension subunits (in moles) and dividing by terminal subunits. The total
proanthocyanidin concentration was considered as the addition of all terminal and extension
subunits. Because acid catalysis with phloroglucinol is not completely efficient, the real yield of
the reaction was measured using a pure B2 proanthocyanidin dimer [(-)-epicatechin-(4→8)-(-)-
epicatechin]. This yield was used to calculate the total proanthocyanidin concentration.
Wine EDP Phloroglucinolysis Method. The determination of the ethylidene-bridged flavanols
in wine samples was done with the use of 2,2´-ethylidenediphloroglucinol (EDP)
phloroglucinolysis according to the method described by Drinkine et al. (39). 5 mL of wine was
diluted in 10 mL of water. By 10 mL, the sample was applied on the column after conditioning.
After that 10 mL of the sample were applied to Set Pak Plus tC18 (5g) Enviromental cartridges
(Waters, Milford, USA) that had been previously activated with 50 mL methanol and 50 mL
water. The sample was washed with 50 mL distilled water and then the sample was eluted with
50 mL methanol, immediately evaporated under vacuum and later redissolved in 1.5 mL
methanol. Finally, 100 µL of this sample were reacted with 100 µL phloroglucinol solution
UNIVERSITAT ROVIRA I VIRGILI GRAPE PHENOLIC MATURITY; DETERMINATION METHODS AND CONSEQUENCES ON WINE PHENOLIC COMPOSITION Nikolaos Kontoudakis ISBN:978-84-693-7682-9/DL:T-1754-2010

nn
Results (iv)
140
(0.2N HCl in methanol, containing 100g/L phloroglucinol and 20 g/L ascorbic acid) at 50 ºC for
20 min. The reaction was stopped by adding 200 µL of 400 mM aqueous sodium acetate (39).
Aqueous 4-methylcatechol (20 µL of 500 mg/L) was then added as internal standard.
Analyses were performed with Agilent 1200 series HPLC using an Agilent 6210 time of flight
(TOF) mass spectrometer equipped with electrospray ionization (ESI) system and an Agilent
Zorbax Eclipse XDB-C18, 4.6 x 150mm 5µm column. As solvent were used 5% aqueous acetic
acid (solvent A), and acetonitrile as solvent B. The sample loop was 20 µL and the elution
gradient was as follows: 10% B for 2 min, from 10 to 50% B in 8 min, from 50 to 100% B in 1
min, 100% B for 4 min, from 100 to 10% B in 1 min, 10% B for 4 min with a 0.3 mL/min flow.
The capillary voltage was 3.5 kV. Nitrogen was used as both dry gas at a flow rate of 12 L/min
at 350 ºC and nebulizer gas at 60 psi. Spectra were recorded in positive ion mode between m/z
50 and1100. For comparing the wine samples we used the area of the identified EDP.
Other Phenolic Compounds. The total phenolic index (TPI) was determined by measuring the
absorbance at 280 nm (19). Dimethylaminocinnamaldehyde index (DMACH index) was
measured according to Nagel and Glories (40).
Statistics. All the data are expressed as the arithmetic average ± of the standard deviation from
three replicates. Two and one-factor ANOVA and Scheffe`s test were carried out with SPSS
software.
Results and discussion
Tables 1 (Wine A) and 2 (Wine B) show the wines color characteristics. In regard to the original
wines (pH 3.5), it is clear that they have very different color characteristics. Wine A have lower
Color Intensity (CI), Chroma (C*) and Hue (H*) and higher Luninosity (L*) than wine B. This
data confirms that wine A is a light wine while wine B is a highly concentrated wine, at least in
terms of color.
As expected, CI, C* and L* of both wines were drastically influenced by the pH. Specifically,
CI and C* were higher and L* lower as the pH is lower in both wines. H* was also higher when
UNIVERSITAT ROVIRA I VIRGILI GRAPE PHENOLIC MATURITY; DETERMINATION METHODS AND CONSEQUENCES ON WINE PHENOLIC COMPOSITION Nikolaos Kontoudakis ISBN:978-84-693-7682-9/DL:T-1754-2010

nn
Results (iv)
141
the pH was more acid in wine B, but this effect was not so clear in the case of wine A. These
changes generated by the pH in the chromatic characteristics observed in both wines can be
easily explained. The lower the pH the higher the proportion of flavylium cation, and
consequently, the higher the contribution of anthocyanins to red color (31). In addition, the
higher the pH the higher the proportion of quinonoidal base. Since this form of anthocyanins is
blue, at lower pH, H* should also be lower.
CI tended to decrease over time in both wines at any pH. However, all the MOX wines had
higher CI than their corresponding controls with the only exception of the wine A at pH 3.9.
These differences were observed immediately after bottling and also 8 months later. Moreover, a
clear trend was observed after 8 months of bottle storage inasmuch as the differences in CI
appear to be higher when pH is lower. Specifically, in wine A the differences in absorbance
units were 1.3 at pH 3.1, 0.4 at pH 3.5 and 0.2 at pH 3.9, and in wine B were 2.4 at pH 3.1, 1.5
at pH 3.5 and 1.1 at pH 3.9.
In regard to Cielab coordinates, C* tend to decrease in all the wines over time but no clear tend
is observed. On the other hand, L* tend to increase in all the control wines over time and have
not a clear behavior in both micro-oxygenated wines at any pH during the three first months.
However, 8 months later, nearly all the microoxygenated wines have an L* value lower than
their corresponding controls, and this differences are higher when the pH is lower. Specifically,
in wine A the differences in L* units were 4.3 at pH 3.1, 1.0 at pH 3.5 and 0.1 at pH 3.9, and in
wine B were 3.3 at pH 3.1, 2.2 at pH 3.5 and 0.8 at pH 3.9. Finally, changes in H* are even
more complicated. In the slight wine (wine A) H* tend to increase in the MOX wines at any pH.
However, in the high phenolic content wine (wine B) the changes on H* of the MOX wines vary
in function of the pH. Thus, H* decreases at pH 3.1, it is stable at pH 3.5 and it increases at pH
3.9. It seems, therefore, pH and polyphenols concentration exert an effect on the color changes
induced by MOX.
Tables 3 (Wine A) and 4 (Wine B) show the results from the spectrophotometric analysis of
anthocyanins and the PVPP Index. This data confirms that wine A had an anthocyanin
concentration much lower than wine B and therefore they were completely different at this level.
As expected, total anthocyanin decreased over time in all the conditions. However, some
different pattern can be observed between controls and MOX wines. In general, the decrease in
anthocyanin concentration after three months tends to be higher in the MOX wines than in their
UNIVERSITAT ROVIRA I VIRGILI GRAPE PHENOLIC MATURITY; DETERMINATION METHODS AND CONSEQUENCES ON WINE PHENOLIC COMPOSITION Nikolaos Kontoudakis ISBN:978-84-693-7682-9/DL:T-1754-2010

nn
Results (iv)
142
corresponding controls. Eight months later, these differences remained in wine A, but wine B
behaved differently in function of pH. In this high phenolic content wine, the anthocyanin
concentration of MOX wine was higher at pH 3.1, equal at pH 3.5 and lower at pH 3.9 than their
corresponding controls.
The PVPP Index tended to increase over time in all wines and did it faster when MOX was
applied, which would confirm that oxygen favors the combination of anthocyanins with
flavanols (21). On the other hand, after three months of MOX, the difference of PVPP index of
MOX wines in respect to their controls was higher when the pH was lower. Specifically, in wine
A the differences in PVVP Index were 9.9 at pH 3.1, 2.2 at pH 3.5 and 2.2 at pH 3.9, and in
wine B were 14.0 at pH 3.1, 7.4 at pH 3.5 and 3.4 at pH 3.9. Although these differences are
minimized eight months later, this data suggests that when the pH is lower, MOX is more
effective, at least in terms of its effect on the combination of anthocyanins and flavanols.
Anthocyanins and anthocyanin-derived pigments were also analyzed by HPLC. In both wines, A
(Table 5) and B (Table 6), the five anthocyanin monoglucosides (malvidin, petunidin,
delphinidin, peonidin, and cyanidin) and their respective acetyl and coumaryl derivatives were
detected. Overall, total monomeric anthocyanin concentration decreased over time and did it
faster when MOX was applied and when pH was lower. Broadly, this trend, which was observed
in the five monoglucosides and also in their respective acyl-derivatives, does not coincide
exactly with that observed for the anthocyanins measured by spectrophotometry. This is because
spectrophotometric analysis overestimates the total anthocyanin concentration since it includes
the contribution from other pigments, whereas only free anthocyanins are detected by the HPLC
method (41).
Malvidin 3-glucoside-(epi)catechin was the only detected direct adduct of anthocyanins and
flavanols and its concentration tends to increase over time in all wines. However, nor pH nor
microoxygenation seem to exert any influence on its evolution.
Malvidin-3-glucoside-ethyl-catechin, malvidin-3-acetylglucoside-ethyl-catechin and malvidin-
3-p-coumaroyl-glucoside-ethyl-catechin were detected in wine samples and all of them are
grouped in Tables 5 and 6 as ethyl-bridged linked pigments. After three months, none of the
control wines differ significantly with respect to their original wines. Similar results were
obtained with MOX wines at pH 3.9 and 3.5. However, both MOX wines had significantly
higher levels ethyl-bridged linked pigments when the pH was more acidic (3.1). Eight months
UNIVERSITAT ROVIRA I VIRGILI GRAPE PHENOLIC MATURITY; DETERMINATION METHODS AND CONSEQUENCES ON WINE PHENOLIC COMPOSITION Nikolaos Kontoudakis ISBN:978-84-693-7682-9/DL:T-1754-2010

nn
Results (iv)
143
later, all the MOX wines had small but significant higher concentrations of these pigments than
their corresponding controls. These results confirm that MOX favor the combination of
anthocyanins with flavanols by means of ethyl bridges although the differences found are minor
than expected.
Several pyranoanthocyanin compounds were found in our wines. Specifically, type-A vitisins
which include: vitisin A and A-type vitisins of peonidin-3-glucoside and malvidin 3-
acetylglucoside; type-B-vitisins which include vitisin B and B-type vitisin of malvidin 3-
acetylglucoside; vinyl-adducts which include malvidin-3-glucoside-4-vinyl-catechin adduct and
malvidin-3-glucoside-4-vinylphenol adduct.
After three months, all the MOX wines had small but significant higher concentration of type-A
vitisins than their respective controls without observing any effect of pH. These differences
remained 8 months later only in the high phenolic content wine (B) but not in the slight wine
(A).
A different trend was found in type B vitisins because three months later all the wines, control,
and MOX, had a significant increase in the concentration of these pigments. It is interesting to
note that both MOX wines at pH 3.1 had significant higher concentration of type B vitisins than
their corresponding controls and that these differences were not found at the other pH.
Therefore, the very acidic pH seems to favor the cycloaddition of ethanal with anthocyanins.
After three months, the vinyl adducts concentration of all MOX wines was significant higher
than their corresponding controls but 8 months later this differences are not so clear. In fact
some control wines after 8 months had higher concentrations of these pigments than their
corresponding MOX wines. On the other hand, the pH did not appear to exert any effect on
these compounds.
Some authors have suggested that a broad peak at the end of the HPLC chromatogram of
anthocyanins and derived-pigments correspond to the polymeric pigments (29,30). This
polymeric peak tended to increase its surface over time in all wines which suggest that the
formation of polymeric structures of pigments took place both in the control and MOX wines.
This polymeric peak tend to increased faster when MOX was applied on the wine B at any pH
but only at pH 3.1 in the wine A.
UNIVERSITAT ROVIRA I VIRGILI GRAPE PHENOLIC MATURITY; DETERMINATION METHODS AND CONSEQUENCES ON WINE PHENOLIC COMPOSITION Nikolaos Kontoudakis ISBN:978-84-693-7682-9/DL:T-1754-2010

nn
Results (iv)
144
At three months, this polymeric peak was significant higher when MOX was applied on the
wine B at any pH but only at pH 3.1 in the wine A. Eight months later the differences between
MOX and control wines were more clearly influenced by the pH. Specifically, at pH 3.1 the
surface of the polymeric peak was around 50 % higher in both MOX wines than in their controls
whereas at pH 3.5 were around 15 % and practically inexistent at pH 3.9. These data suggest,
therefore, that the formation of polymeric pigments in the presence of oxygen is more favorable
when the pH of the wine is very acidic.
Tables 7 and 8 show the total phenolic compounds and related parameters. These data confirm
again that both wines are very different in their phenolic composition inasmuch as the wine A
have a TPI and a proanthocyanidin concentration of about half of the wine B.
As expected, no differences were found in the TPI, DMACH Index, proanthocyanidin
concentration and mDP of both initial wines in function of the pH. Nevertheless, the TPI and the
proanthocyanidin concentration tended to decrease over time in all wines probably caused by the
precipitation of great polymers. In general, these decreases were similar in control and MOX
wines at any pH. The DMACH index also decreased in all wines over time but in that case some
general trends were observed. Specifically, DMACH Index decreased faster in MOX wines than
in their controls. Moreover, this decrease seemed to be more drastic when the pH was lower
especially in the less concentrated wine (A). Since DMACH reacts only with the extremes of
proanthocyanidin polymers, its diminution must be due to a decrease in the number of molecules
(Citas). Therefore, the observed decrease of DMACH Index may be caused either by
precipitation of some of the proanthocyanidin molecules or by increasing their degree of
polymerization. However, the mDP measured by phloroglucionolisis do not follow a similar
pattern than DMACH Index, remaining always in very similar values in all wines. These results
indicate that MOX have not induced changes in the degree of polymerization and suggest that
the decrease in DMACH is more concerned with precipitation of some of the
proanthocyaninidins molecules. These results can be considered as surprising because it was
expected that the MOX induced the polymerization of proanthocyaninidins but other author
have also reported similar results (21).
Table 9 show the evaluation of ethyl-bridged flavanols by means of EDP phloroglucionolysis. In
that case, only wines at 8 months were analyzed because at the beginning of the experiment the
method was not ready. In none of the wines, the application of MOX generated significant
differences in the presence of ethylidene-bridged flavanols at pH 3.9. However, when the pH
UNIVERSITAT ROVIRA I VIRGILI GRAPE PHENOLIC MATURITY; DETERMINATION METHODS AND CONSEQUENCES ON WINE PHENOLIC COMPOSITION Nikolaos Kontoudakis ISBN:978-84-693-7682-9/DL:T-1754-2010

nn
Results (iv)
145
were lower significant differences appeared. Specifically, at pH 3.5 higher presence of
ethylidene-bridged flavanols was found in microxigenated wine A but not in wine B and at pH
3.1 the differences became very high in both wines. These data indicates that the formation of
ethyl-bridged flavanols is highly favored at pH very acidic. Moreover, since no differences were
found at pH 3.9 between control and MOX wines, this data also suggest that MOX can be less
effective when the pH of wines is too high.
It can be concluded that pH exert a major effect on the evolution of color and phenolic
compounds of wine during aging, especially when oxygen is added by MOX. When pH is more
acidic, the effects of MOX are clearer. The differences observed in MOX wines in comparison
to their controls indicate that they had more intense color and higher PVPP Index, higher
concentrations of ethyl-linked pigments, type B vitisins, polymeric pigments and ethylidene-
bridged flavanols when the pH is more acidic. On the contrary, the effects of MOX when the pH
is less acidic are much smaller and sometimes practically nonexistent.
UNIVERSITAT ROVIRA I VIRGILI GRAPE PHENOLIC MATURITY; DETERMINATION METHODS AND CONSEQUENCES ON WINE PHENOLIC COMPOSITION Nikolaos Kontoudakis ISBN:978-84-693-7682-9/DL:T-1754-2010

nn
Results (iv)
146
Table 1. Color Parameters - wine A -
Parameter pH Treatment Initial Wine After 3 months of microoxygenation
8 months after bottling
CI
3.1 Control
10.9 ± 0.2A 10.0 ± 0.1B,α 9.0 ± 0.1C,α
MO 11.1 ± 0.4A,β 10.3 ± 0.3B,β
3.5 Control
9.1 ± 0.1A 8.7 ± 0.1B,α 8.3 ± 0.1C,α
MO 9.1 ± 0.1A,β 8.7 ± 0.1B,β
3.9 Control
7.9 ± 0.1A 8.3 ± 0.2B,α 7.8 ± 0.1A,α
MO 8.3 ± 0.2B,α 8.0 ± 0.2AB,α
L*
3.1 Control
50.8 ± 0.5A 53.3 ± 0.2B,α 56.1 ± 0.2C,α
MO 49.9 ± 1.3A,β 51.8 ± 1.0A,β
3.5 Control
55.1 ± 0.2A 56.7 ± 0.2B,α 58.6 ± 0.1C,α
MO 56.1 ± 0.4B,α 57.6 ± 0.4C,β
3.9 Control
58.3 ± 0.1A 58.4 ± 0.7A,α 60.6 ± 0.1 B,α
MO 58.9 ± 0.7A,α 60.5 ± 0.2B,α
C*
3.1 Control
57.8 ± 0.3A 54.1 ± 0.1B,α 50.1 ± 0.1C,α
MO 53.9 ± 0.2B,α 51.4 ± 0.4C,β
3.5 Control
49.3 ± 0.1A 46.8 ± 0.1B,α 44.2 ± 0.2C,α
MO 46.2 ± 0.2B,β 44.0 ± 0.2C,α
3.9 Control
40.4 ± 0.2A 40.1 ± 0.4A,α 40.1 ± 0.1A,α
MO 40.1 ± 0.3AB,α 39.5 ± 0.3B,β
H*
3.1 Control
5.7 ± 0.2A 5.6 ± 0.2A,α 5.8 ± 0.1A,α
MO 10.0 ± 0.6B,β 9.6 ± 0.3B,β
3.5 Control
3.8 ± 0.1A 4.2 ± 0.2B,α 6.3 ± 0.2C,α
MO 8.3 ± 0.6B,β 8.9 ± 0.4B,β
3.9 Control
3.9 ± 0.1A 6.0 ± 0.3B,α 8.3 ± 0.1C,α
MO 9.3 ± 0.5B,β 10.4 ± 0.2C,β
All data are expressed as the average values of three replicates ± standard deviation (n=3). Statistical analysis: two-factor ANOVA and Scheffe’s test (both, p=0.05). Different letters indicate statistical differences. Latin letters (A, B, C) are used to compare the wines of the same pH throughout the time. Greek letters (α, β) are used to compare control and micro-oxygenation samples of the same pH at the same time.
UNIVERSITAT ROVIRA I VIRGILI GRAPE PHENOLIC MATURITY; DETERMINATION METHODS AND CONSEQUENCES ON WINE PHENOLIC COMPOSITION Nikolaos Kontoudakis ISBN:978-84-693-7682-9/DL:T-1754-2010
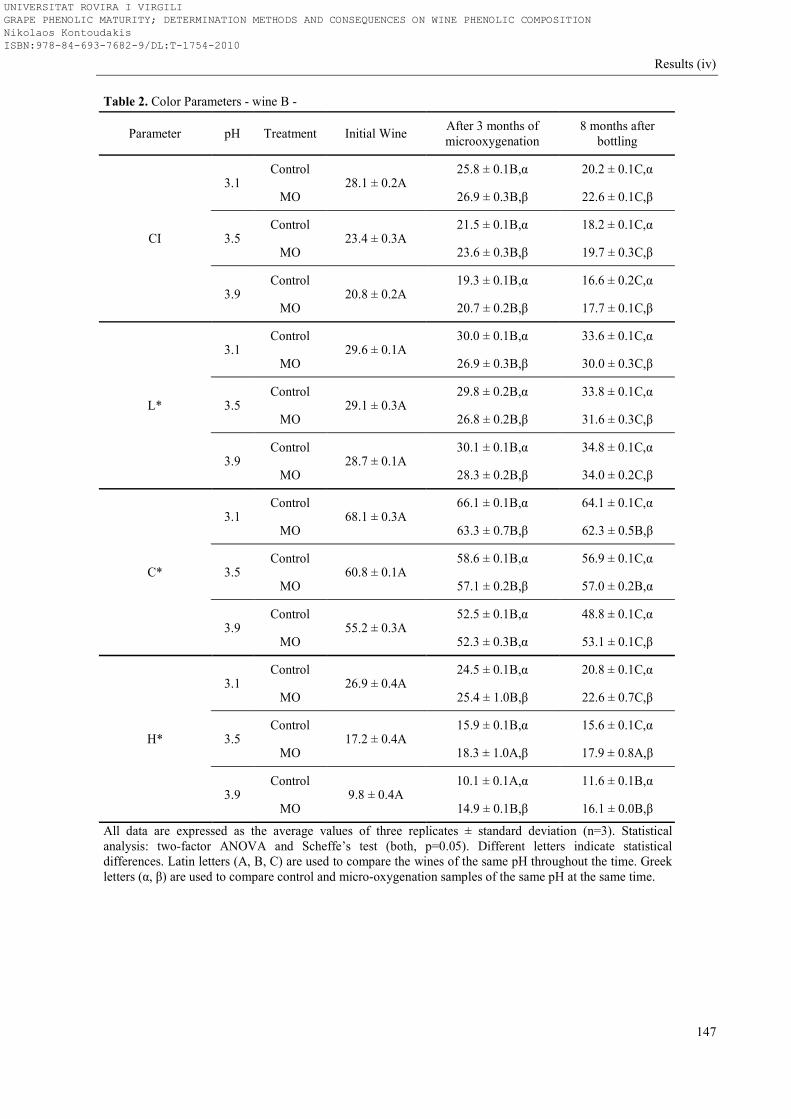
nn
Results (iv)
147
Table 2. Color Parameters - wine B -
Parameter pH Treatment Initial Wine After 3 months of microoxygenation
8 months after bottling
CI
3.1 Control
28.1 ± 0.2A 25.8 ± 0.1B,α 20.2 ± 0.1C,α
MO 26.9 ± 0.3B,β 22.6 ± 0.1C,β
3.5 Control
23.4 ± 0.3A 21.5 ± 0.1B,α 18.2 ± 0.1C,α
MO 23.6 ± 0.3B,β 19.7 ± 0.3C,β
3.9 Control
20.8 ± 0.2A 19.3 ± 0.1B,α 16.6 ± 0.2C,α
MO 20.7 ± 0.2B,β 17.7 ± 0.1C,β
L*
3.1 Control
29.6 ± 0.1A 30.0 ± 0.1B,α 33.6 ± 0.1C,α
MO 26.9 ± 0.3B,β 30.0 ± 0.3C,β
3.5 Control
29.1 ± 0.3A 29.8 ± 0.2B,α 33.8 ± 0.1C,α
MO 26.8 ± 0.2B,β 31.6 ± 0.3C,β
3.9 Control
28.7 ± 0.1A 30.1 ± 0.1B,α 34.8 ± 0.1C,α
MO 28.3 ± 0.2B,β 34.0 ± 0.2C,β
C*
3.1 Control
68.1 ± 0.3A 66.1 ± 0.1B,α 64.1 ± 0.1C,α
MO 63.3 ± 0.7B,β 62.3 ± 0.5B,β
3.5 Control
60.8 ± 0.1A 58.6 ± 0.1B,α 56.9 ± 0.1C,α
MO 57.1 ± 0.2B,β 57.0 ± 0.2B,α
3.9 Control
55.2 ± 0.3A 52.5 ± 0.1B,α 48.8 ± 0.1C,α
MO 52.3 ± 0.3B,α 53.1 ± 0.1C,β
H*
3.1 Control
26.9 ± 0.4A 24.5 ± 0.1B,α 20.8 ± 0.1C,α
MO 25.4 ± 1.0B,β 22.6 ± 0.7C,β
3.5 Control
17.2 ± 0.4A 15.9 ± 0.1B,α 15.6 ± 0.1C,α
MO 18.3 ± 1.0A,β 17.9 ± 0.8A,β
3.9 Control
9.8 ± 0.4A 10.1 ± 0.1A,α 11.6 ± 0.1B,α
MO 14.9 ± 0.1B,β 16.1 ± 0.0B,β
All data are expressed as the average values of three replicates ± standard deviation (n=3). Statistical analysis: two-factor ANOVA and Scheffe’s test (both, p=0.05). Different letters indicate statistical differences. Latin letters (A, B, C) are used to compare the wines of the same pH throughout the time. Greek letters (α, β) are used to compare control and micro-oxygenation samples of the same pH at the same time.
UNIVERSITAT ROVIRA I VIRGILI GRAPE PHENOLIC MATURITY; DETERMINATION METHODS AND CONSEQUENCES ON WINE PHENOLIC COMPOSITION Nikolaos Kontoudakis ISBN:978-84-693-7682-9/DL:T-1754-2010

nn
Results (iv)
148
Table 3. Spectrophotometric Analysis of Anthocyanins and PVPP Index - wine A -
parameter pH Treatment Initial Wine After 3 months of microoxygenation
8 months after bottling
Total Anthocyanins
(mg/L)
3.1 Control
417.1 ± 3.3A 362.3 ± 13.1B,α 264.8 ± 1.0C,α
MO 316.2 ± 4.1B,β 246.2 ± 0.5C,β
3.5 Control
415.9 ± 14.0A 377.4 ± 6.0B,α 282.3 ± 2.7C,α
MO 343.9 ± 2.5B,β 265.2 ± 0.5C,β
3.9 Control
424.7 ± 7.1A 394.9 ± 4.5B,α 314.4 ± 2.2C,α
MO 376.5 ± 1.0B,β 289.0 ± 2.2C,β
PVPP Index
3.1 Control
34.7 ± 1.3A 48.6 ± 2.3B,α 52.5 ± 1.1C,α
MO 58.5 ± 6.8B,β 60.9 ± 0.8B,β
3.5 Control
34.5 ± 2.6A 44.0 ± 3.4B,α 45.3 ± 2.5B,α
MO 46.2 ± 0.5B,α 53.1 ± 1.2C,β
3.9 Control
35.9 ± 4.3A 40.0 ± 1.1A,α 43.8 ± 1.1B,α
MO 42.2 ± 2.9A,α 53.1 ± 5.8B,β
All data are expressed as the average values of three replicates ± standard deviation (n=3). Statistical analysis: two-factor ANOVA and Scheffe’s test (both, p=0.05). Different letters indicate statistical differences. Latin letters (A, B, C) are used to compare the wines of the same pH throughout the time. Greek letters (α, β) are used to compare control and micro-oxygenation samples of the same pH at the same time.
Table 4. Spectrophotometric Analysis of Anthocyanins and PVPP Index - wine B -
parameter pH Treatment Initial Wine After 3 months of microoxygenation
8 months after bottling
Total Anthocyanins (mg/L)
3.1 Control
1009.8 ± 10.1A 798.6 ± 4.1B,α 481.3 ± 3.7C,α
MO 748.1 ± 6.1B,β 511.0 ± 6.6C,β
3.5 Control
981.8 ± 13.7A 796.3 ± 1.5B,α 521.5 ± 2.5C,α
MO 741.7 ± 10.4B,β 517.4 ± 3.9C,α
3.9 Control
994.3 ± 11.3A 806.8 ± 8.6B,α 544.3 ± 6.2C,α
MO 782.8 ± 18.7B,α 517.4 ± 3.9C,β
PVPP Index
3.1 Control
32.7 ± 2.1A 44.6 ± 0.3B,α 67.7 ± 0.1C,α
MO 58.6 ± 1.6B,β 71.9 ± 2.7C,β
3.5 Control
32.0 ± 2.1A 51.5 ± 0.9B,α 62.4 ± 0.3C,α
MO 58.9 ± 2.3B,β 66.4 ± 1.8C,β
3.9 Control
33.6 ± 1.1A 49.8 ± 1.3B,α 57.3 ± 1.5C,α
MO 53.2 ± 3.3B,α 64.0 ± 1.4C,β
All data are expressed as the average values of three replicates ± standard deviation (n=3). Statistical analysis: two-factor ANOVA and Scheffe’s test (both, p=0.05). Different letters indicate statistical differences. Latin letters (A, B, C) are used to compare the wines of the same pH throughout the time. Greek letters (α, β) are used to compare control and micro-oxygenation samples of the same pH at the same time.
UNIVERSITAT ROVIRA I VIRGILI GRAPE PHENOLIC MATURITY; DETERMINATION METHODS AND CONSEQUENCES ON WINE PHENOLIC COMPOSITION Nikolaos Kontoudakis ISBN:978-84-693-7682-9/DL:T-1754-2010

nn
Results (iv)
149
Table 5. HPLC Analysis of Anthocyanins and Anthocyanin-Derived Pigments - wine A -
Parameter pH Treatment Initial Wine After 3 months of microoxygenation
8 months after bottling
Monomeric anthocyanins
(mg/L)
3.1 Control
158.5 ± 0.4A 106.3 ± 1.7B,α 58.9 ± 1.1C,α
MO 65.6 ± 4.6B,β 32.7 ± 0.6C,β
3.5 Control
155.5 ± 0.3A 118.3 ± 1.2B,α 69.0 ± 2.0C,α
MO 96.6 ± 3.4B,β 54.3 ± 1.3C,β
3.9 Control
152.9 ± 0.5A 121.8 ± 1.0B,β 85.9 ± 1.2C,α
MO 108.7 ± 0.5B,β 74.4 ± 0.3C,β
Direct adducts (mg/L)
3.1 Control
1.36 ± 0.04A 1.62 ± 0.21Β,α 1.69 ± 0.13B,α
MO 1.68 ± 0.07Β,α 1.45 ± 0.03C,β
3.5 Control
1.30 ± 0.01Α 1.54 ± 0.04B,α 1.48 ± 0.12B,α
MO 1.60 ± 0.03B,α 1.38 ± 0.03C,α
3.9 Control
1.23 ± 0.01Α 1.37 ± 0.01B,α 1.35 ± 0.07B,α
MO 1.36 ± 0.03B,α 1.38 ± 0.02B,α
Ethyl-linked pigments (mg/L)
3.1 Control
0.45 ± 0.07A 0.43 ± 0.02A,α 0.38 ± 0.01A,α
MO 0.76 ± 0.06B,β 0.76 ± 0.08B,β
3.5 Control
0.45 ± 0.07A 0.44 ± 0.03A,α 0.36 ± 0.04B,α
MO 0.42 ± 0.05A,α 0.56 ± 0.10A,β
3.9 Control
0.45 ± 0.05A 0.50 ± 0.05A,α 0.51 ± 0.01A,α
MO 0.47 ± 0.04A,α 0.74 ± 0.07B,β
A type Vitisins (mg/L)
3.1 Control
2.49 ± 0.04A 2.03 ± 0.06B,α 2.12 ± 0.03B,α
MO 2.60 ± 0.06B,β 2.16 ± 0.02C,α
3.5 Control
2.47 ± 0.02A 2.06 ± 0.05B,α 2.05 ± 0.05B,α
MO 2.62 ± 0.05B,β 2.12 ± 0.09C,α
3.9 Control
2.43 ± 0.04A 1.91 ± 0.05B,α 1.95 ± 0.04B,α
MO 2.95 ± 0.04B,β 2.03 ± 0.12C,α
B type Vitisins (mg/L)
3.1 Control
0.30 ± 0.02A 0.84 ± 0.03B,α 0.37 ± 0.04A,α
MO 1.97 ± 0.25B,β 1.31 ± 0.20C,β
3.5 Control
0.34 ± 0.01A 0.90 ± 0.02B,α 0.27 ± 0.04C,α
MO 0.65 ± 0.04B,β 0.46 ± 0.05C,β
3.9 Control
0.34 ± 0.06A 0.91 ± 0.09B,α 0.21 ± 0.01C,α
MO 0.92 ± 0.02B,α 0.42 ± 0.04C,β
Vinyl adducts (mg/L)
3.1 Control
1.19 ± 0.01A 1.28 ± 0.03B,α 1.18 ± 0.19AB,α
MO 1.69 ± 0.24B,β 1.58 ± 0.22B,α
3.5 Control
1.19 ± 0.04A 1.41 ± 0.05B,α 1.42 ± 0.05B,α
MO 1.71 ± 0.08B,β 1.73 ± 0.07B,β
3.9 Control
1.18 ± 0.01A 1.65 ± 0.03B,α 1.92 ± 0.09C,α
MO 1.96 ± 0.06B,β 2.07 ± 0.15B,α
Polymeric Peak (mg/L)
3.1 Control
5.18 ± 0.29A 5.46 ± 0.31A,α 6.21 ± 0.06B,α
MO 9.20 ± 0.85B,β 9.50 ± 1.00B,β
3.5 Control
5.05 ± 0.53A 6.22 ± 0.22B,α 6.23 ± 0.19B,α
MO 6.36 ± 0.26B,α 6.83 ± 0.24B,α
3.9 Control
5.15 ± 0.19A 5.94 ± 0.15B,α 6.16 ± 0.58B,α
MO 6.23 ± 0.24B,α 6.56 ± 0.06B,α All data are expressed as the average values of three replicates ± standard deviation (n=3). Statistical analysis: two-factor ANOVA and Scheffe’s test (both, p=0.05). Different letters indicate statistical differences. Latin letters (A, B, C) are used to compare the wines of the same pH throughout the time. Greek letters (α, β) are used to compare control and micro-oxygenation samples of the same pH at the same time.
UNIVERSITAT ROVIRA I VIRGILI GRAPE PHENOLIC MATURITY; DETERMINATION METHODS AND CONSEQUENCES ON WINE PHENOLIC COMPOSITION Nikolaos Kontoudakis ISBN:978-84-693-7682-9/DL:T-1754-2010

nn
Results (iv)
150
Table 6. HPLC Analysis of Anthocyanins and Anthocyanin-Derived Pigments - wine B -
Parameter pH Treatment Initial Wine After 3 months of microoxygenation
8 months after bottling
Monomeric anthocyanins
(mg/L)
3.1 Control
270.4 ± 10.4A 205.1 ± 27.8B,α 61.41 ± 0.19C,α
MO 143.0 ± 6.2B,β 42.46 ± 2.16C,β
3.5 Control
270.3 ± 4.8A 195.6 ± 4.9B,α 79.32 ± 1.9C,α
MO 156.3 ± 6.3B,β 61.85 ± 3.7C,β
3.9 Control
245.5 ± 6.1A 204.4 ± 2.4B,α 96.8 ± 0.1C,α
MO 195.1 ± 2.2B,β 72.9 ± 0.1C,β
Direct adducts (mg/L)
3.1 Control
1.52 ± 0.05A 2.45 ± 0.12B,α 2.10 ± 0.10C,α
MO 2.02 ± 0.06B,β 2.75 ± 0.04C,β
3.5 Control
1.66 ± 0.03A 2.03 ± 0.05B,α 2.41 ± 0.09C,α
MO 1.96 ± 0.05B,α 2.87 ± 0.01C,β
3.9 Control
1.60 ± 0.07A 1.79 ± 0.05B,α 2.39 ± 0.02C,α
MO 1.88 ± 0.06B,α 2.34 ± 0.08C,α
Ethyl-linked pigments (mg/L)
3.1 Control
1.19 ± 0.10A 1.24 ± 0.05A,α 1.62 ± 0.18B,α
MO 2.23 ± 0.06B,β 1.91 ± 0.06C,β
3.5 Control
1.23 ± 0.10A 1.23 ± 0.06A,α 1.45 ± 0.05B,α
MO 1.37 ± 0.15A,α 1.68 ± 0.12B,β
3.9 Control
1.22 ± 0.05A 1.11 ± 0.05A,α 1.42 ± 0.02 B,α
MO 1.04 ± 0.14B,α 1.54 ± 0.04B,β
A type Vitisins (mg/L)
3.1 Control
7.68 ± 0.01A 7.48 ± 0.05B,α 7.40 ± 0.01C,α
MO 8.09 ± 0.04B,β 7.85 ± 0.05C,β
3.5 Control
7.60 ± 0.10A 7.42 ± 0.02B,α 7.30 ± 0.01C,α
MO 9.91 ± 0.03B,β 9.38 ± 0.05C,β
3.9 Control
7.61 ± 0.05A 6.66 ± 0.06B,α 6.53 ± 0.01C,α
MO 7.42 ± 0.01B,β 6.93 ± 0.01C,β
B type Vitisins (mg/L)
3.1 Control
0.40 ± 0.05A 0.85 ± 0.02B,α 0.48 ± 0.01A,α
MO 1.31 ± 0.05B,β 0.83 ± 0.02B,β
3.5 Control
0.39 ± 0.03A 0.68 ± 0.02B,α 0.28 ± 0.01C,α
MO 0.63 ± 0.06B,α 0.33 ± 0.01C,β
3.9 Control
0.43 ± 0.05A 0.67 ± 0.01B,α 0.27 ± 0.01C,α
MO 0.65 ± 0.02B,α 0.25 ± 0.01C,α
Vinyl adducts (mg/L)
3.1 Control
1.01 ± 0.07A 1.21 ± 0.03B,α 2.12 ± 0.08C,α
MO 1.57 ± 0.01B,β 2.97 ± 0.08C,β
3.5 Control
1.11 ± 0.05A 1.29 ± 0.07B,α 2.05 ± 0.04C,α
MO 1.51 ± 0.03B,β 1.62 ± 0.14B,β
3.9 Control
1.15 ± 0.06A 1.18 ± 0.05A,α 1.88 ± 0.09C,α
MO 1.32 ± 0.07B,β 1.47 ± 0.09B,β
Polymeric Peak (mg/L)
3.1 Control
5.99 ± 0.21A 7.38 ± 0.34B,α 7.57 ± 0.09B,α
MO 8.39 ± 0.35B,β 11.23 ± 0.43C,β
3.5 Control
5.89 ± 0.08A 6.30 ± 0.16B,α 8.83 ± 0.01C,α
MO 7.47 ± 0.32B,β 10.07 ± 0.03C,β
3.9 Control
5.43 ± 0.13A 6.63 ± 0.08B,α 8.58 ± 0.08C,α
MO 8.02 ± 0.08B,β 9.22 ± 0.16C,β All data are expressed as the average values of three replicates ± standard deviation (n=3). Statistical analysis: two-factor ANOVA and Scheffe’s test (both, p=0.05). Different letters indicate statistical differences. Latin letters (A, B, C) are used to compare the wines of the same pH throughout the time. Greek letters (α, β) are used to compare control and micro-oxygenation samples of the same pH at the same time.
UNIVERSITAT ROVIRA I VIRGILI GRAPE PHENOLIC MATURITY; DETERMINATION METHODS AND CONSEQUENCES ON WINE PHENOLIC COMPOSITION Nikolaos Kontoudakis ISBN:978-84-693-7682-9/DL:T-1754-2010

nn
Results (iv)
151
Table 7. Total Phenolic Compounds, Proanthocyanidins, and Related Parameters - wine A -
parameter pH Treatment Initial Wine After 3 months of microoxygenation
8 months after bottling
TPI
3.1 Control
49.3 ± 0.2A 49.0 ± 0.1A,α 45.7 ± 0.6B,α
MO 48.5 ± 0.9A,α 45.2 ± 0.3B,α
3.5 Control
49.1 ± 0.2A 48.8 ± 0.2A,α 45.4 ± 0.1B,α
MO 48.4 ± 0.8A,α 45.1 ± 0.3B,α
3.9 Control
49.5 ± 0.1A 46.7 ± 0.8B,α 43.5 ± 0.2C,α
MO 46.1 ± 0.3B,α 43.4 ± 1.1C,α
Proanthocyanidins (mg/L)
3.1 Control
1473 ± 21A 1423 ± 42A,α 1286 ± 27B,α
MO 1377 ± 21B,α 1215 ± 81C,α
3.5 Control
1475 ± 25A 1429 ± 46A,α 1352 ± 21B,α
MO 1420 ± 41A,α 1258 ± 27B,β
3.9 Control
1476 ± 37A 1423 ± 16A,α 1397 ± 36A,α
MO 1483 ± 70A,α 1312 ± 26B,β
DMACH Index
3.1 Control
38.50 ± 0.35A 35.75 ± 0.43B,α 31.83 ± 0.52C,α
MO 29.92 ± 1.38B,β 27.83 ± 1.38B,β
3.5 Control
39.50 ± 0.10A 35.50 ± 0.66B,α 32.33 ± 0.58C,α
MO 32.83 ± 1.81B,β 29.08 ± 0.29C,β
3.9 Control
38.13 ± 0.88A 36.42 ± 1.13A,α 33.08 ± 0.72B,α
MO 35.58 ± 1.61B,α 32.50 ± 0.43C,α
mDP
3.1 Control
4.65 ± 0.04A 4.58 ± 0.07A,α 4.52 ± 0.20A,α
MO 4.45 ± 0.08A,β 4.58 ± 0.09A,α
3.5 Control
4.72 ± 0.13A 4.58 ± 0.07A,α 4.85 ± 0.32A,α
MO 4.67 ± 0.03A,α 4.71 ± 0.12A,α
3.9 Control
4.61 ± 0.01A 4.80 ± 0.06B,α 5.08 ± 0.03C,α
MO 4.80 ± 0.13B,α 5.28 ± 0.08C,β All data are expressed as the average values of three replicates ± standard deviation (n=3). Statistical analysis: two-factor ANOVA and Scheffe’s test (both, p=0.05). Different letters indicate statistical differences. Latin letters (A, B, C) are used to compare the wines of the same pH throughout the time. Greek letters (α, β) are used to compare control and micro-oxygenation samples of the same pH at the same time.
UNIVERSITAT ROVIRA I VIRGILI GRAPE PHENOLIC MATURITY; DETERMINATION METHODS AND CONSEQUENCES ON WINE PHENOLIC COMPOSITION Nikolaos Kontoudakis ISBN:978-84-693-7682-9/DL:T-1754-2010

nn
Results (iv)
152
Table 8. Total Phenolic Compounds, Proanthocyanidins, and Related Parameters - wine B -
parameter pH Treatment Initial Wine After 3 months of microoxygenation
8 months after bottling
TPI
3.1 Control
95.7 ± 1.8A 92.7 ± 0.2B,α 92.8 ± 0.7B,α
MO 91.8 ± 0.7B,α 92.9 ± 0.8B,α
3.5 Control
95.6 ± 2.5A 91.9 ± 0.9B,α 92.7 ± 0.5B,α
MO 91.1 ± 1.1B,α 92.5 ± 0.6B,α
3.9 Control
95.6 ± 0.5A 91.3 ± 1.2B,α 92.2 ± 0.5B,α
MO 90.5 ± 1.2B,α 91.1 ± 0.6B,α
Proanthocyanidins (mg/L)
3.1 Control
2753 ± 30A 2435 ± 49B,α 2243 ± 170C,α
MO 2560 ± 26B,β 2017 ± 152C,β
3.5 Control
2781 ± 59A 2489 ± 43B,α 2371 ± 6C,α
MO 2579 ± 61B,α 2327 ± 5C,β
3.9 Control
2742 ± 17A 2512 ± 71B,α 2373 ± 44C,α
MO 2634 ± 31B,β 2223 ± 234C,α
DMACH Index
3.1 Control
65.67 ± 1.42A 65.00 ± 1.50A,α 56.25 ± 0.71B,α
MO 57.50 ± 0.25B,β 51.83 ± 1.18C,β
3.5 Control
67.25 ± 2.18A 65.17 ± 1.15A,α 58.00 ± 1.12B,α
MO 60.25 ± 1.75B,β 54.92 ± 1.27C,β
3.9 Control
65.92 ± 1.13A 64.42 ± 1.04A,α 58.88 ± 1.24B,α
MO 60.75 ± 1.64B,β 55.75 ± 1.30C,β
mDP
3.1 Control
4.47 ± 0.04A 4.63 ± 0.05B,α 4.91 ± 0.01C,α
MO 4.61 ± 0.21B,α 4.74 ± 0.10B,β
3.5 Control
4.58 ± 0.10A 4.85 ± 0.17B,α 4.91 ± 0.04B,α
MO 4.79 ± 0.09B,α 4.75 ± 0.20B,α
3.9 Control
4.52 ± 0.07A 4.65 ± 0.10A,α 5.24 ± 0.02B,α
MO 4.64 ± 0.05A,α 4.90 ± 0.01B,β All data are expressed as the average values of three replicates ± standard deviation (n=3). Statistical analysis: two-factor ANOVA and Scheffe’s test (both, p=0.05). Different letters indicate statistical differences. Latin letters (A, B, C) are used to compare the wines of the same pH throughout the time. Greek letters (α, β) are used to compare control and micro-oxygenation samples of the same pH at the same time.
UNIVERSITAT ROVIRA I VIRGILI GRAPE PHENOLIC MATURITY; DETERMINATION METHODS AND CONSEQUENCES ON WINE PHENOLIC COMPOSITION Nikolaos Kontoudakis ISBN:978-84-693-7682-9/DL:T-1754-2010

nn
Results (iv)
153
Table 9. Evaluation of Ethylidene-Bridged Flavan-3-ols
Parameter pH Treatment 8 months after
bottling (Wine A) 8 months after bottling
(Wine B)
Ethyl bridges (Area x104)
3.1 Control 31.7 ± 2.2α 100.3 ± 3.7α
MO 100.2 ± 29.7β 170.45 ± 18.5β
3.5 Control 34.1 ± 2.4α 55.8 ± 2.7α
MO 52.5 ± 4.9β 61.0 ± 7.1α
3.9 Control 25.1 ± 0.7α 55.6 ± 7.9α
MO 24.9 ± 2.6α 46.2 ± 2.0α
All data are expressed as the average values of three replicates ± standard deviation (n=3). Statistical analysis: one-factor ANOVA and Scheffe’s test (both, p=0.05). Different letters indicate statistical differences.Greek letters (α, β) are used to compare control and micro-oxygenation samples of the same pH at the same time.
Acknowledgment
We thank CICYT (AGL2007-66338) and CDTI (Project CENIT Demeter) for financial support.
Literature cited
(1) Arnold, R.; Noble, A.C. Bitterness and astringency of grape seed phenolics in a model
solution. Am. J. Enol. Vitic. 1978, 29, 150–152.
(2) Gawel, R. Red wine astringency: a review. Aust. J. Grape Wine Res. 1998, 4, 74–98.
(3) Vidal, S.; Francis, L.; Guyot, S.; Marnet, N.; Kwiatkowski, M.; Gawel, R.; Cheynier, V.;
Waters, E.J. The mouth-feel properties of grape and apple proanthocyanidins in a wine-like
medium. J. Sci. Food Agric. 2003, 83, 6, 564-573.
(4) Vidal, S.; Francis, L.; Noble, A.; Kwiatkowski, M.; Cheynier, V.; Waters, E. Taste and
mouth-feel properties of different types of tannin-like polyphenolic compounds and
anthocyanins in wine. Anal. Chim. Acta 2004, 513, 57-65.
UNIVERSITAT ROVIRA I VIRGILI GRAPE PHENOLIC MATURITY; DETERMINATION METHODS AND CONSEQUENCES ON WINE PHENOLIC COMPOSITION Nikolaos Kontoudakis ISBN:978-84-693-7682-9/DL:T-1754-2010
nn
Results (iv)
154
(5) Halsam, E. In vino veritas: Oligomeric procyanidins and the ageing of red wines.
Phytochemistry 1980, 19, 2577-2582.
(6) Jurd, L.; Somers, T.C. The formation of xanthylium salts from proanthocyanidins.
Phytochemistry 1970, 9, 419-427.
(7) Santos-Buelga, C.; Bravo-Haro, S.; Rivas-Gonzalo, J.C. Interactions between catechin and
malvidin-3-monoglucoside in model solutions. Z. Lebensm. Unters. Forsch. 1995, 201, 269-274.
(8) Timberlake, C. F. and Bridle, P. Interactions between anthocyanins phenolic compounds and
acetaldehyde. Am. J. Enol. Vitic. 1976, 27, 97-105.
(9) Escribano-Bailo´n, T.; Alvarez-Garcia, M.; Rivas-Gonzalo, J. C.; Heredia, F. J.; Santos-
Buelga, C. Color and stability of pigments derived from the acetaldehyde mediated
condensation between malvidine 3-o-glucoside and (+)-catechin. J. Agric. Food Chem. 2001,
49, 1213-1217.
(10) Bakker, J.; Timberlake, C.F. Isolation, identification, and characterization of new color-
stable anthocyanins occurring in some red wines. J. Agric. Food Chem. 1997, 45, 35–43.
(11) Fulcrand, H.; Benabdeljalil, C.; Rigaud, J., Cheynier, V.; Moutounet, M. A new class of
wine pigments generated by reaction between pyruvic acid and grape anthocyanins.
Phytochemistry 1998, 47, 1401-1407.
(12) Mateus, N.; Silva, A.M.S.; Vercauteren, J.; De Freitas, V. Occurrence of anthocyanin-
derived pigments in red wines. J. Agric. Food Chem. 2001, 49, 4836-4840.
(13) Vivar-Quintana, A.; Santos-Buelga. C.; Francia-Aricha, E.M.; Rivas-Gonzalo, J.C.
Formation of anthocyanin-derived pigments in experimental red wine. Food Sci. Technol. Int.
1999, 5, 347-352.
(14) Fulcrand, H.; Cameira dos Santos, P.; Sarni-Manchado, P.; Cheynier, V.; Favre-Bonvin, J.
Structure of new anthocyanin derived wine pigments. J. Chem. Soc., Perkin Trans. 1 1996, 7,
735–739.
(15) Schwarz, M.; Wabnitz, T.C.; Winterhalter, P. Pathway leading to the formation of
anthocyanin-vinylphenol adducts and related pigments in red wines. J. Agric. Food Chem. 2003,
51, 3682–3687.
UNIVERSITAT ROVIRA I VIRGILI GRAPE PHENOLIC MATURITY; DETERMINATION METHODS AND CONSEQUENCES ON WINE PHENOLIC COMPOSITION Nikolaos Kontoudakis ISBN:978-84-693-7682-9/DL:T-1754-2010

nn
Results (iv)
155
(16) Cruz, L.; Teixeira, N.; Silva, A.M.S.; Mateus, N.; Borges, J.; de Freitas, V. Role of
vinylcatechin in the formation of pyranomalvidin-3-glucoside-(+)-catechin. J. Agric. Food
Chem. 2008, 56, 10980-10987.
(17) Es-Safi, N.-E.; Fulcrand, H.; Cheynier, V.; Moutounet, M. Studies on the acetaldehyde-
induced condensation of (-)-epicatechin and malvidin 3-O-glucoside in a model solution system
J. Agric. Food Chem. 1999, 47, 2096-2102.
(18) Cheynier, V.; Dueñas-Paton, M.; Salas, E.; Maury, C.; Souquet, J.-M.; Sarni-Manchado, P.;
Fulcrand, H. Structure and Properties of Wine Pigments and Tannins. Am. J. Enol. Vitic. 2006,
57, 298-305.
(19) Ribéreau-Gayon, P.; Glories, Y.; Maujean, A.; Dubourdieu, D. Handbook of Enology;
Wiley: Chichester, UK, 2000; Vol. 2, pp 129-185.
(20) Rivas-Gonzalo, J.C., Bravo-Haro, S. and Santos-Buelga. C. Detection of compounds
formed through the reaction of malvidin 3-monoglucoside and catechin in the presence of
acetaldehyde. J. Agric. Food Chem. 1995, 43, 1444-1449.
(21) Atanasova, V.; Fulcrand, H.; Cheynier, V.; Moutounet, M. Effect of oxygenation on
polyphenol changes occurring in the course of wine-making. Anal. Chim. Acta 2002, 458, 15-
27.
(22) Singleton, V. Oxygen with phenols and related reactions in must, wines, and model
systems: Observations and practical implications. Am. J. Enol. Vitic. 1987, 38, 69–77.
(23) Danilewicz, J. Review of reaction mechanism of oxygen and proposed intermediate
reduction products in wine: Central role of iron and copper. Am. J. Enol. Vitic. 2003, 54, 73–85.
(24) Vivas, N.; Glories, Y.; Raymond, P. Quelques observations sur l’evolution des qualite´s
organoleptiques des vins rouges au cours de leur elevage en barriques neuves. Rev. Fr. Oenol.
1997, 166, 31-34.
(25) Parish, M.; Wollan, D.; Paul, R. Micro-oxygenationsa review. Annual Technical issue. The
Australian Grapegrower & Winemaker, 2000, pp 47-50.
UNIVERSITAT ROVIRA I VIRGILI GRAPE PHENOLIC MATURITY; DETERMINATION METHODS AND CONSEQUENCES ON WINE PHENOLIC COMPOSITION Nikolaos Kontoudakis ISBN:978-84-693-7682-9/DL:T-1754-2010

nn
Results (iv)
156
(26) De Llaudy, M.C.; Canals, R.; González-Manzano, S.; Canals, J.M.; Santos-Buelga, C.;
Zamora, F. Influence of micro-oxygenation treatment before oak aging on phenolic compounds
composition, astringency, and color of red wine J. Agric. Food Chem. 2006, 54, 4246-4252.
(27) Moutounet, M.; Mazauric, J.-P.; Ducournau, P.; Lemaire, T. Wine microoxygenation.
Principles and technological applications. Ind. Bevande 2001, 30 (173), 253-258.
(28) Nikfardjam, M. P.; Dykes, S. Micro-oxygenation research at Lincoln University. Part 2
Sensory changes in Pinor Noir. The Australian & 1ew Zealand Grapegrower & Winemaker,
2002, pp 88-90.
(29) Cano-López, M.; Pardo-Minguez, F.; López-Roca, J.M.; Gómez-Plaza, E. Effect of
microoxygenation on anthocyanin and derived pigment content and chromatic characteristics of
red wines Am. J. Enol. Vitic. 2006, 57, 325-331.
(30) Cano-López, M.; Pardo-Mínguez, F.; Schmauch, G.; Saucier, C.; Teissedre, P.-L.; López-
Roca, J.M.; Gómez-Plaza, E. Effect of micro-oxygenation on color and anthocyanin-
related compounds of wines with different phenolic contents. J.Agric. Food Chem. 2008, 56,
5932-5941.
(31) Brouillard, R. Anthocyanins as Food Colors; Markakis P.; Academic Press, NY, 1982; pp
1-38.
(32) Monagas. M; Bartolomé B. Wine Chemistry and Biochemistry; Moreno-Arribas, M.V.;
Polo, M.C.; Springer, NY; pp 437-462.
(33) Glories, Y. La couleur des vins rouges. 1e`re partie: Les equilibres des anthocyanes et des
tannins. Conn. Vigne Vin 1984, 18, 195–217.
(34) Ayala, F.; Echávarri, J. F.; Negueruela, A. I. A new simplified method for measuring the
color of wines I. Red and rose wines. . Am. J. Enol. Vitic. 1997, 48, 357-363.
(35) Ayala, F.; Echávarri, J.F.; Negueruela, A.I. 2001 URL:
http://www.unizar.es/negueruela/MSCVes.zip.
(36) Niketic-Aleksic, G.K.; Hrazdrina, G. Quantitaive analysis of the anthocyanin content in
grape juices and wine. Lebensm-Wissen. Technol. 1972, 5, 163-165.
UNIVERSITAT ROVIRA I VIRGILI GRAPE PHENOLIC MATURITY; DETERMINATION METHODS AND CONSEQUENCES ON WINE PHENOLIC COMPOSITION Nikolaos Kontoudakis ISBN:978-84-693-7682-9/DL:T-1754-2010

nn
Results (iv)
157
(37) Alcalde-Eon, C.; Escribano-Bailon, M. T.; Santos-Buelga, C.; Rivas-Gonzalo, C. Changes
in the detailed pigment composition of red wine during maturity and ageing. A comprehensive
study. Anal. Chim. Acta 2005, 563, 238–254.
(38) Kennedy, J. A.; Jones, G.P. Analysis of proanthocyanidin cleavage products following
acid-catalysis in the presence of excess phloroglucinol. J.Agric. Food Chem. 2001, 49, 1740-
1746.
(39) Drinkine, J.; Lopes, P.; Kennedy, J. A.; Teissedre, P. L.; Saucier, C. Analysis of ethylidene-
bridged flavan-3-ols in wine. J. Agric. Food Chem. 2007, 55, 1109–1116.
(40) Nagel, C. W.; Glories, Y. Use of a modified dimethylaminocinnamaldehyde reagent for
analysis of flavanols. Am. J. Enol. Vitic. 1991, 42, 364-366.
(41) Rivas-Gonzalo, J.C.; Gutierrez, Y.; Hebrero, E.; Santos-Buelga, C.; Comparisons of
methods for the determination of anthocyanins in red wines. Am. J. Enol. Vitic.1992, 43, 210-
214.
UNIVERSITAT ROVIRA I VIRGILI GRAPE PHENOLIC MATURITY; DETERMINATION METHODS AND CONSEQUENCES ON WINE PHENOLIC COMPOSITION Nikolaos Kontoudakis ISBN:978-84-693-7682-9/DL:T-1754-2010

UNIVERSITAT ROVIRA I VIRGILI GRAPE PHENOLIC MATURITY; DETERMINATION METHODS AND CONSEQUENCES ON WINE PHENOLIC COMPOSITION Nikolaos Kontoudakis ISBN:978-84-693-7682-9/DL:T-1754-2010
nn
IV. DISCUSSIO� A�D PERSPECTIVES
UNIVERSITAT ROVIRA I VIRGILI GRAPE PHENOLIC MATURITY; DETERMINATION METHODS AND CONSEQUENCES ON WINE PHENOLIC COMPOSITION Nikolaos Kontoudakis ISBN:978-84-693-7682-9/DL:T-1754-2010

nn
UNIVERSITAT ROVIRA I VIRGILI GRAPE PHENOLIC MATURITY; DETERMINATION METHODS AND CONSEQUENCES ON WINE PHENOLIC COMPOSITION Nikolaos Kontoudakis ISBN:978-84-693-7682-9/DL:T-1754-2010

nn
Discussion and perspectives
161
DISCUSSIO� A�D PERSPECTIVES
The aim of this thesis was to study the phenolic maturity of the grapes, their influence on wine
phenolic composition and their sensory implications, as well as the application of some
techniques to compensate the lack or excess of grape maturity.
Grape phenolic maturity has a key role on wine quality. The actual market demands wines with
deep red color, full body, soft tannins and fruit scents which can only be achieved if the grapes
have reached a complete phenolic maturity. As it was already mentioned, very well ripened
grapes proportionate wines with a high concentration of anthocyanins and consequently a deep
red color (Kennedy et al. 2002, Canals et al. 2005). Additionally, full ripen grapes present low
astringency and bitterness as result of the diminution of the seed proanthocyanidins proportion
which are very galloylated (Kennedy et al. 2000, Kennedy et al. 2002). On the contrary, unripe
grapes can lead to wines with poor color as also high levels of bitterness and astringency
(Canals et al. 2005).
The importance of grapes phenolic maturity, on wine characteristics, increases the interest of
winemakers to have adequate tools that permit its measurement. This gave a special importance
on the first part of this thesis as there are only a few studies that correlate the predictive
effectiveness of the methods for measuring phenolic maturity and the color and phenolic
composition of the corresponding wines (Gonzáles-Neves et al 2004, Romero-Cascales et al.
2005, Jensen et al. 2008). Moreover, these studies have used only one the existent prediction
methods. In our study we compare three of the most used methods (Glories, ITV, Cromoenos),
at least in Spain.
Several micro-vinifications were carried out to achieve this object at three different levels of
grape maturity with grapes of the Vitis vinifera cultivars Tempranillo, Grenache, Merlot and
Cabernet Sauvignon. The first two cultivars are among the most cultivated in Spain whereas the
other two are probable the most cultivated worldwide. There are several types of winemakings
and for that reason we decided to elaborate according to standard conditions. Temperature was
maintained at 25 ºC, the cap was punched down once by day to favor phenolic compounds
dissolution, and the wines were racked after of 14 days of maceration.
The results of this experiment indicated that there is a quite good linear regression between the
color intensity of the different wines and their corresponding predicted values for the Glories
UNIVERSITAT ROVIRA I VIRGILI GRAPE PHENOLIC MATURITY; DETERMINATION METHODS AND CONSEQUENCES ON WINE PHENOLIC COMPOSITION Nikolaos Kontoudakis ISBN:978-84-693-7682-9/DL:T-1754-2010

nn
Discussion and perspectives
162
and Cromoenos methods. The linear regression coefficients were r2 = 0.8489 and r2 = 0.8869
respectively. In contrast, the regression coefficient for the ITV method was very low (r2 =
0.3879). Moreover, a small modification of Cromoenos method improved the quality of the
measure. Specifically, the linear regression coefficient (r2 = 0.9517) increased notably in respect
to the original method. These results shows that using Glories, Cromoenos or the modification
of this method it is possible to predict reasonably well the wine color of the obtained wines, but
not with ITV.
Additionally, Glories, ITV and specially modified Cromoenos originated satisfactory linear
regression coefficients for Chroma (r2 = 0.8474, 0.7514 and 0.9114 respectively) and
Luminosity (r2 = 0.7900, 0.8284 and 0.8803 respectively). It was not the same for the Hue, as
the linear regression coefficients were very low in all the cases (r2 = 0.3951, 0.1427 and 0.5895
respectively). Even, the obtained slope of Glories method was negative indicating an inverse
tendency between the extract and the wine. This lead us to conclude that the Chroma and the
Luminosity can be predicted quite well using anyone of the three methods, but the Hue
prediction is not possible.
The linear regression coefficients obtained for anthocyanins concentration using the three
methods provide quite good results (r2 = 0.7897 at pH 1.0 and 0.8809 at pH 3.2. for Glories and
r2 = 0.8259 and r2 =0.8170 for ITV and Cromoenos respectively). Moreover, Glories at pH 3.2
had a slope close to one but the other two methods had slopes quite lower than one, indicating
that the two last methods provoked an overextraction of anthocyanins.
Finally, the linear regression analysis between the total phenolic index of the different wines and
their corresponding predicted values obtained by applying the different phenolic maturity
methods was quite good (between 0.8028 and 0.8839). However, the slopes indicate that all
three methods produce an overextraction of phenolic compounds.
In our opinion, this study was necessary due to the lack of information about the prediction
effectiveness of the different methods for phenolic maturity (Gonzáles-Neves et al 2004,
Romero-Cascales et al. 2005, Jensen et al. 2008).
In our study, we conclude that the three studied methods provide good linear regression and
correlation coefficients for anthocyanins by spectrophotometry and TPI. However, only Glories
and Cromoenos offer good results for color parameters, especially the Cromoenos modified
method. Glories is probable the most used method and it seems that can be a useful method. On
UNIVERSITAT ROVIRA I VIRGILI GRAPE PHENOLIC MATURITY; DETERMINATION METHODS AND CONSEQUENCES ON WINE PHENOLIC COMPOSITION Nikolaos Kontoudakis ISBN:978-84-693-7682-9/DL:T-1754-2010
nn
Discussion and perspectives
163
the other hand, Cromoenos has good prediction effectiveness for color intensity and it is also
quite rapid, that give it an advantage. At the harvest, wineries need a technique that can give
results as quickly as possible, and Cromoenos can do it. However, new methods appears, like
the direct measurement techniques FTIR (Fourier Transform Infrared) that permit achieve more
complex analytical results (Dubernet et al., 2000). The direct measurement of grape maturity in
the vineyard using multispectral airborne high resolution image analysis seems to be an
interesting possibility (Lamb et al. 2004). Nevertheless, all these methods need to be studied
more deeply to demonstrate their effectiveness. On the other hand, these techniques are quite
expensive and a small winery cannot afford. Therefore, the methods using extracts such as
Glories and Cromoenos could still have future. However, further studies are necessary to
develop more efficient and quicker methods. Only this way, wineries could improve their
controls for deciding the optimal harvest date and even for classifying grapes in function of their
quality (or prize).
In the case of our experiment, we realized nine micro-vinifications for each cultivar. This
number is quite small to study separately each variety. A greater number of micro-vinifications
would permit the individual study of each one, and this is a proposal for future studies.
Moreover, we decided to realize micro-vinifications because it was the only possibility for
working with enough replicates to have statistically validity. As a next step it would be
interesting to make vinifications in tanks of industrial scale which would permit to draw
conclusions on real winemaking conditions.
The second part of this thesis is focused on the influence of heterogeneity of grape phenolic
maturity on the final quality of wine. It is well known that grapes do not ripe homogeneously in
the vineyard. Several parameters can affect the maturation process of clusters and berries. The
main factors that can be underlined are the location of vines in the vineyard (exposure, altitude,
soil composition, temperature, humidity, vine density, etc.), the position of the cluster on the
vine and even the position of the berries in the cluster can cause differences in the ripening rate
(Haselgrove et al. 2000, Smart et al. 1985).
Our results demonstrate that grapes do not mature at the same rate. During two consecutive
years the berries of Cabernet Sauvignon had a huge density distribution throughout the
maturation process. This heterogeneity continues until the harvest date. For that reason, we
decided to separate the berries according to their density at three groups with the use of two
solutions of sucrose of different concentrations. The berries were vinificated separately.
UNIVERSITAT ROVIRA I VIRGILI GRAPE PHENOLIC MATURITY; DETERMINATION METHODS AND CONSEQUENCES ON WINE PHENOLIC COMPOSITION Nikolaos Kontoudakis ISBN:978-84-693-7682-9/DL:T-1754-2010

nn
Discussion and perspectives
164
As expected, the grapes of different densities originated wine with different characteristics. The
higher the density of grapes the higher alcohol content and pH of wines and on the contrary, the
titratable acidity showed the opposite tendency in both vintages. Moreover, wine color intensity
and Cielab parameters, Chroma (C*) and red-greenness (a*), were higher in wines obtained
from grapes with high density. These have an influence in total color differences (∆Eab*)
among wines of the same vintage, which indicates that wines from grapes of different density
can be distinguished by the human eye.
Grape density also affected the anthocyanin and proantocyanidin composition. Data shows that
the total concentration of these compounds was greater in wines obtained from grapes with
higher density. More specifically, about the proanthocyanidin composition, when the density of
the berries increased the proportion of (+)-catechin significantly decreased and the proportion of
(-)-epigallocatechin significantly increased. Meanwhile, the proportions of the other two
monomers, (-)-epicatechin and (-)-epicatechin-3-O-gallate remained constant. Since
epigallocatechin is only present in skin proanthocyanidins (Souquet et al., 1996) these data
indicate that the contribution of skins to the wine proanthocyainidin concentration increases
when the grapes are denser and therefore riper. The same tendency had the mean degree of
polymerization (mDP) of proanthocyanidins. More ripen grapes had higher mDP. According to
Vidal et al. (2003) astringency augments when the degree of proanthocyanidin polymerization
increases. The wines made with high density grapes presented higher proanthocyanin
concentration and their proanthocyanins also presented a higher mDP. Subsequently, their
astringency was also greater. In the same way, anthocyans concentration tends to be higher in
wines obtained from grapes with higher density. These results suggest that wines from denser
grapes would have a more intense color and also would have a better capacity for aging.
Finally, the sensorial analyses present differences between the wines of the low density and the
wines of medium or high density, but not between the wines of medium and high density. The
tasters preferred the wines of medium and high density as there appeared to be more balanced,
with more floral and fruit scents and with less bitterness.
This experiment confirms our hypothesis, that grape heterogeneity can affect wine quality. The
problem is how to separate the grapes depends on the density. In small amount of grapes it is
easy, but in greater amounts, maybe it has same practical inconvenience. The separation of the
grapes according to their density by the use of aqueous solutions with different density maybe
can be automated, but this is work of other studies related with engineering. A technique that is
UNIVERSITAT ROVIRA I VIRGILI GRAPE PHENOLIC MATURITY; DETERMINATION METHODS AND CONSEQUENCES ON WINE PHENOLIC COMPOSITION Nikolaos Kontoudakis ISBN:978-84-693-7682-9/DL:T-1754-2010
nn
Discussion and perspectives
165
utilized widely, in small wineries that want to improve the quality of their wines, is the manual
elimination of unripe and defective berries with a grape sorting table.
As was already shown, grapes with high phenolic maturity permit the production of high
concentrated wines, with full body, high color appearance and smooth tannins. But nowadays,
especially after the changes that cause global warming (IPCC 2007), in several winemaking
zones, to achieve a high phenolic ripeness, grapes needs to reach high sugar and low acid
concentrations. The final wines would have high alcoholic concentration and high pH (Jones
2005), characteristics that are not desirable (Zamora 2005).
The problem described above leads to the appearance of several solutions for diminishing the
negative effects. Our proposal is described on the third part of this thesis and consists in using
unripe grapes harvested in a cluster thinning to reduce the alcohol content of wines from very
ripe grapes. This study was carried out with grapes of the cultivar Cabernet Sauvignon and
Merlot from the vineyards of the AOC Penedes and Bobal from the AOC Requena. The Bobal
from Requena was chosen as it uses to have very high sugar content when it achieves the
optimum phenolic maturity. On the other hand, Cabernet Sauvignon and Merlot, were chosen as
there are cultivated worldwide.
The wine obtained from unripe grapes was discolored and deodorized with charcoal and later
used for substituting a proportion of the grape juice of very ripe grapes. The wines obtained with
the application of the proposal method had a lower alcoholic content and also a lower pH. This
data confirms that the proposed method can be useful for reducing simultaneously alcohol and
pH.
Furthermore, the obtained reduced-alcohol wines had similar phenolic composition than wines
obtained from the same grapes without applying this procedure. These wines had similar
anthocyanin and proanthocyanidin concentration, and also similar mean degree of
polymerization and momoneric composition. However, as its pH is lower, their color intensity is
significant higher.
In additional, we can confirm that the wines produced from riper grapes, with or without the
application of the proposal technique, had higher phenolic content and higher color intensity
than wines from less ripe grapes. The results are in agreement with those described in the second
part of this Thesis. Specifically, riper grapes provide wines with higher anthocyanin and
proanthocyanidin concentration. Moreover, the tendency was that the proportion of (+)-catechin
UNIVERSITAT ROVIRA I VIRGILI GRAPE PHENOLIC MATURITY; DETERMINATION METHODS AND CONSEQUENCES ON WINE PHENOLIC COMPOSITION Nikolaos Kontoudakis ISBN:978-84-693-7682-9/DL:T-1754-2010

nn
Discussion and perspectives
166
significantly decreased and the proportion of (-)-epigallocatechin significantly increased
throughout maturation. In contrast, the proportions of (-)-epicatechin and (-)-epicatechin-3-O-
gallate remained almost unchanged. Finally, the mDP increased during the maturity.
Although it is clear that anthocyanins concentration increases during maturity (Kennedy et al.
2002, Canals et al. 2005) and may suffer a decline just before harvest and/or during over-
ripening (Mateus et al. 2002, Fournand et al. 2006), it is not clear what happen with
proanthocyanidins. Some authors have described that the berry proanthocyanidins concentration
decrease throughout ripening (De Freitas et al. 2000, Harbertson et al. 2002) whereas others
have reported an increase (Delgado 2004, Canals et al. 2005). In the same way there are
discrepancies about what happens with the mDP. Some authors affirm that decreases (Kennedy
et al. 2000, Kennedy et al. 2002) while others say exactly the opposite (Downey et al. 2003).
Our results (second and third parts) indicate that both, proanthocyanidin concentration and
mDP, tend to increase throughout ripening.
It can be concluded that the applied method for obtaining wines with decreased pH and
alcoholic content do not alter the wine characteristics, at least at phenolic level. Besides, this
procedure is a cheap method that does not need expensive equipments. Nevertheless, it is
necessary to explore more about this technique. For that reason, our group is now realizing a
new study using the odorless and colorless low-alcohol wine but after applying a total
dealcoholization. In the present experiment this wine had 5 % (v/v) of alcohol. A dealcolization
will permit to use lower proportion of low-alcohol wine for obtaining the same alcohol
reduction which would minimize the effect on acidity and pH. In the case of Bobal, as it was
already mentioned, the needed decrease of the alcoholic degree has provoked an excessive
acidification. Using this modification it is possible to minimize the negative effect that the low
alcoholic wine can produce. Additionally, it is necessary to develop experiments of this
technique at industrial scale to verify the viability of this procedure. In this study, micro-
vinifications did not permit a better study of the sensorial impact of this technique. Finally, a
comparative study with other methods for reducing alcohol content will be interesting.
The last part is related with the pH influence on the effectiveness of micro-oxygenation on wine
phenolic composition and color. Brouillard (1982) demonstrated that pH has a great influence
on the anthocyanin reactivity. Moreover, when the oxygen is consumed by the red wine during
winemaking and aging, ethanol is transformed in ethanal according to the mechanism described
by Singleton (1987). Subsequently, ethanal must capture a proton becoming into a carbocation
UNIVERSITAT ROVIRA I VIRGILI GRAPE PHENOLIC MATURITY; DETERMINATION METHODS AND CONSEQUENCES ON WINE PHENOLIC COMPOSITION Nikolaos Kontoudakis ISBN:978-84-693-7682-9/DL:T-1754-2010

nn
Discussion and perspectives
167
which will react with flavanols to begin the process of formation of ethyl bridges. Therefore it is
also logical that the pH has an influence on these mechanisms. Moreover, it must be taken into
account that well-ripe grapes usually lead to high pH wines whereas unripe grapes use to
produce low pH wines. All these arguments, together with that maturity influences the pH of
wine, prompted us to undertake this study.
The obtained data are quite interesting. It is demonstrated that pH affect certainly the evolution
of wine color and phenolic compounds when micro-oxygenation was applied. As it was
expected, the micro-oxygenated wines had more color in comparison with their controls at any
pH and the effect was greater when the pH was more acidic. In the same way, the anthocyanins
reactivity and the formation of new anthocyanin derived-pigments were higher at lower pH.
Specifically, the increase on the concentration of ethyl-linked pigments, type B vitisins,
polymeric pigments and ethylidene-bridged linked flavanols originated by micro-oxygenation
were higher at low pH. On the contrary, when the pH was less acidic the effectiveness of micro-
oxygenation was much smaller and sometimes practically nonexistent.
Surprisingly, the mDP vary very few between controls and micro-oxygenated wines and also
throughout the time. It was expected that the mDP reach greater values in the micro-oxygenated
wines than in their corresponding controls but it was not. Similar results were reported by
Atanasova et al. (2002), although in this work a greater increase during the time was observed.
As final observation of this work, it can be extracted that the oenologist should take in account
the pH of the wine before applying a micro-oxygenation treatment. It would be interesting to
develop further studies about how the pH influences the transformation induced by micro-
oxygenation using different wines as also applying different oxygen doses.
References
Atanasova, V., Fulcrand, H., Cheynier, V. and Moutounet, M. (2002) Effect of oxygenation on polyphenol changes occurring in the course of wine-making. Analytica Chimica Acta 458, 15-27.
Brouillard, R. (1982) Anthocyanins as Food Colors, Markakis P., Academic Press, NY, pp 1-38.
UNIVERSITAT ROVIRA I VIRGILI GRAPE PHENOLIC MATURITY; DETERMINATION METHODS AND CONSEQUENCES ON WINE PHENOLIC COMPOSITION Nikolaos Kontoudakis ISBN:978-84-693-7682-9/DL:T-1754-2010

nn
Discussion and perspectives
168
Canals, R., Llaudy, M.C., Valls, J., Canals, J.M. and Zamora, F. (2005) Influence of ethanol concentration on the extraction of color and phenolic compounds from the skin and seeds of tempranillo grapes at different stages of ripening. Journal of Agricultural and Food
Chemistry 53 (10), 4019-4025. De Freitas, V.A.P., Glories, Y. and Monique, A. (2000) Developmental changes of procyanidins
in grapes of red Vitis vinifera varieties and their composition in respective wines. American
Journal of Enology and Viticulture 51 (4), 397-403. Delgado, R., Martín, P., Del Álamo, M. and González, M.-R. (2004) Changes in the phenolic
composition of grape berries during ripening in relation to vineyard nitrogen and potassium fertilisation rates . Journal of the Science of Food and Agriculture 84 (7), 623-630.
Downey, M.O., Harvey, J.S. and Robinson, M. (2003) Analysis of tannins in seeds and skins of
Shiraz grapes throughout berry development. Australian Journal of Grape and Wine
Research 9, 15–27. Dubernet, M., Dubernet, M., Dubernet, V., Lerch, M., Coulomb, S. and Traineau, I. (2000)
Analyse objective de la qualité des vendanges par spectroscopie infrarouge à transformée de Fourier et réseaux de neurones. Revue Française d’œnologie 185, 18-21.
Fournand, D., Vicens, A., Sidhoum, L., Souquet, J.-M., Moutounet, M. and Cheynier, V. (2006) Accumulation and extractability of grape skin tannins and anthocyanins at different advanced physiological stages. Journal of Agriculture and Food Chemistry 54, 7331–7338.
Gonzáles-Neves, G., Charamelo, D., Balado, J., Barreiro, L., Bochicchio, R., Gatto, G., Gil, G., Tessore, A., Carbonneau, A. and Moutounet, M. (2004) Phenolic potential of Tannat, Cabernet Sauvignon and Merlot grapes and their correspondence with wine composition. Analytica Chimica Acta 513, 191–196.
Harbertson, J.F., Kennedy, J.A. and Adams, D.O. (2002) Tannin in Skins and Seeds of Cabernet
Sauvignon, Syrah, and Pinot noir Berries during Ripening. American Journal of Enology and
Viticulture 53, 54-59. Haselgrove, L., Botting, D., van Heeswijck, R., Høj, P. B., Dry, P. R., Ford, C. and P.G. Iland,
P. G. (2000) Canopy microclimate and berry composition: The effect of bunch exposure on the phenolic composition of Vitis vinifera L cv. Shiraz grape berries. Australian Journal of
Grape and Wine Research 6, 141–149. IPCC (2007) Summary for Policymakers. In: Climate Change 2007: The Physical Science
Basis. Contribution of Working Group I to the Fourth Assessment Report of the
Intergovernmental Panel on Climate Change. Eds. S. Solomon, D. Qin, M. Manning, Z. Chen, M. Marquis, K.B. Averyt, M. Tignor and H.L. Miller, Cambridge University Press, Cambridge, UK and New York.
Jensen, J.S., Demiray, S., Egebo, M. and Meyer, A.S. ( 2008) Prediction of wine color
attributes from the phenolic profiles of red grapes (Vitis vinifera). Journal of Agricultural and
Food Chemistry 56 (3), 1105-1115.
UNIVERSITAT ROVIRA I VIRGILI GRAPE PHENOLIC MATURITY; DETERMINATION METHODS AND CONSEQUENCES ON WINE PHENOLIC COMPOSITION Nikolaos Kontoudakis ISBN:978-84-693-7682-9/DL:T-1754-2010

nn
Discussion and perspectives
169
Jones, G.V., White, M.A. and Cooper, O.R. (2005) Climate change and global wine quality. Climatic Change 73, 319-343.
Kennedy, J.A., Troup, G.J., Pilbrow, J.R., Hutton, D.R., Hewitt, D., Hunter, C.R., Ristic, R.,
Iland, P.G. and Jones, G.P. (2000) Development of seed polyphenols in berries from Vitis
vinifera L. cv. Shiraz. Australian Journal of Grape and Wine Research 6, 244–254. Kennedy, J.A., Matthews, M.A. and Waterhouse, A.L. (2002) Effect of maturity and vine water
status on grape skin and wine flavonoids. American Journal of Enology and Viticulture 53, 268-274.
Lamb, D.W., Weedon, M.M. and Bramley, R.G.V. (2004) Using remote sensing to predict grape
phenolics and colour at harvest in a Cabernet Sauvignon vineyard: Timing observations against vine phenology and optimising image resolution Australian Journal of Grape and
Wine Research 10, 46-54.
Mateus, N., Machado, J.M. and De Freitas, V. (2002) Development changes of anthocyanins in Vitis vinifera grapes grown in the Douro Valley and concentration in respective wines. Journal of the Science of Food and Agriculture 82 (14), 1689-1695.
Romero-Cascales, I., Ortega-Regules, A., López-Roca, J.M., Fernández-Fernández, J.I., Gómez-
Plaza, E. (2005) Comparison of methods for estimating phenolic maturity in grapes: Correlation between predicted and obtained parameters. American Journal of Enology and
Viticulture 56 (3), 212-219. Singleton, V. (1987) Oxygen with phenols and related reactions in must, wines, and model
systems: Observations and practical implications. American Journal of Enology and
Viticulture 38, 69-77. Smart, R. E., Robinson, J. B., Due, G. R. and Brien, C. J. (1985) Canopy microclimate
modification for the cultivar Shiraz. I. Definition of canopy microclimate. Vitis 24, 17-31. Souquet, J. M., Cheynier, V., Brossaud, F., & Moutounet, M. (1996) Polimeric
Proanthocyanidins from grape skins. Phytochemistry 43, 509-512. Vidal, S., Francis, L., Guyot, S., Marnet, N., Kwiatkowski, M., Gawel, R., Cheynier, V. and
Waters, E.J. (2003) The mouth-feel properties of grape and apple proanthocyanidins in a winelike medium. Journal of the Science of Food and Agriculture 83(6), 564–573.
Zamora, F. (2005) El cambio climático: una amenaza para nuestra viticultura. Enólogos 39, 28-
31.
UNIVERSITAT ROVIRA I VIRGILI GRAPE PHENOLIC MATURITY; DETERMINATION METHODS AND CONSEQUENCES ON WINE PHENOLIC COMPOSITION Nikolaos Kontoudakis ISBN:978-84-693-7682-9/DL:T-1754-2010

UNIVERSITAT ROVIRA I VIRGILI GRAPE PHENOLIC MATURITY; DETERMINATION METHODS AND CONSEQUENCES ON WINE PHENOLIC COMPOSITION Nikolaos Kontoudakis ISBN:978-84-693-7682-9/DL:T-1754-2010

nn
V. GE�ERAL CO�CLUSIO�S
UNIVERSITAT ROVIRA I VIRGILI GRAPE PHENOLIC MATURITY; DETERMINATION METHODS AND CONSEQUENCES ON WINE PHENOLIC COMPOSITION Nikolaos Kontoudakis ISBN:978-84-693-7682-9/DL:T-1754-2010

nn
UNIVERSITAT ROVIRA I VIRGILI GRAPE PHENOLIC MATURITY; DETERMINATION METHODS AND CONSEQUENCES ON WINE PHENOLIC COMPOSITION Nikolaos Kontoudakis ISBN:978-84-693-7682-9/DL:T-1754-2010
nn
General conlusions
173
GE�ERAL CO�CLUSIO�S
� The three studied methods for measuring phenolic maturity, Glories, ITV and
Cromoenos, can be useful for predicting some of the characteristics of the future wines.
Specifically, the three methods provide very good linear regression and correlation coefficients
for anthocyanins by spectrophotometry and TPI. However, only Glories and Cromoenos offer
good results for color parameters.
� Cromoenos method enables results easily in just 10 min thereby reducing the cost of
labor necessary. Consequently, Cromoenos method presents the best balance between its
predictive ability and its simplicity of use, making it a very good analytical procedure for
wineries. Moreover, a simple modification of Cromoenos method is proposed. This modification
allows to considerably enhancing its performances.
� The heterogeneity of the grapes at the moment of the harvest was greater than expected.
The ensemble of all the grapes has always a proportion of very well-ripe grapes, another
proportion of sufficiently-ripe grapes and finally a proportion of less-ripe grapes. This fact must
be taken into account because the presence of less-ripe grapes can affect the final composition
and consequently the quality of the wine.
� The presence of a proportion of less-ripe grapes diminish the final ethanol content, pH,
anthocyanin concentration, color intensity, total phenolic index and proanthocyanidin
concentration and increase titratable acidity. Moreover, these lower density grapes contribute
with less polymerized proanthocyanidins, lower proportions of (-)-epigallocatechin and higher
proportions of (+)-catechin. These data suggest that lower density grapes release more seed
proanthocyanidins than skin proanthocyanidins. Finally, the sensory comparison of wines leaves
no doubt because the wine obtained from lower density grapes was always recognized in all the
triangle trials and it was considered as the worst balanced and the bitterest.
� The color, the concentration of anthocyanin and proanthocyanidin as well as their mean
degree of polymerization increased throughout ripening in the wines of the three studied
cultivars. Moreover, the monomeric composition of the wine proanthocyanidins changed with
UNIVERSITAT ROVIRA I VIRGILI GRAPE PHENOLIC MATURITY; DETERMINATION METHODS AND CONSEQUENCES ON WINE PHENOLIC COMPOSITION Nikolaos Kontoudakis ISBN:978-84-693-7682-9/DL:T-1754-2010
nn
General conclusions
174
maturity. Specifically, (+)-catechin decreased and (-)-epigallocatechin increased significantly.
Since, (-)-epigallocatechin is only present in the skin prodelphinidins, this results suggest that
the proportion of skin tannins of wine are greater in the riper grapes.
� The use of unripe grapes is proposed as a method for obtaining wines with lower pH and
ethanol content. The method consists in the substitution of a proportion of the grape juice of
well-ripe grapes by a colorless and odorless low-alcohol wine obtained from cluster thinning.
This procedure is cheap, very easy to apply in wineries and does not require specific equipment.
� Applying the proposed method for decreasing ethanol and pH it is possible to obtain
wines with a similar phenolic composition than the wines obtained with the same grapes without
applying it. These wines had similar anthocyanin and proanthocyanidin concentration, and also
similar mean degree of polymerization and momoneric composition than their controls.
However, as its pH is lower, their color intensities are significant higher.
� The differences observed in micro-oxygenation wines in comparison to their controls
were, in general, greater when the pH was more acidic. Specifically, the differences found in
color intensity, anthocyanin concentration, PVPP Index, ethyl-linked pigments, type B vitisins
and polymeric pigments between micro-oxygenated wines and their corresponding controls
were higher at lower pH. On the contrary, the effects of micro-oxygenation when the pH was
less acidic were much smaller and sometimes practically nonexistent.
� The micro-oxygenated wines in comparison to their controls do not show great
differences in the proanthocyanidin concentrations or in their mean degree of polymerization.
The pH does not appear to exert effects on these parameters. However, the analysis by EDP-
phologlucinolysis shows that there are greater amounts of ethyl-bridged flavanols in the micro-
oxygenated wines at pH very acidic.
� Micro-oxygenation is much more effective when the pH is very acidic and therefore pH
must be taken into account as an important factor for considering in wineries when this
technique is applied.
UNIVERSITAT ROVIRA I VIRGILI GRAPE PHENOLIC MATURITY; DETERMINATION METHODS AND CONSEQUENCES ON WINE PHENOLIC COMPOSITION Nikolaos Kontoudakis ISBN:978-84-693-7682-9/DL:T-1754-2010

nn
UNIVERSITAT ROVIRA I VIRGILI GRAPE PHENOLIC MATURITY; DETERMINATION METHODS AND CONSEQUENCES ON WINE PHENOLIC COMPOSITION Nikolaos Kontoudakis ISBN:978-84-693-7682-9/DL:T-1754-2010