Embed Size (px)
Citation preview

Determinants of Students Performance in Kenya Certificate of
Secondary Education Using Ordinal Logistic Regression in
Kiambu County
By
Samuel Gitonga Kinyua
I56/79761/2012
A Dissertation submitted to the School of Mathematics,
Department of Statistics in the Partial Fulfillment of the Requirement for the
Degree of Masters of Science in Social Statistics at the
University of Nairobi
NOVEMBER 2014

ii
DECLARATION
I declare that this is my original work and has not been presented in any other learning
institution for academic award.
Signature: ……………………………….. Date: …………………
Samuel Kinyua
This work has been presented with my approval as the university supervisor:
Signature: ……………………………… Date: ……………….
Prof. J.A.M. Ottieno
Signature: ……………………………… Date: ……………….
Dr. John Nderitu

iii
DEDICATION
I dedicate this project to my wife Eunice, my daughters: Betty, Kathryn, and Loise and to my
church members for their endless support.

iv
ACKNOWLEDGEMENTS
My gratitude to the almighty God for the wisdom and chance he has provided me with to
pursue my Masters Degree.
I am grateful to the University of Nairobi, particularly to my supervisors Prof. J.A.M Ottieno
and Dr. J. Nderitu for guiding me through my project work and to the mathematics
department for the knowledge I acquired during my two years study period at the university
of Nairobi. Furthermore, I pass my regards to my classmates for their tireless support and
encouragement to carry on to the end of our MSC degree.

v
CONTENTS
DECLARATION .............................................................................................................................. ii
DEDICATION ................................................................................................................................. iii
ACKNOWLEDGEMENTS ...............................................................................................................iv
LIST OF FIGURES .......................................................................................................................... vii
LIST OF TABLES .......................................................................................................................... viii
ACRONYMS .................................................................................................................................... ix
LIST OF SYMBOLS ......................................................................................................................... x
ABSTRACT ...................................................................................................................................... xi
CHAPTER ONE - INTRODUCTION ............................................................................................... 1
1.1 Background ............................................................................................................................. 1
1.2 Purpose of the study ................................................................................................................. 2
1.3 Study Objectives ...................................................................................................................... 2
1.3.1 Main Objective ................................................................................................................. 2
1.3.2 Specific objectives ............................................................................................................ 3
1.4 Study Justification ................................................................................................................... 3
CHAPTER TWO - LITERATURE REVIEW .................................................................................... 5
2.0 Introduction ............................................................................................................................. 5
2.1 The Demand for Education ...................................................................................................... 5
2.2 Financing of Education ............................................................................................................ 5
2.3 Secondary School Education .................................................................................................... 6
2.4 Graduate Examiners ................................................................................................................. 7
2.5 Selection Process into Secondary Schools ................................................................................ 7
2.6 Student’s Gender ..................................................................................................................... 8
2.7 Student’s Age .......................................................................................................................... 9

vi
2.8 KCPE Marks Predictability to Student’s Performance in KCSE .............................................. 10
2.9 Public Primary Schools versus Private Primary School........................................................... 10
CHAPTER THREE – METHODOLOGY ....................................................................................... 13
3.1 Introduction ........................................................................................................................... 13
3.2 Data Source ........................................................................................................................... 13
3.3 Study Variables definition ...................................................................................................... 13
3.4 Assumptions of the Ordinal Logistic Regression Model ......................................................... 15
3.5 Ordinal Logistic Regression Model ........................................................................................ 16
3.6 The Likelihood Function ........................................................................................................ 18
3.7 Ordinal Logistic Regression Parameter Estimator ................................................................... 19
3.8 The Odds Ratio in Ordinal Logistic Regression ...................................................................... 20
3.9 Goodness of Fit...................................................................................................................... 22
CHAPTER FOUR - RESULTS AND DISCUSSION ....................................................................... 23
4.1 Data Analysis, Results and interpretation ............................................................................... 23
CHAPTER FIVE -CONCLUSION AND RECOMMENDATION ................................................... 38
5.1 Conclusion............................................................................................................................. 38
5.2 Recommendation ................................................................................................................... 39
APPENDIX ..................................................................................................................................... 42

vii
LIST OF FIGURES
Figure 1: Frequencies for the Sampled Student's Age ....................................................................... 25
Figure 2: KCSE Performance in 2013 within the Sampled Secondary Schools in Kiambu County
Based On Gender ............................................................................................................................ 26
Figure 3: Frequencies on the Sampled Students KCSE Performance Based on their Primary School
Type: Private or Public Primary School ........................................................................................... 30
Figure 4: Frequencies on the Sampled Students KCSE Performance Based on their Secondary School
Type: Private or Public Secondary School ....................................................................................... 32

viii
LIST OF TABLES
Table 1: Conceptual Framework on the Study Variables Impact on the Overall Student's Performance
........................................................................................................................................................ 12
Table 2: Definition of Variables Used In the Study .......................................................................... 14
Table 3: Frequencies of the Study Variables .................................................................................... 23
Table 4: A Cross tabulation Table on the Transition Trends of Primary School Graduates to
Secondary Schools Based on the School Type ................................................................................. 27
Table 5: The Students Gender Based on the Primary School they attended ....................................... 28
Table 6: The Students Gender Based on the secondary School they attended .................................... 29
Table 7: Test of Parallel Lines ......................................................................................................... 33
Table 8: Study Variable Maximum Likelihood Parameter Estimates ................................................ 34
Table 9: Pseudo R-Squared .............................................................................................................. 35
Table 10: Goodness of Fit of the Model ........................................................................................... 36
Table 11: Model-Fitting Information ............................................................................................... 36

ix
ACRONYMS
KCPE Kenya Certificate of Primary Education
KCSE Kenya Certificate of Secondary Education
OLR Ordinal Logistics Regression Model
MDG Millennium Development Goal
FPE Free Primary Education
MoE Ministry of Education
x
LIST OF SYMBOLS
Model coefficient
Number of parameters
Sample size
Log-likelihood function of the Ordinal logistic regression model
Likelihood function of the logistic regression model
Unique probability for the jth
response given the ith
observation based on
some reference category of j

xi
ABSTRACT
In this project, I have modeled the determinants of students’ performance in the Kenya
Certificate of Secondary Education examination within Kiambu County. The selection and
allocation process to secondary school for primary schools graduates has posed a great
conflict to the interested stakeholders and parents within the education sector. The project’s
aim was to find out the effects of private and public primary schooling on a student’s
secondary school academic and overall performance. Six secondary schools in Kiambu
County were sampled for the study based on their categories and the data on 2009 form –
one-cohort students’ performance in their 2013 final examination. Data analysis conducted
through exploratory and confirmatory analysis – Ordinal Logistic Regression model using
SPSS version 20. The main determinants of a learner’s performance in their secondary school
graduate examination were age, primary school type, secondary school type and their marks
in Kenya Certificate of Primary Education examination and points. The learners’ Kenya
Certificate of Primary Education Examination points, gender, and secondary school category
had a significant impact on the learners’ Kenya Certificate of Secondary Education
performance, with significance values of 0.000, 0.002, and 0.001 respectively.

1
CHAPTER ONE - INTRODUCTION
1.1 Background
In the year 2008, 695,777 students sat for Kenya Certificate Primary School, where 367, 125
were male and 328,652 females, while in the year 2009, 381,600 were male and 345,454
female from a total of 727,054 students. Students’ performance in the Kenya Certificate of
Primary Education (KCPE) is examined at standard eight and this determines the transition
into different types of secondary schools in Kiambu County and also nationally. Kiambu
County has 8 national schools, 10 extra-county schools, 19 county schools, 199 district
schools, and 83 private schools, which total to 319 secondary schools, of which 47 are boys’
schools, 63 girls’ schools and 209 mixed secondary schools.
The current 8-4-4 education system in Kenya was launched in 1985. The system is designed
to provide eight years of primary education, four years of secondary education, and four years
of University education. At each level, the students are assessed and their performances
determine the type of school they are admitted to. The primary schools graduate exams and
the type of school, (private or public), have a great impact on the secondary school they
transit to. Since the introduction of free primary school in the country in 2003, public primary
schools performance level has gone down leaving their counterparts from the private schools
to dominated the top positions.
Private schools’ performance in the present day, earn their students enrollment in top
performing secondary schools at the National and county levels. On the contrary, less than
30% students graduating from public school gain access to the same schools .Due to the
limited places available in top performing public secondary schools, the competition at this
level is very stiff.

2
1.2 Purpose of the study
The study seeks to establish how performance of students in Kenya Certificate of Primary
Education (KCPE) exams, based on whether it is a public or private school, determines their
performance in Kenya Certificate of Secondary Education (KCSE) depending also, on
whether the secondary school is a public or private school.
The current conflict over Kenya Certificate of Primary Education graduate admission to
secondary schools of different ranking, poses a great challenge to the stakeholders within the
education sector and to the learners within this cohort. The mode of school allocation has
been challenged, since it tends to favor learners from private schools. Bright students from
public schools have missed opportunities to join top national schools while their counterparts
from the private schools do so. An Ordinal logistic regression model gives the determinants
in order of their significant based on the different school category transition. This makes it
necessary to study the trends of students’ performance based on the school type (private-
public, private-private, public-private, and public-public) in order to provide an insight into
the determinants of performance difference in public and private schools.
1.3 Study Objectives
The objectives of the study are:
1.3.1 Main Objective
To find out the effects of private and public primary schooling on a student’s secondary
school academic and overall performance.

3
1.3.2 Specific objectives
i. To identify the determinants of students’ performance and achievement based on
transition from: public-to-public, public to private, private-to-private and private to
public from primary school level to the secondary school level.
ii. To establish the impact of a learner’s age on their performance in the graduate
secondary school examination
iii. To establish the impact of a learner’s gender on their performance in the final
secondary school examination
Hypotheses
The following hypotheses were used for the study on school type effect on secondary school
students’ performance:
1. There is no significant difference in the academic performance of students from both
private and public primary schools in KCSE.
2. There is no significant difference in the academic performance of students based on
their age.
3. There is no significant difference in the academic performance of students based on
their gender from either public or private secondary schools.
1.4 Study Justification
The study is an analysis of the trends in students’ performance and achievement based on
transition from: public-to-public, public to private, private-to-private and private to public at
the primary and secondary school level of schooling. This provides basis for choice of
schools by parents to avoid the current primary school graduate selection procedure to
secondary schools, and provide essential information for the education sector, parents, and
the learners. This would be in form of planning for: resources, learning and teaching

4
facilities, school allocation of teachers and even students, private schools establishment
approval, allocation of KCPE graduates to secondary schools, and financial allocation.
Furthermore, such an analysis advised the current trends, which are then used to predict
future intakes, and absorption levels for individual cohort at a particular time/year to either
public or private secondary schools without conflicts.
1.5 Summary
The subsequent sections of this thesis are organized as follows: chapter two, literature review
on factors that affect students’ performance at their secondary school final exam level,
chapter three describes the study methodology, chapter four provides the results and data
analysis and discussion while chapter fives is on the study conclusion and recommendations
for policy developments and further studies.

5
CHAPTER TWO - LITERATURE REVIEW
2.0 Introduction
This chapter describes the factors that affect students’ performance at the secondary school
level as studied by different researchers based on various determinants. It gives an overview
of the other researchers’ findings in relation to the determinants of secondary school students’
performance within the recent past.
2.1 The Demand for Education
To achieve the Millennium Development Goal 2 (MDG): having universal education for all,
almost all countries in the world are currently on the move to ensure provision of Free
Primary Education (FPE). This is an essential tool in the policy setting for the poor, since it
ensures provision of basic education to millions of the world’s child population.
The demand for education especially in public schools has generally gone up in Kenya since
the introduction of free primary education in 2003 and subsidized secondary school education
in 2008 by former president Honorable Mwai kibaki. This has resulted to a constraint of
limited learning and teaching facilities within public schools, due to the tremendous
enrollment rates, ultimately affecting students’ performance in public schools compared to
private schools.
2.2 Financing of Education
Public schools are part of a larger school system, which function as a part of the government
and must follow the rules and regulations set by the government’s Ministry of
Education. Public schools funding is from the government and at times well-wishers. In
contrast, private schools generate their own funding, which typically comes from a variety of

6
sources such as: tuition; private grants; and fundraising from parents, alumni, and other
community members.
2.3 Secondary School Education
Secondary education is the second stage in learner education development; it takes a middle
position between primary and tertiary level. It therefore holds a functional role in enabling
learners to access higher education, preparing them for lifelong education, and work. It is an
investment as well as an instrument that can be used to achieve rapid economic, social,
political, technological, scientific, and cultural development of the country (Nelson Jagero,
2013).
Education, especially Secondary education, plays a significant role in the economic
development of a nation. Secondary education is the foundation of the scientific and
technological advancement that Africa needs as a continent, to develop to the level of
industrialized economies. Moreover, secondary education is the gateway to higher education
and to an individual’s employment. Thus, the demand for secondary education, which is the
pivot of an individual’s academic learning process, is higher in the present generation than
before.
Secondary schools in Kenya are categorized into national, county, extra-county, district, and
private schools. The categories are based on performance, facilities, availability of resources,
school location, and nationwide enrolment of students. The national schools are government
schools and are the most prestigious secondary schools in the country. They are also among
the oldest schools, often modeled on British public schools, but with government funding.

7
2.4 Graduate Examiners
In Kenya, national examination scores at primary and secondary school levels, act as proof of
completion, and qualification for further education and later justification for entry into the
labor market. KCPE score is used to select form one students to various cadres of secondary
schools on the premise that their performance in KCPE will affect their performance in
KCSE that comes at the end of secondary education (Nelson Jagero, 2013). Therefore,
Nelson (2013) places a significant value for the secondary school graduate exams which,
being public and nationally done, serve to: Specify goals and standards of education
nationally in order to control the disparate elements of the education system and provide
evidence that certifies the achievement of students, needed in the job market for placement.
Moreover, they allocate students into further education courses in an objective, unbiased way
since the available spaces keep diminishing with the rise in the education level. They
facilitate international mobility, legitimize membership in international global society, and
evaluate the quality of education and its relevance. Furthermore, they help in diagnosing the
education systems’ weaknesses and motivate policy reforms at different levels.
2.5 Selection Process into Secondary Schools
The Ministry of Education, using a computerized system, conducts admissions to secondary
schools, centrally. The allocation to secondary school is based on an individual students’
KCPE performance. During KCPE registration, students list their preferred secondary schools
based on the available categories. Each student has to choose two national schools of their
preference, two county schools, two extra-county schools, and three district schools. At
selection, national schools have a set of county quotas, from which they choose a given
number of students from each county, based on their KCPE performance. The secondary
school admissions algorithm ranks students within each district and gender by descending
KCPE score and so the process of admitting students is carried separately for both genders.

8
The best students in the county, based on gender are allocated to their first preference
national school, followed by the second best students and the rest in that order. Once the
students’ first choices are filled and yet some have not been allocated any secondary school,
the algorithm considers their second secondary school choices for selection. The process is
organized in a manner that ensures that each student is only admitted to one school at a time.
2.6 Student’s Gender
Gender parity in the present day is the foundation for education equity in the country. School
enrolment patterns in secondary education portray gender parity as a feasible target (Mwangi
and Nyagah, 2011). In the previous years, female’s performance in KCSE was better than
males in the arts and humanities. To the contrary, Boys excelled in the sciences, which are
critical to scientific and technological development, this determines the type of occupational
course one enrolls in and later, the nature of employment they take up in life.
The school type is further classified based on gender as either: Girls, boys or mixed schools.
In a single sex education setting, all learners are either girls or boys while in mixed schools,
they are both girls and boys learning within the same classrooms. According to Mburu P.D.
(2013), in gender separate classrooms, students have higher motivation and higher confidence
levels, which offer them, better educational opportunities. Girls in particular, feel better about
their bodies, the body development, and their body image, which ultimately has a positive
impact on their academic abilities. To the contrary, within well-managed mixed gender
educational environment, boys and girls learn to respect and value each other's ideas. The two
respective genders learn to listen and communicate with each other. Hence, Isolating boys
and girls in single-sex schools is a barrier to effective development in their interpersonal
skills in order to later, function as grown-ups in their society.

9
Single-sex schools have a higher percentage of graduates who attend four-year colleges and a
lower percentage of graduates who attend two-year junior colleges than coeducational
schools (Mburu P.D., 2013). Students in single sex schools performed better compared to
those in mixed schools. Furthermore, Boys in mixed schools also performed better compared
to their counterpart female learners in all the grades or class. Hence, the type of school that
one attends is an important factor in determining one’s performance in KCSE examinations.
To the contrary, a study on the relationship of primary and secondary school performance by
Nelson Jagero (2013); indicated that girls performed better compared to boys in KCSE,
despite the fact that they were admitted with lower marks in KCPE. Nelson’s KCPE results
further indicate that for the boys, their performance in KCPE had only 28.9% effect on their
performance in KCSE, compared to the girls 41.8%.
2.7 Student’s Age
The age of a learner at a particular level of education has an impact on their performance.
Most of the students who join pre-school classes later than the recommended five years, age
do not perform as expected, because they miss learning experiences at a time when they are
most receptive to learning basic skills and establishing secure foundations for cognitive
development (Wasanga et al, 2011). Hence, when these learners sit for their subsequent final
primary and secondary school level exams, they always indicate a lower performance level
compared to their counterparts who attended school within the right age bracket. Yet a study
by Fertig et al. (2005) shows that the school entry age in Germany and its effect on education
attainment is very controversial; some enter school late but perform well while some join
early and do not perform well.
Adult student performance in primary and secondary school setting, is in most cases poor.
When older learners are taught in classes with younger children, there may be psychosocial
issues of self-esteem, bullying, and gender harassment. This further results to problems of

10
matching learning to cognitive capabilities since the curriculum used is the same and the
learners are taught the same content despite their age difference (Wasanga et al., 2011).
2.8 KCPE Marks Predictability to Student’s Performance in KCSE
Other than examination certification, KCPE and KCSE are exams used for selection into the
next level of education; KCPE determines KCSE level while KCSE determines university or
tertiary colleges levels. Performance in KCPE has a major effect on student’s performance in
KCSE achievement. However, Data obtained in a study by Mbugua et al., (2012) on students
who scored between 200 and 400 points out of a maximum of 500, indicated that their entry
marks into secondary schools, could not be the cause of poor performance at Kenya
Certificate of Secondary Education level in their final exams.
2.9 Public Primary Schools versus Private Primary School
National examinations performance is low for most students at the public primary level of
education compared to their counterparts from the private primary schools. This creates a
discriminatory disadvantage to KCPE graduates from public primary schools, particularly
when considering that primary examination is a measure of a learner’s ability and a margin
on which selection and placement to better secondary schools is based. While elite primary
schools in Kenya are largely private, many best secondary schools are public. Almost all the
national and county schools in the country are public and under government ownership.
Factors affecting learner’s performance
The students’ home is the primary agent of their performance in school. This depends on the
family type; monogamous, polygamous or single parent. Many children are hindered from
reaching their optimum level in academic pursuit due to some negative factors arising from
their background (Akomolafe and Olorunfemi-Olabisi, 2011). The family type influences the

11
student’s interest and motivation towards their education and overall academic performance.
The level of motivation is determined by the nature of parental involvement in their
children’s performance by providing conducive learning environment, financial support,
moral and encouragement towards their education. The family type is a significant factor,
influencing student’s academic performance (Akomolafe and Olorunfemi-Olabisi, 2011);
Students from monogamous families usually enjoy parent involvement in their education
better than their counterparts from other family types. Moreover, the students’ performance in
academic and school related activities and functions, significantly depend on their family
type and level of parental involvement in their studies.

12
Table 1: Conceptual Framework on the Study Variables Impact on the Overall
Student's Performance
Independent Variable Dependent Variable
Source: Researcher’s Own Model (2014)
The conceptual framework provides the four basic categories of the factors that influence a
learners performance in KCSE based on the type of primary school they attended. The
primary school characteristics include many features, which this study has considered, such
as the type of school (private or public) and the marks scored in their Kenya Certificate of
Primary education. Among the numerous factors within the secondary school characteristics,
the researcher picked on, the category and the type of secondary school the student attended.
Secondary schools are categorized into; national schools, county schools, extra-county
school, district and private schools. The student are categorized by gender (male or female)
and age, which is based on the recommended age, and common trend, which ranges from, 16
to 20 years for a secondary school student’s age, although higher age bracket 21 to 30 is
sometimes experienced.
Primary school characteristics
STUDENTS’ KCSE
PERFORMANCE
Secondary school
characteristics
Students’ age
Students’ gender

13
CHAPTER THREE – METHODOLOGY
3.1 Introduction
This section presents the study methodology used in an attempt to achieve the objectives of
the study. The chapter provides the data source and collection procedure, description of the
target population and the statistical model used for the analysis development process.
3.2 Data Source
Secondary data on the sampled secondary school academic performance was used in the
study. Secondary data consists of existent information, collected by researchers for different
purposes, from external sources such as documentation, archival records, magazines, and
internet. An advantage of using secondary data in-place of primary data is its ability to save
on time, cost, and labour and furthermore it gives a general idea on how to conduct the
research and the best method to be used since the researcher employs existing information.
Stratified sampling method was used to select the schools to be involved in the research
within Kiambu County. The strata were grouped based on the category of the secondary
school type as either: national, extra- County, county, district, or private schools. A stratum
would later on be regrouped into either boys, girls or mixed schools. The target population
for this particular study was all secondary school students within Kiambu County who were
in the 2009-form one entry and graduated from secondary school in 2013, giving the 2009
secondary school cohort. Out of the 319 secondary schools in Kiambu County, a sample of
six was selected based on a stratified sampling technique on the secondary school category
strata.
3.3 Study Variables definition
Table 1 presents definitions of both dependent and independent variables of the study.

14
Table 2: Definition of Variables Used In the Study
Dependent Variable Definitions
Secondary students KCSE performance
3 = A (excellent)
2 = B (Good)
1= C (Fair)
0 = D (Poor)
Explanatory variables
Primary school Characteristics
Type of primary school
Public = 0
Private = 1
KCPE marks out of 500 marks
Refers to the marks a student score at the
primary school final examination level
Secondary School Characteristics
Type of secondary school
Public = 0
Private = 1
Category of secondary school
National school = 0
Extra county school = 1
County school = 2

15
District school = 3
Private school = 4
Students characteristics
Students age at the time they sit for their
KCSE examination
Refers to the age of a student when they sit
for their KCSE examination
Students’ gender
Female = 0
Male = 1
3.4 Assumptions of the Ordinal Logistic Regression Model
The Ordinal logistic regression model has the following assumptions:
i. The dependent variable assumes its distribution is within the range of the exponential
family of distribution.
ii. Proportional odds assumption or the parallel regression assumption: the relationship
between each pair of outcome groups is the same since the coefficients that describe
the relationship between the lowest versus all higher categories of the response
variable, are the same as those that describe the relationship between the next lowest
category and all higher categories (Ombui et al., 2011).
iii. Logistic regression does not assume a linear relationship between the dependent and
the independent variable but a linear relationship between the logit of the response
and explanatory variables and further, does not require the independent variable to be
in an interval or unbounded.

16
iv. The model assumes that the error terms are independent and that all the variables are
included in the regression model. There is no assumption of a normal distribution over
the error term.
3.5 Ordinal Logistic Regression Model
Ordinal logistic regression is used to model ordered categorical response variables and only
applies to data that meet the proportional odds assumption. The model fits multiple logistic
regressions on a multi-category ordered response variable that has been dummy coded. The
response variable is categorical response variable with categories:
The proportional odds assumption states that the number added to each of the set logarithms
to get the next is the same in every case to form an arithmetic sequence the reference
category is and so non-reference categories have a linear regression
function with the regression parameters given as
, K
And a set of predicator variable vector with
The link function is a transformation of the probabilities that allows for estimation of the
model, in ordinal logistic regression the link function is the logit; the link defines what goes
to the left side of the equation linking the random component on the left side of the equation
and the systematic component on the right. (Adejumo and Adetunji 2013, Ombui et al.,
2011). The logit equations of the Ordinal logistic regression model (OLR) form a comparison

17
the log odds of each of the non-reference response variables to the categorical variable of
choice, logit equations shown as:
, (3.1)
The response probability are then uniquely determined and thus their summation is equal to
one.
(3.2)
(3.3)
For a polytomous outcome , and predictors , the systematic part of the
model is defined as follows:
= (3.4)
This can be re-expressed in terms of the individual category outcome probability by solving
for the unique probabilities to give:
(3.5)

18
For a given predictor , the coefficient gives the change in log odds of the outcome
associated with a unit increase in , for arbitrary fixed values for the remaining predictors
The exponentiated regression coefficient exp ( ) represents the odds
ratio associated with a one unit change in ’ .
Logistic slope coefficients is interpreted as the effect of a unit of change in the X variable on
the predicted logit with the other variables in the model held constant. That is, how a one-unit
change in X affects the log of the odds when the other variables in the model held constant.
3.6 The Likelihood Function
The likelihood function for a given model interpreted as the joint probability of the observed
outcomes expressed as a function of the chosen regression model (Dietz et al. 2005). The
model coefficients are unknown quantities and estimated by maximizing this probability. It is
useful when investigating the contribution of more than one predictor, or for predictors with
multiple levels. According to Shakhawat et al. 2012 the likelihood function is given:
(3.6)
3.7)
The maximization process to estimate the coefficients accomplished by getting the log of the
likelihood function, log-likelihood is:
(3.8)

19
3.7 Ordinal Logistic Regression Parameter Estimator
The linearized log-likelihood function is easy to compute compared to the likelihood function
to obtain the maximum likelihood estimates. To maximize the log-likelihood function, find
the derivative of with respect to the unknown parameters, which are the coefficients. As
illustrated in Equation (3.9)
(3.9)
To obtain the maximum likelihood estimate of the coefficients we use iterative methods (i.e.
the Newton-Raphson Method).

20
3.8 The Odds Ratio in Ordinal Logistic Regression
The odd ratio is calculated using the logistic function:
, j = 0, 1, 2, 3
To simplify the notation, the individual probabilities for the , for the odds to be given as:
(3.10)
Taking the natural logarithm of the equation (3.10), the OR is obtained as:
,
The derivative to get the relationship between the estimated parameters and the odds ratio is:
(3.11)

21
The parameter represents the percentage change in the log-odds ratios from a unit change
in one of the predictor variables . To establish the relationship between the odds ratios and
the probability of , this is given as follows:
(3.12)
(3.13)
,
Therefore,
(3.14)
Moreover, on introducing the natural logarithm to both sides of Equation (3.14):
(3.15)
Equation (3.15) represents the odds-ratio, given in ratio form of the individual probability
odd ratios of the non-reference categories of the response variable compared to the reference
category of the response variable.

22
3.9 Goodness of Fit
The likelihood ratio statistic computed as twice the difference between log-likelihoods from
the two models, and be referred to the distribution for significance testing. Likelihood
ratios used to test for the contribution of the variables in an ordinal logistic regression model
to the overall relationship between the dependent variable and individual independent
variable. Because the likelihood for the full or larger model must be larger than the likelihood
for the smaller (nested) model, the difference will always be positive, therefore using the logit
model the likelihood ratio value given as:
(3.16)
Deviance statistics
Deviances statistics involves a comparison of the log of the maximum of the full model and
the null model- a model with the intercept only.
This gives the deviance statistics based on a comparison between the full and nested models
of the Ordinal logistic regression equation. Whenever the log-likelihood of the null model is
small relative to the log-likelihood of the full model, then the value of D is large, an indicator
that the current model is not good, hence a small value of D gives a good model for use.

23
CHAPTER FOUR - RESULTS AND DISCUSSION
4.1 Data Analysis, Results and interpretation
Table 3: Frequencies of the Study Variables
Study variable frequencies and percentage
Variable Category Frequency Percent Cumulative percent
KCSE grade A 166 24.6 24.6
B 204 30.2 54.8
C 175 25.9 80.7
D 130 19.3 100
Primary school
type
Public 351 48 48
Private 324 52 100
Student’s age
[years]
16 3 0.4 0.4
17 159 23.6 24.0
18 311 46.1 70.1
19 146 21.6 91.7
20 32 4.7 96.4
21 13 1.9 98.4
22 9 1.3 99.7
24 1 0.1 99.9
28 1 0.1 100
Secondary
school type
Public 583 86.4 86.4
Private 92 13.6 100
Secondary
school
County 112 16.6 16.6
District 162 24.0 40.6

24
category Extra county 91 13.5 54.1
National 218 32.3 86.4
Private 92 13.6 100
Student’s
gender
Female 272 40.3 40.3
Male 403 59.7 100
The performance in KCSE is evenly distributed over four grades for the sampled students in
the study. Primary school enrollment to private and public school was almost equal. On the
contrary, at secondary schools level, public school had the highest number of student
enrollment compared to those who had enrolled in private school. Table 3, shows that 324
and 351 students had enrolled in private and public primary schools respectively. However,
in secondary schools, the private schools enrollment decreased to 92 students, yet the public
schools’ enrollment increased from 351 to 583 students.

25
Figure 1: Frequencies for the Sampled Student's Age
The average age for students in high school was 18 years, but the sampled population age
ranged from 16 to an extreme of 28 years of age (Figure 1). There were more male students
enrolled, taking their KCSE exams from the sampled population, compared to the female
students, at 59.7 % and 40.3 % respectively. While Primary school enrolment is near parity,
the case is not the same with secondary school enrolment, despite the fact that this level of
education plays social and economic development. A study by Mburu P.D. (2013) had similar
findings concerning learner’s parity; Females continue to be disadvantaged particularly at the
secondary and post-secondary levels. The process therefore of achieving gender equality
especially at secondary school and higher levels of education continue to be a goal yet to be
achieved in the country’s education sector.

26
Figure 2: KCSE Performance in 2013 within the Sampled Secondary Schools in Kiambu
County Based On Gender
A contradiction appears on Mburu (2013) findings of the disadvantage females had in
performance, in the sampled population of students, where the female students performed
better compared to their male counterparts (Figure 2). While 88% of the “A” scored from the
study sample were by female students, only 12% of the male who were more compared to the
female students, scored an A grade. Similar to the D grade score, 99% of the male sampled
students got a poor grade (D), only 0.8% of the sampled female students scored a D grade.
0
20
40
60
80
100
120
140
160
A B C D
88%
39.7%
25.2%
0.8%
12%
60.3%
74.8% 99.2%
Fre
qu
ency
of
per
form
an
ce b
ase
d o
n g
end
er
KCSE Grade
Female
Male

27
The overall best performances were from the students within national schools. Graduating
from a national school was associated with an increase in the KCSE score of 30 percent of a
standard deviation.
Table 4: A Cross tabulation Table on the Transition Trends of Primary School
Graduates to Secondary Schools Based on the School Type
Type of secondary school Total
PRIVATE PUBLIC
Type of primary school
PRIVATE 64 260 324
PUBLIC 28 323 351
Total 92 583 675
The transition rate from a public primary school to a private secondary school is minimal,
accounting for 4.15 % of the study population, while 9.5 % of the sampled students in this
study, move from private primary school to private secondary schools. There is enormous
enrollment to private primary school since the introduction of free primary education. Yet on
pursing secondary school education 80.2% of the students who had enrolled to private
primary schools moved to public secondary schools. An indication that public secondary
schooling is dominant over the private secondary schooling, and a contradiction to the trend
observed at the primary school level of education. The largest percentage (92%) of those who
were in public primary schools still enrolled in public secondary schools after their KCPE
exams.
According to the sampled study population of 2009 form one- cohorts in Kiambu County
(Table 4), the enrollment within private learning institutions at the primary and secondary
school level decrease from 324 to 92, a difference of 71.6 %. While the transition to public
28
secondary schools from both the private and public primary schools increased from 351 to
583, giving a difference of 39.8 % transition rate.
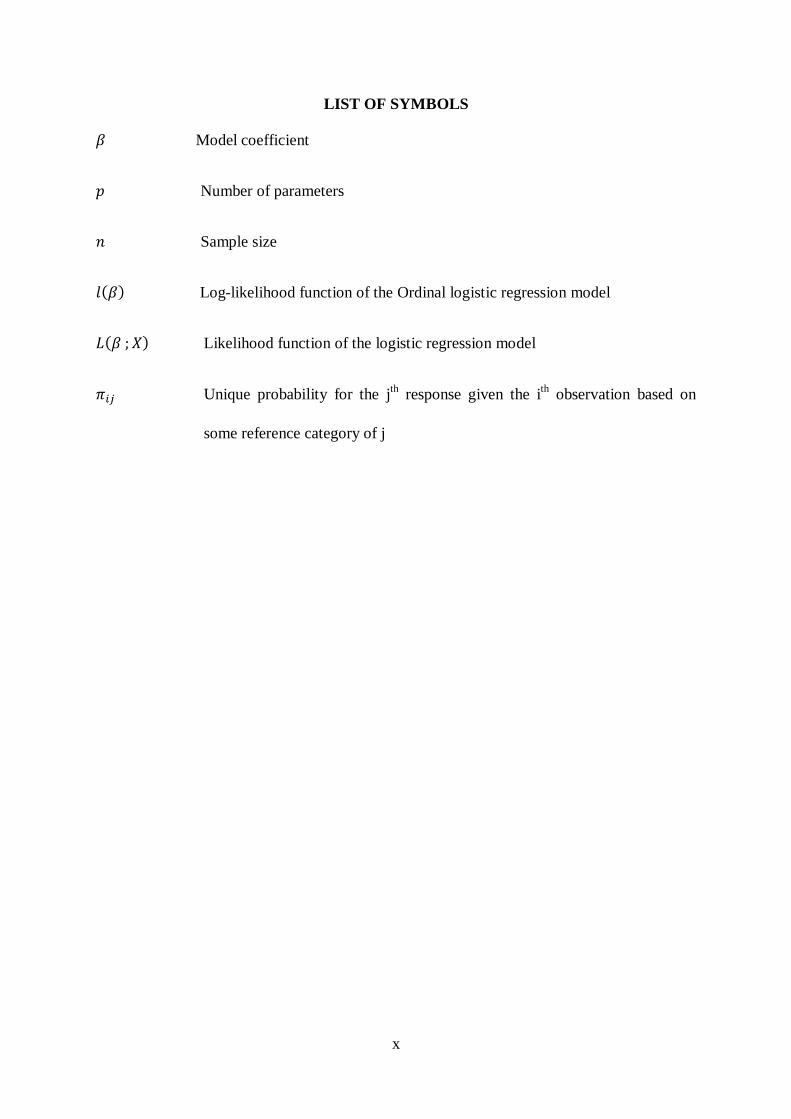
Table 5: The Students Gender Based on the Primary School they attended
Student's Gender Total
Female Male
Primary school type
PRIVATE 164 160 324
PUBLIC 108 243 351
Total 272 403 675
There were more male students in the study sample compared to the female learners. Sixty
percent of the sampled female leaners attended private primary schools while the remaining
40 % attended public primary schools. While a small percentage – 40% of the female went to
public schools, 60 % of the male, had public primary school education as shown in Table 5.

29
Table 6: The Students Gender Based on the secondary School they attended
Student's Gender Total
Female Male
Secondary School Type
PRIVATE 54 38 92
PUBLIC 218 365 583
Total 272 403 675
Table 6 shows that public secondary schools had the highest level of student enrollment
compared to private schools. Similar to the primary school female enrollment trend, there are
more females enrolled to private secondary schools compared to the male students enrolled to
private secondary schools, at 58.7 % and 41.3 % respectively. Tables 5 and 6 indicate that
gender parity in school enrollment has not yet been achieved within the study area, and thus
the whole country. There are more male learners enrolled to schools compared to their female
counterparts, especially at the secondary school level.

30
Figure 3: Frequencies on the Sampled Students KCSE Performance Based on their
Primary School Type: Private or Public Primary School
Private primary schooling had a positive impact on the students’ performance in the final
secondary school examination- KCSE. Private primary school graduates within the sampled
student population had higher levels of performance for grades “A” and “B” compared to
those who attended public primary schools. Fifty four percent of those who scored grade A
were from private primary schools while 63.7 % of the students who scored grade B in their
0
20
40
60
80
100
120
140
A B
C D
54.8%
63.7%
39.4%
26.2%
45.2% 36.3%
60.6%
73.8%
Fre
qu
enci
es o
n s
tud
ents
per
form
an
ce
KCSE performance - grades
Private
Primary
Public
Primary

31
KCSE exams were still private primary school graduates in 2009 (Figure 3). Public primary
school graduates within the sampled student population had higher levels of performance for
grades C and D compared to those who had attended private primary schools. The highest
number of students scoring grade C at their KCSE examination level had gone to public
primary schools, at 60.6% compared to 39.4 % of those who had gone to private primary
schools. Seventy-three percent, compared 26.2 % who scored grade D in their 2013 KCSE
exams from the sampled population of students within Kiambu County, had gone to public
primary schools and private primary schools respectively.

32
Figure 4: Frequencies on the Sampled Students KCSE Performance Based on their
Secondary School Type: Private or Public Secondary School
Public secondary schools achieved better performance compared to private secondary
schools. Only one student from the sampled private secondary schools scored grade A in their
2013 KCSE examinations (Figure 4). Almost all of the students who scored grade A in their
KCSE from the sampled population 0f students within Kiambu County (99.4 %) were from
public secondary schools. A similar situation was observed from the students who showed
good performance by scoring grade B; one hundred and eighty-one students out of two
0
20
40
60
80
100
120
140
160
180
200
A B
C D
1
23
50
18
165
181
125
112
Nu
mb
er O
f S
tud
en
ts
KCSE perfromance -Grade
Private
Secondary
Public
Secondary

33
hundred and four who scored grade B were from public secondary schools. Although public
secondary schools had the highest population, six times that of those in private secondary
schools, their performance in 2013 KCSE, was still commendable compared to that of their
counterparts from the private schools.
Table 7: Test of Parallel Lines
Test of Parallel Linesa
Model -2 Log Likelihood Chi-Square df Sig.
Null Hypothesis 793.764
General 758.014 35.751 18 .234
The null hypothesis states that the location parameters (slope coefficients) are the same across response
categories.
a. Link function: Logit.
The significance value of the parallel line test is greater than alpha at 0.05 hence we accept
the null hypothesis that the location parameters are the same across the response categories
and hence the link function used is appropriate (Table 7).

34
Table 8: Study Variable Maximum Likelihood Parameter Estimates
Estimate Std.
Error
Wald df Sig. 95% Confidence
Interval
Lower
Bound
Upper
Bound
Threshold
[KCSEGRD = A] -10.610 1.788 35.198 1 .000 -14.115 -7.105
[KCSEGRD = B] -7.110 1.746 16.586 1 .000 -10.532 -3.688
[KCSEGRD = C] -3.370 1.714 3.868 1 .049 -6.729 -.011
Location
AGE -.103 .082 1.560 1 .212 -.265 .059
POINTS -.180 .012 227.209 1 .000 -.203 -.156
KCPEMARKS .001 .001 .683 1 .409 -.001 .002
[PRIMARYSCHOOLTYPE=PRIVATE] .052 .211 .060 1 .806 -.465 .362
[PRIMARYSCHOOLTYPE=PUBLIC] 0a . . 0 . . .
[GENDER=0] 1.434 .473 9.181 1 .002 .506 2.361
[GENDER=1] 0a . . 0 . . .
[Sec.Type=PRIVATE] -.171 .427 .160 1 .689 -.666 1.008
[Sec.Type=PUBLIC] 0a . . 0 . . .
[Sec.Categories=COUNTY] 1.464 .571 6.569 1 .010 .344 2.584
[Sec.Categories=DISTRICT] 2.060 .599 11.824 1 .001 .886 3.235
[Sec.Categories=EXTRA-COUNTY] 1.928 .595 10.489 1 .001 .761 3.094
[Sec.Categories=NATIONAL] 0a . . 0 . . .
Link function: Logit.
a. This parameter is set to zero because it is redundant.
Table 8 has several important elements. The Walds statistics and the associated probabilities
using the logit ( ) provide the index of the significance of each predictor in the Ordinal
logistic equation. Table 8, shows that the significant factors in determining a students’
performance at the KCSE level were: the KCPE points a learner scored in their KCPE,
gender of the learner (male or female) and category of secondary school the learner attended.
KCPE performance, according to Lucas Othuon, (1993) was found to be a moderate predictor
of Success in KCSE and overall life performance, which is also a common finding in this

35
study. For all the logit equations, KCPE points were significant in predicting what one scores
in their KCSE exams, a significance level of 0.000. A unit decreases in KCPE points a
learner was 0.18 times more likely chances to score lower cumulative grades in their KCSE.
Therefore, those who registered excellent performance in KCPE were more likely to score
higher grades compared to those whose performance was fair.
Females were more likely to get higher cumulative scores compared to their male
counterparts. There was a 1.434 time more likely increase in logs odds of scoring higher
cumulative grades given that all the other variables in the model are held constant. The
students’ gender had no impact on their performance considering the logit for the response
category. To the contrary, the respective logit ( ) was 1.434 giving an extreme exponential
value, although gender was significant in the model. This disputed the third hypothesis since
there was a significant difference based on the students’ gender. A study by Mburu P.D.,
(2013) on gender based type of schools performance showed that single-sex schools had a
higher percentage of graduates who attended four-year colleges and a lower percentage of
graduates who attended two-year junior colleges than coeducational schools.
Secondary school category; for every move from a lower category of secondary school
ranking in Kiambu county, there are more likely chances of a learner scoring higher
cumulative grades compared to their counterparts at the lower ranked secondary school
categories. There was a 1.464, 1.928, and 2.06 for county, extra-county and district
respectively times more likely chances of a student scoring higher cumulative grades.
Table 9: Pseudo R-Squared
Cox and Snell .723
Nagelkerke .790
McFadden .522
Link function: Logit.

36
Table 9, shows that the maximum values of Cox & Snell and Nagelkerke R2 attained is less
than 1. These values indicate that the ordinal logistic regression model is useful in predicting
the effect of primary school type, age, and gender in predicting KCSE performance.
Table 10: Goodness of Fit of the Model
Goodness-of-Fit
Chi-Square Df Sig.
Pearson 747.651 2001 1.000
Deviance 793.764 2001 1.000
The deviance statistics is a measure of the lack of fit between the data and the model, hence
large values of deviance statics indicate a poor fit of the model to the data. The null
hypothesis being tested in this case states that the observed data is consistent with the fitted
model while the alternative hypothesis states that the observed data is not consistent with the
fitted model. Table 10 shows that p value is equal to 1.00, a value greater than 0.05, being
insignificant the null hypothesis is accepted, the observed data is consistent with the
estimated values in the fitted ordinary logistic model.
Table 11: Model-Fitting Information
Model Fitting Information
Model -2 Log Likelihood Chi-Square Df Sig.
Intercept Only 1659.717
Final 793.764 865.953 9 .000
Link function: Logit.
The -2 Log Likelihood of the model with only intercept is 1659.717 while that of the model
with intercept and independent variables is 793.764. The difference (Chi-square statistics) is
1659.717 – 793.764 = 865.953 that is significant at α=0.05 and the p value is less than 0.001

37
hence there exist an association between the students KCSE performance and the independent
variables used in the study.

38
CHAPTER FIVE -CONCLUSION AND RECOMMENDATION
5.1 Conclusion
KCPE points a learner scored, category of the secondary school attended and the students’
gender were significant in determining the students score in their secondary school final
examination based on the significance value. Although the study findings, also indicate that
age, KCPE scores, secondary school type and the primary school type that a leaner attended,
affected their eventually performance in KCSE based on the 95% confidence interval . The
first and second hypotheses: which are the primary school type, and the student’s age, were
not significant to the level of student’s performance in KCSE while gender - the third
hypothesis was significant. An increase in age beyond 20 years when a student sits for their
KCSE exams had a negative impact on their academic performance.
Private primary schooling has an impact on the learner’s performance in their Kenya
Certificate of Secondary Education. Excellent and good performance in KCSE was evident
from students who had private primary schooling while to the contrary a majority of those
who had public primary schooling scored low grades. The excellent and good performances
in KCSE from private primary schools had joined public secondary schools. Therefore, the
transition from private primary schools to public secondary schools significantly influenced
the students’ performance in their KCSE exams and overall life performance.

39
5.2 Recommendation
A Policy on the keeping of students records detailing primary school type, performance,
secondary school type, gender, age, family type, or structure the students background level of
education and performance, is necessary, in order to enable schools to effectively analyze the
factors affecting individual students performance level, and if possible offer assistance
whenever necessary.
The Ministry of Education and the relevant bodies that carry out students’ selection to
secondary schools should work towards ensuring an even and fair selection allocation of
secondary school spaces to both private and public primary school graduates. This will help
address the current conflict over the form one selection and secondary school allocation
process to different categories of secondary schools in the country, especially to national and
county schools.
Further research on the effect of KCPE marks and KCPE points should be carried out to find
out the difference in the two variables and their impact on a learners’ KCSE performance.
This is based on the study’s findings for the KCPE points and marks significance.

40
REFERENCE
Akomolafe M. J. And Olorunfemi-Olabisi F. A., (2011) Impact of Family Type on Secondary
School Students’ Academic Performance in Ondo State, Nigeria .European Journal of
Educational Studies 3(3), 481-487
Dietz K, Gail M., Krickeberg K., Samet J., Tsiatis A., (2005): Regression Methods in
Biostatistics; Linear, Logistic, Survival, and Repeated Measures Models. Statistics for
Biology and Health. ISBN 0-387-20275-7
Fertig, Michael; Kluve, Jochen (2005): The effect of age at school entry on educational
attainment in Germany, RWI Discussion Papers, No. 27
Mbugua Z. K., Kibet K. Muthaa G. M. and Nkonke G. R., (2012), Factors Contributing To
Students’ Poor Performance in Mathematics at Kenya Certificate of Secondary
Education in Kenya: A Case of Baringo County, Kenya. American International
Journal of Contemporary Research, Vol. 2 (6)
Mburu P. D., (2013), Effects of the Type of School Attended on Students Academic
Performance in Kericho and Kipkelion Districts, Kenya. International Journal of
Humanities and Social Science. Vol. (3) 4
Mwangi N.I. and Nyagah G., (2011): Determinants of Academic Performance in Kenya
Certificate of Secondary Education in Public Secondary Schools in Kiambu County,
Kenya. Journal of Education and Practice. 4. (12), 2013
Mwangi S.K., Tessa B., and Sandefur J.,(2013): Public and Private Provision of education in
Kenya. Journal of African Economic . 22 (2), 39-56
Nelson Jagero , (2013): How Performance of Students In Kenya Certificate of Primary
Education Can Predict their Performance in Kenya Certificate of Secondary,
Education, Educational Research International, Vol. 1 No. 3

41
O’Connell Anne A., (2006): Logistic Regression Models for Ordinal Response Variables;
Quantitative Applications in Social Sciences. Sage publications, Inc.
Othuon L., (1993), A Study of The Predictive Validity of The Kenya Certificate Of Primary
Education Examination: Application Of The Hierarchical Linear Model. University of
British Colombia
Shakhawat Hossain, S. Ejaz Ahmed & Hatem A. Howlader, (2012): Model selection and
parameter estimation of a multinomial logistic regression model, Journal of Statistical
Computation and Simulation, DOI:10.1080/00949655.2012.746347v
Wasanga P., Lewin K. M., Wanderi E., Somerset A., (2011): Participation and Performance
in Education in Sub-Saharan Africa with special reference to Kenya: Improving
Policy and Practice, CREATE PATHWAYS TO ACCESS Research Monograph No.
74
42
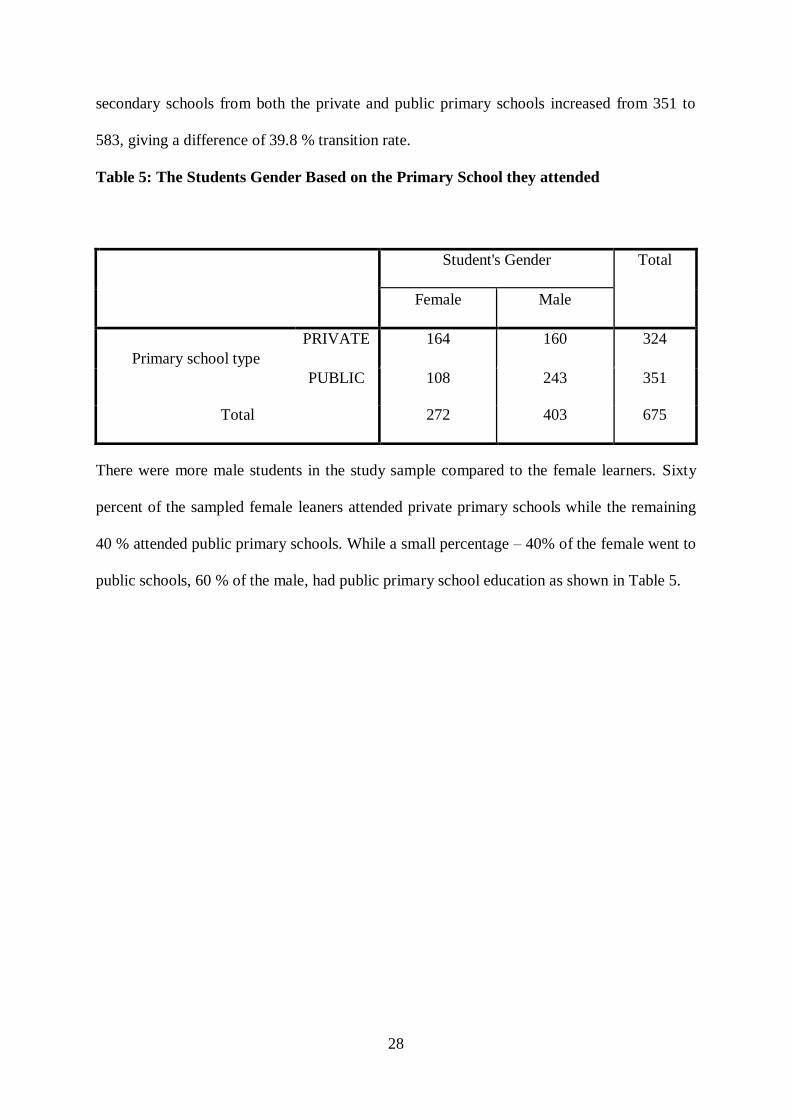
APPENDIX
Appendix A: Frequencies of the Sampled Students Secondary School Type