Embed Size (px)
Citation preview

IJBMEIT: Vol. 4, No. 2, July-December 2012: 141-156
Determinants of Public Expenditure in Assam:An Econometric Study
MOON MOON HUSSAIN1* AND P. SRINAVASA SURESH2
1Asian Institute of Management and Technology, Faculty of Economics (Department of Management), Guwahati, Assam(E-mail: [email protected])2Associate Professor, Department of Economics, NEHU, Shillong
In this paper an attempt is made to analyze the determinants of public expenditure in Assam in both pre economic andpost economic reform period. The analysis reveals that in the pre economic reform period, the net state domesticproduct, per capita net state domestic product, total receipts to net state domestic product were the driving forcebehind the growth of public expenditure thus proving Wagner’s law of increasing expenditures with increasing stateactivities. The study also proves that the increase in total receipts have contributed to the increase in State expenditures.On the other hand, the analysis of the results in the post economic reform period covering the period of our studyshows that the variables per capita revenue expenditure(PCRE), per capita capital expenditure (PCCE), percentage ofurban population to total population (PCUPOP), per capita net state domestic product (PCNSDP), per capita revenueexpenditures on general services (PCREGS), per capita revenue expenditures on economic services (PCREES), netstate domestic product (NSDP), per capita capital expenditures on social services (PCCESS), literacy rate (LR) anddummy variable have been the main factors determining the growth of public expenditures in Assam. The consumerprice index in both the periods has been an insignificant variable in determining public expenditure in Assam.
* Corresponding Author: [email protected]
1. INTRODUCTIONIn recent years, there has been a dramatic surge ofinterest in public expenditure issues amonggovernments, development agencies and wider public.Governments are increasingly realizing the importanceof public expenditure as a tool for achieving theirobjectives, particularly in the area of poverty reduction.Most of the State governments in India have beenexperiencing severe budgetary pressures of varyingmagnitude, resulting in an explosive growth of publicexpenditure. It has been increasing in total rupees, aswell as in terms of per capita expenditure and aspercentage of GNP also. Further, in an underdevelopedcountry like India, where public sector plays a pivotalrole in welfare creation, the burden on the stateexchequer will be still more. While it is difficult toidentify the specific causes of the increases, it appearsthat growth in income; globalization, urbanization andincreased concern for human recourses are allimportant contributions to an expanding public sector.Public expenditure in India rose from 9.1% of GNP inthe early fifties to about 25.3% in the earlynineties and further to about 29% in the latter half ofthe last decade. This sudden rise in public expenditureis mainly attributed to the significant increases
in revenue expenditure, capital expenditure andoutgoings in public accounts. According to Dr. H.Dalton (1970), the former exchequer of the BritishGovernment, public expenditure should be incurred insuch a way so that it equalizes its marginal socialadvantage in all directions. It should also try to balanceits own marginal social advantage with the marginalsocial disadvantages for raising additional revenuesfor the purpose.
2. THE PROBLEMLike most other states, the state governments ofnorth-eastern region of India are also facing severebudgetary pressures with rising demand for publicexpenditure because of their failure to mobilize internalresources adequately and efficiently. The growth rateof Net State Domestic Product (NSDP) is very low inthe north-eastern states when compared to otherdeveloped states like Punjab, Maharashtra, andGujarat etc. Since the commencement of planning inIndia, there has been a very rapid growth ofexpenditure in the State of Assam. Much fund hasflowed from the Assam Government exchequer into theState’s economy in the period of our study. The revenueexpenditure of the State has disproportionatelyincreased while the proportion of capital outlay has

142 / Moon Moon Hussain and P. Srinavasa Suresh
gradually been on the decline. The State budget ofAssam has been experiencing huge deficits in recentyears due to the gap in gross receipts and grossexpenditures. With the enormous expansion of socialand development services and all other activities ofthe state government under the impact of planningwidened. After six decades of ‘planning anddevelopment’, Assam, which was all-India average interms of per-capita SDP at the beginning of the FirstPlan, is now one of the most backward states in thecountry judged by the indicators of development.Moreover, due to the territorial reorganization of theState, the volume of public expenditure in Assam hasundergone various changes. Assam which was all-Indiaaverage in terms of per-capita income before itsbifurcation is now one of the most backward states inthe country. In this backdrop, the present study aimsto analyze the determinants of public expenditure ofState of Assam after its bifurcation and since there isdearth of studies on this topic in the State of Assam,the present study aims to fill this gap.
3. REVIEW OF LITERATUREThe available literature on growth and determinantsof public expenditure is rich and varied. A number ofstudies were carried out in India and abroad to identifythe determinants of public expenditure growth. Almostall the studies in the past employed the regressionanalysis approach to explain the functionalrelationship between the determinant variables andpublic expenditure. Whatever related literatureavailable with us has been put to review to examinetheir relevance to our present study and also to improveupon their limitations if necessary to suit the objectivesof the present study.
Adolf Wagner’s (1883) hypothesis states that owingto the “pressure for social progress” in a welfare state,as the economy expands, public expenditure will alsotend to increase persistently. Wagner also argued thatexpenditure on government administration rises fasterthan the GNP due to the increasing bureaucratizationof the state. Fabricant (1952) was the first to make anempirical study on the growth pattern anddeterminants of local and state level publicexpenditures. In analyzing the inter-state differentialsin the level of public expenditure in the United States,he suggested three independent variables namely percapita income, population density and urbanizationand used a multiple regression model to establish thefunctional relationship between them. With the helpof the regression model, Fabricant succeeded inexplaining that a state with high level of per capitapersonal income would incur the same increase in percapita expenditure as urbanization increases by a given
amount. Peacock and Wiseman (1961) studied thegrowth of public expenditure in U.K. Their hypothesisstates that public expenditure grows due to the growthin revenue. Okafor and Eiya (2011) studied thedeterminants of growth in Government Expenditurein Nigeria. As such four variables namely inflation,public debt, tax revenue and population were used inthe study to determine the growth in publicexpenditure. The results indicate that population,public debt and tax revenue has a significant positiverelationship with total government expenditure whileinflation has a negative relationship with totalgovernment expenditure. Some of the other importantforeign studies are Keynes (1936), Strayer (1949)Samuelson (1954), Kurnov (1963), Sacks and Harris(1964), Fisher (1964) Kee (1965), Adam (1965), Bahland Saunders (1965), Abizadeh and Yousefi (1968),Weicher (1970), Booms (1971), Goffman and Mahar(1971), Sandford (1984), Mahmood (1988), Joulfian andMukherjee (1990), Abizadeh and Basilevsk (1990), Bosland Pandiello (1995), Ahmed, Sohail and Akhtar(2001), Mupimpela (2005), Busemeyar, (2007), etc.
In the Indian context, one of the earliest studieson the determinants of public expenditure growth wasby Dar. Dar (1964) studied the growth of publicexpenditure in India for the year 1951-52 to 1953-59.In his paper, Dar tried to study the relationshipbetween the level of government expenditure with thechanges of population growth and the general priceindex. His study finds that the two explanatoryvariables, i.e., changes in population growth andchanges in general price index have a positive impacton the level of government expenditure. Bhargava(1967) studied the growth of public expenditure in Indiaby employing five sets of explanatory variables namely,the increase in national income, the increase in defenseexpenditure, the rise in price index, economic and socialoverheads and social welfare objectives. His studyobserves that there is a positive correlation betweenthe growth of public expenditure and the independentvariables employed. Zahir (1972) studied the growthand pattern of public expenditure of the state andcentral governments for the period 1951-52 to 1965-66. According to him, the striking change in the largeincrease in the quantum of public expenditure of thestate and the central government is mainly due to thepartition of the country, the financial and politicalintegration of the princely states of India, the influx ofrefugees and the problem of rehabilitation, theprovision of financial adjustments embodied in the newconstitution of India and the implementation of theFive Year Plans. Bhuyan (1984) estimated the trendsand fluctuation pattern of revenue and expendituresof the government of Assam for thirty consecutive

Determinants of Public Expenditure in Assam: An Econometric Study / 143
years, i.e., from 1951-53 to 1978-79. The methodologyadopted by his study is both descriptive and analyticaland statistical techniques of time series analysis havebeen used. His study asserts that the human capitalformation has increased tremendously during theperiod 1951-52 to 1978-79 but the physical capitalformation did not increase the same way. According tohim, out of the expenditure on economic services, muchemphasis was given on agriculture but industry andtransport remained neglected all through. His studyhowever concludes that no budget of the governmentof Assam were policy oriented. Lewis and Rice (1985)studied the size and determinants of public expenditurein the United States and assert that it is the demandfor the pressure groups, influence of elite preferences,and the preference of the masses that determine thelevel of public expenditure. Bhatt and Varalakshmi(1994) attempted to study the impact of political, socialand economical factors on each item of publicexpenditure across Indian states for the years 1969-70, 1980-81 and 1988-89 for 22 Indian states. Theytook ten explanatory variables into account namely,per capita tax revenue, per capita debts, per capitagrants- in-aid, literacy rate, density of population,primary sector contributions, urban population,percentage of SC/ST in total population, per capitaincome, and political variable. They observed thatexcept for the year 1969-70, political variable hasalways been one of the major determinants of publicexpenditure in India. Singh (1997) made a time seriesstudy on public expenditure of the Indian economy forthe period 1960-60 to 1992-93. The main aim of thisstudy was to validate the Wagner’s law of increasingpublic expenditure for the Indian economy. The resultsof the study show that Wagner’s Law is operative withrespect to total expenditure of the central governmentcurrent expenditure and gross capital formation.Nongbri (2002) studied the growth, pattern anddeterminants of public expenditure for the State ofMeghalaya for a period of thirty years, viz, from 1972-73 to 2001-2002. His study concluded that per capitaincome, NSDP, Consumer price index, the tertiarysector and the primary sector are the main variableswhich determine the growth of public expenditure inan underdeveloped State like Meghalaya. All thesefactors have led to an increasing growth of publicexpenditure resulting in poverty of the State. Mishraand Suresh (2005) studied the growth anddeterminants of public expenditure in north-easternstates in general and Nagaland in particular for thirty-eight years, ie, from 1963-64 to 2000-01. The result ofthe study suggests that both Congress and non-congress regimes have negative impact on the growthof non-developmental expenditure in the state. The
study further concludes that ideological leanings of theparties in power or a change of government from noncongress to congress does not seem to make anysystematic difference to the determination of publicexpenditure in the State of Nagaland. Rahman (2008)examined the evolution of public health expenditurein India for the period 1971 to 1991. The empiricalresults show that the key determinants in theexplanation of the regional health expenditure are realstate per capita income and literacy rate, while otherstructural demand variables such as the proportion ofthe state population over age 60, population perprimary health care center and population per doctorare statistically insignificant factors. Some of the otherimportant national studies are Reddy (1972), Sarma,Parek, and Singh (1974), Sharma (1977), Desai (1976),Pillai (1981), Rao (1981), Pillai (1981), Murthy (1982),Ranjana (1989), Bhatt and Patnaik (1991), etc.
The studies mentioned above made a substantialcontribution in identifying the important variables thataffect the growth and pattern of public expenditure.The basic variables used in most of the studies includeper capita income, urbanization, population density,social, cultural and political philosophy of the country,technological change, CPI, GNP, foreign aid, opennessof the economy, etc. while the model used is regressionanalysis.
4. RESEARCH GAPS IDENTIFIEDThe review of the above studies reveals the followinggaps in the current literature of determinants of publicexpenditure in the Indian context:
(i) Causal relationship between total receipts andexpenditure of Indian states has not beenverified empirically.
(ii) Attempts have not been made to consider thesocial, economic, general and demographicfactors together to identify the determinantfactors of each item of public expenditure inIndian States.
(iii) Attempts have not been made to identify theimpact of State income of Assam on publicexpenditure.
It is observed from the above related studies thatmuch work has yet to be done in the field of publicexpenditure and therefore it seemed quite appropriateto the investigator to study the growth, pattern anddeterminants of public expenditure of Assam. Thedearth of recent studies on this topic in thenortheastern states particularly in the State of Assamprovides a solid ground for the necessity anddesirability of undertaking an anatomy of the

144 / Moon Moon Hussain and P. Srinavasa Suresh
determinants of public expenditure in Assam.However, no such attempt has been made to study thedeterminants of public expenditure for the State ofAssam. Hence, keeping this in mind, an attempt ismade in the preceding chapter to study thedeterminants of public expenditure for the State ofAssam for a period of three decades, i.e., from 1973-74to 2008-09 and fill up the above mentioned gaps.Attempt has also been taken to include 17 variableswhich have not been used in any of the studiesmentioned above.
5. OBJECTIVES OF THE STUDYThe specific objectives of the study are:
1. To examine the extent to which State incomecauses public expenditure, mainly through anincrease in demand for public expenditure.
2. To explain the public expenditure growth interms of resource constraints and prospects ofinternal resource mobilization.
3. To find out the factors responsible fordetermining the level and size of publicexpenditure.
4. To examine the major constraints retarding theeconomic development of the State and tosuggest measures for the overall developmentof the state.
6. HYPOTHESES OF THE STUDYThe study intends to test the following hypotheses:
1. There is a direct relationship between the levelof public expenditure and level of NSDP.
2. Changes in Consumer Price Index (CPI)influence the level and quantum of publicexpenditure.
3. The growth of public expenditure and thequantity of public services provided bear afunctional relationship.
7. DATA AND METHODOLOGYThe study is based on secondary data. The study coversa time period of thirty-six years, i.e., from 1973-74 to2008-09. As such the relevant statistical data for thirty-six year period were collected from various governmentpublications and annual budgets of Assam StateGovernment, including their Memoranda. The majorsources of secondary data include budgetary datarelating to the State Government as published fromtime to time in the Assam Development Report, TheEconomic Survey of Assam, Statistical Handbook of
Assam, Statistical Abstract of Assam, etc. In order tohave a better idea about the determinants of publicexpenditure over the period of 36 years, the databasehas been segregated into two parts-pre economicreforms (1973-74 to 1990-91) and post economicreforms (1991-92 to 2008-09) covering the period of ourstudy comprising of eighteen years in each part. Thisis an empirical study and data were collected,tabulated, processed and analyzed by applyingappropriate statistical techniques like multivariatelinear regression analysis.
The main thrust of this research work is to findout the major determinants of public expenditure inAssam. As such the total public expenditure is takenas the dependent variable while 17 other independentvariables namely Net State Domestic Product, PerCapita Net State Domestic Product, Per Capita TotalReceipts, Percentage of Total Receipts to Net StateDomestic Product, Consumer Price Index, Density ofpopulation, Per Capita Capital Expenditure,Percentage of Urban Population to total population,Per Capita Revenue Expenditures on General Services,Per Capita Revenue Expenditures on Social Services,Per Capita Revenue Expenditures on EconomicServices, Per Capita Capital Expenditures on GeneralServices, Per Capita Capital Expenditures on SocialServices, Per Capita Capital Expenditures on EconomicServices and Literacy Rate, Time variable and Dummyvariable have been used based on their theoreticalrelevance as well as empirical importance as emergedout of the earlier studies conducted by variouseconomists both in India and abroad. In order to findout the likely determinants of public expenditure ofAssam the following multivariate linear regressionmodels have used by trial and error method. So fromthe results of these regressions, the main determinantswill be chosen and they will be included in a final model.
PE = a0 + a1 PCNSDP + a2 CPI + a3 (1)PCTREC + a4 DOP+ t + D
PE = a0 + a1 PCCE + a2 TRNSDP + a3 (2)PCUPTP + t + D
PE = a0 + a1 NSDP + a2 PCREGS + a3 (3)PCRESS + a4 PCREES5+ t + D
PE = a0 + a1 NSDP + a2 PCREGS + a3 (4)PCRESS + a4 PCREES + a5 LR + t + D
PE = a0 + a1 PCNSDP + a2 PCCEGS + a3 (5)PCCESS + a4 PCCEES + a5 LR. + t + D
where
PE = Total Public Expenditure
NSDP = Net State Domestic Product
Determinants of Public Expenditure in Assam: An Econometric Study / 145
CPI = Consumer Price Index
LR = Literacy rate
PCTREC = Per Capita Total Receipts
DOP = Density of Population
PCNSDP = Per Capita Net State Domestic Product
TRNSDP = Percentage of Total Receipts to NSDP
UPTP = Percentage of Urban Population to totalpopulation
PCCE = Per Capita Capital Expenditure
PCREGS = Per Capita Revenue Expenditure onGeneral Services
PCRESS = Per Capita Revenue expenditure onSocial Services
PCCEEC = Per Capita Revenue Expenditure onEconomic Services
PCCEGS = Per Capita Capital Expenditure onGeneral Services
PCCESS = Per Capita Capital Expenditure SocialServices
PCCEEC = Per Capita Capital ExpenditureEconomic Services
t = time variable
D = dummy variable.
The above mentioned model specifications will beestimated by multiple regression analysis. This is anempirical study and data has been collected, tabulated,processed and analyzed systematically by applyingappropriate statistical tools.
The choice of the explanatory variables is basedon certain considerations. The implicit logic behindtaking Net State Domestic Product as a dependentvariable is because government spending is consideredto be a part of State Income. In a developing state likeAssam where state income has been steadilyincreasing, increase in absolute amount of publicexpenditure is quite natural. Though State income maynot be the only factor to bring about changes in thetotal public expenditure, it plays a very important rolein shaping public expenditure. From the beginning ofour study, public expenditure has been increasing withthe increase in State income. Such income expendituregrowth is in conformity with the Wagner’s doctrine ofincrease in state activities which says that governmentexpenditure in any society will grow at a faster ratethan community output will do. This is also because ofthe fact that in a comparatively backward State like
Assam, government expenditure has been the primemover of its socio-economic growth. Thus, a majorchunk of public expenditure can be derived fromthe State income. We maintain a notion that NSDPis an indicator of the health of the economy andcould be regarded as a resultant effect of publicexpenditure.
The study has taken Per capita income whichprovides a rough idea about the average income andstandard of living of the people of the State which wasalso found to be an important explanatory variable bymany of the earlier studies like Fabricant (1952), Bhattand Patnaik (1991), Bhatt (1997), etc. Further, it isbelieved that the level of public expenditure in the Statedepends on the total receipts and hence it is consideredas an important variable in determining publicexpenditure.
Consumer price index (CPI) is included as animportant as explanatory variable. Consumer PriceIndex may reveal a positive relationship between therise in prices and the rise in government expenditures.The State has been experiencing an upsurge in pricesince the introduction of planned development process.The basic causes responsible for this increasing trendin prices are the steadily accelerating tempo ofinvestment programmes from year to year, insufficientproduction in relation to demand, deficit financing inthe government sector, diverging trend in theagricultural production, heavy dependence on outsidesources, of supply of most of the essential consumergoods, heavy investment expenditure, bottlenecks intransport sector and decline in production. The coststructure of Assam is also very high and this has ledto a raise in the cost of all projects under different plans.The changes in prices cause changes in the cost ofproviding public services. Any upward pressure ingeneral prices pushes up both the material cost andwages and salaries particularly in the organized sector.As a result, the cost of providing public services goesup. The inclusion of this variable in the model arisesdue to the fact that a substantial portion of the State’sexpenditure is constituted by wages and salaries whichmay reasonably be presumed to increase proportionatelywith consumer price index. Government has to increasethe salaries, dearness allowances, etc. of thegovernment employees from time to time leading to arapid increase in government expenditure.
It is believed that demographic factors likepercentage of urban population to total population anddensity of population also play a very important rolein determining public expenditure in Assam. Each yearnearly one-third of the Bangladeshis suffering fromdevastating floods and cyclone are migrating to Assamfor better living, creating a huge problem for the state.

146 / Moon Moon Hussain and P. Srinavasa Suresh
It’s not only the influx of Bengali Muslims who startedto settle in Government wastelands, forest land,grazing land, and low lying char areas, a good numberof Nepali people also started to flow into the State fromNepal who started to settle in the hilly areas for dairyfarming which were not in the knowledge of local peopleor revenue administration. All this has led to anincrease in the absolute size of the population whichcalls for an absolute expansion of the basic governmentservices like maintenance of law and order, justice andjails, education, medical services, public health, watersupply, etc, thus leading to an increasing level of publicexpenditure. Hence percentage of urban population tototal population and density of population are includedas explanatory variables in the models.
Further factors like General Services, SocialServices, and Economic Services under both capital andrevenue expenditures are taken as explanatoryvariables as the State government in order to bringabout overall growth and development in the State ofAssam has been spending immensely on education, art,culture, health, family welfare, public health,administrative expenditure, departmental expenditure,pensions, interest payments, agriculture and alliedactivities, industry, mines, water resources and powerdevelopment, transport and communication, etc.
Literacy rate has also been considered as anexplanatory variable for public expenditure in Assam.The literacy rate which was just 29.9 per cent in 1971census increased to 52.89 per cent in 1991 census andfurther to 63.25 per cent in 2001 census as the StateGovernment has been implementing variouseducational programmes. To enhance educationalprogress in the state, Universal Elementary Education(UEE) and Sarva Siksha Abhijyan (SSA) are beingpursued by the state.
Time variable (t) is included in the model to capturethe effect of time on public expenditure. Dummyvariable is also included in the above models to accountfor sudden increase or decrease in public expenditurewherever there is rapid increase or decrease.
8. ANALYSIS AND RESULTSThe analysis and results have been segmented intotwo sections. In the first section, an attempt is madeto find out the determinants of public expenditure inthe State of Assam in the pre economic reform periodcovering the period of our study, i.e., 1973-74 to 1990-91. All the five models mentioned above are estimatedby the method of OLS. The dummy variable is includedin the post economic reform period to account for thesudden increase in the expenditure during the year2004-05.
It may be pointed out here that the abovementioned model specifications are estimated by OLS.In almost all the estimated regression equations, it isobserved that the Durbin – Watson d statistic indicatedthe presence of either positive or negative autocorrelation in both pre and post economic reform periodin Assam. Although, OLS estimators remain unbiasedas well as consistent, they are no longer efficient whenautocorrelation is present in the model [Gujarati, D(2009)]. Also, the t and F tests of significance cannotbe applied legitimately. Hence, the researcher had toresort to some remedial measures to correct for thisauto correlation problem. The remedy depends on whatknowledge one has about the nature of interdependenceamong the disturbance terms.
The remedy for auto-correlation involves in findingout the coefficient of auto-correlation � and then usingthe estimated � to transform the original data by doingsome manipulations. There are many methods in theliterature which are used to calculate �. Durbin-Watsond statistic, Theil-Nagar d statistic, Durbin’s two-stepprocedure and the Cochrane-Orcutt iterative methodare some of the well known methods. However, theCochrane-Orcutt iterative method is very popular inapplied econometric research and as such, this C-Omethod has been used to estimate the parameters ofthe above five models. The model specifications 1 to 5are hence estimated using the Cochrane-Orcuttiterative method and the results are given below.
9. RESULTS AND DISCUSSIONS IN THE PREECONOMIC REFORM PERIOD
Table 1 shows the results of the model specification 1estimated by Cochrane-Orcutt Method of Estimation(AR1).
Table 1Cochrane-Orcutt Method of Estimation (AR1)
Dependent Variable: Total Expenditure18 observations used for estimation from 1 to 18
Model 1 Coefficient Standard Error T-statisticConstant 486.9696 1230.1 .39589[.699]TIME 55.7923 51.1872 1.0900[.297]PCNSDP 38.3552 15.2856 2.5092[.027]CPI -3.8966 1.5086 -1.5828[.064]PCTREC .50764 .30821 2.6471[.025]DOP -3.1759 7.2682 -.43696[.670]R-Squared: 0.98445 R-Bar-Squared: 0.97512 D-W Statistic: 2.0684F-stat. F (6, 10) 105.4991[.000]
Table 1 shows the results of model 1 estimated bythe method of Cochrane-Orcutt Method of Estimation(AR1). In this model the variables, per capita net statedomestic product (PCNSDP), consumer price index

Determinants of Public Expenditure in Assam: An Econometric Study / 147
p value is 0. Thus we can reject the null hypothesisthat the regressors have no impact on the regressand.
The results of the model specification 3 estimatedby the C-O method are given in Table 3.
Table 3Cochrane-Orcutt Method of Estimation (AR1)
Dependent Variable: Total Expenditure18 observations used for estimation from 1 to 18Model 3 Coefficient Standard Error T-statisticConstant -115.0802 459.4836 -.25046[.806]TIME -54.2622 91.2970 -.59435[.563]NSDP .44882 .078487 5.7184[.000]PCREGS -7.7348 5.1255 -1.5091[.157]PCRESS 4.9958 5.2888 .94461[.363]PCREES 1.2772 3.4845 .36653[.720]R- Squared: 0.97384 R-Bar-Squared: 0 .978150 D-W Statistics:2.0020F-stat. F (6, 10) 62.0477[.000].
The estimated results of model 3 are given above inTable 3. In this model, the variables net state domesticproduct (NSDP), per capita revenue expenditure ongeneral services (PCREGS), per capita revenueexpenditures on social services (PCRESS) and per capitarevenue expenditures on economic services (PCREES)are taken as determinants of public expenditure. Themodel is found to be statistically fit with R-Squared andR-Bar-Squared being 0.97384 and 0.978150respectively. The presence of auto-correlation in themodel was taken care of by resorting to the C-O iterativemethod. All the variables are statistically insignificantexcept net state domestic product (NSDP) which is notonly significant but exerting a positive influence onpublic expenditure. The constant and time variables areinsignificant. The F test which shows the overallsignificance of a model gives a very high value and thep value is 0. Thus we can reject the null hypothesis thatthe regressors have no impact on the regressand.
The results of the model specification 4 estimatedby Cochrane-Orcutt Method (AR1) are given in Table 4.
Table 4Cochrane-Orcutt Method of Estimation (AR1)
Dependent Variable: Total Expenditure18 observations used for estimation from 1 to 18
Model 4 Coefficient Standard Error T-statisticConstant 42859.3 28463.6 1.5058[.160]TIME 49.4802 74.3472 .66553[.519]NSDP .49678 .080554 6.1670[.000]PCREGS -6.6317 5.3477 -1.2401[.241]PCRESS 2.3087 6.5710 .35135[.732]PCREES -1.6111 3.4852 -.46228[.653]LR -1447.9 958.7333 -1.5102[.159]R- Squared: 0. 98650 R-Bar-Squared: 0. 98235 D-W Statistics:2.0101F-stat. F (7, 9) 54.4598[.000]
(CPI), per capita total receipts (PCTREC) and densityof population (DOP) are included as explanatoryvariables of public expenditure. The model is found tobe statistically fit with R-Squared and R-Bar-Squaredwell above 0.98. Also the presence of auto-correlationin the model was taken care of by resorting to the C-Oiterative method. The results show that except thevariable per capita net state domestic product(PCNSDP) and per capita total receipts (PCTREC), allthe other variables, i.e., density of population (DOP),consumer price index (CPI), including the constant andtime variable are found to be statistically insignificant.The F test which shows the overall significance of amodel gives a very high value and the p value is 0.Thus we can reject the null hypothesis that theregressors have no impact on the regressand.
The results of the model specification 2 estimatedby the method of Cochrane-Orcutt Method ofEstimation (AR1) are given in Table 2.
Table 2Cochrane-Orcutt Method of Estimation (AR1)
Dependent Variable: Total Expenditure18 observations used for estimation from 1 to 18Model 2 Coefficient Standard Error T-statisticConstant 2873.9 3524.6 .81539[.430]TIME 139.2129 69.1884 2.0121[.045]PCCE 5.5853 5.0029 1.1164[.284]TRNSDP 51.0770 14.4337 3.5387[.004]PCUPTP -502.3738 409.1648 -1.2278[.241]R- Squared: 0.98135 R-Bar-Squared: 0.98741 D-W Statistics:2.0142F-stat. F (5, 11) 16.3413[.000].
Table 2 above shows the results of model 2estimated by the method of Cochrane-Orcutt Methodof Estimation (AR1). Here, the variables per capitacapital expenditures (PCCE), percentage of totalreceipts to net state domestic product (TRNSDP), andpercentage of urban population to total population(PCUPTP) are included. The model is found to besatisfactory in explaining the variation in dependentvariable as reflected by R2 of 0.98893 and R-Bar-Squared of 0.98. Also the presence of auto-correlationin the model was taken care of by resorting to the C-Oiterative method. Here, only percentage of total receiptsto net state domestic product (TRNSDP) and timevariable is highly significant and exerting a positiveinfluence on the dependent variable, i.e., total publicexpenditure. While the other variables including thepercentage of urban population to total population(PCUPTP), per capita capital expenditures (PCCE),and constant are insignificant in determining publicexpenditure. The F test which shows the overallsignificance of a model gives a very high value and the

148 / Moon Moon Hussain and P. Srinavasa Suresh
Table 4 above shows the results of model 4estimated by the method of Cochrane-Orcutt Methodof Estimation (AR1). Here the variables net statedomestic product (NSDP), per capita revenueexpenditure on general services (PCREGS), per capitarevenue expenditures on social services (PCRESS), percapita revenue expenditures on economic services(PCREES) and literacy rate (LR) are taken asexplanatory variables of public expenditure. The modelis found to be statistically fit with R- Squared andR-Bar-Squared above 0.98. All the variables arestatistically insignificant except net state domesticproduct (NSDP), which is showing a positive influenceon the dependent variable, i.e., public expenditure. Thepresence of auto-correlation in the model was takencare of by resorting to the C-O iterative method. Theconstant along with the time variable are found to bestatistically insignificant in influencing the dependentvariable. The F test which shows the overallsignificance of a model gives a very high value and thep value is 0. Thus we can reject the null hypothesisthat the regressors have no impact on the regressand.
Table 5 shows the results of the model specification5 estimated by the method of Cochrane-Orcutt Methodof Estimation (AR1)
Table 5Cochrane-Orcutt Method of Estimation (AR1)
Dependent Variable: Total Expenditure18 observations used for estimation from 1 to 18
Model 5 Coefficient Standard Error T-statistic
Constant 28415.6 28022.1 1.0140[.332]TIME -46.9815 52.3741 -.89704[.389]PCNSDP 103.5314 12.4366 8.3247[.000]PCCEGS -78.5639 63.9837 -1.2279[.245]PCCESS 28.5760 22.0354 1.2968[.221]PCCEES -6.4974 5.3481 -1.2149[.250]LR -957.5146 940.0593 -1.0186[.330]
R- Squared: 0 .97547 R-Bar-Squared: 0 .97638 D-W Statistic:2.123F-stat. F (7, 9) 51.1204[.000].
Table 5 above shows the results of model 5estimated by the method of Cochrane-Orcutt Methodof Estimation (AR1). In this model, the variables percapita net state domestic product (PCNSDP), per capitacapital expenditure on general services (PCCEGS), percapita capital expenditures on social services(PCCESS), per capita capital expenditures on economicservices (PCCEES) and literacy rate (LR) are includedas explanatory variables of public expenditure. Themodel is found to be statistically fit with R-Squaredand R-Bar-Squared with 0.97547 and 0.97638respectively. The presence of auto-correlation in the
model was taken care of by resorting to the C-Oiterative method. The variable per capita net statedomestic product (PCNSDP) is considered to bestatistically significant in determining publicexpenditure while, the rest of the variables arestatistically insignificant. The constant and timevariables are also considered to be statisticallyinsignificant. The F test which shows the overallsignificance of a model gives a very high value and thep value is 0. Thus we can reject the null hypothesisthat the regressors have no impact on the regressand.
The results of the analysis undertaken in thepre-reform period covering the period of our study, i.e.,from 1973-74 to 1990-91 as depicted in the Tables 1 to5 have shown that per capita net state domestic product(PCNSDP), percentage of total receipts to net statedomestic product (TRNSDP) and net state domesticproduct (NSDP) are the important determinants ofPublic expenditure of Assam. Hence, in order to furtherverify their significance we have decided to include allthese important variables along with some othervariables namely total receipts (TREC), per capitarevenue expenditures (PCRE) and per capita nondevelopment revenue expenditures (PCNDRE) in asingle model. Accordingly, all these variables areincluded as explanatory variables in model 6 inTable 6, and the model is estimated by Cochrane-Orcuttmethod. The model is given below.
PE = a0 + a1 NSDP + a2 DOP + a3 PCCE + a4PCREGS + a5 PCCEGS + a6 PCCEES + a7LR + a8 TREC + a9 PCRE + a10PCNDRE + t11+ D12 (6)
Table 6 shows the results of the model specification6 estimated by the method of Cochrane-Orcutt Methodof Estimation (AR1).
Table 6Cochrane-Orcutt Method of Estimation (AR1)
Dependent Variable: Total Expenditure18 observations used for estimation from 1 to 18
Model 6 Coefficient Standard Error T-statistic
Constant 282.2225 1361.2 .20734[.842]TIME -55.2883 147.2143 -.37556[.718]NSDP .30748 .10428 2.9486[.021]DOP -1.8459 8.8957 -.20750[.842]PCCE .52260 5.1047 .10238[.921]PCREGS -2.2850 19.4024 -.11777[.910]PCCEGS -10.9977 77.2214 -.14242[.891]PCCEES 6.4095 8.5291 .75149[.477]LR .22710 .27043 .83976[.410]TREC .33888 .29278 2.1574[.015]PCRE 3.9942 4.0779 .97948[.360]PCNDRE -13.2459 18.0182 -.73514[.486]
R-Squared: 0.98888 R-Bar-Squared: 0.98443 D-W Statistics:2.001F-stat. F (11, 5) 40.4335[.000].
Determinants of Public Expenditure in Assam: An Econometric Study / 149
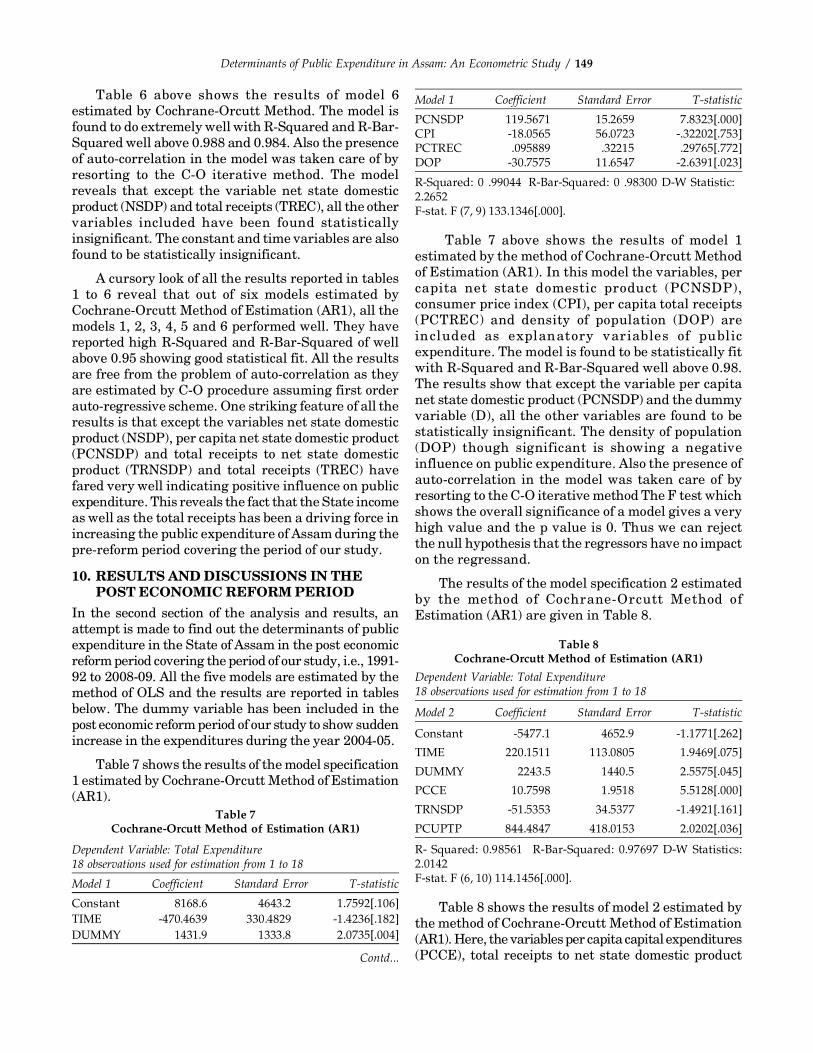
Table 6 above shows the results of model 6estimated by Cochrane-Orcutt Method. The model isfound to do extremely well with R-Squared and R-Bar-Squared well above 0.988 and 0.984. Also the presenceof auto-correlation in the model was taken care of byresorting to the C-O iterative method. The modelreveals that except the variable net state domesticproduct (NSDP) and total receipts (TREC), all the othervariables included have been found statisticallyinsignificant. The constant and time variables are alsofound to be statistically insignificant.
A cursory look of all the results reported in tables1 to 6 reveal that out of six models estimated byCochrane-Orcutt Method of Estimation (AR1), all themodels 1, 2, 3, 4, 5 and 6 performed well. They havereported high R-Squared and R-Bar-Squared of wellabove 0.95 showing good statistical fit. All the resultsare free from the problem of auto-correlation as theyare estimated by C-O procedure assuming first orderauto-regressive scheme. One striking feature of all theresults is that except the variables net state domesticproduct (NSDP), per capita net state domestic product(PCNSDP) and total receipts to net state domesticproduct (TRNSDP) and total receipts (TREC) havefared very well indicating positive influence on publicexpenditure. This reveals the fact that the State incomeas well as the total receipts has been a driving force inincreasing the public expenditure of Assam during thepre-reform period covering the period of our study.
10. RESULTS AND DISCUSSIONS IN THEPOST ECONOMIC REFORM PERIOD
In the second section of the analysis and results, anattempt is made to find out the determinants of publicexpenditure in the State of Assam in the post economicreform period covering the period of our study, i.e., 1991-92 to 2008-09. All the five models are estimated by themethod of OLS and the results are reported in tablesbelow. The dummy variable has been included in thepost economic reform period of our study to show suddenincrease in the expenditures during the year 2004-05.
Table 7 shows the results of the model specification1 estimated by Cochrane-Orcutt Method of Estimation(AR1).
Table 7Cochrane-Orcutt Method of Estimation (AR1)
Dependent Variable: Total Expenditure18 observations used for estimation from 1 to 18
Model 1 Coefficient Standard Error T-statistic
Constant 8168.6 4643.2 1.7592[.106]TIME -470.4639 330.4829 -1.4236[.182]DUMMY 1431.9 1333.8 2.0735[.004]
Model 1 Coefficient Standard Error T-statistic
PCNSDP 119.5671 15.2659 7.8323[.000]CPI -18.0565 56.0723 -.32202[.753]PCTREC .095889 .32215 .29765[.772]DOP -30.7575 11.6547 -2.6391[.023]
R-Squared: 0 .99044 R-Bar-Squared: 0 .98300 D-W Statistic: 2.2652F-stat. F (7, 9) 133.1346[.000].
Table 7 above shows the results of model 1estimated by the method of Cochrane-Orcutt Methodof Estimation (AR1). In this model the variables, percapita net state domestic product (PCNSDP),consumer price index (CPI), per capita total receipts(PCTREC) and density of population (DOP) areincluded as explanatory variables of publicexpenditure. The model is found to be statistically fitwith R-Squared and R-Bar-Squared well above 0.98.The results show that except the variable per capitanet state domestic product (PCNSDP) and the dummyvariable (D), all the other variables are found to bestatistically insignificant. The density of population(DOP) though significant is showing a negativeinfluence on public expenditure. Also the presence ofauto-correlation in the model was taken care of byresorting to the C-O iterative method The F test whichshows the overall significance of a model gives a veryhigh value and the p value is 0. Thus we can rejectthe null hypothesis that the regressors have no impacton the regressand.
The results of the model specification 2 estimatedby the method of Cochrane-Orcutt Method ofEstimation (AR1) are given in Table 8.
Table 8Cochrane-Orcutt Method of Estimation (AR1)
Dependent Variable: Total Expenditure18 observations used for estimation from 1 to 18
Model 2 Coefficient Standard Error T-statistic
Constant -5477.1 4652.9 -1.1771[.262]
TIME 220.1511 113.0805 1.9469[.075]
DUMMY 2243.5 1440.5 2.5575[.045]
PCCE 10.7598 1.9518 5.5128[.000]
TRNSDP -51.5353 34.5377 -1.4921[.161]
PCUPTP 844.4847 418.0153 2.0202[.036]
R- Squared: 0.98561 R-Bar-Squared: 0.97697 D-W Statistics:2.0142F-stat. F (6, 10) 114.1456[.000].
Table 8 shows the results of model 2 estimated bythe method of Cochrane-Orcutt Method of Estimation(AR1). Here, the variables per capita capital expenditures(PCCE), total receipts to net state domestic productContd...

150 / Moon Moon Hussain and P. Srinavasa Suresh
(TRNSDP), and percentage of urban population to totalpopulation (PCUPTP) are included as independentvariables. The model is found to be satisfactory inexplaining the variation in dependent variable asreflected by R2 of 0.98561 and R-Bar-Squared of 0.9769respectively. Here, only the variables per capita capitalexpenditures (PCCE), percentage of urban populationto total population (PCUPTP) and dummy variable (D)are highly significant and exerting a positive influenceon the dependent variable, i.e., total publicexpenditure. While the other variables includingpercentage of total receipts to net state domesticproduct (TRNSDP) constant and time variables areinsignificant in determining public expenditure. Alsothe presence of auto-correlation in the model was takencare of by resorting to the C-O iterative method. The Ftest which shows the overall significance of a modelgives a very high value and the p value is 0. Thus wecan reject the null hypothesis that the regressors haveno impact on the regressand.
The results of the model specification 3 estimatedby the C-O method are given in Table 9.
Table 9Cochrane-Orcutt Method of Estimation (AR1)
Dependent Variable: Total Expenditure18 observations used for estimation from 1 to 18
Model 3 Coefficient Standard Error T-statistic
Constant 382.0386 367.3732 1.0399[.321]
TIME -461.0836 131.3323 -3.5108[.005]
DUMMY 70328.6 20049.0 3.5078[.005]
NSDP .049875 .020510 2.4317[.033]
PCREGS 6.5862 2.3101 2.8510[.016]
PCRESS -3.3539 1.4314 -2.3430[.039]
PCREES 2.5959 .72721 3.5697[.004]
R- Squared: 0.98861 R-Bar-Squared: 0.97974 D-W Statistics: 2.017F-stat. F (7, 9) 111.5461[.000]
The estimated results of model 3 are given abovein Table 9. In this model, the variables net statedomestic product (NSDP), per capita revenueexpenditure on general services (PCREGS), per capitarevenue expenditures on social services (PCRESS) andper capita revenue expenditures on economic services(PCREES) are taken as determinants of publicexpenditure. The model is found to be statistically fitwith R-Squared and R-Bar-Squared being 0.98861 and0.97974 respectively. The presence of auto-correlationin the model was taken care of by resorting to theC-O iterative method. In this model, exceptthe constant, all the other variables are statisticallysignificant in determining public expenditure.
However, the variables per capita revenueexpenditures on social services (PCRESS) and timevariable though significant is exerting a negativeinfluence on public expenditure. The F test whichshows the overall significance of a model gives a veryhigh value and the p value is 0. Thus we can reject thenull hypothesis that the regressors have no impact onthe regressand.
The results of the model specification 4 estimatedby Cochrane-Orcutt Method (AR1) are given in Table 10.
Table 10Cochrane-Orcutt Method of Estimation (AR1)
Dependent Variable: Total Expenditure18 observations used for estimation from 1 to 18
Model 4 Coefficient Standard Error T-statistic
Constant -2193.1 5775.7 -.37971[.712]
TIME -492.6809 132.5075 -3.7181[.004]
DUMMY 79930.0 26234.2 3.0468[.012]
NSDP 63.04211 24.0309 2.3616[.003]
PCREGS 4.8547 3.8942 2.2466[.041]
PCRESS -2.2709 2.4701 -.91937[.380]
PCREES 2.9504 .95380 3.0933[.011]
LR 48.5604 109.9191 2.4417[.002]
R-Squared: 0. 98882 R-Bar-Squared: 0.97764 D-W Statistics:2.1488F-stat. F (8, 8) 88.4286[.000]
Table 10 above shows the results of model 4estimated by the method of Cochrane-Orcutt Methodof Estimation (AR1). Here the variable net statedomestic product (NSDP), per capita revenueexpenditure on general services (PCREGS), per capitarevenue expenditures on social services (PCRESS), andliteracy rate (LR) are taken as explanatory variablesof public expenditure. The model is found to bestatistically fit with R-Squared and R-Bar-Squaredabove 0.98. All the variables are statistically significantexcept per capita revenue expenditures on socialservices (PCRESS). The constant and time variablethough significant is exerting a negative influence onpublic expenditure. The presence of auto-correlationin the model was taken care of by resorting to the C-Oiterative method. The F test which shows the overallsignificance of a model gives a very high value andthe p value is 0. Thus we can reject the nullhypothesis that the regressors have no impact on theregressand.
Table 11 shows the results of the modelspecification 5 estimated by the method of Cochrane-Orcutt Method of Estimation (AR1).

Determinants of Public Expenditure in Assam: An Econometric Study / 151
Table 11Cochrane-Orcutt Method of Estimation (AR1)
Dependent Variable: Total Expenditure18 observations used for estimation from 1 to 18
Model 5 Coefficient Standard Error T-statistic
Constant -33.9563 2942.0 -.011542[.991]TIME -218.9803 208.7645 -1.0489[.319]DUMMY 1930.1 687.2243 2.8086[.019]PCNSDP 76.9269 21.9709 3.5013[.006]PCCEGS -25.4742 25.2324 -1.0096[.336]PCCESS 26.8470 12.9935 2.0662[.066]PCCEES 27.8857 2.3147 2.2467[.041]LR 7.4580 64.2336 2.11611[.910]
R-Squared: 0.99008 R-Bar-Squared: 0 .98015 D-W Statistic:2.2048F-stat. F (8, 8) 99.7609[.000].
Table 11 above shows the results of model 5estimated by the method of Cochrane-Orcutt Methodof Estimation (AR1). In this model, the variables percapita net state domestic product (PCNSDP), per capitacapital expenditure on general services (PCCEGS), percapita capital expenditures on social services(PCCESS), per capita capital expenditures on economicservices (PCCEES) and literacy rate (LR) are includedas explanatory variables of public expenditure. Themodel is found to be statistically fit with R-Squaredand R-Bar-Squared with 0.97547 and 0.97638respectively. The presence of auto-correlation in themodel was taken care of by resorting to the C-Oiterative method. In this model, all the variablesconsidered are found to be statistically significant indetermining public expenditure except the variablesper capita capital expenditure on general services(PCCEGS), constant and time variable. The F testwhich shows the overall significance of a model givesa very high value and the p value is 0. Thus we canreject the null hypothesis that the regressors have noimpact on the regressand.
The results of the analysis undertaken in the post-reform period covering the period of our study, i.e., from1991-92 to 2008-09 as depicted in the tables 7 to 11have shown that the dummy variable, per capita netstate domestic product (PCNSDP), net state domesticproduct (NSDP), per capita capital expenditures(PCCE), per capita capital expenditures on socialservices (PCCESS), per capita revenue expenditureson economic services (PCREES), per capita revenueexpenditures on general services (PCREGS),percentage of urban population to total population(PCUPTP), literacy rate (LR) and are the importantdeterminants of public expenditure of Assam. Whilethe variables density of population (DOP) and per
capita revenue expenditures on social services(PCRESS) though significant is negatively influencingpublic expenditures in Assam. Hence, in order tofurther verify their significance, we have decided toinclude all these important variables along with someother variables viz, per capita non developmentrevenue expenditure (PCNDRE), per capita revenueexpenditure (PCRE) and total receipts (TREC) in asingle model. Accordingly, all these variables areincluded as explanatory variables in model 7 in table12, and the model is estimated by Cochrane-Orcuttmethod. The model is given below.
PE = a0 + a1 NSDP + a2 DOP + a3 PCCE + a4PCREGS + a5 PCCEGS + a6 PCCEES + a7
LR + a8 TREC + a9 PCRE + a10 PCNDRE + t11+ D12 (7)
Table 12 shows the results of the modelspecification 7 estimated by the method of Cochrane-Orcutt Method of Estimation (AR1).
Table 12Cochrane-Orcutt Method of Estimation (AR1)
Dependent Variable: Total Expenditure18 observations used for estimation from 1 to 18
Model 6 Coefficient Standard Error T-statistic
Constant 4225.8 1086.2 3.8904[.012]
TIME -814.3942 50.2281 -16.2139[.000]
DUMMY 5250.8 336.2633 15.6151[.000]
NSDP .13714 .0035558 38.5692[.000]
DOP -81.3792 7.7681 -10.4761[.000]
PCCE 4.0169 1.7107 4.59442[.003]
PCREGS 5.2426 .55120 9.5112[.000]
PCCEGS -0.69280 6.6157 -0.10472[.921]
PCCEES -8.5724 1.9413 -4.4159[.003]
LR 329.8303 57.1050 5.7759[.002]
TREC -.33282 .032226 -10.3277[.000]
PCRE 5.0922 .55529 9.1702[.000]
PCNDRE -.53511 1.0989 -.48693[.647]
R- Squared: 0.98990 R-Bar-Squared: 0.9886 D-W Statistics: 2.001F-stat. F (14, 1) 25166.1[.005].
Table 12 above shows the results of model 6estimated by Cochrane-Orcutt Method. The model isfound to do extremely well with R-Squared andR-Bar-Squared well above 0.989 and 0.988. Also thepresence of auto-correlation in the model was takencare of by resorting to the C-O iterative method. Themodel reveals that except the variables per capita nondevelopment revenue expenditure (PCNDRE) and percapita capital expenditures on general services(PCCEGS), all the other variables included have faredvery well indicating positive influence on publicexpenditure. The dummy variable is significant

152 / Moon Moon Hussain and P. Srinavasa Suresh
revealing sharp increase in the year 2004-05. Thevariables total receipts (TREC), density of population(DOP) and per capita capital expenditure on economicservices (PCCEES) including the time variable thoughsignificant are found to be exerting negative influenceon public expenditure.
11. SUMMARY OF THE RESULTSTo sum up the analysis in both pre economic reformand post economic reform periods covering the periodof our study, it is observed that in the pre economicreform period, the net state domestic product, percapita net state domestic product, total receipts to netstate domestic product were the driving force behindthe growth of public expenditure thus proving Wagner’slaw of increasing expenditures with increasing stateactivities. The study also proves that the increase intotal receipts have contributed to the increase in Stateexpenditures. On the other hand, the analysis of theresults in the post economic reform period coveringthe period of our study shows that the variables percapita revenue expenditure(PCRE), per capita capitalexpenditure (PCCE), percentage of urban populationto total population (PCUPOP), per capita net statedomestic product (PCNSDP), per capita revenueexpenditures on general services (PCREGS), per capitarevenue expenditures on economic services (PCREES),net state domestic product (NSDP), per capita capitalexpenditures on social services (PCCESS), literacy rate(LR) and dummy variable have been the main factorsdetermining the growth of public expenditures inAssam. The consumer price index in both the periodshas been an insignificant variable in determiningpublic expenditure in Assam.
The analysis of the results show that theformulated hypothesis, i.e., there is a directrelationship between the level of public expenditureand level of NSDP was proved to be correct as NSDPvariable was found to be statistically significant indetermining public expenditure of Assam both in thepre economic reform and post economic reform periodcovering the period of our study. The analysis of theresults also show that the formulated hypothesis, i.e.,changes in Consumer Price Index (CPI) influence thelevel and quantum of public expenditure was provedto be incorrect as the variable CPI was found to bestatistically insignificant in determining publicexpenditure of Assam. Further, the analysis of theresults also show that the formulated hypothesis, i.e.,the growth of public expenditure and the quantity ofpublic services provided bear a functional relationshipwas proved to be correct as depicted by the statisticallysignificant variables namely per capita revenueexpenditure on economic services (PCREES), per capita
revenue expenditures on general services (PCREGS)and per capita capital expenditures on social services(PCCESS) in the post economic reform period.
12. CONCLUSIONFrom the above analysis, it is revealed that severalfactors have led to the increase of public expendituresin Assam. The increase in general services underrevenue account in the post economic period wasmainly due to the increase in the salaries ofgovernment employees due to the pay revisions, whichhas increased more than four times during the lastdecade. The wage bill of the employees increased from‘ 700 crores in 1990-91 to ‘ 3000 crores in 1999-2000.Besides, the increasing rate of dearness allowancespaid to government employees creates additionalburden. Higher level of debt servicing due to increasein loans and overdrafts in the said period also led toits increase.
Literacy rate increased from 52.84 per cent in 1991to 64.28 percent in 2001, an increase of 21 percent. Itis marginally below the national literacy rate of 65.20per cent. The significant feature of the literacy rate isthe marked improvement in female literacy in Assam.The literacy rate which was just 52.84 per cent in 1991census increased to 63.25 percent in 2001 census asthe State Government has been implementing variouseducational programmes. To enhance educationalprogress in the state, Universal Elementary Education(UEE) and Sarva Siksha Abhijyan (SSA) is beingpursued. Some other schemes under the State Plansuch as community ownership of elementary schoolsoperationalised through formation of School ManagingCommittees and Mother Groups has been introduced.Free textbooks have been given to all the students,MIS known as District Information System onEducation (DISE) has been operationalised, etc., to givemore thrust on the issue of education. All this hasdefinitely led to an increase in expenditure in the State.
The percentage of urban population to totalpopulation has increased from 11.1 per cent in 1991 to12.72 per cent in 2001. In Assam, there is huge shift ofpopulation resulting from migration of population fromrural to urban areas in search of better employmentopportunities and better social services related toeducation, health, etc. Large scale immigration ofpopulation from the neighbouring countries likeBangladesh, Nepal etc. causes a high rate of growth ofurban population in Assam. Again due to lack ofagricultural research and absence of intensivecultivation, the agricultural sectors have largelyremained under-developed. In the absence of theavailability of alternative employment opportunitiesdue to lack of industrialization and more particularly

Determinants of Public Expenditure in Assam: An Econometric Study / 153
due to lack of adequate development of small, cottageand village industries in the rural areas of the State,growing number of rural people did not find sufficientavenues for gainful employment in the rural areasitself. Thus there is continuous outflow of ruralpopulation to the urban areas of the State in search ofgainful employment. In such a situation, this high rateof growth of urban population in Assam has beenresulting in various evils such as growth of slums,increasing congestion and pollution, problems oftransportation, housing, water supply, health services,sanitation and finally to unemployment and povertythus putting a great burden on the State exchequer.
This increase in revenue expenditures of the StateGovernment during the period of our study was mainlyattributed to increase in general and social andcommunity services with a view to fulfill the objectivesof Five Year Plans like alleviate poverty, improve uponthe education art and culture, provide minimum basicneeds to the masses like drinking water, sanitation,health care, energy, roads, generate employment, etc.Thus, with the increase in revenue expenditures in theState of Assam, we can say that the State has beentrying hard and making best possible effort to developthe economy. Another important reason for theuncontrollable growth of revenue expenditure is therise in pensions, wages, salaries dearness relief anddearness allowances and interest payments due torevised Pay Commissions from time to time. While thewage bill is rising due to both rising number ofemployees and higher wages, the State governmenthas not been efficient enough to meet the expenditurefrom its own resources. High level of financial supportto public sector undertakings necessitated by theirinability to meet their current obligations also led toits increase. Increase in general and social andcommunity services with a view to fulfill the objectivesof Five Year Plans like alleviate poverty, improve uponthe education art and culture, provide minimum basicneeds to the masses like drinking water, sanitation,health care, energy, roads, generate employment, etc.have also lead to its growth. However, since 2004-05,revenue expenditures as a percentage to totalexpenditure has been maintaining a fluctuating butdeclining trend and declined from 90.13 per cent in2005-06 to 85.44 per cent in 2008-09 mainly due to thecompression measures of revenue expenditureundertaken by the State government in the recentyears wherever possible without affecting publicinterest.
The growth of capital expenditures though slowhas been more satisfactory in the in the post economicreform period than the pre economic reform period.This has definitely improved the fiscal position of
Assam due to consistent and cohesive reformatorymeasures undertaken by the State Government like(a) implementation of Medium Term Fiscal ReformProgramme adopted in March, 2003 in consultationwith Government of India, (b) implementation ofcomprehensive fiscal restructuring programme titledAssam Governance and Public Resource ManagementProgramme sponsored by the Asian Development Bankand Government of India from 2004, (c) enactment andimplementation of Assam Fiscal Responsibility andBudget Management Act, 2005, (d) tax augmentationmeasures, (e) compression measures of revenueexpenditure wherever possible without affecting publicinterest and (f) containment of public debt includingGovernment Guarantees.
For better understanding of the determinants ofpublic expenditure in Assam and assess the influenceof the above mentioned independent variables on publicexpenditure in both pre and post economic reformperiod more accurately, advanced econometrictechniques like co-integration, etc, can be used. Assuch, this aspect may be taken care of by futureresearchers.
ReferencesAbizadeh, S and Yousefi, M. (1968), “Growth of Government
Expenditure: The Case of Canada”, Public FinanceQuarterly, 16(1), pp. 80-81.
Aiyer, V. G. Ramkrishna (1968), Public Finance, Manktalas,Bombay.
Andre, C and Delorme, R. (1978), “The Long Run Growth ofPublic Expenditure in France”, Public Finance, Vol. XXXIII(1-2).
Ashworth, John (1995), “The Empirical Relationship betweenBudgetary Deficits and Government Expenditure Growth:An Examination Using Co integration”, Public Finance/Finances Publiques, Vol. 50 (1), 1995, pp.1-18.
Alam, Khorshed (1999), “Financial Crisis, Tax System andResource Mobilization in Assam”, Journal of North-EastCouncil for Social Science Research, 23:1, pp. 22-25.
Ahmed, Qazi Masood., Sohail Javed and Akhtar Lodhi (2001),“The Determinants of Public Expenditure: A SimultaneousApproach-An Experience from Selected DevelopingCountries”, The Indian Economic Journal, Vol. 48, April-June, 2000-01, Bangalore-4.
Al-Faris, A. F. (2002), “Public Expenditure and Economic Growthin the Gulf Cooperation Council Countries”, AppliedEconomics, Vol. 34, pp. 1187-1193.
Brazer, H.E (1959), “City Expenditures in the United States”,National Bureau of Economic Research, Occasional Paper66, New York.
Bahl, R.W. and Saunders, R.J. (1965), “Determinants of Changein State and Local Government Expenditure”, National TaxJournal, Vol. XV111 (1), pp. 50-57.
Booms, B. H. (1966), “City Government Form and PublicExpenditure Level”, National Tax Journal, Vol. XIX.

154 / Moon Moon Hussain and P. Srinavasa Suresh
Bhargava, R. N. (1967), “The Theory and Working of UnionFinance in India”, Chaitanya Publishing House, Allahbad.
Booms, B.H and Hu Teh, W. (1971), “Towards a Positive Theoryof State and Public Expenditure”, Public FinanceInternational Quarterly Journal, Vol. XXV1 (2), 432-35.
Burhhead, Jesse and Miner, Jerry. (1971), Public Expenditure,Macmillan, London.
Bardoloi, U. N. (1972), Local Finances in Assam. UnitedPublishers.
Bhuyan, Prafulla. Kumar (1977), “State Finances of AssamGovernment during the Plan Period.” Ph .D thesis,Dibrugarh University, Dibrugarh.
Bansal, R.K. (1988), “Raising Additional Resources in theStates”, Atlantic Publishers and Distributors, New Delhi110 027.
Bez, K. (1990), “Quantitative Techniques in Economics”, KalyaniPublishers, New Delhi.
Bhat, Sham K. and Patnaik, Uma Shankar (1991), “PoliticalEconomy of Public Expenditure Determination in IndianStates”, Indian Journal of Economics, Vol. LXX1, IssueNo. 283, April 1991, pp. 419-431.
Bhat, Sham K and Varalakshmi, S. (1994), “The Impact ofPolitical Economy on Public Expenditure in Indian States”,The Indian Journal of Economics, Vol. LXX1V (295), pp.407-415.
Bosl, N. and Pandiello, J. S (1995), “Seven Hypotheses aboutPublic Choice and Local Spending (A Test for SpanishMunicipalities), Public Finance, Vol 1/50, pp. 36-49.
Bhattacharya, H. K. (1998), Forwarded by T.N Chaturvedi.“Economic Development of Assam”, A.P.H. PublishingCorporation, New Delhi.
Chaudhary, R.K. (1976), “Public Expenditure in Assam: AnAnalytical Study”, Ph. D thesis, Gauhati University,Guwahati.
Chang, Tsangyao (2002), “An Econometric Test of Wagner’s Lawfor Six Countries based on Co integration and Error-Correction Modeling Techniques.” Applied Economics, 34,pp. 1157-1169.
Chandra, R. (2004), “Government Size and Economic Growth:An Investigation of Causality in India”, Indian EconomicReview, Vol. XXX1X (2), pp. 295-314.
Diamond, Lord (1975), “Public Expenditure in Practice”, London:George Allen and Unwin.
Desai, S.A. (1976), “Determinants of Inter-State GovernmentExpenditure Differentials in India”, Indian Journal ofEconomics, LV1 (3), pp. 435-42.
Diamond, Lord (1977), “Wagner ’s Law and DevelopingCountries”, Developing Economies, Vol. XV (1).
Dutta, Sibana (1985), “Public Expenditure and EconomicDevelopment”, Asish Publication House.
Dhar, P. K. (1987), “The Economy of Assam Including Economyof North-East India.” Ludhiana: Kalyani Publishers.
Datta, Ray. B. and Agarwal, S.P. (1996), “Reorganization ofNorth-East India since 1947”, Concept Publishing House,New Delhi-110059.
Das, H.N. (2003), “The Present Financial Crisis in Assam”,Dialogue Quarterly, A Journal of Astha Bharati, Vol.4 (1),pp. 85-101.
Das, H.N. (2003), “Good Governance in Assam: The Need forFiscal Responsibility Legislation”, Dialogue Quarterly, AJournal of Astha Bharati, Vol V (4), pp. 65-71.
Dhar, P.K. (2005), “The Economy of Assam Including Economyof North-East India”, Kalyani Publishers, Ludhiana.
Fabricant, Solomon. (1952), “The Trend of Government Activityin the United States since 1900”, National Bureau ofEconomic Research, New York.
Fisher, GW (1961), “Determinants of State and LocalGovernment Expenditure: A Preliminary Analysis”,National Tax Journal, Vol. X1V (2), pp. 349-58.
Fisher, G.W. (1964), “Inter State Variations in State and localGovernment Expenditure”, National Tax Journal, Vol.XV11(1), pp. 64-73.
Forte, Francesco and Peacock, Alan. (1985), “Public Expenditureand Government Growth”, Basil Blackwell Ltd, Oxford.
Gupta, Shibshankar P. (1967), “Public Expenditure andEconomic Growth-A Time Series Analysis, Public Finance,Vol. XXII (4).
Gupta, Shibshankar P. (1968), “Public Expenditure andEconomic Development-A Cross-Section Analysis,Finanzarchiv, October.
Goffman, I.J and Mahar, D.J. (1971), “The Growth of PublicExpenditure in Selected Developing Nations: Six CaribbeanCountries, 1940-65, Public Finance, Vol. XX11V1 (1).
Ghali, K.H. (1998), “Government Size and Economic Growth:Evidence from a Multivariate Cointegration Analysis.Applied Economics, Vol. 31, pp. 975-987.
Gujrati, Damodar N. (2009), “Basic Econometrics”, McGraw-Hill,Inc.
Hicks, Ursula. K. (1963), “British Public Finances”, OxfordUniversity Press, Oxford.
Henderson, J.M (1968), “The Local Government Expenditure: ASocial Welfare Analysis”, Review of Economics andStatistics.
Horowitz, A.R. (1968), “A Simultaneous Equation Approach tothe Problem of Explaining Inter-State Differences in Stateand Local Expenditure”, Southern Journal of Economics,Vol. 34 (3), No. 1.
Haveman R.H, Margolis, J. (1970), “Public Expenditures andPolicy Analysis”, Markham Publishing Company, Chicago.
Harris, J.E. (1980), “Taxing Tar and Nicotine, AmericanEconomic Review, Vol. 70.
Islam, Anisul M. (2001), “Wagner’s Law Revisited: Co integrationand Exogeneity Tests for the U.S.A”, Applied EconomicsLetters, No. 8.
Joulfian, D. and Mukherjee, R. (1990),” The GovernmentRevenue Expenditure Nexus: Evidences from a State”,Public Finance Quarterly, Vol.18, No. (1), pp. 92-103.
Keynes, J.M. (1936), “The General Theory of Employment,Interest and Money”, Harcourt, Brace, and World, NewYork.
Kurnow, E (1963), “Determinants of State and LocalExpenditures Re-Examined,” National Tax Journal, Vol.XV1, No. 3, pp. 252-58.
Kee, W.S. (1965), “City Expenditures and Metropolitan Areas:Analysis of Inter-Governmental Fiscal System”, TheJournal of Finance, Vol. XX, No. 3, pp. 511-12.

Determinants of Public Expenditure in Assam: An Econometric Study / 155
Lyle C. Fitch (1953), “Trends in Federal, State and LocalGovernment Expenditures Since 1980”, American EconomicReview, Vol. XL111, No. 2, pp. 234-242.
Lewis, A. (1965), “The Theory of Economic Growth”, London,Richard D. Irwin, pp. 403.
Lall, S. (1969), “A Note on Government Expenditure inDeveloping Countries”, The Economic Journal, No. 79, pp.414-416.
Lekhi, R.K. and Choudhury, R.K. (1996), “Economy of IndiaIncluding Assam and North-East”, Kalyani Publishers.
Martin A and Lewis, W.A (1950), “Pattern of Public Revenueand Expenditure”, Manchester School of Economics andSocial Studies, September.
Morss, E.F. (1966), “Some Thoughts on The Determinants ofState and Local Expenditures”, National Tax Journal, Vol.X1X, No. 1, pp. 94-103.
Morss, E.R. Fredland, E.J. and Hyman, S.H. (1967),“Fluctuations in State Expenditures: An EconometricAnalysis”, Southern Economic Journal, Vol. XXX111, No. 4.
Musgrave, Richard A (1969), “Fiscal Systems”, New Heaven:Yale University Press.
Mathew (1972), “Economics of Public Expenditure”, Vora andCo. Publishing Private Limited, Mumbai.
Murthy, N.R.V (1981), Wagner’s Law of Public Expenditure: AnEmperical Investigation of the Indian Economy Using theAppropriate Measure for a Valid Test, The Indian EconomicJournal, Vol. 28, Jan-Mar.
Murthy, NRV. (1982), “Endogenous Government ConsumptionExpenditure: Some Econometric Evidence for the IndianEconomy”, The Indian Economic Journal, Vol. 30, No. 1,pp. 74-76.
Metwally M.M. and Mahmoud M.F. (1989), “Size of State andGovernment Expenditure: A Cross Country Study”,The Indian Journal of Public Administration, Vol. XXXV,No. (1).
Musgrave, Richard. A. and Musgrave, Peggy B. (1989), “PublicFinance in Theory and Practice, McGraw Hill Book Co,Singapore.
Masood, Q.A. and Lodhi, J.A. (2000), “The Determinants of PublicExpenditure: A Simultaneous Approach-An Experiencefrom Selected Developing Countries”, The Indian EconomicJournal, Vol. 48, pp. 58-64.
Mishra, B. and Suresh, P.S. (2005), “Political Economy of PublicExpenditure Growth in North-Eastern States of India: ACase Study of Nagaland”, Asian-African Journal ofEconomics and Econometrics, Vol. 5, No. 1, pp. 17-33.
Nongbri, E. (2002), “Growth, Pattern and Determinants of PublicExpenditure in Meghalaya, Ph.D Thesis, North Eastern HillUniversity, Shillong.
Osman, J.W. (1966), “The Determinants of Interstate Variationsin State and Local Government Expenditures in the UnitedStates”. A Thesis Submitted to the Graduate School ofPortugal-The State University. New Brunswick, NewJersey.
Odeclokun, M.O. (1993), “An Econometric Analysis of SectoralFinancial and Expenditure Flows in LDC’s: Evidence fromFlow of Funds Data”, Indian Economic Review, Vol. XV111,No.1, pp. 22-23.
Peacock, A.T. and Wiseman (1961), “The Growth of Public
Expenditure in United Kingdom”, Princeton UniversityPress.
Pryor L Frederic (1968), “Public Expenditure in Communist andCapitalist Nations, George Allen and Unwin Ltd., London,Ch.1.
Peters, G. H. (1971), Private and Public Finance, Fontana/Collins, London, pp. 7-8, 148-150.
Prest, A.R. (1973), “Public Finance in UnderdevelopedCountries”, Vikas Publishing House Private Limited, Delhi-6, pp. 14-31, 111-123.
Pillai, V. (1981), “Fiscal policy and Political Change in aDemocratic Society: The Case of Indian States”, The IndianJournal of Economics, Vol. LX1, No. 44, pp. 501-502.
Reddy, K.N. (1970), “Growth of Government Expenditure andNational Income in India”, 1872-1966, Public Finance, Vol.XXV, No. 1, pp. 81-96.
Reddy, K.N. (1972), “The Growth of Public Expenditure inIndia”, Sterling Publishing Private Limited, New Delhi-16,pp. 1-11.
Rao, S.R. and Rao M.N. (1977), “Inter Municipal ExpenditureVariation: An Econometric Analysis”, The Indian Journalof Economics, Vol. LV11, pp. 43-357.
Rao, S.R. and Rao, M.N. (1977), “Inter Municipal ExpenditureVariation: An Econometric Analysis. The Indian Journalof Economics, Vol. LV11, No. 4, pp. 343-357.
Ram, R. (1986), “Government Size and Economic Growth: ANew Framework and Some Evidence from Cross-Sectionand Time- Series Data”, The American Economic Review,Vol. 76, No.1, pp. 191-203.
Reddy, K.N. (1988), “Determinants of Growth of GovernmentExpenditure in India”, The Indian Journal of PublicAdministration, Vol. XXX1V, No. 2, pp. 227-247.
Rao, M.G. (2002), “State Finances in India: A Critical Review”,Working Paper 113. Institute of Social and EconomicChange.
Strayer, Paul J. (1949), “Public Expenditure Policy”, AmericanEconomic Review, Vol. XXX1X, No. 1.
Samuelson, P.A. (1954), “The Pure Theory of Public Expenditure,Review of Economics and Statistics, Vol. XXXV1, November.
Samuelson, P.A. (1955), “Diagrammatic Exposition of a Theoryof Public Expenditure, Review of Economics and Statistics,Vol. XXXV1, November 1954.
Sacks, S. and Harris, R. (1964), “The Determinants of State andLocal Government Expenditure and Inter-GovernmentalFlow and Funds”, National Tax Journal, Vol. XX1V, No. 1,pp. 75-82.
Sharkansky, I. (1967), “Some More Thoughts about theDeterminants of Government Expenditure”, National TaxJournal, Vol. XX, No. 2, pp. 178-79.
Sarma A, Parek, K.M. and Singh, L.T. (1974), “Determinants ofUrban Local Expenditures: An Exploration in GujaratContext”, Anvesak, Vol. 4, No. 2, pp. 172-73.
Sandford, C. (1983), “Reasons for Growth in GovernmentSpending”, Economics of Public Finance. New York:Perganom Press.
Solano, P.L. (1983), “Institutional Explanation of PublicExpenditure among High Income Democracies”, PublicFinance International Quarterly Journal, Vol. XXXV111,No. 1.

156 / Moon Moon Hussain and P. Srinavasa Suresh
Singh, B. and B.S. Sahni (1984), “Causality Between PublicExpenditure and National Income”, Review of Economicsand Statistics, Vol. 66, pp. 630-644.
Sarma Atul and Tulasidhar, V.B. (1984), “GovernmentExpenditures as an Instrument for Utilizing ExcessCapacities”, Concept Publishing Company, New Delhi,pp. 145-158.
Singh, Gulab (1997), “Wagner’s Law- a Time-Series Evidencefrom the India’s Economy”, The Indian Journal ofEconomics, Vol. LXXV11, No. 306 pp. 349-356.
Tarschys, D. (1975), “The Growth of Public Expenditures - NineModes of Explanation”, Scandinavian Political Studies,No. 10.
Weicher, J.C. (1970), “Determinants of Central CityExpenditures: Some Overlooked Factors and Problems”,National Tax Journal, Vol. XX111, pp. 379-94.
Wagner, Adolph (1883), Finanzwissenschaft in Musgrave,Richard A, ed. Fiscal Systems. London: Yale UniversityPress, 4-16.
Yousefi, M. and Abizadeh, S. (1992), “Growth of StateGovernment Expenditures: Empirical Evidence fromthe United States”, Public Finance/Finances Publiques,Vol. 47, No. 2, pp. 322-339.
Zahir, Mohammed (1972), “Public Expenditure and IncomeDistribution in India”, Associated Publishing House, N. Delhi.
Other sourcesBudget at a Glance, 1995-96, 1997-1998, 1998-1999,2001-02,
2004-2005, 2008-09, Government of Assam.
Development Profile of Assam, Government of Assam, 2002.
Economic Survey, Assam, 1974-75 to 2009-10.
NEC Basic Statistics, 1980
Statistical Handbook, Assam, 1973 to 2010.
North Eastern Economic Review (1997), Center for EconomicResearch and Analysis, Vol. 1, No. 4.
North-Eastern Council (1995), Basic Statistics of North EasternRegion, N.E.C Secretariat, Shillong.