Embed Size (px)
Citation preview

February 2005
Determinants of Health Care Satisfaction in Ohio’s Medicaid Managed Care
Program: Analysis of the 2000 Consumer Satisfaction Survey
Revised Final Report
Prepared for
Paul Boben, Ph.D. CMS, OSP, DBR
7500 Security Boulevard, C3-19-07 Baltimore, MD 21244-1850
Prepared by
Joseph Burton, M.S. John Kautter, Ph. D.
Erin Richter, B.S. RTI International
Health, Social, and Economics Research 411 Waverley Oaks Road, Suite 330
Waltham, MA 02452-8414
RTI Project Number 08507
DETERMINANTS OF HEALTH CARE SATISFACTION IN OHIO’S MEDICAID MANAGED CARE PROGRAM:
ANALYSIS OF THE 2000 CONSUMER SATISFACTION SURVEY
Revised Final Report
Authors: Joseph Burton, M.S. John Kautter, Ph.D. Erin Richter, B.S. Project Director: John Kautter, Ph.D. Scientific Reviewer: Arthur Bonito, Ph.D. Federal Project Officer: Paul Boben, Ph.D.
RTI International*
CMS Contract No. 500-95-0048, T.O. #5
February 2005
This project was funded by the Centers for Medicare & Medicaid Services under contract no. 5500-95-0048, T.O. #5. The statements contained in this report are solely those of the authors and do not necessarily reflect the views or policies of the Centers for Medicare & Medicaid Services. RTI assumes responsibility for the accuracy and completeness of the information contained in this report.
**RTI International is a trade name of Research Triangle Institute.

iii
CONTENTS
EXECUTIVE SUMMARY............................................................................................................. 1
SECTION 1 INTRODUCTION...................................................................................................... 3
SECTION 2 OVERVIEW OF THE CONSUMER ASSESSMENT OF HEALTH PLANS SURVEYS (CAHPS®) ............................................................................................ 5 2.1 Overall Ratings (Question Summary Rates) ................................................................. 6 2.2 Grouping the CAHPS® Ratings for Analyses .............................................................. 6 2.3 Composites (Global Proportions).................................................................................. 6 2.4 Adults and Children: Investigating Differences in Proxies’ Ratings of Care for
Children and Adults’ Ratings of Their Own Care......................................................... 8
SECTION 3 ANALYSES OF THE DETERMINANTS OF RATINGS FOR HEALTH PLAN, PERSONAL DOCTOR, AND OVERALL HEALTH CARE: METHODS........... 13 3.1 Sample Selection ......................................................................................................... 13 3.2 Development of the Personal Experiences Scales....................................................... 14 3.3 Ordered Logit Regression Models .............................................................................. 15 3.4 Note on Interpreting Odds Ratios ............................................................................... 16
SECTION 4 ANALYSES OF THE DETERMINANTS OF RATINGS FOR HEALTH PLANS, PERSONAL DOCTOR, AND OVERALL HEALTH CARE: RESULTS.......... 17 4.1 Demographic Characteristics of the Analysis Cohort ................................................. 17 4.2 Adults .......................................................................................................................... 17
4.2.1 Adults: Individual Characteristics..................................................................... 17
4.2.2 Adults: Exit Status of Plans............................................................................... 22
4.2.3 Adults: Personal Experiences with Care ........................................................... 24
4.2.4 Adults: Rating of Personal Doctor .................................................................... 25 4.3 Children....................................................................................................................... 25
4.3.1 Children: Individual Characteristics ................................................................. 25
4.3.2 Children: Exit Status of Plans ........................................................................... 28
4.3.3 Children: Personal Experiences with Care........................................................ 29
4.3.4 Children: Rating of Personal Doctor................................................................. 30
SECTION 5 ANALYSES OF THE DETERMINANTS OF RATINGS FOR HEALTH PLANS, PERSONAL DOCTOR, AND OVERALL HEALTH CARE: DISCUSSION AND CONCLUSIONS................................................................................ 31 5.1 Individual Characteristics............................................................................................ 31 5.2 Plan Exit Status ........................................................................................................... 32 5.3 Personal Experiences................................................................................................... 32 5.4 Rating of Personal Doctor ........................................................................................... 33 5.5 Conclusions ................................................................................................................. 34
REFERENCES.............................................................................................................................. 35

iv
LIST OF EXHIBITS
Exhibit 1 Items used to measure the CAHPS® overall ratings for health plan, personal doctor, and overall health care................................................................................................ 7
Exhibit 2 Distribution of the CAHPS® ratings among respondents in the 2000 Ohio consumer satisfaction survey...................................................................................................... 7
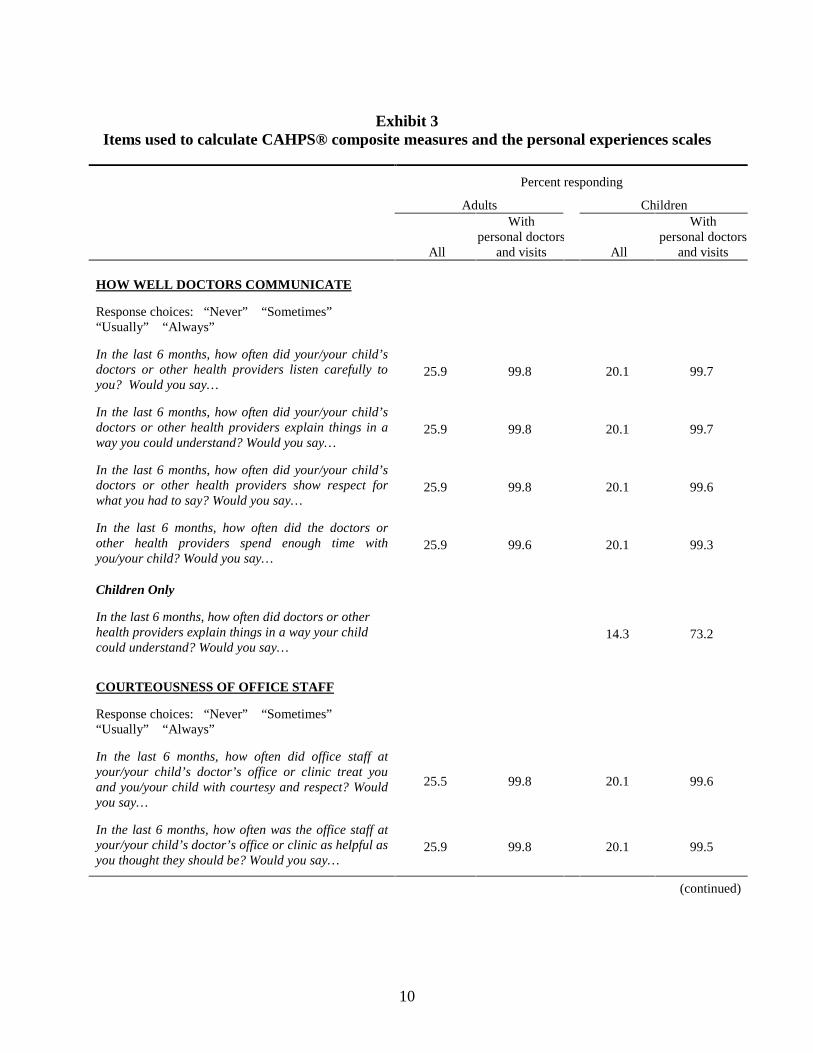
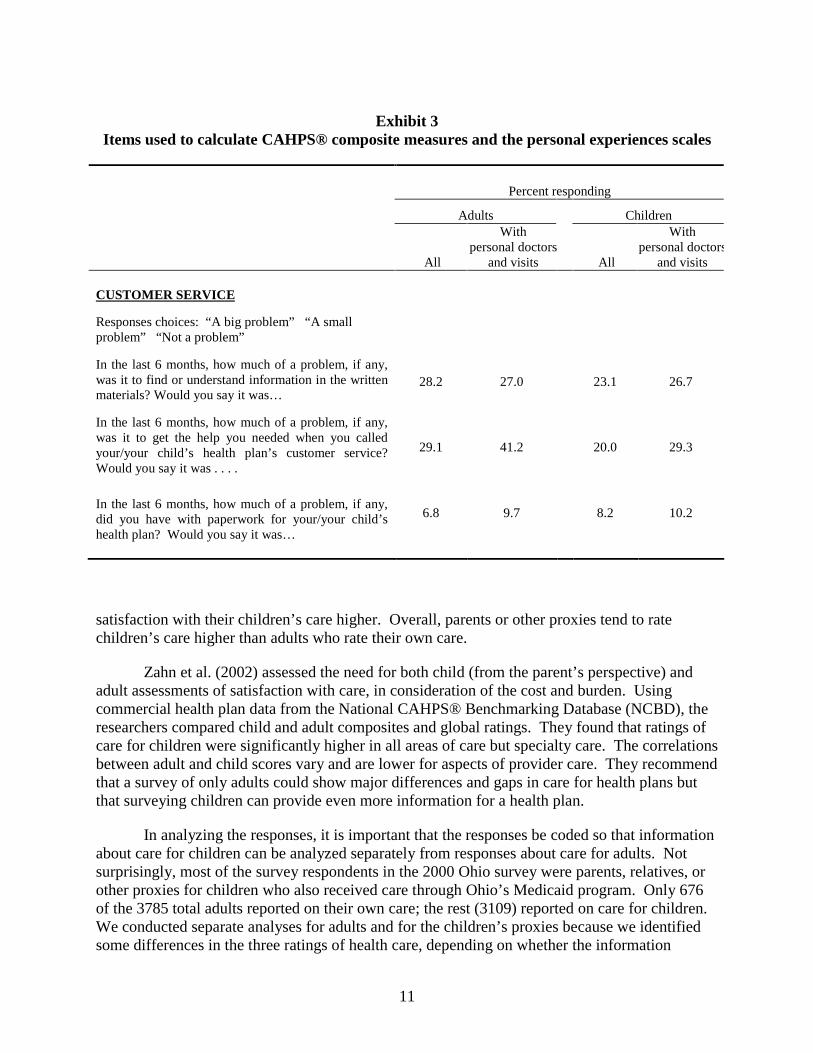
Exhibit 3 Items used to calculate CAHPS® composite measures and the personal experiences scales .......................................................................................................................... 9
Exhibit 4 Composition of respondents by having a personal doctor and having visited a doctor 14 Exhibit 5 Ranges for high and low scores for personal experiences scales .................................. 15 Exhibit 6 Characteristics of Ohio Medicaid managed care beneficiaries by having a personal
doctor and visited a doctor within six months, for adults and child proxies............ 18 Exhibit 7a - Adults Ordered logit regression models for ratings of health plan and personal
doctor: demographic variables, plan exit status, personal experiences, and rating of personal doctor..................................................................................................... 19
Exhibit 7b - Adults Ordered logit regression models for ratings of overall health care: demographic variables, plan exit status, personal experiences, and rating of personal doctor ......................................................................................................... 20
Exhibit 8 Ohio Medicaid managed care plans, 2000 .................................................................... 23 Exhibit 9 Adults by plan exit status .............................................................................................. 23 Exhibit 10a - Children Ordered logit regression models for ratings of health plan and personal
doctor: demographic variables, plan exit status, personal experiences, and rating of personal doctor..................................................................................................... 26
Exhibit 10b - Children Ordered logit regression models for ratings of overall health care: demographic variables, plan exit status, personal experiences, and rating of personal doctor ......................................................................................................... 27
Exhibit 11 Children by plan exit status ......................................................................................... 29
Symbols * significant at 10% ** significant at 5% *** significant at 1%
1
EXECUTIVE SUMMARY
This report investigates how the ratings of health plans, doctors, and overall health care are affected by individual characteristics and personal experiences with plans and providers in a Medicaid Managed Care population. We used responses to the 2000 Ohio Medicaid Managed Care Consumer Satisfaction survey, which is based on the Consumer Assessment of Health Plans (CAHPS®) survey, for the analyses. Only beneficiaries who had personal doctors and who had visited a doctor’s office or clinic in the past six months were included in the analyses, and we conducted separate analyses for adults and children. We grouped the ratings as “High” (10), “Medium” (7-9) and “Low” (0-6) and used them as dependent variables. The independent variables were demographic characteristics, whether or not the plan exited the Medicaid managed care market, and four personal experience indicator variables: experiences with (1) Getting Needed Care (Access), (2) Getting Care Quickly (Timeliness), (3) Communicating with Doctors (Communication), and (4) Courteousness of Office Staff (Courtesy). Our analyses revealed that personal experiences directly influence how Medicaid beneficiaries or their adult proxies rate health plans, personal doctors, and overall health care. Almost every personal experiences indicator is highly significant in the analyses, which tested how these scales affect the three ratings.

2

3
SECTION 1 INTRODUCTION
Between 1998 and 2002, the Medicaid managed care market in Ohio changed rapidly, with several plans exiting the Medicaid market and progressively fewer plans providing continuous service to Medicaid beneficiaries. In our prior report for CMS’s evaluation of the Ohio 1115 waiver demonstration, Who Exits Managed Care Markets – Does Plan Quality Matter? (Kulas, Kautter, Mitchell, et al. 2002), we used plan-level data from the 1998 Ohio Medicaid Managed Care Consumer Satisfaction survey to analyze the relationship between plan quality and market participation. Overall, we concluded that the Ohio Medicaid managed care market has been fairly efficient in weeding out the lowest quality plans and that the better quality plans have survived.
We supplement our prior report by using the more recent 2000 Ohio Medicaid Managed Care Consumer Satisfaction survey to investigate what individual characteristics or personal experiences are associated with how Medicaid beneficiaries in Ohio rate their health plans, their personal doctors, and their overall health care. We also compare selected Consumer Assessment of Health Plans (CAHPS®) survey measures of exiting plans to continuing plans. While considerable work has been done on CAHPS® measures, relatively little has been done on CAHPS® measures for a Medicaid managed care population. The analyses that follow could help Ohio better understand satisfaction with managed care among Medicaid beneficiaries.
The purpose of our analyses is not to compare one health plan to another, but to: (1) identify what personal characteristics and experiences with health plans and physician practices determine how Medicaid beneficiaries’ rate health plans, personal doctors, and overall health care; and (2) identify differences between continuing and exiting plans. We analyze three CAHPS® measures across the entire Medicaid managed care program, and note differences in the scores for exiting plans. Most previous work on CAHPS® data, including our previous report, present results at the plan level. This report does not include analyses at the plan level; rather, we present results for the total group of exiting plans, and model the determinants of the three ratings using individuals as the unit of analysis.
The principal data source used in this study is the 2000 Ohio Medicaid Managed Care Consumer Satisfaction survey. The 2000 survey was conducted from December 1999 through February 2000 and asks about experiences in the previous six months. The Ohio Department of Jobs and Family Services (ODJFS) and Macro International jointly developed the questionnaire using the CAHPS® methodology developed and sponsored by the Agency for Health Care Policy and Research (AHRQ) (ODJFS: www.jfs.ohio.gov/ohp/reports/). Almost all survey items that addressed satisfaction were taken from the CAHPS® 2.0H Adult and Child Core questionnaires, which measure beneficiaries’ perceptions of interactions with their health plans and health professionals involved with their care. ODJFS supplemented these core CAHPS® questions with items of interest for policymaking. Other state and local interests had substantial input in developing the domains that determined the content of the questionnaire. A report describing the 2000 survey results at the plan-level was prepared by Macro International (ODJFS, 2000).

4
This report is organized as follows. After providing a general description of CAHPS® surveys and presenting descriptive statistics for the 2000 Ohio Medicaid Managed Care Consumer Satisfaction survey in Section 2, in Section 3 we explain our methodology for analyzing the determinants of health care satisfaction in Ohio’s Medicaid managed care market. Section 4 presents our results and, finally, Section 5 provides a discussion and offers conclusions.

5
SECTION 2 OVERVIEW OF THE CONSUMER ASSESSMENT
OF HEALTH PLANS SURVEYS (CAHPS®)
In this section we provide a general description of CAHPS® surveys and present descriptive statistics for the 2000 Ohio Medicaid Managed Care Consumer Satisfaction survey. CAHPS® was created as a useful measure to study consumer satisfaction with all types of health plans and to permit comparisons across different types of populations and health plans (Carman 1999). To allow for these comparisons, the CAHPS® surveys contain a core group of composite scores and global ratings appropriate for all different types of health plans. The composite scores include experiences getting care, communication with providers, interactions with office staff, and experiences with a health plan. The CAHPS® surveys have been used in a number of different capacities, such as evaluating health plans, analyzing outcomes for children, and understanding racial and ethnic disparities in care. Carman et al. (1999) wrote an epilogue of what was learned after the implementation of the CAHPS® surveys in the late 1990’s. The group found that the surveys were easily administered and covered topics important to the health plans. Plans varied in the way they presented survey results, but valued the standardized format of the survey itself. Hays et al. (1999) published an assessment of the psychometric properties of the CAHPS® 1.0 survey measures; and, using data from Medicaid and private plans, found the CAHPS® measures to have strong reliability. In particular, the rating of the health plan was significantly correlated to willingness to recommend the plan and to re-enroll in the plan, suggesting the CAHPS® survey was an accurate assessment of health care.
The CAHPS® surveys can also be used by a health plan to learn more about consumer needs and adjust its benefits packages accordingly. Millar, et al. (2000) used the CAHPS® surveys to assess consumer satisfaction among Medicaid beneficiaries in Oklahoma each year between 1997 and 1999. They found, over time, significant improvements in health plan ratings for both children and adults. Office staff courtesy and respect improved significantly, as well as the perceived ability to find satisfactory physician care for children. Improvement was also present in other measures but was not significant.
The CAHPS® measures calculated from the survey questions are of two types: (1) composite scores (or global proportions) and (2) overall ratings (summary rates). Each of the five composite scores uses responses from two to five questions to derive a measure for a particular topic area. The four overall ratings are each based on a single question. Both the composite scores and the overall ratings are typically derived by aggregating responses at the plan level. Because the analyses are conducted at the plan level, the plan scores can be easily calculated despite a large proportion of missing values. There are often missing values in CAHPS® data because respondents might not have interacted with their doctors or their health plans in the manner related to the question within the time frame of the question. (The time frame for the Ohio survey questions is the last six months.) For example, if a respondent did not have a discussion with his or her health plan’s customer service staff, he or she would not answer the questions related to customer service. Below is a brief description of the CAHPS® composites and ratings.

6
2.1 Overall Ratings (Question Summary Rates)
The four overall ratings questions ask members to rate their
• Health Plan
• Health Care
• Personal Doctor
• Specialist
All ratings are based on an 11-point scale, with 0 being “worst possible” and 10 being “best possible.” For each health plan, the number answering an overall rating question in a certain way is divided by the number answering the question. This proportion represents the “rate” of satisfaction for the topic addressed by the question. Satisfaction rates are often based on the proportion of individuals who give a rating of 10, 9-10, or 8-10, depending on the analysts’ preferences.
Researchers and other users of the CAHPS® surveys often use the CAHPS® analyses program to generate case-mix adjusted composite scores and overall ratings. This SAS program is provided as part of the CAHPS® users tool kit (Agency for Healthcare Research and Quality, 2003), is widely used among the CAHPS® users nationwide, and is continuously refined. The CAHPS® analyses program is intended to calculate only the rating of health plans and of overall health care. This is because the unit of analysis is typically the health plan. The program can be used to analyze the rating of personal doctor and the rating of specialist; but since respondents in any given health plan use different doctors, it is not clear how one would interpret such results at the plan level. All of the ratings can be analyzed at the individual level because they are based on a single question. The questions on which the first three ratings are based appear in Exhibit 1.
2.2 Grouping the CAHPS® Ratings for Analyses
The distributions of the CAHPS® ratings as reported in the 2000 Consumer Satisfaction Survey are skewed toward the maximum value: ten. In addition, there are relatively few responses in the 0-7 range. We divided the CAHPS® ratings into three groups for all of our analyses: “0-7,” “8-9,” and “10.” The CAHPS® analyses program also allows responses to be grouped in this way. Distilling the ratings into these three groups fits the distribution of the Ohio data well and provides an intuitive simplification of the data. Dividing the composite scores and ratings into three groups—low satisfaction, medium satisfaction, and high satisfaction—facilitates interpretation of the results. It is also a preference of other researchers, as the CAHPS® analyses program allows users to automatically group responses this way. Exhibit 2 displays the frequencies of the actual rankings and how these were combined into three groups of rankings. We will use this grouping throughout this report.
2.3 Composites (Global Proportions)
Unlike the overall ratings, the CAHPS® composite measures comprise two or more questions about the following topics:

7
Exhibit 1 Items used to measure the CAHPS® overall ratings
for health plan, personal doctor, and overall health care
HEALTH PLAN
We want to know your rating of all your experience with your/your child’s health plan. Use any number from 0 to 10 where “0” is the “worst” health plan possible, and “10” is the “best” health plan possible. How would you rate your/your child’s health plan now?
PERSONAL DOCTOR
We want to know your rating of your/your child’s personal doctor or nurse. (If you/your child have more than one personal doctor or nurse, choose the person you/your child sees most often.) Use any number from 0 to 10 where “0” is the “worst” personal doctor or nurse possible, and “10” is the “best” personal doctor or nurse possible. How would you rate your/your child’s personal doctor or nurse now?
HEALTH CARE
We want to know your rating of all your/your child’s health care in the last 6 months from all doctors and other health providers. Use any number from 0 to 10 where “0” is the “worst” health care possible, and “10” is the “best” health care possible. How would you rate all your/your child’s health care?
Exhibit 2 Distribution of the CAHPS® ratings among respondents in the 2000 Ohio
consumer satisfaction survey
Rating of
health plan
Rating of personal doctor
Rating of overall
health care Adults
Number of adult respondents 505 447 511 High (10) 40.0% 46.3% 39.5% Medium (8-9) 35.8 31.8 36.6 Low (0-7) 24.2 21.9 23.9 Total 100.0 100.0 100.0
Children
Number of adult respondents 2,368 2,202 2,374 High (10) 48.8% 57.1% 54.3% Medium (8-9) 32.4 29.9 34.4 Low (0-7) 18.8 13.0 11.3 Total 100.0 100.0 100.0

8
• Getting Needed Care (Access)
• Getting Care Quickly (Timeliness)
• How Well Doctors Communicate (Communication)
• Courteousness of Doctor’s Office Staff (Courtesy)
• Plan Customer Service
Each composite score is measured using either of two response scales: (1) a “Never/Sometimes/Usually/Always” scale; or (2) a “Big Problem/Small Problem/Not a Problem” scale. Like the overall ratings, the composite measures are reported as the proportion of respondents answering in a certain way. For example, the percent reporting that it was “Not a Problem” to get needed care is how the Getting Needed Care composite might be reported. Percentages are summed across the questions used and then divided by the number of questions in the composite, yielding plan-level composite scores that represent the “rate” of satisfaction within a plan for each topic area. The items comprised by the composite measures can be weighted unequally or equally, depending on the preference of the analyst.
In our analyses we use items on which the composite measures are based to create scales at the individual level. The scales measure personal experiences in the topic areas of the composites. We then perform regression analyses to determine how these facets of health care affect the global ratings. Not all questions are asked of all respondents. For example, only persons who happen to have called their health plans are asked the customer service questions; and only persons who called their doctors’ offices are asked questions about those interactions. Therefore, a significant portion of the respondents did not answer these questions, even among those who had appointments with their personal doctors. As described later in Section 3, these analyses include only those who had a personal doctor and visited a doctor’s office or clinic in the six months prior to the survey. Persons without visits were asked only a limited set of questions about their experiences receiving health care. For this reason, only selected questions in the composite set are used to construct the personal experience scales. Exhibit 3 lists the CAHPS® composite items and identifies the subset of items used to construct the personal experiences scales. For each question, the percent responding to each question appears to the right of the question. Italicized questions are used to construct the personal experience scales and were answered by almost all beneficiaries with recent doctor visits.
2.4 Adults and Children: Investigating Differences in Proxies’ Ratings of Care for Children and Adults’ Ratings of Their Own Care
One important feature of CAHPS® is that the survey questions can be used to evaluate care for children and adults. Responses for children are completed by an adult proxy, typically (but not always) a parent and usually the child’s mother. For example, Homer, Fowler, Gallagher, et al. (1999) used the CAHPS® survey to learn about children and families’ experiences with pediatric care across public and private health plans. Parents or other proxies reported few communication problems with providers. The study found that older, female parents who are of an ethnic minority and low education status often rate their satisfaction and

9
Exhibit 3 Items used to calculate CAHPS® composite measures and the personal experiences scales
Percent responding
Adults Children
All
With personal doctors
and visits All
With personal doctors
and visits
GETTING NEEDED CARE
Response choices: “A big problem” “A small problem” “Not a problem”
30.5 53.1
24.2 51.4
With the choices you/your child’s health plan gave you, how much of a problem, if any, was it to get a personal doctor or nurse that you/for your child you are happy with? Would you say it was…
33.6 41.9 25.6 29.6
In the last 6 months, how much of a problem, if any, was it to get a referral to a specialist that you/your child needed to see? Would you say that it was…
16.8 34.2 8.7 22.7
In the last 6 months, how much of a problem, if any, was it to get the care for you/your child that you or a doctor believed necessary? Would you say it was…
26.4 98.3 20.5 98.9
In the last 6 months, how much of a problem, if any, were delays in your/your child’s health care while you waited for approval by your/your child’s health plan? Would you say it was…
25.9 98.3 20.4 97.2
GETTING CARE QUICKLY
Response choices: “Never” Sometimes” “Usually” “Always”
In the last 6 months, when you called during regular office hours, how often did you get the help or advice you needed for your child? Would you say...
In the last 6 months, how often did you/your child get an appointment for regular or routine health care as soon as you wanted? Would you say...
24.6 98.3 20.4 98.3
In the last 6 months, when you/your child needed care right away for an illness or injury, how often did you/your child get care as soon as you wanted? Would you say…
8.6 34.0 7.1 33.9
In the last 6 months, how often did you wait in the doctor’s office or clinic more than 30 minutes past the appointment time to see the person you/your child went to see? Would you say…
25.9 99.1 19.9 99.3
(continued)
10
Exhibit 3 Items used to calculate CAHPS® composite measures and the personal experiences scales
Percent responding
Adults Children
All
With personal doctors
and visits All
With personal doctors
and visits
HOW WELL DOCTORS COMMUNICATE
Response choices: “Never” “Sometimes” “Usually” “Always”
In the last 6 months, how often did your/your child’s doctors or other health providers listen carefully to you? Would you say…
25.9 99.8 20.1 99.7
In the last 6 months, how often did your/your child’s doctors or other health providers explain things in a way you could understand? Would you say…
25.9 99.8 20.1 99.7
In the last 6 months, how often did your/your child’s doctors or other health providers show respect for what you had to say? Would you say…
25.9 99.8 20.1 99.6
In the last 6 months, how often did the doctors or other health providers spend enough time with you/your child? Would you say…
25.9 99.6 20.1 99.3
Children Only
In the last 6 months, how often did doctors or other health providers explain things in a way your child could understand? Would you say…
14.3 73.2
COURTEOUSNESS OF OFFICE STAFF
Response choices: “Never” “Sometimes” “Usually” “Always”
In the last 6 months, how often did office staff at your/your child’s doctor’s office or clinic treat you and you/your child with courtesy and respect? Would you say…
25.5 99.8 20.1 99.6
In the last 6 months, how often was the office staff at your/your child’s doctor’s office or clinic as helpful as you thought they should be? Would you say…
25.9 99.8 20.1 99.5
(continued)
11
Exhibit 3 Items used to calculate CAHPS® composite measures and the personal experiences scales
Percent responding
Adults Children
All
With personal doctors
and visits All
With personal doctors
and visits
CUSTOMER SERVICE
Responses choices: “A big problem” “A small problem” “Not a problem”
In the last 6 months, how much of a problem, if any, was it to find or understand information in the written materials? Would you say it was…
28.2 27.0 23.1 26.7
In the last 6 months, how much of a problem, if any, was it to get the help you needed when you called your/your child’s health plan’s customer service? Would you say it was . . . .
29.1 41.2 20.0 29.3
In the last 6 months, how much of a problem, if any, did you have with paperwork for your/your child’s health plan? Would you say it was…
6.8 9.7 8.2 10.2
satisfaction with their children’s care higher. Overall, parents or other proxies tend to rate children’s care higher than adults who rate their own care.
Zahn et al. (2002) assessed the need for both child (from the parent’s perspective) and adult assessments of satisfaction with care, in consideration of the cost and burden. Using commercial health plan data from the National CAHPS® Benchmarking Database (NCBD), the researchers compared child and adult composites and global ratings. They found that ratings of care for children were significantly higher in all areas of care but specialty care. The correlations between adult and child scores vary and are lower for aspects of provider care. They recommend that a survey of only adults could show major differences and gaps in care for health plans but that surveying children can provide even more information for a health plan.
In analyzing the responses, it is important that the responses be coded so that information about care for children can be analyzed separately from responses about care for adults. Not surprisingly, most of the survey respondents in the 2000 Ohio survey were parents, relatives, or other proxies for children who also received care through Ohio’s Medicaid program. Only 676 of the 3785 total adults reported on their own care; the rest (3109) reported on care for children. We conducted separate analyses for adults and for the children’s proxies because we identified some differences in the three ratings of health care, depending on whether the information

12
referred to care for children or adults; and because, as other research suggests, reporting on care for oneself is inherently different than reporting about care for a child. Our results confirm that adults tended to answer questions related to the care for children differently than the adults who rated care for themselves.
13
SECTION 3 ANALYSES OF THE DETERMINANTS OF RATINGS FOR HEALTH PLAN,
PERSONAL DOCTOR, AND OVERALL HEALTH CARE: METHODS
Previous research has focused on how individual characteristics affect CAHPS® measures. These analyses use data from the 2000 Consumer Satisfaction Survey related to identify how individuals’ personal experiences with receiving health care determine plan and provider ratings when demographic characteristics are controlled. In addition, we hypothesize that plans with highly rated doctors (according to the CAHPS® item) will tend to be highly rated themselves.1 Personal experiences with health plans and providers might also be important—in particular items related to getting approvals and prompt care, and communications with providers, their staffs, and health plans. Our approach to identifying the determinants of plan satisfaction is to generate scales at the individual level, selected from the items used to calculate the CAHPS® composite measures, and then test the extent to which they predict the ratings for health plan, personal doctor, and overall health care. We analyzed the responses at the individual level using multivariate logistic regression models.
3.1 Sample Selection
The CAHPS® composite scores discussed in Section 2 are by design plan-level scores. Responses from individual items within each composite domain are aggregated at the plan level. The items (questions) are given weights so that the composite score represents a weighted average of all the responses within that composite domain. Because the scores are calculated at the plan level, missing values do not affect the calculations.
A composite score can theoretically be calculated at the individual level if all questions in the composite measures are answered. Several questions or series of questions, however, refer to events that do not apply to particular respondents. For example, questions about referrals to specialty providers cannot be answered by individuals who never needed to see specialists during the time frame of the question. Such a small portion of respondents—even those who had and visited a personal doctor—saw a specialist that we did not include the rating of specialist in our analyses.
In these analyses, we construct individual-level analogues to the composite measures: the personal experience scales. Exhibit 3 in Section 2 identifies the questions that are both in the composite measures and used for the personal experience scales constructed. It also identifies what questions are not asked of respondents who do not have personal doctors or did not visit a doctors office or clinic in the last six months. We used responses only from beneficiaries who had personal doctors and visited a doctor or clinic within the past six months for our analyses. We excluded responses from or on behalf of beneficiaries who did not have a personal doctor because these beneficiaries did not rate their personal doctors. The rating of personal doctor is integral to these analyses because it is one of the three dependent variables analyzed and because we explore how that rating affects other ratings. We also excluded respondents who did not visit a doctor because they answered only a subset of questions that make up the CAHPS® composite
1 In exploring this hypothesis, we will have to consider the possibility that the causal link works in the other
direction: that is, highly rated health plans have good doctors in their networks.

14
measures and thus did not report on personal experiences related to recent visits (See Exhibit 3 in Section 2). Exhibit 4 summarizes the respondent pool from the 2000 survey by having a personal doctor and by having visits to a doctor’s office or clinic. As indicated, these analyses are conducted on about three quarters of the respondents.
Exhibit 4 Composition of respondents by having a personal doctor and having visited a doctor
Adults Children Visits Visits
Personal doctor No Yes Personal doctor No Yes
Yes 14.0% 70.9% Yes 16.4% 74.6%
No 6.4% 8.7% No 3.2% 5.8%
3.2 Development of the Personal Experiences Scales
We created individual-level personal experiences scales by selecting items from the survey for beneficiaries who had personal doctors and who had visited a doctors office or clinic in the past six months. All those who had a personal doctor and visited a doctor were asked the set of questions that make-up the personal experience scales. We created four personal experience scales–one each from the items that constitute the composites measures. These are personal experiences (1) getting needed care (access); (2) getting care quickly (timeliness), (3) communication by providers (communication) and (4) courtesy of office staff (receiving courteous treatment). We did not construct a scale corresponding to the remaining composite measure, Plan Customer Service because half of the respondents had not contacted their health plans and thus did not answer either customer service item. We then used these scales to create indicator variables for the regression analyses.
We used the standard response categories for the personal experience scales. As with the composite measures, responses range from never (0 numerically) to always (4 numerically). For each of the four personal experiences scales, we took the simple arithmetic mean of the questions completed to define the score on the scale. The data for the set of respondents used in the analyses were very complete and had relatively few missing values. In some cases a respondent in our analysis sample chose not to answer a question. We calculated the scale from the number of questions answered by each respondent. That is, if a respondent answered the question with a “Don’t Know” or “Refused,” the scale for that respondent omits that question. A few respondents did not answer any of the questions in a scale. These beneficiaries fall out of the regression models that include that scale.
The access scale ranges from 1-3; the timeliness, courtesy, and communication scales range from 1-4. The ranges and distributions of the scales appear in Exhibit 5.

15
Exhibit 5 Ranges for high and low scores for personal experiences scales
Personal experiences scales Range
Low group High group
Adult high percent
Children high percent
Access 1-3 1-2.5 3 77.6 84.9
Timeliness 1-4 1-2.5 3-4 57.4 62.1
Courtesy 1-4 1-3.75 4 74.7 79.9 Communications 1-4 1-3.8 4 65.5 70.0
NOTE: Because the item responses are integer values that are then averaged to calculate the scale scores, the set of possible scale scores is limited. No scale scores exist in the gaps between the high and low groups as presented.
Once the four scales were constructed for each individual, we divided the scores for each scale into a high and low group, and then created a dummy variable to be used in the regression models. For the getting needed care (access) and getting care quickly (timeliness) scales, the dummy variables are equal to “1” for low values. The dummies for these scales represent problems with access and delays in receiving care, respectively. For the courtesy and communications scales, dummy variables are set to “1” for high values. The indicators represent courteous treatment and good communication.
3.3 Ordered Logit Regression Models
We grouped the CAHPS® ratings into “High” (10), “Medium” (8-9), and “Low” (0-7) for all of our analyses. Because the outcome can be one of three values, we used ordered logistic regression to estimate the effects of several variables on the ratings. The dependent variables are the health plan rating, the rating of personal doctor, and the rating of overall health care. We did not analyze the rating of specialist because most of the respondents did not receive specialty care in the time frame of the survey and thus did not answer these questions. The independent variables include individual characteristics, whether the health plan exited the Medicaid market, the personal experiences scales created, and the rating of personal doctor. We ran three series of regression models. The first modeled the ratings as a function of individual characteristics, including age, race, gender, education level, and health status; as well as the exit status of the plans. The second series of regressions includes all of the personal characteristics, the exit status of the plans, and the rating of personal doctor as an independent variable in the regressions on the plan rating and the rating of overall health care. The third and final series estimates the determinants of the ratings and includes all of the personal characteristics, the exit status of the plans, the rating for personal doctor (except in the regressions on the same rating), and the four personal experiences scales created. This is our full model.2
2 We also ran regressions identical to the full model but for excluding the personal doctor rating. The results are
not presented because they are very similar to the results from the full model.

16
3.4 Note on Interpreting Odds Ratios
Ordered logit regression is similar to binomial logit regression in that the variable coefficients are often expressed as odds ratios. Odds ratios are the relative odds of one occurrence compared to another, which approximate the relative probabilities of one outcome compared to another. Odds ratios for ordered logit regressions also describe relative odds, but are slightly more difficult to interpret because the number of outcomes is three or more. The odds ratios represent the relative odds (again, which approximate the relative probability) of an outcome or contiguous group of outcomes compared to another outcome or contiguous group of outcomes. In these analyses, the outcomes are ratings of “high,” “medium,” or “low.” The odds ratios represent the odds of a “high” rating compared to a “medium” or “low” rating, as well as the odds of a “high” or “medium” rating compared to a “low” rating. To facilitate the description of the results, we use the terms “favorable” and “unfavorable” throughout the presentation of the results. We use favorable to mean “high” compared to either “medium” or “low,” and to mean either “high” or “medium” compared to “low.”
The three possible outcomes are ordinal data, meaning that the exact relationship (or distance) between the outcomes is not defined. We assume only that “high” is better than “medium,” and “medium” is better than “low;” but that is all we know. We do not know how much better “high” is than “medium,” or “medium” than “low” and make no assumptions about the exact relationship of the categories in cardinal units. The same is true for the ratings expressed in the raw scores of 0-10. A rating of 10, for instance, is not necessarily twice as good as a rating of 5.

17
SECTION 4 ANALYSES OF THE DETERMINANTS OF RATINGS FOR HEALTH PLANS,
PERSONAL DOCTOR, AND OVERALL HEALTH CARE: RESULTS
In this section we present our results of the individual-level analyses of CAHPS® data. We first present the results for adults who rated their own care, followed by the results for children’s care reported by adult proxies. For each group of respondents, we first discuss the effects of demographic characteristics, the plan exit status, and personal experiences scales on the ratings for health plan, personal doctor, and overall health care. We follow with a discussion of how the rating of personal doctor predicts how Medicaid beneficiaries rate their health plans and their overall health.
4.1 Demographic Characteristics of the Analysis Cohort
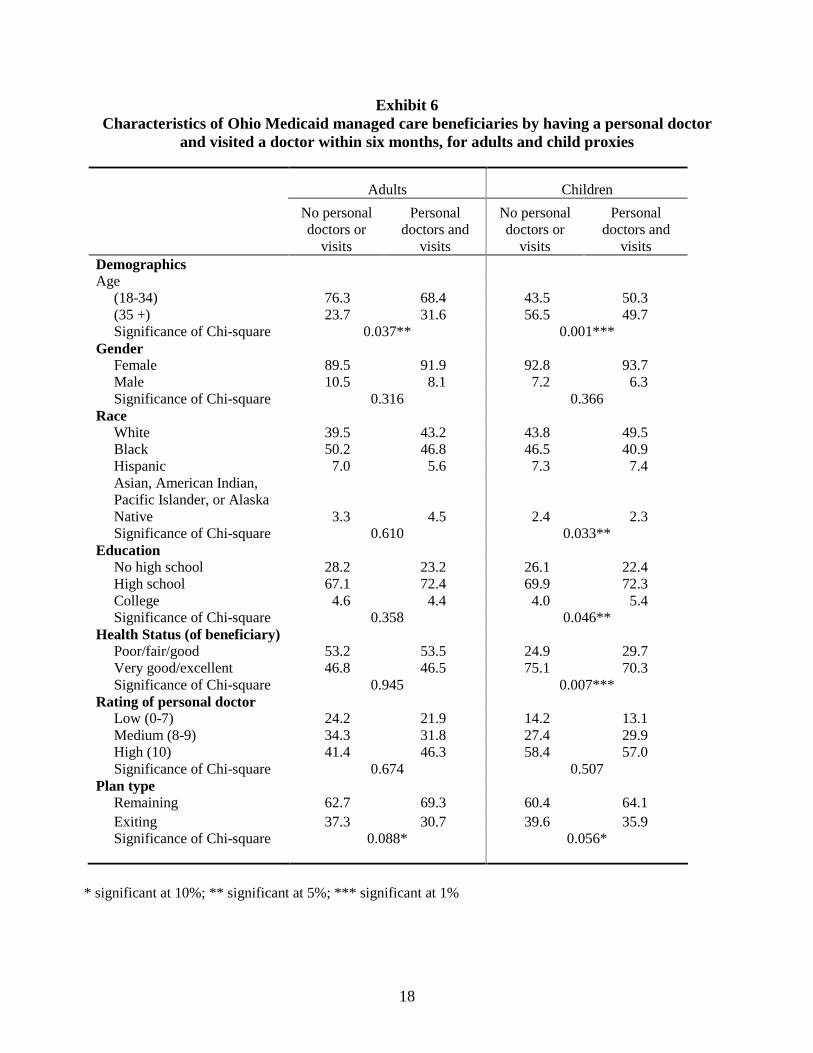
Exhibit 6 describes the characteristics of the analyses cohort separately for adults and adult proxies who completed the survey on behalf of their children. The exhibit also compares the analyses sample to the group of respondents omitted from the analyses, noting characteristics for which the Chi-square statistic is significant. The analyses cohort—those who had personal doctors and visited a doctor’s office or clinic—was similar to the group of omitted respondents. Even the statistically significant differences at the five percent level were small. For adults, those in the analyses cohort were slightly older, with 31.6 percent being over 35 compared to 23.7 percent in the group not included. The adult proxies were slightly younger, with 50.3 percent aged 18-34, than the omitted group, with only 43.5 percent aged 18-34. The adult proxies also differed slightly by race/ethnicity, education level and health status. About half of the analysis cohort was White, compared to 43.8 percent for the omitted sample. In addition, the analyses cohort was slightly higher educated. Finally, 70.3 percent of the analyses cohort was in very good or excellent health compared to 75.1 percent of the omitted sample.
4.2 Adults
Exhibits 7a and 7b, below, present the odds ratios and significance levels for the three series of regressions for adults. The discussion of the results for adults includes a description of how we constructed the variables used in the models.
4.2.1 Adults: Individual Characteristics
Age
We grouped all respondents into two age categories: under 35 years, and 35 years and over. The regression models include an indicator variable for the latter group. For the ratings of health plans, the odds ratios range from 1.26-1.58 but were not statistically significant at the 5 percent level. The results for the rating of overall health care are similar (odds ratios range from 1.44 to 1.70). For the rating of personal doctor, persons 35 and over had 71-80 percent higher odds (odds ratios of 1.71 and 1.80) of rating their doctors favorably, even in the full model that includes personal experiences.
18
Exhibit 6 Characteristics of Ohio Medicaid managed care beneficiaries by having a personal doctor
and visited a doctor within six months, for adults and child proxies
Adults Children
No personal doctors or
visits
Personal doctors and
visits
No personal doctors or
visits
Personal doctors and
visits Demographics Age
(18-34) 76.3 68.4 43.5 50.3 (35 +) 23.7 31.6 56.5 49.7 Significance of Chi-square 0.037** 0.001***
Gender Female 89.5 91.9 92.8 93.7 Male 10.5 8.1 7.2 6.3 Significance of Chi-square 0.316 0.366
Race White 39.5 43.2 43.8 49.5 Black 50.2 46.8 46.5 40.9 Hispanic 7.0 5.6 7.3 7.4 Asian, American Indian, Pacific Islander, or Alaska Native 3.3 4.5 2.4 2.3 Significance of Chi-square 0.610 0.033**
Education No high school 28.2 23.2 26.1 22.4 High school 67.1 72.4 69.9 72.3 College 4.6 4.4 4.0 5.4 Significance of Chi-square 0.358 0.046**
Health Status (of beneficiary) Poor/fair/good 53.2 53.5 24.9 29.7 Very good/excellent 46.8 46.5 75.1 70.3 Significance of Chi-square 0.945 0.007***
Rating of personal doctor Low (0-7) 24.2 21.9 14.2 13.1 Medium (8-9) 34.3 31.8 27.4 29.9 High (10) 41.4 46.3 58.4 57.0 Significance of Chi-square 0.674 0.507
Plan type Remaining 62.7 69.3 60.4 64.1 Exiting 37.3 30.7 39.6 35.9 Significance of Chi-square 0.088* 0.056*
* significant at 10%; ** significant at 5%; *** significant at 1%

19
Exhibit 7a - Adults Ordered logit regression models for ratings of health plan and personal doctor:
demographic variables, plan exit status, personal experiences, and rating of personal doctor
Rating of health plan Rating of personal doctor Demographics
Age (35+) 1.58 1.27 1.26 1.71 1.80 (0.078)* (0.410) (0.400) (0.046)** (0.038)**
Male 1.54 1.85 1.71 0.65 0.54 (0.414) (0.262) (0.344) (0.323) (0.119)
Black 1.04 1.12 1.16 0.79 0.80 (0.882) (0.685) (0.602) (0.375) (0.435)
Hispanic 1.65 0.92 1.06 2.50 2.04 (0.226) (0.862) (0.889) (0.134) (0.180)
1.31 0.71 0.77 2.95 2.46 Asian, American Indian, Pacific Islander, or Alaska Native (0.698) (0.722) (0.759) (0.137) (0.152)
Education (high school) 0.71 0.71 0.72 0.87 0.91 (0.250) (0.283) (0.322) (0.686) (0.779)
Education (college) 0.53 0.93 0.75 0.44 0.55 (0.240) (0.888) (0.568) (0.103) (0.232)
1.93 1.51 1.83 1.44 1.21 Very good or excellent health status (0.010)** (0.137) (0.026)** (0.170) (0.519)
Plan type Exiting 0.54 0.62 0.56 0.81 1.00
(0.025)** (0.080)* (0.034)** (0.447) (0.999) Rating of personal doctor
Medium (8-9) 2.83 3.62 (0.007)*** (0.000)***
High (10) 9.19 12.05 (0.000)*** (0.000)*** Personal experience
Access 0.35 0.55 (0.002)*** (0.073)*
Timeliness 1.15 0.73 (0.608) (0.241)
Communication 1.77 2.29 (0.061)* (0.015)**
Courtesy 0.92 2.02 (0.808) (0.050)*
Observations 441 433 433 438 438
p values in parentheses * significant at 10%; ** significant at 5%; *** significant at 1%

20
Exhibit 7b - Adults Ordered logit regression models for ratings of overall health care:
demographic variables, plan exit status, personal experiences, and rating of personal doctor
Rating of overall health care Demographics
Age (35+) 1.70 1.51 1.44 (0.058)* (0.210) (0.245)
Male 2.09 3.65 3.46 (0.077)* (0.003)*** (0.009)***
Black 0.85 0.86 0.89 (0.512) (0.590) (0.663)
Hispanic 1.33 0.74 0.79 (0.635) (0.649) (0.699)
0.81 0.30 0.35 Asian, American Indian, Pacific Islander, or Alaska Native (0.573) (0.015)** (0.020)**
Education (high school) 0.52 0.47 0.47 (0.016)** (0.005)*** (0.005)***
Education (college) 0.39 0.53 0.47 (0.067)* (0.195) (0.094)*
1.83 1.49 1.86 Very good or excellent health status (0.021)** (0.190) (0.030)**
Plan type Exiting 0.64 0.80 0.67
(0.088)* (0.412) (0.127) Rating of personal doctor
Medium (8-9) 3.81 4.92 (0.000)*** (0.000)*** High (10) 12.62 20.58
(0.000)*** (0.000)*** Personal experiences
Access 0.50 (0.040)**
Timeliness 0.73 (0.272) Communication 1.79
(0.098)* Courtesy 2.32 (0.059)*
Observations 445 437 437
p values in parentheses * significant at 10%; ** significant at 5%; *** significant at 1%

21
Gender
Our regression analyses include an indicator variable for males. Because this is a Medicaid population, only 8.1 of the respondents (beneficiaries) were male. For adults rating their own care, gender does not appear to influence the ratings of either health plans or personal doctor, as none of the odds ratios were significant. In rating their overall health care, however, we found that males had over twice the odds (odds ratios of 2.09-3.65 across the models) of rating their overall health favorably compared to females.
Race
Our regression analysis includes indicator variables for Hispanics (Latinos), non-Hispanic blacks, and non-Hispanics who identified themselves Asian, American Indian, Pacific Islander, or Alaska Native. Our reference group is non-Hispanic whites. We found some differences in how the race/ethnic groups rated their health care compared to non-Hispanic whites.
We combined Hispanic ethnicity and race into a single variable for these analyses for two reasons. First, while race and Hispanic ethnicity are considered distinct concepts by the federal government and were asked in separate questions on the 2000 Census, often persons of Hispanic ethnicity view the race question as either confusing or redundant (Population Reference Bureau, 2005). On the 2000 Medicaid Managed Care Survey, it appears that some of the Hispanic respondents were confused by the follow-up question on race because they wrote in “Hispanic” on the race question. Second, only a small percentage of Ohio’s Medicaid managed care program were Hispanic; and most of these were white Hispanics. For these analyses, we thought it best to combine the race/ethnic status into a single variable.
We found no differences between whites and the other three race/ethnic groups in the ratings of health plan and doctor. For the rating of overall health care, only the Asian/Pacific Islander/American Indian/Alaska Native race/ethnic group differed from whites. This group had lower odds of rating their overall health care favorably, with odds ratios between .30 and .81 across the three models; the finding is statistically significant in the second and third models that include personal experiences or the rating of personal doctor.
Education Level
The 2000 Ohio survey asks respondents about the number of years of education completed. We grouped respondents into (1) those not completing high school, (2) those completing high school, and (3) those completing college. Our analysis uses the first group as the reference group. Education level did not affect the ratings of health plan or personal doctor. For the rating of overall health care, however, having either graduated from high school or college influenced the ratings. Respondents with a high school education were half as likely to rate their overall health care favorably compared to persons who did not graduate from high school (odds ratios ranged from .47-.52 across the three models). Having a college education also lowered the odds of a favorable rating by a similar amount, but only according to the models that did not include the personal experiences. Once personal experiences are included in the analysis, graduating from college did not affect the rating. This becomes apparent by the decline in the statistical significance of the odds ratios that occurs once the personal experiences are added.

22
Health Status
The last personal characteristic included in our analyses is health status. Survey participants were asked to rate their health as “poor,” “fair,” “good,” “very good,” or “excellent.” We constructed an indicator variable for persons in very good to excellent health; the regression models compare them to persons who rated their health as poor, fair, or good. In the models that did not include personal experiences, adults who were in very good or excellent health had almost twice the odds (odds ratios of 1.93 and 1.83) of rating their health plans favorably compared to those in poorer health. Once personal experiences are controlled, however, health status did not affect the rating of health plan. While being in good health affected the health plan rating, it did not affect how beneficiaries rated their doctors. The results for the rating of overall health care mirrored the results of the plan rating. The health status indicator variable is significant only in the models that do not include the beneficiaries’ personal experiences with their doctors’ offices and the plans.
4.2.2 Adults: Exit Status of Plans
In year 2000, eleven plans participated in the Medicaid managed care market in Ohio. By the end of 2000, two plans had left the Medicaid managed care market; and by the end of 2001, two other plans had left the market. We grouped the plans according to their status in the market to find out whether this status is associated with the results of the satisfaction surveys. Specifically, we defined two plan groups: (1) Continuing plans are those that participated in the Medicaid program for more than one year after the year of the survey; (2) Exiting plans are those that left the Medicaid managed care market within one year after the measurement year. Exhibit 8 lists the health plans by their exit status.
Beneficiaries in exiting plans tended to rate their plans lower than beneficiaries in continuing plans. They also rated their overall health care lower than respondents in continuing plans. Exhibit 9 illustrates the differences in the ratings between the exiting plans and the continuing plans for adult beneficiaries. These differences are unadjusted for differences in the beneficiary populations. We tested these differences between exiting plans and continuing plans in the series of regression models by controlling for demographic variables.
All of the regression models include a dummy variable representing the group of exiting plans. In the first and third regression models, the exiting plans had about 50 percent lower odds (odds ratios of .54 and .56, respectively) of receiving a favorable rating compared with plans that continued serving the Medicaid population. In the full model, however, the odds become closer to that of continuing plans (odds ratio of .62) and is no longer statistically significant at the 5 percent level. The findings for the rating of overall health care are similar: the significance changes from .088 to .412 from the first to the full model. For the rating of personal doctor, being in an exiting plan did not seem to matter, as the odds ratios are at or about 1.0 (.81 and 1.0) and were not statistically significant.

23
Exhibit 8 Ohio Medicaid managed care plans, 2000
Exit year Continuing Dayton Area Health Plan - Emerald HMO - Family Health Plan - Genesis Health Plan - Paramount Health Care - QualChoice Health Plan - SummaCare - Exiting HMO Health Ohio 2000 Total Health Care 2000 Mediplan 2001 SuperMed HMO 2001
Exhibit 9 Adults by plan exit status
34.6%
24.2% 24.6% 21.3%27.8%
22.0%
30.4%
36.8%31.6%
32.9%
36.4%
37.1%
35.1%39.0%
43.9% 45.8%
35.8%40.9%
0.0%
10.0%
20.0%
30.0%
40.0%
50.0%
60.0%
70.0%
80.0%
90.0%
100.0%
Exiting Plans Continuing Plans Exiting Plans Continuing Plans Exiting Plans Continuing Plans
Rating of Health Plan Rating of Personal Doctor Rating of Overall Health Care
% High (10)
% Medium (8-9)
% Low (0-7)

24
4.2.3 Adults: Personal Experiences with Care
Experiences with Getting Needed Care (Access)
For the access scale, the dummy variable indicates that the beneficiary experienced some sort of problem getting needed medical care, as measured by the two questions composing the scale. The reference group is those who reported having no or little problems getting needed care, according to the scale. Adult beneficiaries who reported problems getting needed medical care had a two thirds lower odds (odds ratio of .35) of rating their health plans favorably. In addition, this finding is significant at the 1 percent level. Similarly, those experiencing a problem getting needed care had half the odds of rating both their doctors favorably and their overall health care favorably, with odds ratios of .55 and .50, respectively.
Experiences with Getting Care Quickly (Timeliness)
As with the access scale, the scale created for the timeliness of care is based on two questions. The dummy variable created represents problems with the timeliness of care. The reference group for the timeliness scale is those who reported no problems with getting care quickly. For adult beneficiaries, their experiences in getting care quickly did not appear to influence how they rated their health plans, their doctors, or their overall health care. None of the odds ratios are statistically significant and the odds ratios are within 27 percent of 1.0.
Experiences Communicating with Doctors (Communication)
The third scale measures personal experiences communicating with personal doctors and other health care providers. This measure is based on four questions for adults and five questions for proxies. Unlike the access and timeliness scales, it uses the entire sets of questions originally designed to calculate the corresponding CAHPS® composite measure. This is because almost all of the items were asked of respondents (or the children for whom they were proxies) who visited doctors’ offices in the prior six months. The indicator variable used in the model represents the perception that providers communicate well.
The perception that providers communicate well had a modest effect on how adult beneficiaries rated their health plans and their overall health care. Those who thought their providers consistently communicated well had about 80 percent higher odds (odds ratio of 1.77 and 1.79) of rating their health plans and health care favorably. These results are marginally significant (at the 10 percent level), however. Not surprisingly, the perceived communication skills of providers had a larger effect on the rating of personal doctor, as beneficiaries who thought there doctors communicated well had twice the odds (odds ratio of 2.29) of rating their doctors favorably.
Courteousness of Office Staff (Courtesy)
The courtesy scale is constructed from the two CAHPS® questions originally designed to calculate the corresponding CAHPS® composite measure. The dummy variable created indicates that office staff members were perceived to be consistently courteous.
The courteousness of office staff had no effect on the rating of health plan by adult consumers. This is not surprising, since the questions refer to staff members at doctors’ offices rather than health plans. Receiving courteous treatment did affect the ratings of personal doctor

25
and of overall health care, however. Those who reported receiving courteous treatment by staff at their doctors’ offices had almost twice the odds (odds ratio of 2.02) of rating their doctors favorably, and twice the odds (odds ratio of 2.32) of rating their overall health care favorably.
4.2.4 Adults: Rating of Personal Doctor
Both the second and third series of regressions include the rating of personal doctor as an independent variable. We created two indicator variables for the personal doctor rating used in the regressions on health plans and on overall health care: one for people who rated their doctors as “Medium” and one for people who rated their doctors as “High.” In the full model, adults have over twice the odds (odds ratio of 2.83) of rating their health plans favorably when they rate their doctors as “Medium” compared to “Low;” they have over nine times the odds (odds ratio of 9.19) when they rate their doctors as “High” compared to “Low.” The odds were slightly higher in the third regression model, which does not include personal experiences with care. This suggests that the rating of personal doctor subsumes some of the variance explained by the personal experiences.
4.3 Children
As with our analysis of adults, for children we first discuss the effects of demographic characteristics, plan exit status, and personal experiences scales on the ratings for health plans, personal doctor, and overall health care, and then follow with a discussion of how the rating of personal doctor predict the ratings of health plans and overall health. Exhibits 10a and 10b, below, present the odds ratios and significance levels for the three series of regressions for children.
4.3.1 Children: Individual Characteristics
Age
The age of proxies appears to affect only the rating of health plans, as adult proxies 35 years and older were slightly more likely (odds ratios of 1.24-1.27 across the three models) to rate their children's plans favorably compared to younger proxies. For the personal doctor rating, we detected no differences between the two age groups. For the rating of overall health care, age had a small impact (odds ratio of 1.27) in the first model only.
Gender
Only 6.3 percent of the respondents (adult proxies) were male for the child surveys. The gender of the adult proxy did not influence any of the ratings for children’s health care. All of the odds ratios are in the neighborhood of 1.0 and none are statistically significant.
Race
Blacks and Hispanic proxies were slightly less likely (odds ratios of .62-.79 across all models) to rate their children's health plans favorably compared to Whites, even controlling for how they rated their doctors and their personal experiences. The finding for Hispanics is significant at the 10 percent level only, however. Blacks, Hispanics and Whites rated their doctors and their overall health care similarly. Respondents identifying as Asian/Pacific

26
Exhibit 10a - Children Ordered logit regression models for ratings of health plan and personal doctor:
demographic variables, plan exit status, personal experiences, and rating of personal doctor
Rating of health plan Rating of personal doctor Demographics
Age (35+) 1.27 1.27 1.24 1.17 1.14 (0.047)** (0.056)* (0.078)* (0.216) (0.301) Male 1.14 1.27 1.32 0.92 0.90 (0.593) (0.358) (0.265) (0.703) (0.667) Black 0.79 0.75 0.76 1.03 1.02 (0.049)** (0.022)** (0.025)** (0.793) (0.847) Hispanic 0.66 0.63 0.62 1.01 1.06 (0.098)* (0.070)* (0.055)* (0.959) (0.818) Asian, American Indian, Pacific Islander, or Alaska Native
0.42 0.62 0.65 0.34 0.39
(0.043)** (0.290) (0.344) (0.033)** (0.133)
Education (high school) 0.59 0.53 0.55 0.98 0.99 (0.000)*** (0.000)*** (0.000)*** (0.917) (0.938)
Education (college) 0.44 0.51 0.46 0.77 0.86 (0.003)*** (0.014)** (0.002)*** (0.364) (0.621) Very good or excellent health status 2.22 1.80 2.05 1.46 1.25 (0.000)*** (0.000)*** (0.000)*** (0.005)*** (0.116)
Plan type Exiting 0.69 0.73 0.67 0.98 1.13
(0.002)*** (0.018)** (0.002)*** (0.880) (0.390)
Rating of personal doctor Medium (8-9) 1.65 2.15 (0.007)*** (0.000)*** High (10) 5.55 8.34 (0.000)*** (0.000)***
Personal experiences Access 0.35 0.63 (0.000)*** (0.012)** Timeliness 0.76 0.80 (0.035)** (0.093)*
Communication 1.45 3.10 (0.023)** (0.000)***
Courtesy 1.56 1.64 (0.013)** (0.007)***
Observations 2,156 2,135 2,140 2,154 2,148
p values in parentheses * significant at 10%; ** significant at 5%; *** significant at 1%

27
Exhibit 10b - Children Ordered logit regression models for ratings of overall health care: demographic variables, plan exit status, personal experiences, and rating of personal doctor
Rating of overall health care Demographics
Age (35+) 1.27 1.21 1.21 (0.054)* (0.169) (0.162) Male 1.14 1.37 1.40 (0.591) (0.235) (0.185) Black 0.92 0.82 0.83 (0.482) (0.165) (0.166) Hispanic 1.00 0.99 0.95 (0.994) (0.980) (0.827) Asian, American Indian, Pacific Islander, or Alaska Native
0.27 0.40 0.44
(0.007)*** (0.057)* (0.059)*
Education (high school) 0.81 0.75 0.77 (0.177) (0.120) (0.134) Education (college) 0.61 0.74 0.68 (0.111) (0.331) (0.183)
1.85 1.56 1.78 Very good or excellent health status (0.000)*** (0.002)*** (0.000)***
Plan type Exiting 0.71 0.70 0.64
(0.008)*** (0.020)** (0.002)*** Rating of personal doctor
Medium (8-9) 3.15 4.23 (0.000)*** (0.000)*** High (10) 26.15 40.23
(0.000)*** (0.000)*** Personal experiences
Access 0.51 (0.000)*** Timeliness 0.72 (0.021)** Communication 2.11 (0.000)*** Courtesy 1.80 (0.001)***
Observations 2,156 2,135 2,141
p values in parentheses * significant at 10%; ** significant at 5%; *** significant at 1%

28
Islander/American Indian/Alaska Native had about 50 percent lower odds of rating their children’s health plans and doctors favorably compared Whites. When personal experiences are considered, however, the difference between this group and whites disappears (the odds ratios become insignificant). For the rating of overall health care, the pattern is similar: Asian/Pacific Islander/American Indian/Alaska Natives have lower odds of rating overall health care favorably, but the effect diminishes as personal experiences are controlled. The odds ratio changes from .27 with high significance in the first model to .40 with marginal significance in the full model.
Education Level
We found a small but compelling relationship between education level and how proxies for children in the Medicaid managed care program rated health plans. Proxies who graduated from high school or college had about half the odds (odds ratios range from .44 to .59) of rating children’s health plans favorably. This finding is statistically significant across all three models for both those graduating from high school or college. Although education level affected how proxies rated children’s health plans, it did not affect how they rated children’s doctors (the odds ratios are very close to 1.0 and are not statistically significant) or their overall health care (odds ratios are not statistically significant).
Health Status
Parents or proxies who reported their children as being in very good or excellent health had about twice the odds of rating health plans and overall health care favorably (odds ratios range from 1.80 to 2.22 for health plans, and from 1.56 to 1.85 for overall health care) compared to proxies of children reported to be in poorer health. While a child’s health affects plan ratings by proxies, it does not appear to affect how a proxies rate doctors once personal experiences are considered. In the regression models for the rating of doctor, the health status variable is significant only in the model that does not include the personal experiences of the proxies and children.
4.3.2 Children: Exit Status of Plans
Proxies for children in exiting plans tended to rate their plans lower than beneficiaries or proxies for children in continuing plans. They also rated their children’s overall health care lower than respondents in continuing plans. Exhibit 11 illustrates the unadjusted differences in the ratings between the exiting plans and the continuing plans for children. The regression results account for these differences.
The proxies for children in exiting plans had slightly lower odds (odds ratios range from .69 to .73 across the three models) of rating their child’s health plans favorably compared to proxies in continuing plans. The results for the rating of overall health care are similar. We found no differences in the rating of personal doctor between proxies for children in exiting plans compared to proxies for children in continuing plans: the odds ratios are about 1.0 and are not statistically significant.

29
Exhibit 11 Children by plan exit status
22.7%18.5%
14.3% 12.9% 14.0% 10.2%
32.0%31.8%
28.6% 29.5%33.2%
34.9%
45.3%49.7%
57.1% 57.6%52.8% 54.9%
0.0%
10.0%
20.0%
30.0%
40.0%
50.0%
60.0%
70.0%
80.0%
90.0%
100.0%
Exiting Plans Continuing Plans Exiting Plans Continuing Plans Exiting Plans Continuing Plans
Rating of Health Plan Rating of Personal Doctor Rating of Overall Health Care
% High (10)
% Medium (8-9)
% Low (0-7)
4.3.3 Children: Personal Experiences with Care
Experiences with Getting Needed Care (Access)
For each of the three ratings, proxies who had negative experiences getting needed care for children had lower odds of reporting favorable ratings compared to those who reported no negative experiences. The odds for rating health plans were two thirds lower (odds ratio of .35); for rating personal doctors, one–third lower (odds ration of .63); and for overall health care, half as much (odds ratio of .51). As with the access scale, all of the results were statistically significant.
Experiences with Getting Care Quickly (Timeliness)
Proxies who had negative experiences getting care quickly for children had 24 percent lower odds (odds ratio of .76) of rating health plans favorably compared to those who reported no negative experiences getting timely care for children. The results for the rating of personal

30
doctor and overall health care were similar, with odds ratios of .80 and .72 respectively. All of the results were statistically significant, although marginally so for the rating of personal doctor.
Experiences Communicating with Doctors (Communication)
Persons who viewed their children’s providers as good communicators had 50 percent higher odds (odds ratio of 1.45) of rating health plans favorably compared to those who viewed their children’s providers as inconsistently communicating well. The relationship between a provider’s communication skills and the rating of personal doctor is much greater: persons who viewed their children’s doctors as good communicators had over three times the odds (odds ratio of 3.10) of rating doctors favorably compared to the reference group. Good communicators influence the ratings for overall health care less than the rating of personal doctor but more than the health plan rating, with the odds ratio at 2.11.
Courteousness of Office Staff (Courtesy)
When proxies perceived the staff at doctor’s offices to be courteous, they had 56 percent higher odds of rating their children’s health plans favorably, 64 percent higher odds of rating their children's doctors favorably, and 80 percent higher odds of rating their children’s overall health care favorably. The courtesy scale is statistically significant at the two percent level in each of the three regression models.
4.3.4 Children: Rating of Personal Doctor
When a child’s parent (or proxy) rated a doctor as “High” compared to “Low,” he or she also had about 5-8 times higher odds of rating the child’s health plan favorably, depending on whether personal experiences are controlled for. The odds ratio in the full model (including personal experiences) is 5.55 and the odds ratio in the model without personal experiences is 8.34. When a child’s proxy rates a child’s doctor as “Medium” compared to “Low,” there appears to be a more modest effect on how he or she rates the health plan: the odds ratio is 1.65 in the model with personal experiences and 2.15 in the model without them. For the rating of overall health care, how one rates their children's doctors appears to determine the rating for overall health care. Those who rated their children's doctors as "High" had 26 and 40 times higher odds of rating their children's overall health care favorably.

31
SECTION 5 ANALYSES OF THE DETERMINANTS OF RATINGS FOR HEALTH PLANS, PERSONAL DOCTOR, AND OVERALL HEALTH CARE: DISCUSSION AND
CONCLUSIONS
5.1 Individual Characteristics
The age of respondents mattered when adults rated their own doctors but did not matter in the case of adult proxies rating care for their children. The opposite was true for the rating of health plans, as older adult proxies had slightly higher (about 25 percent) odds of rating children’s health plans favorably compared to younger adult proxies. These findings are consistent with previous research (e.g., Zahn, et al., 2002) describing how satisfaction ratings for adults and children might differ.
The only gender difference we found was in how adults rated their overall health care. Men who completed the Ohio survey had about three times the odds of rating their overall health care favorably compared to women, but did not rate their health plans or doctors differently than women. We found no differences between male and female proxies in any of the three ratings. Our findings are only slightly different from those of Weisman et al. (2001), who analyzed gender and patient satisfaction in commercial managed care using data from the HEDIS/CAHPS® 2.0H adult survey. In that study, researchers found that differences in satisfaction were small and perceptions of care do not differ significantly between men and women.
Previous research has shown that persons of different races and ethnicities rate their health plans and doctors differently. For example, Weech-Maldonado, et al. (2001) studied whether parents’ Medicaid managed care CAHPS® reports of pediatric care vary by race/ethnicity or language. Racial/ethnic minorities scored lower on a number of measures, including access to medical services (specialists and treatments) and timeliness of care and health plan service. Non-English speakers (Hispanic and Asian) also had more negative CAHPS® ratings. Asian non-English speakers reported the lowest satisfaction. Our findings are consistent with this research. For the rating of health plan, we found that Black and Hispanic parents or proxies were less likely than Whites to give favorable ratings. As with the previous research, we found that parents identifying as Asian/American Indian/Pacific Islander/Alaska Native gave the lowest ratings. For the rating of plans and doctors, this finding did not hold when personal experiences are considered, however.
In the analyses of adult care, we found that persons identifying as either Asian, Pacific Islander, American Indian, or Alaska Native rated their overall health care slightly lower than Whites, controlling for all other factors. This finding is consistent with an analysis by Morales, et al. (2001) who looked at racial differences between CAHPS® ratings among adults on commercial health plans and Medicaid. That study found that the ratings and composite scores were similar among racial/ethnic groups with the exception of Asians/Pacific Islanders who reported worse access, promptness of care, and communication with providers than other groups. Less than 5 percent of the respondents to the Ohio survey identified themselves as in this group, however.
32
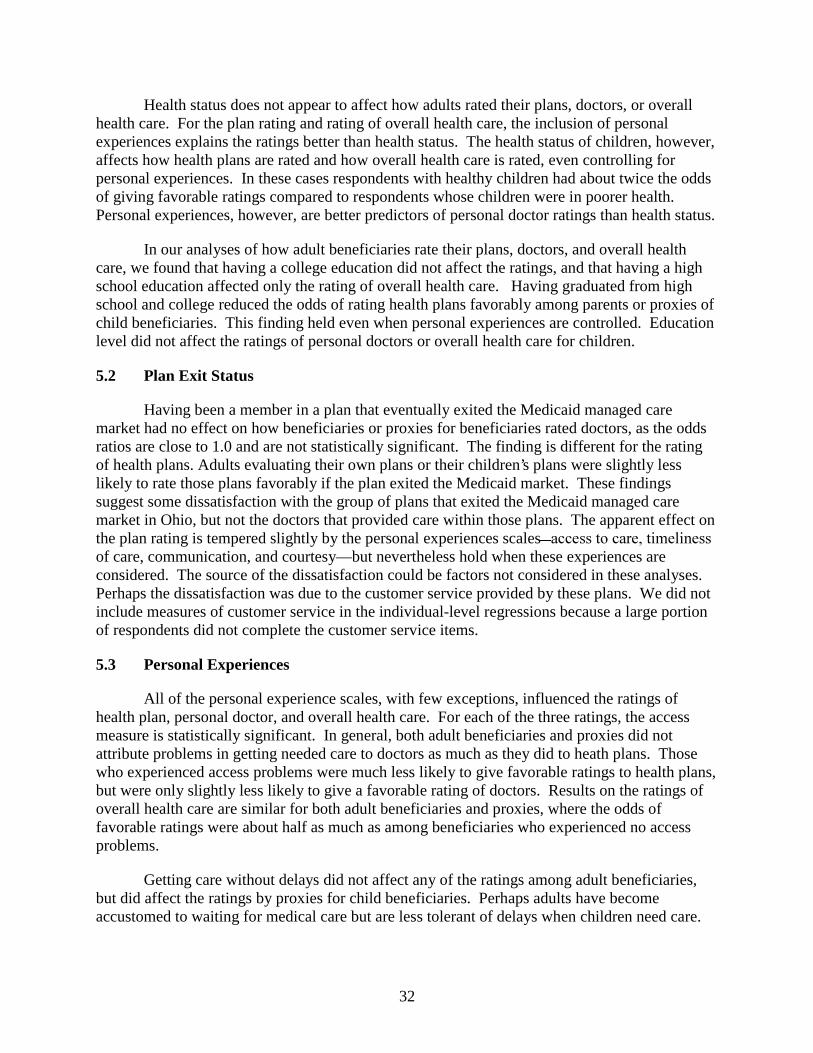
Health status does not appear to affect how adults rated their plans, doctors, or overall health care. For the plan rating and rating of overall health care, the inclusion of personal experiences explains the ratings better than health status. The health status of children, however, affects how health plans are rated and how overall health care is rated, even controlling for personal experiences. In these cases respondents with healthy children had about twice the odds of giving favorable ratings compared to respondents whose children were in poorer health. Personal experiences, however, are better predictors of personal doctor ratings than health status.
In our analyses of how adult beneficiaries rate their plans, doctors, and overall health care, we found that having a college education did not affect the ratings, and that having a high school education affected only the rating of overall health care. Having graduated from high school and college reduced the odds of rating health plans favorably among parents or proxies of child beneficiaries. This finding held even when personal experiences are controlled. Education level did not affect the ratings of personal doctors or overall health care for children.
5.2 Plan Exit Status
Having been a member in a plan that eventually exited the Medicaid managed care market had no effect on how beneficiaries or proxies for beneficiaries rated doctors, as the odds ratios are close to 1.0 and are not statistically significant. The finding is different for the rating of health plans. Adults evaluating their own plans or their children’s plans were slightly less likely to rate those plans favorably if the plan exited the Medicaid market. These findings suggest some dissatisfaction with the group of plans that exited the Medicaid managed care market in Ohio, but not the doctors that provided care within those plans. The apparent effect on the plan rating is tempered slightly by the personal experiences scales ������������������� ����of care, communication, and courtesy—but nevertheless hold when these experiences are considered. The source of the dissatisfaction could be factors not considered in these analyses. Perhaps the dissatisfaction was due to the customer service provided by these plans. We did not include measures of customer service in the individual-level regressions because a large portion of respondents did not complete the customer service items.
5.3 Personal Experiences
All of the personal experience scales, with few exceptions, influenced the ratings of health plan, personal doctor, and overall health care. For each of the three ratings, the access measure is statistically significant. In general, both adult beneficiaries and proxies did not attribute problems in getting needed care to doctors as much as they did to heath plans. Those who experienced access problems were much less likely to give favorable ratings to health plans, but were only slightly less likely to give a favorable rating of doctors. Results on the ratings of overall health care are similar for both adult beneficiaries and proxies, where the odds of favorable ratings were about half as much as among beneficiaries who experienced no access problems.
Getting care without delays did not affect any of the ratings among adult beneficiaries, but did affect the ratings by proxies for child beneficiaries. Perhaps adults have become accustomed to waiting for medical care but are less tolerant of delays when children need care.

33
How well doctors communicate is a key determinant of all the ratings and is particularly important in determining the ratings of personal doctors. Both adult beneficiaries and proxies who viewed doctors as good communicators were more likely to give favorable ratings in general compared to those who did not. For both groups, communication affected the ratings for doctors the most, followed by the rating of overall health care.
Receiving courteous treatment at doctors’ offices appeared to influence how adult proxies rated children’s health plans, but did not influence how adult beneficiaries rated their own plans. However, both groups of respondents appear to base their ratings of personal doctor and overall health care on their personal experiences interacting with office staff.
Perhaps the most revealing finding is how the effects of demographic characteristics (and to some extent, the exit status of the plan) diminish when accounting for personal experiences. Personal characteristics, including age, education, health status, and identifying as an Asian/ Pacific Islander/Native American/Alaska Native became less significant or insignificant once personal experiences were considered. The specific analyses where this occurred were:
(1) Age - in the case of the adult rating overall health among all respondents, and among adults rating their own health plan.
(2) Race - among those identifying as Asian/ Pacific Islander/Native American/Alaska Native, in the rating of health plans for their children.
(3) Having a college education - among adults rating their overall health care and parents rating their children's health plans, and
(4) Health status - in all the analyses except for the rating of doctors among adult beneficiaries.
This suggests that personal experiences with plans and providers largely drive the overall satisfaction scores among Medicaid beneficiaries in Ohio. It also suggests that beneficiaries in different subgroups have different personal experiences receiving care. This is an area for further research and closer examination.
5.4 Rating of Personal Doctor
The rating of personal doctor is highly predictive of how adult beneficiaries and proxies rate health plans and overall health care. The rating of personal doctor influenced the rating of health plan and of overall health more than any other factor and is highly correlated with the other two ratings. When adult proxies rated their children’s doctors “High” compared to “Low,” they had 5 times higher odds of rating health plans favorably and 26 times higher odds of rating overall health care favorably. Clearly how one perceives their doctor is the most important determinant of plan satisfaction.
Another area for additional research is exploring the relationships between the ratings of doctors and plans further. In these analyses, we show how personal experiences with physicians and their staffs affect the physician ratings; and, in turn, the physician ratings affect the plan ratings. This sequence is supported because the physician rating becomes a stronger determinant

34
of the plan rating when the personal experiences are removed from the models. It is plausible that the relationship between plan- and physician ratings is more complex than presented here. A bi-directional model might further identify the determinants of beneficiary satisfaction.
5.5 Conclusions
We identified a small but detectible effect on plan satisfaction for child beneficiaries attributable to being in a plan that exited the Medicaid program in Ohio. Exiting plans received a lower plan rating, controlling for all other factors. Beneficiaries or proxies rated doctors similarly whether they were in an exiting or continuing plan, however. Any negative perceptions by those in the exiting plans do not appear to be connected to doctors. The fact that these plans left the Medicaid market implies that they had some difficulties providing service to the beneficiaries compared to the continuing plans.
This analysis revealed that personal experiences directly influence how Medicaid beneficiaries or their adult proxies rate health plans, personal doctors, and overall health care. Almost every personal experiences scale is highly significant in the analyses, which tested how these scales affect the three ratings. For both the rating of children’s health plans and the rating of children’s overall health care, all four measures of personal experiences are significant at the 1 or 5 percent levels; for the personal doctor rating, all scales but the timeliness scale are significant at the 2 percent level. For adult beneficiaries, all categories of personal experiences appear to influence the ratings except for getting care quickly and, in the case of the plan rating, receiving courteous treatment at doctors’ offices. Personal experiences with getting needed care mattered most in determining the plan rating for both adult and child beneficiaries. For the personal doctor rating, personal experiences in communicating with providers had the strongest effect.
The focus of most interactions with health care is physician offices, so it is no surprise that the ratings for physicians largely determine the ratings for plans and for overall health care. These findings provide empirical support for the current trend among researchers to develop physician-based performance and satisfaction measures. Doctors and staff at doctors’ offices are the focal point of receiving primary care, and satisfaction measures among Medicaid beneficiaries in Ohio appear to be sensitive to perceptions and experiences with doctors and their staffs.

35
REFERENCES
Agency for Healthcare Research and Quality: CAHPS®‚ 3.0 Survey and Reporting Kit. Rockville,MD. 2002
Bechtel, G.G.: Commensurate Ratings of Health Care. Journal of Outcome Measurement, Vol. 4(3):635-666, 2000.
Bender, R.H. and S.A. Garfinkel: Differences in the Structure of CAHPS® Measures among the Medicare Fee-for-Service, Medicare Managed Care, and Privately Insured Populations. HSR: Health Services Research, Vol. 36(3):489-508, July 2001.
Brown, J.A., S.E. Nederend, R. D. Hays, et al.: Special Issues in Assessing Care of Medicaid Recipients. Medical Care, Vol. 37(3):MS79-MS88, Supplement, 1999.
Carman, K.L., P.F. Short, D.O. Farley, et al.: Epilogue – Early Lessons from CAHPS® Demonstrations and Evaluations. Medical Care, Vol. 37(3):MS597-MS105, Supplement, 1999.
Elliott, M.N., R. Swartz, J. Adams, et al.: Consumer Evaluations for Health Plans and Health Care Providers – Case-Mix Adjustment of the National CAHPS® Benchmarking Data 1.0: A Violation of Model Assumption? HSR: Health Services Research, Vol. 36(3):555-573, July 2001.
Farley, D.O., M.N. Elliott, Rand, et al.: Effect of CAHPS® Performance Information on Health Plan Choices by Iowa Medicaid Beneficiaries. MCR&R, Vol. 59(3): 319-336, September 2002.
Farley, D.O., P.F. Short, D.E. Kanouse, et al.: Testing CAHPS® Health Plan Performance Reports in the Florida Medicaid Program, RAND Document, Doc. # MR-1218-AHCPR, 2000.
Farley, D.O., P.F. Short, M.N. Elliott, et al.: Effects of CAHPS® Health Plan Performance Information on Plan Choices by New Jersey Medicaid Beneficiaries. RAND Document, Doc. # LRP-200208-06, 2002, Published in Health Services Research, Vol. 37(4):985-1007, August 2002.
Fox, M. H., J. Morse, M. Zimmerman, et al.: The Effectiveness of CAHPS® among Women Enrolling in Medicaid Managed Care. Journal of Ambulatory Care Management, pp. 76-91, October 2001
Hays, R.D., J.A. Shaul, Dr. V.S.L. Williams, et al.: Psychometric Properties of the CAHPS® 1.0 Survey Measures. Medical Care, Vol. 37(3):MS22-MS31, Supplement, 1999.
Homer C., F. Fowler, P. Gallagher, et al.: The Consumer Assessment of Health Plan Study (CAHPS®) Survey of Children’s Health Care. Journal on Quality Improvement, 25(7): 369-377, 1999.
Homer, C. J., F. J. Fowler, P.M. Gallagher, et al.; The Consumer Assessment of Health Plan Study (CAHPS®) Survey of Children’s Health Care. Journal on Quality Improvement, Vol. 25(7):369-377, July 1999.

36
Kulas, B., J. Kautter, J. Mitchell, et al.: Who Exits Managed Care Markets - Does Plan Quality Matter? Final Report to CMS under Contract Number 500-95-0048. May 3, 2002.
Marshall G.N., L.S. Morales, M. Elliott, et al.: Confirmatory Factor Analysis of the Consumer Assessment of Health Plans Study (CAHPS®) 1.0 Core Survey. Psychological Assessment, 2001, 13:216-229.
Marshall, G.N., R.D. Hays, and R. Mazel: Health Status and satisfaction with health care: Results from the Medical Outcomes Study. Journal of Consulting and Clinical Psychology 64 (2): 380-90, 1996.
Millar, Dr. J.S., Dr. D. McCauley, C. Hays, et al.: Consumer Assessment of Health Plans Survey (CAHPS®) Results for Oklahoma Managed Care Medicaid, 1997, 1998 and 1999. Journal of Oklahoma State Medical Association, Vol. 93(3):109-117, March 2000.
Morales, L.S., M.N. Elliott, R. Weech-Maldonado, et al.: Differences in CAHPS® Adult Survey Reports and ratings by Race and Ethnicity: An Analysis of the National CAHPS® Benchmarking Data 1.0. HSR: Health Services Research, Vol. 36(3):595-617, July 2001.
Ohio Department of Job and Family Services: The 2000 Medicaid Managed Care Consumer Satisfaction Survey. Full Report. Prepared by ORC Macro, September, 2000.
Ohio Department of Job and Family Services, Bureau of Managed Health Care: Medicaid Managed Health Care Program, Progress Report, January-December 2000.
Ohio Department of Job and Family Services, Bureau of Managed Health Care: Medicaid Managed Health Care Program, Progress Report, January-December 2001.
Population Reference Bureau: Racial Identity in the U.S. Hispanic/Latino Population.. http://www.prb.org/AmeristatTemplate.cfm?Section=RaceandEthnicity&template=/ContentManagement/ContentDisplay.cfm&ContentID=7831, February11, 2005.
Scanlon, D.P., C. Darby, E. Rolph and H.E. Doty: Use of Performance Information for Quality Improvement – The Role of Performance Measures for Improving Quality in Managed Care Organization. HSR: Health Services Research, Vol. 36(3):619-641, July 2001.
Schneider, E.C., A.M. Zaslavsky, B.E. Landon, et al.: National Quality Monitoring of Medicare Health Plans – The Relationship between Enrollees’ Reports and the Quality of Clinical Care. Medical Care, Vol. 39(12):1313-1325, 2001.
Short, Dr. P.H., Dr. L. McCormick, Dr. J. Hibbard, et al.: Similarities and Differences in Choosing Health Plans. Medical Care, Vol. 40(4):289-302, 2002.
Solomon, Dr. L.S., Dr. A.M. Zaslavsky, B.E. Landon, et al.: Variation in Patient-Reported Quality among Health Care Organizations. Health Care Financing Review, Vol. 23(4): 85-100, Summer 2002.
37
Spranca, M., D.E. Kanouse, M. Elliott, et al. Do Consumer Reports of Health Plan Quality Affect Health Plan Selection? HSR: Health Services Research, Vol. 35(5) Part 1: 933-947, December 2000.
Stata Technical Bulletin. Stata Corporation, January 2000.
Weech-Maldonado, R., L.S. Morales, S. Spritzer, et al.: Racial and Ethnic Differences in Parents’ Assessments of Pediatric Care in Medicaid Managed Care. HSR: Health Services Research, Vol. 36(3):575-593, July 2001
Weisman, Dr. C.S., J.T. Henderson, E.S. Schifrin, et al.: Gender and Patient Satisfaction in Managed Care Plans: Analysis of the 1999 HEDIS/CAHPS® 2.0H Adult Survey. Women’s Health Issues, Vol. 11(5): 401-415, September/October 2001.
Zaslavsky, A.M. and P.D. Cleary: Dimensions of Plan Performance for Sick and Healthy Members on the Consumer assessments of Health Plans Study 2.0 Survey. HSR: Health Services Research, Vol. 36(3):489-508, July 2001.
Zaslavsky, A.M., J.A. Shaul, L.B. Zaborski, et al.: Combining Health Plan Performance Indicators into Simpler Composite Measures. Health Care Financing Review, Summer 2002, Vol. 23 (4):101-115.
Zaslavsky, A.M., L. Zaborski, and P.D. Cleary: Factors Affecting Response Rates to the Consumer Assessment of Health Plans Study Survey. Medical Care, Vol. 40(6):485-499, 2002.
Zaslavsky, A.M., L. Zaborski, and P.D. Cleary: Does the Effect of Respondent Characteristics on Consumer Assessments Vary across Health Plan? MCR&R, Vol. 57(3):379-394, September 2000.
Zaslavsky, A.M., N.D. Beaulieu, B.E. Landon, et al., Dimensions of Consumer-Assessed Quality of Medicare Managed-Care Health Plans. Medical Care, Vol. 38(2):162-174, 2000
Zhan, C., J Sangl, G.S. Meyer, and A.M. Zaslavsky: Consumer Assessments of Care for Children and Adults in Heath Plans. How Do They Compare? Medical Care Review 40 (2): 145-54, 2002.