Embed Size (px)
Citation preview
The Business & Management Review, Volume 4 Number 4 March 2014
International Conference on Business and Economic Development (ICBED), New York-USA 146
Determinants of foreign direct investment in SADC: an empirical analysis
Sannassee Raja Vinesh; Seetanah Boopendra; Diksha Hemraze
University of Mauritius, Reduit, Mauritius
Keywords FDI, FDI determinants, PVECM, PVAR
Abstract Most countries in the world are trying their best to attract more foreign direct investment. To be
able to identify the key determinants of foreign direct investment is a vital task. Compared to other parts of the world, the performance of South African Development Community (SADC) countries in attracting foreign direct investment is poor. This study deals with identifying the determinants of foreign direct investment inflow in SADC for the period of 1985 to 2010. Short run and long run relationships between FDI inflows and the other control variables are estimated in a PVECM and PVAR model respectively. Sources of variations are studied through Generalised Impulse Response Functions and Variance Decomposition. Trade openness, gross domestic product per capita, telephone line (per 100 people), secondary school enrolment rate, natural resources and exchange rate are the independent variables while foreign direct investment as a percentage of GDP is the dependent variable. The study findings show that trade openness, gross domestic product, natural resources and secondary school enrolment rate are the most significant determinant of foreign direct investment for Southern African Development Community.
1.0 Introduction
Foreign Direct Investment is one of the most important factors in international economic integration and it takes place when at least ten percent of the company shareholding in a domestic firm undertakes an investment is a foreign country. According to the OECD, ‘Foreign direct investment (FDI) is the category of international investment that reflects the objective of a resident entity in one economy to obtain a lasting interest in an enterprise resident in another economy’.
FDI creates direct, steady and long lasting links between economies while encouraging the transfer of technology and expertise between countries.It can also be regarded as an extra source of funding for investment and an important vehicle for enterprise development under the right policy environment. FDI is viewed as the most stable component; owing to the nature and duration of the commitment it involves (Barrell and Holland, 2000) and is seen as catalyst to the host nation’s economic growth and development as it improves technological practice and promote industrial development (Asheghian, 2004).
FDI has played an important role in economic development, not only in the developed countries but also in developing countries. According to UNCTAD (United Nations Conference on Trade and Development), FDI flows worldwide have surged within the last two decades. The UNCTAD World Investment Report 2012 shows that the rise of FDI flows in 2011 was widespread in all three major groups – developed, developing and transition economies. Developing economies continued to absorb nearly half of global FDI and transition economies another 6 per cent.
The Business & Management Review, Volume 4 Number 4 March 2014
International Conference on Business and Economic Development (ICBED), New York-USA 147
Hence, this paper aims to investigate the main determinants of FDI in the case of a sample of 12 countries in SADC, along with the exact direction of short run and long run causality among the variables.
The rest of the paper is structured as follows: Section 2 reviews the theoretical underpinnings and the existing literature on determinants of foreign direct investment. Section 3 details the methodology used while section 4 analyses the results obtained from empirical testing and provides arguments to support the results. Finally, section 5 concludes the study by summarizing the findings and presenting some policy implications.
2.0 Literature Review 2.1 Theories of FDI
The Hecksher-Ohlin Model was first conceived by two Swedish economists, Eli Hecksher (1919) and Bertil Ohlin. It mainly argues about international differences in labour, labour skills, physical capital or land that create productive differences that explain why trade occurs. The model highlights that countries will export products that use their abundant and cheap factors of production and import products that use the countries scarce factors.
According to Dunning (1981, 1988), the The Eclectic Paradigm presents a popular and flexible framework where there is three particular reasons why companies choose to go global- ownership, locational and internalization. The Ownership advantages are regarded as advantage which firms develop in the home country. It allows a company to diversify its technologies, brand recognition and unique product qualities. The second advantage is locational advantage; firms seek in foreign countries for several reasons such as cheap resources, cheap labour, and favourable exchange rate, and regulations which are not available to the firm in the home country. The third advantage consists of Internalization which relates to benefits derived to company’s trade-off between FDI and exporting and licensing. Internalisation explains why a firm would rather choose a foreign market through FDI rather than pursue alternative modes without ownership control.
Raymond Vernon (1966) explains through his Product Life Development Theories that a product goes through four stages- the innovative, take off, maturity and decline stages. He tried to understand the shift of international trade and international investment. At the initial stage, the enterprises are more focused on the domestic market. And then in the next stage, when the product matures, enterprises start exporting to developed countries. At this stage the innovating enterprises enjoys the profit of the sales of newly invented product until rival enterprises copy and produce the same product. Later when the demand for the product increases the product will be standardized.
2.2 Determinants of FDI Market size is defined through the market volume and market potential. It is measured
by GDP per capita and is considered as an important determinant used when determining FDI (Artige and Nicolini (2005). Charkrabarti(2001) states that the market-size hypothesis supports an idea that a large market is required for efficient utilization of resources and exploitation of economies of scale. As the market size grows, FDI increases and thus enables investors to benefit from economies of scale.
Trade openness promotes the efficient allocation of resources through specialization and comparative advantage and competition in both national and international markets. It allows easier diffusion of knowledge and technology across countries. Moreover if less capital controls and liberal trade policies are applied, it thus attracts more FDI (Onyeiwu and Shrestha, 2004).

The Business & Management Review, Volume 4 Number 4 March 2014
International Conference on Business and Economic Development (ICBED), New York-USA 148
The ability to move capital in and out of a country is essential for foreign investors. Trade to GDP ratio is frequently used to measure the importance of international transactions.
Productivity is a measure of economic efficiency which shows how effectively economic inputs are converted into output. Charkrabarti (2001) claims that wage as an indicator of labour
cost has been the most contentious of all the potential determinants of FDI. Cheap labour helps in attracting multinationals but however the availability of skilled labour is also considered. Human capital is found to be a relevant determinant that affects the level of productivity. Basically skilled labour sectors where the level of education improves, productivity increases and facilitates implementation of technological innovations (Brooks et al., 2010). So a significant
positive relation of FDI can be expected particularly for efficiency seeking FDI. The level of political risk among FDI determinants remains relatively unclear. Specific
proxy variables (e.g. number of strikes and riots, work days lost) have proved important in some studies; but these quantitative estimates can capture only some aspects of the qualitative nature of political risk.
Infrastructure range from roads, ports, railways, telecommunication systems to institutional development. Poor infrastructure can be viewed as both an obstacle and a chance for foreign investment. For the majority of low-income countries, it is frequently quoted as one of the major constraints. Nevertheless, foreign investors also point to the potential for attracting important FDI if host governments allow more substantial foreign participation in the infrastructure sector.
Economic growth is the increase in the amount of the goods and services produced by an economy over a certain period of time. It is mostly measured as the per cent rate of increase in real GDP. Charkrabarti(2001) states a rapidly growing economy provides relatively better opportunities for making profits than the ones growing slowly or not growing at all. Lunn (1980), Schneider and Frey (1985) and Culem (1988) find a positive effect of growth on FDI, while Tsai (1994) obtains a strong support for the hypothesis over the period 1983 to 1986, but only a weak link from 1975 to 1978.
The literature remains fairly indecisive regarding whether FDI may be sensitive to tax incentives. It is argued that high levels of taxation would discourage FDI whilst low level of taxes would encourage foreign investors. The latter do consider the nature of tax law in host countries before any investment decisions. Therefore countries try to provide lower tax rate to attract more FDI. However, Narula and Dunning (2000) suggests that tax rates may not be the deciding factor in MNC’s Investment decisions and that other location specific advantages may have a much greater effect.
Exchange rate can affect FDI by lowering the costs of production by MNC and thus affect the competitiveness of goods produced and yield higher profits from foreign firms. Lim (2001) argues that the depreciation of a currency could imply that foreign firms would be able to purchase assets and technology in the host country cheaply thus increasing FDI. On the contrary, an appreciation would imply more foreign currency earnings for the foreign investors hence would increase FDI inflow.
A good financial system is of ultimate importance for the functioning of the modern economy and is represented by financial institutions especially banks, the government and international institutions. The development of the domestic financial system will help foreign firms to raise finance in order to broaden activities in the host country. This would further boost the scope for technological spillovers to domestic firms. FDI, as measured by the financial flow data, is partly financed through debt and equity rose in financial markets in the host countries

The Business & Management Review, Volume 4 Number 4 March 2014
International Conference on Business and Economic Development (ICBED), New York-USA 149
(Borensztein et al., 1998). Thus, the availability and quality of domestic financial markets may influence FDI.
Regional Integration is a process in which states enter into an agreement in order to enhance regional cooperation and the objectives of the agreement range from economic to political to environmental.The growth in the literature on regional integration and FDI can be attributed to the strong growth in Regional Trade Agreements (RTAs) and the amount of FDI flows, especially in developing countries. Through several existing channels RTAs influences the level of foreign direct investment. These can be categorized into investment rules, trade rules and other initiatives (e.g. Blomström and Kokko, 1997; Dunning, 1997).
2.3 SADC overview The Southern African Development Community (SADC) is one of the most important
trading blocs in the southern Africa. Since its creation in 1980, several countries have been joining in and today it consists of a total of 15 member states: Angola, Botswana, the Democratic Republic of Congo, Lesotho, Madagascar, Malawi, Mauritius, Mozambique, Namibia, South Africa, Swaziland, United Republic of Tanzania, Zambia and Zimbabwe. SADC’s objective is to “achieve economic development, peace and security, and growth, alleviate poverty, enhance the standard and quality of life of the peoples of Southern Africa, and support the socially disadvantaged through Regional Integration” and its aim is the coordination of development projects in order to lessen the economic dependence.
In 2000, SADC implemented the Free Trade Agreement (FTA), which till date, 12 of the 15 SADC member states has been joining. SADC is also seeking to attract more FDI, though its share on the latter’s global flow remains minor. However, FDI’s inflow into the SADC region increased to US$ 63 billion in 2011 while it was US$ 54 billion in 2010. The best performing member of SADC in attracting FDI flows that year was Mauritius with US$ 37.746,00 million followed by Angola with US$ 1.596,00 million.
3.0 Methodology The focus of the study is to investigate the determinants of FDI in SADC. However due
to unavailability of data for Namibia and Angola, the sample size will be reduced to only twelve countries instead of fourteen, for the period 1985-2010. The study follows Wheeler and Mody (1992), Asiedu (2002, 2006), Sekkat et al. (2004), Quazi (2005) and Agrawal (2011). Based on previous empirical literature and data availability, the following functional form applies to the model: FDI= f (GDP; NR, OPN, SER, INFRASI, XRATE) Where:
FDI Foreign Direct Investment net inflows (% of GDP)
GDP Gross Domestic Product per Capita
NR Natural Resources as a % of export
OPN Trade Openness
SER Secondary School Enrolment Rate
INFRASI Telephone lines per 100 people
XRATE Exchange Rate However, because of the variance stabilizing properties of log transformation, the log values
of the variables are used. In fact, logged variables yield a more clear-cut interpretation of then coefficients in terms of percentage change.

The Business & Management Review, Volume 4 Number 4 March 2014
International Conference on Business and Economic Development (ICBED), New York-USA 150
Converting all the variables in logarithmic terms yields:
This becomes:
Data for the different variables were collected for the period 1985-2010 and their sources,
measurement and expected coefficients are illustrated in the following table. Table (1): Variable, measurement and data sources.
4.0 Analysis Panel Unit Root Test
The assumption of non-stationarity and the order of integration of the variables are tested by Augmented Dickey-Fuller (ADF) (1979), Phillips-Perron (PP) (1988), Levin Lin & Chu (LLC) (2002), Im Pesaran and Shin (2003) tests. The results show that all the variables are stationary at first difference, hence I (1). Co-Integration Test
Since all the variables are stationary at first difference, this indicates the potential presence of co-integration. The corresponding probabilities of the Trace Test and the Max-Eigen Test from the Johansen-Fisher test confirm the presence of co-integration. Thus, it may be argued that there exist stable long-run relationships among the variables. Vector Error Correction Model (VECM)
Given the presence of co-integration, the dynamics of the model are estimated using a Vector Error Correction Model (VECM), specified as follows: ∆ (Vxt) = ɸ+ρ∆ (Vxt-1) +Ωxt Where:
∆ symbolises the first difference operator
Vxt represents a vector of the 7 variables used in this study
ɸ is a vector constant term
ρ symbolises a (7x7) matrix of parameters
Vxt-1 is a vector of the 7 variables lagged by 1
Ω is the vector error term The lag order of the VECM is selected on the basis of the Schwarz Information Criterion.
Variable Measurement Data Source Expected Sign
FDI Net annual FDI as a % of GDP Unctad Positive
SIZE GDP per capita World bank indicators
Positive
OPN The ratio of trade to GDP World bank indicators
Positive
NR Natural resources as a % of exports
Computed Positive
SER Secondary Enrolment ratio World Bank indicators
Positive
TEL Telephone lines per 100 people World Bank indicators
Positive
XRATE Exchange rate as a % of GDP Penn World Data
The Business & Management Review, Volume 4 Number 4 March 2014
International Conference on Business and Economic Development (ICBED), New York-USA 151
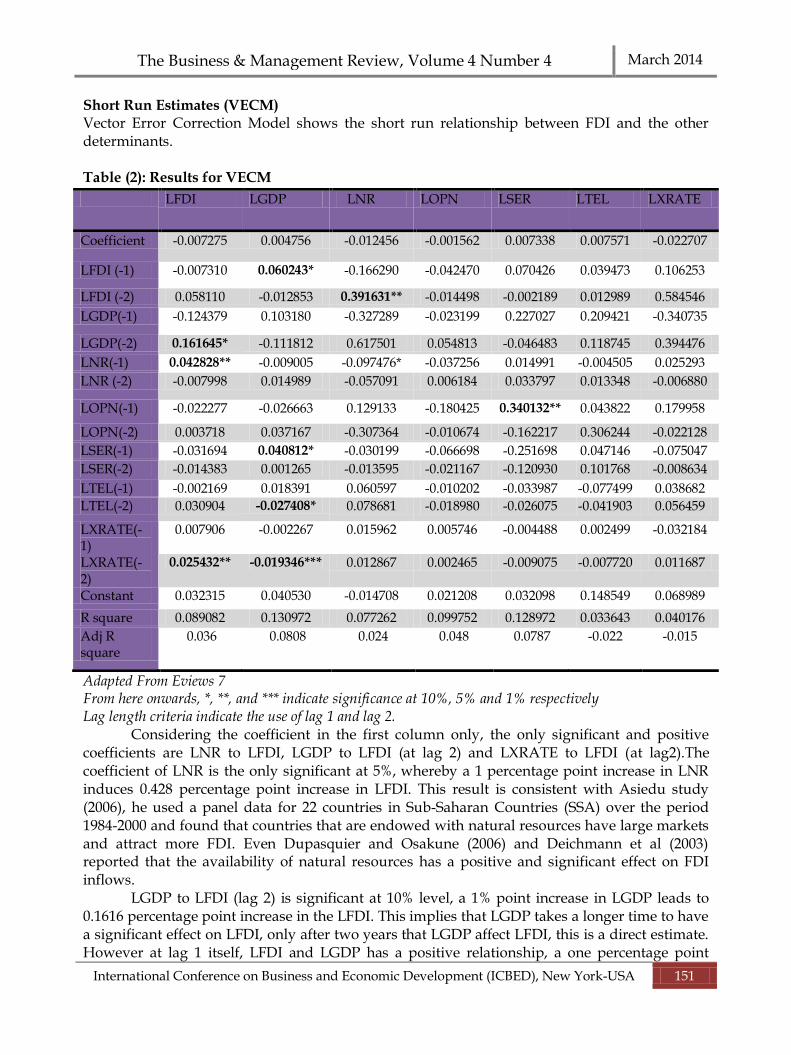
Short Run Estimates (VECM) Vector Error Correction Model shows the short run relationship between FDI and the other determinants. Table (2): Results for VECM
Adapted From Eviews 7 From here onwards, *, **, and *** indicate significance at 10%, 5% and 1% respectively Lag length criteria indicate the use of lag 1 and lag 2.
Considering the coefficient in the first column only, the only significant and positive coefficients are LNR to LFDI, LGDP to LFDI (at lag 2) and LXRATE to LFDI (at lag2).The coefficient of LNR is the only significant at 5%, whereby a 1 percentage point increase in LNR induces 0.428 percentage point increase in LFDI. This result is consistent with Asiedu study (2006), he used a panel data for 22 countries in Sub-Saharan Countries (SSA) over the period 1984-2000 and found that countries that are endowed with natural resources have large markets and attract more FDI. Even Dupasquier and Osakune (2006) and Deichmann et al (2003) reported that the availability of natural resources has a positive and significant effect on FDI inflows.
LGDP to LFDI (lag 2) is significant at 10% level, a 1% point increase in LGDP leads to 0.1616 percentage point increase in the LFDI. This implies that LGDP takes a longer time to have a significant effect on LFDI, only after two years that LGDP affect LFDI, this is a direct estimate. However at lag 1 itself, LFDI and LGDP has a positive relationship, a one percentage point
LFDI LGDP LNR LOPN LSER LTEL LXRATE
Coefficient -0.007275 0.004756 -0.012456 -0.001562 0.007338 0.007571 -0.022707
LFDI (-1) -0.007310 0.060243* -0.166290 -0.042470 0.070426 0.039473 0.106253
LFDI (-2) 0.058110 -0.012853 0.391631** -0.014498 -0.002189 0.012989 0.584546
LGDP(-1) -0.124379 0.103180 -0.327289 -0.023199 0.227027 0.209421 -0.340735
LGDP(-2) 0.161645* -0.111812 0.617501 0.054813 -0.046483 0.118745 0.394476
LNR(-1) 0.042828** -0.009005 -0.097476* -0.037256 0.014991 -0.004505 0.025293
LNR (-2) -0.007998 0.014989 -0.057091 0.006184 0.033797 0.013348 -0.006880
LOPN(-1) -0.022277 -0.026663 0.129133 -0.180425 0.340132** 0.043822 0.179958
LOPN(-2) 0.003718 0.037167 -0.307364 -0.010674 -0.162217 0.306244 -0.022128
LSER(-1) -0.031694 0.040812* -0.030199 -0.066698 -0.251698 0.047146 -0.075047
LSER(-2) -0.014383 0.001265 -0.013595 -0.021167 -0.120930 0.101768 -0.008634
LTEL(-1) -0.002169 0.018391 0.060597 -0.010202 -0.033987 -0.077499 0.038682
LTEL(-2) 0.030904 -0.027408* 0.078681 -0.018980 -0.026075 -0.041903 0.056459
LXRATE(-1)
0.007906 -0.002267
0.015962 0.005746 -0.004488 0.002499 -0.032184
LXRATE(-2)
0.025432** -0.019346*** 0.012867 0.002465 -0.009075 -0.007720 0.011687
Constant 0.032315 0.040530 -0.014708 0.021208 0.032098 0.148549 0.068989
R square 0.089082 0.130972 0.077262 0.099752 0.128972 0.033643 0.040176
Adj R square
0.036 0.0808 0.024 0.048 0.0787 -0.022 -0.015
The Business & Management Review, Volume 4 Number 4 March 2014
International Conference on Business and Economic Development (ICBED), New York-USA 152
increase in LFDI leads to a 0.06 percentage point increase in the level of LGDP. This implies that an increase in FDI in the short run boost up the level of GDP. This corroborates with the study of Dees (1998) who found that FDI has been significant in explaining China’s economic growth, while De Mello (1997) found a positive correlation for selected Latin American countries (Lim 2001:9),an increase in FDI leads to a definite increase in the level of LGDP.
Another variable being significant at 5% level is LXRATE to LFDI a 1 percentage point increase in the LXRATE prompts 0.02 percentage point increase in LFDI. According to Ed-wards (1990), OECD FDI flows into the less developed countries and indicated a significantly positive effect of appreciation of the domestic currency. Blonigen (1997) makes a “firm-specific asset” argument to show that exchange rate depreciation in host countries tend to increase FDI inflows. But alternatively, a stronger real exchange rate might be anticipated to reinforce the incentive of foreign companies to produce domestically: the exchange rate is in a sense a barrier to entry in the market that could lead to more horizontal FDI.
Usually a higher level of education, leads to an increase in the level of production, implying a better workforce will be able to adapt to changes in technology and easily leading to a higher productivity. From the table, a 1 percentage point increase in LSER induces 0.04% percentage point increase in LGDP.LSER and LGDP is significant at 10% level. This result corroborates with Mahmood and Ehsanullah (2011) results; they assessed the impact of macroeconomic variables on FDI in Pakistan. A time series analysis based on annual data from 1972- 2005was done and their findings point out that population growth, democracy and enrolment at secondary school has positive impact on foreign direct investment.
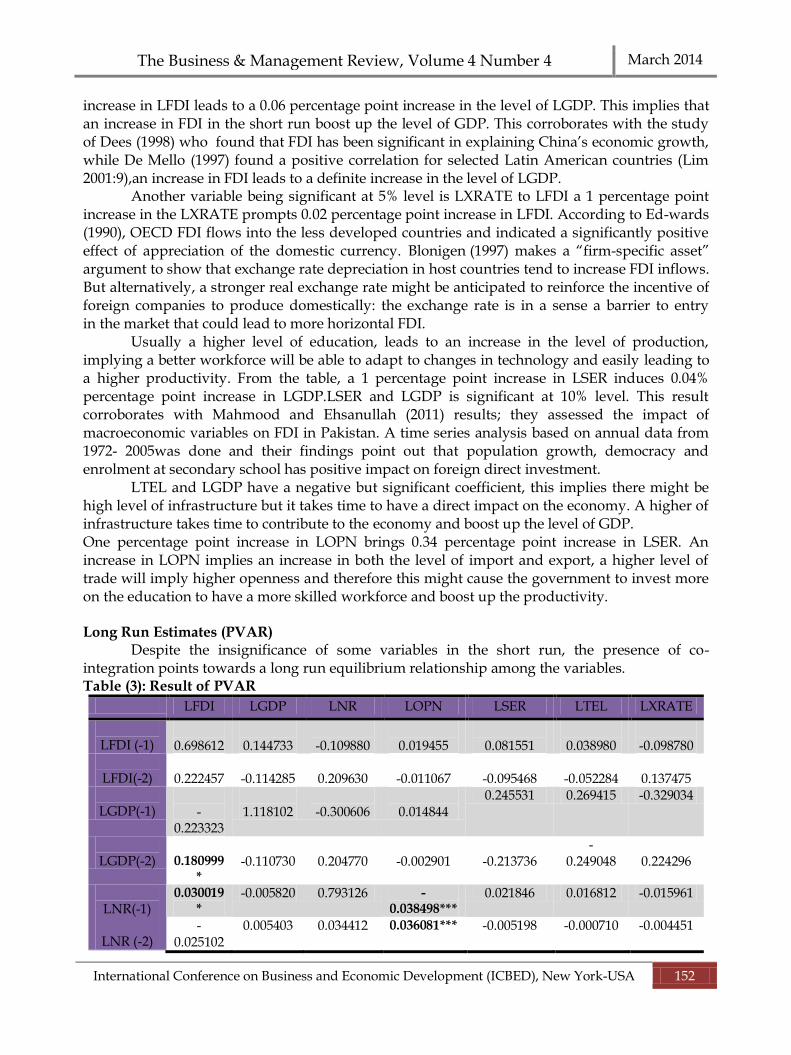
LTEL and LGDP have a negative but significant coefficient, this implies there might be high level of infrastructure but it takes time to have a direct impact on the economy. A higher of infrastructure takes time to contribute to the economy and boost up the level of GDP. One percentage point increase in LOPN brings 0.34 percentage point increase in LSER. An increase in LOPN implies an increase in both the level of import and export, a higher level of trade will imply higher openness and therefore this might cause the government to invest more on the education to have a more skilled workforce and boost up the productivity. Long Run Estimates (PVAR)
Despite the insignificance of some variables in the short run, the presence of co-integration points towards a long run equilibrium relationship among the variables. Table (3): Result of PVAR
LFDI LGDP LNR LOPN LSER LTEL LXRATE
LFDI (-1)
0.698612
0.144733
-0.109880
0.019455
0.081551
0.038980
-0.098780
LFDI(-2)
0.222457
-0.114285
0.209630
-0.011067
-0.095468
-0.052284
0.137475
LGDP(-1) -
0.223323
1.118102
-0.300606
0.014844
0.245531 0.269415 -0.329034
LGDP(-2)
0.180999
*
-0.110730
0.204770
-0.002901
-0.213736
- 0.249048
0.224296
LNR(-1)
0.030019*
-0.005820 0.793126 -0.038498***
0.021846 0.016812 -0.015961
LNR (-2)
-0.025102
0.005403 0.034412 0.036081*** -0.005198 -0.000710 -0.004451
The Business & Management Review, Volume 4 Number 4 March 2014
International Conference on Business and Economic Development (ICBED), New York-USA 153
LOPN(-1)
0.056736 -0.023088 0.263472 0.755905 0.408604*** 0.053292 0.100122
LOPN(-2)
-0.045515
0.039883 -0.441219* 0.173217 -0.341566** 0.093404 -0.182083
LSER(-1)
-0.016070
0.037716* 0.045873 -0.049755** 0.658032 0.057817 -0.064877
LSER(-2)
0.056051*
0.040653* 0.077615 0.044889* 0.161720 -0.013901 0.012600
LTEL(-1)
-0.012241
0.023176 0.069438 -0.009144 -0.007782 0.894526 0.047635
LTEL(-2)
0.037438 -0.024667 -0.044301 -0.003151 0.044123 0.056391 -0.038099
LXRATE(-
1)
0.000836 0.005603 -0.004204 0.002723 0.000469 0.021416 0.905388
LXRATE(-
2)
-0.004880
0.001540 -1.50E-05 -0.005199 -0.007564 0.007078 0.002264
Constant 0.278564 -0.179284 0.980053 0.299600 0.006951 -0.657209 1.493272
R-squared 0.953829 0.986876 0.793212 0.901531 0.793859 0.926484 0.844264
Adj. R-squared
0.951461
0.986202 0.782608 0.896482 0.783288 0.922714 0.836277
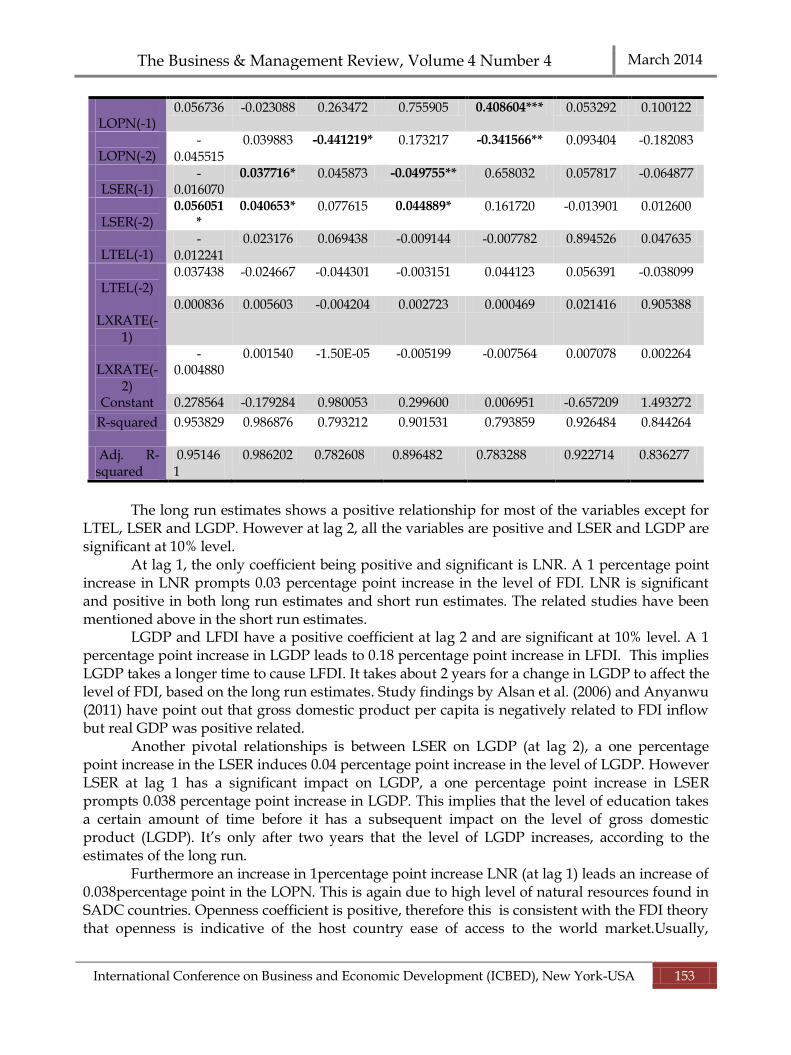
The long run estimates shows a positive relationship for most of the variables except for
LTEL, LSER and LGDP. However at lag 2, all the variables are positive and LSER and LGDP are significant at 10% level.
At lag 1, the only coefficient being positive and significant is LNR. A 1 percentage point increase in LNR prompts 0.03 percentage point increase in the level of FDI. LNR is significant and positive in both long run estimates and short run estimates. The related studies have been mentioned above in the short run estimates.
LGDP and LFDI have a positive coefficient at lag 2 and are significant at 10% level. A 1 percentage point increase in LGDP leads to 0.18 percentage point increase in LFDI. This implies LGDP takes a longer time to cause LFDI. It takes about 2 years for a change in LGDP to affect the level of FDI, based on the long run estimates. Study findings by Alsan et al. (2006) and Anyanwu (2011) have point out that gross domestic product per capita is negatively related to FDI inflow but real GDP was positive related.
Another pivotal relationships is between LSER on LGDP (at lag 2), a one percentage point increase in the LSER induces 0.04 percentage point increase in the level of LGDP. However LSER at lag 1 has a significant impact on LGDP, a one percentage point increase in LSER prompts 0.038 percentage point increase in LGDP. This implies that the level of education takes a certain amount of time before it has a subsequent impact on the level of gross domestic product (LGDP). It’s only after two years that the level of LGDP increases, according to the estimates of the long run.
Furthermore an increase in 1percentage point increase LNR (at lag 1) leads an increase of 0.038percentage point in the LOPN. This is again due to high level of natural resources found in SADC countries. Openness coefficient is positive, therefore this is consistent with the FDI theory that openness is indicative of the host country ease of access to the world market.Usually,
The Business & Management Review, Volume 4 Number 4 March 2014
International Conference on Business and Economic Development (ICBED), New York-USA 154
economies in which trade is important has relatively higher level of FDI and the implementation of more liberal economic policies certainly attract more foreign investments.
Short Run and Long Run Causality The Granger causality test is conventionally shown by estimating vector autoregressive
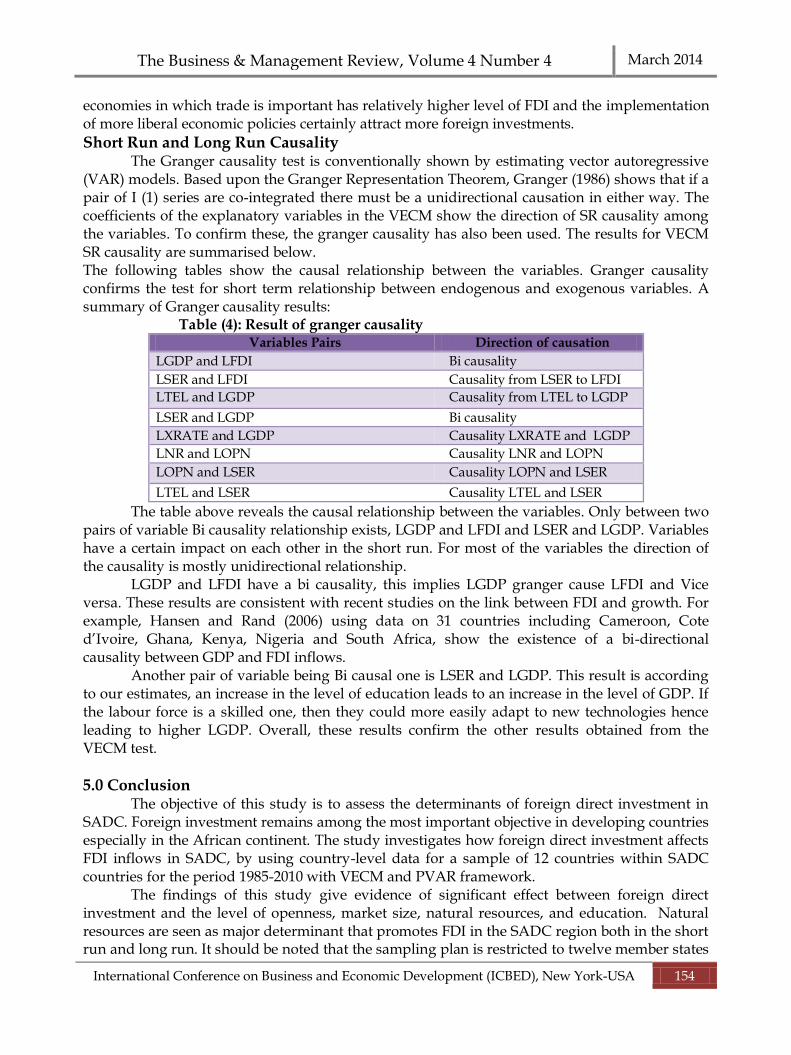
(VAR) models. Based upon the Granger Representation Theorem, Granger (1986) shows that if a pair of I (1) series are co-integrated there must be a unidirectional causation in either way. The coefficients of the explanatory variables in the VECM show the direction of SR causality among the variables. To confirm these, the granger causality has also been used. The results for VECM SR causality are summarised below. The following tables show the causal relationship between the variables. Granger causality confirms the test for short term relationship between endogenous and exogenous variables. A summary of Granger causality results:
Table (4): Result of granger causality Variables Pairs Direction of causation
LGDP and LFDI Bi causality
LSER and LFDI Causality from LSER to LFDI
LTEL and LGDP Causality from LTEL to LGDP
LSER and LGDP Bi causality
LXRATE and LGDP Causality LXRATE and LGDP
LNR and LOPN Causality LNR and LOPN
LOPN and LSER Causality LOPN and LSER
LTEL and LSER Causality LTEL and LSER
The table above reveals the causal relationship between the variables. Only between two pairs of variable Bi causality relationship exists, LGDP and LFDI and LSER and LGDP. Variables have a certain impact on each other in the short run. For most of the variables the direction of the causality is mostly unidirectional relationship.
LGDP and LFDI have a bi causality, this implies LGDP granger cause LFDI and Vice versa. These results are consistent with recent studies on the link between FDI and growth. For example, Hansen and Rand (2006) using data on 31 countries including Cameroon, Cote d’Ivoire, Ghana, Kenya, Nigeria and South Africa, show the existence of a bi-directional causality between GDP and FDI inflows.
Another pair of variable being Bi causal one is LSER and LGDP. This result is according to our estimates, an increase in the level of education leads to an increase in the level of GDP. If the labour force is a skilled one, then they could more easily adapt to new technologies hence leading to higher LGDP. Overall, these results confirm the other results obtained from the VECM test.
5.0 Conclusion The objective of this study is to assess the determinants of foreign direct investment in
SADC. Foreign investment remains among the most important objective in developing countries especially in the African continent. The study investigates how foreign direct investment affects FDI inflows in SADC, by using country-level data for a sample of 12 countries within SADC countries for the period 1985-2010 with VECM and PVAR framework.
The findings of this study give evidence of significant effect between foreign direct investment and the level of openness, market size, natural resources, and education. Natural resources are seen as major determinant that promotes FDI in the SADC region both in the short run and long run. It should be noted that the sampling plan is restricted to twelve member states

The Business & Management Review, Volume 4 Number 4 March 2014
International Conference on Business and Economic Development (ICBED), New York-USA 155
of SADC and differences the sample is likely to play a key role in explaining why empirical analyses provide contrasting estimates of the sign of the impact of the determinants on foreign direct investment.
Another deterministic variable was education, measured by secondary school enrolment rate, which was found to affect the level of foreign direct investment for SADC mostly in the long run. A positive and skilled human capital was found to attract higher level of foreign direct investment. The market size also determines the level of foreign direct investment, but in this study, though market size was found positive it mostly depended on the amount of time that foreign direct investment took to have a positive effect on gross domestic product.
The advantages of receiving FDI is not only increasing foreign currency inflows and employment, but it also helps a developing country to rapidly emerge from a low level to more admirable standards. Countries have realized that increasing in FDI inflows will bring in many benefits to a host country. The analysis part of this thesis is mostly focused on what determines the level of FDI inflows to SADC countries by investigating factors believed to influence the level of inward FDI. By looking at the effect of the determinants on FDI for the 12 selected countries, the results imply that all 4 factors play an important role in attracting FDI inflows and 2 of them is does not determine the actual level of FDI. The long-term effects of these determinants on attracting FDI inflows are hard to predict, since the level of FDI inflows in the 12 countries fluctuate over time.
Firstly the proxy for market size (GDP) and openness appear to have the same signs as the expectation and the previous researches. These results emphasize higher the level of GDP, openness, education and natural resources the higher the amount of FDI inflows in the next period. An interesting result is pointed out in the analysis where there is a negative relationship between the level of infrastructure and the level of FDI inflows in the short run. This result contradicts what previous researches on FDI declare. A negative sign between infrastructure and FDI inflows can be excused by data unavailability and the data used to estimate are not enough to reflect the effect of infrastructure on attracting FDI inflows. But in SADC case, the spread of the level of FDI increases as infrastructure increases.
As discussed previously, countries try to attract FDI by providing several benefits. However, researcher has found out that such policies are not effective ways to reap FDI’s growth. For developing countries to enjoy the optimal benefits of FDI and thereby achieving economic development, there are other important factors that should be considered, as follows:
Political and macroeconomic stability to create the right environment for investment.
Necessary reforms of economic policies.
Better Education and training to worker which help to increase the level of productivity.
Repatriations of profits.
Need to be properly addressed if developing countries want to persuade foreign investors to invest their capital. By so doing, the small economies are more likely to benefit from FDI. Over and above it is important to pursue a policy which allow the state to formulate appropriate policies to manage capital flows effectively.
Prevent the abuse of monopoly power from Multinationals.
Take into account all the problems faced by developing countries through a community.
The quality and regularity of information on African investments will be Important, portfolio investors are likely to be demanding in terms of their assessment of risks.
These policies might further help developing economies to achieve their goals.
The Business & Management Review, Volume 4 Number 4 March 2014
International Conference on Business and Economic Development (ICBED), New York-USA 156
Refrences Asiedu, E. (2002), "On the Determinants of Foreign Direct Investment to Developing Countries:
Is Africa Different?" World Development, 30(1), pp. 107-119.
Bénassy-Quéré, A.; Coupet, M.; Mayer, T. (2007) “Institutional determinants of foreign direct investment”, World Economy, 30 (5), 764-782
Blomstrom, Magnus & Kokko, Ari (1998) " Multinational Corporations and Spillovers," Journal of Economic Surveys, Wiley Blackwell, vol. 12(3), pages 247-77, July.
Brooks, D.H.; Hasan, R.; Lee, J.-W.; Son, H.H.; Zhuang, J. (2010) “Closing development gaps: challenges and policy options”, ADB Economics Working Paper Series 209, Manila: Asian Development Bank.
Cassou, S. P. (1997), "The Link Between Tax Rates and Foreign Direct Investment." Applied Economics, 29, pp. 1295-1301.
Caves, R. (1971), “International corporations: the industrial economics of foreign investment”, Economica, 38 (149)
Chakrabarti A. (2001) “The Determinants of Foreign Direct Investment: Sensitivity” http://www.erf.org.eg/CMS/uploads/pdf/1184754629_Steve_Onyeiwu.pdf
Christopher R. and Abdoul G. Sam(2000) “Impact of Pension Privatization on Foreign Direct Investments: a Study of the Latin American Experiment”,
http://ageconsearch.umn.edu/bitstream/61206/2/reece_sam_draft.pdf Culem C. G. 1988. “The Vocational Determinants of Direct Investments Among Industrialized
Countries.” European Economic Review Vol.32: 885-904 De Mello, Luiz R, Jr, 1999. "Foreign Direct Investment-Led Growth: Evidence from Time Series
and Panel Data," Oxford Economic Papers, Oxford University Press, vol. 51(1) Determinants of Foreign Direct Investment in Africa Journal of Developing Societies June
200420: 89-106, Dickey DA, Fuller W A. (1979) “Distributions of the Estimators For Autoregressive Time Series
with a Unit Root” Journal of the American Statistical Association 75, 427-831 Dunning J.H. 1981. International Production and the Multinational Enterprise. London: George Allen
& Unwin. Edwards S. 1990. “Capital Flows, Foreign Direct Investment, and Debt-Equity Swaps in
Developing Countries.” Working Paper Series. Cambridge, MA: National Bureau of Economic Research.
Evans Nyarko ( 2008 )Some Panel Evidence from the Transition Economies.Abosi Publication. Foreign Pedroni, P. (1997). `Panel Cointegration: Asymptotic and Finite Sample Properties of
Pooled Time Series Tests with an Application to the PPP Hypothesis: New Results', Indi University Working Paper in Economics.
Goldsbrough, D. G. (1979), "The Role of Foreign Direct Investment in the External Adjustment Process." (Staff Papers 26), pp. 725-754.
Grubert, H., Mutti, J. (1991), "Taxes, Tariffs and Transfer Pricing in Multinational Corporate Decision Making." Review of Economic Studies, 73, pp. 285-293.
Hartman, D. G. (1994), "Tax Policy and Foreign Direct Investment in the United States." National Tax Journal, 37 (4), pp. 475-488.
Hausmann, Ricardo and Fernandez-Arias, Eduardo (March 26, 2000) Foreign Direct Investment: Good Cholesterol? IADB, Research Department Working Paper No. 417.
Hines, J. R., Rice, E. M. (1994), "Fiscal Paradise: Foreign Tax Havens and American Business." The Quarterly Journal of Economics, 109, pp. 149-182.
http://www.econ.ucdavis.edu/faculty/knruss/Hymer_JEBO2.pdf

The Business & Management Review, Volume 4 Number 4 March 2014
International Conference on Business and Economic Development (ICBED), New York-USA 157
Hymer, D. (1711-1776). Essays,literary, moral, and political. London,Ward, Lock and Tyler. Hymer, S. H. (1976). The international operations of national firms: a study of direct foreign investment.
Cambridge, Mass.,MIT Press. IMF (1993). Balance of payments manual. Washington, D. C.: IMF, International Monetary Fund. Jackson, S., Markowski, S. (1995), "The Attractiveness of Countries to Foreign Direct
Investment." Journal of World Trade, 29, pp. 159-180. Johansen, S. (1988) “Statistical Analysis of Cointegration Vectors,” Journal of Economic Dynamics
and Control, Vol. 12, No. 2–3, pp. 231– 254.http://www.imf.org/external/pubs/ft/wp/2007/wp07141 Kalecki (1937), Shneider and Frey (1985) Tsai (1994), Aiseidu (2002). Determinants of investment
is based on the neoclassical theory of optimal capital accumulation pioneered by Jorgenson (1963, 1971)
Karl Sauvant P,Wolfgang A,Maschek and Geraldine McAllister (1933) Foreign Direct Investment by Emerging Market Multinational Enterprises,The Impact Of The Financial Crisis And Recession And Challenges Ahead.
Kogut, B. (1993) “Foreign Direct Investment as A Sequential Process 2Buckley, The Internationalization of the Firm; A Reader, Academic Press.
L. Artige and R. Nicolini (Novembre 2006) Evidence on the Determinants of Foreign Direct Investment. The Case of Three European Regions CREPP HEC-Management School University of Liège CREPP Working Paper 2006/07
Lim, D. (1983), "Fiscal Incentive and Direct Foreign Investment in Less Developed Countries." The Journal of Development Studies, 19, pp. 207- 212
Lindy Helfman ,Alex Lenkoski (2011) Bayesian Model Averaging In The Presence Of Selection Bias Theo Eicher University of Washington Heidelberg University, Version 2.0
Loree, D., Guisinger, S. E. (1995), "Policy and Non-Policy Determinants of U.S. Equity Foreign Direct Investments.
Maria Carkovic and Ross Levine (May 2002.Does Foreign Direct Investment Accelerate Economic Growth? University of Minnesota
Nauro .F, Campos and Yuko, Kinoshita W. D. Working Paper Number 438 (January 2002).Foreign Direct Investment as Technology Investment." Journal of International Business Studies, 26, pp. 281-300
Nauro F. Campos and Yuko, Kinoshita ,William Davidson (January 2002) Foreign Direct Investment as Technology Transferred: Some Panel Evidence from the Transition Economies By: Working Paper Number 438
Nigh, D. (1985), "The Effect of Political Events on United States Direct Foreign Investment: A Pooled Time-Series Cross-Sectional Analysis." Journal of International Business Studies, 16, pp. 3-17.
Nunnenkamp, Peter (2002) : Determinants of FDI in developing countries has globalization changed the rules of the game?, Kieler Arbeitspapiere, No.1122, http:// hdl.handle.net/10419/2797
Perron, P. and Ng, S. (1996). `Useful Modifications to some Unit Root Tests with Dependent Errors and their Local Asymptotic Properties', Review of Economic Studies, 63, 435-465.
Phillips, P. C. B. and Moon, H. (1999). `Linear Regression Limit Theory for Non-stationary Panel Data', Econometrica, 67, 1057±1111
Porcano, T. M., Price, C. E. (1996), "The Effects of Government Tax and Non-Tax Incentives on Foreign Direct Investment." Multinational Business Review, 4, pp. 9-20.

The Business & Management Review, Volume 4 Number 4 March 2014
International Conference on Business and Economic Development (ICBED), New York-USA 158
Protsenko, A. (2004). Vertical and horizontal Foreign Direct Investments in transition countries,
Ludwig-Maximilians-Universität München. Root FR, Ahmed A. (1979) “Empirical Determinants of Manufacturing Direct Foreign
Investment in Developing Countries” Economic Development and Cultural Change 27, 751-767.
Root FR, Ahmed A. (1979) “Empirical Determinants of Manufacturing Direct Foreign Investment in Developing Countries” Economic Development and Cultural Change 27, 751-767.
Schneider F, and B.F. Frey. 1985. “Economic and Political Determinants of Foreign Direct Investment.” World Development Vol. 13 (2): 161-175.
Seetanah and Rojid (2007), “The determinants of FDI in Mauritius: A dynamic time series investigation”, ongoing paper.
Seyed Mohammad Alavinasab (1988) Determinants of Foreign Direct Investment in Iran Ph.D. Faculty of Management, University of Tehran, Qom College, Iran
Shrestha H. and S. Onyeiwu. (2003). “Structural Adjustment, Foreign Direct Investment and Economic Development in the Arab World.” Unpublished Manuscript.
Southern Africa Development Community Regional Economic Performance in 2011 and Medium-term Prospects.
Swenson, D. L. (1994), "The Impact of U. S. Tax Reform on Foreign Direct Investment in the United States." Journal of Public Economics, 54, pp. 243-266.
Tsai P. (1994) “Determinants of Foreign Direct Investment and Its Impact on Economic Growth” Journal of Economic Development 19, 137-163
Wei S. (2000) “How Taxing is Corruption on International Investors?” Review of Economics and Statistics 82 (1): 1-11.
Wheeler D, Mody A. (1992) “International Investment Location Decisions: The case of U.S. firms”, Journal of International Economics 33, 57-7.
Yulin, N., Reed, M. R. (1995), "Vocational Determinants of U. S. Direct Foreign Investment in Food and Kindered Products." Agrobusiness, 11, pp.77- 86.