Embed Size (px)
Citation preview

DETERIORATION OF TIMBER PILE
FOUNDATIONS IN ROTTERDAM
Eric Schreurs
Faculty of Civil Engineering and Geosciences
Delft University of Technology
2017


DETERIORATION OF TIMBER PILE
FOUNDATIONS IN ROTTERDAM
Eric Schreurs
A Thesis Submitted in Partial Fulfilment
of the Requirements for
the Degree of Master of Science in Civil Engineering
Faculty of Civil Engineering and Geosciences
Delft University of Technology
January 2017


Graduation committee:
Prof.dr.ir. J.W.G. van de Kuilen
Chairman graduation committee ‐ Timber Structures and Wood Technology
(+31) (0)15 2782322
Drs. W.F. Gard
Supervisor from Delft University of Technology ‐ Timber Structures and Wood Technology
(+31) (0)15 2789435
Dr.ir. G.J.P. Ravenshorst
Supervisor from Delft University of Technology ‐ Timber Structures and Wood Technology
(+31) (0)15 2785721
Dr.ir. C.B.M. Blom
Supervisor from Delft University of Technology ‐ Concrete Structures
Supervisor from Gemeente Rotterdam
(+31) (0)15 2784324
Master Thesis Student:
E.C.W. Schreurs
Study number: 4232275
(+31)(0)652664865


PREFACE The work in front of you has been the result of a yearlong study into the residual strength of
timber pile foundations. It has been written to fulfil the study track Structural Engineering
which is part of the master Civil Engineering. The subject came to mind after a conversation
with Kees Blom of the municipality of Rotterdam.
Timber pile foundations are a large cause for problems and because of the lack of knowledge
into the phenomenon there are high uncertainties for home owners. Playing a role to reduce
this uncertainty intrigued me and this thesis was born.
This thesis couldn’t be completed without the help of certain people. At first I would like to
thank my graduation committee. Wolfgang Gard and Geert Ravenhorst because of their day to
day guidance during this project and their readiness to make time when I needed advise. Kees
Blom who gave me the opportunity to complete my thesis at the municipality of Rotterdam and
last Jan Willem van de Kuilen for his knowledge and readiness to be the chairman of the
graduation committee.
I would like to thank the company Brefu for providing me with 100 year old timber piles to do
the experiments on and providing me with background information about these piles.
I am grateful to my friends for providing me with distraction during the last year and at last I
owe a big thanks to my family for supporting me during my total study and giving me every
opportunity to reach my goals.
Eric Schreurs
Delft, January 2017


ABSTRACT
The west part of the Netherlands is built in a river delta area. The ground in this area consist
of sediment which is deposited by the rivers over the years. This soft soil is not stable enough
to support simple foundations for structures, so for centuries people have used timber
foundation piles to support structures on the stronger sand layers below the weak soil.
However these piles start to degrade when they are no longer fully submerged resulting in high
cost for home owners and uncertainties about the structural safety of buildings.
Goal of this thesis is to find a prediction method to be able to predict the remaining strength of timber foundation piles. This is done by answering the main research question: “What is the state of the timber foundations regarding the residual strength in the dedicated foundation risk areas of Rotterdam, can there be made more accurate estimates using certain parameters and measurement methods?” In Rotterdam it is very specific which foundations are heavily degraded and failing in their function of carrying the above structures. Timber piles which are just meters apart can have different levels of degradations. For this reason the foundation risk areas as defined by the municipality of Rotterdam can only be used as a map were timber foundations occur. The risks as defined in this map are not accurate. It is just an indexation of were troubles with timber foundations have occurred and how many of the total timber foundations in these areas have failed. A better method is to constantly monitor the sag of the structures. This is possible nowadays and is already done by Rotterdam with the help of satellites. If the sag of the foundations becomes unacceptable, for instance to the extent of structural damage, the municipality has to intervene. At this point a foundation inspection has to be done which can be done with the F3O standardised method. In this thesis this method is updated with a different procedure to determine the remaining timber strength of the foundation piles. To update the standardised method of F3O at first the theoretical background of the subject is set. The different parameters contributing to the failure are investigated for the different parts of a pile foundation. The parts which are investigated are the upper structure, the kesp, the pile head, pile shaft and pile tip. After this background research actual experiments on timber piles are done. For this thesis tests were done on 7 timber pile heads which have been in use since 1902. Goal was to find a method to determine the residual strength of the pile head. Visual inspection, probing, CT-Scanning and IML-Resi measurements have been done to determine the most reliable procedure for estimating remaining strength. It is found that a combination of methods leads to the best prediction of the strength. All methods have their own pros and cons and by combining them the most efficient procedure can be determined.

The IML-Resi measurements can detect the degradation pattern as it occurs in timber piles in an accurate way. However basic inspections like probing and visual inspection have to be used to determine the location of the IML-Resi measurements.
Nowadays the Pilodyn is used to determine the degradation of in use piles. This method only provides information of the outer layer of the timber pile. With the use of the IML-Resi the total cross section of the timber pile is tested. Which leads to detailed information into the total pile degradation pattern. Making it possible to determine whether or not the pile follows a uniform or non-uniform degradation pattern, which is not possible with a Pilodyn test.
The resistance the IML-Resi measures when penetrating the timber can be related well to the remaining strength of the timber piles. Making the use of adjusted safety factors when dealing with timber piles foundation unnecessary. The tested piles showed timber properties which are comparable with new timber.
This all making it possible to accurately determine the extent of degradation and the remaining strength of a timber pile at any specific moment.

TABLE OF CONTENTS PREFACE 7
ABSTRACT 9
TABLE OF CONTENTS 11
RESEARCH SET UP 1
1.1 INTRODUCTION 2
1.2 PROBLEM DESCRIPTION 4
THEORY 7
2.1 FOUNDATIONS METHODS 8
2.2 DEFINITION OF SETTLEMENTS 10
2.3 FAILURE OF THE UPPER STRUCTURE 11
2.4 MEASURING DAMAGE 13
2.5 GROUNDWATER 16
2.6 CONNECTING FOUNDATION PARTS 17
2.7 TIMBER PILE PROPERTIES 19
2.8 MODELS TO DESCRIBE REMAINING STRENGTH 25
2.9 GEOTECHNICAL CAPACITY TIMBER PILES 30
2.10 FAILURE MECHANISMS 32
LABORATORY TESTING 34
3.1 DEFINITION OF DEGRADATION 35
3.2 METHOD FOR EXPERIMENTS 35
3.3 RESULTS 37

ANALYSIS 38
4.1 VISUAL INSPECTION AND PROBING 39
4.2 IML-RESI TESTING 41
4.3 CT SCAN ANALYSIS 43
4.4 VERIFICATION RESULTS IML-RESI WITH CT SCAN 47
4.5 SIZE EFFECT IN COMPRESSION TESTS 51
4.6 COMPRESSION TESTS 53
4.7 MODELLING REMAINING STRENGTH 58
4.8 SERVICE LIFE PREDICTION 61
CONCLUSION 62
5.1 CASE STUDY SPOORSINGEL 63
5.2 CONCLUSION 68
LITERATURE 71
LIST OF FIGURES 74
APPENDICES 76
I BACKGROUND INFORMATION ABOUT TESTING SAMPLES 77
II CONE PENETRATION TEST 80
III CURRENT METHOD FOUNDATION ASSESSMENT 81
IV ACCEPTANCE OF DAMAGE 82
V SCIENTIFIC RESEARCH INTO DAMAGE LIMITS 84
VI ASSESSMENT FULL PILE SECTIONS 92
VII VISUAL INSPECTION AND PROBING 113
IX LOCATION TEST SAMPLES IN PILE 145
X COMPRESSION TESTS DATA 149
XI RESIDUAL CROSS SECTION RESISTANCE 156

CHAPTER ONE
RESEARCH SET UP

Delft University of Technology
2 Master of Science thesis E.C.W. Schreurs
1.1 INTRODUCTION
The west part of the Netherlands is built in a river delta area. The ground in this area consist
of sediment which is deposited by the rivers over the years. This soft soil is not stable enough
to support simple foundations for structures, so for centuries people have used timber
foundation piles to support structures on the stronger sand layers below the weak soil.
Until the second world war pile foundations were the most common foundation method, it is
estimated that 25 million timber piles are still in use nowadays. Over the last decades it has
become clear that these timber pile foundations start to fail due to large settlements.
In the nineties large foundation problems occurred in Dordrecht resulting in cracks in masonry
walls and large settlements differences in structures (Buma, Stuurman, Etten, & Jong, 2006).
Occasionally even the collapse of structures took place. For a lot of cities and home owners this
has been an eye opener into foundation issues. With this renewed interest into foundation
failure several researches have been done. Estimates about the financial magnitude of the
problem range from 1 to 40 billion Euros(Bolsma, Buma, Meerten, Dionisio, & Elbers, 2012).
These numbers are huge and regardless who is responsible cheaper solutions are much
welcomed.
Besides the financial risk there is also a safety issue. Houses need to be safe and reliable places
to life in and deteriorating foundations lead to high uncertainties regarding this function.
For the city of Rotterdam it is expected that now or in the near future problems with wooden
pile foundation will occur. Due to these problems a map is made which indicates in which areas
failure of timber piles can be expected (figure 1.2). However knowledge is lost about the
parameters which were used to predict pile failure. Neither is it certain which failure
mechanism are taken into account. These can be geological or biological, for instance negative
skin friction or degradation by fungi, bacteria and insects can all play a role in foundation
failure.
Figure 1.1 Examples of foundation failure

Delft University of Technology
3 Master of Science thesis E.C.W. Schreurs
Figure 1.1 Expected risks with timber pile foundations in Rotterdam
The definition of the risk which the pile deterioration imposes is also unclear. Which risks are
acceptable and which are not? These are important questions which need to be evaluated,
before conclusions on whether or not measures have to be taken can be drawn.
Because of all the timber pile foundation problems nowadays new buildings are often built with
different foundation types. It is easily forgotten that a lot of pile foundation still meet modern
day requirements and the responsible use of timber can be a wise decision, because it is relative
cheap, CO2 fixating and renewable.

Delft University of Technology
4 Master of Science thesis E.C.W. Schreurs
1.2 PROBLEM DESCRIPTION
To do research into timber pile foundation problems for the city of Rotterdam it is important to clarify what the risks are and how they can be defined. Also a quantification of the risks has to be given, what risks are acceptable and for how long do they remain acceptable. The risk has to be measurable to be able to set rules when to take certain actions. When is a foundation not fulfilling its requirements and what are the main mechanisms which contribute to this failing.
The different pile degrading mechanisms need to be analysed and detailed inspections into specific foundations in Rotterdam need to be done. These inspection have to make clear which mechanisms are influencing the problem and what the scope of the actual problem is. Based on these inspections the degree of degradation, the rate of degradation and the expected degradation can be derived and the geotechnical parameters can be quantified.
With these found parameters it is possible to give predictions on the remaining service life. If these predictions are insufficient suggestions can be made on how to improve service life. This advice can be given based on previously used renovation techniques or techniques which have been used in other fields.
Goals
The main goal of this master thesis is to predict the remaining service life of timber pile
foundations. Which failure mechanisms can occur and specifically the influence of the timber
parameters regarding the remaining service life.
This is a very big objective for just one master thesis and it has to be expected that only a
portion of the main goal is reached by this thesis alone. Ambition is at least to contribute to the
realization of the main goal in the future.
For the city of Rotterdam the goal is to gain insights and advice on how to deal with foundation problems in the future. The possible methods to predict the service life and how different parameters contribute to the failure of foundations are interesting goals for them, from which they can benefit.
The societal contribution which this thesis will provide is also important. The public is benefited with service life predictions and general insights into foundation problems, not only for the houses they live in, but also when considering to purchase a new house. Regarding the scope of the problem and the potential of problems in the future. Research on timber pile foundations is important.
Research questions
The main research question of the master thesis will be the following:
What is the state of the timber foundations regarding the residual strength in the dedicated
foundation risk areas of Rotterdam, can there be made more accurate estimates using certain
parameters and measurement methods?
To address this broad questions sub questions are devised, which will ultimately lead to an
answer for the main question.

Delft University of Technology
5 Master of Science thesis E.C.W. Schreurs
At first the sub questions will focus on the acquirement of knowledge.
1. What type of foundations are used in Rotterdam and what are the techniques an requirements
to install and calculate them.
2. Where is risk of the failing of a timber foundation based on?
To reach a good understanding of the allowable risk. The risk needs to be defined and
concretised. The limit of when a timber pile foundation is not meeting the required bearing
capacity needs to be defined. This way a prediction can be made when the timber pile
foundations will fail based on predefined parameters.
3. What are the failure mechanism which are responsible for the failing of the timber pile
foundation?
For this problem a literature study will be done. Aim is to identify the relevant failure
mechanism for foundation piles and which mechanisms can be expected in the timber piles of
Rotterdam.
4. What existing data is available from comparable research?
All previous obtained research needs to be collected. The city of Rotterdam has done a lot of
research into timber piles and also in the past there have been tests in the Stevin laboratory on
timber pile foundations. Both resources need to be consulted and analysed.
5. What is the goal of the experiments which need to be done, which data needs to be collected,
which output needs to be acquired and to achieve these things which experiments need to be
conducted?
For the acquired test samples a method needs to be devised what kind of experiments need to
be conducted. Also the test possibilities which are available in the Stevin lab and how they can
be implemented on the timber pile test samples has to be investigated.
7. What output can be expected using theoretical models and does the acquired output
corresponds with these values?
The acquired test output has to be compared to values which were expected. Differences need
to be explained and other discussion points can be addressed.
8. What is the rate of degradation of the tested timber piles and how are they affecting the
remaining strength? Based on this data, what is the remaining service life of the timber pile
foundations in Rotterdam?
Based on the new test results models must be devised with which predictions about the
remaining service life of the timber pile foundations in Rotterdam are made.
Conclusions have to be drawn regarding the sufficiency of the remaining service life. If this
service life is insufficient suggestions can be made on how to improve the service life of the pile foundations or how the foundation can be made reliable again.

Delft University of Technology
6 Master of Science thesis E.C.W. Schreurs
Scope limitations
In the master thesis it is easy to lose sight of the main research goal and in these cases large
stray of the subject must be avoided to keep the project manageable and within the limits of a
40 EC thesis. For this reason some subjects need to be excluded from the scope of this project.
Timber pile foundation will be considered. All other type of (timber) foundations methods will
be excluded.
Only regular buildings, so no large monumental or high sky buildings which impose extreme
loads on foundations will be included.
The timber species evaluated in this thesis will only be pine and spruce, since these account for
about 95% of all timber foundations in Rotterdam.
Only the degradation mechanisms occurring in the ground of the city Rotterdam are
considered and only advice for this region is given.
Timber piles used in open water subjected to marine degradation and collapse loads are also
not considered.
With these restrictions it is expected that the total thesis will remain within the limits which
are set in this proposal and comply with the standards set by the Technical University Delft.

CHAPTER TWO
THEORY

Delft University of Technology
8 Master of Science thesis E.C.W. Schreurs
2.1 FOUNDATIONS METHODS
In the Netherlands a lot of the housing in the west is built on wooden foundation piles. From a
long time ago people tended to live in the river deltas, because of the higher fertility of the land
and the abundance of food. During the industrial revolution the housing needs of the people
changed and a lot more people moved to the cities along the deltas. To accommodate the people
many more houses were built. To give these houses solid foundations they were mainly
supported by timber piles.
In general there are three types of timber pile foundations used in the Netherlands, the
Rotterdam foundation, the Amsterdam foundation and a Rotterdam foundation with a single
pile row connected with a concrete beam instead of timber elements(CURNET & SBR, 2012),
figure 3.1. The difference lies in the fact that in Amsterdam buildings were built with 1 or 2
more layers, this required more robust foundations which needed more piles. To accommodate
the number of piles two rows of piles were needed under a single foundation beam. In
Rotterdam one row of piles proved to be sufficient.
Traditionally the placing of timber piles was done based on the judgement of an experienced
builder. A single test pile was driven into the solid sand layer. By measuring the change in
driving depth with a certain number of blows the correct resistance was determined. Based on
this driving depth the length of all the other piles of the structure was chosen. This procedure
is not well documented so a lot of uncertainties are present when assessing old timber pile
foundations.
Figure 2.1 Three widely used foundation methods ( H.Keijer Fugro)

Delft University of Technology
9 Master of Science thesis E.C.W. Schreurs
Foundation elements
It can be said that a standard timber pile foundation consists of 5 main areas in which different
failure mechanisms can occur. In each area different parameters contribute to the failure of the
foundation part. First all different parameters will be discussed, with at the end a summary of
all failure mechanisms per region and which parts of the foundations they affect. The areas
which can be identified when analysing foundations are:
I. Upper Structure
II. Timber connecting parts
III. Pile head
IV. Pile shaft
V. Pile tip
In general a foundation fails when there are too large differential settlements. This leads to
deformations in the upper structure which cause the structure to dysfunction.

Delft University of Technology
10 Master of Science thesis E.C.W. Schreurs
2.2 DEFINITION OF SETTLEMENTS
Settlements of timber pile foundations are very important because they are the reason leading
to foundation failure. Not only the settlement of a single pile has to be limited in order for the
foundation to function but the relative settlement of the foundation elements compared with
the rest has to be checked in order to assess the damage in the upper structure.
For the settlements some parameters are of importance and they can be defined according to
the next figure (Burland & Wroth, 1974). These parameters can then be used to derive limits
which lead to damage.
1. Change of length equal to δL leads to
a strain ε=δL/L.
2. Settlement ρ, is positive downwards.
Upward displacement is called heave
and denoted ρh.
3. Differential settlement δp
4. Rotation θ, is the gradient between
two reference points.
5. Tilt is denoted ω and is the rigid
body rotation of the structure.
6. Relative rotation β, defines the
rotation of a straight line between two
reference points. (Same as angular
distortion defined by Skempton)
7. Angular strain α. From figure:
𝛼𝐵 = 𝛿𝜌,𝐵𝐴
𝑙𝐴𝐵+
𝛿𝜌,𝐵𝐶
𝑙𝐵𝐶
8. Relative deflection Δ.
9. Deflection ration Δ/L.
Most of these settlements lead to damage
in the upper structure. This will be discussed in the next chapters.
Figure 2.2 Definition of settlements(Burland & Wroth 1974)

Delft University of Technology
11 Master of Science thesis E.C.W. Schreurs
2.3 FAILURE OF THE UPPER STRUCTURE
In the upper structure it is important to know the definition of damage and derive norms
regarding which settlements lead to the different damage criteria.
The irregular settlements of the foundation caused by pile degradation or geotechnical factors
cause deformations in the upper structure. When these deformations get too high the upper
structure will fail. Depending on the use of the structure, the requirements of the users and the
structural properties of the building this will cause damage.
Damage is very roughly defined as changes introduced into a system that adversely affect its current or future performance (Farrar & Worden, 2006).
For the buildings in Rotterdam with a foundation on timber piles this means changes which
affect the aesthetics, functionality and/or safety of the building in a bad way. For assessing the
damage, distinction will be made between the different kind of damages (De Lange, 2011).
Architectural damage
Damage which is purely aesthetical there is no reduction in the functional or structural use of
the building. There are only consequences for the appearance of the building.
Examples are small cracks in the masonry or plasterwork or a small tilt of the building.
Functional damage
Damage which has as a consequence that the functionality of the structure is affected. The
serviceability limit state is exceeded.
Cracking, tilting and deformations of the structure, cause the dysfunction of the building and
can reduce the life cycle of the building due to secondary effects like, leakage, not functioning
doors and windows and failing connections with sewer systems.
Structural damage
Damage which affects the structural safety of the building. The ultimate limit state is exceeded
and the rules in the NEN8700 are not met.
For instance cracking due to the exceedance of the strength in the masonry or tilting due to the
lack of stability in the foundation.
While the definition of damage is clear the level of damage on which to decide to intervene is
not. This depends on a lot of factors and can be different for individual persons, which risk is
one willing to take determines the decision on foundation repair regarding the structural safety
of the building. With regard to the functionality of the building the mobility of the user can play
a large role in the decision process, when the user is for instance in a wheelchair he will have
different demands on the allowable settlements then when dealing with a good walker.
Aesthetics is a really arbitrary parameter, because some people will want to have a perfect
house without cracks and others do not care about the visual appearance of their house. All
different factors which influence the acceptance of damage and some examples when dealing
with foundation can be found in Appendix IV.

Delft University of Technology
12 Master of Science thesis E.C.W. Schreurs
In this chapter it has become clear that the acceptance of building damage can vary a lot. To
come to reasonable advise on foundation problems it is important to derive a system to
quantify building damage.

Delft University of Technology
13 Master of Science thesis E.C.W. Schreurs
2.4 MEASURING DAMAGE
To come to an advise whether or not to intervene in a building which is suspected to have
foundation problems it is important to quantify and measure the damage. There have been
several researches on damage in structures which were related to foundation problems and
there is an assessment method in use in the Netherlands to assess the foundation. The research
and the current method will be discussed in this chapter.
Current guidelines
The norm which deals with existing structures is the NEN 8700. It gives rules regarding the
structural safety of existing structures. It differentiates 3 reasons to assess a building:
Rebuilding
Making sure a structure meets a chosen remaining service life
Structural safety at the current time
For this thesis only the last two criteria are relevant. The legal disapproval level for a family
house belonging to reliability class 1 is one year remaining service life. This is the absolute
minimum and within this boundary it is legal for the municipality to intervene.
One difference it makes is to adjust the consequence classes to calculate the limit states to
which a building has to comply.
Table 2.1 Consequence classes NEN8700
CONSEQUENCE CLASSES
NORMAL REJECT LEVEL REPAIR LEVEL G Q Non-dom
Q G Q Non-
dom Q G Q Non-
dom Q
CC1 1.1 1.35* Ψ0 1 1 Ψ0 1.1 1.1
Ψ0
CC2 1.2 1.5* Ψ0 1.1 1.15 Ψ0 1.2 1.3
Ψ0
Another possibility the norm offers is to adjust the material properties, for instance the
material factor or the characteristic strength of the materials used. Because the building is
already in use the material which are used are known, for this reason it is possible to do
research on the actual material properties present in the building. This means that there are
lesser insecurities which lead to lower safety factors.
With the design of submerged wooden pile foundations service class 3 is not sufficient. For this
reason we will use safety factors as defined by Stapf and Aicher (Staph & Aicher, 2012). They
have done research into safety factors of in use wooden piles and have advised which safety
factors to use. For kmod they advise to use a value of 0,3. This factor is build up from two
different factors. Kmod=ktime*kmoist. The ktime factor can be derived from the Eurocode load
duration class permanent and service class 1. In this class kmoist doesn’t play a role. To
determine kmoist in timber foundations they have conducted tests and found that a safe value

Delft University of Technology
14 Master of Science thesis E.C.W. Schreurs
for kmoist is 0,5. From these tests they also derived an adjusted material factor of γm = 1.23.
During the experimental testing it will be checked whether or not this value is a good
assumption.
Scientific research into damage limits.
In the past some research has been done into damage limits, which relate settlements to
damage in masonry structures. A short recap of all research is can be found in appendix IV. The
first and very widely used research was done by Skempton and MacDonald in 1956 and a lot
of the following research has been based on their ground breaking work. The boundary values
which they found for the angular distortion, by others defined as deflection ratio, can be seen
in table 2.2.
Table 2.2 Damage criteria Skempton and MacDonald
LIMIT DEFLECTION RATIO SORT OF DAMAGE 1/500 Advised to use as damage initiation 1/300 Found damage initiation from 98 buildings 1/150 Structural damage
Another method as first developed by Polshin and Tokar makes use of critical strains for the
masonry used. The critical strain they found as a damage criteria is between 0.05% and 0.1%.
This is however the limit at which damage occurs. After the limit there still can be capacity left
in the structure.
Another effect almost all studies find is the difference between hogging and sagging
deformations. From practice it seems that hogging deformations are more prone to damage
then sagging deformations. Burland and Wroth explained this effect due to the lack of a
constraint when a crack forms at the top of a wall, also the shifting of the neutral axis from the
middle to the bottom plays a role in the different mechanisms. However Netzel argued that
when horizontal differential settlements are neglected and if the analysed wall has a L/H ratio
between 0.75 and 2.5 hogging modes do not always lead to more severe damage compared
with sagging modes.
Quality of the masonry
Another important factor in the upper structure is the quality of the masonry which is
connected with the underlying timber foundation. To assume a certain strength of this masonry
there are three methods. Assuming a lower limit based on literature, actual foundation
inspections on site and real research into the strength of the masonry(CURNET & SBR, 2012).

Delft University of Technology
15 Master of Science thesis E.C.W. Schreurs
The flow of forces can be seen in the figure 6.1. It underlines the importance of the masonry. Calculation of the masonry can be done by rules in the NEN 1997. There are three main failure mechanisms of the masonry, namely exceedance of masonry strength around pile heads, Collapse of the pressure arc (not likely), collapse of the masonry in the building wall(CURNET & SBR, 2012). The last mechanism is the case when dealing with the settlements as described before.
Figure 2.3 Flow of forces in masonry (CURNET &SBR, 2012)

Delft University of Technology
16 Master of Science thesis E.C.W. Schreurs
2.5 GROUNDWATER
The groundwater level plays a large role in the susceptibility of timber foundations to degrading mechanisms. In general it is believed that piles which remain under the phreatic ground water level can remain in service for very long periods and this has been proven in practice. For instance the Royal Palace on the Amsterdam Dam square which has been founded on piles which have been in use since 1640.
The main reason why timber parts of the foundation almost do not degrade below the
groundwater surface is the lack of oxygen in the water. In the top 10cm of the groundwater
enough oxygen can be present to facilitate the aerobic degradation of timber. For this reason It
can be said an acceptable groundwater level is 30cm above the timber foundation
parts(Fundering, 2006). The extra 20 cm is to account for differences between the
measurement moments and the extreme low ground water level.
In the Netherlands in general and this is also the case in Rotterdam the groundwater level is declining over the years. When for instance the groundwater at the Spoorsingel over the past 40 years is viewed this declining trend can be seen very well.
Figure 2.4 Groundwater level at Spoorsingel, Rotterdam
This trend is very worrisome, because this means the groundwater level will drop below the construction level of the timber parts in the foundation and this will lead in almost all the cases to degradation.
Monitoring well 28
-3,2
-3,1
-3
-2,9
-2,8
-2,7
-2,6
-2,5
-2,4
-2,3
-2,2
18-2-1982 14-11-1984 11-8-1987 7-5-1990 31-1-1993 28-10-1995 24-7-1998 19-4-2001 14-1-2004 10-10-2006 6-7-2009
Monitoring well: 128568-28
Lineair (Monitoring well: 128568-28)

Delft University of Technology
17 Master of Science thesis E.C.W. Schreurs
2.6 CONNECTING FOUNDATION PARTS
The parts which are made to connect, redirect and spread the forces from the upper structure
to the piles are often made of timber elements in old foundations. These elements have a
horizontal alignment and are called ‘kespen’. In newer pile foundation these connecting parts
are made of concrete, because of the high susceptibility to degradation.
Force transfer
The function of the kespen in traditional foundations is the spreading of the forces in the
masonry over the pile head. In the Amsterdam foundation type the kesp is also responsible for
the uptake of horizontal forces coming from the horizontal component of the forces and leading
them into the eccentric placed foundation piles.
Figure 2.5 Calculation model connection (Frank Sas)

Delft University of Technology
18 Master of Science thesis E.C.W. Schreurs
Timber strength properties
The timber connecting parts are loaded different then the foundation piles. These horizontal
orientated parts get loaded perpendicular to the grain. Loaded this way the timber can resist a
much smaller load compared to when it is loaded parallel to the grain. According to the NEN
8707 the value of this strength is 4.5N/mm2 . However recent studies have shown that this
value is too high. Study show that the strength is depending on the properties of the
construction: what is the pile diameter and is the deformation criteria used too high(Nobel,
2014). A save calculation value is found and it is advised to use a value of 2.45N/mm2, this value
belongs to a deformation of the kesp of 30%.
A method is proposed by Nobel(2014) to get accurate estimates of kesp strengths and how to take into account more parameters when estimating this strength. The only effect not yet taken into account with this method is the influence of the height of the kesp, because all test were done on kespen which were 70mm height.
𝜎𝑐,90,𝑑 =𝐹𝑐,90,𝑑
𝐴𝑒𝑓𝑓= 𝑘𝑒𝑐,90 ∙ 𝑓𝑐,90,𝑑 ↔
𝐹𝑐,90,𝑑
𝐴= 𝑘𝑐,90 ∙
𝐴𝑒𝑓
𝐴∙ 𝑓𝑐,90,𝑑
𝑓𝑐,90,𝑑 = 1.07 𝑁
𝑚𝑚2
𝑘𝑒𝑐,5 = 𝑘𝑐,90 ∙ 𝐴𝑒𝑓
𝐴
𝐴𝑒𝑓 = 𝜋 (𝑅1 + 30)2 − 2𝑎𝑟𝑐𝑜𝑠 (𝑅1
𝑅1 + 30) (𝑅1 + 30)2 + 4√15𝑅1 + 225𝑅1
𝑘𝑐,90 𝑒𝑛 𝐴𝑒𝑓 ℎ𝑎𝑣𝑒 𝑡𝑜 𝑚𝑎𝑡𝑐ℎ 𝑡ℎ𝑒 𝑐𝑜𝑛𝑑𝑖𝑡𝑖𝑜𝑛𝑠 𝑓𝑜𝑢𝑛𝑑 𝑖𝑛 𝑁𝐸𝑁1995 6.1.5
𝐴 = 𝜋𝑅12, 𝑤𝑖𝑡ℎ 𝑅1 𝑎𝑠 𝑡ℎ𝑒 𝑟𝑎𝑑𝑖𝑢𝑠 𝑜𝑓 𝑡ℎ𝑒 𝑝𝑖𝑙𝑒

Delft University of Technology
19 Master of Science thesis E.C.W. Schreurs
2.7 TIMBER PILE PROPERTIES
Wood anatomy
Timber used
For foundation piles in Rotterdam timber piles were used which consisted of a large part of the
trunk of a tree. Timber species used in Rotterdam foundations are mostly spruce. Other species
can be found such as oak and pine but these are very rare. Trees tend to grow with a taper
along the tree height this effect is also present in the foundation piles used. From experience it
can be said the taper of piles in Rotterdam is 5mm/m with an average length of the piles
between 15 and 20 meters. Because these relative high lengths were needed the majority of
timber foundations are made of spruce, which in general is available in longer lengths.
Juvenile, mature, heart- and sapwood boundary
In a cross section of a full trunk different kinds of wood can be found which have different
properties regarding parameters important in the application of timber in foundations. Four
different parts of the cross section will be discussed: juvenile, mature, heart- and sapwood.
Juvenile wood has inferior strength compared with the rest of the cross section. To take this
into account in the cross section it is important to know how much juvenile wood is present. In
general there are two rules either the 15 innermost rings are the juvenile wood(Wilhelmsson
et al., 2002) or the innermost 10 rings is the juvenile wood (Pik & Kask, 2004) safest is to
assume the innermost 15 rings as juvenile wood This gives adequate enough estimates for
residual strength calculations.
The juvenile wood is part of the heartwood. All wood which is not juvenile wood is called
mature wood. To distinguish between the heartwood and sapwood is important, because of
their different biological resistance against microorganisms. In foundation piles it is difficult to
visually find the boundary between heartwood and sapwood. Often there is not much colour
difference and the only way to determine the boundary is by means of microscopic research,
which is time consuming and requires a lot of experience. Another method has been researched
(Longuetaud, Mothe, Leban, & Mäkelä, 2006), this method relates the number of heartwood
rings to the disk age which is easy to determine by counting the grow rings. This is an easy
method to estimate the number of heartwood rings (HWNBR) in a full timber foundation pile.
The equation can be seen in figure 9.1 along with the location of a model of a cross section.
𝐻𝑊𝑁𝐵𝑅 = 0.6614×𝑎𝑔𝑒 − 11.077
HWNBR= Number of heartwood rings
Age = Count of total growth rings
Sapwood
Heartwood
Juvenile wood
Mature wood
Figure 2.6 Timber differences in cross section

Delft University of Technology
20 Master of Science thesis E.C.W. Schreurs
Degradation of the pile
There are a lot of mechanism which can degrade timber. All mechanisms will be described here,
they can be active in more than one region of the total timber pile foundation structure. In the
chapters belonging to the other regions only the influence of the relevant degrading processes
will be discussed.
Biological deterioration
Biological decay is one of the most important parameters when modeling service life of timber
piles(Van de Kuilen & Montaruli, 2008). Biological decay affects the chemical structure of the
timber and changes the cross sectional properties of the affected timber. Understandably this
has great influence on the service life of the damaged member. Biological decay can in general
be divided into several components, namely fungal decay, bacterial decay and insect attack.
Each of which will be specified in this chapter.
Fungal decay
There are a few different kind of fungi which play a role
in the degradation of timber piles. The growth and
reproduction of fungi takes place in several steps which
can be seen in figure 9.2. In general there are four
different kinds: blue stain, white rot, brown rot and soft
rot. Each have their own ideal circumstances and parts
which they affect
Figure 2.7 Fungal degradation

Delft University of Technology
21 Master of Science thesis E.C.W. Schreurs
White and brown rot are considered to be the most severe forms of fungal attack. They occur
in timber pile foundations when the soil contains enough oxygen. This is the case when the
groundwater table is lowered below the top of the pile. This top will then begin to degrade fast
and if no measures are taken the whole cross section can be affected, ultimately leading to near
zero residual strength of the member.
Brown rot is a severe wood degrading fungi which can occur in the top of timber piles when
the groundwater level is lowered below the foundation level of the structure. Because of the oxygen in the air the fungi gets a chance to live in the wood feeding on the cellulose and
hemicellulose of the wood cells. Which makes the wood crack across the grain, shrink, collapse
and it is crushed into powder(Causen, 2010).
Figure 2.8 Brown rot seen in test specimen
White rot has much the same properties as brown rot however it occurs more in hardwood
while brown rot is more found in softwood species. But sometimes they can colonize both types
of wood. White rot fungi consume both cellulose and lignin, the wood does not crack across the
grain and the outward dimensions remain the same (Causen, 2010). When there are favorable
conditions in the soil for brown rot and white rot they can consume a total cross section of a
pile in only seven years(Vatovec & Kelley, 2007). When the groundwater level is not retracted
long enough and fluctuates too much the moisture content of the wood is too high for white rot
and brown rot. The soft rot fungi can thrive under these circumstances, however the
degradation by this fungi is slower than is the case with white and brown rot (Vatovec & Kelley,
2007), but this can over time degrade the timber very severally. When the piles are subjected
to changing ground water levels for a long duration the soft rot can be a major contributor to
settlement problems with timber pile foundations.

Delft University of Technology
22 Master of Science thesis E.C.W. Schreurs
Blue stain of wood is also a fungal attack on the wood. Staining is confined to the sapwood and
does not affect the mechanical properties of the timber in a major way. It makes the wood more
absorbance and affects the shock resistance and toughness (Causen, 2010). These properties
do not play a major role in submerged timber pile foundations and for this reason staining is
not considered important.
In the following table the fungal decay mechanism are compared and it can be seen what are
the ideal environments in which they can live.
Table 2.3 Overview fungal degradation
FUNGAL TYPE
WOOD TYPE
MOISTURE CONTENT
TEMPERATURE PH AFFECTED PARTS
BROWN ROT
Softwood 30-60 % 24-35°C 4-6 CELLULOSE HEMICELLULOSE
WHITE ROT
Hardwood 30-60 % 24-35°C 4-6 LIGNINE CELLULOSE HEMICELLULOSE
SOFT ROT
Soft-& Hardwood
30-200 % 24-35°C Up to 11
CELLULOSE HEMICELLULOSE
BLUE STAIN
SOFT- & HARDWOOD
30-40 % 28-40°C CELL CONTENTS
Bacterial decay
Bacterial decay is one of the only mechanism which
can cause wood degradation below the
groundwater level in the anoxic environment.
According to Klaassen (Klaassen, 2007) there are
two types of wood degrading bacteria, erosion
bacteria and tunnelling bacteria. Bacterial
degradation is a slower process then fungal
degradation, but can have a devastating effect on
timber pile foundations. The attack of bacterial
degradation is often limited to the sapwood part of
the cross-section. Heartwood degradation is
possible but this is only found in archaeological
wood of several centuries old. Pine has a relative big part of sapwood and therefore caution is
required when assessing pine piles.
Figure 2.9 Deteriorated cross section

Delft University of Technology
23 Master of Science thesis E.C.W. Schreurs
Table 2.4 Overview bacterial degradation
Bacteria type Mobility Nutrition Affected parts Erosion bacteria Motile via gliding and
groundwater flow Cellulose & hemicellulose
Cellulose rich S2 layer (leaves S3 and middle layer intact)
Tunneling bacteria Motile via gliding and groundwater flow
Cellulose & hemicellulose
All cell wall layers
At the pile tip a critical cross section can be present because of the taper of the pile. The smallest
area will be present here and due to the built up of the negative skin friction, see 11, along the
pile shaft the largest force will be present at this location. The bacterial degradation occurs
over the total length of the pile and the smaller tip has lesser cross-section to resist the attack.
However assessing this degradation is impossible in situ. The research by Klaassen(Klaassen, 2007) showed that the degree of bacterial degradation along the length of the pile is more or
less the same. Making it possible to make assumptions on the remaining cross section at the
pile tip.
Degradation by insects
Degradation by insects is not a factor of influence considering timber pile foundations in the
ground. They don’t live beneath groundwater levels and if the pile head is above the
groundwater lever the other degrading mechanisms will be more dominant and the decay by
insects can be neglected.
Physical degradation
Physical degradation occurs either in case of fire (temperature), wind, UV radiation or drying.
Especially in older structures, drying cracks may be visible. Depending on the size of these
cracks, the structural safety may be at risk. The depth of these cracks depends on factors such
as initial moisture content, climate after installation, sawing pattern of the beam and whether
the heart of the tree is present or not. Although the stiffness is decreased, the bending strength
is hardly affected since the amount of wood material is not changed in the highly stressed
zones. For shear however, these cracks are important and the residual cross section has to be
taken into account(Van de Kuilen & Montaruli, 2008).
Table 2.5 Drying strains
PINE SPRUCE RADIAL 4.0 3.7 TANGENTIAL 7.7 7.8 LONGITUDINAL 0.3 0.3
Delft University of Technology
24 Master of Science thesis E.C.W. Schreurs
Mechanical decay
Mechanical damage consist of several parameters, duration of load(DOL) effects, grade/quality
of wood, pile group effects, test sample size, variability and potential defects in the wood. The
most significant is the duration of load effect this accounts for 40% reduction in the
compressive strength for permanent loads. In foundation piles this effect cannot be
underestimated because of the relative high permanent loads. The duration of load effect
becomes more severe depending on the percentage of the ultimate load which is present on the member.
For long term strength, loads must be classified in a load duration class, which can be either
instantaneous, short term, medium term, long term or permanent. Mechanical loads only cause
damage when they are short term and very high(Kuilen, 1999). Permanent loads are too low
to cause serious damage and do hardly influence the service life of the structure, except for pile
foundations (Van de Kuilen & Montaruli, 2008). r
A critical phase when mechanical degradation can occur is when the piles are driven. Due to
the driving of the piles cracks can form which can lead to a reduction in the strength.
Chemical
Chemical alterations of the wood due to the oxidation of constituents exposed to air is called
chemical stain (Scheffer, 1982). This is not a problem in timber foundation piles, because of the
lack of oxygen below the ground water surface and that the chemical stain usually doesn’t affect
the strength properties of the timber. This is only the case locally when the wood is exposed
for a long period of time to iron or copper. This effect is also localized to piles which are used
in contaminated soil. And these effects must be determined on site.

Delft University of Technology
25 Master of Science thesis E.C.W. Schreurs
2.8 MODELS TO DESCRIBE REMAINING STRENGTH
To describe the remaining bearing capacity of timber piles which have been in use for several
years a few models have been developed. In this thesis four developed methods will be
discussed: the damage model by Jan Willem van de Kuilen from 2005, this model is further
developed by Nicolas Gentner in his 2014 thesis, furthermore the way the current residual
strength is determined in practice as proposed by Frans Sas from the municipality of
Amsterdam and the method developed by Carolina Lantinga in her 2014 thesis.
MODEL 1 (Kuilen, 2006)
Van de Kuilen proposes to model the timber using the damage accumulation model developed
by Gerhards in 1986 with adjusted strength values for the resistance part (R(s(τ),t)) of the limit
state function, Z(t)=R(s(τ),t)-S(t). Inserting a time dependent resistance in the accumulated
damage function the following function is obtained.
𝑑𝛼
𝑑𝑡= 𝑒
(−𝐶1+𝐶2𝜎(𝜏)
𝑓𝑠(𝑡))
𝑑𝛼
𝑑𝑡= 𝑅𝑎𝑡𝑒 𝑜𝑓 𝑑𝑒𝑐𝑎𝑦
𝐶1& 𝐶2 = 𝑃𝑎𝑟𝑎𝑚𝑒𝑡𝑒𝑟𝑠 𝑑𝑒𝑡𝑒𝑟𝑚𝑖𝑛𝑒𝑑 𝑓𝑟𝑜𝑚 𝑡𝑖𝑚𝑒 𝑡𝑜 𝑓𝑎𝑖𝑙𝑢𝑟𝑒 𝑡𝑒𝑠𝑡𝑠
𝜎(𝜏) = 𝐿𝑜𝑎𝑑 𝑝𝑎𝑡ℎ
𝑓𝑠(𝑡) = 𝑇𝑖𝑚𝑒 𝑑𝑒𝑝𝑒𝑛𝑑𝑒𝑛𝑡 𝑙𝑜𝑎𝑑 𝑐𝑎𝑟𝑟𝑦𝑖𝑛𝑔 𝑐𝑎𝑝𝑎𝑐𝑖𝑡𝑦
The damage α is a value between 0=undamaged and 1=failure. Which leads to an acceptable
structure as long that Z(t)=1-α>0.
The time dependent resistance is written as:
𝐹𝑢 = 𝑓𝑐,0 ∙ 𝐴𝑟𝑒𝑚 + 𝑓𝑐,0,𝑑𝑒𝑐 ∙ 𝐴𝑑𝑒𝑐
𝐹𝑢 = 𝑃𝑖𝑙𝑒 𝑟𝑒𝑠𝑖𝑠𝑡𝑎𝑛𝑐𝑒
𝑓𝑐,0 = 𝑆𝑡𝑟𝑒𝑛𝑔𝑡ℎ 𝑜𝑓 𝑛𝑜𝑛 𝑑𝑒𝑐𝑎𝑦𝑒𝑑 𝑡𝑖𝑚𝑏𝑒𝑟
𝑓𝑐,0,𝑑𝑒𝑐 = 𝑆𝑡𝑟𝑒𝑛𝑔𝑡ℎ 𝑜𝑓 𝑑𝑒𝑐𝑎𝑦𝑒𝑑 𝑡𝑖𝑚𝑏𝑒𝑟
𝐴𝑟𝑒𝑚 = 𝑅𝑒𝑚𝑎𝑖𝑛𝑖𝑛𝑔 𝑠𝑜𝑢𝑛𝑑 𝑐𝑟𝑜𝑠𝑠 𝑠𝑒𝑐𝑡𝑖𝑜𝑛
𝐴𝑑𝑒𝑐 = 𝐷𝑒𝑐𝑎𝑦𝑒𝑑 𝑐𝑟𝑜𝑠𝑠 𝑠𝑒𝑐𝑡𝑖𝑜𝑛
Which is based on a cross section with two different strengths, namely the decayed part and
the sound part.

Delft University of Technology
26 Master of Science thesis E.C.W. Schreurs
MODEL 2(Gentner, 2014)
Gentner evolves the model as specified by Van de Kuilen for specific cases. He considers two
types of decay patterns both are depicted below.
First Both models are evaluated without taking into account damage accumulation. For the
evenly distributed model a starting decay depth is e0 and a constant decay rate μ is adopted.
For the service life the following equation is found:
𝑇 =(−2𝜋𝑒0 + 𝜋𝑑)(𝑓𝑐,0 − 𝑓𝑐,0,𝑑𝑒𝑐) − √𝜋2𝑑2(−𝑓𝑐,0 ∙ 𝑓𝑐,0,𝑑𝑒𝑐 + 𝑓𝑐,0,𝑑𝑒𝑐
2) + 4𝜋𝑄(𝑓𝑐,0 − 𝑓𝑐,0,𝑑𝑒𝑐)
2𝜋𝜇(𝑓𝑐,0 − 𝑓𝑐,0,𝑑𝑒𝑐)
𝑄 = 𝐶𝑜𝑛𝑠𝑡𝑎𝑛𝑡 𝑙𝑜𝑎𝑑
𝜇 = 𝐷𝑒𝑐𝑎𝑦 𝑟𝑎𝑡𝑒
𝑒0 = 𝑆𝑡𝑎𝑟𝑡𝑖𝑛𝑔 𝑑𝑒𝑝𝑡ℎ 𝑜𝑓 𝑑𝑒𝑐𝑎𝑦
𝑑 = 𝑑𝑖𝑎𝑚𝑒𝑡𝑒𝑟
However it should be noted that heartwood has a different decay rate than sapwood. This is
not taken into account by the equation.
Figure 2.10 Different decay patterns and their associated parameters

Delft University of Technology
27 Master of Science thesis E.C.W. Schreurs
For the second model with the triangular
decay pattern heartwood degradation is
neglected. With this concession it can be said
there is a maximum penetration depth of the
decay, hmax. There is also a need to take into
consideration some species dependant and
specific parameters namely: bmax, μ and n.
These are the maximum width of the decay the
decay rate and the number of affected areas in
the specimen.
The difference between the two models can be seen from the following two figures which combines the results found for a fictional pile with some feasible parameters.
From the shapes of the graphs it can be seen that the second model is much more severe as the
rate which leads to failure increases over time.
Figure 2.12 Difference between the two models developed by Gentner
Figure 2.11 Parameters for irregular decay

Delft University of Technology
28 Master of Science thesis E.C.W. Schreurs
MODEL 3 (Sas, 2007)
Frank Sas relates the residual strength of foundation piles to the penetration depth of a pylodin measurement. When doing extensive pile calculations he makes use of 4 zones in each pile with different strengths these strengths are different per pile and depend on the penetration depth of the pylodin measurement.
Ultimately leading to standard graphs related to test done on foundation piles in the past. All new measurements are related to these past reference piles. For example the reference graph in figure 10.4.
Figure 2.13 Standard graph for determining residual strength

Delft University of Technology
29 Master of Science thesis E.C.W. Schreurs
MODEL 4(Lantinga, 2014)
The model of Lantinga looks a lot like model 1. She uses two different areas to account for
degradation and she uses pilodyn measurements to estimate the depth of the weaker area.
With the relation between the moisture content and the compression strength and the relation
between the pilodyn-dry mass related to the modulus of elasticity she determines the
remaining strength of the cross section.
Another effect she investigates is when the cross section is eccentrically loaded. She derives
interaction equations between moment and normal force which lead to the following graphs
for the tests she has done.
Figure 2.14 Interaction diagram Normal force and Moment
Delft University of Technology
30 Master of Science thesis E.C.W. Schreurs
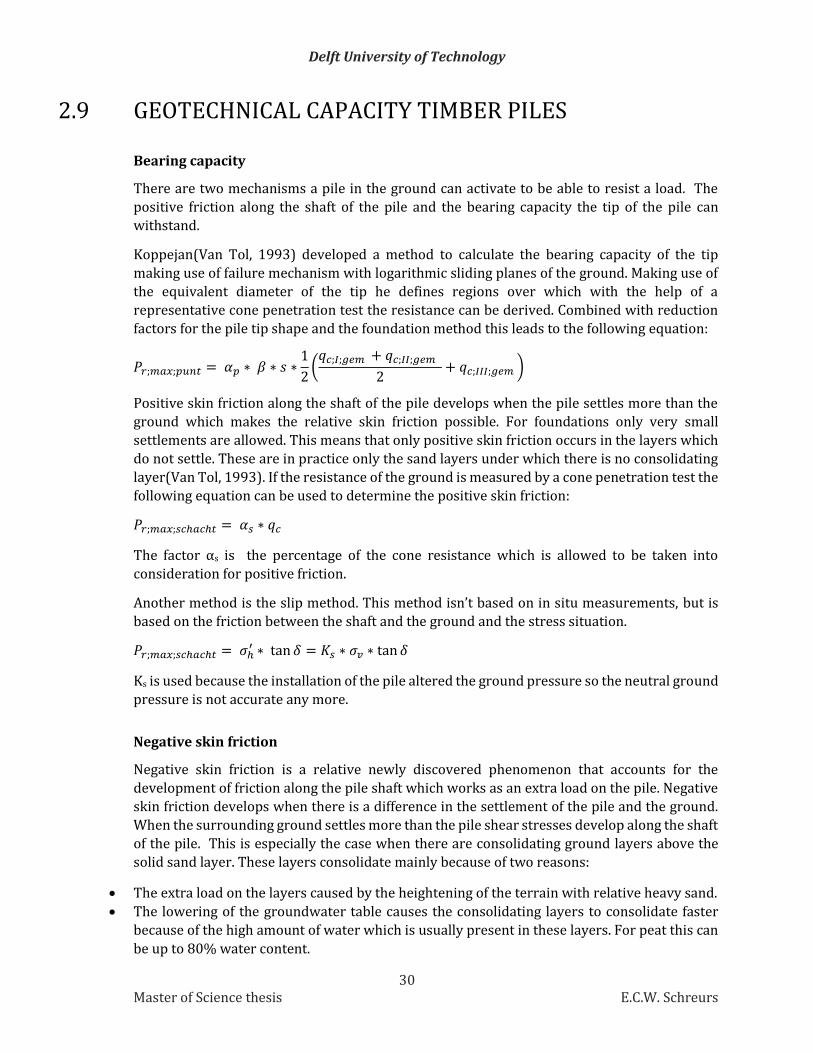
2.9 GEOTECHNICAL CAPACITY TIMBER PILES
Bearing capacity
There are two mechanisms a pile in the ground can activate to be able to resist a load. The
positive friction along the shaft of the pile and the bearing capacity the tip of the pile can
withstand.
Koppejan(Van Tol, 1993) developed a method to calculate the bearing capacity of the tip
making use of failure mechanism with logarithmic sliding planes of the ground. Making use of
the equivalent diameter of the tip he defines regions over which with the help of a
representative cone penetration test the resistance can be derived. Combined with reduction
factors for the pile tip shape and the foundation method this leads to the following equation:
𝑃𝑟;𝑚𝑎𝑥;𝑝𝑢𝑛𝑡 = 𝛼𝑝 ∗ 𝛽 ∗ 𝑠 ∗1
2(
𝑞𝑐;𝐼;𝑔𝑒𝑚 + 𝑞𝑐;𝐼𝐼;𝑔𝑒𝑚
2+ 𝑞𝑐;𝐼𝐼𝐼;𝑔𝑒𝑚 )
Positive skin friction along the shaft of the pile develops when the pile settles more than the
ground which makes the relative skin friction possible. For foundations only very small
settlements are allowed. This means that only positive skin friction occurs in the layers which
do not settle. These are in practice only the sand layers under which there is no consolidating
layer(Van Tol, 1993). If the resistance of the ground is measured by a cone penetration test the
following equation can be used to determine the positive skin friction:
𝑃𝑟;𝑚𝑎𝑥;𝑠𝑐ℎ𝑎𝑐ℎ𝑡 = 𝛼𝑠 ∗ 𝑞𝑐
The factor αs is the percentage of the cone resistance which is allowed to be taken into
consideration for positive friction.
Another method is the slip method. This method isn’t based on in situ measurements, but is
based on the friction between the shaft and the ground and the stress situation.
𝑃𝑟;𝑚𝑎𝑥;𝑠𝑐ℎ𝑎𝑐ℎ𝑡 = 𝜎ℎ′ ∗ tan 𝛿 = 𝐾𝑠 ∗ 𝜎𝑣 ∗ tan 𝛿
Ks is used because the installation of the pile altered the ground pressure so the neutral ground
pressure is not accurate any more.
Negative skin friction
Negative skin friction is a relative newly discovered phenomenon that accounts for the
development of friction along the pile shaft which works as an extra load on the pile. Negative
skin friction develops when there is a difference in the settlement of the pile and the ground.
When the surrounding ground settles more than the pile shear stresses develop along the shaft
of the pile. This is especially the case when there are consolidating ground layers above the
solid sand layer. These layers consolidate mainly because of two reasons:
The extra load on the layers caused by the heightening of the terrain with relative heavy sand.
The lowering of the groundwater table causes the consolidating layers to consolidate faster
because of the high amount of water which is usually present in these layers. For peat this can
be up to 80% water content.
Delft University of Technology
31 Master of Science thesis E.C.W. Schreurs
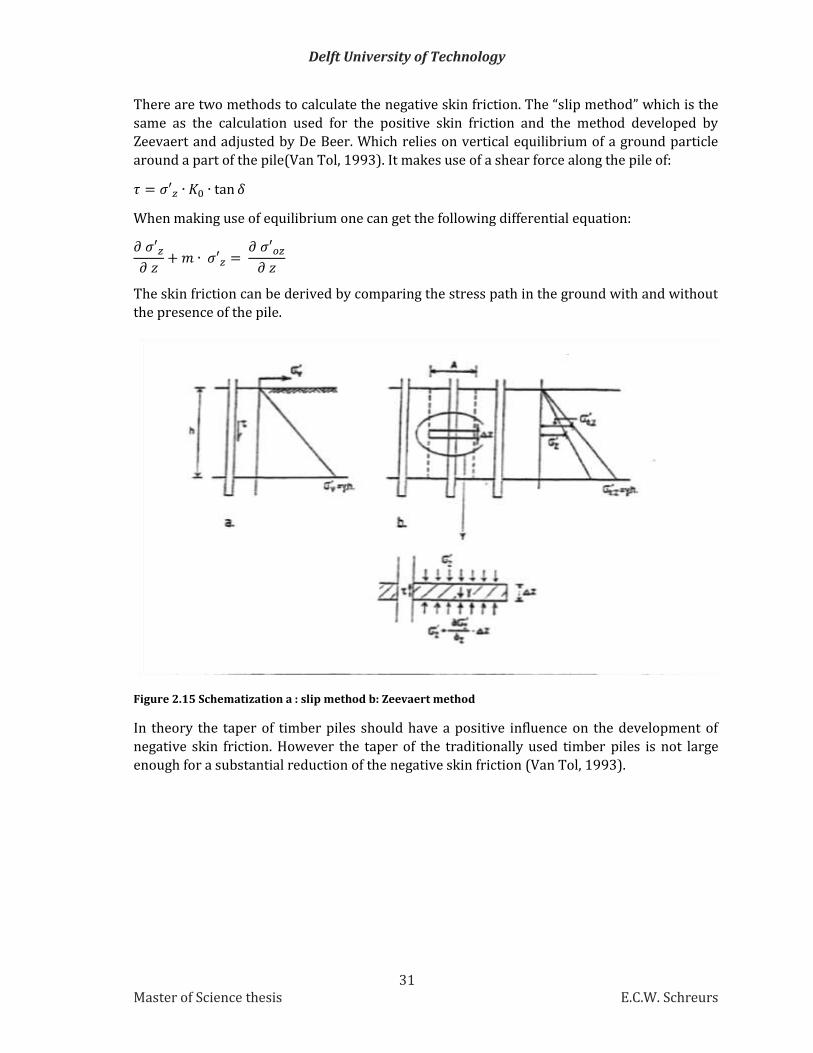
There are two methods to calculate the negative skin friction. The “slip method” which is the
same as the calculation used for the positive skin friction and the method developed by
Zeevaert and adjusted by De Beer. Which relies on vertical equilibrium of a ground particle
around a part of the pile(Van Tol, 1993). It makes use of a shear force along the pile of:
𝜏 = 𝜎′𝑧 ∙ 𝐾0 ∙ tan 𝛿
When making use of equilibrium one can get the following differential equation:
𝜕 𝜎′𝑧
𝜕 𝑧+ 𝑚 ∙ 𝜎′𝑧 =
𝜕 𝜎′𝑜𝑧
𝜕 𝑧
The skin friction can be derived by comparing the stress path in the ground with and without
the presence of the pile.
Figure 2.15 Schematization a : slip method b: Zeevaert method
In theory the taper of timber piles should have a positive influence on the development of
negative skin friction. However the taper of the traditionally used timber piles is not large
enough for a substantial reduction of the negative skin friction (Van Tol, 1993).

Delft University of Technology
32 Master of Science thesis E.C.W. Schreurs
2.10 FAILURE MECHANISMS
In the previous chapters the failure of timber pile foundations have been investigated. All
aspects which are of influence when dealing with timber pile foundation failure have been
handled. In this chapter the failure mechanisms will be summarized based on the regions in
which they occur. These regions can be seen in figure 12.1.
Region I
The upper structure is the ultimate critical part to
decide whether or not the foundation is still
functioning. There are different criteria related
to the failing of the upper structure. The structure
can fail esthetical, architectural or structural. The
extent to which damage and the accompanying
risks are acceptable is different for all different
home owners. However the government has a
role in this, which is to prevent dangerous situations. The government comes into play when
structural damage occurs. To all levels of damage
research has been done to determine limits
which mark the occurrence of the different
damage levels. All researches are well in line with
the criteria as they are used in practice now.
Another important factor of region I is the quality
of the masonry which is present above the
foundation piles. This masonry is responsible for
the guidance of the forces into the timber piles.
High stresses occur here and the masonry must
be able to resist these stresses, this is not self-
evident in old structures. Inspections or testing of
the masonry must lead to a good estimate of the
stress which the masonry is able to resist.
Region II
In this region the pile is connected to the upper structure. In old foundations this is done by
timber elements which are horizontally placed. These parts are very susceptible to
degradation, because they are the first elements which is dried out when the groundwater
lowers. Due to this it can no longer fulfill the spreading function to guide the forces into the
masonry and it can also fail in pressure perpendicular to the grain when the embedment
strength is not sufficient any more. The strength of this timber, loaded perpendicular to the
grain, is often assessed to high. And more parameters should be taken into account when
estimating this strength.
Figure 2.16 Regions in Rotterdam foundation

Delft University of Technology
33 Master of Science thesis E.C.W. Schreurs
Region III
In this region the degradation of the pile head can lead to insufficient strength of the pile. The
cross section of the pile gets degraded to such an extent that it can no longer sufficiently
provide the capacity needed for the compressive strength. In this region the elastic shortening
of the pile due to the load will also be the biggest. Calculating this shortening is not always easy
because it is unclear what the exact modulus of elasticity is of the pile combined with the
ground.
Region IV
Region IV deals with the geotechnical failure modes which can occur in pile foundations.
Insufficient geotechnical bearing capacity can occur under influence of certain mechanisms.
One of the biggest effects is the increasing load due to negative skin friction which keeps pulling
the pile down leading to large settlements. Another factor could be insufficient driving depth
leading to overestimations of the bearing capacity of the tip.
Region V
Besides the bearing capacity of the tip another failure mechanism can occur. Due to bacterial
degradation the cross section of the pile can get degraded over the entire pile length. Because
of the taper the smallest cross section is found at the tip of the pile. Combined with bacterial
degradation a critical cross section can develop at this place.

CHAPTER THREE
LABORATORY TESTING

Delft University of Technology
35 Master of Science thesis E.C.W. Schreurs
Figure 3.1 Parts of the test specimen
3.1 DEFINITION OF DEGRADATION
To come to a working solution and a hands on approach when assessing timber piles a definition of degradation and a way to quantify it has to been given. For this thesis the following definition is devised and is used in the following part.
A decline of the mechanical properties of the cross section regardless of the mechanism.
Goal of the experiments will be to identify ways to detect the degradation and to be able to relate this to the strength.
3.2 METHOD FOR EXPERIMENTS
Part of the research is done on actual specimens from a high risk area in Rotterdam. A batch of
timber foundation pile heads is acquired from the Spoorsingel 43 and 45 in Rotterdam. There
are 7 pile heads which have been put in use in 1902. The experiments will be done to answer
the following research question.
What non and or semi destructive test methods can be used to predict remaining compression
strength of in use timber pile foundations?
The timber will be tested on four different levels.
The first level is testing of the full pile heads. The
second level is testing on disks which have been
sawn from the pile heads and the third level are
test on specimens taken from the disks. The
methods used will be visual, probing, CT
scanning and resistance drilling measurements.
All will be checked with destructive testing in
level three. Figure 14.1 elaborates more on the
test and methods used.
It is expected that visual inspection with some basic probing can lead to the identification of
timber degradation patterns of the pile heads. The resistance drilling will lead to detailed
insights into internal defects and degradation, leading to data of the density and elasticity
modulus. In the end a prediction method will be devised to predict strength loss which is the
base for service life predictions.
Level 1: Testing of the entire pile heads.
Measuring and assessing of the samples.
At first measuring of the samples will be done to be able to estimate the dimensions of the entire piles. Also pictures are made to assess the pile.
Visual inspection combined with probing.
A subdivision is made along the pile length corresponding to the disks which have to be sawn in the following phase. In areas where visual defects can be found probing will be done with a
Full pile head (level 1)
Disks (level 2)
Test specimen (level 3)

Delft University of Technology
36 Master of Science thesis E.C.W. Schreurs
tool 3*3mm to determine the depth of the degradation. The location of the degradation is documented making it possible to determine the scope and pattern of the degradation.
IML-Resi testing.
With this test method the aim is to find the boundary between sap and heartwood. Also the measured results give indications about the degradation of the sections and can identify internal defects. The results at the top can be compared with the results at the bottom of the samples. Giving insights into the degradation from fungi. The procedure is to systematically test the piles with the IML-Resi at four points in each disk and in each defect as has been identified by the visual inspection.
Level 2: Testing of cross sectional disks.
Checking cross sectional disks with CT scanner.
Three disks are inspected under a CT scanner which scans with a resolution of 0.6mm. Results show density differences inside the timber pile. These can be used to verify the measurements which have been done in the previous phase.
Making visual subdivisions.
Goal in this phase is to visually identify uniform degraded parts in the disks to be able to saw the test specimens. Also distinction is made in each specimen to test for differences between sap, heart and juvenile wood. Keeping in mind the requirements of the NEN 408 regarding the dimensions of compressive samples.
Level 3: Testing on compression specimens.
Moisture content determination (NEN 408).
The test specimens are kept in the climate room at the Stevin lab in a regulated room with relative humidity 65% and a temperature of 20°C. The expected moisture content in softwoods will be 12%. Experiments are done to check the actual moisture contents of the tested samples. The compressive test will take place on specimens of 33*38*200+/-. This will be done according to NEN-EN 13183-1. Because in the norm the length of specimens needs to be 6 time the smaller cross section comparison of the results will be done with longer specimens to determine a size effect.
Compressive testing to determine compression strength parallel to the grain.
To determine the compressive strength of the test specimens the rules of the NEN 408 will be
followed. According to this guideline the specimens need to be six times longer than the smaller
cross section. With a constant loading head movement the load will be applied in such a manner
that the cross section is expected to fail in 300 +/-120 seconds, all pieces deviating from this
limit have to be reported. The final compressive strength will be calculated with the following
equation with an accuracy of 1%.
𝑓𝑐,0 =𝐹𝑚𝑎𝑥
𝐴

Delft University of Technology
37 Master of Science thesis E.C.W. Schreurs
3.3 RESULTS
In this chapter the results for each testing method will be displayed. In chapter 6 these results
will be further analyzed.
Assessing the full pile sections
Each pile was measured and assessed before a single tests was done. This to make sure that
everything was well documented when later in the process properties were uncertain and to
be able to show what the state of the material used was. In appendix V the documentation of
the piles can be found.
Visual inspection and probing
Each pile is assessed with a basic probing tool with an area of 3*3mm. Each pile is probed at
the same locations where later also IML-Resi measurements will be taken. The result of this
test can be found in appendix VI and consists of a probing depth, the corresponding IML-Resi
measurement number and the height of the degradation over the surface of the pile.
IML-Resi measurements
Standard procedure is that for each pile 8 IML-Resi measurements are taken. Four at the top at
approximately 50mm from the top and four measurements at the same location, but then about
950mm from the top. The trajectories of the measurements are assumed to be towards the
centre of the pile. This is made visual in appendix VIII and the assumed trajectory is indicated.
CT scanning
Results of the CT scanning are difficult to show in a paper, because of the 3d output of the
scanner. Pictures taken from these scans are used in the analysis.
Compression tests
The results of all the compressive tests are added in appendix X. In these tables also some
properties of the test pieces are stated. For each piece the dimensions, the moisture content,
the ratio between height and length, the critical area, the density and the ultimate stress is
stated.

CHAPTER FOUR
ANALYSIS

Delft University of Technology
39 Master of Science thesis E.C.W. Schreurs
4.1 VISUAL INSPECTION AND PROBING
The visual inspection gives very rough estimates of the outer degradation of the pile. The
probing depth will be compared with the degradation at the surface as has been measured with
the IML-Resi.
Table 4.1 Comparison IML-Resi measurement with probing
Mnr [#]
D Rg [mm]
D pr [mm]
Mnr [#]
D Rg [mm]
D pr [mm]
Mnr [#]
D Rg [mm]
D pr [mm]
370 20 10 401 2 2 348 5 3 372 0 5 403 1 2 350 2 3 374 0 0 405 1 0 409 35 20 376 20 0 408 5 2 412 25 25 371 0 0 362 35 20 414 30 10 373 0 0 364 40 10 416 30 2 375 0 0 366 25 10 410 2 4 377 0 0 368 30 20 413 2 0 351 40 0 363 2 0 415 2 0 353 5 0 365 2 0 417 0 0 354 40 13 367 2 0 378 20 >20 359 20 2 369 5 0 387 0 0 352 0 0 339 15 10 389 10 10 356 0 0 342 2 0 391 20 20 358 0 0 344 2 5 380 0 5
360 10 0 347 4 3 388 5 0
400 Total >30 349 10 3 390 2 0
402 Total 10 340 2 0 393 10 5
406 Total >30 343 0 0
407 Total >30 346 5 5
Mnr: Measurement number IML-Resis D Rg: Degradation depth measured with the IML-Resi D pr: Degradation depth measured with probing
The comparison shows large differences between the accuracy of the probing. This might be
because of the extent to which the timber is degraded. The timber needs to be degraded very
heavily to be able to penetrate it with the probing tool. When this is the case probing gives a
good indication into the degradation depth. This can for instance be seen in measurements 400,
402, 406 and 407. However when the timber is degraded slightly probing leads to little
penetration depth.
Another difference occurs when there is a small peek in the resistance at the surface of the pile.
This seems to be the case very often and can be seen in the IML measurements. For instance in
figure 4.1

Delft University of Technology
40 Master of Science thesis E.C.W. Schreurs
Figure 4.1 IML-Resi measurement 406
In general probing can be used to decide where it is wise to take IML-Resi measurements. It
can also give an indication of the pattern in which the degradation is affecting the pile.

Delft University of Technology
41 Master of Science thesis E.C.W. Schreurs
4.2 IML-RESI TESTING
To determine the optimal feed and drilling speed to use in the resistance drilling. IML-Resi
tests have been done, the results can be found in Appendix VIII. The IML-Resi has two motors,
one for the rotating motion and one for the penetrating motion, both motors measure the
power they have to apply. In the output this is displayed as a number between 0 and 1
indicating how much of the total power is needed.
At first IML-Resi measurements have been done to identify the most appropriate feed speed
and drilling speed.
At first the optimum drilling speed was determined. The results can be seen in figure 17.1.
Figure 4.2 Difference between variating the drilling speed

Delft University of Technology
42 Master of Science thesis E.C.W. Schreurs
When the drilling speed is increased the pattern remains the same. However the increased
drilling speed leads to a decrease in the resistance the IML-Resi undergoes when penetrating
the wood. The peaks in the graph flatten out making it more difficult to see differences in the
resistance needed.
For the feed speed the same procedure has been done. Increasing the feed speed changes the
results, this can be seen in figure 17.2. With a higher feed speed the general shape of the graph
remains the same, however the boundary when there is a change in feed resistance becomes
less acute which makes it more difficult to define the affected area.
Ideally both the drilling graph and the feed graph do not differ. When this is the case the output
graph fully displays timber properties and is not influenced by measurements errors. The best
results have been acquired with the settings for the IML-Resi as 1500r/min and 50cm/min.
Figure 4.3 Difference between variating the feed speed

Delft University of Technology
43 Master of Science thesis E.C.W. Schreurs
4.3 CT SCAN ANALYSIS
Timber anatomy
CT scanning gives information about the timber anatomy. In figure 18.1 all different properties
which can be seen are indicated.
Figure 4.4 Timber properties which can be identified with CT scanning

Delft University of Technology
44 Master of Science thesis E.C.W. Schreurs
Drying cracks can be distinguished from other cracks due to the lack of degradation in the
cracked surface all cracks which were presently present in the ground have degradation marks
on the surface of the crack. The juvenile wood can also be distinguished, because of the lower
density of the juvenile wood it appears lighter in the scan. Making it possible to check the
equation to estimate the heartwood amount as found in the literature study. This equation and
the result can be seen in table 18.1.
𝐻𝑊𝑁𝐵𝑅 = 0.6614×𝑎𝑔𝑒 − 11.077
HWNBR= Number of heartwood rings
Age = Count of total growth rings
Table 4.2 Checking HWNBR equation
CHECKING EQUATIONS
AGE HWNBR IN CT HWNR EQUATION
PILE 1 58 25 27 PILE 5 51 24 23
The equation seems to come to very good estimates of the heartwood content in the timber.
This is important, because in both scanned piles the degradation occurs different for the
heartwood and sapwood part of the cross section.
The scan in figure 18.1 is taken after the IML-Resi tests so it also shows the drilling trajectory.
The mechanical damage is probably caused by the sawing of the pile head during the
foundation renewal.

Delft University of Technology
45 Master of Science thesis E.C.W. Schreurs
Degradation patterns
To get more insights into the progression of the degradation a cross section 200mm below the
top of the pile will be compared with a cross section 30mm below the pile top. Taking a scan
from 200mm and 30mm can give an idea about the growth pattern fungi follow when
degrading timber. Because lowering water levels is the cause of the degradation it can be
assumed the degrading starts at the top of the pile. And goes along as the water level keeps
dropping. Analysing the degradation from the bottom to the top gives an idea of how the degradation progresses over time.
Figure 4.6 Degradation growth pile 5
3
Figure 4.5 Degradation growth pile 1
1
2

Delft University of Technology
46 Master of Science thesis E.C.W. Schreurs
In pile 1, figure 18.2, the progression of the degradation can be seen the degradation pattern
looks a lot like the ring pattern which most calculation models use. There are exceptions,
because some degradation depend on the local geometry for example the area indicated as 1.
The pattern here almost goes to the pit of the pile. Most likely this is caused by a screw which
has been screwed in at this location in the past which makes it easier for the degradation to
penetrate the timber. The degradation labelled as 2 does not start at the surface of the pile, but
has developed from the top and is about 100mm deep. The exact cause for this degradation is
not known, but is likely to be caused by a local crack.
In pile 5, figure 18.3, another degradation pattern appears. This degradation does not follow a
uniform pattern. It probably started in an odd pattern, because of cracks which were present
in the timber, this can for example be the case at the location labelled as 3. When comparing
the degradation with the cross section closer to the top this degradation disappears because
the crack is just local and does not reach the top. In general the degradation of this pile started
as irregular fungal penetrations into the timber after this patterns has reached the heartwood
boundary they start to grow towards each other resulting in a totally degraded sapwood part
and it seems the heartwood is not affected until the sapwood is totally degraded. However it
has to be noted that the degradation is not a full ring and even at the surface of the pile there
are parts left unaffected.

Delft University of Technology
47 Master of Science thesis E.C.W. Schreurs
4.4 VERIFICATION RESULTS IML-RESI WITH CT SCAN
To verify to which detail the IML-Resi can measure the internal properties of timber piles the
images of the CT scanner are compared with the output of the IML-Resi. There have been made
scans of three parts of the cross section, namely from pile 1 the head and from pile 5 the head
and bottom peace. In these scans the trajectories of the IML-Resi can clearly be seen. The
different shades of grey relate to different densities of the material scanned. The darker the
shade the less dense the material.
What clearly can be seen in the graphs from the IML-Resi are the year rings of the tree which
consist of a latewood part and an early wood part, both have different densities. At the end of
each graph irregularities can be seen. This is because it is nearly impossible to drill into the
centre of the round wood exactly. The smaller radius of the inner year rings lead to longer
drilling paths into late or early wood which interrupts the periodic behaviour of the graph
slightly.
There are other properties that can be detected with IML-Resi measurements for example:
knots, cracks, degradation and the juvenile boundary. In the following figures the IML-Resi
output is displayed on top of the CT scans of pile 1 and 5.

Delft University of Technology
48 Master of Science thesis E.C.W. Schreurs
Figure 4.7 Pile 5 head IML-Resi combined with CT-scan
At the juvenile wood boundary a red circle indicates a clear drop in the graph this circle corresponds well with the CT measurement. At the drop of the graphs a different shade of grey
can be identified which corresponds with a lower density of the timber. In the comparison
between IML-Resi measurements and the CT scan it is clear that the IML-Resi can detect cracks
in the timber, these are indicated with a purple line. However other effects can also let the IML-
Resi output drop to 0. For instance in measurement 340 at approximately 90 mm there is a
drop to almost 0. The CT scan shows no crack at this location. So these sudden drops can also
occur when passing an extremely soft early wood ring.

Delft University of Technology
49 Master of Science thesis E.C.W. Schreurs
Figure 4..8 Pile 5 bottom IML-Resi combined with CT-scan
Clear degradation areas have been indicated with a yellow area. In these areas a clear drop in
the resistance measured can be seen. This corresponds well with the different densities the CT
scan show. The indicated blue area corresponds with an abnormality in the graph which can’t
be found at the corresponding area in the CT scan. Compressive testing will be used to analyse
if the abnormality can be seen in the corresponding strength.
The IML-Resi can also detect internal knots in the timber. For instance in measurement 348 at
the end a large increase in the resistance can be seen. This is because of the knot at that location.
However when doing residual strength calculations knots do not have a lot of influence on the
total strength, so this won’t be investigated further.

Delft University of Technology
50 Master of Science thesis E.C.W. Schreurs
Figure 4.9 Pile 5 bottom IML-Resi combined with CT-scan
IML-Resi measurements can give a lot of insides into the internal condition of timber foundation piles. In the tested piles all the cracks which were detected by the IML-Resi were drying cracks due to the storage in a climate room with 65% RH and 20⁰C. In the ground the moisture content of the timber will be a lot higher and drying cracks will not occur to such extend. For detecting degradation however clear drops in the total profile can be seen. So the average value of the IML-Resi drops significantly.

Delft University of Technology
51 Master of Science thesis E.C.W. Schreurs
4.5 SIZE EFFECT IN COMPRESSION TESTS
According to NEN-EN 408 the test pieces have to have a height of 6 times the smaller cross
section. Because all test samples used in these tests have different lengths the influence of the
height on the ultimate strength will be tested. Some samples have been tested which were
higher than the regular pieces and were from the same location in the pile only higher. In table
3.2 the dimension of the tested pieces are shown.
Table 4.3 Test pieces properties for size effect
Code [#]
Ratio H/L [-]
Ultimate strength [N/mm2]
Code [#]
Ratio H/L [-]
Ultimate strength [N/mm2]
B 4.1 5.4 47.95 C 4.1 7.5 43.48 B 4.2 5.7 43.63 C 4.2 7.6 42.56 B 4.3 5.6 44.38 C 4.3 7.6 43.43 B 4.4 6.3 36.57 C 4.4 7.6 41.26 B 4.5 5.5 30.17 C 4.5 7.5 30.69 B 4.6 5.6 43.15 C 4.6 7.5 40.56 B 4.7 5.7 37.75 C 4.7 7.5 28.47 B 4.8 5.4 12.71 C 4.8 7.5 39.04 B 4.9 7.5 30.38 C 4.9 7.6 33.63 B 4.10 5.4 43.82 C 4.10 7.5 38.82 B 4.11 5.8 21.90 C 4.11 7.5 20.37 B 4.12 6.1 23.98 C 4.12 7.4 43.43
For the test pieces were the code of the sample ends with a 4,7,8 or 12 the test pieces are
excluded from the comparison, because of the clear difference in degradation patterns. When
the strength of the B pieces is compared with the strength of the C pieces ideally the line y=x
would be a match with the trend line. Figure 20.1 this comparison is shown.

Delft University of Technology
52 Master of Science thesis E.C.W. Schreurs
Figure 4.10 Size effect on compression strength
As can be seen the small size differences do not have an influence on the compression strength.
A R2 of 0.908 is very high for timber. When the size ratio differentiates more than it did in this
test the size effect has to be evaluated again.
y = 0,9549xR² = 0,908
0,00
5,00
10,00
15,00
20,00
25,00
30,00
35,00
40,00
45,00
50,00
0,00 10,00 20,00 30,00 40,00 50,00 60,00Co
mp
ress
ion
str
engt
h C
sam
ple
s [N
/mm
2 ]
Compression strength B samples [N/mm2]

Delft University of Technology
53 Master of Science thesis E.C.W. Schreurs
4.6 COMPRESSION TESTS
The compression tests have let to results regarding the residual strength. It is important to
relate these results to the IML-Resi measurements. This way predictions can be made to
estimate the residual strength of in use timber piles.
At first the test pieces which were on a trajectory of a IML-Resi measurement will be evaluated.
The average of the IML-Resi measurement at the location of the test piece will be compared
with the measured ultimate strength.
Degradation classes
For the compression tests a visual subdivision
based on degradation is made. This is done to
be able to quantify the degradation. The
degradation is divided into 4 categories based
on a visual subdivision of the cross sections in
figure 21.2 the build up towards the middle of
a pile can be seen together with the regions
which are associated with a certain
degradation, namely 0,1,2 or 3. Different
degradation classes, DC, can exist in one test
piece. Leading to different percentages per
class. During the analysis the degradation
class of these pieces will be the weighted
average of these classes. For instance the
piece in Figure 21.1 it consist of
approximately 25% DC 0 and 75% DC 1,
resulting in a degradation class of 0.75.
Figure 4.12 Degradation classes
3 0 1 2
Figure 4.11 Different degradation in a single piece
25%
DC 0 75%
DC 1

Delft University of Technology
54 Master of Science thesis E.C.W. Schreurs
Relation density to compression strength
A widely used and acknowledged parameter to predict compression strength and timber
strength in general is the density. In figure 21.3 the density has been plotted against the
compression strength for the samples tested.
Figure 4.13 Strength density relation for all samples
It can be seen there is a reasonable correlation between the two parameters. The density can
be used to predict the compression strength of timber piles, however taking boring samples to
be able to determine the density of in use timber piles is an invasive procedure, because every
boring hole leaves a weakness in the pile where degradation can penetrate the timber to great
depth.
The resistance measurement is developed to be a measurement method to predict the density
of timber. If the measurement is compared to the density the following graph is obtained.
Figure 4.14 Relation resistance with density
R² = 0,6937
0,00
10,00
20,00
30,00
40,00
50,00
60,00
0 100 200 300 400 500 600
Co
mp
ress
ion
str
engd
th [
N/m
m2 ]
Density [kg/m3]
Density - Strength
R² = 0,6162
0
100
200
300
400
500
600
0 0,02 0,04 0,06 0,08 0,1 0,12 0,14 0,16 0,18 0,2
Den
sity
[kg
/m3
]
Resistance Ω
Resistance - Density

Delft University of Technology
55 Master of Science thesis E.C.W. Schreurs
Relation degradation class with compression strength
Relating the newly defined degradation classes with the measured compression strength gives
insights into the strength and degradation that occurs in piles which have been in use for 114
years.
In figure 21.4 the degradation class will be plotted against the compression strength for all the
test samples.
Figure 4.15 Degradation classes related to compression strength
A clear decline can be seen in compression strength. However the scatter is great and when a
pile is in use this method cannot be used to estimate the remaining strength. Probability
density functions for the degradation classes can be seen in figure 3.17. There is a great overlap
between the different degradation classes. This makes it impossible to use these visual classes
to predict the remaining strength of timber.
Figure 4.16 Probability density functions degradation classes
0,00
5,00
10,00
15,00
20,00
25,00
30,00
35,00
40,00
45,00
50,00
0 0,5 1 1,5 2 2,5 3
Co
mp
ress
ion
str
engt
h [
N/m
m2 ]
Degradation class
Degradation class - Strength
0
0,02
0,04
0,06
0 10 20 30 40 50 60
Pro
bab
ility
Compressive strength [N/mm2]
Probability density functions DC's
Class 0
Class 1
Class 2
Class 3

Delft University of Technology
56 Master of Science thesis E.C.W. Schreurs
Relation IML-Resi measurements to compression strength
If the IML-Resi measurement can be related to the compression strength it is possible to make
predictions about the strength of a pile without intervening with the structural properties of
the pile. In figure 21.5 This has been done for the piles which have been used during this study.
It can be seen there is a correlation between the compression strength and the IML-Resi
measurement. This correlation is not very strong, but it can be used to make predictions if some
adjustments are made. The trend line which is generated using the test data gives a line which
follows:
σ𝑐 = 179,89 + 10,347 Equation 21.1 σc = Compression strength
= Resistance
If we use the slope of this line and use this slope combined with the fact that we need to go
through the origin of the graph we get the equation:
σ𝑐 = 180 Equation 21.2
Plotting this line in the strength-resistance graph gives a safe approximation of the
compression strength of the timber as can be seen in figure 21.8.
y = 179,89 + 10,347R² = 0,6166
0,00
5,00
10,00
15,00
20,00
25,00
30,00
35,00
40,00
45,00
0 0,02 0,04 0,06 0,08 0,1 0,12 0,14 0,16 0,18 0,2
Co
mp
ress
ion
str
engt
h N
/mm
2
Resistance
Resistance - Strength
Figure 4.17 Compression strength related to resistance measurement

Delft University of Technology
57 Master of Science thesis E.C.W. Schreurs
Figure 4.18 Comparison compression strength and resistance measurement with lowered trend line
The lowered trend line is below 97.65% of the data points. This makes the lowered line a safe
method for prediction the remaining strength of a pile.
Relation IML-Resi measurements to modulus of Elasticity
To calculate the deformations of foundations it is important to know the Modulus of Elasticity,
MOE. As figure 21.9 shows the IML-Resi doesn’t give a reliable relation between the resistance
measured and the MOE.
Figure 4.19 Comparison MOE to resistance measurement
There is however a difference between the MOE of degraded timber and intact timber. For this
reason two MOE are defined. The 5% value is taken according to the test done giving the MOE
of table 3.3.
Table 4.4 MOE tested timber
Modulus of Elasticity [N/mm2]
Non-degraded 12500 Degraded 4300
y = 179,89 + 10,347R² = 0,6166
y = 180
0,00
5,00
10,00
15,00
20,00
25,00
30,00
35,00
40,00
45,00
0 0,05 0,1 0,15 0,2 0,25
Co
mp
ress
ion
str
engt
h N
/mm
2
Resistance
Resistance - Strength
y = 2E-06x + 0,0327R² = 0,2386
0
0,05
0,1
0,15
0,2
0 10000 20000 30000 40000 50000 60000
Res
ista
nce
Ω
MOE N/mm2
Degraded
Non-Degraded
Lineair (All)

Delft University of Technology
58 Master of Science thesis E.C.W. Schreurs
4.7 MODELLING REMAINING STRENGTH
Goal of all experiments was to develop a model to predict remaining strength of in use timber
piles. For this model a combination will be used from experiments which can be used with in
use timber piles foundations.
The following method will be advised to use. It combines the results of this study to a working
solution to be used in practice. In appendix III it can be seen in which part of the current
foundation assessment method this solution can be implemented.
The residual strength determination follows a new procedure which we will elaborate in this
chapter. Figure 22.1 shows graphically the different steps which need to be followed.
Figure 4.20 Calculation procedure
At first probing will be used to determine the presence of degradation and to determine the
pattern at which the degradation is developing in the pile. The degradation can develop in two
different ways. The ring patters, where the degradation forms a kind of uniform ring of

Delft University of Technology
59 Master of Science thesis E.C.W. Schreurs
degradation which progresses to the middle of the pile or the degradation can grow several
degradation shapes which degrade only certain areas of the timber. Both patterns can be seen
in figure 4.21
Figure 4.21 Calculation models
When the degradation pattern has been determined, or at least the places where degradation
occurs from the surface of the pile. The resistance drilling can be started. It is advised that for
each pile standard 4 IML-Resi measurements will be done, which go through the centre of the
pile. This has as an advantage that it can be easily checked if the resistance measurement goes
through the centre of the pile.
The information gathered at this point is enough to determine the residual strength of the
timber pile. All that is left to do is to analyse the measurements. This has to be done by the
following procedure.
At first the heartwood zone has to be determined from the resistance measurement. This can
be done visually, a clear drop in the graph can be seen. Or this can be done using the formula
in paragraph 9. The second step in this analysis is to check whether the resistance drilling gives
the same degradation pattern as was expected by the probing, if this is not the case this has to
be adjusted.
At this point depending on the degradation pattern evaluated in the IML-Resi measurements a
model has to be made to determine the residual strength of the cross section.
To model the degradation inside the pile the IML-Resi measurements are used. For each
measurement areas are defined with clear uniform output values. These areas are then
extended over the area of the pile at the location of the IML-Resi measurement. The IML-Resi
output then is related to the residual strength as defined in chapter 21. Then taking into
account the safety factors from chapter 6 the equation for the residual strength becomes
equation 4.7.1.
z 𝑅ℎ𝑤 R
𝐴𝑟𝑒𝑎𝑑𝑒𝑐,𝑖
𝐴𝑟𝑒𝑎ℎ𝑤
𝐴𝑟𝑒𝑎𝑠𝑤
Ring pattern Non-uniform pattern

Delft University of Technology
60 Master of Science thesis E.C.W. Schreurs
𝐹𝑐 = (∑ (180Ω𝑑𝑒𝑐,𝑖)𝐴𝑟𝑒𝑎𝑑𝑒𝑐,𝑖𝑛𝑖=1 + (180𝑠𝑤)𝐴𝑟𝑒𝑎𝑠𝑤 + (180𝑠𝑤)𝐴𝑟𝑒𝑎ℎ𝑤) ∙
𝑘𝑚𝑜𝑑
𝛾𝑚 Eq 4.7.1
𝐹𝑐 = 𝐶𝑜𝑚𝑝𝑟𝑒𝑠𝑠𝑖𝑣𝑒 𝑠𝑡𝑟𝑒𝑛𝑔𝑡ℎ
𝑑𝑒𝑐,𝑠𝑤,ℎ𝑤 = 𝐴𝑣𝑒𝑟𝑎𝑔𝑒 𝑟𝑒𝑠𝑖𝑠𝑡𝑎𝑛𝑐𝑒 𝑜𝑣𝑒𝑟 𝐼𝑀𝐿 − 𝑅𝑒𝑠𝑖 𝑡𝑟𝑎𝑗𝑒𝑐𝑡𝑜𝑟𝑦 𝑑𝑒𝑐𝑎𝑦𝑒𝑑, 𝑠𝑎𝑝𝑤𝑜𝑜𝑑 𝑜𝑟 ℎ𝑒𝑎𝑟𝑡𝑤𝑜𝑜𝑑
𝐴𝑟𝑒𝑎𝑑𝑒𝑐,ℎ𝑤,𝑠𝑤 = 𝐴𝑟𝑒𝑎 𝑑𝑒𝑐𝑎𝑦𝑒𝑑, 𝑠𝑎𝑝𝑤𝑜𝑜𝑑 𝑎𝑛𝑑 ℎ𝑒𝑎𝑟𝑡𝑤𝑜𝑜𝑑 𝑝𝑎𝑟𝑡
𝑘𝑚𝑜𝑑 = 𝑘𝑚𝑜𝑖𝑠𝑡 ∙ 𝑘𝑡𝑖𝑚𝑒
𝛾𝑚 = 1.23
The area of each identified IML-Resi region can be calculated using the equation 4.7.2.
𝐴𝑟𝑒𝑎 = %𝐶𝐹 ∙ ((𝑅𝑎𝑑𝑖𝑢𝑠 − 𝐷𝑒𝑔𝑠𝑡𝑎𝑟𝑡)2 − (𝑅𝑎𝑑𝑖𝑢𝑠 − 𝐷𝑒𝑔𝑒𝑛𝑑)2) Eq 4.7.2
%𝐶𝐹 = 𝑃𝑒𝑟𝑐𝑒𝑛𝑡𝑎𝑔𝑒 𝑜𝑓 𝑡ℎ𝑒 𝑐𝑖𝑟𝑐𝑢𝑚𝑓𝑒𝑟𝑒𝑛𝑐𝑒 𝑐𝑜𝑣𝑒𝑟𝑒𝑑 𝑏𝑦 𝑡ℎ𝑒 𝐼𝑀𝐿 − 𝑅𝑒𝑠𝑖 𝑚𝑒𝑎𝑠𝑢𝑟𝑒𝑚𝑒𝑛𝑡
𝐷𝑒𝑔𝑠𝑡𝑎𝑟𝑡,𝑒𝑛𝑑 = 𝐷𝑒𝑝𝑡ℎ 𝑜𝑓 𝑑𝑒𝑔𝑟𝑎𝑑𝑎𝑡𝑖𝑜𝑛 𝑠𝑡𝑎𝑟𝑡 𝑜𝑟 𝑒𝑛𝑑
This equation becomes more clear in chapter 5.1 where an example calculation is made.

Delft University of Technology
61 Master of Science thesis E.C.W. Schreurs
4.8 SERVICE LIFE PREDICTION
To make service life predictions after the calculation of the remaining strength of the pile it is
important to know the rate at which the pile degrades over time. In this thesis no research has
been done into the degrading speed of timber piles. However it is possible to predict the
degradation of the pile over time if some additional measurements are taken. A good method
would be to monitor the piles in Rotterdam by doing periodic testing on the timber piles. The
interval between these measurements have to be related to the residual strength of the pile.
Ideally this gives an indication of the rate of degradation of the piles and it can give insights
into measures to stop the degradation of the piles. For instance a degraded pile stops degrading
when the pile is submerged again so one can measure the effect of sewer repair.

CHAPTER FIVE
CONCLUSION
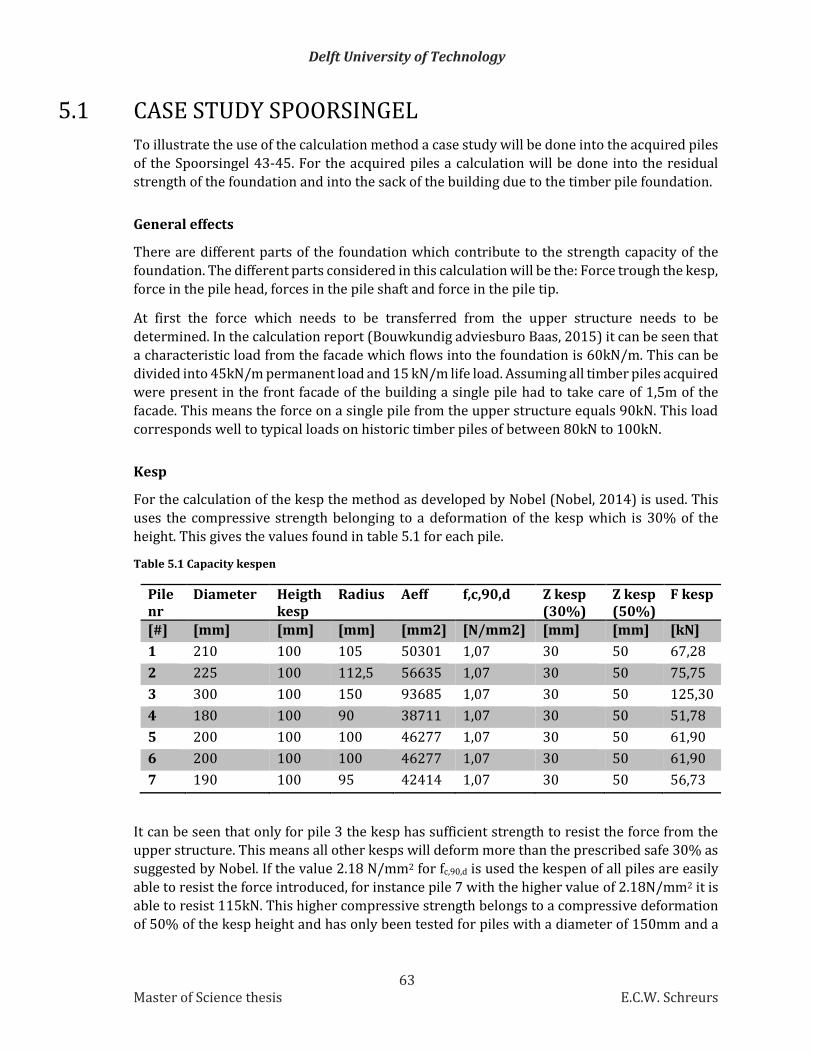
Delft University of Technology
63 Master of Science thesis E.C.W. Schreurs
5.1 CASE STUDY SPOORSINGEL
To illustrate the use of the calculation method a case study will be done into the acquired piles
of the Spoorsingel 43-45. For the acquired piles a calculation will be done into the residual
strength of the foundation and into the sack of the building due to the timber pile foundation.
General effects
There are different parts of the foundation which contribute to the strength capacity of the
foundation. The different parts considered in this calculation will be the: Force trough the kesp,
force in the pile head, forces in the pile shaft and force in the pile tip.
At first the force which needs to be transferred from the upper structure needs to be
determined. In the calculation report (Bouwkundig adviesburo Baas, 2015) it can be seen that
a characteristic load from the facade which flows into the foundation is 60kN/m. This can be
divided into 45kN/m permanent load and 15 kN/m life load. Assuming all timber piles acquired
were present in the front facade of the building a single pile had to take care of 1,5m of the
facade. This means the force on a single pile from the upper structure equals 90kN. This load
corresponds well to typical loads on historic timber piles of between 80kN to 100kN.
Kesp
For the calculation of the kesp the method as developed by Nobel (Nobel, 2014) is used. This
uses the compressive strength belonging to a deformation of the kesp which is 30% of the
height. This gives the values found in table 5.1 for each pile.
Table 5.1 Capacity kespen
Pile nr
Diameter Heigth kesp
Radius Aeff f,c,90,d Z kesp (30%)
Z kesp (50%)
F kesp
[#] [mm] [mm] [mm] [mm2] [N/mm2] [mm] [mm] [kN]
1 210 100 105 50301 1,07 30 50 67,28
2 225 100 112,5 56635 1,07 30 50 75,75
3 300 100 150 93685 1,07 30 50 125,30
4 180 100 90 38711 1,07 30 50 51,78
5 200 100 100 46277 1,07 30 50 61,90
6 200 100 100 46277 1,07 30 50 61,90
7 190 100 95 42414 1,07 30 50 56,73
It can be seen that only for pile 3 the kesp has sufficient strength to resist the force from the upper structure. This means all other kesps will deform more than the prescribed safe 30% as
suggested by Nobel. If the value 2.18 N/mm2 for fc,90,d is used the kespen of all piles are easily
able to resist the force introduced, for instance pile 7 with the higher value of 2.18N/mm2 it is
able to resist 115kN. This higher compressive strength belongs to a compressive deformation
of 50% of the kesp height and has only been tested for piles with a diameter of 150mm and a

Delft University of Technology
64 Master of Science thesis E.C.W. Schreurs
kesp height of 70mm. The total deformation contributed to the kesp is for this reason assumed
to be between 30 to 50% of the kesp height.
Pile head
To calculate the residual strength and the Modulus of Elasticity of the timber pile head the
properties of the cross section need to be determined. For each pile the decayed area and the
properties belonging to these areas need to be determined. This needs to be done following the
equations 4.7.1 and 4.7.2.
For pile 5 the calculation will be displayed step by step. For the other piles only the results will
be shown.
In figure 5.1 the actual degradation pattern of
pile 5 can be seen. However in practice the
exact resistance drilling trajectories are not
know and it is assumed all go exactly through
the middle. If we use the method from chapter
22 to calculate the residual strength. It has to
be noted that in the method advised 8
resistance measurements will be done, which
makes it possible to determine the
degradation patterns with a higher accuracy.
At first the determination of the heartwood
zone is done. This can be done with the
equation found in chapter 9. For pile 5 this
boundary is determined 50mm from the
outside of the pile. In figure 5.2 all
assumptions based on the developed test
method will be modelled.
For each of the other piles the results can be found in appendix VIII.
Table 5.2 Residual strength
Pile nr Residual Strength
Safety factor Residual Strength
Design
[#] [kN] [kmod/γm] [kN]
1 972 0,38 369
2 312 0,38 118
3 76 0,38 29
4 612 0,38 232
5 431 0,38 163
6 416 0,38 158
7 396 0,38 150
342
349 Figure 5.1 Actual degradation pattern pile 5

Delft University of Technology
65 Master of Science thesis E.C.W. Schreurs
In table 5.2 the material and modification factors from NEN-EN 1995-1-1 are used, this because
the tests haven’t let to indications that the factors used in modern day calculations lead to over
estimation of the timber properties.
The deformation of the piles head can be estimated using the Modulus of Elasticity for degraded
timber for the entire top 1 meter of the pile. The result is small and this is not the real
deformation of the pile head. Degraded timber which is loaded up to failure will collapse onto
the functioning fibres. This makes the calculation of the pile head deformation not linear elastic.
𝑍𝑝𝑖𝑙𝑒 ℎ𝑒𝑎𝑑 =90000 ∙ 1000
𝐸𝑑𝑒𝑔 ∙ 𝜋 ∙125
2
2 = 1.7 𝑚𝑚 => 2𝑚𝑚
𝐸𝑑𝑒𝑔 = 4300𝑁/𝑚𝑚2
Geotechnical considerations
Three effects depend on the geotechnical situation at the site. Negative skin friction, positive
skin friction and the capacity of the pile tip. Based on the cone penetration test which can be
found in Appendix II a ground profile has been drawn up which leads to the values in table 5.3
for the geotechnical effects.
Table 5.3 Geotechnical strength
Effect Force [kN]
Negative skin friction 142.72
Positive skin friction 84.82
Geotechnical pile tip capacity 122.72
Capacity left 64.82
Using these values it has to be noted that the piles are assumed to be driven two meters deep
into the sand layer. This value however is a guess. There is no actual information available
regarding the driving depth.
When adding the force from the upper structure which is 90kN the geotechnical capacity is not
sufficient. This means the pile will start to sink into the sand layer until it develops enough
positive skin friction to resist the additional load. Under the current assumptions this
additional sack will be 590mm. However this value is highly uncertain because of the
uncertainty regarding the driving depth.
Noted has to be this is not an effect depended on the timber properties and just used as a
comparison what the influence of the geotechnical properties can be.

Delft University of Technology
66 Master of Science thesis E.C.W. Schreurs
Timber pile
Below the pile tip the shortening of the pile needs to be calculated and the compressive stress
at the tip of the pile has to be checked.
The shortening of the pile can be estimated considering the pile as a bar under the influence of
a compressive force. This means the pile shortens by:
𝑍𝑠ℎ𝑜𝑟𝑡𝑒𝑛𝑖𝑛𝑔 =(90000 + 142720) ∙ 18000
𝐸𝑛𝑜𝑛 𝑑𝑒𝑔 ∙ 𝜋 ∙125
2
2 = 14𝑚𝑚
𝐸𝑛𝑜𝑛 𝑑𝑒𝑔 = 12500𝑁/𝑚𝑚2
The compressive stress at the tip of the pile can easily be calculated using the force applied
multiplied by 1,2 assuming most of this force is permanent over the area of the pile tip. This
gives:
𝜎𝑝𝑖𝑙𝑒,𝑡𝑖𝑝 =90 ∙ 1.2 + 142.72 − 84.82
14 ∙ 𝜋 ∙ 1252
= 13.5 𝑁/𝑚𝑚2
Based on the compressive capacity of sound timber acquired during the testing of the pile. A
healthy pile should be able to resist this stress.
Remaining strength and deformation
The total deformation and capacity of the foundation has been calculated. The total
deformation is build up from all the parts of the foundation. In an equation his would look
like:
𝑍𝑡𝑜𝑡 = 𝑍𝑘𝑒𝑠𝑝 + 𝑍𝑝𝑖𝑙𝑒 ℎ𝑒𝑎𝑑 + 𝑍𝑝𝑖𝑙𝑒 𝑠ℎ𝑎𝑓𝑡 + 𝑍𝑠ℎ𝑜𝑟𝑡𝑒𝑛𝑖𝑛𝑔
The different parts have been calculated and some effects contribute significantly more than
others which can be seen in table 5.4.
Table 5.4 Different distributions to foundation deformation
Deformation Contribution [%] Z [mm]
𝒁𝒌𝒆𝒔𝒑 76 50
𝒁𝒑𝒊𝒍𝒆 𝒉𝒆𝒂𝒅 3 2
𝒁𝒔𝒉𝒐𝒓𝒕𝒆𝒏𝒊𝒏𝒈 21 14
𝒁𝒕𝒐𝒕 100 66
Deformation Z [mm]
𝒁𝒏𝒆𝒈𝒂𝒕𝒊𝒗𝒆 𝒔𝒌𝒊𝒏 𝒇𝒓𝒊𝒄𝒕𝒊𝒐𝒏 590

Delft University of Technology
67 Master of Science thesis E.C.W. Schreurs
It can be seen that negative skin friction can contribute the most to sacking of a timber
foundation. However this depends on the driving depth and the soil conditions on each site.
The large influence of the geotechnical properties does not mean the timber properties can be
neglected, because the residual strength of the pile foundation depends on the weakest part
of the foundation which can differ in each situation.
For example it is found that degraded piles can reach very low residual strengths causing the
pile head to collapse which will lead to deformations caused by the collapsing of degraded
fibres onto healthy timber fibres.

Delft University of Technology
68 Master of Science thesis E.C.W. Schreurs
5.2 CONCLUSION
With the information provided in this thesis it is possible to answer the sub questions as
defined in chapter 1. The answers to these questions will be provided in this chapter, ultimately
leading up to the answering of the main research question.
1. What type of foundations are used in Rotterdam and what are the techniques and requirements
to install and calculate them.
In Rotterdam the gross of the timber foundations which were used consist of the Rotterdam
foundation type and are made of spruce piles. These piles are between 15 and 20 meters long
and have a taper of 5mm/m.
2. Where is the failing of a timber foundation based on?
The failing of a timber pile foundation is closely related to the failing of the upper structure
which it is supporting. A foundation can fail, however when this does not lead to a lot of damage
in the upper structure it might still be acceptable. This depends on the owners willingness to
accept certain damage to his structure. Three types of damage have been defined to be able to
make damage criteria. These are architectural damage, functional damage and structural
damage. For the municipality only the last one is important, because this leads to direct danger
for people. For all these types of damages damage limits have been defined and can be found in appendix V.
3. What are the failure mechanism which are responsible for the failing of the timber pile
foundations?
Five regions have been defined in which failure can occur due to several reasons in figure 12.1
an overview of these regions can be found. This thesis however has focused on the failure
mechanism which is directly related to the compressive capacity of the timber piles. This
mechanism is mostly caused by biological degradation which occurs when the timber piles are
subjected to the air due to lowering groundwater levels.
4. What existing data is available from comparable research?
Four models have been devised by past research to predict remaining strength of piles which
have been in use, these can be found in chapter 2.8. The method used in practice is the model
devised by Frank Sas(2007). This method uses Pilodyn measurements combined with the
experience gained from proof loaded piles. However from the experiments done in this thesis
it seems that Pilodyn measurements are not accurate enough to determine the degradation
extend of timber piles. Patterns can occur were the degradation is surrounded by sound timber.
With the Pilodyn these can’t be detected, because the pilodyn only measures the outer layer of
the pile. The model from Nicolas Gentner(2014) is the only one which also makes use of non-
uniform degradation patterns and from the CT-scans in this thesis it is proven that this can
occur.

Delft University of Technology
69 Master of Science thesis E.C.W. Schreurs
5. What is the goal of the experiments which need to be done, which data needs to be collected,
which output needs to be acquired and to achieve these things which experiments need to be
conducted?
Ultimate goal of the experiments was to find an alternative method to be able to predict the
remaining strength of in use timber piles. Finding alternative measurement methods to assess
timber piles. The experiments done were visual inspection, probing with a sharp tool,
resistance drilling with the IML-Resi, CT-scanning and ultimately compressive testing of samples.
7. What output can be expected using theoretical models and does the acquired output
corresponds with these values?
Expected was the resistance drilling could be related to the strength of the timber. This is the
case and a model has been made based on this. The growth of degradation in a pile is made
visual through the CT-scans of the pile. In the scanned pile it revealed that over 100 years the
heartwood is still left unaffected by degrading mechanisms. And the growth can occur in two
patterns, the ring pattern and the non-uniform pattern. In both cases the sapwood will degrade
before the heartwood.
During the tests it was found that for the in use non degraded parts of the timber piles the
timber was comparable with new timber. For this reason there it is advised to use the design
strength of timber from the 1995-1-1 and not the adjusted factors according to Stapf and Aicher
(Staph & Aicher, 2012). The kmod and kdef factors as they advised could be more useful when
assessing piles which haven’t been tested with the IML-Resi. When there is more uncertainty
regarding the internal properties of the timber piles .
8. What is the rate of degradation of the tested timber piles and how are they affecting the
remaining strength? Based on this data, what is the remaining service life of the timber pile
foundations in Rotterdam?
Monitoring the loss of timber pile strength is necessarily to give predictions about the service
life of in use timber piles. This can be done by using the assessment method from this thesis
periodically. This to get insights into the rate of strength loss of the piles over time. For now
figure 4.20 can be used to predict the strength during the service life of the pile.

Delft University of Technology
70 Master of Science thesis E.C.W. Schreurs
The answering of these sub questions make it possible to answer of the main research question.
What is the state of the timber foundations regarding the residual strength in the dedicated
foundation risk areas of Rotterdam, can there be made more accurate estimates using certain
parameters and measurement methods.
In Rotterdam it is very specific which foundations are heavily degraded and failing in their
function carrying the above structures. Timber piles which are just meters apart can have
different levels of degradations. For this reason the foundation risk areas as defined by the
municipality of Rotterdam can only be used as a map were timber foundations occur. The risk
as defined in this map are not accurate, because it is just an indexation of were troubles with
timber foundations have occurred and how many of the total timber foundations in these areas
have failed. A better method is to constantly monitor the sag of the structures. This is possible
nowadays and is already done by Rotterdam with the help of satellites. If the sag of the
foundations becomes unacceptable, for instance to the extent of structural damage, the
municipality has to intervene. At this point a foundation inspection has to be done. This has to
be done with the F3O standardised method which can be found in appendix III. Added to this
procedure is the schedule as is found in figure 4.20, which gives advice on how to handle the
inspection in relation to the timber properties. Added in this method is the residual strength
determination as is devised in this thesis. Making use of the IML-Resi to measure the
degradation of timber by drilling. The results of these measurements can accurately be related
to the timber strength with the method used in chapter 4.7. This will lead to better results as it
is the case in the current procedure.

Delft University of Technology
71 Master of Science thesis E.C.W. Schreurs
LITERATURE
Bjerrum, L. (1963). Allowable settlement of structures. Paper presented at the Proceedings of the European conference on soil mechanics and foundation engineering, Wiesbaden.
Bolsma, R., Buma, J., Meerten, H. v., Dionisio, M., & Elbers, J. (2012). Effect van droogte op stedelijk
gebied. Boscardin, M. D., & Cording, E. J. (1989). Building Response to Excavation-Induced Settlement. Journal
of Geotechnical Engineering, 115(1). Bouwkundig adviesburo Baas. (2015). Berekeningsraport: Funderingsherstel Spoorsingel 43/45 te
Rotterdam. Buma, J. T., Stuurman, R. J., Etten, B. D. v., & Jong, J. D. d. (2006). Onderzoek naar funderingsschade door
lage grondwaterstanden in Dordrecht. Burland, J. B., Broms, B. B., & De Mello, V. F. B. (1977). Behaviour of Foundations and Structures. Paper
presented at the 9th International Conference on Soil Mechanics and Foundation Engineering, Tokyo.
Burland, J. B., & Wroth, C. P. (1974). Settlement of buildings and associated damage. Paper presented
at the British Geotechnical Society's Conference on the Settlement of Structures, Cambridge. Causen, C. A. (2010). Biodeterioration of Wood Wood Handbook. Madison, WI: Department of
Agriculture, Forest Service, Forest Products Laboratory. CURNET, & SBR. (2012). Handboek Funderingsherstel Rotterdam. De Lange, S. (2011). Partieel funderingsherstel van woningblokken. (Master), Technical University
Delft, Delft. Derriks, H. (2011). Risico's van het verkeer en vervoer: de beleving van de burger. Farrar, C. R., & Worden, K. (2006). An introduction to structural health monitoring. Philosophical
transactions of the royal society, 13. Fundering, S. P. (Producer). (2006). De Fundering onder uw Woning. Gentner, N. (2014). Estimate of the remaining lifetime of existing timber piles: issues and models. (MSc),
University of Munich, Munchen. Grant, R., Christian, J. T., & Vanmarcke, E. H. (1972). Tolerance of Buildings to Differential Settlements
Massachusetts: Department of Civil Engineering Mass. Institute of Technology.

Delft University of Technology
72 Master of Science thesis E.C.W. Schreurs
Klaassen, R. K. W. M. (2007). Bacterial decay in wooden foundation piles - Patterns and causes: A study of historical pile foundations in the Netherlands. International Biodeterioration & Biodegradation(61), 45-60.
Kuilen, J.-W. G. v. d. (1999). The residual load carrying capacity of timber joints. HERON, 44(3), 27. Kuilen, J.-W. G. v. d. (2006). Service life modeling of timber structures. Materials and Structures, DOI
10.1617. Lantinga, C. (2014). De resterende (geotechnische) draagkracht van bestaande houten
funderingspalen. (MSc), Technical University Eindhoven, Eindhoven. Longuetaud, F., Mothe, F., Leban, J.-M., & Mäkelä, A. (2006). Picea abies sapwood width: Variations
within and between trees. Scandinavian Journal of Forest Research, 21, 12. doi:10.1080/02827580500518632
Mair, R. I., Taylor, R. N., & Burland, J. B. (1996). Prediction of ground movements and assessment of risk
of building damage due to bored tunnelling. Netzel, H. (2009). Building Response Due to Ground Movements. (Phd), Technical University Delft. Nobel, W. (2014). De druksterkte van een kesp. Druk loodrecht op de vezel. (Bachelor), Technical
University Delft, Delft. Pik, J., & Kask, R. (2004). Mechanical Properties of Juvenile Wood of Scots Pine in Myrtillus Forest
Syte Type. Baltic Forestry, 10, 6. Polshin, D. E., & Tokar, R. A. (1975). Maximum allowable non‐uniform settlement of structures. Paper
presented at the 4th International conference of soil mechanics and foundation engineering. Ricceri, G., & Soranzo, M. (1985). An analysis on allowable settlement of structures. Rivista Italiana di
Geotechnica, 4, 177-188. Sas, F. (2007). De houten paalfundering doorgezaagd. Amsterdam Scheffer, T. C. (1982). Microbiological Degradation and the Causal Organisms. In D. D. Nicholas (Ed.),
Wood Deterioration and its Prevention by Preservative Treatments (Vol. 1). New York: Syracuse University Press.
Skempton, A. W., & MacDonald, D. H. (1956). The allowable settlements of buildings. Paper presented
at the Structural and Building division meeting. Stapf, G & Aicher, S (2012). Design Concept for Wooden Pile Foundation based on the Example of an
160 year old stone bridge in Southern Germany. Paper presented at the World Conference on Timber Engineering Auckland, New Zealand.
Van de Kuilen, J. W. G., & Montaruli, N. E. (2008). Timber Structures Service Life Modelling. Paper
presented at the International Conference on Durability of Building Materials and Components Istanbul, Turkey.

Delft University of Technology
73 Master of Science thesis E.C.W. Schreurs
Van Tol, A. F. (1993). Funderingstechnieken: ontwerpaspecten. Delft: TU Delft. Vatovec, M., & Kelley, P. (2007). Biodegradation of Untreated Wood Foundation Piles In Existing
Buildings Part 2 - Deterioration Mechanisms. Structure magazine. Wilhelmsson, L., Arlinger, J., Spångberg, K., Lundqvist, S. O., Grahn, T., Hedenberg, Ö., & Olsson, L.
(2002). Models for Predicting Wood Properties in Stems of Picea abies and Pinus sylvestris in Sweden. Scandinavian Journal of Forest Research, 17:4, 20. doi:10.1080/02827580260138080
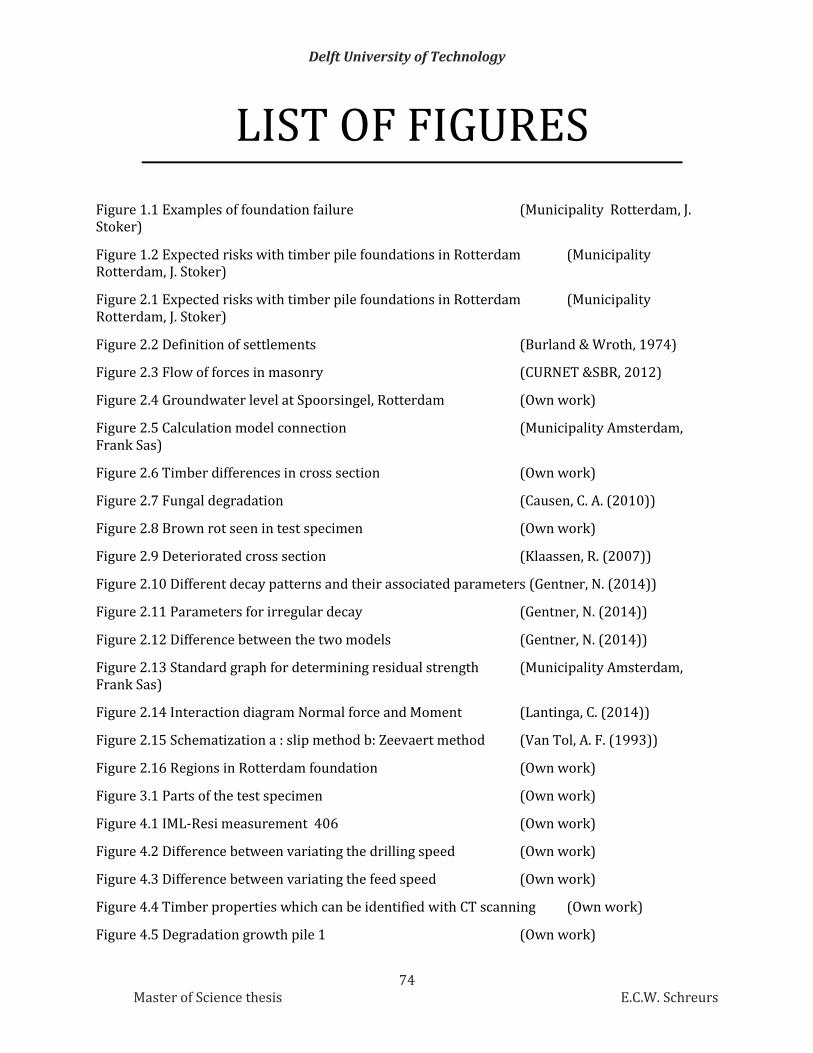
Delft University of Technology
74 Master of Science thesis E.C.W. Schreurs
LIST OF FIGURES
Figure 1.1 Examples of foundation failure (Municipality Rotterdam, J. Stoker)
Figure 1.2 Expected risks with timber pile foundations in Rotterdam (Municipality Rotterdam, J. Stoker)
Figure 2.1 Expected risks with timber pile foundations in Rotterdam (Municipality Rotterdam, J. Stoker)
Figure 2.2 Definition of settlements (Burland & Wroth, 1974)
Figure 2.3 Flow of forces in masonry (CURNET &SBR, 2012)
Figure 2.4 Groundwater level at Spoorsingel, Rotterdam (Own work)
Figure 2.5 Calculation model connection (Municipality Amsterdam, Frank Sas)
Figure 2.6 Timber differences in cross section (Own work)
Figure 2.7 Fungal degradation (Causen, C. A. (2010))
Figure 2.8 Brown rot seen in test specimen (Own work)
Figure 2.9 Deteriorated cross section (Klaassen, R. (2007))
Figure 2.10 Different decay patterns and their associated parameters (Gentner, N. (2014))
Figure 2.11 Parameters for irregular decay (Gentner, N. (2014))
Figure 2.12 Difference between the two models (Gentner, N. (2014))
Figure 2.13 Standard graph for determining residual strength (Municipality Amsterdam, Frank Sas)
Figure 2.14 Interaction diagram Normal force and Moment (Lantinga, C. (2014))
Figure 2.15 Schematization a : slip method b: Zeevaert method (Van Tol, A. F. (1993))
Figure 2.16 Regions in Rotterdam foundation (Own work)
Figure 3.1 Parts of the test specimen (Own work)
Figure 4.1 IML-Resi measurement 406 (Own work)
Figure 4.2 Difference between variating the drilling speed (Own work)
Figure 4.3 Difference between variating the feed speed (Own work)
Figure 4.4 Timber properties which can be identified with CT scanning (Own work)
Figure 4.5 Degradation growth pile 1 (Own work)
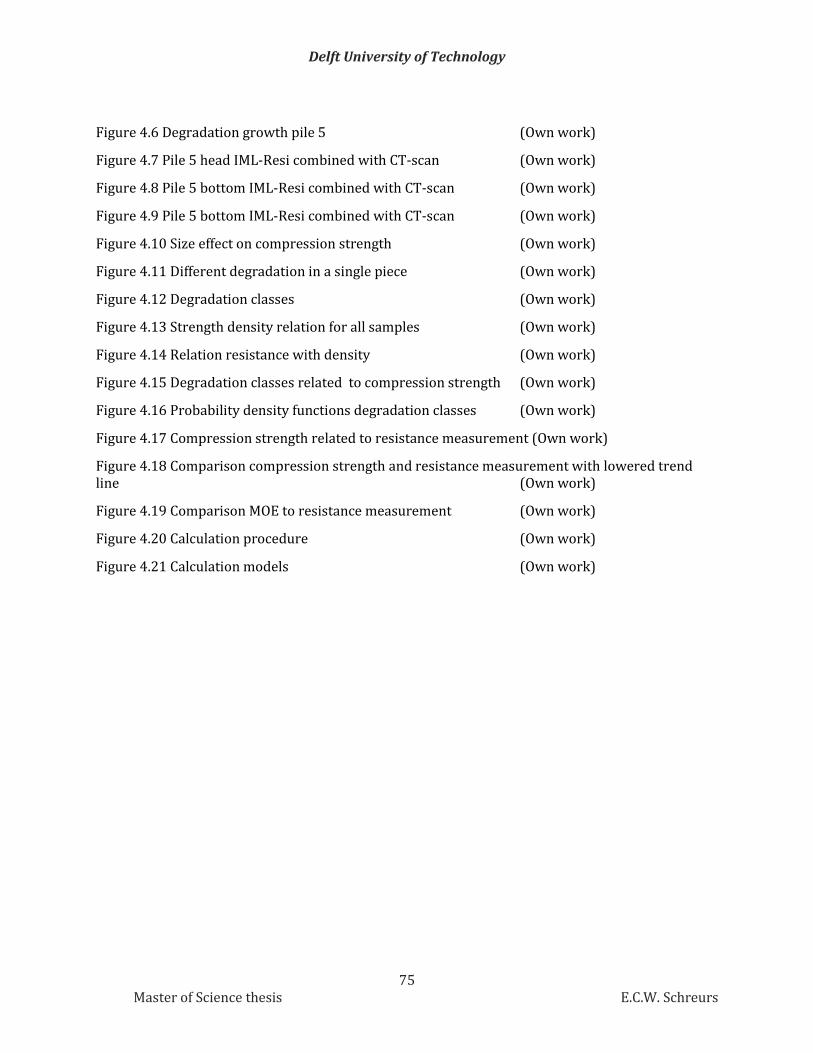
Delft University of Technology
75 Master of Science thesis E.C.W. Schreurs
Figure 4.6 Degradation growth pile 5 (Own work)
Figure 4.7 Pile 5 head IML-Resi combined with CT-scan (Own work)
Figure 4.8 Pile 5 bottom IML-Resi combined with CT-scan (Own work)
Figure 4.9 Pile 5 bottom IML-Resi combined with CT-scan (Own work)
Figure 4.10 Size effect on compression strength (Own work)
Figure 4.11 Different degradation in a single piece (Own work)
Figure 4.12 Degradation classes (Own work)
Figure 4.13 Strength density relation for all samples (Own work)
Figure 4.14 Relation resistance with density (Own work)
Figure 4.15 Degradation classes related to compression strength (Own work)
Figure 4.16 Probability density functions degradation classes (Own work)
Figure 4.17 Compression strength related to resistance measurement (Own work)
Figure 4.18 Comparison compression strength and resistance measurement with lowered trend line (Own work)
Figure 4.19 Comparison MOE to resistance measurement (Own work)
Figure 4.20 Calculation procedure (Own work)
Figure 4.21 Calculation models (Own work)

Delft University of Technology
76 Master of Science thesis E.C.W. Schreurs
APPENDICES
I Background information about testing samples
II Cone penetration test
III Current method foundation assessment
IV Acceptance of damage
V Scientific research into damage limits
VI Assessment full pile sections
VII Visual inspection and probing
VIII IML-Resi measurements
IX Location test samples in pile
X Compression tests data

Delft University of Technology
77 Master of Science thesis E.C.W. Schreurs
I BACKGROUND INFORMATION ABOUT TESTING
SAMPLES
For timber research into degradation patterns and the influence on the strength of degradation
specimens have been acquired of old timber piles. These piles originate from a building site in
the city of Rotterdam, Spoorsingel 43 and 45, and have been in use since 1900. In this chapter
background information is given about the specimens and the conditions to which they have
been exposed will be discussed.
At the time the pile specimens were received they have been assessed and measured. This is
documented in appendix V. Pictures have been taken from all sides and the dimensions of the
samples is documented.
In the past two foundation assessments have been done regarding the state of the foundations
at the research location. The first assessment has been done in 1985. They have done research
from Spoorsingel 35 to 65 and in this part three inspection pits were made. The first pit was
made at Spoorsingel 57-59, the second pit was made at Spoorsingel 33 and the last one was
made at number 49. At all inspection locations the timber piles were assessed as good which
means they have a remaining service life of at least 30 years. Notes have to be placed that for
the individual assessment of Spoorsingel 43 and 45 no specific advise is given due to the
absence of the habitants during the research. However both neighbouring houses are assessed
as good, so the 30 year remaining service life is advised.
The second foundation assessment has been done at Spoorsingel 33 to 47 in 1998. Inspection
pits have been dug at Spoorsingel 33 and 49 and at both locations the foundation is assessed
as good. Notes are made in the report that at three inspection pits at Spoorsingel 43 different
states of the foundation piles is found: good, moderate and bad. The implications of these states
are not mentioned. In the specific advice given by number 43 it is noted that the pile heads have
been lowered in the past and that due to this foundation repair the remaining service life is 40
year. For number 45 the same remaining service life is advised, but this is only done by visual
inspection of the outside state of the structure.
The groundwater table at the location has been measured in several wells which are in the neighbourhood of the piles. The location of the wells can be seen in the following figure. It has
to be noted that monitoring well 28 gives the best approximation of the groundwater table
around the specimens, because this well is the closest to the location which has to be
researched.
The data of wells 28 to 30 has been plotted in a graph containing all data available from 18-1-
1982. The past two years new wells have been in place, namely 101, 105 and 106. However
data from these wells does not represent the long term behaviour of the groundwater due to
the extreme short period these wells have been monitored and the extreme droughts which is
experienced the last few months, using this data an extreme negative trend will be measured.

Delft University of Technology
78 Master of Science thesis E.C.W. Schreurs
Monitoring well 28
-3,2
-3,1
-3
-2,9
-2,8
-2,7
-2,6
-2,5
-2,4
-2,3
-2,2
18-2-1982 14-11-1984 11-8-1987 7-5-1990 31-1-1993 28-10-1995 24-7-1998 19-4-2001 14-1-2004 10-10-2006 6-7-2009
Monitoring well: 128568-28
Lineair (Monitoring well: 128568-28)
Monitoring well 29
-3,2
-3,1
-3
-2,9
-2,8
-2,7
-2,6
-2,5
-2,4
-2,3
-2,2
18-2-1982 14-11-1984 11-8-1987 7-5-1990 31-1-1993 28-10-1995 24-7-1998 19-4-2001 14-1-2004 10-10-2006 6-7-2009
Monitoring well: 128568-29
Lineair (Monitoring well: 128568-29)
Monitoring well 30
-3,2
-3,1
-3
-2,9
-2,8
-2,7
-2,6
-2,5
-2,4
-2,3
-2,2
18-2-1982 14-11-1984 11-8-1987 7-5-1990 31-1-1993 28-10-1995 24-7-1998 19-4-2001 14-1-2004 10-10-2006 6-7-2009
Monitoring well: 128568-30
Lineair (Monitoring well: 128568-30)

Delft University of Technology
79 Master of Science thesis E.C.W. Schreurs
Looking at the graphs from the monitoring wells it can be concluded that over time the
groundwater table in the research area is undergoing a decrease in time. In the foundation
assessment of 1998 no reasons are found for this decrease and from 1998 on it is still
decreasing.
Soil conditions at the site can be investigated to make
calculations on the capacity of pile foundations in the
region. A cone penetration test (GH1386) has been performed at the location as indicated in the figure
from this test a ground profile can be compiled on
which basis a calculation can be made according to
the Koppejan method. In the foundation assessment
of 1985 the ground layers are described as followed.
This can be checked with the cone penetration test.
The ground level is at -1.26m N.A.P. Then there is a
layer sand which is used as ground improvement of
about 5m in the penetration tests this layer goes on
to -4,5m N.A.P. From -4,5m N.A.P. to -16,5m N.A.P
there are very weak peat/clay layers. Underneath
this layer there is the Pleistocene sand layer into which the pile tip is piled.
Based on the cone penetration test a more detailed ground profile can be compiled with the
help of known ground behaviour.
From environmental research in the area it can be concluded that no heavy contamination of
the ground or groundwater is present. So the timber isn’t exposed to wood decaying chemicals.

Delft University of Technology
80 Master of Science thesis E.C.W. Schreurs
II CONE PENETRATION TEST

Delft University of Technology
81 Master of Science thesis E.C.W. Schreurs
III CURRENT METHOD FOUNDATION ASSESSMENT

Delft University of Technology
82 Master of Science thesis E.C.W. Schreurs
IV ACCEPTANCE OF DAMAGE
According to Derriks (Derriks, 2011), there are several parameters which affect the acceptance
of people to certain risks the relevant reasons are given and examples are given how they can
be implemented in this specific case:
Cluster Specific parameter Lower acceptance Higher acceptance Background Cause of the damage Risk due to human
error. Wrong calculations in the past or building deficiencies.
Natural building damage due to earthquakes.
Effect of the damage
Consequences Total dysfunction of the structure.
Only parts of the structure will fail due to the damage.
Reparability Damage which is difficult to repair.
Damage is easy to repair.
Individual factors
Knowledge If the foundation problems remain abstract. It is difficult for home owners to make decisions on it.
A deep understanding into foundation problems can contribute to the acceptance of the risk which comes with it.
Trust The owner has no trust in the advice a company or the government gives into the foundation problem.
The government or advising companies have proven to be trustworthy and the owner can trust the building to be save.
Voluntariness If an owner is forced into making a specific decision he is less inclined to accept the damage which come with it.
If the owner takes the risk voluntary and knows what the consequences are he accepts the damage.
Attribution If the owner believes the foundation problems occurred due the fault of a third party.
The foundation problems are not caused by a third party. There is no one to blame.

Delft University of Technology
83 Master of Science thesis E.C.W. Schreurs
Other factors Personal benefits If the damage affects
the owner directly. His quality of life is lower.
The damage doesn’t affect the owner.
Context There have recently been a lot of foundation problems with high consequences for the owners.
There have not been any previous cases in which the foundation problems have let to severe damage.

Delft University of Technology
84 Master of Science thesis E.C.W. Schreurs
V SCIENTIFIC RESEARCH INTO DAMAGE LIMITS
Some scientific research has been done into damage which occurs when dealing with
settlements of the foundation. Criteria when assessing structures must be based on these
researches. A lot of them are identified by Suzanne de Lange (2011) the most important and
elementary are discussed.
(Skempton & MacDonald, 1956) The first research into damage which occurred as a result of settlements of foundations is done by these people. There work is still the bases of almost all research which have been done after.
In their research they made a distinction between three types of damage:
- Structural, which is damage of the frame of a building beams and stanchions.
- Architectural, which accounts for damage of panel walls, floors and finishes.
- And the last combination is the occurrence of both previous damages. They relate the occurrence of these damages in 98 buildings to two factors the angular
distortion(δ/l) and the maximum differential settlement(∆). Which are defined by the next
figure:
Figure IV.1 Settlement definitions (Skemption & MacDonald 1956)
The assessment of the 98 buildings resulting in damage values for the angular distortion of
1/300, with a limit of 1/150 for which structural damage occurs, but it is advised to use 1/500
to account for the big amount of uncertainties. For the maximum differential settlement a
boundary value of about 3,5mm is found.

Delft University of Technology
85 Master of Science thesis E.C.W. Schreurs
(Polshin & Tokar, 1975) Polshin and Tokar used the work of Skempton and Macdonald and defined damage criteria for
different material types. Their research defined a new parameter namely the ratio L/H which
is the ratio between the length and the height of the building. This factor relates to the bending
and shearing properties of the building. In their calculation they defined critical strains for
types of material. For masonry this critical strain was, εcrit, of 0.05%-0,1%. Leading to boundary
values for cracking of:
Buildings with L/H<3 1/2500-1/3333
Buildings with L/H>5 1/1400-1/2000
Real lower boundaries under which structural damage occurs are not defined by them.
(Bjerrum, 1963) Bjerrum related certain boundary values for angular distortion to damage in different kind of
buildings. His findings can be found in the following figure.
(Grant, Christian, &
Vanmarcke, 1972) Grant, Cristian and Vanmarcke did research on buildings to check the assumptions made by
Skempton and Macdonald and supported the limits found for the differential settlement, of
1/300 and 1/150, with data from additional structures. However notes are placed, that if there
is a slow settlement over time it can lead to lesser damage because of the creep which is
accompanied by it.
Figure IV.2 Findings Bjerrum, 1963

Delft University of Technology
86 Master of Science thesis E.C.W. Schreurs
(Burland & Wroth, 1974) To analyze settlements and criteria of damage Burland and Wroth defined a set of definitions
which is very convenient for foundation analysis:
Change of length equal to δL leads to
a strain ε=δL/L.
Settlement ρ, is positive
downwards. Upward displacement
is called heave and denoted ρh.
Differential settlement δp
Rotation θ, is the gradient between
two reference points.
Tilt is denoted ω and is the rigid
body rotation of the structure.
Relative rotation β, defines the
rotation of a straight line between
two reference points.
(Same as angular distortion defined
by Skempton)
Angular strain α. From figure:
𝛼𝐵 = 𝛿𝜌𝐵𝐴
𝑙𝐴𝐵+
𝛿𝜌𝐵𝐶
𝑙𝐵𝐶
Relative deflection Δ. Deflection
ratio Δ/L.
Burland and Wroth continue on the
research by Polshin and
Tokar(1957) and Skempton and
Macdonalds(1956). Polshin found that critical strains between 0.05
and 0.1 are limits for brickwork.
Burland used in his research a value
of 0.075, because this value proved
to be very accurate in practice.
However the onset of cracking doesn’t
necessarily mean that the ultimate limit is reached in cases where the cracking is controlled
and deformations are allowed there can still be a lot of capacity left.
The value for critical angular distortion of 1/500 as advised by Skempton and Macdonald is
evaluated and a distinction is made between hogging and sagging deformations.
Figure IV.3 Deformation definitions Burland and Wroth

Delft University of Technology
87 Master of Science thesis E.C.W. Schreurs
Figure IV.4 Comparison different limits
Testing between different modes of deformation have shown that some modes are more severe
than others. Models showing the difference between sagging and hogging are shown below. It
can be seen that hogging is much more severe due to the lack of a restraint when a crack
develops at the top of the wall, therefore it can easily propagate towards the foundation.
Figure IV.5 Difference between hogging and sagging mode
Burland and Wroth concluded that some parameters have a big influence on the limits which
must be set, namely:
- The length to height ratio(L/H).
- The relative stiffness in shear and in bending.
- The degree of tensile restraint built into the structure and its foundations.
- The mode of deformation.

Delft University of Technology
88 Master of Science thesis E.C.W. Schreurs
They also concluded that the boundary conditions set by Skempton and Macdonald are
satisfactory but conservative for buildings L/H>3and unsafe for buildings with L/H<4. For
these buildings it is advised to use the criteria set by Polshin and Tokar, which limits Δ/L in
relation to L/H. However when structures are subjected to hogging half of these values should
be taken.
(Burland, Broms, & De Mello, 1977) In this research distinction was made between the degree of damage in relation to the effort it
takes to repair the damage.
Figure IV.6 Classification of damage
They also analyzed the previous work which had been done by Skempton and Polshin. They
put some side notes by both researches.
In general they acknowledged the pioneering work of Skempton and MacDonald however
some side notes should be made:
- Limited to traditional steel and reinforced concrete frame buildings only results used for a few
load bearing brick wall.
- Only the relative rotation implies that all damage results from shear deformation, this is not
necessarily the case.
- To little classification into the degree of damage is used.

Delft University of Technology
89 Master of Science thesis E.C.W. Schreurs
The work of Polshin and Tokar they found that they used correct assumptions when looking at
the limits for no cracking at all. The load bearing capacity is not yet fully used at this point, so
using these criteria is very conservative. The associated degree of damage doesn’t surpass
category 1 (very slight).
(Ricceri & Soranzo, 1985) Ricceri and Soranzo argued that instead of the difficulty to calculate differential settlements
the easier way in design is to calculate the settlement combined with a flexible structure. With
the values found in this analysis a choice can be made whether or not to go deeper into the
problem. They found settlements of 8cm to lead to no problems, but settlements of 20cm to be
inadmissible for traditional buildings. For settlements in between these values further analysis
should be done.
(Boscardin & Cording, 1989) Boscardin and Cording devised limit states for different kind of structures, with special interest
into the mining industry which are very well in line with the results as found by Skempton and
MacDonald and related to the degrees as defined in Burland his 1977 work. Different critical
strains are also defined in relation to the different degrees of damage. The figure is valid for
hogging deformations with L/H=1.
Figure IV.7 Settlement limits related to degree of damage

Delft University of Technology
90 Master of Science thesis E.C.W. Schreurs
(Mair, Taylor, & Burland, 1996) In this research the horizontal strain is added to the damage criteria for hogging deformations
with L/H=1. The results can be found in the figure below.
Figure IV.8 Limit states for hogging deformations with horizontal strain
(Netzel, 2009) Netzel concludes that there for the different kind of strains, bending and diagonal, different
settlement criteria should be used. For determining the diagonal strains the angular distortion
should be used and for the bending strains the deflection ratio should be used. The use of one
parameter for both strains leads to over and or under estimations. Noted herby is that Netzel
makes use of a Gaussian settlement profile.
Conclusions have been drawn when only one parameter is used to limit the tensile strains. The
most useful will be summarized below:
When deflection ratio is used as a parameter to estimate the diagonal strains this will lead to a
underestimation of 60%.
Angular distortion to estimate bending strains can lead to an overestimation up to 130%. For these reasons Netzel advices to use deflection ratio for the estimation of bending strains
and the angular distortion to estimate diagonal strains. In practice these parameters will lead
to acceptable results with the right associated damage.

Delft University of Technology
91 Master of Science thesis E.C.W. Schreurs
Netzel also elaborates about the difference between hogging and sagging deformations.
Buildings undergoing hogging are more susceptible to damage, this is been proven by empirical
experience in practice. An explanation for the difference is the different location of the neutral
axis. However he concludes that when horizontal differential settlements are not taken into
consideration for a L/H range between 0.75 and 2.5 and when using the analytical approach
with limit tensile stresses hogging does not always lead to more damage compared with a
building which is undergoing a sagging deformation .
Figure IV.9 Difference between deformation modes undergoing no horizontal differential settlements

Delft University of Technology
92 Master of Science thesis E.C.W. Schreurs
VI ASSESSMENT FULL PILE SECTIONS

Delft University of Technology
93 Master of Science thesis E.C.W. Schreurs

Delft University of Technology
94 Master of Science thesis E.C.W. Schreurs

Delft University of Technology
95 Master of Science thesis E.C.W. Schreurs

Delft University of Technology
96 Master of Science thesis E.C.W. Schreurs

Delft University of Technology
97 Master of Science thesis E.C.W. Schreurs

Delft University of Technology
98 Master of Science thesis E.C.W. Schreurs

Delft University of Technology
99 Master of Science thesis E.C.W. Schreurs

Delft University of Technology
100 Master of Science thesis E.C.W. Schreurs

Delft University of Technology
101 Master of Science thesis E.C.W. Schreurs
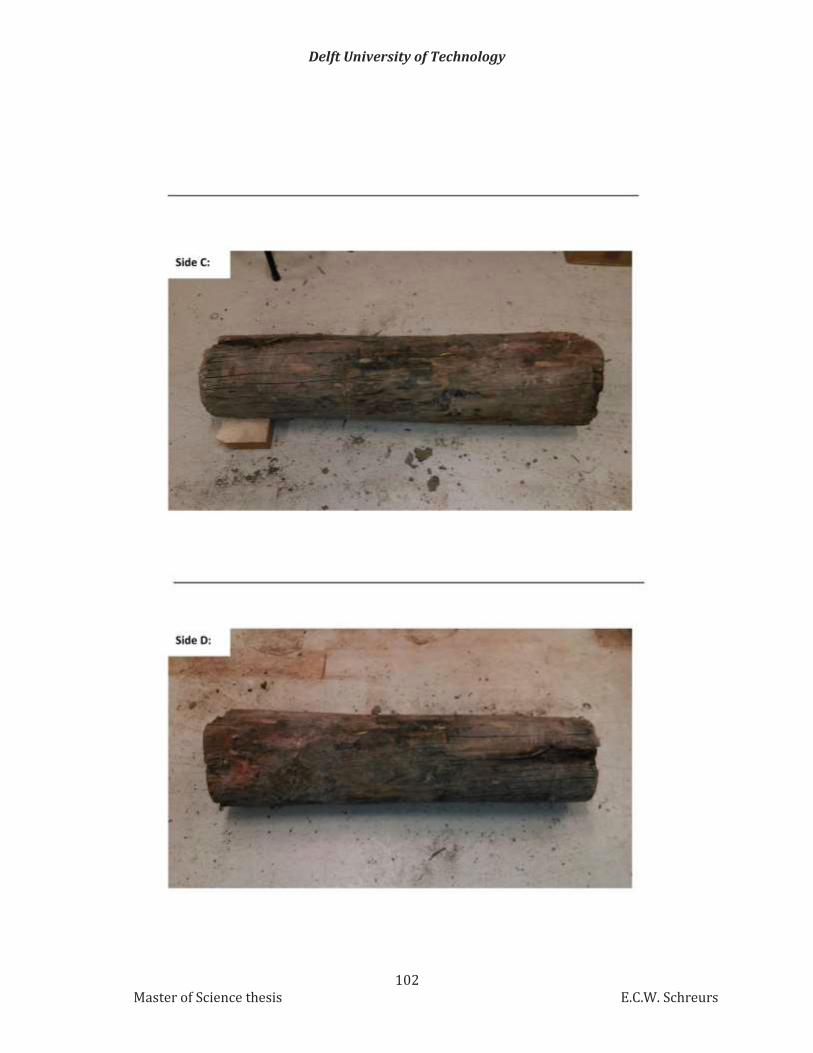
Delft University of Technology
102 Master of Science thesis E.C.W. Schreurs
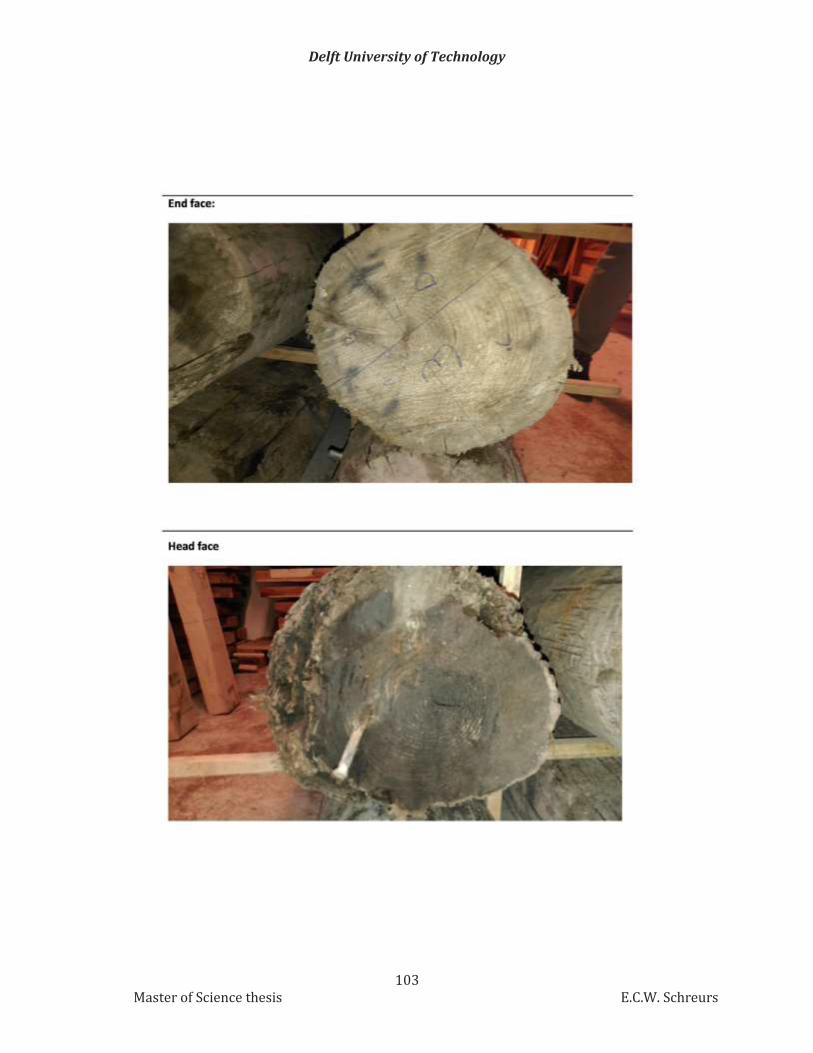
Delft University of Technology
103 Master of Science thesis E.C.W. Schreurs

Delft University of Technology
104 Master of Science thesis E.C.W. Schreurs

Delft University of Technology
105 Master of Science thesis E.C.W. Schreurs

Delft University of Technology
106 Master of Science thesis E.C.W. Schreurs

Delft University of Technology
107 Master of Science thesis E.C.W. Schreurs

Delft University of Technology
108 Master of Science thesis E.C.W. Schreurs

Delft University of Technology
109 Master of Science thesis E.C.W. Schreurs

Delft University of Technology
110 Master of Science thesis E.C.W. Schreurs

Delft University of Technology
111 Master of Science thesis E.C.W. Schreurs

Delft University of Technology
112 Master of Science thesis E.C.W. Schreurs

Delft University of Technology
113 Master of Science thesis E.C.W. Schreurs
VII VISUAL INSPECTION AND PROBING
According to NEN5491 some parameters of timber foundation piles can be taken to assess the
quality. These norms normally apply for new foundation piles, so they can be expected to work
for in use piles as well. The definitions of the imperfections can be found in NEN5461. For the
determinations easy visual observations are sufficient and in some cases some basic probing
has to be done with for example a screwdriver. All the piles which are present and need to be
present seem to fulfil the requirements as stated in the norm except for the degradation part,
which is logical because the norm is made for new piles. To assess the degradation of the piles
they will be visually checked for degradation patterns and probing will be done with a small
screwdriver. The results of this inspection can be found in the following tables. These tables
also include a IML-Resi number, which relates to the number of the IML-Resi measurement
which relates to that location. For each pile 5 cm below the top of the pile and 5 cm below the
bottom of the pile four IML-Resi measurements at α=0˚,90˚,180˚ and 270˚ will be done to assess
the general quality of the timber pile. In all the identified degradation extra IML-Resi
measurement will be done.
Coordinate system used:
In the following tables also the locations of the probing can be found including the IML-Resi
measurement related to this location. The IML-Resi measurement is always taken from the
location of the probing to the middle of the pile head.
α
x

Delft University of Technology
114 Master of Science thesis E.C.W. Schreurs
Pile nr 1
x [mm]
α [˚] Length degr [mm]
Width degr [mm]
Depth probing [mm]
Resistogr nr [-]
Comments
1 50 0 100 50 10 370
2 950 0 0 371
3 50 90 3 372
4 950 90 0 373
5 50 180 0 374
6 950 180 0 375
7 50 270 0 376
8 950 270 0 377
Pile nr 2
x [mm]
α [˚] Length degr [mm]
Width degr [mm]
Depth probing [mm]
Resistogr nr [-]
Comments
1 100 0 (-10-45)
Full 200 0 351 Heavy cracking
2 1000 0 (-5)cr Full 200 0 352
3 500 0 full 200 0 353
4 50 90 120 100 13 354 Cracking damage
5 1000 90 0 355-356
6 50 180 0 357 Damage
7 1000 180 0 358 Cracking damage
8 50 2 359
9 1000 0 360
Pile nr 3
x [mm]
α [˚] Length degr [mm]
Width degr [mm]
Depth probing [mm]
Resistogr nr [-]
Comments
1 50 0 150 >30 400 Pile fully
2 1000 0 2 401 degraded
3 50 90 10 402 all around
4 1000 90 2 403
5 50 180 >30 406
6 1000 180 0 405
7 50 270 >30 407
8 1000 270 2 408

Delft University of Technology
115 Master of Science thesis E.C.W. Schreurs
Pile nr 4
x [mm]
α [˚] Length degr [mm]
Width degr [mm]
Depth probing [mm]
Resistogr nr [-]
Comments
1 50 -45-0 100 150 20 362 Degr
2 950 0 0 363
3 50 90(45-180)
150 10 364
4 950 0 365
5 100 180-270
150 10 366
6 950 180-270
0 367 Crack
7 100 270-0 150 20 368
8 950 369
Pile nr 5
x [mm]
α [˚] Length degr [mm]
Width degr [mm]
Depth probing [mm]
Resistogr nr [-]
Comments
1 0-495 0 495 96 10 50 339
2 950 0 340
3 300 10 96 5 341
4 5 90 0 342
5 950 90 0 343
6 5 110-180
460 200 5 344
7 300 145 5 345
8 950 145 5 346
9 5 180-270
full full 3 347
10 950 180-270
3 348
11 5 270-0 3 349
12 950 270-0 3 350

Delft University of Technology
116 Master of Science thesis E.C.W. Schreurs
Pile nr 6
x [mm]
α [˚] Length degr [mm]
Width degr [mm]
Depth probing [mm]
Resistogr nr [-]
Comments
1 50 0 Full 0-90 20 409
2 950 0 Full 0-90 4 410
3 500 0 Full 0-90 10 411
4 50 90 100 25 412
5 950 90 0 413
6 50 180 10 414
7 950 180 0 415
8 50 270 2 416
9 950 270 0 417
Pile nr 7
x [mm]
α [˚] Length degr [mm]
Width degr [mm]
Depth probing [mm]
Resistogr nr [-]
Comments
1 50 270-45 Full >20 378
2 500 ‘’ ‘’ 10 379
3 950 ‘’ ‘’ 5 380
4 50 90 0 387
5 950 90 0 388
6 50 135-225
60 10 389
7 950 0 390
8 50 225-270
>20 391
9 500 ‘’ 10 392
10 950 ‘’ 5 393

Delft University of Technology
117 Master of Science thesis E.C.W. Schreurs
VII IML-RESI MEASUREMENTS

Delft University of Technology
118 Master of Science thesis E.C.W. Schreurs

Delft University of Technology
119 Master of Science thesis E.C.W. Schreurs

Delft University of Technology
120 Master of Science thesis E.C.W. Schreurs

Delft University of Technology
121 Master of Science thesis E.C.W. Schreurs

Delft University of Technology
122 Master of Science thesis E.C.W. Schreurs

Delft University of Technology
123 Master of Science thesis E.C.W. Schreurs

Delft University of Technology
124 Master of Science thesis E.C.W. Schreurs

Delft University of Technology
125 Master of Science thesis E.C.W. Schreurs

Delft University of Technology
126 Master of Science thesis E.C.W. Schreurs

Delft University of Technology
127 Master of Science thesis E.C.W. Schreurs

Delft University of Technology
128 Master of Science thesis E.C.W. Schreurs

Delft University of Technology
129 Master of Science thesis E.C.W. Schreurs

Delft University of Technology
130 Master of Science thesis E.C.W. Schreurs

Delft University of Technology
131 Master of Science thesis E.C.W. Schreurs

Delft University of Technology
132 Master of Science thesis E.C.W. Schreurs

Delft University of Technology
133 Master of Science thesis E.C.W. Schreurs

Delft University of Technology
134 Master of Science thesis E.C.W. Schreurs

Delft University of Technology
135 Master of Science thesis E.C.W. Schreurs

Delft University of Technology
136 Master of Science thesis E.C.W. Schreurs

Delft University of Technology
137 Master of Science thesis E.C.W. Schreurs

Delft University of Technology
138 Master of Science thesis E.C.W. Schreurs

Delft University of Technology
139 Master of Science thesis E.C.W. Schreurs

Delft University of Technology
140 Master of Science thesis E.C.W. Schreurs

Delft University of Technology
141 Master of Science thesis E.C.W. Schreurs

Delft University of Technology
142 Master of Science thesis E.C.W. Schreurs

Delft University of Technology
143 Master of Science thesis E.C.W. Schreurs

Delft University of Technology
144 Master of Science thesis E.C.W. Schreurs

Delft University of Technology
145 Master of Science thesis E.C.W. Schreurs
IX LOCATION TEST SAMPLES IN PILE
Pile 1 location test samples
Pile 2 location test samples
B1.5
B1.1
1
B1.1
2
B1.3
B1.6
B1.1
0
B1.9
B1.8
B1.4 B1.7
B1.2 B1.1
B1.1
3
B1.1
4
A1. 9 A1.8
A1.7
A1.4
A1.2 A1.1
A1.1
0
A1.6
A1.3
B2.4
B2.1
4
B2.1 B2.2
B2.5
B2.6
B2.1
2 B2.8
B2.1
0
B2.1
1
B2.9
B2.1
3
B2.3
A2.1 A2.2
A2.5
A2.6
A2.8
A2.1
0 A2.9
A2.4 A2.3
B1.1
5
A2.2
0

Delft University of Technology
146 Master of Science thesis E.C.W. Schreurs
Pile 3 location test samples
Pile 4 location test samples
B3.1
B3.3
B3.4
B3.2
B3.16
B3.6 B3.7
B3.8
B3.10 B3.9
B3.15
B3.5 B3.17
B3.13 B3.14
B3.12 B3.11 A3.2
A3.20
A3.8 A3.7 A3.6 A3.5
A3.9 A3.10
B4.2 B4.3
A4.7
A4.6
A4.9
A4.10 A4.8
A4.4
A4.1 B4.3
B4.7 B4.6 B4.5
B4.9
B4.10
B4.12
B4.11 B4.8
B4.4 B4.21
B4.1
B4.2
A4.12

Delft University of Technology
147 Master of Science thesis E.C.W. Schreurs
Pile 5 location test samples
Pile 6 location test samples
B5.1
B5.7 B5.6
B5.1
3 B5.1
2
B5.3 B5.2
B5.15
B5.9 B5.8
B5.1
0
B5.11
B5.4 B5.5
A5.1
A5.2 A5.3
A5.1
2
A5.1
3
A5.4 A5.5
A5.6 A5.7
A5.9
A5.1
0
A5.8
B6.1 B6.2
B6.3
B6.8
B6.12
B6.1
0
B6.9
B6.1
1 B6.4
A6.2
A6.3
A6.8
A6.10
A6.9
A6.4

Delft University of Technology
148 Master of Science thesis E.C.W. Schreurs
Pile 7 location test samples
Pile 4 location test samples (size effect)
B7.10
B7.8 B7.7
B7.2
B7.4
B7.1
B7.6
B7.3
B7.5
B7.9
A7.1
A7.2
A7.7 A7.8
A7.10 A7.9
A7.4
A7.6
A7.3
A7.5
C4.2
C4.1
C4.12 C4.4
C4.8
C4.5 C4.6
C4.7
C4.3
C4.10 C4.9
C4.11

Delft University of Technology
149 Master of Science thesis E.C.W. Schreurs
X COMPRESSION TESTS DATA
Pile 1: Code L W H MC Ratio H/L Area Density
Ultimate force
Ultimate strength
[#] [mm] [mm] [mm] [%] [#] [mm2] [kg/m3] [kN] [N/mm2]
Top part A 1.1 38 38 177 14,6 4,7 1444 456 37,39 25,89
A 1.2 38 38 191 15,4 5,0 1444 427 37,97 26,30
A 1.3 38 38 203 15,1 5,3 1444 445 45,57 31,56
A 1.4 38 38 195 15,8 5,1 1444 340 19,48 13,49
A 1.6 38 38 203 15,4 5,3 1444 423 47,49 32,89
A 1.7 38 38 178 15,5 4,7 1444 380 42,36 29,34
A 1.8 38 38 185 15,5 4,9 1140 367 25,89 22,71
A 1.9 38 38 185 15,4 4,9 1444 339 14,39 9,97
A 1.10 38 38 172 15,5 4,5 1140 413 45,16 39,61
Code L[mm] W[mm] H[mm] MC Ratio H/L Area Density
Ultimate force
Ultimate strength
Bottom B 1.1 38 38 202 14,9 5,3 1444 443 57,27 39,66
part B 1.2 38 38 205 15,2 5,4 1330 400 42,98 32,32
B 1.3 30 38 200 14,5 6,7 1140 468 39,72 34,84
B 1.4 38 38 200 15,6 5,3 1444 384 44,72 30,97
B 1.5 38 38 202 15,3 5,3 1444 378 41,60 28,81
B 1.6 36 38 197 15,3 5,5 1368 455 41,42 30,28
B 1.7 36 38 203 14,4 5,6 1260 462 44,24 35,11
B 1.8 44 38 201 15,0 4,6 1540 390 52,66 34,19
B 1.9 38 38 185 15,1 4,9 1444 410 49,36 34,18
B 1.10 38 38 155 14,9 4,1 1444 426 48,96 33,91
B 1.11 38 38 198 14,7 5,2 1444 451 49,07 33,98
B 1.12 38 38 193 14,9 5,1 1444 467 61,50 42,59
B 1.13 38 38 196 14,4 5,2 1444 454 57,10 39,54
B 1.14 38 38 198 14,4 5,2 1444 459 50,01 34,63
B 1.15 38 38 199 15,6 5,2 1444 423 52,15 36,11

Delft University of Technology
150 Master of Science thesis E.C.W. Schreurs
Pile 2: Code L W H MC Ratio H/L Area Density
Ultimate force
Ultimate strength
[#] [mm] [mm] [mm] [%] [#] [mm2] [kg/m3] [kN] [N/mm2]
Top part A 2.1 38 38 198 14,8 5,2 1444 353 28,86 19,99
A 2.2 38 38 193 13,6 5,1 1444 429 49,45 34,25
A 2.3 38 38 203 14,5 5,3 1444 427 37,62 26,05
A 2.4 38 38 199 14,7 5,2 1444 395 33,31 23,07
A 2.5 38 38 193 14,7 5,1 1444 397 31,67 21,93
A 2.6 38 38 196 15,2 5,2 1444 327 21,56 14,93
A 2.8 38 38 193 15,4 5,1 1444 376 31,08 21,52
A 2.9 38 38 199 14,9 5,2 1444 393 44,00 30,47
A 2.10 38 38 199 14,9 5,2 1444 384 24,48 16,95
A 2.20 38 38 197 15,0 5,2 1330 354 31,43 23,63
Code L[mm] W[mm] H[mm] MC Ratio H/L Area Density
Ultimate force
Ultimate strength
Bottom B 2.1 38 38 220 14,1 5,8 1444 394 40,09 27,76
part B 2.2 38 38 228 13,5 6,0 1444 409 38,96 26,98
B 2.3 38 38 215 14,8 5,7 1444 402 44,54 30,84
B 2.4 38 38 215 15,0 5,7 1330 387 42,66 32,08
B 2.5 38 38 222 14,8 5,8 1444 397 38,51 26,67
B 2.6 38 38 215 14,9 5,7 1444 420 39,93 27,65
B 2.8 38 38 217 14,9 5,7 1330 450 38,70 29,10
B 2.9 38 38 202 14,4 5,3 1444 416 46,81 32,42
B 2.10 38 38 210 14,7 5,5 1444 419 40,31 27,92
B 2.11 38 38 209 14,6 5,5 1444 409 29,96 20,75
B 2.12 38 38 212 14,7 5,6 1444 413 33,59 23,26
B 2.13 38 38 203 14,7 5,3 1444 448 40,31 27,92
B 2.14 38 38 220 14,5 5,8 1444 400 40,40 27,98

Delft University of Technology
151 Master of Science thesis E.C.W. Schreurs
Pile 3: Code L W H MC Ratio H/L Area Density
Ultimate force
Ultimate strength
[#] [mm] [mm] [mm] [%] [#] [mm2] [kg/m3] [kN] [N/mm2]
Top part A 3.2 38 38 192 15,1 5,1 1444 409 47,15 32,65
A 3.5 38 38 192 15,3 5,1 1444 293 13,97 9,67
A 3.6 38 38 186 16,0 4,9 1444 282 12,20 8,45
A 3.7 38 38 192 15,4 5,1 1444 251 6,09 4,22
A 3.8 25 38 190 15,5 7,6 950 301 1,70 1,79
A 3.9 38 38 188 15,6 4,9 1444 225 4,32 2,99
A 3.10 34 38 194 15,3 5,7 1292 225 2,97 2,30
A 3.20 38 38 193 19,3 5,1 1444 248 0,17 0,12
Code L[mm] W[mm] H[mm] MC Ratio H/L Area Density
Ultimate force
Ultimate strength
Bottom B 3.1 28 38 195 14,8 7,0 980 464 33,53 34,21
part B 3.2 38 38 195 14,9 5,1 1444 425 51,91 35,95
B 3.3 38 38 195 14,9 5,1 1330 392 43,63 32,80
B 3.4 38 38 192 14,7 5,1 1444 337 34,10 23,61
B 3.5 38 38 192 14,3 5,1 1330 373 40,81 30,68
B 3.6 38 38 198 14,4 5,2 1330 362 37,89 28,49
B 3.7 38 38 189 14,7 5,0 1330 396 44,16 33,20
B 3.8 26 38 182 13,8 7,0 988 493 33,75 34,16
B 3.9 38 38 197 14,6 5,2 1330 423 59,64 44,84
B 3.10 38 38 192 14,7 5,1 1444 428 57,42 39,76
B 3.11 38 38 201 15,9 5,3 1444 477 56,32 39,00
B 3.12 38 38 202 15,5 5,3 1444 418 50,74 35,14
B 3.13 38 38 201 15,3 5,3 1444 433 51,28 35,51
B 3.14 38 38 199 14,5 5,2 1444 370 41,88 29,00
B 3.15 38 38 200 14,3 5,3 1444 461 64,74 44,83
B 3.16 38 38 191 14,4 5,0 1444 396 44,60 30,89
B 3.17 38 38 200 15,0 5,3 1330 447 52,63 39,57

Delft University of Technology
152 Master of Science thesis E.C.W. Schreurs
Pile 4: Code L W H MC Ratio H/L Area Density
Ultimate force
Ultimate strength
[#] [mm] [mm] [mm] [%] [#] [mm2] [kg/m3] [kN] [N/mm2]
Top part A 4.1 34 38 202 14,6 5,9 1292 493 63,66 49,27
A 4.2 38 38 213 14,6 5,6 1330 486 58,49 43,98
A 4.3 38 38 215 15,4 5,7 1444 300 18,45 12,78
A 4.4 38 38 194 14,9 5,1 1444 435 53,30 36,91
A 4.6 38 38 205 15,6 5,4 1444 404 46,33 32,08
A 4.7 38 38 206 15,1 5,4 1444 341 27,26 18,88
A 4.8 38 38 192 14,9 5,1 1444 390 26,95 18,66
A 4.9 38 38 202 15,3 5,3 1330 426 40,53 30,47
A 4.10 38 38 204 14,5 5,4 1140 470 52,82 46,33
A 4.12 38 38 195 14,4 5,1 1444 342 15,99 11,07
Code L[mm] W[mm] H[mm] MC Ratio H/L Area Density
Ultimate force
Ultimate strength
Bottom B 4.1 38 38 204 14,2 5,4 1444 483 69,24 47,95
part B 4.2 38 38 215 14,9 5,7 1330 471 63,00 47,37
B 4.3 38 38 213 15,1 5,6 1444 462 64,09 44,38
B 4.4 32 38 203 14,8 6,3 1216 482 44,47 36,57
B 4.5 38 38 210 15,1 5,5 1330 404 43,56 32,75
B 4.6 38 38 212 15,2 5,6 1330 453 62,31 46,85
B 4.7 38 38 217 15,3 5,7 1444 442 54,51 37,75
B 4.8 36 38 193 14,7 5,4 1368 340 17,39 12,71
B 4.9 28 38 210 14,6 7,5 980 515 32,32 32,98
B 4.10 38 38 205 14,6 5,4 1330 467 63,28 47,58
B 4.11 34 38 197 14,8 5,8 1190 420 28,29 23,77
B 4.12 32 38 194 14,8 6,1 1216 388 29,16 23,98
B 4.21 38 38 206 15,0 5,4 1444 423 51,86 35,91
Pile 4: Code L W H MC H/L Area Density Force Strength
Middle C 4.1 38 38 285 14,8 7,5 1444 468 62,78 43,48
part C 4.2 38 38 287 15,0 7,6 1444 439 61,45 42,56
C 4.3 38 38 288 14,8 7,6 1444 464 62,72 43,43
C 4.4 38 38 287 15,9 7,6 1444 417 59,58 41,26
C 4.5 38 38 284 15,8 7,5 1444 400 44,31 30,69
C 4.6 38 38 286 14,9 7,5 1444 456 58,57 40,56
C 4.7 38 38 285 15,0 7,5 1444 430 41,11 28,47
C 4.8 38 38 284 15,2 7,5 1444 455 56,38 39,04
C 4.9 38 38 287 15,1 7,6 1444 440 48,56 33,63
C 4.10 38 38 285 14,4 7,5 1444 459 56,05 38,82
C 4.11 38 38 286 14,2 7,5 1444 387 29,42 20,37
C 4.12 38 38 282 14,8 7,4 1444 474 62,72 43,43

Delft University of Technology
153 Master of Science thesis E.C.W. Schreurs
Pile 5: Code L W H MC Ratio H/L Area Density
Ultimate force
Ultimate strength
[#] [mm] [mm] [mm] [%] [#] [mm2] [kg/m3] [kN] [N/mm2]
Top part A 5.1 38 38 198 15,0 5,2 1444 361 38,14 26,41
A 5.2 38 38 192 15,6 5,1 1444 278 16,12 11,16
A 5.3 38 38 192 17,0 5,1 1444 277 24,75 17,14
A 5.4 38 38 195 15,2 5,1 1444 307 21,84 15,12
A 5.5 38 38 191 15,4 5,0 1444 355 36,61 25,35
A 5.6 38 38 195 15,0 5,1 1444 343 32,67 22,62
A 5.7 38 38 192 14,9 5,1 1444 378 37,67 26,09
A 5.8 38 38 200 13,4 5,3 1444 361 31,47 21,79
A 5.9 38 38 190 15,4 5,0 1444 360 36,19 25,06
A 5.10 38 38 196 14,4 5,2 1444 326 30,23 20,93
A 5.12 38 38 194 17,0 5,1 1444 354 35,51 24,59
A 5.13 38 38 185 16,6 4,9 1444 420 39,34 27,24
Code L[mm] W[mm] H[mm] MC Ratio H/L Area Density
Ultimate force
Ultimate strength
Bottom B 5.1 38 38 200 15,0 5,3 1444 435 33,68 23,32
part B 5.3 38 38 195 15,4 5,1 1444 364 29,76 20,61
B 5.4 38 38 205 14,6 5,4 1330 442 38,46 28,92
B 5.5 38 38 208 14,7 5,5 1330 369 34,13 25,66
B 5.6 38 38 205 15,4 5,4 1444 301 29,37 20,34
B 5.7 38 38 197 15,5 5,2 1444 381 38,62 26,75
B 5.8 38 38 206 15,1 5,4 1444 358 29,48 20,42
B 5.9 38 38 202 16,0 5,3 1444 352 40,61 28,12
B 5.10 38 38 210 14,4 5,5 1444 415 32,81 22,72
B 5.11 38 38 209 14,6 5,5 1444 402 40,96 28,37
B 5.12 38 38 204 15,3 5,4 1444 337 30,71 21,27
B 5.13 38 38 194 16,1 5,1 1444 404 39,99 27,69
B 5.15 30 38 195 15,4 6,5 1140 483 34,42 30,19

Delft University of Technology
154 Master of Science thesis E.C.W. Schreurs
Pile 6: Code L W H MC Ratio H/L Area Density
Ultimate force
Ultimate strength
[#] [mm] [mm] [mm] [%] [#] [mm2] [kg/m3] [kN] [N/mm2]
Top part A 6.2 38 38 203 15,0 5,3 1330 411 33,28 25,02
A 6.3 38 38 208 13,9 5,5 1140 456 28,41 24,92
A 6.4 38 38 202 14,4 5,3 1140 460 41,63 36,52
A 6.8 38 38 198 14,3 5,2 1444 480 41,57 28,79
A 6.9 38 38 212 15,0 5,6 1444 548 57,69 39,95
A 6.10 38 38 208 14,9 5,5 1330 437 38,34 28,83
Code L[mm] W[mm] H[mm] MC Ratio H/L Area Density
Ultimate force
Ultimate strength
Bottom B 6.1 38 38 194 15,4 5,1 1444 487 56,80 39,34
part B 6.2 38 38 195 14,0 5,1 1444 469 54,09 37,46
B 6.3 38 38 195 14,9 5,1 1444 439 58,55 40,55
B 6.4 38 38 192 16,3 5,1 1330 478 47,22 35,50
B 6.8 38 38 196 14,5 5,2 1444 454 47,02 32,56
B 6.9 38 38 191 15,6 5,0 1444 530 50,73 35,13
B 6.10 38 38 196 15,0 5,2 1330 490 50,36 37,86
B 6.11 38 38 190 15,5 5,0 1444 491 47,48 32,88
B 6.12 38 38 184 15,5 4,8 1330 440 40,99 30,82

Delft University of Technology
155 Master of Science thesis E.C.W. Schreurs
Pile 7: Code L W H MC Ratio H/L Area Density
Ultimate force
Ultimate strength
[#] [mm] [mm] [mm] [%] [#] [mm2] [kg/m3] [kN] [N/mm2]
Top part A 7.1 38 38 185 13,3 4,9 1330 331 27,94 21,01
A 7.2 38 38 190 14,2 5,0 1444 360 40,84 28,28
A 7.3 38 38 182 14,2 4,8 1444 414 44,50 30,82
A 7.4 38 38 191 14,2 5,0 1216 458 42,94 35,31
A 7.5 38 38 180 14,6 4,7 1444 351 31,87 22,07
A 7.6 38 38 180 14,6 4,7 1330 408 36,71 27,60
A 7.7 38 38 191 14,6 5,0 1444 392 49,30 34,14
A 7.8 38 38 190 13,5 5,0 1444 359 24,45 16,93
A 7.9 38 38 187 13,9 4,9 1330 460 55,50 41,73
A 7.10 38 38 187 15,0 4,9 1444 420 54,67 37,86
Code L[mm] W[mm] H[mm] MC Ratio H/L Area Density
Ultimate force
Ultimate strength
Bottom B 7.1 38 38 195 13,2 5,1 1444 460 42,15 29,19
part B 7.2 38 38 204 14,7 5,4 1444 435 51,64 35,76
B 7.3 38 38 201 13,8 5,3 1444 486 51,08 35,37
B 7.4 38 38 199 14,4 5,2 1330 463 43,04 32,36
B 7.5 38 38 195 13,9 5,1 1330 475 48,76 36,66
B 7.6 38 38 198 15,1 5,2 1444 385 35,31 24,45
B 7.7 38 38 198 13,7 5,2 1444 455 53,64 37,15
B 7.8 38 38 198 13,2 5,2 1444 471 56,83 39,36
B 7.9 38 38 205 13,3 5,4 1444 468 55,50 38,43
B 7.10 38 38 200 13,9 5,3 1444 468 52,75 36,53
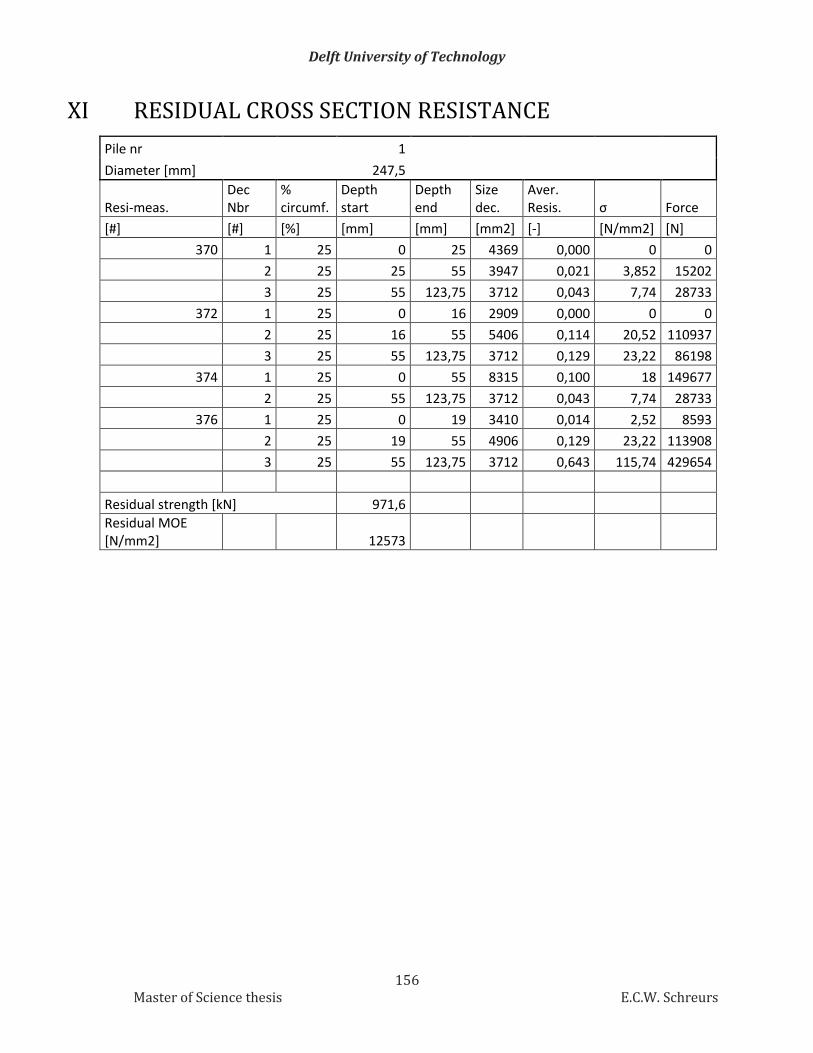
Delft University of Technology
156 Master of Science thesis E.C.W. Schreurs
XI RESIDUAL CROSS SECTION RESISTANCE
Pile nr 1
Diameter [mm] 247,5
Resi-meas. Dec Nbr
% circumf.
Depth start
Depth end
Size dec.
Aver. Resis. σ Force
[#] [#] [%] [mm] [mm] [mm2] [-] [N/mm2] [N]
370 1 25 0 25 4369 0,000 0 0
2 25 25 55 3947 0,021 3,852 15202
3 25 55 123,75 3712 0,043 7,74 28733
372 1 25 0 16 2909 0,000 0 0
2 25 16 55 5406 0,114 20,52 110937
3 25 55 123,75 3712 0,129 23,22 86198
374 1 25 0 55 8315 0,100 18 149677
2 25 55 123,75 3712 0,043 7,74 28733
376 1 25 0 19 3410 0,014 2,52 8593
2 25 19 55 4906 0,129 23,22 113908
3 25 55 123,75 3712 0,643 115,74 429654
Residual strength [kN] 971,6
Residual MOE [N/mm2] 12573

Delft University of Technology
157 Master of Science thesis E.C.W. Schreurs
Pile nr 2
Diameter [mm] 240
Resi-meas. Dec Nbr
% circumf.
Depth start
Depth end
Size dec.
Aver. Resis. σ Force
[#] [#] [%] [mm] [mm] [mm2] [-] [N/mm2] [N]
351 1 25 0 44 6773 0,000 0 0
2 25 44 60 1709 0,079 14,22 24302
3 25 60 120 2827 0,052 9,36 26465
353 1 25 0 7 1281 0,000 0 0
2 25 7 60 7201 0,089 16,02 115365
3 25 60 120 2827 0,028 5,04 14250
354 1 25 0 45 6892 0,000 0 0
2 25 45 60 1590 0,100 18 28628
3 25 60 120 2827 0,072 12,96 36644
376 1 25 0 24 4072 0,000 0 0
2 25 24 60 4411 0,063 11,34 50018
3 25 60 120 2827 0,032 5,76 16286
Residual strength [kN] 312,0
Residual MOE [N/mm2] 12573
Pile nr 3
Diameter [mm] 248
Resi-meas. Dec Nbr
% circumf. Depth start
Depth end
Size dec.
Aver. Resis. σ Force
[#] [#] [%] [mm] [mm] [mm2] [-] [N/mm2] [N]
400 1 25 0 124 12076 0,000 0 0
402 1 25 0 83 10756 0,000 0 0
2 25 83 124 1320 0,025 4,5 5941
406 1 25 0 34 5715 0,000 0 0
2 25 34 72 4238 0,071 12,78 54162
3 25 72 124 2124 0,042 7,56 16055
407 1 25 0 124 12076 0,000 0 0
Residual strength [kN] 76,2
Residual MOE [N/mm2] 12573
Pile nr 4

Delft University of Technology
158 Master of Science thesis E.C.W. Schreurs
Diameter [mm] 247,5
Resi-meas. Dec Nbr
% circumf.
Depth start
Depth end
Size dec.
Aver. Resis. σ Force
[#] [#] [%] [mm] [mm] [mm2] [-] [N/mm2] [N]
362 1 25 0 34 5701 0,000 0 0
2 25 34 59 3034 0,129 23,22 70440
3 25 59 123,75 3293 0,105 18,9 62234
364 1 25 0 40 6519 0,000 0 0
2 25 40 56 1904 0,124 22,32 42493
3 25 123,75 12028 0,100 18 216497
366 1 25 0 22 3896 0,000 0 0
2 25 22 67 5602 0,053 9,54 53442
3 25 67 123,75 2529 0,068 12,24 30960
368 1 25 0 30 5125 0,000 0 0
2 25 30 57 3404 0,100 18 61263
3 25 57 123,75 3499 0,118 21,24 74327
Residual strength [kN] 611,7
Residual MOE [N/mm2] 12573

Delft University of Technology
159 Master of Science thesis E.C.W. Schreurs
Pile nr 5 Diameter [mm] 247,5
Resi-meas. Dec Nbr
% circumf.
Depth start
Depth end
Size dec.
Aver. Resis. σ Force
[#] [#] [%] [mm] [mm] [mm2] [-] [N/mm2] [N]
339 1 25 0 18 3244 0,000 0 0
2 25 18 50 4511 0,080 14,4 64963
3 25 50 123,75 4272 0,049 8,82 37678
342 1 18,75 0 8 1129 0,050 9 10158
2 18,75 8 50 4688 0,100 18 84388
3 18,75 50 123,75 3204 0,062 11,16 35755
344 1 12,5 0 28 2414 0,041 7,38 17812
2 12,5 28 50 1464 0,063 11,34 16606
3 12,5 50 123,75 2136 0,044 7,92 16916
347 1 18,75 0 4 574 0,000 0 0
2 18,75 4 50 5243 0,063 11,25 58985
3 18,75 50 123,75 3204 0,050 9 28835
349 1 25 0 12 2220 0,000 0 0
2 25 12 19 1190 0,081 14,58 17354
3 25 19 42 3369 0,000 0 0
4 25 42 123,57 5249 0,044 7,875 41335
Residual strength [kN] 430,8
Residual MOE [N/mm2] 12573

Delft University of Technology
160 Master of Science thesis E.C.W. Schreurs
Pile nr 6
Diameter [mm] 235
Resi-meas. Dec Nbr
% circumf.
Depth start
Depth end
Size dec.
Aver. Resis. σ Force
[#] [#] [%] [mm] [mm] [mm2] [-] [N/mm2] [N]
409 1 25 0 36 5627 0,000 0 0
2 25 36 60 2620 0,105 18,9 49520
3 25 60 117,5 2597 0,089 16,02 41599
412 1 25 0 31 4967 0,000 0 0
2 25 31 60 3280 0,115 20,7 67892
3 25 60 117,5 2597 0,095 17,1 44404
414 1 25 0 31 4967 0,000 0 0
2 25 31 60 3280 0,112 20,16 66121
3 25 60 117,5 2597 0,097 17,46 45339
416 1 25 0 36 5627 0,000 0 0
2 25 36 60 2620 0,111 19,98 52349
3 25 60 117,5 2597 0,105 18,9 49078
Residual strength [kN] 416,3
Residual MOE [N/mm2] 12573
Pile nr 7 Diameter [mm] 242,5
Resi-meas. Dec Nbr
% circumf.
Depth start
Depth end
Size dec.
Aver. Resis. σ Force
[#] [#] [%] [mm] [mm] [mm2] [-] [N/mm2] [N]
378 1 25 0 24 4119 0,000 0 0
2 25 24 121,25 7428 0,091 16,38 121670
387 1 25 0 26 4421 0,000 0 0
2 25 26 121,25 7126 0,100 18 128260
389 1 25 0 12 2172 0,000 0 0
2 25 12 44 4687 0,104 18,72 87745
3 25 44 58 1545 0,000 0 0
4 25 58 121,25 3142 0,042 7,56 23754
391 1 25 0 65 9062 0,000 0 0
2 25 65 121,25 2485 0,078 14,04 34890
Residual strength [kN] 396,3
Residual MOE [N/mm2] 12573


![Pile Foundation Design[1] - ITDmtp.itd.co.th/ITD-CP/data/PileFoundationDesign.pdf · Introduction to pile foundations Pile foundation design Load on piles Single pile design Pile](https://img.dokumen.tips/doc/110x75/5a6ffb387f8b9ab1538b8376/pile-foundation-design1-itdmtpitdcothitd-cpdatapilefoundationdesignpdfpdf.jpg)