Embed Size (px)
Citation preview
Detection of Intense Ice Precipitation with GPM/DPR
TOSHIO IGUCHI
NICT, Tokyo, Japan
NOZOMI KAWAMOTO
RESTEC, Tokyo, Japan
RIKO OKI
JAXA, Tsukuba, Japan
(Manuscript received 6 July 2017, in final form 25 December 2017)
ABSTRACT
Detection of ice precipitation is one of the objectives in the Global Precipitation Measurement (GPM)
mission. The dual-frequency precipitation radar (DPR) can provide precipitation echoes at two different
frequencies, which may enable differentiating solid precipitation echoes from liquid precipitation echoes. A
simple algorithm that flags the pixels that contain intense ice precipitation above the height of 2108C is
implemented in version 5 of the DPR products. In the inner swath of DPR measurements in which both Ku-
and Ka-band radar echoes are available, the measured dual-frequency ratio (DFRm) together with the
measured radar reflectivity factor is used to judge the existence of intense ice precipitation. Comparisons of
the flagged pixels with surfacemeasurements show that the algorithm correctly identifies relatively intense ice
precipitation regions. The global distribution of the flagged pixels indicates an interesting difference between
land and ocean, in particular in the distribution of ice precipitation that reaches the surface. The flag is also
expected to be useful for improving precipitation retrieval algorithms by microwave radiometers.
1. Introduction
Global measurement of ice precipitation is needed to
fully understand the water cycle and climate. In partic-
ular, knowing its vertical profiles is important in studies
of latent heating and energy transport. However, be-
cause of sparse observation stations in high-latitude re-
gions, little knowledge has been accumulated about the
global distribution of snowfall or ice precipitation. Mea-
surement from space is themost promising way to change
the state of lacking sufficient observation data.
Measurements of ice precipitation from space have
been carried out in the past with microwave radiome-
ters and the W-band cloud profiling radar (CPR) of
CloudSat (Hiley et al. 2011; Kulie et al. 2016; Liu 2008;
Kulie and Bennartz 2009; Skofronick-Jackson et al.
2013). The CloudSat radar has the highest sensitivity for
snow detection and brought us a reliable observational
distribution of falling snow globally for the first time.
Detection of ice precipitation with a spaceborne radi-
ometer relies on the scattering signal at high-frequency
channels. Combining microwave radiometer data with
CloudSat data has accelerated the improvement of ice
retrieval algorithms for microwave radiometers sub-
stantially (Liu and Seo 2013). Nevertheless, there still
remains large uncertainty in the retrieval algorithms for
both radar and radiometer to detect and quantify ice
precipitation with sufficient accuracy. A major part of
uncertainty originates in large variation of the scattering
properties of ice particles that depend heavily on the kind
of ice particles and the habit of snow crystals. In addition,
in the CloudSat case, the effect of non-Rayleigh scatter-
ing and multiple scattering by ice particles makes the
quantitative retrieval of precipitation rate very difficult in
intense ice precipitation. The CloudSat’s very narrowCorresponding author: Toshio Iguchi, [email protected]
Denotes content that is immediately available upon publica-
tion as open access.
MARCH 2018 IGUCH I ET AL . 491
DOI: 10.1175/JTECH-D-17-0120.1
� 2018 American Meteorological Society. For information regarding reuse of this content and general copyright information, consult the AMS CopyrightPolicy (www.ametsoc.org/PUBSReuseLicenses).
Unauthenticated | Downloaded 12/17/21 04:59 AM UTC

swath and sun-synchronous orbit limit the sampling rep-
resentativeness as well.
One of the objectives of the Global Precipitation
Measurement (GPM) mission was to detect falling snow
with both the GPM microwave imager (GMI) and the
dual-frequency precipitation radar (DPR) on its Core
Observatory spacecraft (Hou et al. 2014; Skofronick-
Jackson et al. 2017). DPR consists of the Ku-band radar
(KuPR) and the Ka-band radar (KaPR). KuPR is a ra-
dar very similar to the precipitation radar (PR) on the
Tropical Rainfall Measuring Mission’s (TRMM’s) sat-
ellite. KaPR was added to increase the sensitivity of
precipitation measurement and to estimate the particle
size more accurately than a single-frequency radar so
that we can improve the estimates of rainfall rate and
identify snow precipitation regions. In fact, by using the
difference in the scattering and attenuation properties
of liquid and solid water particles between Ku- and
Ka-band electromagnetic (EM) waves, it is possible to
estimate the mean diameter of precipitation particles
once an appropriate particle size distribution (PSD)
model is chosen. Since the mean particle size for a given
radar reflectivity differs substantially between liquid
phase and solid phase particles, it is possible in principle
to separate solid phase regions from liquid phase regions.
In a typical stratiform rain system, a bright band is ob-
served in radar echoes so that we can easily separate the
solid precipitation range from the liquid precipitation range.
In a convective system, however, nobright band is observed.
Weneed to take advantage of the difference in radar echoes
of rain and snow between the Ku and Ka bands. One pos-
sible way to achieve this objective is to use the size in-
formation. By combining radar echoes from the common
scattering volumeat twodifferent frequencies, we should be
able to estimate twoparameters of the PSDof precipitation.
Once two independent parameters of PSDare obtained, we
can not only convert radar reflectivity factor into rainfall
rate accurately but also identify and separate solid pre-
cipitation regions from liquid precipitation regions.
In fact, if the attenuation correction is properly realized,
the difference in effective radar reflectivity factor at the two
different frequencies, which is called the dual-frequency
ratio (DFR), gives particle size information because the size
effect caused by non-Rayleigh scattering takes place at the
higher-frequency radar echoes more severely than at the
lower-frequency radar echoes. As a measure of the differ-
ence in effective radar reflectivity factor Ze at the two dif-
ferent frequencies, we define DFR in this paper as follows:
DFR5Ze(Ku)2Z
e(Ka),
where Ze is expressed in decibels of reflectivity factor
(dBZ) and the argument in the parentheses indicates the
frequency band. Since ice particles and snowflakes are
generally larger than raindrops, DFR becomes much
larger for ice or snow precipitation than rain for a given
value of Ze(Ku). For example, if a typical particle size
distribution is assumed, when Ze(Ku)5 25 dBZ, then
DFR from rain echo is about 0 to 21 dB, whereas DFR
from ice precipitation takes a value larger than a few
decibels (3–10dB) depending on the density of ice par-
ticles (Liao andMeneghini 2011). Therefore, for light to
moderate precipitation, DFR can be used to identify the
phase state of precipitating particles.
It is known that attenuation resulting from absorption
by ice particles is very small at both Ka and Ku bands,
but the Ka-band EM waves suffer from attenuation by
liquid phase precipitation much more severely than the
Ku-band EM waves. We define the measured DFR
(DFRm) as
DFRm5Z
m(Ku)2Z
m(Ka),
where Zm is the measured apparent radar reflectivity
factor. If we observe light to moderate precipitation
from above with a dual-frequency radar, then DFRm
takes a value close to DFR in the ice precipitation range
because the attenuation effect is small. However, it may
recover from a finite value to a value close to zero at the
top of the rain range because light rain can produce
only a small value of DFR. ThenDFRm increases in rain
with range as a result of the attenuation difference be-
tween the Ka- and Ku-band channels that increases
monotonically with range.
After the GPM Core Observatory satellite was
launched, however, it became apparent that combining
the dual-frequency precipitation echoes to extract PSD
information is much more difficult than we anticipated.
To obtain accurate DFR from measured radar echo
data, we need to correct for the attenuation in Zm(Ku)
and Zm(Ka), but the accurate attenuation correction
turned out to be very difficult. This is because, first, we
need to know the phase state of the precipitating parti-
cles (solid or liquid) to calculate the attenuation from
Zm at each range bin, but the phase state can be esti-
mated from DFR only after we make the attenuation
correction. Thus, we may end up with a circular algo-
rithm that may not correctly estimate the phase state.
Theoretically, we can calculate the attenuation by as-
suming either a liquid or solid phase of the particles at
each range bin, and choose the one that produces amore
natural or reasonable solution. In reality, however, small
errors in the estimates and fluctuation of signals make it
very difficult to judge whether an increase in DFRm in a
particular range is caused by the size effect or by at-
tenuation and to determine the phase state.
492 JOURNAL OF ATMOSPHER IC AND OCEAN IC TECHNOLOGY VOLUME 35
Unauthenticated | Downloaded 12/17/21 04:59 AM UTC
The second reason for difficulty in attenuation cor-
rection is that some assumptions in the simple radar
equation used in the attenuation correction are not
necessarily satisfied, especially in measurement of an
intense convective storm. The most important assump-
tion of this kind is the assumption of uniformity of
precipitation within the scattering volume. Since typical
horizontal dimensions of a convective system are
smaller than or comparable to the radar beam diameter,
uniformity of precipitation within the scattering volume
may not be an appropriate assumption. Depending on
the degree of nonuniformity and the spatial correlation
of the distribution of precipitating particles between
different range bins, the effective attenuation may
change drastically even if the measured Zm profiles are
identical. The attenuation estimate given by the surface
reference technique may also be severely biased if the
rain distribution is not uniform within the beam.
In a very intense convective precipitation system
with a substantial amount of ice aloft, multiple scattering
by ice particles may further complicate the problem.
Since the scattering cross section is larger at the Ka band
than at the Ku band, the multiple-scattering effect ap-
pears first in Ka-band echoes, and the multiple scattered
echoes often appear at ranges that are not the true
ranges from the radar to the volumes where the multiple
scattering dominantly takes place because of compli-
cated echo paths of multiple scattering. Attenuation by
cloud liquid water is also another factor of uncertainty.
The uncertainty factorsmentioned abovemake it very
difficult to estimate Ze accurately from Zm by attenua-
tion correction at the two frequencies. Since the esti-
mation of PSD needs an accurate estimate of DFR,
small errors in attenuation correction have a fatal effect.
Given such a difficult situation, we decided to
develop a simple algorithm that flags the pixels in two-
dimensional space that contain relatively intense ice
precipitation somewhere in the vertical column with
certainty. The algorithm uses only the magnitudes of
measured dual-frequency ratio (DFRm) and radar re-
flectivity factors together with ancillary temperature
data. The algorithm is not intended to identify all solid
precipitation regions, but to detect intense ice pre-
cipitation that includes intense snow precipitation. Even
if the algorithm misses many light ice precipitation, in-
formation about the distribution of intense ice pre-
cipitation will complement the ice measurements by
microwave radiometers or cloud profiling radar like
CloudSat and should be of use to understand the global
climate related to ice precipitation. Just as CloudSat
data helped the improvement of ice retrieval algorithms
formicrowave radiometer, The new ice flag fromDPR is
expected to help improving microwave radiometer’s
retrievals of precipitation that contains intense con-
vection. The flag created by this algorithm is called
flagHeavyIcePrecip. Note that there is another new flag
denoted by flagSurfaceSnowfall in the DPR V5 output
that indicates falling snow at or near surface (Le et al.
2017). This paper describes the algorithm that creates
the former flag and shows some examples of its
performances.
2. Algorithm
KuPR scans its 49 beams in the cross-track direction
with the swath width of 250 km. KaPR’s matched scan
consists of 25 beams that match with the central 25
beams of KuPR (Kubota et al. 2014; Iguchi et al. 2017).
We call this narrow central swath the inner swath. The
swath of KuPR outside the inner swath is called the
outer swath. The new algorithm flags those beams in
which intense ice precipitation is detected above the
2108C isotherm height. DFRm is used in the inner swath
where dual-frequency information is available, whereas
in the outer swath of the DPR products and in the Ku-
only or Ka-only products, measured radar reflectivity
factors (Zm) are used to set the flag. The flags from Ku-
only and Ka-only judgment are also stored in the inner
swath of the DPR products.
The dual-frequency algorithm for detecting intense
ice precipitation is based on the property that the dual-
frequency ratio (DFR) becomes rather large when
precipitation particles are large. Size effect makes
Ze(Ka) smaller than Ze(Ku) always for ice particles and
for medium to large liquid particles. Matrosov (1998)
shows that DFR at Ka and X band (or other longer
wavelengths such as C or S band) is nearly independent
of the density of snow particles, but only depends on its
median diameter (Liao and Meneghini 2011). Similar
argument is also applicable to the combination of the Ka
and Ku bands. In fact, the DFR caused by ice particles
may exceed a few dB when the median or mean particle
size is large (Liao et al. 2005). In particular, aggregates
of snowflakes create very large DFRs (Tyynelä and
Chandrasekar 2014). Since the ice precipitation particles
are generally larger than raindrops, we can expect that
DFRs are larger in ice precipitating regions than in
raining regions (Liao and Meneghini 2011).
We decided to use DFRm instead of DFR itself in
order to avoid errors originating from unreliable atten-
uation correction. As a result, DFRm may take a large
value not only when precipitation particles are large but
also when the attenuation in Ka-band echoes becomes
significant. The latter situation may happen, for exam-
ple, in rainfall regions, where Zm(Ka) decreases with
rangemore rapidly thanZm(Ku) by attenuation. In solid
MARCH 2018 IGUCH I ET AL . 493
Unauthenticated | Downloaded 12/17/21 04:59 AM UTC

precipitation layers, however, attenuation by absorption
can be ignored because the imaginary part of dielectric
constant of ice is negligibly small at both Ku and Ka
bands. Attenuation by scattering can generally be ig-
nored at the Ku band, whereas that at the Ka band may
become nonnegligible and decrease the apparent re-
flectivity when ice precipitation is intense. This attenu-
ation effect may further increase the value of DFRm in
addition to the size effect. If the ice precipitation is very
intense, then multiple scattering at the Ka band may
compensate for the attenuation effect and sometimes
decreaseDFRm at far ranges to produce a so-called knee
in the DFRm profile (Battaglia et al. 2015). In such a
case, because of large attenuation, DFRm takes a rather
large value at a range well before themultiple-scattering
effect appears. Since we look only at the maximum
DFRm value in each profile, the flag is set because of the
large DFRm above the height where the knee appears.
Since spaceborne radar measurements begin at the
storm top, it can be assumed that solid (ice) hydrome-
teors, if present, will generally occur at ranges closer to
the radar than liquid (water) hydrometeors. Above the
height of 2108C, we can assume that large precipitation
particles are solid and that only small liquid drops may
exist in a supercooled state (Williams et al. 1989). The
total attenuation caused by small liquid drops that include
water cloud droplets is very difficult to estimate, but it is
unlikely that theKa-band attenuation down to the2108Cheight exceeds 3dB (Liebe et al. 1989). Considering the
size effect and the attenuation effect, therefore, if a
DFRm larger than approximately 5dB is measured above
the 2108C isotherm, it must be caused by large ice par-
ticles or a thick layer of intense ice precipitation.
In the current case,we set the threshold to 7dB inorder to
be on the safe side. This threshold value of DFRm is de-
terminedby referring toFigs. 1 and 4 inLiao andMeneghini
(2011) and by some trial and error with actual DPR data.
When the radar reflectivity factor is calculated from
the received power, the background noise power is
subtracted from the received power. Since these sam-
pled powers suffer from fading noise, the calculated Zm
includes a relatively large fluctuation error when the
received power is very close to the noise power. If
Zm(Ka) is negatively biased in such a situation, then the
calculated DFRmmay be positively biased substantially.
To ensure that DFRm larger than 7dB can be judged
with certainty even when the KaPR’s received power is
close to the noise level, we impose another condition
that Zm(Ku) must be larger than 27 dBZ at the same
range bin in which the corresponding DFRm is evalu-
ated. KaPR’s relatively low sensitivity limits the de-
tectability of ice precipitation with the DFRm method.
If the high-sensitivity beams of KaPR are matched with
the KuPR beams (which is envisioned in future opera-
tions), since its minimum detectable Zm is about 6 dB
better than the current KaPR’s matched beams, then we
should be able to lower the threshold for KuPR ac-
cordingly and to improve the identification of ice pre-
cipitation regions.
Note that in order to avoid erroneous flagging associated
with large DFRm caused by attenuation as a result of the
liquid phase of precipitation, only data from the storm top to
2108Cheight are looked at, and that if the abovementioned
conditions are satisfied at any range bin within the interval,
then the flag is set for the angle bin that contains this profile.
Heavy ice precipitation flags are provided for the Ku-
only and Ka-only products and in the outer swath of the
DPR products as well. Since only single-frequency radar
echoes are available in these cases, the flag is set by looking
at the maximum measured radar reflectivity above the
2108C height based on the following reasoning.
It is known that intense precipitation is associated with
formation of ice particles created in a strong updraft in a
convective cell. In particular, thunderstorms and light-
ning are caused by ice particles. Such intense storms are
judged by large reflectivity factors resulting from rela-
tively large ice particles at altitudes above the freezing
height. It is generally accepted that 40 dBZ of reflectivity
at the 2108C height is a good threshold for detecting
lightning activities (Williams et al. 1989; Zipser and Lutz
1994; Liu et al. 2012). We adopt this criterion for flagging
the existence of intense ice precipitation in the Ku-only
single-frequency algorithm. The same height is selected
as the lower bound in the DFRm method in the DPR
algorithm as well. It is known, however, that the re-
lationship between themagnitude of the radar reflectivity
factor and the lightning activity is rather complicated and
differs substantially between oceanic storms and conti-
nental storms (Petersen et al. 1996). To deal with such
variation and uncertainty, different values are set in the
flag at 40 6 5-dBZ thresholds for KuPR profiles as well.
Since the Ka-band reflectivity is generally a few decibels
lower than the correspondingKu-band reflectivity because
of the size effect from large particles and the attenuation
caused by scattering in an intense storm, the threshold
levels for ice detection with the KaPR are lowered by 5dB
from the corresponding Ku-band thresholds.
With these properties in mind, we adopt the following
conditions to set a flag called flagHeavyIcePrecip that is
added to the output of version 5 of the DPR products.
The adjective heavy used in the name of the flag means
intense precipitation and not heavy or dense ice particles.
The actual code was implemented in the classification
module of the DPR, Ku-only, and Ka-only algorithms.
The flag uses 5 bits and takes values between 00000band 11111b in a binary expression. We first define x1, x2,
494 JOURNAL OF ATMOSPHER IC AND OCEAN IC TECHNOLOGY VOLUME 35
Unauthenticated | Downloaded 12/17/21 04:59 AM UTC

and x3 according to the following rules by examining the
data in each profile above the 2108C isothermal height.
1) Condition on DFRm and Zm at the same range bin
x15
8<:
10000b, if max of DFR
m. 7 dB
and Zm(Ku). 27 dBZ ,
00000b, otherwise.
2) Condition on the maximum of KuPR’s Zm
x25
8>>>>>>><>>>>>>>:
00100b, if 35 dBZ,max ofZ
m(Ku)
# 40 dBZ
01000b, if 40 dBZ,max ofZ
m(Ku)
# 45 dBZ
01100b, if 45 dBZ,max ofZ
m(Ku)
00000b, otherwise.
3) Condition on the maximum of KaPR’s Zm
x35
8>>>>>>><>>>>>>>:
00001b. if 30 dBZ,max ofZ
m(Ka)
# 35 dBZ
00010b, if 35 dBZ,max ofZ
m(Ka)
# 40 dBZ
00011b, if 40 dBZ,max ofZ
m(Ka)
00000b, otherwise.
The value of flagHeavyIcePrecip is the sum of the
variables x1, x2, and x3,
flagHeavyIcePrecip5 x11 x21 x3:
From this construction of the 5-bit flag, it is evident
that the most significant bit represents the fulfillment of
condition A, the next two bits condition B with KuPR’s
Zm, and the last two bits condition C with KaPR’s Zm.
Note that DFRm is examined only when KuPR’sZm is
larger than 27dBZ in order to avoid misjudgment re-
sulting from the noisy signal of KaPR when its echo is
weak. With the condition of Zm(Ku). 27dBZ for ice
precipitation detection, most light ice precipitation will be
missed by this algorithm. Nevertheless, the test results
shown in the following two sections indicate that theDFRm
algorithm (conditionA) can detect intense ice precipitation
more frequently than the condition B or C. Note that con-
ditions A and C are applicable only in the inner swath,
whereas condition B is examined in the full swath.
3. Performance of the algorithm
We compared the distribution of pixels flagged by
flagHeavyIcePrecip with ground-based measurements
in three cases.
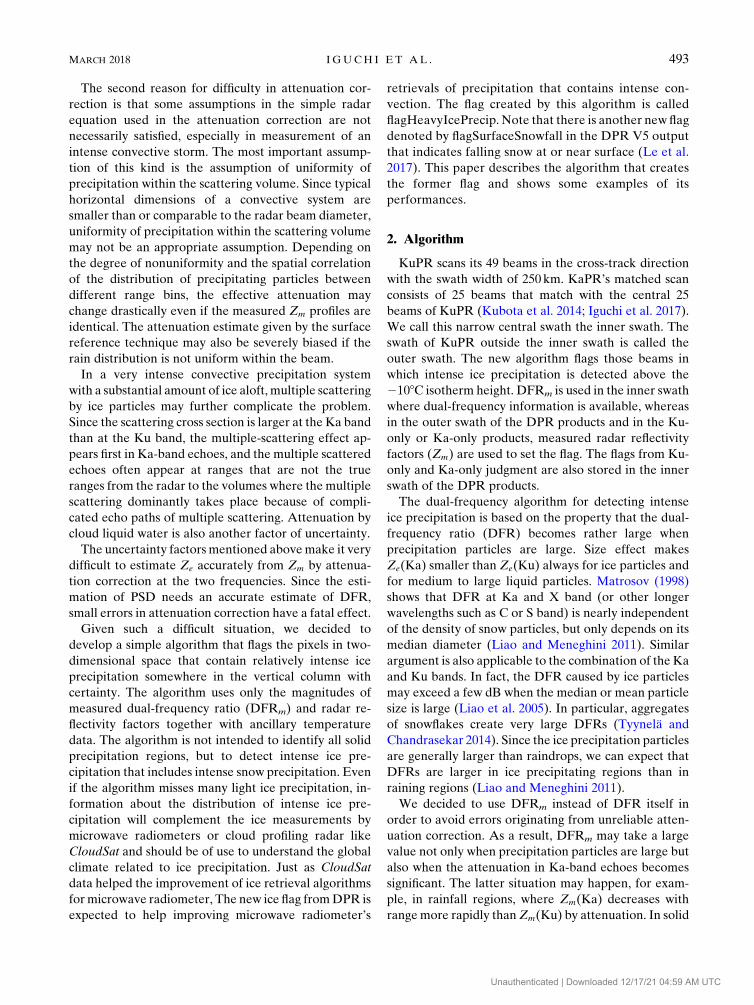
Figure 1 shows the case with a very intense hailstorm
off the coast of Naples in Italy on 5 September 2015
(orbit number: 8630, scan: around 4938, time: 0848:11
UTC). Very low brightness temperatures measured at
the high-frequency channels of GPM/GMI indicate the
presence of a large amount of ice particles within the
storm. Ground-based polarimetric radar data also sup-
port the presence of large graupel/hail particles. In fact,
baseball-size hailstones were observed at the surface
during this violent hailstorm event (Marra et al. 2017).
Figure 1a shows the vertical cross sections of measured
Zm(Ku) with contour lines and DFRm with color. The
broken line near 6km indicates the 2108C height. Since
hail will produce large reflectivity factors, the conditions B
and C are easily met. The regions where condition A is
satisfied correspond to yellow-to-red areas above the
2108C height in this figure. Figure 1b shows the output
from flagHeavyIcePrecip. Red pixels are the pixels that
satisfy condition A. In this particular case, the regions that
satisfy conditionA nearly correspond to the regions where
condition B [Zm(Ku). 35 dBZ] or C [Zm(Ka). 30 dBZ]
is satisfied. Note that the region withZm(Ku). 40 dBZ in
Fig. 1a is always inside the region with DFRm. 7 dB. This
fact implies that condition A can be used to detect graupel
and hail, since reflectivity factors larger than 40dBZ at or
above2108Cheight generally indicate the existence of hail
or graupel (Williams et al. 1989).
Figure 2 shows an intense hailstorm case near Fort
Worth, Texas, on 26 May 2015 (orbit number: 7052,
scan: around 5150, time: 2224:23 UTC). This storm was
measured with a ground-based polarimetric radar at al-
most exactly the same time (2225:19 UTC) as well.
Figure 2a shows the hydrometeor types identified by a
polarimetricmethod at the height of 4km.Hail regions are
denoted in red, and wet and dry graupel regions are shown
in yellow and green, respectively. This storm was over-
passed by the GPM Core Observatory satellite 1min ear-
lier. Figure 2b shows the output from theDPR product. In
this case, all three conditions, A–C, aremet atmany pixels.
Since Ka-band echoes are available only in the inner
swath ofmeasurement, conditionB is the only information
we can use from flag flagHeavyIcePrecip in the outer
swath. In this outer part of the swath, Fig. 2d shows that the
distribution of dark blue and red pixels agrees pretty well
with hail regions identified by the ground-based radar,
confirming the premise that 40dBZ at to above 2108Cheight is a good threshold for the detection of hail.
In the inner part of the swath, the regions flagged by
condition A and condition B or Cmatch pretty well with
the hail or graupel regions classified by the polarimetric
radar. It seems that the regions flagged by condition A
are somewhat wider than the regions with hail or graupel
identified by the ground-based radar. This disagreement
MARCH 2018 IGUCH I ET AL . 495
Unauthenticated | Downloaded 12/17/21 04:59 AM UTC
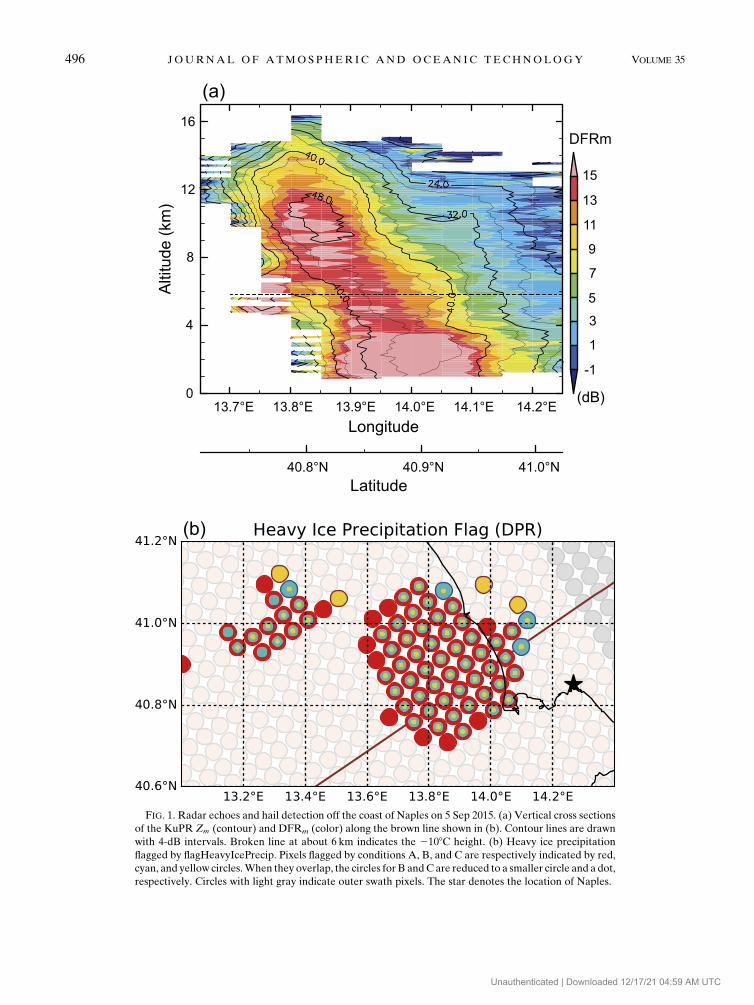
FIG. 1. Radar echoes and hail detection off the coast of Naples on 5 Sep 2015. (a) Vertical cross sections
of the KuPR Zm (contour) and DFRm (color) along the brown line shown in (b). Contour lines are drawn
with 4-dB intervals. Broken line at about 6 km indicates the 2108C height. (b) Heavy ice precipitation
flagged by flagHeavyIcePrecip. Pixels flagged by conditions A, B, and C are respectively indicated by red,
cyan, and yellow circles.When they overlap, the circles for B andC are reduced to a smaller circle and a dot,
respectively. Circles with light gray indicate outer swath pixels. The star denotes the location of Naples.
496 JOURNAL OF ATMOSPHER IC AND OCEAN IC TECHNOLOGY VOLUME 35
Unauthenticated | Downloaded 12/17/21 04:59 AM UTC
may partly come from the comparison of the flags that are
determined from the profile data with the hydrometeor
identification map at the particular height of 4km.
The figure shows that the regions that satisfy condition
A are mostly larger than the regions flagged by B or C,
and that the dual-frequency method is more sensitive to
the intense ice precipitation. In fact, a comparison of
Figs. 2b and 2d shows that the regions flagged by condition
A are closer to the regions flagged by condition Bwith the
35-dBZ threshold than those with 40 or 45dBZ. Similarly,
Fig. 2c shows that even in this rather intense hailstorm
case, KaPR’s reflectivity factor exceeds 35dBZ only at a
few pixels and never exceeds 40dBZ and that the regions
flagged by conditionCwith theKaPR’s 30-dBZ threshold
(light blue in Fig. 2c, yellow dot in Fig. 2b) agree pretty
well with the regions flagged by condition B with the
KuPR’s 40-dBZ threshold (dark blue and red pixels in
Fig. 2d). The difference caused by different thresholds
may be used to characterize the storms in future studies.
A widespread snowstorm hit the northeastern part of
Japan on 18 January 2016 (local time). Figure 3a shows the
vertical cross sections of Ku-band’s Zm (contour lines) and
DFRm (color) along the brown line in Figs. 3b and 3c. The
contour lines are drawn with 2.5-dB intervals, and the re-
gions of DFRm larger than 7dB are indicated by warm
colors (from yellow through red to pink) in the figure.
Figure 3b shows the estimated attenuation-corrected radar
reflectivity factor (Ze) at 2km above sea level given by
KuPR’s standard product (orbit number: 10725, scan:
around 2935, time: 0001:56, 18 January 2016UTC). It shows
that the storm is widespread and distributes rather uni-
formly. There are about 100 stations in the Japan
FIG. 2. Hail detection in the thunderstorm near Fort Worth on 26 May 2015. (a) Hydrometeor identification by
a ground-based polarimetric radar (provided by Dr. Cecil); BD5 big drops/melting hail, HA5 hail, WG5 high-
density graupel, DG5 low-density graupel, VI5 vertical ice, WS5 wet snow, DS5 dry snow, CR5 ice crystals,
RN 5 rain, DZ 5 drizzle, UC 5 unclassified. (b) Output from flagHeavyIcePrecip from DPR; pixels are color
coded as in Fig. 1b. (c) Output from flagHeavyIcePrecip from KaPR; cyan: 30 dBZ,Zm # 35 dBZ, dark blue:
35 dBZ,Zm # 40 dBZ. (d) Output from flagHeavyIcePrecip fromKuPR; cyan: 35 dBZ,Zm # 40 dBZ, dark blue:
40 dBZ,Zm # 45 dBZ, red: 45 dBZ,Zm. Circles with light gray indicate outer swath pixels.
MARCH 2018 IGUCH I ET AL . 497
Unauthenticated | Downloaded 12/17/21 04:59 AM UTC

Meteorological Agency’s (JMA) Automatic Meteorologi-
cal Data Acquisition System (AMeDAS) within the area
shown in this figure. Almost all of them recorded a tem-
perature lower than 2.58Cand only a few stations reported a
temperature between 2.58 and 58C. Either snow or sleet was
observed at all of the JMA’s 13 ground observatories lo-
cated in the part of the main island of Japan depicted in
this figure.
As shown in Fig. 3c, conditionA ismet at several places,
and the flagHeavyIcePrecip is set at many pixels in the
swath. In this particular case, neither condition B nor C is
satisfied except at one pixel at 38.38N, 138.78E, wherecondition Bwith the threshold 35dBZ is barely fulfilled. A
possible reason for this large difference in flagging by
conditions A and B is that aggregates of snow crystals may
be the dominant ice particles in this storm, since they can
produce large DFR even for relatively small Zm(Ku)
(Tyynelä and Chandrasekar 2014). This example proves
that this flag is set not only by hail but also some intense
snow or graupel. We can generally say that the cases sat-
isfied by condition B are a subset of those satisfied by
condition A. As a result, we can use the x1 part of the flag
as an indicator of intense ice or snow precipitation,
whereas x2 or x3 can be used to detect thunderstorms.
4. Global distribution of intense ice precipitation
Since we have confirmed that the new flag is properly
set at pixels with intense ice precipitation, we looked at
the global distribution of the flagged pixels in 2015.
FIG. 3. Detection of intense ice precipitation over northern Japan on 18 Jan 2016. (a) Vertical cross sections of
KuPR’sZm (contour lines with every 2.5-dB intervals) andDFRm (color) along the brown line shown in (b) and (c).
(b) Estimated radar reflectivity factor (Ze) in dBZ at 2 km. (c) Pixels flagged by flagHeavyIcePrecip in the DPR
product. Color code as in Fig. 1. Circles with light gray indicate outer swath pixels.
498 JOURNAL OF ATMOSPHER IC AND OCEAN IC TECHNOLOGY VOLUME 35
Unauthenticated | Downloaded 12/17/21 04:59 AM UTC
Figure 4a shows the percentage of observation pixels in
which flagHeavyIcePrecip indicates that conditionA is set
in each 28 3 28 box in 2015. Figure 4b shows the corre-
sponding percentage in which KuPR’s maximum Zm is
larger than 40dBZ above the 2108C height, that is, con-
dition B with x2$ 01000b. This condition generally im-
plies that there are enough graupel hydrometeors to create
thunder and lightning. The fact that flagHeavyIcePrecip
with condition A occurs more frequently than that with
Zm . 40 dBZ also implies that condition A has a higher
sensitivity to intense ice precipitation.
Detection of intense ice precipitation does not nec-
essarily mean that solid precipitation reaches the sur-
face. In fact, most ice precipitation detected in the
tropics exists only at very high altitudes. To see whether
the ice particles are reaching the actual surface in those
cases, only the cases in which flagHeavyIcePrecip is set
are counted and at the same time the surface air tem-
perature is approximately below 18C. This temperature
was estimated from the value stored in ‘‘phase’’ variable
at the surface range bin determined by the KuPR. The
temperature data used to create standard GPM prod-
ucts are taken from the Global Analysis Dataset
(GANAL) created by the JMA (Iguchi et al. 2017).
The value stored in phase is calculated at the center of
the range bin from the GANAL temperature data and
rounded down to the nearest integer. As a result, as-
suming that the radar correctly identifies the surface
range bin, the actual air temperature at the surface
should be lower than approximately 18C considering
the round-off error and the maximum possible height
bias of 62.5m resulting from the quantization of range
samples. Since surface snowfall occurs even when the
surface air temperature is a few degrees above 08C,18C is considered as a conservative threshold (Sims
and Liu 2015).
The results are shown in Fig. 4c. In these cases we can
assume that ice precipitation reaches the surface without
melting. An interesting observation is the relatively high
occurrence of intense ice precipitation over the Ant-
arctic Ocean, which is also found with CloudSat obser-
vations (Liu 2008; Kulie et al. 2016). Since only very
intense ice precipitation is flagged in the current algo-
rithm, the frequency of detecting ice precipitation is
much lower with DPR than with CloudSat, but the
patterns of frequency distribution have some similarity.
However, relatively frequent detection of ice pre-
cipitation over the North Atlantic Ocean to the south of
Greenland and over the Sea ofOkhotsk and theBering Sea
is not seen in the snowfall fraction derived from CloudSat
data (Fig. 6a in Kulie et al. 2016). Its distribution seems to
resemble more the distribution of the mean annual liquid
equivalent snowfall (Fig. 6b in Kulie et al. 2016). This is not
surprising if intense ice precipitation contributes much to
the total amount of liquid equivalent ice precipitation.
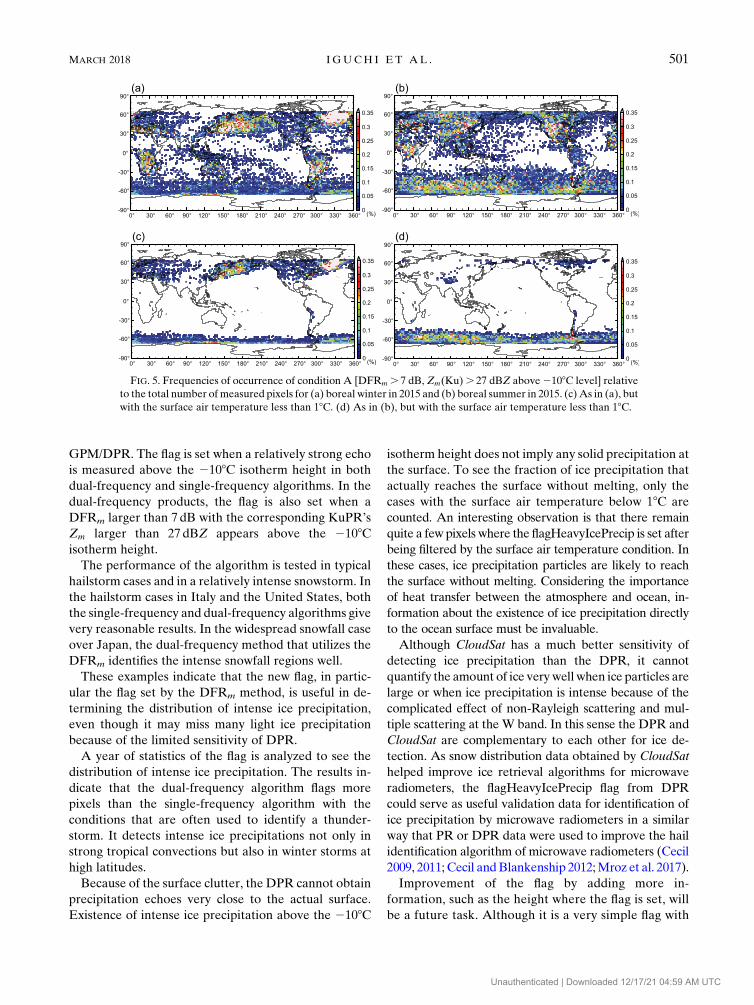
To see the seasonal variation, similar figures aredrawn for
the boreal winter (January, February, and December) and
summer (June–August) months in 2015 (Fig. 5). Relatively
high percentage regions in the tropics and subtropics, such
as those in central Africa, South America, and Australia,
in Figs. 5a and 5b correspond well with active lightning re-
gions in those seasons. This observation is not surprising
whenwe think that lightning is associatedwith the existence
of ice particles, in particular graupel, at high altitudes.
In the high-latitude regions, however, the regions
flagged with condition A are not related to lightning
regions. It is well-known that some lightning occurs east
of Japan over the North Pacific Ocean in winter. How-
ever, the occurrence of condition A in the North Pacific
Ocean and the North Atlantic Ocean in boreal winter is
very frequent and out of proportion to lightning activi-
ties compared with other regions.
As inferred from the difference between Figs. 4a and
4b, the pixels flagged by conditionA in high latitudes are
not necessarily associated with intense storms. In other
words, these pixels are flagged by large ice particles,
such as large snowflakes or aggregates, but not neces-
sarily by particles associated with strong convections.
To see how often such flagged ice precipitation actually
reaches the surface, the data are filtered with the condition
that the surface air temperature is below 18C. Figures 5cand 5d show the results. All flagged boxes in the tropics and
subtropical regions in Figs. 5a and 5b disappear, and only
boxes at high-latitudinal regions remain. The distribution of
intense ice precipitation pixels in Fig. 5c shows that there
are frequent surface-reaching snowfalls in marginal seas
of the northwestern Pacific Ocean (the Sea of Okhotsk
and theBeringSea) andof thenorthwesternAtlanticOcean
to the south of Greenland, including Buffin Bay and Hud-
son Bay. It is also interesting to note that some ice pre-
cipitation reaches the sea surface without melting over the
Antarctic Ocean even in austral summer. Less frequently
but similar summer ice precipitation to the ocean surface
can be seen in Fig. 5d between Canada and Greenland.
As described in the algorithm section, the intense ice
precipitation flag is based on the echoes above the es-
timated 2108C height. The surface air temperature is
taken from the GANAL data stored in the standard
GPM products. Although these temperatures may have
some error, the error cannot be so large as to invalidate
the abovementioned observation.
5. Summary
To detect intense falling snow, graupel, and hail, a new
flag was introduced in the version 5 products of the
MARCH 2018 IGUCH I ET AL . 499
Unauthenticated | Downloaded 12/17/21 04:59 AM UTC

FIG. 4. Frequencies at which flagHeavyIcePrecip was set with different conditions over 28 3 28 boxesin 2015. (a) Percentage of occurrences in which flagHeavyIcePrecip is set by condition A [DFRm . 7 dB,
Zm(Ku) . 27 dBZ above 2108C level]. (b) Percentage of occurrences in which the maximum of Zm of
KuPR above the 2108C height exceeds 40 dBZ (condition B with x2$ 01000b). (c) Percentage of oc-
currences in which flagHeavyIcePrecip is set by conditionA and the surface air temperature is below 18C.Percentages are calculated relative to the total number of the measured pixels that include no rain pixels.
500 JOURNAL OF ATMOSPHER IC AND OCEAN IC TECHNOLOGY VOLUME 35
Unauthenticated | Downloaded 12/17/21 04:59 AM UTC
GPM/DPR. The flag is set when a relatively strong echo
is measured above the 2108C isotherm height in both
dual-frequency and single-frequency algorithms. In the
dual-frequency products, the flag is also set when a
DFRm larger than 7dB with the corresponding KuPR’s
Zm larger than 27 dBZ appears above the 2108Cisotherm height.
The performance of the algorithm is tested in typical
hailstorm cases and in a relatively intense snowstorm. In
the hailstorm cases in Italy and the United States, both
the single-frequency and dual-frequency algorithms give
very reasonable results. In the widespread snowfall case
over Japan, the dual-frequency method that utilizes the
DFRm identifies the intense snowfall regions well.
These examples indicate that the new flag, in partic-
ular the flag set by the DFRm method, is useful in de-
termining the distribution of intense ice precipitation,
even though it may miss many light ice precipitation
because of the limited sensitivity of DPR.
A year of statistics of the flag is analyzed to see the
distribution of intense ice precipitation. The results in-
dicate that the dual-frequency algorithm flags more
pixels than the single-frequency algorithm with the
conditions that are often used to identify a thunder-
storm. It detects intense ice precipitations not only in
strong tropical convections but also in winter storms at
high latitudes.
Because of the surface clutter, the DPR cannot obtain
precipitation echoes very close to the actual surface.
Existence of intense ice precipitation above the 2108C
isotherm height does not imply any solid precipitation at
the surface. To see the fraction of ice precipitation that
actually reaches the surface without melting, only the
cases with the surface air temperature below 18C are
counted. An interesting observation is that there remain
quite a few pixels where the flagHeavyIcePrecip is set after
being filtered by the surface air temperature condition. In
these cases, ice precipitation particles are likely to reach
the surface without melting. Considering the importance
of heat transfer between the atmosphere and ocean, in-
formation about the existence of ice precipitation directly
to the ocean surface must be invaluable.
Although CloudSat has a much better sensitivity of
detecting ice precipitation than the DPR, it cannot
quantify the amount of ice verywell when ice particles are
large or when ice precipitation is intense because of the
complicated effect of non-Rayleigh scattering and mul-
tiple scattering at the W band. In this sense the DPR and
CloudSat are complementary to each other for ice de-
tection. As snow distribution data obtained by CloudSat
helped improve ice retrieval algorithms for microwave
radiometers, the flagHeavyIcePrecip flag from DPR
could serve as useful validation data for identification of
ice precipitation by microwave radiometers in a similar
way that PR or DPR data were used to improve the hail
identification algorithm of microwave radiometers (Cecil
2009, 2011; Cecil andBlankenship 2012;Mroz et al. 2017).
Improvement of the flag by adding more in-
formation, such as the height where the flag is set, will
be a future task. Although it is a very simple flag with
FIG. 5. Frequencies of occurrence of condition A [DFRm . 7 dB, Zm(Ku). 27 dBZ above2108C level] relative
to the total number of measured pixels for (a) boreal winter in 2015 and (b) boreal summer in 2015. (c) As in (a), but
with the surface air temperature less than 18C. (d) As in (b), but with the surface air temperature less than 18C.
MARCH 2018 IGUCH I ET AL . 501
Unauthenticated | Downloaded 12/17/21 04:59 AM UTC

room for improvement, the new flag must be of help to
researchers in the study of ice precipitation, in partic-
ular in combination with data from cloud radar or mi-
crowave radiometers.
Acknowledgments. The authors would like to express
their gratitude to Dr. Daniel J. Cecil of NASA’s
Marshall Space Flight Center for providing us with
Fig. 2a. Thanks are also due to Prof. Tomoo Ushio of
Tokyo Metropolitan University for the informative
discussion about radar measurement of thunderstorms.
We are grateful to the anonymous reviewers for their
valuable suggestions, which helped to improve the
manuscript. Funding for this work was provided by
NICT and JAXA.
REFERENCES
Battaglia, A., S. Tanelli, K. Mroz, and F. Tridon, 2015: Multiple
scattering in observations of the GPM dual-frequency pre-
cipitation radar: Evidence and impact on retrievals.
J. Geophys. Res. Atmos., 120, 4090–4101, https://doi.org/
10.1002/2014JD022866.
Cecil, D. J., 2009: Passive microwave brightness temperature as
proxies for hailstorms. J. Appl. Meteor. Climatol., 48, 1281–
1286, https://doi.org/10.1175/2009JAMC2125.1.
——, 2011: Relating passive 37-GHz scattering to radar profiles in
strong convection. J. Appl. Meteor. Climatol., 50, 233–240,
https://doi.org/10.1175/2010JAMC2506.1.
——, and C. B. Blankenship, 2012: Toward a global climatology
of severe hailstorms as estimated by satellite passive micro-
wave images. J. Climate, 25, 687–703, https://doi.org/10.1175/
JCLI-D-11-00130.1.
Hiley, M. J., M. S. Kulie, and R. Bennartz, 2011: Uncertainty analysis
for CloudSat snowfall retrievals. J. Appl. Meteor. Climatol., 50,
399–418, https://doi.org/10.1175/2010JAMC2505.1.
Hou, A., and Coauthors, 2014: The Global Precipitation Mea-
surement mission. Bull. Amer. Meteor. Soc., 95, 701–722,
https://doi.org/10.1175/BAMS-D-13-00164.1.
Iguchi, T., S. Seto, R. Meneghini, N. Yoshida, J. Awaka, M. Le,
V. Chandrasekar, and T. Kubota, 2017: GPM/DPR level-2
algorithm theoretical basis document. JAXA–NASA Tech.
Rep., 81 pp., http://www.eorc.jaxa.jp/GPM/doc/algorithm/
ATBD_DPR_201708_whole_1.pdf.
Kubota, T., and Coauthors, 2014: Evaluation of precipitation es-
timates by at-launch codes of GPM/DPR algorithms using
synthetic data from TRMM/PR observations. IEEE J. Sel.
Top. Appl. Earth Obs. Remote Sens., 7, 3931–3944, https://doi.org/10.1109/JSTARS.2014.2320960.
Kulie, M. S., and R. Bennartz, 2009: Utilizing spaceborne radars
to retrieve dry snowfall. J. Appl. Meteor. Climatol., 48,
2564–2580, https://doi.org/10.1175/2009JAMC2193.1.
——, L. Milani, N. B. Wood, S. A. Tushaus, R. Bennartz, and T. S.
L’Ecuyer, 2016: A shallow cumuliform snowfall census using
spaceborne radar. J. Hydrometeor., 17, 1261–1279, https://
doi.org/10.1175/JHM-D-15-0123.1.
Le, M., V. Chandrasekar, and S. Biswas, 2017: An algorithm to
identify surface snowfall fromGPMDPR observations. IEEE
Trans. Geosci. Remote Sens., 55, 4059–4071, https://doi.org/10.1109/TGRS.2017.2687420.
Liao, L., andR.Meneghini, 2011: A study on the feasibility of dual-
wavelength radar for identification of hydrometeor phases.
J. Appl. Meteor. Climatol., 50, 449–294, https://doi.org/
10.1175/2010JAMC2499.1.
——,——, T. Iguchi, and A. Detwiler, 2005: Characterizing falling
snow using multifrequency dual-polarization measurements.
J. Atmos. Oceanic Technol., 22, 1494–1506, https://doi.org/
10.1175/JTECH1808.1.
Liebe, H. J., T. Manabe, andG. A. Hufford, 1989:Millimeter-wave
attenuation and delay rates due to fog/cloud conditions. IEEE
Trans. Antennas Propag., 37, 1617–1623, https://doi.org/
10.1109/8.45106.
Liu, C., D. J. Cecil, E. J. Zipser, K. Kronfeld, and R. Robertson,
2012: Relationships between lightning flash rates and radar
reflectivity vertical structures in thunderstorms over the
tropics and subtropics. J. Geophys. Res., 117, D06212, https://
doi.org/10.1029/2011JD017123.
Liu, G., 2008: Deriving snow cloud characteristics from CloudSat
observations. J. Geophys. Res., 113, D00A09, https://doi.org/
10.1029/2007JD009766.
——, and E.-K. Seo, 2013: Detecting snowfall over land by satellite
high-frequency microwave observations: The lack of scatter-
ing signature and a statistical approach. J. Geophys. Res.
Atmos., 118, 1376–1387, https://doi.org/10.1002/jgrd.50172.
Marra, A. C., and Coauthors, 2017: Observational analysis of an
exceptionally intense hailstorm over the Mediterranean area:
Role of the GPM core observatory. Atmos. Res., 192, 72–90,
https://doi.org/10.1016/j.atmosres.2017.03.019.
Matrosov, S. Y., 1998: A dual-wavelength radarmethod tomeasure
snowfall rate. J. Appl. Meteor., 37, 1510–1521, https://doi.org/
10.1175/1520-0450(1998)037,1510:ADWRMT.2.0.CO;2.
Mroz, K., A. Battaglia, T. J. Lang, D. J. Cecil, S. Tanelli, and
F. Tridon, 2017: Hail-detection algorithm for the GPM Core
Observatory satellite sensors. J. Appl. Meteor. Climatol., 56,
1939–1957, https://doi.org/10.1175/JAMC-D-16-0368.1.
Petersen, W. A., S. A. Rutledge, and R. E. Orville, 1996: Cloud-
to-ground lightning observations from TOGA COARE:
Selected results and lightning location algorithms. Mon. Wea.
Rev.,124, 602–620, https://doi.org/10.1175/1520-0493(1996)124,0602:
CTGLOF.2.0.CO;2.
Sims, E. M., and G. Liu, 2015: A parameterization of the proba-
bility of snow–rain transition. J. Hydrometeor., 16, 1466–1477,
https://doi.org/10.1175/JHM-D-14-0211.1.
Skofronick-Jackson, G., B. T. Johnson, and S. J. Munchak, 2013:
Detection thresholds of falling snow from satellite-borne active
and passive sensors. IEEE Trans. Geosci. Remote Sens., 51,
4177–4189, https://doi.org/10.1109/TGRS.2012.2227763.
——, and Coauthors, 2017: The Global Precipitation Measurement
(GPM) mission for science and society. Bull. Amer. Meteor. Soc.,
98, 1679–1695, https://doi.org/10.1175/BAMS-D-15-00306.1.
Tyynelä, J., and V. Chandrasekar, 2014: Characterizing falling
snow using multifrequency dual-polarization measurements.
J. Geophys. Res. Atmos., 119, 8268–8283, https://doi.org/
10.1002/2013JD021369.
Williams, E. R., M. E. Weber, and R. E. Orville, 1989: The re-
lationship between lightning type and convective state of
thunderclouds. J. Geophys. Res., 94, 13 213–13 220, https://
doi.org/10.1029/JD094iD11p13213.
Zipser, E. J., and K. R. Lutz, 1994: The vertical profile of radar
reflectivity of convective cells: A strong indicator of storm
intensity and lightning probability? Mon. Wea. Rev., 122,
1751–1759, https://doi.org/10.1175/1520-0493(1994)122,1751:
TVPORR.2.0.CO;2.
502 JOURNAL OF ATMOSPHER IC AND OCEAN IC TECHNOLOGY VOLUME 35
Unauthenticated | Downloaded 12/17/21 04:59 AM UTC


![GPM Available Products - JAXA min Ver. 04 (See: page 10~) GPM/DPR/Ka KaPR L1B [DAB] Received Power 30 min Ver. 04 ... GPM Available Products [As of Mar. 27, 2017] Mar. 27, 2017 Page-3](https://img.dokumen.tips/doc/110x75/5af5c3fd7f8b9a154c903151/gpm-available-products-min-ver-04-see-page-10-gpmdprka-kapr-l1b-dab-received.jpg)


![[GPM 083] Mi-14[1].GPM](https://img.dokumen.tips/doc/110x75/577d20571a28ab4e1e9298ca/gpm-083-mi-141gpm.jpg)


