Embed Size (px)
Citation preview

Universidad del Turabo
Detection of Escherichia coli ATCC® 8739™ and Aspergillus brasiliensis
ATCC®16404™ in Raw Materials and Pharmaceutical Products Using the Real-
Time PCR in Comparison with Standard Conventional Microbiological Methods
By
Elsie Jacqueline Hernández García BS, Biology, Interamerican University of Puerto Rico
MS, Science, University of Puerto Rico Mayagüez Campus
Dissertation
Submitted to the School of Science and Technology of the Universidad del Turabo
In partial fulfillment of the requirements for the degree of Doctor of Philosophy
In Environmental Science
Biology Option
Gurabo, Puerto Rico
November, 2015

UNIVERSIDAD DEL TURABO
CERTIFICATION OF DISSERTATION APPROVAL
The dissertation of Elsie Jacqueline Hernández García, was reviewed and
approved by the members of the Dissertation Committee. The Doctoral Academic
Requirements Compliance form, signed by the committee members, has been deposited
in the Register’s Office and at the Graduate Studies & Research Center in the
Universidad del Turabo.
DISSERTATION COMMITTEE MEMBERS Adalberto Bosque, Ph.D., MBA., REM CEA, CESCO Public Health Program Ponce Health Sciences University Research Advisor Teresa Lipsett, Ph.D. Universidad del Turabo Supervising Professor Ángel Rivera, MD, MBA Universidad del Turabo Member Eileen Villafañe, Ph.D. Research Laboratory of PR Environmental Quality Board Member Santander Nieto, Ph.D. Universidad del Turabo Member

© Copyright 2015
Elsie Jacqueline Hernández García. All Rights Reserved.

iv
Abstract Elsie Jacqueline Hernández (Ph.D., Environmental Science)
Detection of Escherichia coli ATCC® 8739™ and Aspergillus brasiliensis
ATCC®16404™ in Raw Materials and Pharmaceutical Products Using the Real-Time
PCR in Comparison with Standard Conventional Microbiological Methods
(November/2015)
Abstract of a doctoral dissertation at the Universidad del Turabo
Dissertation supervised by Adalberto Bosque, Ph.D., MBA., REM
No. of pages in text: 163.
Pharmaceutical products are susceptible to microbial contamination. This type of
contamination could represent a risk to consumers health. Furthermore, microbial
contamination can cause degradation, changes in the aesthetic of the product, and loss
of drug effectiveness by reducing or inactivate the therapeutic activity of the product. The
techniques used in the pharmaceutical industry are conventional techniques where the
practice of methods of transference of cultures, phenotypic observation of the colony, and
biochemical tests for its final identification prevails. These conventional techniques are
time-consuming, not specific, and lack accuracy and precision to demonstrate the present
of specified organisms in a sample. This analytical methodology results in delays for the
final approval of products.
A sensitive Real-time Polymerase Chain Reaction method with TaqMan® MGM
probe was developed in this research for precision, specificity and rapid detection of
objectionable microorganisms in raw material and finished product. The Real-time PCR
method had amplification of Escherichia coli ATCC® 8739™ DNA in all dilutions from 10¯¹
to 10¯¹⁵mL by the sensitivity test and detected the bacteria in the raw materials and OTC

v
samples analyzed at 10¯⁷ and 10¯¹⁵mL for Test for Specified Microorganisms (TSM).
Also, in Aspergillus brasiliensis ATCC®16404™ was obtained amplification in all samples
from sample 10¯¹ to 10¯¹⁵mL for sensitivity test and 10¯³ and 10¯¹⁵mL for detection of the
presence of the fungi in TSM. There is a statistically significant differences in the detection
of Escherichia coli ATCC® 8739™ and ATCC® 16404™ Aspergillus brasiliensis in
conventional and the rt-PCR methods. The conventional method did not have the ability
to detect small traces of the 10¯¹⁵ sample dilutions while the Real-time PCR method was
able to detect at this dilution. This research demonstrates how quickly, precisely, and
accurately detect the presence of these objectionable organisms in terms of the minimum
traces as 4 μl of pharmaceutical sample, something not possible under the conventional
USP pour plate method. The Real-time PCR methodology contributes to the rapid
detection of objectionable organisms in a pharmaceutical sample preventing the risk of
exposure of humans and animals to contaminated drugs that do not meet the FDA and
USP quality standards.

vi
Resumen
Elsie Jacqueline Hernández (Ph.D., Environmental Science)
Detección de Escherichia coli ATCC® 8739™ y Aspergillus brasiliensis ATCC®16404™
en Materia Prima y Producto Farmaceútico usando PCR en Tiempo Real en
Comparación con el Método Estándar Convencional Microbiológico
(noviembre/2015)
Resumen de una disertación doctoral en la Universidad del Turabo.
Disertación supervisada por Adalberto Bosque, Ph.D., MBA.,
No. de páginas en texto: 163.
Los productos farmacéuticos son susceptibles a contaminación microbiana. Este
tipo de contaminación representa un riesgo a la salud de los consumidores. Ocasionando
degradación, cambios en la estética del producto y la posible pérdida de la efectividad de
la droga. La presencia de ciertos microorganismos en preparaciones no estériles pueden
tener el potencial de reducir o inactivar la actividad terapéutica del producto. Las técnicas
utilizadas en la industria farmacéutica descrita en la Farmacopea son convencionales
donde prevalece la práctica de métodos de transferencia de cultivos, observación
fenotípica de la colonia y pruebas bioquímicas para su identificación final. Estas técnicas
convencionales consumen tiempo, no son específicas, carecen de exactitud y precisión
para demostrar la presencia de organismos específicos en una muestra resultando en el
retraso para la aprobación del producto.
Un método sensitivo de PCR en tiempo real (PCR-rt) con sonda TaqMan® MGM
fue desarrollado en esta investigación para precisión, especificidad y detección rápida de
microorganismos objetables en materia prima y producto terminado. Este método
amplificó el ADN de Escherichia coli ATCC® 8739 ™ en todas las diluciones desde 10¯¹

vii
hasta 10¯¹⁵mL para la prueba de sensitividad. Además,detectó la bacteria en las
muestras analizadas de materia prima y OTC en las diluciones 10¯⁷ y 10¯¹⁵mL en la
prueba de microorganismos especificos (TSM). En Aspergillus brasiliensis
ATCC®16404™ se obtuvo amplificación en todas las muestras desde 10¯¹ hasta 10¯¹⁵ mL
en la prueba de sensitividad y 10¯³ y 10¯¹⁵ mL en la prueba para detección del hongo en
TSM. Hay unas diferencias estadísticamente significativas en la detección de Escherichia
coli ATCC® 8739 ™ y ATCC® 16404 ™ Aspergillus brasiliensis tanto en el métodos
convencional de vertido en plato y el método molecular de PCR-rt. El método
convencional no tuvo la capacidad de detectar pequeñas trazas de la muestra contenida
en la dilución 10¯¹⁵mL, mientras que el método de PCR-rt fue capaz de detectar la
muestra en esta dilución. La metodología de PCR-rt desarrollada en esta investigación
contribuye a la rápida detección de objetables en muestras farmacéuticas previniendo el
riesgo de exposición de humanos y animales a medicamentos contaminados que no
cumplen con los estándares de calidad.

viii
Vita
Elsie Jacqueline Hernández García was born in the community of Captain Correa
in Arecibo, Puerto Rico. She holds a Bachelor of Science in Biology (BS) of the Inter
american University of Puerto Rico and obtained Master of Science (MS) degree with a
concentration in Biology specializing in mycology at the University of Puerto Rico,
Mayagüez Campus. She was recognized as the first graduate student in 1987 who did her
research on a topic of Chemical Engineering still a student of the department of Biology.
Elsie's research was directed to pharmaceutical biotechnology for the production of
benzylpenicillin for cell immobilization. She has 23 years of experience managing quality
control in a microbiology laboratory, manufacturing processes following FDA guidelines,
pharmacopoeias, government guidelines for parenteral drugs, including oral and semisolid
products. Her primary responsibility has been conducting audits and evaluating the
microbiological criteria for acceptance in pharmaceutical preparations by microbiological
testing, water analysis for pharmaceutical purposes, monitoring of controlled
environments, qualification, and validation processes to achieve compliance with the
acceptance criteria for finished products.
Ms. Hernández is a senior consultant in the area of microbiology in
pharmaceuticals and manufacturing, primarily doing consulting work in the area of
microbiological laboratories, manufacturing, and training in technical and regulatory
guidelines. She has had taught at various universities in Puerto Rico, including the
University of Puerto Rico, the Pontifical Catholic University of Puerto Rico, and at the Ana
G. Méndez University System. She has taught courses related to biotechnology,
pharmaceutical, and biopharmaceutical manufacturing, including manufacturing
biotechnology processes, validation processes, GMP’s and regulations, industrial
microbiology, mycology, genetics, microbiology, molecular biology, and general biology.

ix
Dedications
To God, for giving me the wisdom and the knowledge that was by my side every
step of this huge project.
To my greatest love, my daughter Ninotchka, my biggest inspiration, who gave
me the strength to transcend any adversity.
To my parents, Dr. Enrique Hernández Santos and Prof. Elsie D. García Lugo,
for teaching me what it was to have passion for learning and the faith that the reward
will always be to enjoy the harvest of hard work.
To all my friends and family who supported me in any way and were part of this
journey, I dedicate this disertation.

x
Acknowledgments
The goal of completing a doctoral degree was a major endeavor requiring passion
for education, the wisdom to understand the effort and dedication to succeed, and the
tenacity to achieve the degree. This goal has been possible with the advice and time from
others who have supported me.
I want to express my gratitude to my research advisor, Dr. Adalberto Bosque, for
supporting me in this research project and for his dedication, availability, goodness,
advice, and humanity. Without his direction, it would not have been possible to carry out
this dissertation.
I am grateful to my supervisor Professor, Dr. Teresa Lipsett for her time, and
willingness to guide my steps through the process of the doctoral degree. Thanks a lot, for
their unwavering support throughout. I want to express my appreciation to Dr. Eileen
Villafaňe for providing motivation, time, advice and support. To Dr. Angel L. Rivera, I am
grateful for your time spent; to Dr. Santander Nieto, thank you for being part of my
graduate committee. I thank to Ms. Ana Lliteras for technical molecular support and
Bioanalytical Instruments for supplying essential equipment.
I extend many thanks to Prof. Juan F. Acevedo of the Catholic University, Ponce
facilitating materials and equipment for the conventional part of this research. Thanks to
the Pontifical Catholic University of Arecibo for letting me use the facilities and laboratory
equipment for the experimental phase of this dissertation.
Many thanks to Dr. Dallas Alston of the Pontifical Catholic University of Ponce for
time, advise and dedication spent editing of this manuscript. I thank Dr. Abner Colón for
his guidance, support and time in the statistical analysis in this investigation.

xi
Table of Contents
page
List of Tables ............................................................................................................ iv
List of Figures ........................................................................................................... vii
Chapter One. Introduction ....................................................................................... 1
1.1. Nature of the Problem ...................................................................................... 4
1.2. Problem Justification ........................................................................................ 8
1.3. Research Goals and Objectives ....................................................................... 10
1.3.1. Goals .................................................................................................. 10
1.3.1.1. Environmental Science Goal ................................................ 10
1.3.1.2. Pharmaceuticals Industry Goal ............................................. 10
1.3.2. Specific Objectives .............................................................................. 11
Chapter Two. Literature Review ............................................................................... 13
2.1. Background ....................................................................................................... 13
2.2. Health Risks from Objectionable Organisms ...................................................... 34
2.2.1. From GMP’s Perspective .................................................................... 37
2.2.2. Non-compliance of Product ................................................................. 40
2.2.3. From the United States Phamacopoeia (USP) Perspective ................. 46
2.3. Contribution to Procedures, Costs and Benefits for Pharmaceuticals
Industries .......................................................................................................... 48
2.4. Advantages and Disadvantages of the Techniques Described in the
Pharmacopeia vs. Molecular Method ................................................................ 58

xii
page
2.4.1. USP 38-NF 33 <Chapter <61> Microbiological Examination of
Non-sterile Product: Test of Microbial Enumeration ........................... 59
2.4.1.1. Preparation of the Sample .................................................... 59
2.4.1.2. Total Aerobic Microorganisms Count (TAMC) ....................... 60
2.4.1.3. USP Results Interpretation ................................................... 62
2.5. USP 38-NF33 Chapter <62> Microbiological Examination of Non-sterile
Products: Tests for Specified Microorganisms ................................................... 63
2.5.1. Product Analysis ................................................................................. 63
2.6. Advantages and Disadvantages of the Techniques Described by USP 38-NF
33<61> .............................................................................................................. 65
2.7. Applications Present and Future ........................................................................ 68
2.8. Advantage of the Real-time PCR ....................................................................... 69
2.8.1. Options of the Real-time PCR Equipment’s ......................................... 70
2.8.2. Advantages of the Real-time PCR Technique ..................................... 70
2.9. Real-time PCR Comparison versus Microbiological Methods ............................ 72
2.10. Taxonomic change of Aspergillus niger to Aspergillus brasiliensis ................... 73
2.10.1. Morphologic Characteristics of Genus Aspergillus ............................. 73
2.10.2. Aspergillus: Importance in Industry, Agriculture and Medicine ........... 77
2.10.3. Taxonomy: Approaches to Distinguish A. niger from A. brasiliensis .. 78
2.10.4. Reclassification of Strain ATCC®16404™ from Aspergillus niger to
Aspergillus brasiliensis ...................................................................... 79
Chapter Three. Materials and Methods..................................................................... 85
3.1. Microbiological Analysis ..................................................................................... 85
3.1.1. Identification Method ........................................................................... 85

xiii
page
3.1.2. Negative Control ................................................................................. 86
3.1.3. Growth Promotion Test ....................................................................... 86
3.1.4. Suitability of the Counting Method in Presence of Product .................. 86
3.1.5. Specified Microorganisms ................................................................... 87
3.1.6. Preparation of Test Strains .................................................................. 87
3.1.7. Inoculum Preparation-determination of the Population Known
to Contaminate Pharmaceutical Sample ............................................. 88
3.1.8. Preparation of the Pharmaceutical Sample ......................................... 89
3.1.9. TBC and TYMC Test: Plate Method .................................................... 92
3.1.10. Identification of the Preparation of the Inoculum ................................ 92
3.2. Molecular Method Real-time PCR...................................................................... 93
3.2.1. Preparing a PCR Reagent ................................................................... 94
3.2.2. Preparation and Extraction Samples for Escherichia coli ATCC®
8739™ and Apergillus. brasiliensis ATCC® 16404™ Testing ............. 96
3.2.3. Real-time PCR Amplification Process ................................................. 98
4.0. Chapter Four: Results and Discussion ............................................................... 101
4.1. Data Analysis .................................................................................................... 122
4.1.1. Inferential Data Analysis ...................................................................... 122
4.1.2. Inferential Analysis Methods ............................................................... 124
5.0. Chapter Five: Conclusions and Recommendations ........................................... 126
Literature Cited ......................................................................................................... 128

xiv
List of Tables
page
Table 2.01. Major Risk for Non-GMP Compliance .................................... 39
Table 2.02. Product Recall Definition ........................................................ 41
Table 2.03. Products Withdrawn from Market in 2013 for Microbial
Contamination……………………………………………………..43
Table 2.04. CDC and FDA Laboratory-confirmed Organisms from
Product Samples…………………………………………………..44
Table 2.05. Summary of Organisms that are More Frequently a Health
Threat .................................................................................... 48
Table 2.06. Advantages and Disadvantages of Culture and Molecular
Methods for Screening of MRSA ............................................ 49
Table 2.07. Contribution and Benefits to SOPs ......................................... 53
Table 2.08. Generic and Practical Approach to Microbial Measurements
Methods ................................................................................. 56
Table 2.09. Contribution in Terms of Cost for the Pharmaceutical
Industry .................................................................................. 57
Table 2.10. Costs of Molecular Reactives Translated to Costs per
Reaction ................................................................................ 58
Table 2.11. Products Examination Techniques ......................................... 61
Table 2.12. Test for the Absence of Specified Microorganisms ................ 64
Table 2.13. Advantages and Disadvantages of the Techniques
Described in the USP38 <61> ................................................ 67
Table 2.14. Advantages and Disadvantages of the Real-time PCR .......... 71

xv
page
Table 2.15. Advantages and Disadvantages of Conventional
Microbiology Methods ............................................................ 73
Table 2.16. The Difference in ITS Sequences .......................................... 80
Table 3.01. Selected dilutions from Test for Specified Microorganisms
(TSM) .................................................................................... 91
Table 3.02. Amount of Samples per Objectionable Organisms ................. 92
Table 3.03. Preparation of the Reaction Mix ............................................. 95
Table 3.04. Primers and Probe per Organisms ......................................... 96
Table 3.05. Steps Performed to extract sample with PrepMan ................. 97
Table 3.06. Preparation of the 48 Wells Plate ........................................... 99
Table 3.07. Reaction of Real-time PCR Quantities of Reagents by
Reaction ................................................................................ 99
Table 3.08. Quantities for Reaction .......................................................... 100
Table 4.01. Sensitivity Test for minimal Detection of Eschericha coli
ATCC® 8739™ by Conventional Pour-plate Method ............. 103
Table 4.02. Confirmatory Test for E. coli ATCC® 8739™ Identification
Detected in USP Conventional Pour-plate and Real-time
PCR Methods ........................................................................ 104
Table 4.03. Confirmatory Test for A. brasiliensis ATCC® 16404™
Identification Detected in USP Conventional Pour-plate and
Real-time PCR Methods ........................................................ 106

xvi
Table 4.04. Sensitivity test for minimal detection of
Aspergillus brasiliensis ATCC® 16604™ by Conventional
Pour-plate Method ................................................................. 109
Table 4.05. Real-time PCR Treshold Cycle (Ct) Values of E. coli at
minimum detection (Sensitivity Test) ...................................... 111
Table 4.06. Real-time PCR Ct Values of A. brasiliensis ATCC® 16404™ at
Minimum Detection Sensitivity Tests ...................................... 115
Table 4.07. Live and Dead Cells of Escherichia coli ATCC® 8739™ with
Cellometer®Auto M10 ............................................................ 116
Table 4.08. Live and Dead Cells of Aspergillus brasiliensis ATCC®
16404™ with Cellometer®Auto M10 ...................................... 117
Table 4.09. Presence in CFU, Cells and Ct Value .................................... 119
Table 4.10. Test for Specified Microorganisms Detection by USP
Conventional Pour-plate and Real-time PCR141 ................... 121
Table 4.11. Mann-Whitney test for Detection of Escherichia coli
ATCC®8739™ and Aspergillus brasiliensis ATCC®16404™
for Each of the Two Different Methods ................................... 122
Table 4.12. Mann-Whitney Test for Real-time PCR .................................. 123
Table 4.13. Mann-Whitney test ................................................................. 123
Table 4.14. Frequiencies .......................................................................... 124
Table 4.15. Tests Statistic ........................................................................ 125

xvii
List of Figures
page
Figure 2.01. Algorithm for the Identification of Nonfermenting
Gram-negative Bacilli ............................................................. 27
Figure 2.02. Causes for Non-sterile Recalls ............................................... 36
Figure 2.03. Morphological Structures of the Genus Aspergillus A-B:
conidiophores C-D: conidial heads ........................................ 74
Figure 2.04. Aspergillus brasiliensis sp. nov. CBS 101740T ...................... 75
Figure 2.05. Colony Morphologies of Type Strains of Species assigned
to Aspergillus section Nigri ..................................................... 76
Figure 2.06. A Neighbor Joining Tree of Black Aspergilli Based on
Their ITS DNA Sequences ..................................................... 81
Figure 2.07. The sequence data for A. brasiliensis ATCC®16404™ was
18S ribosomal RNA gene, partial sequence ........................... 82
Figure 3.01. Computer Screen Template Real-time PCR Run Method
Parameters ............................................................................ 99
Figure 3.02. Real-time PCR Protocol Used-Reconstitution of the Forward
and Reverse Primers to 10,000 pmol ..................................... 100
Figure 3.03. Protocol Used for Dilutions of the TaqMan® Probe to
100µM in 50µL ....................................................................... 101
Figure 4.01. Sensitivity Test for Minimal Detection of E. coli ATCC®8739™
the CFU Conventional Method ............................................... 102
Figure 4.02. A. brasiliensis Results in CFU for Sensitivity Test by
Conventional Pour-plate Method ............................................ 108
Figure 4.03. Amplification Plot for a 10 fold Dilution for
E.coli ATCC®8739™ and A. brasiliensis ATCC®16404™ ..... 113

1
Chapter One
Introduction
Microbiology laboratories in the pharmaceutical industries conduct the
identification of objectionable organisms with conventional cultivation methods, selective
and differential media, phenotypical characteristics, and biochemical tests as traditional
manual methods. Today’s microbiological quality control laboratory still uses fundamental
tools that were developed centuries ago. It was interesting that such instruments as
autoclaves, agar plates, broth tubes, erlenmeyer flasks, incubators, inoculation loops, and
microscopes are popular when many new detection and enumeration devices provide
alternative and rapid microbiological methods.
Traditional instruments are being compared to alternative or rapid microbiology
systems in terms of functionality and sensitivity (Denoya 2014). The microbiological test
methods can be grouped into three broad categories based on their function. They are (1)
detection of the presence or absence of microorganisms in a test sample; (2) enumeration
of microorganisms present in a sample; and (3) identification of microorganisms either
present in a test sample or from a pure culture isolated from a test sample (Madsen 2001).
The term most commonly used for the conventional microbial population counting was
“Colony Forming Unit” (CFU), which was an artifact-based count relying on cellular
replication to produce a visible colonies of cells on growth medium. If the physical
conditions or growth medium are not suitable, no colonies appear. Also, if a clump of many
cells lands in one place and only a single colony forms, then the count of “one” would
underestimate the total.
Therefore, plate counts are not always accurate or precise because they involve a
lot of manipulation of the analyst. The microbiological tests represent a small portion of a

2
pharmaceutical quality testing program and although their importance was critical
to pharmaceutical product safety. New technology is needed for microbiological methods
that offer advantages of speed and precision for solving microbiological problems
associated with materials, excipients or environmental factors during manufacturing
proceses or samples analyses .
Many new methods use technologies developed for aerospace research, clinical
studies, and the food industry (Hussong & Mello 2006). While it may seem odd that the
pharmaceutical industry lags behind in implementing new microbiological technologies,
the resistance to change was reinforced, in part, by regulatory pressure and the complexity
of assays. Automated methods are among the most frequently used miniaturized systems,
including API systems Inc., Enterotube™, Minitek®, Crystal™ ID system, Micro-ID®, RaID
systems, Biolog Microbial ID system and Vitek®. The most successful and sophisticated
miniaturized automated identification system include the Vitek® system (bioMérieux)
(Fung 2002). These standard miniaturized tests’ method are time-consuming, not specific,
and delay the release of the product. These automated systems do not provide information
about identification characteristics of many of the isolated organisms in their computerized
information system. As a result, many isolated organisms cannot be identified. These
automated systems are limited in the identification of specific fungi, which was the reason
why industries regularly use external contractors for the identification (Matsuda et al.
2007).
In recent years, the focus of multiple investigations of the pharmaceutical
microbiology has been toward improving isolation and early detection of pathogenic
organisms, including their characterization and enumeration from various environmental
and products origin. Each of these methods falls into the classification of rapid
microbiological methods (RMM). These approaches are categorized according to the type

3
of technology used, including microorganism growth, organism viability, presence of the
microorganism, cellular component or “artifact” effect, methods of nucleic acid, traditional
methods combined with computerized image assistance, and combinations of several
methods (Clontz 2009). These strategies serve as the basis for determining the identity of
a microorganism as part of an investigation of product failure by not complying with the
specifications for environmental or product sample.
Recent microbiological detection technologies frequently require fewer microbial
cells to obtain results in less time than those obtained with traditional methods. Some of
the technologies are more accurate and informative data related to the potential
contaminant than the information obtained using conventional assays (Saghee et al.
2010). The evolution of microbiological testing from classical procedures to RMM will
provide new and increased data to assist in rapid decision-making to facilitate real-time
release or to complete on time with the determination of the root-cause analysis for failure
investigations, thus improving product safety. With the successful use of these
technologies, the quality control microbiology laboratories incorporate these new tools to
provide product and process knowledge to improve their quality goals (Duguid et al. 2011).
The analyses according, to United States Pharmacopoeia (USP) chapter <62>
Microbiological Examination of Non-Sterile Products: Test for Specified Microorganisms
(TSM), must comply with the absence of: Staphylococcus aureus, Pseudomonas
aeruginosa, E. coli, Salmonella spp., and Candida albicans for non-sterile products and
raw materials (USP38-NF33. 2015). This research study is based on the detection of
Escherichia coli ATCC®8739™ (bacteria) and Aspergillus brasiliensis (fungus).
Aspergillus brasiliensis ATCC®16604™ for the experimental phase in this investigation
was chosed from Chapter <61> Microbiological Examinations of Nonsterile Products:
Microbial Enumeration Test (MET). In accordance to these requirements, this study was
presented as a possible alternative to accurately detect the presence and genetic activity

4
of these objectionable organisms in pharmaceutical product samples. The Real-time PCR
technique was accurate, effective, simple, and cost-effective for the analyses, not solely
for bacteria, but also for fungi and yeasts required by the USP chapter <62>: Test for
Specied Microorganisms (TSM). The fundamental objective of the investigation was
detection, sensitivity, and precision in terms of presence or absence of objectionable
organisms through the utilization of molecular methods (Real-time PCR) by comparing
conventional to modern identification techniques to identify E. coli ATCC® 8739™ (USP38-
NF33 Chapter <62>. 2015) and A. brasiliensis ATCC®16404™ for the United States
Pharmacopeia (USP) <61> by using the molecular technique Real-time PCR. The
conventional microbiological methods, including long-established techniques described in
Europe, Japan, and the United States pharmacopoeia have benefited microbiologists
during the past century and have helped to ensure the production of microbiologically safe
products (Sandle 2014). For example, a wide range of microbiological techniques have
verified by using plate-count methods in the enumeration and identification of
microorganisms within an acceptable margin of error according to conventional
methodology and type of product (Sutton 2011).
1.1. Nature of the Problem
Pharmaceuticals industries conduct lab tests for the compliance of product quality
in terms of purity, safety, and efficacy (GMP 2015). For compliance purposes, most
microbiological methodologies analyses rely on traditional techniques (USP38-NF33
2015). The USP are standards that describe minimal expectations for the quality of
finished products. If a pharmaceutical product does not meet requirements of the
appropriate USP monograph, it was designated “mislabeled” or “adulterated”, based on
provisions by the Federal Food Drug, and Cosmetic Act, in which case the Food and Drug
Administration (FDA) can take enforcement actions (Sutton et al. 2011)

5
The type of analyses to confirm the presence or absence of specific organisms in
a pharmaceutical sample is critical to achieve the approval of the product to be used by
the consumer. The role of USP, a nongovernmental, not-for-profit organization, was to
develop microbiological public standards that guarantee the uniformity of products from
batch to batch, as well as the microbiological quality of the products (Sutton et al. 2001).
The test for specified microorganisms (TSM) was performed in the pharmaceutical
industries to guarantee that the organisms considered objectionable were not present,
either in the raw material or in the finished product. The microorganisms identified as
objectionable organisms by the FDA must not be present in the pharmaceutical
preparations that may pose a risk to consumer health (Jiménez 2007).
In this type of test, TSM was the predominant practice among microbiological
methods for the cultivation of microorganisms, phenotypic observation of the colony, and
biochemical tests to determine its final identification. These time-consuming tests were
not specific, and lack accuracy and precision to show the entire content of the presence
or absence of these specific organisms in a sample. Time-consuming tests delay final
approval of the pharmaceutical product (Ragheb et al. 2012). The TSM was required
within the pharmaceutical industries to ensure that objectionable organisms were not
present in the raw material, nor in the finished product. To avoid consumer-health risks,
microorganisms identified as objectionable by the FDA should not be present in
pharmaceutical preparations (Jiménez 2007).
Conventional microbiological methods are labor-intensive and time-consuming
with lengthy incubation periods, resulting in delaying the release of products. Ragheb et
al. (2012) tested and validated a polymerase chain reaction identification approach to
detect the following indicator bacteria: E. coli, P. aeruginosa, Salmonella spp., and
Staphylococcus aureus in pharmaceutical preparations. Their method depended on
amplification of specific conserved genes located in four bacteria. The method could be

6
performed individually or collectively to detect indicator bacteria in a single reaction in
different forms of pharmaceutical products. The method provides a high-performance
screening method to test different pharmaceutical preparations to detect specific
microorganism contamination (Ragheb et al. 2012).
The quality test compliance of the raw material and the finished product depends
on the results obtained in terms of detection, precision, and sensitivity to the entire process
of pharmaceutical manufacture. Certain standardized tests were carried out in
microbiological testing laboratories in each pharmaceutical production facility to ensure
quality according to standard pharmacopeia recommendations. It was essential that
nonsterile products were free of specified microorganisms. For example, topical
preparations must be free of P. aeruginosa and S. aureus, and oral preparations without
Salmonella spp. and E coli. The existent conventional methodologies analyze the limits of
microbial growth in a sample of raw material and finished product, as described by the
USP (USP38-NF33 2015). Rapid release of samples optimizes manufacturing, product
testing, and release, thus permitting high throughput, with simultaneous analysis of
pharmaceutical formulations (Jiménez 2001). Conventional microbiological methods
generate-during and at the end of each analysis-significant quantities of biological waste,
thus increasing the risk of biological hazards as compared to the Real-time PCR
methodology which generates less biological waste. The detection-level in the Real-time
PCR test is in nanograms of the concentration of sample DNA or this methodology can
used to detect specific organisms. Identification of bacteria and fungi using traditional
techniques requires a lot of time, effort, excessive expense of materials, excess of
biological waste, and experienced analysts in bacterial and mycological identification.
A sensitive rRNA targeted reverse transcription quantitative PCR method was
developed for exact and sensitive enumeration of subdominant bacterial populations using
specific primers for 16S or 23S rRNA, with corresponding analytical curves for E. coli,

7
Enterococcus faecalis, S. aureus, Clostridium perfringes and P. aeruginosa. The number
of cultured bacteria was determined by Real-time -qPCR; the results correlated with the
CFU (Colony Forming Unit) count over the range from 10˚ to 10¯5 CFU. The bacteria
counts obtained by Real-time -qPCR methodology were the same as the CFU count,
regardless of the in vitro growth phase, except for C. perfringes during starvation periods.
The viable cell counts obtained were in agreement with Real-time -qPCR counts rather
than with the CFU counts (Matsuda et al. 2007).
During the manufacturing process of a pharmaceutical product, microbiological
contamination can originate from raw material or can be introduced during manufacture
by means of contaminated equipment, operators, from the air, or from packaging material
(GMP - 21CFR211 2013). It can also be originated during the storage and handling of
material. The majority of the raw material (including water) used in the pharmaceutical
industry may contain several types of polluting organisms. The microbial growth potential
of a pharmaceutical drug product is the potential of microorganisms to survive and
proliferate within the product. Each drug formulation can support or inhibit microbial
growth, depending on its components (Lolas and Metcalfe. 2011). Depending on the
manufacturing process, microbial contaminants can be reduced or eliminated (Clontz
2009). The microbiological quality of the pharmaceutical excipients used to manufacture
pharmaceutical and over-the-counter (OTC) drug products may significantly affect the
outcome of individual processing steps and the microbiological attributes of the final drug
products (Cundell 2006). Today’s microbiological quality control laboratory still uses
fundamental tools such as agar plates, autoclaves, broth tubes, Erlenmeyer flasks,
incubators, inoculation loops, and microscopes. However, many new detection and
enumeration devices were applicable in alternative and rapid microbiological methods.
Traditional instruments will be compared to alternative or rapid microbiology systems in
terms of functionality and sensitivity.

8
The modern pharmaceutical industry must use rigorous and sensitive methods of
microbial identification to detect pathogenic organisms in a minimal sample size.
Molecular technologies use genetic sequences to rapidly detect microbial contamination,
provide an accurate microorganism identification in the pharmaceutical environment, and
improve efficiency (Jiménez 2011). Analyses must provide information assuring the
absence of specified or objectionable organisms belonging to the pharmacopoeia
(USP38-NF33 2015). The objectionable organisms stipulated in the USP Chapter <62>
are E. coli, Salmonella spp., S. aureus, P. aeruginosa, Clostridium spp. and C. albicans.
The indicator organisms used for the suitability test of the enumeration method in the
presence of product are S. aureus, P. aeruginosa, B. subtilis, C. albicans and A.
brasiliensis (Chapter <61> USP38-NF33 2015).
1.2. Problem Justification
The purpose of this investigation work was to evaluate the detection of E. coli
ATCC® 8739™ and A. brasiliensis ATCC® 16404™ in OTC pharmaceutical preparations
using the Real-time PCR methodology as a viable alternative so that the pharmaceutical
industries will be confident to use this methodology for routine analyses systems in quality
control laboratories. This investigation will evaluate that Real-time PCR analyses are
precise and rapid for the detection and identification of E. coli ATCC ® 8739™ and A.
brasiliensis ATCC ® 16404™. For instance, this method only required thirty-minutes to
analyze each sample, which was not possible using conventional microbiological methods
that take from 24 to 48 hr for bacteria and from 5 to 7 days for fungi. Decreasing analysis-
time to detect contaminant microorganisms in raw material, excipients, environmental
monitoring, and finished products will accelerate the final approval of Real-time PCR
methodology. This research focus on the following three types of products of finished
product: solids, liquids, and cream, which will be analyzed strictly according to the criteria
established in the chapter <61> and <62> of the Compendium of the USP38-NF33 (2015).

9
The hypothesis therefore was that the molecular methods of Real-time PCR
provides the detection of minimal traces of objectionable organisms present in the
samples, contrary to standard conventional microbiological method that measure the
presence of viable organisms that could be counted when reading test results. The
standard conventional microbiological methods are the standard methodologies that
involves the growth of colonies on a nutrient agar surface during a specific period of
incubation (Postagate 1969). In the pharmaceutical industry, detection and quantification
of viable cells of well-characterized species are important for quality control purposes.
Determination of microbial viability by the plate count method was routine in microbiology
laboratories worldwide (Davey 2011).
The technique Real-time PCR was expected to evaluate how the physiological
capabilities of these organisms can mask the detection of these objectionable organisms.
The use of the molecular technique Real-time PCR was projected as a molecular method
with a high potential to detect the presence and activity of living cells of objectionable
organisms in a pharmaceutical sample.
This research proposed to evaluate if the Real-time PCR technique was more
sensitive, accurate, and precise in the detection of E. coli ATCC®8739™ and A.
brasiliensis ATCC®16404™ in the TSM test, as compared to the conventional method of
identification. A secondary objective was to evaluate the cost effectiveness of this
technique compared to conventional methods in terms of preparation time, obtaining
results, reproducible results, and ease of use. The goal of this study was to compare the
conventional USP techniques of detection and identification for E. coli ATCC® 8739™ and
A. brasiliensis ATCC® 16404™ using the TSM pour-plate method with the molecular
technique of Real-time PCR.
1.3. Research Goals and Objectives
1.3.1. Goals

10
1.3.1.1. Environmental Science Goal
The goal of this study was to contribute with an alternative to the analysis of raw
materials and finished products for the pharmaceutical industries with a capacity to detect
minimal concentrations of objectionable organisms contamination in their sample. This
helps to reduce the risk of exposure of humans and animals to contaminated drugs that
do not meet the FDA and USP quality standards. The early and rapid detection of a
precise and effective methodology as the Real-time PCR helps in protecting public health
by avoiding outbreak of nosocomial infections.
1.3.1.2. Pharmaceuticals Industry Goal
The goal of this investigation was to evaluate that the Real-time PCR methodology
as a precise, rapid, and specific technique to detect objectionable and specified organisms
for the TSM test, as compared to conventional microbiological current methods specified
in chapter <62> of the USP (2014). It evaluate its advantages in molecular microbiological
analyses for pharmaceutical industries versus the conventional methodologies,
specifically in terms of precision, specificity, and test duration. It compare the cellular
viability of the inoculum analysis used for both skills (molecular and conventional pour-
plate methods) in terms of detection of DNA target (Ct value) versus CFU/mL. It evaluate
that results obtained from this investigation can be used by the pharmaceutical industries
to validate the Real-time PCR methodology as an alternative to TSM methods to
determine the presence, quantity of cells, and genetic activity of the objectionable
organisms, including S. aureus, P. aeruginosa, E. coli, Clostridia spp., Salmonella spp.
and C. albicans (USP38-NF33 2015). The cost effectiveness of the Real-time PCR vs.
USP pour-plate methods will be compared among test duration, risk of biological
exposure, materials, and equipment during the execution of the methods.

11
This investigation directly impacts the conventional methodology established by
the USP (2015), thus offering the Real-time PCR methodology as a viable alternative
microbiological laboratory technique suitable for the pharmaceutical industry.
1.3.2. Specific Objectives
This study will use the molecular technique Real-time PCR for the identification of
bacteria and fungi to compare its effectiveness, precision (reproducibility), and rapid
analysis to conventional techniques used to culture and identify these organisms. The
Real-time PCR, which involves a single-step based on the sequencing of the conserved
DNA to target specific microorganisms, also will be compared to data provided from
conventional techniques. The methodology performs a millions of copies of the target DNA
of Escherichia coli ATCC® 8739™ and Aspergillus brasiliensis ATCC® 16404™ in 30 min
at real time in this study.
This investigation outlines the following five principal targets.
Compare the minimum capacity of the method to detect the contaminant in
the pharmaceutical sample so that the output of the product to market is
prevented avoiding risk to public health .
Compare the methodology of microbiological conventional analysis for the
TSM test with the molecular methodology of Real-time PCR in terms of
sensitivity, precision, accuracy, specificity, reproducibility, and test duration
to detect objectionable or specified organisms.
Evaluate the Real-time PCR possesses high sensitivity in the detection of
minimal traces of pharmaceutical product, as compared to the USP
conventional method pour-plate culture techniques.

12
Compare the genetic activity for the minimal trace of DNA at the molecular
level versus CFU/mL using the conventional microbiological pour-plate
method.
Evaluate the Real-time PCR method can identify objectionable bacteria
and fungi in reference to time invested in the analysis, amount of materials
used for preparation, analysis and biological waste.

13
Chapter Two
Literature Review
2.1. Background
Microbial contamination is still one of the major causes for global product recalls,
in particular in developing tropical countries (Okeke et al. 2001; Jimenez 2007). Therefore,
it was important to improve the preservative system and refine non-invasive packaging
to inhibit the growth of contaminating microorganisms during manufacturing, storage and
use by consumers (Farrington et al. 1994; Linter and Genet 1998). Contamination leads
to product degradation or, if it was contaminated with pathogens, allows the product to act
as a fomite to potentially spread infection to susceptible users (Brannan and Dille 1990).
Contamination by microorganisms can cause infections after the organisms are dead and
thus are harder to detect. Consequently, the presence of objectionable microorganisms in
non-sterile products was indicative of the absence control protocols (Jiménez 2001).
Pharmaceutical products are prone to microbial contamination at every stage
during their manufacture. Identification of microbial contaminants in product recalls and
environmental samples provides important information on the possible contamination
sources and distribution of microbial species in pharmaceutical environments (Jiménez
2007). The presence of some microorganisms in non-sterile preparations can reduce or
inactivate the therapeutic activity of a pharmaceutical product, thereby adversely affecting
patients’ health (cGMP 2014).
Current rapid method technologies can detect the presence of diverse types of
microorganisms or specific microbial species, enumerate the number of sample
microorganisms, and identify microbial cultures to the genus, species, and sub-species
levels. Each microorganism detected, quantified, or identified was dependent on the
specific technologies and instrumentations employed (Miller 2005). Pharmaceutical

14
industries for non-sterile products must reduce the microbiological load in its raw materials
and final product.
The acceptance criteria established for non-sterile products was based on the
number of total aerobic microbial count (TAMC) and the combination of the amount of total
yeast and mold (TYMC) (USP38 <1111> 2015). These specifications vary according to
the dosage form and use of the product. The dosage forms of a pharmaceutical product
include tablet, capsule, liquid, and ointment/cream. For purposes of microbiological
laboratory testing, the products have been divided into four categories (PMM. 2014):
Category 1 – Injections and other parenteral including otic products, emulsions,
sterile nasal products, and ophthalmic products made with aqueous bases or
vehicles.
Category 2 – Topical products made with aqueous bases or vehicles,
non-sterile nasal products, and emulsions, including emulsions applied to mucous
membranes.
Category 3 – Oral products other than antacids that are made with aqueous bases
or vehicles.
Category 4 – Antacids that are made with aqueous bases or vehicles.
The analysis method known as the TSM (Test for Specified Microorganisms)
provides the general instructions for the microbiological examination of non-sterile
products (USP38 <62> 2015). This test involves the execution of two basic methods: (1)
tests for the microbiological quantitative enumeration and (2) tests for specified
microorganisms, performed as determined in Chapters <61>, <62> of USP 38-NF33
(2015). The TSM test was primarily designed to determine if a substance or
pharmaceutical preparation complies with the established specifications in terms of
microbiological quality (USP <1227> 2015). The role of United States Pharmacopeia, a

15
nongovernmental, not-for-profit organization, was to develop microbiological public
standards that, along with other requirements, ensure the consistency of products from
batch to batch, as well as assure the microbiological quality of products (Sutton et al.
2001). The TSM describes the quantitative enumeration of bacteria, fungi, and yeast from
non-sterile products that can grow under aerobic conditions. It also describes the
determination of presence or absence of indicators organisms like S. aureus, P.
aeruginosa, E. coli, Salmonella spp., Aspergillus niger, and C. albicans (Clontz 1998). The
TSM test must demonstrate that the specimen analyzed does not inhibit growth and
multiplication of the microorganisms contained in the sample.
The analysis methods described in USP <61>, <62> (2015) are conventional
methodologies that include the transference of cultures, phenotypic colony observation,
and biochemical tests for final identification. The plate method outlined in Chapters <61>
and <62>Microbiological examination of non-sterile product of the US Pharmacopeia
include guidance for assessing total aerobic bioburden in pharmaceutical products. This
comprehensive methodology lacks the flexibility for a variety of situations. It uses a
mathematical model to express the plate-counting procedure as a statistical framework
concerning the total aerobic bioburden. This framework allows the laboratory scientist to
adjust USP <61> and <62> chapters methods to meet specific practical constraints. The
plate method can performed with acceptance criteria using a test-specimen quantity
smaller than the prescribed 10 g or 10 mL (Kai 2004).
Many rapid microbiological method (RMM) technologies provide more sensitive,
accurate, precise, and reproducible test results when compared with conventional, growth-
based methodologies. They may be fully automated, offer increased sample throughput,
operate in a continuous data-collecting mode, reduce duration (e.g., from days or weeks
to hours or minutes), and for some RMM platforms, provide Real-time results (Miller 2012).

16
The pharmaceutical industry utilizes precise and sensitive methods for microbial
identification so that pathogenic or specific organisms can be detected with a minimal
sample size. Results of a sample must demonstrate an absence of indicative or
objectionable organisms which include the following: Salmonella spp., S. aureus, E. coli,
P. aeruginosa, C. albicans, and A. niger. These are organisms that could be harmful by
themselves or by toxins produced by them; they also can cause diseases and infections
in humans (FDA 2014). Objectionable organisms can cause disease or degradation of
product. Other examples are Pseudomonas spp, such as P. putida and P. maltophila.
Opportunistic organisms can cause disease in immune compromised patients, and these
organisms include most of the microbial flora found in pharmaceutical raw materials,
recipients, and the manufacturing environment (Clontz 1998).
The most frequent microbial contaminants of pharmaceutical products and raw
materials are bacteria, yeast, and filamentous fungi. To analyze the microbial content of
pharmaceutical raw materials in finished pharmaceutical products, Martínez et al. 1991
determined the aerobic bacteria, anaerobic bacteria, and fungi. Few or one of pathogenic
microorganisms were found in most analyzed products, but in some materials, especially
those of natural origin, they detected high bacterial and fungal contamination.
Microorganisms of the genus Bacillus were the most frequent aerobic bacteria isolated;
Bifidobacterium and Clostridium were the most common anaerobic bacteria; and
Penicillium and Aspergillus fungi had the highest frequency. Because of their enzymatic
or toxigenic activities, these microorganisms are problematic in pharmaceutical finished
products.
Many of the ingredients used in formulations can become substrates for
microorganisms with optimum conditions, including pH, temperature, and nutrients. Thus,
the pharmaceutical industry should move away from traditional methods of testing of raw
materials and the finished product to a new technological pharmaceutical industrial era.

17
Moving away from the traditional pharmaceutical manufacturing becomes evident when a
retrospective evaluation compares traditional methods to modern technologies. For
instance, many organisms cannot be cultured with traditional methods. However, by using
new technologies, organisms which cannot be cultured can still be related to different
environments. By correlating organisms to different environments or soil, we can correlate
them to the origins of sterile products, non-sterile products, ointments, creams, and
biological products.
Regardless of the classification, it was important to detect the bioburden because
the vast majority of the pharmaceutical preparations have pH values of 6.5-7.5, ideal pH
values to sustain the ample microbial growth. According to the ingredients that compose
each formula, the susceptibility to microbial growth can be determined. Products unable
to suppress the growth of several microorganisms represent a potential health hazard
(Campana et al. 2006; Clontz 2009).
The evolution of the pharmaceutical industry during the last decade was evidenced
in the incorporation of molecular techniques in sensitive analyses to maintain quality
control of the finished product. This incorporation was performed with the principal
objective of obtaining positive and reliable results. Molecular techniques in microbiological
analysis were presented as an ideal alternative for those cases when no visible signs of
contamination were observed, but that certain types of organisms may be present in high
numbers. Physical changes in raw materials and finished product are usually associated
with microbial contamination, changes such as breakdown of emulsions, bio-pellicles,
surface growth, and production of gas, odors, unwanted texture, colors or flavors. In recent
years, several publications have encouraged the application of molecular techniques in
the microbiological assessment of pharmaceuticals. One of these techniques is
polymerase chain reaction (PCR). The successful application of PCR in the
pharmaceutical industry in developing countries was governed by technical factors and

18
regulatory requirements. These components include the development of a PCR laboratory
and the choice of appropriate equipment and reagents, including the presence of well-
trained analysts and the establishment of quality control and quality assurance programs
(Ragheb et al. 2014).
Different methodologies of molecular application have been applied toward the
pharmaceutical industry microbiological laboratories. One of these methods has been the
diagnosis by adenosine tri-phosphate (ATP), bioluminescence, and chain reaction of the
polymerase (PCR). When fitted to the methods of standard analysis, these methods
provide a rapid result regarding the quality control screening of cosmetics, and finished
products (Jiménez 2001).
The rapidity and alternatives for the "screening" in the microbiological analyses will
depend on the alternative techniques, the organisms involved, and the economic factor,
which can determine what methodology appears viable for routine use in the
pharmaceutical environment. These alternative methods can be classified by the
principles on which they are based, such as bioluminescence, DNA techniques,
immunological techniques, instrumental measurement of bacterial metabolism, and
modified conventional methods or other combinations of these techniques. Test kits must
be accurate, easy to use, labor-saving, sensitive, specific, and rapid (24 h or less). They
must also offer the possibility of a low detection limit, computerization, and low investment
and operational costs. (Van der Zee and Huis int’t Veld. 1997).
The pharmaceutical industries use conventional methods of culture techniques for
the enumeration of different populations using the selective culture media following the
ways of isolating pure cultures and use of confirmatory tests (Jiménez 2001). Other
methods used by pharmaceuticals industries for identification are the automated systems,
including BIOLOG, MIDI™, Phoenix, and VITEK® Systems, based principally on

19
phenotypical tests with a database of genus and species, which are limited for bacteria
and much more limited for identification of fungi (Cundell 2006). In research of the clinical
isolates, the sensitivity of the tests was 99.5% for Vitek® and 95.3% for the Phoenix
system. There were no significant differences between the 2 systems in the control strains,
with the Phoenix system obtaining 100% sensitivity. The Vitek® 2 expert systems obtained
seven strains with ESBL-positive tests, but were considered to be incoherent (Treño et al.
2009).
Cundell (2006) suggested that diverse methods and strategies must be evaluated
to characterize and, identify the genus and species of the organisms isolated in different
pharmaceutical industry environments. This reaffirms the need of the pharmaceutical
industry to justify programs of microbial identification and development of identification
techniques. Cundell suggests the evaluation of new, precise methods in microbiological
laboratories, especially for molecular genetics for bacteria and fungi. The conventional
Microbiological tests based on the activity of microbial growth represent a limiting factor in
speed for obtaining the results of quality control.
During the last 30 years, implementation of Good Manufacturing Practices (GMP)
has been the foundation for improving industrial quality control analysis. As part of GMP,
the United States Pharmacopoeia (USP) Microbial Enumeration Test (MET) provides
methods for the determination of total microbial counts for bacteria, yeast, and mold (USP
2015). The detection of microbial contaminants has been traditionally performed using
cultivation based methods (Mestrandrea L.W. (1997); Baird R. (1998). However, new
molecular methods are available that can rapidly detect microorganisms in contaminated
samples.
Chaubron, Martin and Groulon (2006) developed a one-step universal kit for real-
time RT-PCR method (Reverse Transcriptase Polymerase Chain Reaction). This kit detect

20
bacteria, fungi, and yeasts isolated in pharmaceutical preparations, cosmetics, and non-
clinical samples. Using only one step of RT-PCR, it perform a rapid RT-PCR to
simultaneously detect and quantify the presence of RNA of bacteria, fungi, and yeasts by
using fluorescent monitoring during amplification to reduce risk for false positives. The
false positives can caused by the opening of the pipe between the RT and PCR, as a
consequence of possible environmental contamination of the product due to the precedent
reaction of amplification in the laboratory.
To successfully treat a contamination caused by a bacteria or fungus-yeast in a
sterile or non-sterile product from industry, rapid and accurate detection was required.
Bacterial and fungus-yeast detection have traditionally been performed by pure culture
isolation, followed by identification procedures that incorporate biochemical characteristics
requirements and features, knowledge of the specimen source, visible (colony)
microscopic morphology. A rapid diagnostic method of less than 24 hr for detecting
bacteria and fungus-yeast in industrial samples with the equivalent sensitivity as culture
would be a significant improvement over currently used methods (Chaubron et al. 2006).
The majority of edible gelatin sold in Europe was derived from pigskin or extracted
from bovine tissue. Analytical methods are deficient that document the origin of gelatin or
more specifically, the animal species used as raw material sources in the finished product.
Several published species-specific PCR systems were evaluated as potential molecular
methods for determining the origin of the raw material used in making gelatin. A PCR
primer recently substantiated bovine species-specific material in gelatin by targeting the
ATPase 8 subunit gene in bovine mitochondrial DNA. This PCR primer set was enhanced
by both conventional and real-time PCR approaches and an evaluation of confirmed the
high specificity for the adopted primer set in various gelatin matrices of known origin. The
presence of bovine gelatin in pork or fish gelatin can be detected at 0.1 to 0.001%. Thus,

21
these two PCR assays were potential molecular detection tools to routinely detect bovine
gelatin either alone or as an inclusion in gelatin from other species (Tasara et al. 2005).
A multiplex PCR assay was devised and compared with standard conventional
methods for quality evaluation of pharmaceutical raw materials and finished products with
low levels of microbial contamination. Studies (Karanam et al. 2008) of artificially
contaminated with <10 colony forming units of E. coli, S. aureus, P. aeruginosa, and
Salmonella spp. and possibly contaminated samples were incubated for 16 h with different
enrichment media.
The detection limits for artificially contaminated products analyzed by multiplex
PCR was 1 CFU/g; the detection limit for conventional methodologies was >2 CFU/g.
Similarly, when tested with possibly contaminated samples, 35% were detected for E. coli,
Salmonella spp., S. aureus and P. aeruginosa with multiplex PCR, while only 21% were
detected with standard conventional microbial methods. Thus, multiplex PCR test
provides sensitive and reliable results and allows for the cost-effective detection of all four
bacterial pathogens in a single reaction tube. Karami et al. also conducted a rapid and
definite diagnosis of Salmonella enteritis using an ultra-rapid multiplex polymerase chain
reaction (PCR) detection method for major Salmonella serotypes, such as Salmonella
Typhi, Salmonella Typhimurium and Salmonella Havana. The results showed that all
reference and clinical isolates of Salmonella serovars Typhi and Paratyphi were accurately
identified by this assay. Specificity analysis revealed no cross reactions with other
Enterobacterial strains. Sensitivity of PCR and multiplex PCR assays was 1-10 cells.
Multiplex PCR preparation from sample to final result was 45-50 min (2006).
Abee and Wouters designed a method for the detection and identification of
microbial contaminants in pharmaceutical products, environments of pharmaceutical
production, cosmetics, and food (1999). This method was based on the selective
amplification for quantitative PCR “target” sequence of specific cDNA, particularly in

22
detecting the rRNA sequence of microbial contaminates. The benefits of this method was
the advantage of the conversion of the sequence of RNA in cDNA route with only one
step of reverse transcription and subsequently used in a PCR, in particular in TaqMan® X
PCR.
Schabereiter et al. developed a new test for the detection and differentiation of
eleven (11) species of Aspergillus spp. and Candida spp. in clinical specimens using the
molecular proficiency of RT-PCR. The detection of these organisms were collected from
patients for 33 clinical samples irrespective of suspecting the presence of infection by
fungi; the samples were analyzed using standard culture methods and by molecular real-
time-PCR. The RT-PCR not only detected fungi growing in samples, but also detected
Candida spp. as C. albicans and C. glabarata, as opposed to the conventional method
which could not detect Candida spp.(2006).
Klingspor and Jalal (2006), reported that 5-6 hr were required for the identification
of Candida spp. and Aspergillus spp. using the Rt Light Cycler® method. The
oligonucleotide primers and probes used for species identification were derived from DNA
sequences of the 18S rRNA genes of various fungal pathogens. Each sample was
screened for Aspergillus and Candida to the genus level in the real-time PCR assay. The
assay detected and identified most of the clinically relevant Aspergillus and Candida spp.
at 2 CFU/mL blood. Amplification was 100% specific for all Aspergillus and Candida spp.
tested. The use of RT-PCR in this study demonstrated sensitivity for the detection of the
DNA of the fungi in blood samples, fluids, and samples of biopsy within 6 hr. and identified
the majority of Candida spp. Also, the Real-time PCR assay allows sensitive and specific
detection and identification of fungal pathogens in vitro and in vivo.
Another method of Reverse Transcription-quantitative PCR (RT-qPCR) used by
Matsuda et al. (2007) focused on rRNAs as the target for precise and sensitive

23
quantification of commensal subdominant bacterial populations because rRNA was a
universal constituent of bacterial ribosomes and high copy numbers (103 to 104 molecules
per actively growing cell) are present as housekeeping genes, those required for basic
cellular function.
Targeting these molecules has the potential to increase the detection sensitivity,
as compared to the sensitivity of assays based on detection of a single or multiple copies
of genomic sequences. In this research the sensitive quantification of bacterial populations
with lower detection limits of 103 cells/g of feces and 100 cells/mL of peripheral blood
were detected with RT-qPCR by targeting rRNA, which has similar sensitivity to
conventional culture methods, but improved performance time. They demonstrated that
only 5 hr. was needed for RT-qPCR quantification, and suggested that rRNA-targeted RT-
qPCR assays provide a sensitive and convenient system for quantification of commensal
bacteria and for examining their possible invasion of a host.
Samadi et al. (2007) compared the conventional microbiological method currently
performed in pharmaceutical industry laboratories with the polymerase chain reaction
method. They suggested that the conventional methodology for detection of microbial
contamination in pharmaceutical products was generally based on culture by selective
media, microscopic examination of the suspected colonies, and biochemical tests, each
which was time-consuming and non-specific. In recent years attempts have been focused
on specific, sensitive and rapid methods because available documents are still insufficient
to integrate rapid methods in identification of microbial contaminations.
The study was directed towards the evaluation of a simple DNA lysis protocol,
coupled with a rapid PCR system for detection of low numbers of S. aureus in
pharmaceutical products. In the PCR assay of the experiment, the distinctive 241base-
pair (bp) fragments were obtained with universal primers and bacterial DNA templates,
thus indicating the efficiency of the extraction method and primers. The amplification of

24
the 108 bp fragment with specific primers using a DNA S. aureus template and negative
results with other staphylococcal species proved the specificity of the assay. The minimum
detection limit (MDL) of S. aureus in pharmaceutical samples was 102 CFU/mL when
using 10 μL of the sample lysate without any prior enrichment . Consequently, this level
of detection has not been previously reported in pharmaceutical samples.
The PCR disadvantage lack of discrimination between viable and non-viable cells
solve by; the researchers, integrating a preenrichment step into their study. After a 24 hr
preenrichment, the number of cells increased and the MDL was lowered to 1 CFU/mL.
The positive PCR results obtained for the bacterial concentration of about 101 and 100
CFU/mL and intensification of other amplicon following enrichment were expected,
because bacteria could multiply exponentially within 24 hr. Standard identification
methods usually require several days; with quick lysis, specific primers, and PCR protocol,
S. aureus contaminations of about 1-2 CFU/mL in pharmaceutical products were identified
to the species level. This study indicated that the components contained in the final
product were not inhibited by adverse effects and did not limit detection by PCR.
Jiménez et al. (2000) compared the method of rapid analysis of PCR with the
standard method for quality evaluation of pharmaceutical raw materials and finished
products with low levels of microbial contaminants. In their study they developed and
analyzed PCR assays for detecting low levels of bacterial and mold contamination in
pharmaceutical samples containing less than 10 CFU and to compare the assays to
standard conventional methods.
The samples were artificially contaminated with less than 10 CFU of E. coli, S.
aureus, P. aeruginosa, and A. niger. The sample was evaluated for low levels of microbial
contaminants in raw material, including carboxymethylcellulose, lactose, and semiticone,
and for finished product such as: denture adhesives, liquids, anti-flatulents and medicated
ointments. The bacterial DNA was extracted from each enrichment broth by mild lysis in

25
Tris–EDTA–Tween 20 buffer containing proteinase K; DNA mold was obtained by boiling
samples in Tris–EDTA–SDS buffer for 1 hr. A 10-mL aliquot of extracted DNA was added
to Ready-To-Go PCR beads and specific primers for E. coli, S. aureus, and P. aeruginosa.
A 50-mL aliquot of extracted mold DNA was used for amplification of specific sequences
of A. niger DNA.
With the PCR, they detected low levels of microbial contamination in all the
samples of raw material and finished product. Indicating that 100% interrelation exists
between both methods (standard method vs. PCR). The standard methods required 6–8
days, while PCR detection of all microorganisms was completed within 27 hr. Low levels
of microbial contamination were detected in all raw materials and products using PCR
assays and rapid quality evaluation of pharmaceutical samples resulted in optimization of
product fabrication, quality control, and release of finished products.
The barriers to the acceptance of rapid methods in pharmaceutical microbiology
gradually have been overcome. For full acceptance, minimal sample preparation must be
combined with better resolution that does not compromise the effectiveness of testing.
Bosshard et al. (2006) performed a study to compare phenotypic versus molecular
identification. The results of molecular analyses were compared with two commercially
available identification systems (API® 20 NE, VITEK™ 2 fluorescent card). Using 16S
rRNA gene sequence analyses, 92% of the isolates were assigned to species level and
8% to genus level. Using API® 20 NE, 54% of the isolates were assigned to species and
7% to genus level, and 39% of the isolates could not be discriminated at any taxonomic
level. VITEK™ 2 obtained 53%, 1%, and 46%, respectively, with 15% and 43% of the
isolates corresponding to species not included in the API® 20 NE and VITEK™ 2
databases, respectively. Bosshard et al. concluded that 16S rRNA gene sequencing was

26
an effective means for the identification of clinically relevant nonfermenting gram-negative
bacilli.
They proposed an algorithm for proper identification of nonfermenting gram-
negative bacilli and concluded that the majority of strains could not be accurately identified
by phenotypic profiling because species assignment was found to be reliable only when
excellent (or good) species identification was achieved. This was the case in 35% of the
isolates. Molecular identification was more laborious than phenotypic identification; results
of sequencing were usually available within one to two working days. Given these
considerations, they developed an algorithm for the effective and proper identification of
gram-negative nonfermenters in the diagnostic laboratory (Fig. 2.01). Thus, if API® 20 NE
or VITEK™ 2 do not yield an excellent (or good) species identification, the subsequent
assays shoul target nonfermenters and subjected to 16S rRNA gene sequencing if an
adequate species assignment is problematic.

27
Figure 2.01. Algorithm for the identification of nonfermenting gram-negative bacilli.
(Bosshard et al 2006).
In accordance with Bosshard et al. (2006), the 16S rRNA sequenced gene has
several benefits, compared with phenotypical identification, including that it was not
restricted to a specific group of bacteria and information from the public GenBank®
database was available that covers the whole spectrum of phylogenetic diversity; it was
new, so, other systems currently did not have species assigned to a group or related
bacteria. However, the results were precise and do not depend on the change of the strain
or individual interpretation.
An objectionable organism in accordance with the USP38-NF33 (2015) for the
TSM test was any Salmonella spp. Salmonelloses was responsible for many infections in
humans and animals, but are not detectable in certain clinical samples that contain a small
28
number of the organisms. Pathmanathan et al. (2003) studied the possibility of applying
the PCR procedure using a pair of primers targeting the hilA gene to detect Salmonella
spp. A total of 33 Salmonella strains from 27 serovars and 15 non-Salmonella strains from
eight different genera were included. The PCR with all the Salmonella strains produced a
784 bp DNA fragment that was absent from all the non-Salmonella strains tested in the
study. The detection limit of the PCR was 100 pg with genomic DNA and 3 × 10⁴ CFU/mL
with serial dilutions of bacterial culture. Subsequently, an enrichment-PCR method was
developed to test the sensitivity of the hilA primers for the detection of Salmonella in faecal
samples contaminated with different concentrations of Salmonella choleraesuis subsp.
choleraesuis serovar Typhimurium.
The method described by the authors allowed the detection of Salmonella
Typhimurium in faecal samples at a concentration of 3 × 10² CFU/ml−1. They concluded
that the hilA primers were specific for Salmonella spp. and the PCR method presented by
them may be suitable for the detection of Salmonella spp.in feces better than the
conventional method of analysis. The conventional method of isolating strains of
Salmonella spp. takes four to seven days to complete, in addition to being laborious and
needing adequate personnel. Substances such as bilirubin and biliary salts in human fecal
matter contains inhibit PCR use, making organisms detection difficult.
Among the principal monitoring and repeated approach of many investigations of
different industrial pharmaceutical classifications, most of their efforts are applied to the
study and implementation of microbiological methods that includes: organism’s isolation,
early detection of pathogenic organisms, characterization, and enumeration of
microorganisms of environmental samples, raw materials, and finished products. These
are categorized in accordance with the type of alternate technology used. The alternate
technology can include the growth of microorganisms, organism viability, presence or
absence of the microorganisms, cellular components, or “artifacts” present, nucleic acid

29
methods, and traditional methods combined with computerized images (Moldenhauer
(2006). One notable question when audits are made in the pharmaceutical industries is,
What specific outlying organisms within samples analyzed in programs of environmental
monitoring programs need to be characterized and identified to genus, species or serotype
of strains? This key question directs the pharmaceutical industry towards developing
strategies that could be applied effectively to identify pathogenic or objectionable
microorganisms.
Quality control monitoring will include information concerning the excipients,
content of the pharmaceutical ingredients, behavior in manufacture environments, and the
integrity of the finished product (Cundell 2006). These strategies will determine the
specifications of flawed product on not complying with the required specifications. The
specifications are contained under the requests of “International Compendia
Harmonization” (ICH) a harmonized standard for Japanese, American, and European
product specification. With the harmonization changes occurred in 2007 relating to
specifications and methods of tests for pharmaceutical applicable preparations. Involving
the evaluation and adaptation of the limits of values in the monographs principally for the
European pharmacopeia, in accordance with ICH (2007).
The current information from 1997 until 2006 stemmed from an evaluation of 40
different pharmaceuticals to establish limits for microbiological quality testing not
exceeding 93% of the examined raw material. A total of 5.5% of the analyses were
supported to be within the specifications after applying it to the factor of validate of
tolerance of 5 of the ancient method. Only 1.5% of the analyses resulted as out of
specifications (OOS), generally from raw material of vegetable origin (Bomblies et al.
2007).
The FDA has stated that research priorities should be directed towards creating
investigative fields and laboratories with sensitive, effective hardware for analyses which

30
are cost effective (Avallone 1986; Cundell 2006; Miller 1982). Microbiology laboratories
perform tests for the detection of objectionable pathogenic microorganisms from the raw
material up to the finished product, guarantee that the product expires within
specifications. The USP38 Chapters <61> (Microbiological examination of non-sterile
products: Microbial Enumeration Tests (Met)) and USP <62> (Microbiological examination
of non-sterile products: Test for specified microorganisms) establishes the determination
of entire microbiological content of bacteria, yeasts, and fungi in pharmaceutical samples
for non-sterile products. In spite of the regulations, microbial contamination continues as
a major problem on a global scale.
Lee et al. (2008) demonstrated the effectiveness of Real-time PCR technique
based on the determination of the gene rRNA in terms of quantity of the number of copies
analyzed for the absolute and relative quantification with E. coli. The rapid methodology
was cost effective without presenting safety problems, compared to traditional methods
such as Southern Blot Analysis. Detection of medically-related highly-pathogenic
objectionable organisms in the pharmaceutical industry focused on S. aureus and P.
aeruginosa. A modification of Real-time PCR was based on "LightCycler® hybridization
probes" that originally was developed for analysis of clinical samples.
In a study by Skof et al. (2007), optimization of Real-time PCR was achieved by
analyzing 34 different pharmaceutical topical-use application samples compared in
parallel form with the standard protocol for European pharmacopeia. The tests made with
the modified PCR could detect 1-10 CFU of both bacteria in gram or milliliter units of
pharmaceutical product in 26 hr., including 24 hr. of enrichment. However, microbiological
standard methodologies require 5-7 days. They concluded that the Real-time PCR was
an efficient tool for the rapid detection of S. aureus and P aeruginosa in topical-application
pharmaceutical products .
31
The Real-time PCR method used in the analyses of the TSM test in
pharmaceutical microbiology laboratories are not found commonly in literature; articles
usually refer to the chemical product, in medical and biotechnological devices, and clinical
areas concerning objectionable organisms such as: E. coli, P. aeruginosa, Salmonella
spp., S. aureus, A. niger and C. albicans. The methodology of uniplex PCR amplicons
were effectively sequenced, corroborating the conservation of used primers. Other
validation parameters such as specificity, sensitivity, and robustness were evaluated. The
method provides a high performance screening methods to test different pharmaceutical
preparations for specified microorganisms for the detection of microbiological
contamination (Ragheb et al. 2012).
Real-time quantitative PCR (qPCR) technology offers fast and reliable
quantification of any target sequence in a sample (Burgos et al. 2002). They analyzed the
effect of manufacturing lots of PCR reagents on two main PCR parameters, specificity and
sensitivity. It was used four different amplicons, incorporating either viral DNA or mouse
genomic DNA. Even though a PCR product could be obtained among a variety of
parameters, they observed relevant variations in sensitivity relating to the reagents’
formulation. They concluded that different lots of reagents may determine the analytical
performance of PCR assays, indicating that reagents testing import when the PCR
protocol was used for quantitative purposes (Burgos et al. 2002). There were many
methods available for quantification of nucleic acids; real-time -qPCR was the most
sensitive and precise method (Ferre 1992; Klein 2002). Changsoo et al. (2005)
demonstrated the feasibility of two real-time qPCR methods to determine plasmid copy
number. The relative and absolute quantification methods required separate detection of
the plasmid and the host chromosomal DNA. Detection was performed using a primer set,
specific to a single-copy gene in each target molecule. They used SYBR Green I dye in

32
real-time -qPCR analyses because it has several advantages over sequence-specific
probes when singleplex PCRs are performed.
A hybridized test using Real-time PCR really was developed by Kearns et al.
(2002). The test was developed for the rapid detection in less than one hour of the
susceptibility to Penicillin by the bacterium Streptococcus pneumoniae. Real-time PCR
was sensitive to culture methods, microscopy or detection of antigen, in addition to
providing information of susceptibility even in the cases of negative cultures.
Jaffe et al. (2001) evaluated in his study that the methods of Real-time PCR, in
addition to being cost effective for each sample, also provided precision and rapidity of
DNA extraction. In their study he mentions that he pathogenic gram-negative bacteria, P.
aeruginosa, has emerged as one of the most problematic nosocomial organisms. This
objectionable organism is problematic for the pharmaceutical industry because it is
clinically indistinguishable from other gram negative bacterial infections. The percentage
of mortality of P. aeruginosa is high, as well as this bacteria is inherently resistant to
common antibiotics. The detection at clinical laboratory levels is performed by the
standard methodology of identification and susceptibility, taking 48 hr to complete the
analysis.
McArthur and Bibb (2008) developed a method of fingerprinting using DNasae IT7
exonucleous applied to actII-orf4 from f Streptomyces coelicolor. The A3 encodes the
activation of the specific route for the production of the antibiotic actinorhodin. In the
development of a live map, they created oligonucleotides incorporating the regulatory
elements S. coelicolor affected antibiotic production. In the determination of the
oligonucleotide decoys (mimicking fragments of ADN inhibiting specific transcription
factors containing specific sequences of recognition), they made a protocol of transfection
process which was developed for liquid cultivation that support an efficient entry of the
decoys, with RT-qPCR to demonstrate the persistence of the decoy for >70 hr. The

33
measurements in the effect of the growth, expression of, and the production of antibiotic
demonstrated that one of the decoys in concordance with the plate test was more effective
at increasing the production of actinorhodin.
The development of a novel Real-time PCR for the detection and differentiation of
eleven medically important Aspergillus spp. and Candida spp. in clinical specimens was
performed by Schabereiter-Gurtner et al. (2007). The application of the Real-timePCR
targeting the region ITS2 of the fungi was developed for the detection and differentiation
of the species, including Aspergillus flavus, A. fumigatus, A. nidulans, A. niger and A.
terreus, and C. albicans, C. dubliniensis, C. glabrata, C krusei, C. parapsilosis, and C.
tropicalis using the LightCycler® instrument. The results of Real-time PCR were compared
with results of culture, histology, or ELISA system. The results suggest that the tests for
Aspergillus spp. and Candida spp. can be adapted for clinical laboratories as simple
techniques, especially for early scrutiny the objectionable of Candida and Aspergillus spp.
Once again, Real-time PCR methodology was potentially an important tool in the detection
of stages of early diagnosis in infections caused by fungi.
In a retrospective analysis of how the pharmaceutical industry has evolved in the
latter decade, the incorporation of molecular techniques was significantly demonstrated
for analyses for the control of the quality of the pharmaceutical products, especially to
determine the diversity of microorganisms in products utilized by the pharmaceutical
industries. The identification of microbial contamination within products provides valuable
information which can be used to discover the possible source of contamination and
distribution of microbial species in the pharmaceutical environments (Jiménez 2007). The
FDA listed 134 non-sterile products from 1998 until 2006, which represented 48% of
contamination from Burkholderia cepacia, Pseudomonas spp. and Ralstonia picketti.
Contamination by yeasts and fungi represented 23% gathered from products; 60% from
not-sterile product belonging to gram negative bacteria, and 4% associated with gram-

34
positive bacteria (Jiménez. 2007). Of 193 contaminated products, 78% of the
contamination stemmed from the lack of sterility of the product, and 7% from yeast and
fungi contamination. Data revealed that an 6% belonged to gram-negative bacteria, and
1% from gram-positive bacteria.
2.2. Health Risks from Objectionable Organisms
The question, “What was an objectionable organism?” was pertinent among
industrial microbiologists and regulators. This discussion should be based on science,
combined with consideration for reasoned risk analysis (Sutton 2012). The presence of
the objectionable organisms in pharmaceutical preparations represents an imminent risk
to the health of the consumer. The term “risk” within the pharmaceutical industry can be
described from three principals: These can be: (1) in an approach known as the current
good manufacturing practices (GMPs), (2) directed to nonperformance of the raw material
and finished product, and (3) compliance with the USP for the laboratory analyses needed
in accordance with the type of product that was manufactured. This investigation presents
its approach to fulfill analyses of raw material and finished product in accordance with the
requests of the TSM testing in chapters <61> and <62> detail in the USP (2015).
The use of contaminated pharmaceutical preparations has proven hazardous to
the health of users (Cooker 2005). There have been reports of drug-borne human
infections worldwide. Contamination of pharmaceuticals with microorganisms can also
bring about changes in their physical characteristics, including breaking of emulsions,
changes in odor and color, fermentation of syrups, thinning of creams, turbidity, or
deposits, (Shaikh et al. 1988). The incidence of microflora in non-sterile preparations
generally was influenced by the nature of the ingredients (whether natural or synthetic),
and the quality of the vehicle and the care and attitude of personnel involved in their
handling (Parker 2000). Limits for objectionable microorganisms in oral products intended
for use by immunocompromised patient populations, such as children and cancer

35
sufferers, who are more at risk of microbial infections, should be more stringent than limits
for oral products intended for treating patients that are not immunocompromised (Gad et
al. 2011).
With the harmonization of the compendia tests, additional guidance was added to
the informational chapter USP <1111> which states: “…the significance of other
microorganisms recovered should be evaluated in terms of the following:
• Use of the product, with it’s hazard varying according to the route of
administration (eye, nose, respiratory tract).
• Nature of the product, such as does the product support growth? Does it have
adequate antimicrobial preservation?
• The method of application.
• Intended recipient, including risks which may vary for neonates, infants, or the
debilitated.
• The use of immunosuppressive agents, corticosteroids.
• Presence of disease, wounds, or organ damage”.
Where warranted, a risk-based assessment of the relevant factors was conducted by
personnel with specialized training in microbiology and in the interpretation of
microbiological data. Assessment for raw materials processing the product, the current
testing technology, and availability of materials of the desired quality (USP 2015).
According to Sutton and Jiménez (2012) regarding enforcement reports for non-
sterile products, about 75% of the recalls are from either OTC products or personal-care
products from 2004 to 2011. The causes for the non-sterile recalls are presented in
Figure 2.02.

36
Figure 2.02. Causes for non-sterile recalls (Sutton and Jiménez 2012).
Of the 142 non-sterile recalls during the period from 2004 to 2011, a total of 103
were tested positive for objectionable organisms and 22 for microbial contamination in
general. Of those 103 objectable organisms cited in recalls included: 77 gram-negative
bacilli, 3 gram-positive cocci and 23 yeast/molds recalls.
The compendium guidance provides the basis for an evaluation of potentially
objectionable organisms by a competent, trained, professional microbiologist. Risk
assessments are encouraged (Sutton and Jiménez 2012). The first consideration should
be total numbers of microorganisms present. Immunocompromised patients are at
increased risk for oral drugs, so low total aerobic counts (10 CFU/g for tablets) were
established for the specification (Manu-Tawiah 2001). The source or the cause of primary
contamination must be identified for appropriate action to be taken. The primary
contamination may be intrinsic with contaminated raw materials, or extrinsic-contaminated

37
during or after processing (Kushwha 2009). The severity of the effects that
microorganisms may have on any particular drug product is a function of the nature of the
product with its intended use, and the nature of the contaminant microorganisms
(Kushwaha 2010).
At one end of the spectrum, microbial contamination of a sterile parenteral product
may, on injection into a incapacitated patient, result in fatality; or patients may refuse to
begin or continue medication because of aromas, discolorations, or off-flavors with
microbial origin. Thus, the presence of microorganisms should to be avoided in drug
products (Nigel 2002).
2.2.1. From GMP’s Perspective
The main importance of verifying that raw material and finished products are free
of the presence of microorganisms is that contamination could represent a risk to the
health of the consumer; thus, it ismportant to follow Good Manufacturing Practices (GMPs
2015). According to Title 21 of the Federal Code of Regulations, Part 211 (21CFR211
2014), following the norms of GMP applying to food, cosmetic, and drugs industries will
provide quality standards for manufacture of the product, with non-compliance products
removed from the market. This prevents health risks to human beings. In the United
States, current Good Manufacturing Practice (cGMP) regulations are issued by the U.S.
Food and Drug Administration (FDA) as the minimum requirements for quality systems for
FDA-regulated products such as biologics, devices, drugs and food. One requirement of
cGMP regulations was the monitoring of microbiological contamination (Kushwaha 2009).
The critical nature of the issue was reflected by its presence in three separate citations in
the cGMP (Sutton 2012):
21 CFR 211.84(d)(6) “Each lot of a component, drug product container, or closure
with potential for microbiological contamination that was objectionable in view of
its intended use shall be subjected to microbiological tests before use.”

38
21 CFR 211.113(a) “Appropriate written procedures, designed to prevent
objectionable microorganisms in drug products not required to be sterile, shall be
established and followed.”
21 CFR 211.165(b) “There shall be appropriate laboratory testing, as necessary,
of each batch of drug product required to be free of objectionable microorganisms.”
The GMPs include all the aspects in the manufacture of a drug, from the receipt of
the raw material, the facilities, equipment, training, and hygiene of the personnel to the
completed product. The GMPs require a detailed, written standard operating procedure
(SOP) for process, analysis, and handling that involves the quality of the final product.
Compliance with the GMPs protects the consumer by not allowing the sale of drugs or
products not fulfilling quality standards, such as non-intentionally added toxic content, for
non-compliance of a formula, or problems with processing, packaging, analysis, or
microbial or particulate contamination during its product manufacture (21CFR211. 2014).
Pharmaceutical manufacturing generally includes a complex, multi-step handling and
processing system risks from microbial contamination from diverse sources including
container-closures, equipment, personnel, the environment, the facility, and raw materials
(Guilfoyle et al. 2013).
The analyzed raw material and finished product must demonstrate that it comply
within the standard of GMPs named as a pure, safe, and effective product. If the company
was not complying with cGMP regulations, any drug made by them was considered
adulterated under the law. This means that the drug was not manufactured under
conditions that comply with cGMP (Rodríguez-Pérez 2014). It does not mean that there is
necessarily something wrong with the drug. The product can be perfectly safe for use, but
as established in the FD&C Act, a drug that was not manufactured following cGMP
requirements was considered adulterated. If failure to meet cGMP results in the

39
distribution of a defective drug, the company may subsequently recall that product. Once
the company follows cGMP, its label was assured of efficacy of the product.
The FDA trains its inspectors so that they conduct GMP examinations to ensure
compliance with its regulations. Thus, it guarantees the consumer a healthy, safe product.
The GMP is a system that helps ensure that the medicines are prepared and controlled in
a consistent way with specified quality standards and are manufactured as stipulated
when submitted to the FDA for commercial approval. Consequently, every industry
designs, in accordance with the fulfillment of the regulations of GMPs, the target to
minimize the risks of contamination by objectionable, indicators and/or pathogenic
organisms in accordance with the distinctions that the FDA authorizes. The principal risks
mainly found by the US FDA for the year 2013 and 2014 are described in Table 2.01.
Table 2.01. Major risks for non GMP compliance.
FDA US. 2014. Product recall.
Type of Incident Risk
Contamination in the final product Contamination in raw material
Damage to health Death
Presence of particulate matter Local inflammation, phlebitis, mechanical disruption of tissue, or immune response to the particulate lead to granulomatous formation, etc.
Incorrect labeling of containers
Incorrect medicine Secondary effects Damage to health Death
Lack of active ingredient Active ingredient higher than established
Ineffective treatment Harmful effects

40
Without GMPs it would be difficult to assure the quality, homogeneity, and
reproducibility of a lot of production, not only with regard to other lots, but inside the same
batch of the product. The federal regulations for the current good manufacturing practices
(cGMP’s) of drugs states quite clearly in 21 CFR 211.84(d)(6) that “each lot of a
component, closure, or drug product container, that has potential for microbiological
contamination, that is objectionable in view of its intended use, shall be subjected to
microbiological tests before use.(Torbeck et al. 2011).
2.2.2. Non-compliance of Product
The microbial diversity present in the pharmaceutical environment can provoke the
immediate withdrawal of the product from the market with the imminent alert of
safeguarding the health and life of the consumers because each product may support
microorganisms. Microbial growth potential can have a significant effect on the
development and design of the drug manufacturing process (Lolas and Metcalfe 2011).
The distribution and growth of the microorganisms in the pharmaceutical ambience
is limited by the environmental gradient where microorganisms may survive and grow with
various gradients of factors such as: temperature, water availability, pH, and concentration
of organic available components. Each gradient factor has a threshold value according to
each organism. Consequently, the optimization of the system is needed in terms of
environmental control to eliminate fluctuations, and to minimize or eliminate the survival
of the organisms. The presence of objectionable microorganisms in non-sterile products
is indicative of poor quality during the process, and the absence of optimization of the
system (Jiménez 2007).
The identification of microbial contamination in retired products (for recalls
definition, refer to Table 2.02) from the market provides information of the possible sources
of distribution of microbial species in the pharmaceutical industry environment (Torbeck
et al. 2011).

41
Table 2.02. Product recall definition.
A “recall” is a firm’s removal or correction of a marketed product that the FDA considers to be in violation of the laws it administers, and against which the FDA would initiate legal action (e.g., seizure). Recalls do not include market withdrawals. FDA assigns a numerical designation (I, II, or III) to a particular product recall to indicate the relative degree of healthhazard presented by the product.
A Class I recall: use of or exposure to a violate product may cause temporary or medically reversible adverse health consequences or where the probability of serious adverse health consequences is remote.
A Class II recall: the use of, or exposure to, a violate product may cause temporary or medically reversible adverse health consequences or where the probability of serious adverse health consequences is remote.
A Class III recall: a situation in which use of or exposure to a violate product is not likely to cause adverse health consequences.
Market withdrawal: occurs when a product has a minor violation that would not be subject to FDA legal action. A firm should remove the product from the marketplace or correct the violation. A product could be removed from the market due to tampering, without evidence of manufacturing or distribution problems.
Medical device safety alert: issued in situations (which may also be considere as recalls) where a medical device may present an unreasonable risk of significant injury.
Data obtained from U.S. FDA 2014.
An analysis of information of pharmaceutical products withdrawn by the FDA,
concludes, that of 134 non-sterile products from 1998 to September 2006, 48% of the
retired products were contaminated by B. cepacia, spp., or Ralstonia picketti (Jiménez
2007). Of these drugs, 23% were caused by yeasts and fungi. Sixty percent (60%) of the
outlying retired products contained gram-negative bacteria, and 4% were identified as
gram-positive bacteria. Otherwise, in the classification of sterile products,they indicated
that of 193 withdrawn products, 78% of the products lacked sterility and 7% were
contaminated with yeasts and fungi. About, 6% of the products were from gram-negative
bacteria, and a 1% were from gram-positive bacteria. Among the non-sterile and sterile

42
products, B. cepacia was the most frequent isolated organism, with 22% and 2.5% of the
products withdrawn from the market, respectively. Based on the literature, B. cepacia,
Pseudomonas spp. and Ralstonia picketti can be associated with water contamination,
whereas the yeasts and fungi and gram-positive bacteria can indicate poor environmental
controls (Jiménez 2007).
One of the principal causes of recalls reported by Torbeck et al. (2011) may have
been attributed to the bacterium B. cepacia complex (Bcc) because of inadequate testing
and specification (e.g., inadequate microbiological analysis, contaminated raw materials,
and incomplete/incorrect testing for antimicrobial effectiveness). The product recalls
included occurred during the years 2000 and 2008. A total of eight recalls were Class I,
six were Class II, and two were Class III. Of the recalls, six recalls were initiated voluntarily,
following FDA judgments, and the firms initiated an additional 10 voluntary recalls. The
product types included anticavity rinse, baby and adult washcloths, electrolyte solution,
eyewash, mouthwash, nasal spray, radiopaque preparations, skin cream, surgical prep
cloth. Burkholderia cepacia complex had contaminated each of these products, even in
the presence of one or more antimicrobial preservatives. This species consists of 17
closely related species of the ß -proteobacteria subdivision, which continues to be
principal cause for contamination within the pharmaceutical industry (Torbeck et al. 2011).
Table 2.03 lists retired products from the market for the year 2013 as a consequence of
contamination by microorganisms (FDA US 2013).

43
Table 2.03. Products withdrawn from market in 2013 due to microbial contamination.
Date Industry Product Contaminant
Mar 20, 2013
Medprep Consulting Inc. All Lots of all compounded products
Potential mold contamination
Mar 20, 2013
Clinical Specialties Compounding Pharmacy
All lots of sterile Products repackaged and distributed by Clinical Specialties Compounding
Lack of sterility Assurance
Mar 17, 2013
Medprep Consulting Inc. All lots of all Compounded Products
Potential mold contamination
Mar 16, 2013
Medprep Consulting Inc. All ots of Magnesium Sulfate, 2g in Dextrose, 5% in water, 50mL for injection
Mold contamination
Retrieved from U.S. Food and Drug Administration. Guidance Documents. 2015.
Verifying compliance with quality standards of the articles, raw material and
finished product was critical to avoid major consequences as demonstrated in Table 2.04.
The FDA and the Center for Disease Control and Prevention (CDC) identified the
presence of contamination by bacteria and/or fungi in vials without opening the products
Betamethasone, Cardioplegia, and Triamcinolone (FDA U.S. 2014, CDC 2014). Among
the included specified organisms, there were bacteria such as Bacillus spp. and fungi such
as Aspergillus fumigatus, species that can be pathogenic to the human beings.
Particularly, A. fumigatus was a risk for immunocompromised patients.

44
Table 2.04. CDC and FDA Laboratory-Confirmed organisms from product samples.
Laboratory-confirmed Organisms from Product Samples Associated with NECC Recalled Lots of Betamethasone, Cardioplegia, and
Triamcinolone Solutions
Medication Lot Number Microbial Contamination
Betamethasone 6 mg/mL injectable – 5 mL per vial
08202012@141 Paenibacillus pabuli/amolyticus; Bacillus idriensis; Bacillus flexus; Bacillus simplex; Lysinibacillus sp., Bacillus niacini, Kocuria rosea, Bacillus lentus
Betamethasone 6 mg/mL injectable – 5 mL per vial
07032012@22 Bacillus niabensis; Bacillus circulans
Betamethasone 12 mg/mL injectable – 5 mL per vial
07302012@52 Bacillus lentus, Bacillus circulans, Bacillus niabensis, Paenibacillus barengoltzii/timonensis
Betamethasone 6mg/mL injectable – 5 mL per vial
08202012@44 Bacillus lentus, Bacillus firmus, Bacillus pumilus
Betamethasone Betamethasone 6 mg/mL injectable – 5 mL per vial
08152012@84 Penicillium sp., Cladosporium sp.
Triamcinolone 40mg/mL injectable – 1 mL per vial
06062012@6 Bacillus lentus, Bacillus circulans, Bacillus niabensis, Bacillus nealsonii, Bacillus subtilis group, Bacillus firmus
Triamcinolone 40 mg/mL injectable – 2 mL per vial
08172012@60 Aspergillus tubingensis, Penicillium sp.
Triamcinolone 40mg/mL injectable – 10 mL per vial
08242012@2 Aspergillus fumigatus
Cardioplegia solution 265.5 mL per bag
09242012@55 Bacillus halmapalus/horikoshii, Brevibacillus choshinensis
Data obtained directly from (CDC) Centers of Disease Control and Prevention 2014.

45
When we do an interrelation of the outlying and identified organisms quoted in
Jiménez’ 2007 study, and the presented organisms of the products withdrawn from the
market by the FDA and identified by the CDC we see that these organisms do not belong
to the USP list of objectionable organisms. Nevertheless, it was important to highlight that
, if we refer to the USP in Chapter <1111> microbiological examination of non-sterile
product: criteria of acceptance for pharmaceutical preparations and substances for
pharmaceutical use it establishes that the presence of certain microorganisms in non-
sterile preparations can have the potential of reducing or deactivating the therapeutic
activity of the product. These organisms may provoke adverse effects to the health of the
patient. Thus, pharmaceutical industries are entrusted with assuring a decrease in the
bioburden of the different dosages of the finished product that they manufacture. The most
important and determinant aspect was that they must adhere to Chapter <1111> where a
new stipulation indicates that, in addition to the microorganisms listed as specific
organisms that must be absent in non-sterile products, the industry has the responsibility
for determining the significance of the presence of other organisms recovered, in terms of
risk to the public health.
The isolated organisms clearly described in the released investigations previously
presented in this study belong to the division of other organisms, because these were not
a part of the specific objectionable organisms. Otherwise, these organisms appear to be
isolated cases among the retired products. This indicates that the industry cannot limit its
identification to objectionable organisms, indicators and/or pathogenic organisms that
appear in the USP lists. For this reason, the industry must evaluate other organisms
isolated under the following parameters (USP38 2015):
Use of the product; dangers vary according to the route of administration (eyes,
nose, respiratory tract, etc.).

46
Nature of the product; does not product support microorganisms growth and
maintains sufficient antimicrobial preservation.
Application of standardized product-analysis methods.
Target population (newborns, infants, etc.).
Uses immunosuppressive cortisteroid agents.
Presence of diseases, wounds, organ damage.
In the event that any of these situations present, it was important that an evaluation
of the risks of pertinent factors be performed by personnel specialized in microbiological
protocols and capable of the interpretation of the microbiological data USP38-NF33,
Chapter <1111> (2015).
2.2.3. From the United States Pharmacopoeia (USP) Perspective
Pharmaceutical products are exposed to microbiological contamination that can
represent risks to the health of the consumer (FDA 2015). The presence of certain
organisms in non-sterile preparations can have the potential of reducing or inactivating the
therapeutic capacity or efficacy of the pharmaceutical product and having the potential to
adversely affect the health of patients, in accordance with the USP38-NF33 <1111>
(2015). The presence of these organisms may causes degradation of the product,
changes in the aesthetics, and the efficacy of the product. If these organisms are
potentially harmful or may produce toxins, there would not be in compliance with USP
(2015). The FDA identifies the microorganisms as: harmful, objectionable, and
opportunists (FDA 2009).
An organism is assigned a harmful designation if it contained or liberated toxins
and is responsible for infections and illnesses in human beings. Examples of these
organisms are: Salmonella spp., S. aureus, E. coli, P. aeruginosa, C. albicans and A.
niger. These well-known organisms designated as objectionable can cause illnesses or

47
deterioration of the product. Some strains of the genus Pseudomonas, like P. putida and
P. maltophilia represents this type of organism. Opportunistic organisms can cause
illnesses in immunocompromised patients and includes the majority of the microbial flora
in raw material, excipients, and those from pharmaceutical manufacturing environments
(Jiménez 2007; Clontz 2009).
The USP establishes methods for determining the microbiological load known as
a bioburden test and the microbial limits test designed to determine aerobic or facultative
anaerobic heterotrophic mesophilic organisms because these are the most common
contaminants in pharmaceutical industry facilities. Table 5 summarizes the organisms
identified by the FDA as organisms that should not be present in pharmaceutical
preparations and present a risk to consumer health (Jiménez 2007).

48
Table 2.05. Summary of organisms that are more frequently a health threat.
Organism Morphology
Effect
Clostridium spp. Gram positive bacteria bacillus
Causes toxic effects. Possible virulence like gas gangrene, necrotic enteritis.
Candida spp. Yeast Pathogenic to humans Aspergillus niger Fungi Aspergilliosis Fusarium spp. Penicillium spp. Alternaria spp. Trichosporum spp.
Fungi Opportunistic pathogens to humans
Trychophyton spp. Microspora spp.
Fungi Potential source of infection in keratinized tissues
Staphylococcus spp. Micrococcus spp. Streptococcus spp.
Gram positive cocci bacteria
Skin infection Toxins and enzymes produced destroy the white and red cells Considered a highly opportunistic pathogen Resistant to antibiotics.
Staplylococcus epidermidis S. saprophyticus S. haemolytycus
Gram positive cocci bacteria
Opportunistic pathogen. Less virulent than S. aureus
P. aeruginosa Gram negative bacteria bacillus
Pathogen in humans. Causes infections on burns, cuts, urinary tract and lower respiratory tract.
2.3. Contribution to Procedures, Costs and Benefits for Pharmaceutical Industries
The first rapid methods of microbiological analysis by clinical microbiologists began
in the 1960 (Fung 2002). Rapid methods and automation in microbiology was a dynamic
area in applied microbiology dealing with the study of improved methods in the
characterization, early detection, isolation and enumeration of microorganisms in clinical,
food, industrial, and environmental samples. From 1960 to 1970, rapid methods of
identification of microorganisms used by the pharmaceutical industry was based on a few
"kits" for miniature tests. This miniaturized methodology was used mainly as an alternative
technology to traditional biochemical tests. Figure 1.01 estimated the trends of rapid

49
methods and automation in microbiology by medical microbiologists and food
microbiologists from 1965 to 2000. The age of miniaturization and diagnostic kit
development occurred from 1965 to 1975; the age of immunological test kits from 1975 to
1985; and the age of genetic probes, molecular testing systems, and polymerase chain
reaction (PCR) from 1985 to 1995 (Fung 2002).
The PCR method marked an important stage in microbiological analysis, both in
clinical samples and in the field of pharmaceutical investigation. The challenge to the
clinical microbiology laboratory was how to respond to problem, for example in the case
of a worldwide pandemic (such as MRS- methicillin-resistant S. aureus). This includes the
implementation of protocols for mandated legislation that will require an active screening
program. Although more expensive molecular techniques have the potential of providing
sensitive and rapid results, they may not be the most appropriate for some institutions.
Culture requires a longer processing time, but can achieve comparable sensitivity,
depending on the culture method employed (Marlowe et al. 2011). The Table 2.06 shows
the advantages and disadvantages of culture and molecular methods for screening of
MRSA according to Marlow et al. (2011).
Table 2.06. Advantages and disadvantages of culture and molecular methods for
screening of MRSA.
Method Sensitivity Specificity (%)
Time to results (h)
Cost Technologist Skill Level
Culture
Molecular
Lowª
High
100
<100
18-48
<24
Low
High
Moderate
Moderate to high
ª Improved sensitivity with chromogenic agars and broth enrichment.
In the industrial field the rapid microbiological systems are grouped together in four
(4) principal platforms (Clontz 2009).

50
1. Methods based in the growth of microorganisms: This test measures
chemical reactions and physiological changes of the organism as a result of
microbial growth under specific conditions, where technicians can measure
such changes as electrical impedance / conductivity of the test solution,
biochemical reactions, or ATP bioluminesce.
2. Methods based on the artifact: This method involves the analysis of the
component of the microbial cell, including fatty acids. These methods include
gas chromatography, ELISA, and MALDI-TOF mass spectrophotometry
cellular components such as nucleic acids and proteins.
3. Methods based on nucleic acids: This method targets the amplification of
the DNA of microorganisms using PCR and the riboprinting technique. This
methodology was used to identify microorganisms and differentiate between
species and was useful for the identification of organisms involved in
contamination during the investigation process for non-compliance with the
quality control standard.
4. Methods based on viability: This methodology involves the use of viable
strains or biological bookmarks capable of detecting and of enumerating
microorganisms without the need to incubate them to increase their cellular
density. An example of this technology includes the fluorescent labeling
methods such as: fluorescent flow cytometry, immunofluorescence and
fluorescent coloring of nucleic acids used as viable labels.
The technique of real-time quantitative PCR, provides advantages for the detection
of indicator and objectionable organisms for the pharmaceutical industry. Of the four
platforms, the number three: “methods based on detection of nucleic acids” should be the
main approach utilized by the Pharmaceutical Industries (Clontz 2009).

51
The principal contribution of this investigation for the industries was through the
study of minimal trace detection of E. coli ATCC®8739™ and Aspergillus brasiliensis
ATCC®16404™ in pharmaceutical preparations using the Real-time PCR technique. Real-
time PCR can detect objectionable organisms with sensitivity, specificity, efficacy for the
characterization and rapid identification during the analyses of raw material, excipients,
environmental monitoring and finished product.
These four parameters can be defined as follows:
Sensitivity: indicates the minimum quantity of DNA required for the
amplification to be produced.
Specificity: obtains an amplified sole product, such as the detection of a
specific sequence for E. coli ATCC®8739™ y A. brasiliensis ATCC®16404™
strains.
Efficiency: achieves the maximum amplification in a determined number of
cycles validated.
The present study will help to set the bases for the development of written
procedures, protocols, and validations for the TSM, using the specific molecular
methodology of Real-time PCR. Through this investigation, another contribution will detail
a step-by-step protocol for microbiological molecular analyses applied directly to samples
of raw material and pharmaceutical OTC product. In terms of this point it important mention
that there was little or no literature regarding the application of Real-time PCR directed to
the test TSM in the pharmaceutical industry. The majority of the performed studies are
directed to the PCR methodology. Currently, in Puerto Rico, through an interview with
personnel, there are eight (8) industries that are using MicroSeq® molecular system. No
industry in the Island uses the methodology for microbiological analysis in
pharmaceuticals or biopharma.
52
The MicroSeq® method was directed to the genetic sequence of 16S at the
ribosomal level. Currently in Puerto Rico (in 2013) the UPR Medical Sciences Campus,
Forensic Sciences program and other Universities on the Island utilize Real-time PCR
(Personal communication: Ana Lliteras Field Application Specialist, Molecular Biology
Bioanalytical Instrument. 2013). The prevailing techniques used in most of the
pharmaceutical industries, and described in the compendium were conventional
techniques, with culture transfer methods, phenotypic observation of the colony, and
biochemical tests to obtain final identification (USP38-NF33 <61> 2015). These
conventional techniques consume a lot of time, are not specific, and, lack accuracy and
precision to demonstrate the entire content of the presence of viable organisms in a
sample (Jiménez 2011).
A Real-time PCR system to universally detect microbes at a limit of 10 to 50 CFU
within 5-6 hr was developed by Walzer et al. (2007). Their system was useful to replace
conventional microbial plating techniques for the analysis of microbial contamination in
liquids such as water. Advantages of using rapid systems include reducing the product
release cycle time, reducing raw material, decreasing simultaneous work-in-progress,
increasing finished product inventories, improving the quality of the microbial testing,
automating microbial testing, collecting electronic test data and information
creation,starting investigations earlier in response to the out of specifications (OOS)
results, potentially reducing risk of microbial product contamination, and refining the
manufacturing processes within the laboratory (Cundell 2006).
Table 2.07 breaks down the principal contributions of this investigation to the
established SOPs in the pharmaceutical industries and the principal benefits of adopting
this molecular technique.

53
Table 2.07. Contribution and benefits to SOPs.
Contribution to Established SOPs Benefits of the Technique
Addition of molecular methodology to established SOP. Add the analysis of TSM and bioburden under technique Real-time PCR.
The validation of Real-time PCR facilitates the securing of the results of rapid identification in a minimum of 30 min for contaminants, objectionable organisms, and pathogenic contaminants. Detected as the reaction was occurring.
Alternate or principal technique
As an alternate it suggests using identification of detected objectionable organisms and detection of contamination of lots on hold because they are in a process of investigation. Facilitates decision-making due to promptness in securing results.
Restructuring flow of analysis tests in the laboratory.
Real-time PCR facilitates a practical distribution in the execution of the analyses because it decreases work load. It diminishes the preparation of means, solutions, wash teams, sterilization cycles and personnel required by conventional method.
Decrease of test execution time. Releasing batches of products in less time. The execution of the test by Real-time PCR can take from 30 min with the StepOne™ Plus
equipment. Conventional methods require 2 days for bacterial growth and 7 days for fungi and yeasts, then organisms are characterized and identified after the incubation time.
Decrease time to analyses results
Accelerates speed of the analyses and/or its response. Real-time PCR is obtained in fewer than 50 min, whereas traditional methods takes 5 to 14 days.

54
The traditional technique for the identification of fungi and yeasts requires too
much time and effort, and requires analysts with experience in mycology, whereas the
Real-time qPCR involves only one step based on the sequence of the preserved DNA.
The Real-time qPCR has demonstrated, in clinical studies, the advantages of an effective
system, including effective, precise, and rapid analyses that traditional techniques of
culture and identification do not provide. While standard identification methods require a
mean of several days, the virtue of quick analysis, specific primers, and PCR protocol with
a S. aureus contamination of about 1-2 CFU mL¯¹ in pharmaceutical products were
identified to species level by Samadi et al. (2007).
The Real-time PCR technique contributes to the mandate of the GMPs to assure
that the final product was pure, safe, and effective, while providing a mechanism of
minimal detection at trace levels of the presence of any microbiological contamination.
Table 2.07., continued. Accuracy, sensitivity and speed of analysis
Facilitates rapid execution of assays. Precision was based on determining DNA concentration and the sensitivity to detect the presence in the sample. The traditional method determines growth in terms of CFU of the organism through pour-plate or filtration method.
Analysts' training with the technique (multi-faceted analysts)
Positively affects distribution of human resource The technique is not complicated and with adequate certification training, analysts can gain knowledge of events within in the termocycler during the analysis.
Decreased biomedical waste Decreased materials utilized and as such saving space on deposits of biological waste. Facilitates removal of biological waste Avoid media preparations, solutions and equipment used in traditional method was.

55
This technique helps safeguard the health and life of human beings and animals, and to
distribute medicines that expire with the quality standards required by regulatory agencies.
Currently, the microbiological tests performed in the pharmaceutical and
biopharmaceutical industries are divided into three principal categories, including (1)
detection that implies a qualitative aspect; (2) quantitative enumeration; and (3)
characterization and identification of the viable specified organisms (USP <61>, <62>
2015).
Traditionally the microbiological methods described in the compendium (USP
2015) are based on microbial growth. These require a lot of work and manipulation, in
addition to being time consuming. These types of tests need days of incubation,
obstructing and preventing management from taking proactive measures to correct
contamination caused by viable microorganisms that may represent an imminent risk to
the health of the consumer and contribute to nonperformance of the product.
Consequently, microbiological growth techniques limit operations, thus directly impacting
the sensitivity, accuracy and reproducibility of the test because it involves extended
manipulation during test execution. The conventional methodology, based on microbial
growth lacks flexibility and relies on colony counts which require mathematical models to
achieve the best interpretation of the results (Kai 2004).
Most RMM are inherently expensive and the justification of its introduction into a
system requires a thorough evaluation of the method itself. Table 2.08 present an example
of a generic and a practical approach to its measurement in a real laboratory world (Gandhi
2006).

56
Table 2.08. Generic and practical approach to microbial mesurements methods.
Input variables Output variables
Material cost (media, kits, reagents,
glassware, etc.) (Mc)
Number of samples processed
(Sn)
Labor cost (employee, training, etc.) (Lc) Number of samples released or
reported results . (Sp)
Fixed cost (instrument, lab space,
validation, maintenance, etc.) (Fc)
Number of samples re-tested
(Sr)
Number of materials (media, kits,
reagents, ect) (Mn)
Process time (St)
Number of man hours (preparation,
testing, cleaning and maintenance, etc.) (Hn)
Number of working hours (Hn)
According to Gandhi the technique for measuring the efficiency presented in his
study was broad and its application was not limited to RMM; rather, it can be applied to
laboratory instruments as well (2006). However, Table 2.09 presents the principal
contributions of this investigation in terms of saving time and money, compared to the
Real-time PCR technique. The costs were presented in terms of the decrease or
elimination of efforts during the achievement of the test. Table 2.10 presents the savings
in terms of materials, personnel, effort and time invested during the tests of the
conventional microbiology that describes the compendium of the USP versus the method
of Real-time PCR.

57
Table 2.09. Contribution in terms of cost for the pharmaceutical industry.
Contribution
Mechanism
Decrease in costs
From a conventional methodology of microbiology to the molecular Real-time PCR
System change from growth in Petri dish to micro tube.
Elimination of use of large quantities of Petri dishes and culture media.
From a system of huge handling to one of less intervention
Elimination of a continuous system of transfer to a Petri dish for one of the filling wells. Elimination of manipulation to then apply to automated systems.
Minimizing costs and time avoiding time repetition of samples or "resamples" from contamination during the manipulation of the sample. Savings in investigations when the test fails due to microbiological handling during sampling.
From a system limited by the type culture media and conditions of incubation to one that identifies any live or dead sample according to molecular protocol designed.
Elimination of the integrity factor from the media in terms of nutrients, water content, temperature of pouring technique and manipulation.
Time saving in the preparation of the medias and solutions. No need to wait for days of incubation.
From a system where wait times are days and weeks to obtain results to a system where results are obtained at the moment of the reaction.
Eliminates the incubation process and posterior testing. Results are obtained in 30 min to 1 hr.
Time saved in materials, better use of personnel. Results are obtained immediately, easing the decision making in OOS cases.
From a system based in numbering, detection in CFU, and characterization to a system that identifies the organisms genome base on DNA concentration.
Conventional system uses multiple equipment while Real-time PCR uses only one equipment.
Time savings and better distribution in the work flow in the lab.
From a system based in phenotypic characteristics and biochemical tests to a sensitive, accurate and DNA detection.
Conventional system uses selective and differential media. Molecular test detects genetic expression.
Money saving in early detection of minimal contamination, thus avoiding non-compliance with quality standards.

58
In contrast, Table 2.10 presents the costs per reaction based on the costs of the
reagents that were used in this investigation. This cost does not include miscellaneous
items such as micropipettes, micropipette tips, gloves, trays, or biosafety bag. The
intention of Table 2.10 is to provide an estimate of the investment in the reagents needed
for the execution of the test of TSM for the method of Real-time PCR.
Table 2.10. Costs of molecular reactives translated to costs per reaction.
Description Price Items (quantity
Total Cost per reaction
Molecular reagents and primers
Sufficient reactive to perform 200 reactions 3 reactions (triplicates) = 1 sample 66 Samples can be processed with this data the cost per sample would be approximately $6. This does not include energy, labor and miscellaneous.
TaqMan MGB Probe 6,000pmoles
$258.00 2 $516.00
Sequence Detection Primers Aspergillus niger, Escherichia coli
$30.00 4 $120.00
PrepMan® Ultra
Sample
$103.00 1 $103.00
TaqMan® Fast
Universal PCR Master Mix
$208.00 1 $208.00
Water Molecular Biology Grade, Ultrapure
$13.39 1 $14.00
Micro tubes 2mL $155.40 1 $156.00
TOTAL 10 $1,117.00
2.4. Advantages and Disadvantages of the Techniques Described in the
Pharmacopeia vs. Molecular Method
The methodology described in the pharmacopeia for the analysis of the
microbiological quality for non-sterile products comprises two general methodologies.
These are: (1) methods for the enumeration, which represents the quantitative aspect of
the analysis, and (2) methods of determination of specific organisms, qualitative aspect of
the test. In pharmacopeia these two methodologies are contained in Chapters <61> and

59
<62> of the USP38-NF33 (2015). The following was the description of the conventional
method used by the pharmaceutical industry, as described in the compendium of the
USP38-NF33. (2015).
2.4.1. USP38-NF 33 Chapter <61> Microbiological Examination of Non-sterile
Products:Test of Microbiological Enumeration
USP Chapter <61> details the tests for the quantitative estimate of bacteria and
mesophilic fungi present in various pharmaceutical articles, from raw material to the
finished product. These tests are mainly designed to verify that the test expires within the
specifications for microbial quality. The alternate methods such as automated methods
can be used instead of the tests established in the compendium whenever there was
evidence of the studies of qualification, and these demonstrate its equivalence (USP38-
NF33 <61>. 2015). The preparations of the samples can also be modified as needed,
whenever they are based on the obtained results of the qualification tests. Any
antimicrobial property present in the product has to be removed and neutralized before
the routine tests are performed. This chapter contains a guide for the procedures in
estimating of the total count of aerobic microorganisms (TAMC – Total Aerobics Microbial
Count) and the entire count combination of yeast and fungi (TYMC-Total Yeast Mold
Count).
2.4.1.1. Preparation of the Sample
According with the USP, the samples must be prepared using the method that fits
the type of product to be analyzed. The validation of the analysis method for the product
ensures that the preparation of the sample does not alter any microbiological component
present in the sample and that no antimicrobial or inhibitory property supports their growth
(USP38-NF33 <61>. 2015).
When the sample are prepared for TSM, all the steps in the analysis have to be
made using sterile materials and aseptic techniques. The USP provides the

60
recommendations to dissolve or to suspend the product to obtain a homogeneous mix in
the event the product shows insolubility characteristics. The preparation of the sample
involves dissolving or suspending 10mL or 10g from the specimen to be analyzed in a
sodium chloride peptone buffer with a pH value of 7.0 or a phosphate buffer of 7.2pH, or
broth of Soy Casein Digest Broth (SCDB).
The prepared dilution was usually 1:10mL. Chapter <61> provides the guide for
the preparation of the sample when the sample was insoluble in water; the product was in
aerosol and for transdermal patches.
2.4.1.2. Total Aerobic Microorganisms Count (TAMC)
The TAMC test for the estimation of aerobic mesophilic microorganisms for
bacteria, as well as for fungi, utilizes the culture media Soy Casein Digest (SCD). This test
was performed using aseptic techniques with Laminar Flow Hood (LFH) conditions or in a
Biological Safety Laminar Flow Hood cabinet to prevent contamination during the test. It
was applied to non-sterile samples, or from the raw material, finished product, and process
formulations. This analysis was performed using the following techniques, depending on
the type of product and the confirmation of suitability during the validation of the method:
(1) Membrane filtration
(2) Pour-plate method
(3) Spread-plate method
(4) MPN – most-probable-number method
Table 2.11 presents four methods used in the pharmaceutical industry to analyze
the raw material, finished product, and process formulations. It summarize the steps for
the process of the samples to the incubation process (USP <61>. 2015).

61
Table 2.11. Products examination techniques.
Technique Procedure
Filtration by membrane
Transfer an appropriate amount to two filters with membrane.
Immediately filter the sample. Rinse by flushing each membrane.
Transfer a membrane over the SCD agar surface for TAMC. Incubate at 30-35°C between 3 to 5 days.
Transfer a membrane over the SDA surface for TYMC. Incubate at 20-25ºC for 5 to 7 days.
Calculate the number of cfu per g or mL of product.
Pour plate
Transfer 1mL of the sample to two sterile Petri dishes, in duplicate for each medium.
Add 20mL of SCD agar to one of the plates that contains the sample.
Homogenize
Add 20mL of the SDA agar to another plate containing the sample.
Homogenize
Incubate at 30-35ºC 3 to 5 days for SCD.
Incubate at 20-25ºC 5 to 7 days for SDA.
Select the corresponding plate corresponding to a given dilution and that shows highest number of colonies less than 250 for TAMC and 50 for TYMC.
Take the average of the counts by means of culture and calculate the cfu number per g or per mL.
Surface-Spread
Transfer 1mL of the simple over the surface of the culture medium.
Perform duplicates per each culture medium.
Disperse in an even form.
Incubate at 30-35ºC 3 to 5 days for SCD.
Incubate at 20-25ºC 5 a 7 days for SDA.
Select the corresponding plates to a given dilution that it shows the highest number of less than 250CFU for TAMC and 50CFU for TYMC.
Take the average of the counts by means of the culture medium and calculate the number of CFU per g or mL.

62
Table 2.11. continued.
Most-Probable-Number
The results by this method are unreliable. These are obtained especially for mold counts.
Thus, it was kept for the TAMC enumeration in situations where there was no other available method (USP38-NF33 <61> 2015.
Table 2.11 Reflects the stipulated steps for each method according to USP38-NF33
Chapter <62> 2014.
2.4.1.3. USP Results Interpretation
TAMC was considered to be equal to the number of CFU found using SCDA agar.
If fungal colonies were detected in the media, these were counted as part of the
TAMC.
The total count of yeast and fungi (TYMC) was considered part of the number of
CFU using agar SDA.
If bacteria colonies were detected in the media, these were counted as part of the
TYMC.
When TYMC was expected to exceed the acceptance criteria due to bacteria
growth, use Sabouraud dextrose agar containing antibiotic.
If the count was performed through the MPN method, the resulting calculated value
was TAMC.
When an acceptance criteria for microbiological quality was recommended, it was
explained as follows
10¹ CFU: maximum aceptable count = 20 CFU
10² CFU: maximum aceptable count = 200 CFU
10³ CFU: maximum aceptable count = 2000 CFU

63
2.5. USP 38-NF33 Chapter <62> Microbiological Examination of Non-sterile
Product: Tests for Specified Microorganisms
USP38-NF33 Chapter <62> describes the test for the detection of specific
organisms. The test was designed primarily to determine when a substance or preparation
meets the established specifications of microbiological quality. This chapter presents
alternative microbiological methods, including automated methods which may be used
and will always be accepted as demonstrably equivalent to the stipulated method by
pharmacopoeia. It further notes specific selective media to be used for determining the
following target organisms: E. coli, Salmonella spp., P. aeruginosa, S. aureus, C. albicans
and Clostridia spp.
2.5.1. Product Analysis
Table 2.12 presents the specific organisms and the culture technique utilized for
each of the organisms using selected culture media. It also shows the parameters for the
results interpretation.

64
Table 2.12. Test for the Absence of Specified Microorganisms.
Organism Test/Culture Medium Results Interpretation
Escherichia coli
MacConkey broth – incubate at 42ºC 24-48 hr Subculture in MacConkey agar– incubate 30-35ºC 18- 72 hr
Growth-can indicate positive Confirm with its identification
Salmonella spp Rappaport Vassiliadis Salmonella enrichment Broth – incubate at 30-35ºC 18-24 hr Subculture in xylose Lysine deoxychocolate Agar – incubate at 30-35ºC 18-48 hr
Well-developed colonies, color red or without black center-can indicate positive Confirm its identification
Pseudomonas aeruginosa
Subculture in Centrimide agar– incubate at 30-35ºC 18-72 hr
Growth – can indicate positive Confirm its identification
Staphylococcus aureus
Subculture in Mannitol Salt agar – incubate at 30-35ºC 18-72 hr
Growth with White or yellow colonies with a yellow zone – can indicate positive Confirm its identification
Clostridia spp. Reinforced medium for Clostridia – incubate in anaerobic conditions at 30-35ºC 48 hr Subculture in Colombia agar - incubate under anaerobic conditions at 30-35ºC 48-72 hr
Growth of low bacillus under anaerobic conditions with or without spores with negative catalase can indicate positive. Confirm its identifiction
Candida albicans Saburoud dextrose agar – incubate at 30-35ºC 24-48 hr
Colonies are large, whitish , round and moist can indicate positive Confirm its identification

65
2.6. Advantages and Disadvantages of the Techniques Described by
USP38-NF33 <61>
The pharmaceutical industries for non-sterile products must ensure the decrease
in the microbiological load of final dosages of product, raw material, and process
formulation. The criteria of acceptance established for non-sterile product Chapter <1111>
(USP 2015) is based on the technique of counting the total number of aerobic
microorganisms (TMAC) and the combination of yeasts and fungi counts (TYMC) as the
USP38-NF33 (2015) establishes. These specifications change in accordance with the
presentation and use of the product. The rapidity and alternatives for the "screening" in
the microbiological analyses will depend on the technique used, the target organism, and
the economic factor, which can determine what methodology appears to be viable for
routine use in the pharmaceutical environment (van der Zee and Huis in’t Veld 1997).
Cundel (2006) suggested that the pharmaceutical industry justify microbial
identification programs, including, selection of rapid, easy, and effective methods for
species identification. This would successfully benefit investigations of failure products.
He also suggested evaluating methods used in microbiological laboratories with precise
methods, such as the methodology of molecular genetics for bacteria and fungi. Samadi
et al. (2007) agreed that conventional techniques comprise the use of selective means,
examination of microscopic colonies, and biochemical tests, but that the industry should
move to molecular techniques for the optimization of the laboratory analyses.
Counting methods in Petri dishes such as the technique of pour and spread-plate
technique following USP38 <61> are methods that lack flexibility to be useful during any
moment or situation. It was necessary to evaluate these skills and apply a mathematical
model to achieve a better interpretation of results (Kai 2004). This involves an increase
in the percent of errors because this technique involves a lot of manipulation, growth
factors, incubation, and interpretation using mathematical conversion, each which can

66
affect negatively the test results. These methods consume a lot of time during, previous
and post preparation, to obtain a final result. Molecular methodology provides much more
rapid and accurate identification and helps the understanding of the type of organisms in
the industry’s laboratory (Jiménez 2011). This makes the process more efficient because
it provides a rapid evaluation of the product and its process. Table 2.13 presents the
summary of the advantages and disadvantages of the techniques described in the USP38
<61>.

67
Table 2.13. Advantage and disadvantages of the techniques described in the USP38<61>.
Technique Advantage Disadvantage
Filtration per membrane
Easy to perform
There are less steps of preparation than other methods.
Membrane can break.
Possible loss of sample when rinsing membrane.
Difficult to count the colonies.
Colonies usually appear colorless
Method of platecount
pour plate
Surface spread plate
Requires mastery of skills in basic microbiological techniques for analysis execution.
It was the traditional approach currently microbiology curriculum in the academic area.
Currently the most widely used technique for TSM.
To perform the analysis various equipment are required.
Takes much preparation of sterilization of material and glassware.
Takes excessive preparation of culture medium and solutions.
Involves much manipulation before, during, and after the test.
Takes days and weeks to see results.
Requires post tests after incubation period.
For the identification and determination of other species that are not listed among the specific organisms, highly qualified personnel are required for its identification.
Most-Probable-Number (MPN)
Its interpretation is confusing.
Not frequently used.
It is not dependable.
The accuracy of the method is lower than the filtration technique or plate count.
No reliable results are obtained especially for mold count.
The MPN is reserved for counting TAMC in situations where no other method available (USP38 <61>).
The choice of method was based on factors such as the nature of the product and the
required microorganisms (USP38-NF33 <61>. 2015).

68
2.7. Applications Present and Future
In the Real-time qPCR method, the advantage was that the processes of
amplification and detection take place simultaneously in a closed microtube without the
need for later action (Livak and Schmittgen 2001). It combines the amplification of PCR
and detection in only one step, thus eliminating the need to detect the product of PCR in
an electrophoresis gel. The product increases exponentially with the number of cycles.
Using fluorescence for detection, measures the quantity of DNA synthesized at the time
the reaction happens. For this reason, it was referred to as Real-time because it was at
that time when synthesis occurs. This was possible because the fluorescence emission
was proportional to the quantity of DNA formed. Consequently, this allows detection and
registration of the kinetics of the amplification (Bustin et al. 2009). The Real-time PCR
equipment has a thermocycler to changes temperature, depending on the stage of the
process. The thermocyclers perform PCR during real-time by incorporating a fluorescent
reader designed to measure changes at any time and to emit fluorescence for each of the
wells where the amplification was performed. The Real-time PCR fluorescent detection
systems can be of two types; intercalating agents or specific probes marked with
fluorochromes, designed in a specific way.
The fluorescence detection system was by hydrolysis probe, which were marked
with two types of fluorochromes. One does the donor's function and other the acceptor.
This process was based on the fluorescent transference across the resonance (FRET)
between two molecules (Valasek 2005). The fluorescence detection most used are
hydrolysis probes, also called TaqMan probes, molecular beacon probes, and FRET
probes. The pilot phase of the Real-time PCR runs for this research used hydrolysis and,
TaqMan® probes. The hydrolysis probes were oligonucleotides marked with a donating
fluorochrome in the 5' end of the molecule that expresses fluorescence, having been lit
and an acceptor in the 3' that absorbs the fluorescence liberated by the donor, with the

69
donating molecules and acceptors located spatially close. The emission spectrum of the
first overlaps the absorption spectrum of the second. As long as the probe was intact, the
fluorescence emitted by the donor is absorbed by the acceptor. However, during the
amplification of target DNA, the probe hybridizes its complementary strand. When moving
along the chain during, synthesis, Thermus aquaticus DNA polymerase having 5'
exonuclease activity hydrolyzes the free 5' end of the probe, and thus causes release of
the donor fluorophore. Because the donor and acceptor were spatially far apart, the
fluorescence emitted from the first was collected by the reader (Kubista et al. 2006).
The Real-time qPCR comprises a thermocycler and fluorescence reader. These were
designed to perform the reading of the fluorescence emitted by each of the wells used at
any time of the reaction (Vinuza-Burgos 2009). In this research, the molecular runs were
performed using the StepOne™ Real-time PCR System from Applied Biosystem through
Bioanalytical Instrument. The differences between the devices lie in the rapidity of the
production capacity and results in the number of samples that can be processed
simultaneously and the number of channels that detect the emission of both
fluorochromes. Consequently, one can use several probes labeled with different
fluorophores, to identify different types of target DNA in the same reaction (multiplex PCR)
or internal controls to incorporate reaction to detect the presence of certain inhibitors
(Dorak 2006).
2.8. Advantages of the Real-time PCR
The advantages provided by the Real-time PCR methodology in this research were
directed towards two (2) areas: options presented by the equipment and advantages in
the technique.

70
2.8.1. Options of the Real-time PCR Equipment’s
The Real-time PCR equipment software equipment provides options, such as: (1)
amplifying and detecting the DNA or RNA in the sample, (2) performing multiple PCR runs,
(3) quantifying the target DNA or RNA sample, and (4) conducting analysis of dissociation
curves.
2.8.2. Advantages of the Real-time PCR Technique
The main advantage of the Real-time PCR equipment is its ability to rapidly monitor
the progress of the PCR reaction as it occurs in real time (Bustin 2009). This methodology
does not require any additional process for the detection of DNA or RNA. If the computer
is Light Cycler, it can complete the process ranging from 30 to 40 min, thus saving time
and allowing a greater flow of samples and test runs. Its ability to precisely measure the
amount of amplicons (DNA fragments) at each cycle, allows highly accurate quantification
of the amount of starting materials in samples. Another advantage is that when testing in
closed systems, the risk of contamination is minimized. Amplification and detection occurs
in a single tube, eliminating post PCR manipulations. The Real-time PCR quantifies the
initial concentration of DNA present in the samples by being more practical, easy, and
accurate than conventional methods. Real-time PCR equipment has a high capacity to
perform multiple qualitative, quantitative determinations of mutations, and PCR tests,
among others using the same equipment. However, under conventional methodologies,
many types of equipment are required to perform the test (Valasek 2005).
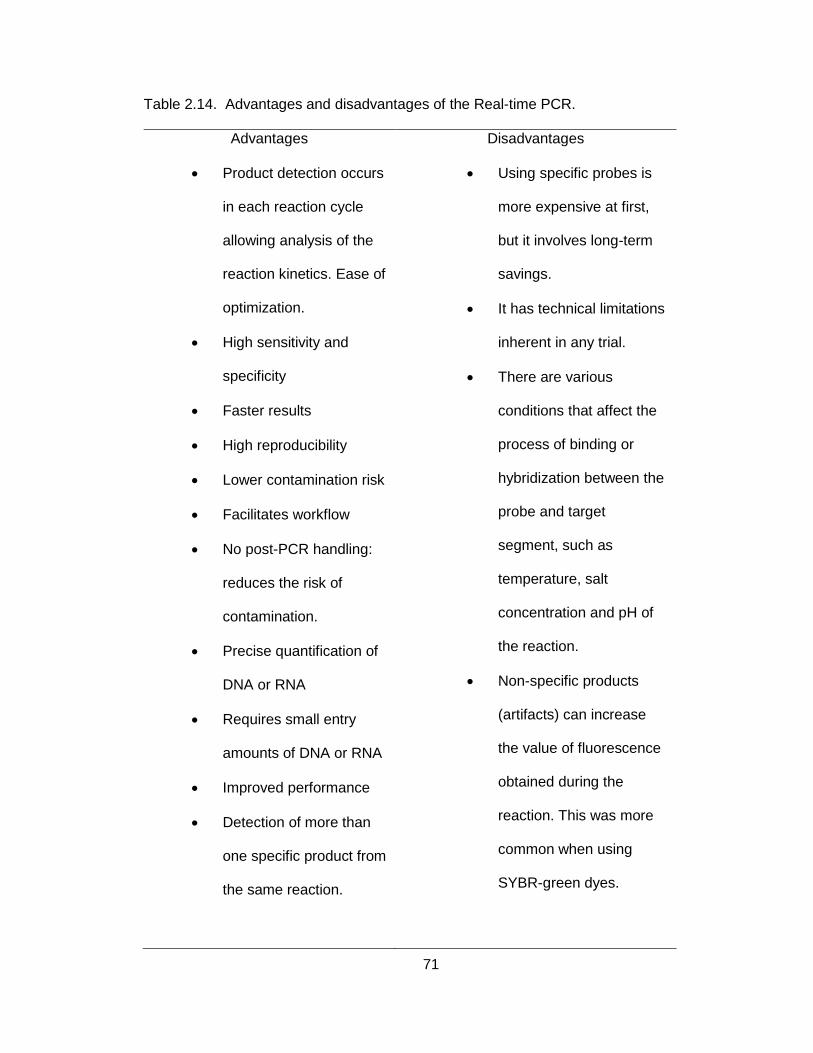
71
Table 2.14. Advantages and disadvantages of the Real-time PCR.
Advantages
Disadvantages
Product detection occurs
in each reaction cycle
allowing analysis of the
reaction kinetics. Ease of
optimization.
High sensitivity and
specificity
Faster results
High reproducibility
Lower contamination risk
Facilitates workflow
No post-PCR handling:
reduces the risk of
contamination.
Precise quantification of
DNA or RNA
Requires small entry
amounts of DNA or RNA
Improved performance
Detection of more than
one specific product from
the same reaction.
Using specific probes is
more expensive at first,
but it involves long-term
savings.
It has technical limitations
inherent in any trial.
There are various
conditions that affect the
process of binding or
hybridization between the
probe and target
segment, such as
temperature, salt
concentration and pH of
the reaction.
Non-specific products
(artifacts) can increase
the value of fluorescence
obtained during the
reaction. This was more
common when using
SYBR-green dyes.

72
Table 2.14. continued
Minimizes experimental
variations.
Cost effective
Decreases biological
waste.
Probe should be designed
differently for each target
to study.
Specific probes are more
expensive.
2.9. Real-time PCR Comparison versus Microbiological Methods
The advantages and disadvantages of the Real-time PCR method versus the
traditional microbiological method have been evaluated from the technical, economic (in
terms of time/cost) and the regulatory aspects. Microbiological analysis methods usually
fall into three broad categories, Including molecular biology, biochemistry, and
microbiology. Molecular methods in general cover a broad range of techniques based on
DNA analysis and discrimination of the microorganism. This technique eliminates the time
required to grow and the intervals associated with the growth and development of the
culture.
Conventional microbiological methods are those that have more variety and are
less useful for characterizing consortium of communities (Spiegelman et al. 2005). Such
methods are based on the traditional tools of cell count, use of selective media, and
microscopic examination to provide the general characteristics of a community of
microorganisms as a whole. Many of microbiological tests reflect fast and inexpensive
procedures to create a profile of the organism under study. Conventional microbiological
methods are useful in making a screening of the organism (de Boer and Beumer 1999).

73
Table 2.15 presents a summary of the advantages and disadvantages of
conventional microbiology methods.
Table 2.15. Advantages and disadvantages of conventional microbiology methods.
Advantages Disadvantages
Uses basic
microbiology
skills
Phenotypic properties (biochemical, carbon sources) can be
variable, subjective, and dependent on the growth parameters and
body health.
Method most
used
The cellular fatty acid profile changes with temperature, age of the
culture, and growth medium.
Some identification systems require subjective tests as gram
staining, oxidase, and coagulase before the final determination or
determination of the appropriate card or miniaturized system.
Generates large amounts of biological waste.
2.10. Taxonomic Change of Aspergillus niger to Aspergillus brasiliensis
2.10.1. Morphologic Characteristics of Genus Aspergillus
The mitosporic genus Aspergillus was characterized by production of specialized
hyphae called conidiophores located on the conidiogenous cells which generate
asexualspores or conidia (Figure 2.03) (Abarca 2000).

74
Figure 2.03. Morphological structures of the genus Aspergillus. A-B: conidiophores,C-D:
conidial heads. (Retrieved from Abarca 2000).
The name A. brasiliensis refers to the locality where the culture was originally
isolated. Colony diameters at 7 days: Czapeck Yeast Agar (CYA) at 25⁰ and 37⁰C, and
Czapek Yeast Autolysate with 5% NaCl (CYAS) at 25C: 71–76 mm; Malt Extract Agar
(MEA) 52–70 mm; Yeast Extract Agar (YES) 75–80 mm; Oatmeal Agar (OA) 32–36 mm;
Creatine Agar (CREA) 32–44 mm, poor growth, strong acid production. Colony first growth
white then dark brown to black (Fig. 2.01). Exudates absent, reverse cream-colored to
light brown color. Conidial heads usually globose at first and later radiate, occasionally
developing into several conidial columns; stipes 700–170068 – x13 μm, walls thick,
smooth, pale brown; vesicles 30–45 μm wide, almost globose; biseriate; with metulae
covering virtually the entire surface of the vesicle, measuring 22–3063–6 μm; phialides
flask-shaped, 7–963–4 μm; conidia are subglobose, 3.5–4.8 μm in diameter, and

75
echinulate, with no sclerotia observed in the culture extype. All isolates produced several
naphtho-c-pyrones (including aurasperone B), tensidol A and B and pyrophen (Vargas et
al. 2007).
Figure 2.04. Aspergillus brasiliensis sp. nov. CBS 101740T. (a) Colonies on CYA; (b)
colonies on OA; (c) colonies on MEA; (d–g)conidiophores; (h) conidia under light
microscope; (i) conidia as seen using SEM. Bars, 10 mm (d–h) and 5 mm (i). (Adapted
from Vargas et al. 2007).

76
Figure 2.05. Colony morphologies of type strains of species assigned to Aspergillus
section nigri grown on CYA and MEA plates at 25 °C for 7 d. (A–B) A. aculeatinus, (C–D)
A. aculeatus, (E–F) A. brasiliensis, (G–H) A. carbonarius, (I–J) A. costaricaensis, (K–L) A.
ellipticus, (M–N) A. foetidus, (O–P) A. japonicus, (Q–R) A. heteromorphus, (S–T) A.
homomorphus, (U–V) A. ibericus, and (W–X) A. lacticoffeatus. (Adapted from Samson RA,
Noonim P, Meijer M, Houbraken J, Frisvad JC and Varga J. 2007).

77
2.10.2. Aspergillus: Importance in Industry, Agriculture and Medicine
Different Aspergillus spp. are abundantly distributed in nature. The genus
Aspergillus consists of a large number of species, including several opportunistic
pathogens (e.g. A. fumigatus, A. terreus), toxin producers (e.g. A. flavus, A. parasiticus)
and industrial species (A. niger, A. aculeatus, A. oryzae). The genus was separated into
several sections, such as the yellow and the black aspergilli. The black aspergilli
(Aspergillus section nigri) are cosmopolitan, and contain species commonly found in
industrial contamination (Meijer et al. 2011). These can be isolated from a variety of
substrates. The simple dispersion of conidia and their small size, facilitates suspension
in air for extended periods. Because of this, humans are frequently exposed to this mold
by inhalation.
Different Aspergillus spp. are the most common cause of invasive fungal
infections. These frequently turn out to be fatal in immunocompromised patients (Fridkin
and Jarvis 1996; Trick and Jarvis 1998). Although Aspergillus fumigatus was the most
common etiologic agent in this type of fungal infection, other species of the genus such
as A. flavus, A. terreus, A. niger, and A. nidulans (Emericella nidulans) are also considered
responsible for invasive infections (Abarca 2000). In addition to its role as an opportunistic
pathogen, this genus is important because it is an organism used in fermentation
processes for the production of citric acid. This genus contains several species of positive
or negative economic importance in industries, such as agriculture and medicine. Most
aspergilli, including species of economic importance, reproduced only by asexual spores.
Recently, genome projects have been completed for the following Aspergillus species: A.
fumigatus, A. nidulans, A. niger and A. oryzae. Several other species are also being
sequenced. Information from these genome projects will continue to be useful in
interpreting aspects of the evolution of sexuality, phylogeny, and the extent of secondary
metabolite diversity (Bennett 2009). The black aspergilli are an important group of species

78
in food mycology, medical mycology and biotechnology (Gams et al. 1985). Many species
cause food spoilage. Others are used in the fermentation industry to produce amylases or
lipases, which are hydrolytic enzymes and citric acid and gluconic acid, which are organic
acids (Jurjević et al. 2000). They are also candidates for genetic manipulation in the
biotechnology industries. Aspergillus niger used under certain industrial conditions has
been granted the status, :“generally recognized as safe” (GRAS), by the Food and Drug
Administration of the US government (Vargas et al. 2007).
Aspergillus can be detrimental in two ways: (1) directly as an opportunistic
pathogen causing aspergillosis, and (2) indirectly due to aflatoxin production generated in
food products that can lead to aflatoxicosis.
2.10.3. Taxonomy: Approaches to Distinguish A. niger from A. brasiliensis
The taxonomy of fungal species, similar to many other microorganisms, suffers
frequent revisions due to the discovery of new species and to the development and
gathering of characterization data and morphological information. The morpho-taxonomy
helps in the identification of many species. The macro and micro-morphological, including
spectral mass analyses for the phenotypic characterization of 13 Aspergillus section Nigri,
characterization of conidia (spores) is done with an scanning electron microscopy. It was
useful to discriminate the key morphological characteristics of the conidia and to separate
closely related fungi (Simões et al. 2013). A variety of methods have been proposed by
the literature to detect fungi in minimal concentrations in early stages of the laboratory
analysis.
These molecular methods include PCR, and/or a combination thereof, with certain
techniques which are useful at detecting Aspergillus. Methods such as RSIC, C-probe and
probe with pyro sequencing or investment DirectSS/dsDNA detection have been used to
identify both pathogenic bacteria and fungi. This would help develop an older standard for
the detection of Aspergillus spp. (Abdin et al. 2010). Invasive aspergillosis was a major

79
cause of morbidity and mortality in immunocompromised and critically ill patients.
Standard culture methods for the diagnosis of Aspergillus infections have limited
sensitivity and specificity and are time consuming. The recent availability of novel
molecular based diagnostic techniques offers the potential of rapid, sensitive and specific
pathogen detection (Faber et al. 2009). With the increasing incidence and mortality of
fungal infection, the requirements for strict diagnostic approaches was now an urgent
issue.
Traditional screening techniques, such as cultivation, provide a poor input of
diagnosis (Faber et al. 2009). Therefore, expectations are set that molecular biologically
techniques have the potential to develop a diagnostic approach in the pathogenicity of the
fungus (Li et al. 2004). The definite and rapid diagnosis of invasive aspergilosis is
necessary because of the high mortality caused. The real-time PCR assay provides a high
sensitivity and specificity for detection of fungal DNA and rapidly identifies most of clinically
relevant Aspergillus species (Ramírez et al. 2009).
2.10.4. Reclassification of Strains ATCC® 16404™ from Aspergillus niger to
Aspergillus brasiliensis
Since 1965 the taxonomy of the Aspergillus spp. has been mainly governed by
description by Raper and Fennell (1965). There have been major changes in the taxonomy
of Aspergillus species including their telemorph states (Abarca 2000; Geiser et al. 2007).
Black aspergilli was one of the most difficult groups concerning its classification and
identification. New molecular approaches have shown that there was a high biodiversity,
but that species are occasionally difficult to recognize based solely on their phenotypic
characters (Samson et al. 2007). During a study of the genetic relationships among black
aspergilli collected worldwide, four isolates have been identified which did not fit into any
of the currently accepted 19 species of Aspergillus section Nigri (Samson et al. 2007;
Noonim et al. 2008, Perrone et al. 2008). Any proposed new species should show

80
evidence for evolutionary divergence from other taxa, particularly unique DNA characters
at multiple loci. The polyphasic approach was suggested as the ‘gold standard’ for species
delimitation using a combination of multilocus sequence data, combining morphological
physiological characteristics with ecological data (Samson et al. 2009).
The ATCC®16404™ strain, known as A. niger, has been designated as a reference
strain for quality control in a number of fungal reference strains widely used in clinical
applications and for industrial testing. These fungal isolates are cited in a number of official
methods (eg, Harmonized Microbial Limits USP <61> and Sterility Tests) and manuals, as
well as the Code of Federal Regulations. The taxonomic and phylogenetic report clear
placement of these two black aspergilli strains, ATCC® 9642™ and ATCC ®16404™, as A.
brasiliensis, were with previously classified as A. niger (Houseknecht et al. 2008).
Furthermore, the ATCC® 9642™, deposited as Aspergillus niger, also being renamed as
A. brasiliensis. Sequence alignment has revealed that all lots of 9642 and 16404 are
identical, but 16888 differ from 9642 and 16404 in five positions (Table 2.16).
Table 2.16. The difference in ITS sequences.
Position* 140 166 172 173 384
Aspergillus niger type strain ATCC® 16888™ A T A A Deleted
ATCC® 16404™ C C T T T
ATCC®9642™ C C T T T
Aspergillus brasiliensis type strain IMI 381727 C C T T Deleted
Note: * The first C in the border sequence (TTACCG) of 18S and ITS1 was here defined as position 1.
Table 2.14 indicates that there was approximately 1.0% difference base pair-wise
within the ITS region between the Aspergillus niger type strain and the other two black
aspergilli ATCC®16404™ and ATCC®9642™. Differences of this magnitude typically

81
raise the question whether ATCC®16404™ and ATCC®9642™ can be adequately
considered as A. niger (Houseknecht et al. 2008).
These results demonstrated that ATCC®16404™ and 9642™ are distinct from A.
niger ATCC®16888™ and form a separate clade with A. brasiliensis strain IMI381727
(Figure 2). Therefore, the commonly used fungal barcoding sequences indicate that
ATCC®16404™ and 9642™ are A. brasiliensis, not A. niger, indicating substantial
differences, genotypically and phenotypically, between the type strain of A. niger
(ATCC®16888™) and the other two widely used fungal reference strains, ATCC®9642™
and 16404™.
Figure 2.06. A Neighbor Joining Tree of Black Aspergilli based on Their ITS DNA
Sequences. (Adapted from: Houseknecht et al. 2008).
These results demonstrated that ATCC®16404™ and 9642™ are distinct from A.
niger ATCC®16888™ and form a separate clade with A. brasiliensis strain IMI381727
(Figure 2.06). Therefore, the commonly used fungal barcoding sequences indicate that

82
ATCC®16404™ and 9642™ are A. brasiliensis, not A. niger (Houseknecht et al. 2008). The
sequence data for A. brasiliensis ATCC®16404™ was 18S ribosomal RNA gene, partial
sequence; internal transcribed spacer 1), 5.8S ribosomal RNA gene, and ITS 2, complete
sequence; and 28S ribosomal RNA gene, partial sequence (Figure 2.07).
Aspergillus brasiliensis ATCC®16404™ 18S partial gene sequence
TGATATGCTTAAGTTCAGCGGGTATCCCTACCTGATCCGAGGTCAACCTGGAAAG
AATGGTTGGAAAACGTCGGCAGGCGCCGGCCAATCCTACAGAGCATGTGACAAA
GCCCCATACGCTCGAGGATCGGACGCGGTGCCGCCGCTGCCTTTCGGGCCCGTC
CCCCCGGAGAGAGGGGACGGCGACCCAACACACAAGCCGGGCTTGAGGGCAGC
AATGACGCTCGGACAGGCATGCCCCCCGGAATACCAGGGGGCGCAATGTGCGTT
CAAAGACTCGATGATTCACTGAATTCTGCAATTCACATTAGTTATCGCATTTCGCTG
CGTTCTTCATCGATGCCGGAACCAAGAGATCCATTGTTGAAAGTTTTAACTGATTG
CAAACAATCGACTCAGACTGCACGCTTTCAGACAGGGTTCGTGTTGGGGTCTCCG
GCGGGCACGGGCCCGGGGGGCAGAGGCGCCCCCCCGGCGGCCGACAAGCGGC
GGGCCCGCCGAAGCAACAGGGTACAATAGACACGGATGGGAGGTTGGGCCCAAA
GGACCCGCACTCGGTAATGATCCTTCCGCA
Figure 2.07. The sequence data for A. brasiliensis ATCC®16404™ was 18S ribosomal
RNA gene, partial sequence.
The pharmacopoeia list a number of microorganisms to be used in the compendia
of microbiological tests for confirming the growth-promoting, indicative, and inhibitory
properties of the media and demonstrating the suitability of the test for a specific test
article. Major national culture collections are specified as the sources for these test strains

83
based on their history of deposition and maintenance and use in the compendia tests.
Using these microorganisms, it has long been assumed that these strains are
interchangeable and that sourcing the strains from different culture collections has no
impact on the result of the media quality control and method qualification tests (Cundell et
al. 2010). The black aspergilli are one of the more difficult groups concerning classification
and identification, and several taxonomic schemes have been proposed. New molecular
approaches have shown that there was a high biodiversity, but that species are
occasionally difficult to recognize based solely on their phenotypic characters (Samson et
al. 2007). For species descriptions it was recommended to examine several gene
sequences (e.g., ITS, calmodulin, β-tubulin, and actin) and submit them to recognized
sequence databases (Samson et al. 2009).
Significant advances have been made to identify clinically important molds.
Although molds have historically been identified using observations of colonial and
microscopic morphology, this time-consuming procedure requires expertise and can be
problematics for determining species identification. But especially in the case of the
management of high-risk patients, DNA-based identification are increasingly employed in
clinical laboratories. Methods such as the GenProbe® assay, are based on the polymerase
chain reaction such as single-step PCR, RAPD-PCR, rep-PCR, nested PCR, PCR-RFLP,
PCR-EIA, and microarray-based, Luminex technology-based, and Real-time PCR-based
methods. Because of the complexity and variation of target organisms, many methods are
slowly being validated. However, DNA sequencing chemistry using comparative DNA
sequence analysis was an attractive tool for fungal identification. This methodology can
be developed within the laboratory or purchased commercially. These methods can be
useful, but depend largely in the reliability and breadth of databases used for comparison
(Balajee et al. 2007). Molecular biological techniques can be used to investigate the
biological properties and mechanisms of pathogenic fungal infections and antifungal

84
studies (Li et al. 2004). The Real-time PCR assay provides a high sensitivity and
specificity for detection of fungal DNA and rapidly identifies most of clinically relevant
Aspergillus species (Ramírez et al. 2009).

85
Chapter Three
Materials and Methods
This research study focused on testing for microbiological examination OTC
pharmaceutical products in oral and ectopic areas. Two different methodologies for test
specified microorganisms (TSM) were compared. Microbiological conventional pour- plate
methodology established by the USP38 with molecular Real-time PCR method was
applied. The comparison between the two methods was based on the detection in terms
of sensitivity and high specificity in the presence and absence of specific organisms in a
pharmaceutical sample. The organisms used as contaminants to pharmaceutical samples
were the strains of Escherichia coli ATCC®8739™ and Aspergillus brasiliensis
ATCC®16404™. The samples analyzed were composed of three raw materials and three
OTC pharmaceuticals products. This study focused on demonstrating the capacity of each
method to demonstrate the minimum detection in the presence of contamination to levels
of traces of the organisms.
The test was carried out under controlled conditions using aseptic techniques,
laminar flow hood (LFH), use of sterile materials, equipment sanitation, and environmental
monitoring during the test and control group in each experimental run. All analyzes were
performed on a LFH to prevent microbial contamination. Environmental monitoring was
performed with exposure of plates containing culture media SCDA and SDA during
handling and testing. Precautions were taken to avoid contamination using a control group
during the test to prove that microorganisms were revealed in the tests were not affected.
3.1. Microbiological Analysis
3.1.1. Identification Method
Pour-plate technique was used as enumeration method on plate count (TEM).
Thepetri dish used as exposure plate technique, and for the test (TSM) was 100 x 20mm.

86
The conventional method of selection was based on the factors of the nature of the
product, analyzed raw material required, and the acceptance limits of microorganisms
(USP 2015).
Pharmaceutical products used for analysis were finished products representations
of OTC tablet, liquid, and cream. The raw materials analyzed were: Corn Starch, Sodium
Chloride and Sucrose.
3.1.2. Negative Control
To verify the testing condition, a negative control was performed using the chosen
diluent phosphate buffer solution in place of the tested article. There must be no growth.
3.1.3. Growth Promotion Test
A growth promotion test for each culture medium batch and buffer solution used in
the research was conducted. With this test, the ability of the media and solutions used to
grow and regain the inoculated organisms was demonstrated. The batch used Soy Casein
Digest Agar (SCDA), Soy Casein Digest Broth (SCDB), and phosphate buffer solution that
were inoculated with NTM (not more than) 100 CFU of E. coli strain ATCC®8739™ and
incubated at 30-35°C for three days. The batch of Saboraud Dextrose Agar (SDA),
Saboraud Dextrose Broth (SDB), and Phosphate Buffer Solution were inoculated with
NMT 100 CFU of A. brasiliensis strain ATCC®16404™ and incubated 20-25°C for 5 days.
At the end of the incubation time for each organism, plate count was taken, and the results
were scored. The results of growth on the plates according to USP <62> did not differ from
the original inoculum. Solid growth medium results obtained did not differ by a factor
greater than 2 from the calculated value for standardized inoculum.
3.1.4. Suitability of the Counting Method in the Presence of Product
A total of 10g or 10mL of each finished product and raw material were individually
dissolved and transferred to 90mL of phosphate buffer solution at pH 7.2. Triplicate

87
samples were used in duplicate for the three OTC products and the three raw materials.
Each tube containing the finished product and raw materials was contaminated with 1mL
of not more than 100 CFU E. coli and A. brasiliensis respectively. The E. coli-contaminated
tubes were incubated at 30-35°C for three days. The tubes contaminated with A.
brasiliensis were incubated at 20-25°C for five days. Once the incubation time for each
organism was completed, the tubes were transferred to a Petri plate using the pour-plate
method and counting plate method. This was done in triplicate for each OTC and raw
material for each organism studied. The OTC pharmaceutical products and raw aterials
used in this research fell into the classification of water soluble products.
3.1.5. Specified Microorganisms
The specific organisms used were the strains of E. coli ATCC®8739™ and A.
brasiliensis ATCC®16404™ for the quantitative enumeration as a representation of
mesophilic bacterial and fungal growth under aerobic conditions. The experimental phase
was conducted concurrently using the USP pour-plate conventional methodology and
Real-time PCR Step One Plus™ System from Applied Biosystems® as a molecular
method.
3.1.6. Preparation of Test Strains
The viable microorganisms used for inoculation were not more than five transfers
or passages removed from original master seed-lot (USP38 2015). The microorganisms’
test-strain growth was prepared with a suspended colony sample of each organism in
enriched culture medium SCDB for E. coli and SDB for A. brasiliensis. The test strain for
A. brasiliensis was incubated separately on SDB at 20-25ºC for 3 days. Once developed,
both inoculum mother culture vigorous vortexes were applied to each test tube containing
their corresponding mother inoculum. A quantity of 1mL of E. coli mother inoculum was
transferred to each of two duplicate test tubes, each containing 9 mL of phosphate buffer

88
solution at pH 7.2 and incubated for 24 hr at 30-35°C. Then A. brasiliensis was transferred
to 1 mL of inoculum mother to two test tubes (duplicate) each containing 9 ml of phosphate
buffer solution at pH 7.2 with 0.05% polysorbate 80 and incubated for 24 hr at 20-25°C.
These inoculums in the study represent the 10º dilution.
3.1.7. Inoculum Preparation - Determination of the Population Known to
Contaminate Pharmaceutical Sample
From the original inoculum of 100 E. coli and A. brasiliensis, a dilution 1:10 was
performed with a total of 15 test tubes. The 15 tubes comprised from 10-¹ to 10-15 for each
organism with each tube containing 9 mL of sterile phosphate buffer was placed in a rack
for E. coli and A. brasiliensis. An additional tube was labeled as negative control, only
containing 9 mL of phosphate buffer solution at pH7.2. The 100 seed inoculum containing
E. coli ATCC®8739™ was vigorously vortexed. Using a sterile pipette, 1 mL of the inoculum
was removed from tube 100 and transferred to a test tube labeled 10-¹ mL. The used
pipette was discarded. The dilution of 10¯¹ was vortexed and immediately processed. With
another sterile pipette, 1 mL of tube 10-¹ was transferred to tube 10-2. The used pipette
was discarded and transferred for serial dilution; this procedure was continued until tube
10-¹5 mL. The same process was followed in serial dilution for A. brasiliensis
ATCC®16404™.
After the serial dilution series of each organism, a plate-count was performed.
Fifteen sterile Petri dishes were labeled from 10ˉ¹ to 10ˉ15 in triplicate for each dilution. An
additional sterile Petri dish was labeled as a negative control in triplicate. The negative
control contained only culture medium. The tube labeled 10-1 was thoroughly vortexed, 1
mL solution containing E. coli extracted, and transferred to a sterile dish labeled 10-1. The
pour-plate method was immediately performed. A total of 20 mL of the culture medium
plates were added, each containing SCDA for E. coli and for A. brasiliensis dishes

89
containing SDA. A circular motion was applied to homogenize the 1 mL that was added to
the culture medium. The 15 steps to triplicate tubes in both E. coli to A. brasiliensis were
repeated. The pour-plate method was also performed in triplicate for the negative control
and inoculum 100 of each specific organism. Escherichia coli triplicates were incubated at
30-35°C for 3 days. A. brasiliensis triplicates were incubated at 20-25°C for 5 days.
Reading of the count of E. coli colonies for 24 and 48 hr and for A. brasiliensis at 24, 48
and 96 hr were performed. Known populations were chosen for each organism ranging
from 10 to 100 CFU/plate.
3.1.8. Preparation of the Pharmaceutical Sample
The method that was used for the preparation of the sample depended on the
physical characteristics of the type of product that was analyzed for the test for specified
organism (TSM test). Selected samples of raw materials (corn starch, sodium chloride
and sucrose) and finished oral product types (tablets, liquid, and cream) of were each
diluted into duplicate bottles containing 90 mL of phosphate buffer solution for each
labeled material, and performed in triplicate for each objectionable organism. For each E.
coli 10-⁷ bottle another, bottle was labeled as 10-15. The bottle 10-⁷ represented the dilution
chosen in E. coli representing the population from which the sample was contaminated.
The bottle labeled as 10-15 represented the last tube in the serial dilution process,
specificity analysis method. With 10-15 dilution for each specific organism, the sensitivity
of each method was shown for detecting the minimum level of the presence of traces of
the specific organism (E. coli ATCC®8739™ and A. brasiliensis ATCC®16404™)
concentration in a pharmaceutical sample.
For A. brasiliensis, two bottles containing 90 mL of phosphate buffer solution were
also labeled in triplicate for three OTC (over the counter) and three raw materials. A bottle
was labeled as 10¯³ and another bottle as 10¯15. The 10¯³ dilution bottle was chosen for A.

90
brasiliensis as the known population that OTC samples (tablets, liquid and cream) and
samples from contaminated raw materials (corn starch, sodium chloride, and sucrose).
The bottle labeled 10-15 represented the last series of dilutions during the sensitivity test
of the pour-plate method analysis and Real-time PCR. With the 10-15 dilution containing
the objectionable organisms, the sensitivity of each method was demonstrated for each
method to detect minimum levels contaminant traces (E. coli and A. brasiliensis) in each
sample analyzed for raw materials and pharmaceutical products.
Table 3.01. Selected dilutions for test for specified microorganisms (TSM).
Organisms Selected dilution known Population
Last dilution
Escherichia coli ATCC®8739™ 10-⁷ 10-15
Aspergillus brasiliensis ATCC®16404™ 10-³ 10-15
Table 3.01 shows the selected dilutions per objectionable organism to contaminate the
samples of the final product and raw materials.
During the preparation of the pharmaceutical sample, a sterile mortar was used to
pulverize, dissolve, and homogenize tablets into 90 mL phosphate buffer solution with a
7.2 pH. Ten grams or milliliters of the pharmaceuticals samples (solid, liquid and cream)
were added to 90mL phosphate buffer solution. The content was mixed using a analog
vortex mixer for homogenization of the solution. Once reached the solubility in the buffer
solution containing 10% w / v of the product, we artificially contaminated each sample of
raw materials and OTC product with E. coli (ATCC®8739™) and A. brasiliensis
(ATCC®16404™), respectively.
Escherichia coli was added to each bottle labeled 10ˉ⁷ 1 mL of the population
known as 10¯⁷ of E. coli and in the bottles labeled 10¯15 1mL of the dilution of the organism

91
corresponding to tube 15 for the test for specified organisms phase. The same was done
for A. brasiliensis. To the bottles labeled as 10¯³ runs of A. brasiliensis 1 mL of the
population known organism 10-³ and 10-15 labeled bottles was added 1 mL of the dilution
of the organisms belonging to the tube 15 of the stage specified organisms test of the
method. All runs were performed in triplicate. This made a total of three pharmaceutical
known populations contaminated by dilution tube 15 in triplicates. This does 2 bottles of
90 mL phosphate buffer solution containing 10g or mL of product + 1 mL contaminant in
triplicate to equal a total of 18 bottles per run with E. coli or A. brasiliensis per TSM test
for pharmaceutical product. There were also a total of 18 bottles of specific organisms
TSM run phase for raw materials. Table 3.02, shows the samples made by the described
organism.
Table 3.02. Amount of samples per objectionable organism.
Organisms Known population Dilution 10-15
Escherichia coli
ATCC®8739™
Known population 10-⁷
Tablet
Bottle 1
Bottle 2
Bottle 3
Liquid
Bottle 1
Bottle 2
Bottle 3
Cream
Bottle 1
Bottle 2
Bottle 3
Tablet
Bottle 1
Bottle 2
Bottle 3
Líquid
Bottle 1
Bottle 2
Bottle 3
Cream
Bottle 1
Bottle 2
Bottle 3
Aspergillus
brasiliensis
ATCC®16404™
Known population 10-³
Bottle 1
Bottle 2
Bottle 3
Bottle 1
Bottle 2
Bottle 3
Bottle 1
Bottle 2
Bottle 3
Bottle 1
Bottle 2
Bottle 3
Bottle 1
Bottle 2
Bottle 3
Bottle 1
Bottle 2
Bottle 3
Table 3.02 describes the contaminated samples for the TSM test according to
theobjectabionable organisms. These samples containing product which were artificially

92
inoculated with the organisms were incubated for 24 hr at 30-35ºC for bacteria and 20-
25ºC for fungi for 5-7 days.
3.1.9. TBC and TYMC Test: Plate Method
A quantity of 1.0 mL of the dilution of the product artificially contaminated with E.
coli and A. niger were individually transferred to each sterile Petri dish. An additional batch
was utilized without sample for negative control. The pour-plate method 20 mL of SCDA
for E. coli and SDA for A. brasiliensis (a warmer temperature to 45°C) was added to every
two Petri dishes. The plates were covered, performing a rotary movement to homogenize
the way with the inoculum, allowing it to harden at room temperature. As soon as the
media solidified, plates were inverted and incubated at 30-35°C for 3 days for bacteria,
and 20-25°C for 5-7 days of fungi. Continued to the period of incubation, the colonies of
every pour-plate method were counted, and the number of CFU was calculated for g or
mL of product. Colonies obtained in plates to confirm the identification of E. coli and A.
brasiliensis strains were identified.
3.1.10. Identification of the Preparation of the Inoculum
After the period of incubation, the broth of enriched SCDB containing E. coli was
streaked on MacConkey agar (MCA) and Eosine Methylene Blue (EMB). All these
selective media were incubated to 30-35⁰C for 48hr After 48hrs of incubation, the colonies
were streaked on the SCDA. Gram stain does to the isolated colonies to confirm bacteria
morphology. Traditional identification is performed using the biochemical manual system.
In samples for fungi, following the period of incubation of Sabouraud Dextrose
Broth (SDB) containing the inoculum of the product and the organism A. brasiliensis, a
transfer was made on SDA and incubated at 20-25ºC for a minimum of 7 days. After the
incubation period, the number of colonies were counted and identified to genus and

93
species levels using macroscopic and microscopic characteristics evaluation of the
organism applying the morphological characteristics and taxonomic manuals.
3.2. Molecular Method Real-time PCR
For the molecular phase Applied Biosystems Step One Plus™ Real-time PCR
System equipment was used. The StepOnePlus™ systems used fluorescent-based
polymerase chain reaction (PCR) reagents to provide: (1) Quantitative detection of target
nucleic acid sequences (targets) using Real-time analysis. (2) Qualitative detection of
targets using post-PCR (endpoint) analysis, and (3) Qualitative analysis of the PCR
product (achieved by melt curve analysis ocurring post-PCR) (Applied Biosystems 2014).
The equipment used was designed to work using 48 wells. The program used was the
Primer Express® Software version 3.0 for using TaqMan primers and probes for
performing the method of Real-time PCR.
Through this method, the ability to detect the presence or absence of specific
nucleic acid sequences for E. coli and A. brasiliensis was established using TaqMan®
Fast Universal PCR Master Mix 2X which comprised the steps of polymerization,
cleavage, strand displacement, and selected polymerization. The components in the
experiment included the nucleotide sequence of the target A. brasiliensis and E. coli
organisms. The method compared the samples under study in each run. The samples
analyzed were run on par with conventional microbiological runs. These were the
Sensitivity Test methods where dilutions ranged from 100 to 10-15 containing A. brasiliensis
and E. coli separately. The detection of low concentration of trace level objectionable
organisms with the TSM test organism were also presented. All runs with its endogenous
control were run to eliminate variations in the efficiency of the retro transcription. The
samples in the wells’ plates were performed in triplicate for each sample with its
endogenous per plate.

94
The method of analysis to interpret the test was based on the Comparative Ct
Method for Relative Quantification (ΔΔCt). The CT value is the threshold cycle, the cycle
number when the flourescence for the reaction crosses a threshold line. The CT values
are logarithmic and are used either directly as in the comparative CT method or indirectly
as in interpolation to standard curves to create linear values for quantitative analysis. The
software collected raw fluorescence data at different points after each extension step of
PCR. Each reading was composed of a three phases throughout the system:
Excitation – The instrument illuminated all wells of the reaction plate within the
instrument, exciting the fluorophores in each reaction.
Emission – The instrument optics collected the residual fluorescence emitted from
the wells of the reaction plate. The resulting image collected by the device
consisted only of light that corresponded to the range of emission wavelengths.
Collection – The instrument assembleed a digital representation of the residual
fluorescence collected over a fixed time interval. The StepOne™ software stored
the raw fluorescent image for analysis.
After a run, the StepOne™ System software used calibration data (spatial, dye, and
background) to determine the location and intensity of the fluorescent signals of each
measurement, the dye associated with each fluorescent signal, and the significance of
the signal (Applied Biosystem 2015).
3.2.1. Preparing a PCR Reagent
The reactions were prepared with the FG, TaqMan® Fast Universal PCR Master
Mix (supplied at a 2X concentration, p/n 4304437). The PCR Master Mix provides the
entire necessary reagent for the 5’ nuclease PCR process, with the exception of the
primers, the TaqMan® probe and DNA template. The preparation of the reaction mix is
shown in Table 3.03. The working stock concentration of the primers was 50µM and the

95
working stock concentration of probe was 10 µM. The primers and probes were designed
by Applied Biosystems® Custom Oligo Synthesis Services. The forward and reverse
primer and Probe used are described in Table 3.04. The reconstitution of the Forward and
Reverse primers to 10,000 pmol are shown on Figure 3.02. The dilutions of the TaqMan®
probe to 100 µM in 50 µL are indicated in Figure 3.03.
The DNA templates that were later added to both the primers and the probe to
provide a working stock concentration of 10 µL. For this research the total reaction
volumes were 50µl.
Table 3.03. Preparation of the reaction mix.
16 x 3 + 2 NTC = 50 samples per assay: 50 samples per assay (in μL)
TaqMan® Advanced Fast Master Mix 10.0 μL x 50 = 500
First forward 2.0 μL x 50 = 100
First reverse 2.0 μL x 50 = 100
Probe 2.0 μL x 50 = 100
cDNA template 4.0 μL x 50 = 200
Final Volume 20.0 μL

96
Table 3.04. Primers and probe per organisms.
Aspergillus brasiliensis
Forward Primer Reverse Primer Probe
GGGCCGCTGGCTTCTTA TGTTATTGCCGCGCACTTC 6 – FAM
ACTATCGGCTCAA
GCC MGBNFQ
Escherichia coli
CCGCGTGGTATGAAGAAAG CTTCCTCCCCCGCTGAA VICTTCGGGTTGTA
AAAGTACMGBNFQ
Table 3.04 presents the sequence detection primer 10.000 pmoles and the TaqMan®
MGM probes of 6.000 pmoles from Applied Biosystems used for A. brasiliensis and E.
coli.
3.2.2. Preparation and Extraction Samples for Escherichia coli
ATCC®8739™ and Aspergillus brasiliensis ATCC®16404™ Testing
To prepare the bacteria and fungi from the culture dilution, the cultures were
shaken by the PrepMan® Ultra Sample Preparation Reagent Well and the reagent settled
until any remaining bubbles had disappeared. We then transferred each appropriate
quantity of PrepMan® Ultra Sample Preparation Reagent into a 50 mL sterile conical tube.
Table 3.03 summarizes the reagents by reaction. The tubes were labeled and pipette filled
with 1 mL of culture broth.
This broth contained the bacteria or fungi in new 2 mL microcentrifuge screw-cap
tubes which were microcentrifuged at the highest speed for 2 min, aspired; the
supernatant was discarded using a VWR® Scientific disposable transfer micropipette with
the pipette 100-1000 µL. Using a 2 mL sterile microcentrifuge screw-cap tube, 100 µL of

97
the PrepMan® Ultra Sample Preparation Reagent were aseptically added into each tube.
Pipette tips were changed between tubes. After tightly screw-capping the microcentrifuge
tubes, the sample was vigorously vortexed and placed in a heat block and set to 100ºC
for 10 min, removed allowed to cool at room temperature for 2, and microcentrifuged at
the highest speed for 2 minutes. An 50 μL aliquot of the supernatant from the spun tubes
was transferred into a second set of microcentrifuge, screw-cap tubes. The remaining
supernatant was discarded. A 5 µL aliquot of supernatant was used for each assay
reaction. Finally, the samples were amplified using the thermal cycling protocol described
in Figure 3.01.
Table 3.05. Steps performed to extract the sample with PrepMan®.
Procedure
1. Centrifuged 1 mL of the sample 2 min at full speed.
2. Discarded supernatant.
3. Added 100 μl of PrepMan® Ultra.
4. Heated sample to 100⁰C for 10 min.
5. Removed 50 µL and stored at -20⁰C if the sample were not
analyzed immediately.

98
Figure 3.01. Computer screen template – Real-time PCR run method parameters.
3.2.3. Real-time PCR Amplification Process
For the preparation of the PCR amplification process, the DNA polymerase was
hot-satarted in the TaqMan® Universal PCR Master Mix (2X), No AmpErase UNG. This
amplified the target cDNA using sequence-specific primers and cleaved the TaqMan®
probed hybridized to the target sequence. The cleavage of TaqMan® probes caused by
the hot-start DNA polymerase generated the fluorescent signal. The plate document on
the StepOne™ Real-time PCR System was set up and the PCR reaction plate in triplicate
was prepared for each reaction with the recommended reaction volume of 20 µL for the
optical 48 well fast plate. Table 3.05 shows amounts of reagents used for each reaction.
Software for the Real-time PCR System showed the plate document that corresponded to
the reaction plate and the reaction plate was placed into the StepOne™ System, which
was started for the run. Figure 3.01 shows the run method parameters.

99
Table 3.06. Preparation of the 48-wells plate.
Procedure
Added 16μL reaction volume in each of the wells in the plate.
Added 4μL of each sample corresponding to each well.
Table 3.07. Reaction of Real-time PCR - Quantities of reagents by reaction.
Component Volume (μL)
TaqMan® Advanced Fast Master Mix
Primer Forward
Primer Reverse
Probe
cDNA template
Final Volume
10.0
2.0
2.0
2.0
4.0
20.0
Reconstitution volume
(10,000 pmol) (1 µmol / 1,000,000 pmol) = 0.01 µmol
0.01 µmol / X = 50 µmol / L = 0.0002 L = 200 µL
It was added 200 µL of nuclease free water to each test tube of lyophilized primer
to obtain a concentration of 50 µM in each tube.
Figure 3.02. Real-time PCR protocol used - Reconstitution of the forward and reverse
primers to 10,000 pmol.

100
Dilution performed
C1V1 = C2V2
100 µM = 100 µmol / L
100 µmol / 1,000,000 µL (50 µL) = 10 µmol / 1,000,000 µL (V2)
we cleared for V2 = 500 µL
500 µL - 50 µL = 450 µL
It was added 450 µL of 1X TE buffer to the tube of TaqMan® probe to dilute it to
10µm.
Figure 3.03. Protocol used for dilution of the TaqMan® probe to 100 µM in 50 µL.
Table 3.08. Quantities for reaction.
Reactive µL per
reaction
Reaction mix
multiply
# de Reactions + 1
Final Concentration
Universal Master Mix II 10 multiply by 1X
Primer F 2.0 number of 900nM
Primer R 2.0 samples 900nM
TAqMan® Probe 2.0 250nM
DNA template 4.0 ---
Water ---- ---
Final Volume 20.0

101
Chapter Four
Results and Discussion
The minimal detection of Escherichia coli ATCC®8739™ and Aspergillus
brasiliensis ATCC®16404™ in three different raw materials (corn starch, sucrose, sodium
chloride) and three pharmaceutical products (solid, liquid, cream) contaminated with a
specific known population was detected at minimum level of dilution10¯¹⁵ by Real-time
PCR (Table 4.09). Results of the study for two phases included. Phase I (sensitivity test)
for minimal detection of microorganism’s present in the sample for E. coli indicated that
the detection in culture medium for bacteria was from the dilution 10⁰ to 10¯⁹, with 10¯⁹ as
the minimum amount that was detected under conventional pour-plate method with a
number of colonies on average of 1CFU / plate (Table 4.01). The chosen dilution in the
serial dilution was 10¯⁷ for E. coli, which consistently presented the parameter from 10 to
100 CFU of the required known population of cells to contaminate the raw materials and
the OTC products .
Table 4.01 contains the results in CFU/plate by conventional pour-plate method
for bacteria. From the dilution of 10¯¹⁰ to 10¯¹⁵, there was no colony growth, indicating no
presence of bacteria was detected with the conventional microbiological method. Figure
4.01 shows the results of E. coli in CFU by the pour-plate method. To confirm the presence
of contamination with bacteria in each sample, the microorganisms were isolated and
biochemically identified (Table 4.02).

102
Figure 4.01. Sensitivity test for minimal detection of E.coli ATCC®8739™ using the CFU
conventional method.

103
Table 4.01. Sensitivity test for minimal detection of Escherichia coli ATCC®8739™ by
conventional pour-plate method. Technique used: Serial dilution/counting on plate
(CFU/plate).
Escherichia coli ATCC®8739™
Mean of Triplicates by Runs
Sample Run 1 Run 2 Run 3
Negative Control 0 0 0
10⁰ TNTC TNTC TNTC
10¯¹ TNTC TNTC TNTC
10¯² TNTC TNTC TNTC
10¯³ TNTC TNTC TNTC
10¯⁴ TNTC TNTC TNTC
10¯⁵ TNTC TNTC TNTC
10¯⁶ 293 299 299
10¯⁷ 66 67 67
10¯⁸ 9 8 9
10¯⁹ 2 1 1
10¯¹⁰ 0 0 0
10¯¹¹ 0 0 0
10¯¹² 0 0 0
10¯¹³ 0 0 0
10¯¹⁴ 0 0 0
10¯¹⁵ 0 0 0

104
Table 4.01 presents the results of the averages of triplicates for each run in triplicate
repeated five times. The bold type letter shows the population selected as known
population.
The known population was the dilution selected to artificially contaminated
samples of raw materials and finished products for the second phase of the study (phase
II - TSM). Also, table 4.01 shows in bold letters the dilution selected as the most diluted
to demonstrate the sensitivity effect of both methods.
Table 4.02. Confirmatory Test for E. coli ATCC®8739™ identification detected in USP
conventional pour-plate and Real-time PCR methods.
Sample Gram Stain ID Real-time PCR
10⁰ Gram negative rod E. coli +
10ˉ¹ Gram negative rod E. coli +
10ˉ² Gram negative rod E.coli +
10ˉ³ Gram negative rod E.coli +
10ˉ⁴ Gram negative rod E.coli +
10ˉ⁵ Gram negative rod E.coli +
10ˉ⁶ Gram negative rod E.coli +
10ˉ⁷ Gram negative rod E.coli +
10ˉ⁸ Gram negative rod E.coli +
10ˉ⁹ Gram negative rod E.coli +

105
The Table 4.02 and Table 4.03 shows the results obtained in the identification of
bacteria and fungi from samples used for sensitivity test for both methodologies
(Conventional pour-plate and Real-time PCR).
Table 4.02., continued.
10ˉ¹⁰ No growth 0 CFU +
10ˉ¹¹ No growth 0 CFU +
10ˉ¹² No growth 0 CFU +
10ˉ¹³ No growth 0 CFU +
10ˉ¹⁴ No growth 0 CFU +
10ˉ¹⁵ No growth 0 CFU +

106
Table 4.03. Confirmatory Test for A. brasiliensis ATCC®16404™ identification detected
in USP conventional pour-plate and Real-time PCR methods.
Sample Meetsª
Macro/Micromorphology Observations
ID Real-time PCR
10⁰ + A. Brasiliensis +
10ˉ¹ + A. Brasiliensis +
10ˉ² + A. Brasiliensis +
10ˉ³ + A. brasiliensis +
10ˉ⁴ + A. brasiliensis +
10ˉ⁵ + A. brasiliensis +
10ˉ⁶ No growth 0 CFU +
10ˉ⁷ No growth 0 CFU +
10ˉ⁸ No growth 0 CFU +
10ˉ⁹ No growth 0 CFU +
10ˉ¹⁰ No growth 0 CFU +
10ˉ¹¹ No growth 0 CFU +
10ˉ¹² No growth 0 CFU +
10ˉ¹³ No growth 0 CFU +
10ˉ¹⁴ No growth 0 CFU +
10ˉ¹⁵ No growth 0 CFU +
ª Colony first white then dark brown to black. The reverse of the colony light brown.
Exudates absent. Conidial heads globose at first and later radiate,walls thick, smooth, pale
brown; vesicles 30–45 mm wide, nearly globose; biseriate; metulae covering the entire
surface of the vesicle with phialides flask-shaped with conidia subglobose, echinulate. No
sclerotia observed in the culture .

107
The fungal results indicated that A. brasiliensis was detected by conventional
microbiological method at the 10¯⁵ dilution with a minimum detection average of 3 x 10⁵
cells (Table 4.04). The table presents the results of the averages of triplicates for each
run in triplicates repeated five times. Figure 4.02 shows the results of A. brasiliensis in
CFU by the conventional pour-plate method. Based on the reproducibility of the results,
they showed that the dilution representing the range of 10 to 100 CFU for the fungus was
10¯³ dilutions (Table 4.04). The 10¯⁷ dilutions in E. coli and 10¯³ in A. brasiliensis were
chosen to contaminate the second phase of this study to test for specified microorganisms
(TSM).

108
Figure 4.02. A. brasiliensis results in CFU for sensitivity test by conventional pour-plate
method.
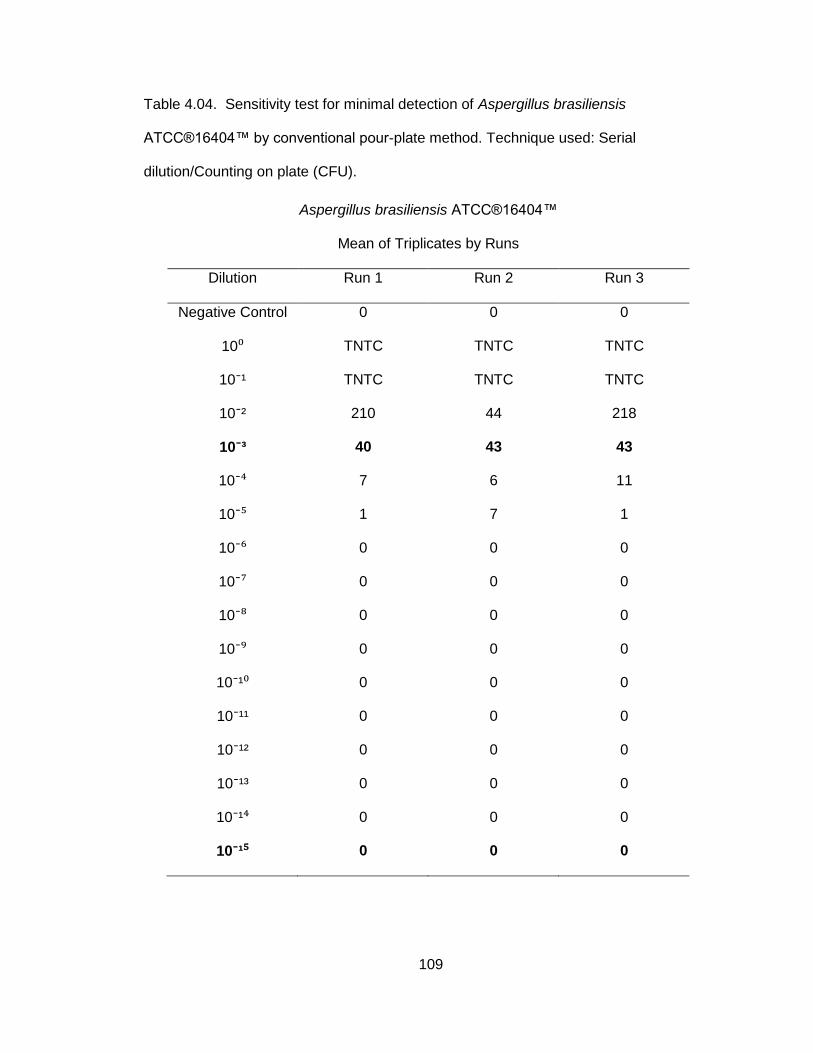
109
Table 4.04. Sensitivity test for minimal detection of Aspergillus brasiliensis
ATCC®16404™ by conventional pour-plate method. Technique used: Serial
dilution/Counting on plate (CFU).
Aspergillus brasiliensis ATCC®16404™
Mean of Triplicates by Runs
Dilution Run 1 Run 2 Run 3
Negative Control 0 0 0
10⁰ TNTC TNTC TNTC
10¯¹ TNTC TNTC TNTC
10¯² 210 44 218
10¯³ 40 43 43
10¯⁴ 7 6 11
10¯⁵ 1 7 1
10¯⁶ 0 0 0
10¯⁷ 0 0 0
10¯⁸ 0 0 0
10¯⁹ 0 0 0
10¯¹⁰ 0 0 0
10¯¹¹ 0 0 0
10¯¹² 0 0 0
10¯¹³ 0 0 0
10¯¹⁴ 0 0 0
10¯¹⁵ 0 0 0

110
The tables’ 4.01 and 4.04 indicated in bold the chosen population of bacteria and
fungi to contaminate the raw materials and finished products to the TSM test. Also, the
dilution of 10¯¹⁵ was chosen even when the conventional method did not detect the
presence of organisms by the sensitivity test.
Thus Real-time PCR demonstrated the sensitivity of the methodology to detect the
minimal trace of E. coli and A. brasiliensis in the presence of raw material and OTC
products for TSM by conventional and molecular methods. To directly detect the presence
of specified bacteria and fungi contamination in the raw material and finished product,
DNA was extracted using TaqMan® Advanced Fast Master Mix analyzed StepOne™
Real-time PCR with two different primers to amplify a conserved DNA sequence for E. coli
16S and A. brasiliensis ITS region. The number of copies of the DNA sequence for E. coli
and A. brasiliensis with specific sequence-primers designed for each organism was
detected. Tables 4.05 and 4.06 presents the threshold cycle (Ct) at which the fluorescent
signal of the reaction crosses the threshold. This Ct was used to calculate the initial DNA
copy number, because the Ct value was inversely related to the starting amount of target.
The results obtained from Ct by molecular Real-time PCR methodology indicated
amplification of the DNA target for samples from 10¯¹ to 10¯¹⁵ for E. coli and A. brasiliensis
in comparison with the control (Tables 4.05 and 4.06).

111
Table 4.05. Real-time PCR – Treshold Cycle (Ct) values of E.coli at minimum detection
(Sensitivity test).
Sample Triplicates Ct Ct mean Sample Triplicates Ct Ct mean
10¯¹ 1 15.36 25.76 10¯⁹ 1 32.50 34.87 2 34.02 25.76 2 37.09 34.87 3 27.92 25.76 3 35.03 34.87
10¯² 1 28.461 28.19 10¯¹⁰ 1 33.35 32.21 2 28.20 28.19 2 30.48 32.21 3 27.90 28.19 3 32.80 32.21
10¯³ 1 30.98 31.21 10¯¹¹ 1 33.89 33.74 2 31.09 31.21 2 33.69 33.74 3 31.57 31.21 3 33.65 33.74
10¯⁴ 1 31.88 32.65 10¯¹² 1 30.54 30.21 2 33.65 32.65 2 29.91 30.21 3 32.42 32.65 3 30.17 30.21
10¯⁵ 1 32.59 33.19 10¯¹³ 1 30.24 31.65 2 33.79 33.19 2 32.70 31.65 3
33.19 33.19
3 32.01 31.65
10¯⁶ 1 29.71 29.24 10¯¹⁴ 1 32.78 30.90 2 29.30 29.24 2 34.50 30.90 3 28.71 29.24 3 25.43 30.90
10¯⁷ 1 33.71 32.93 10¯¹⁵ 1 28.77 33.39 2 31.42 32.93 2 38.00 33.39 3 33.66 32.93 3 33.39 33.39
10¯⁸ 1 33.30 33.27 Control 1 10.90 15.89 2 33.25 33.27 Control 2 15.27 15.89 3 33.26 33.27 Control 3 21.50 15.89
Table 4.05 presents the Ct values to determine the ability of the method to detect
the presence of the bacteria even at dilutions 10¯¹⁵. The results show that the control of E.
coli amplified to a Ct of 15.89. The positive control E. coli DNA was from Life Technologies
product code 362251. All samples detected the presence of the objectionable bacteria
with DNA amplification above the Ct value of 25.76. The amplifications signals were
considered positive for E. coli when it was greater than the signal emitted by the control.
The result was negative when it was less than the signal of Ct of 15.89. These results

112
were compared with the number of CFU obtained by the conventional microbiological
pour-plate method. A comparison of the amplification curves for E.coli in comparison with
conventional method revealed significant differences, indicating that the amplification
precision for detection of Real-time PCR was more sensitive and accurate than
conventional method (Fig 4.03). No E. coli contamination in terms of CFU for sensitivity
test was observed in SCDA culture plate for conventional pour-plate method from dilution
10¯¹⁰ to 10¯¹⁵. The bacteria detection obtained by pour- plate method was lower in
comparison with the Real-time PCR, suggesting that the Real-time PCR was more
sensitive than the convetional pour-plate method. Results from bacteria are shown in
Table 4.04. Only 30 minutes was needed to perform the molecular technique Real-time
PCR detection by the StepOne™.
This suggested that the Real-time PCR assays with TaqMan® MGM probe
provided a sensitive and practical system for detection the objectable microorganisms.
These probes were more specific than primers at higher temperature. The primers were
designed according to standard PCR guidelines. These was specifics for the target
sequences for E. coli and A. brasiliensis (Table 3.04).The entire samples reflects that
contains the targets organisms during the cycle (Fig 4.03). The cycle indicated that enough
sample was accumulated for a cleaved probe to allow amplification signals to emerge from
the baseline. At this point, the visible amplification signal inversely related to the initial
target quantity.

113
Escherichia coli ATCC® 8739™
Aspergillus brasiliensis ATCC®16604™
Figure 4.03. Amplification plot for a 10 fold dilution for E.coli ATCC® 8739™ (above) and
A. brasiliensis ATCC®16404™ (below).

114
As shown in Figure 4.03, the Real-time PCR with the customs TaqMan® assay
designed primer demonstrated positive results with the specific target bacteria and fungal
species and did not detect other non-target microorganisms in the samples. The amount
of viable bacteria and fungi cells count in the serial dilutions for sensitivity test and TSM
samples were determined by Cellometer® Auto M10 (Nexcelom Bioscience) and
compared with the corresponding conventional CFU plate counts method (Table 4.07 and
Table 4.08).
In A. brasiliensis, the fungi colony growth was observed until 10¯⁵, no CFU were
reflected from 10¯⁶ to 10¯¹⁵. In all repetition and replicates, no contamination was observed
from dilution 10¯¹⁰ to 10¯¹⁵ for samples containing E. coli and also no contamination was
observed for A. brasiliensis from dilution 10¯⁶ to 10¯¹⁵ (Fig. 4.02). Both strains used to
contaminate the samples and recovered by the plate count were isolated and identified to
confirm that the organisms recovered were the strain used for the study.

115
Table 4.06. Real-time PCR Ct values of A. brasiliensis ATCC 16404 at minimum
detection sensitivity test.
Sample Triplicate Ct Ct mean Sample Triplicate Ct Ct mean
10¯¹ 1 23.61 28.17
10¯⁹ 1 32.37 32.44
2 28.17 28.17 2 32.49 32.44 3 32.73 28.17 3 32.45 32.44
10¯² 1 26.37 26.16 10¯¹⁰ 1 27.51 27.45 2 26.00 26.16 2 27.66 27.45 3 26.12 26.16 3 27.18 27.45
10¯³ 1 29.49 29.46 10¯¹¹ 1 25.42 25.39 2 29.47 29.46 2 25.37 25.39 3 29.41 29.46 3 25.38 25.39
10¯⁴ 1 32.97 32.74 10¯¹² 1 29.40 29.57 2 32.45 32.74 2 29.89 29.57 3 32.80 32.74 3 29.43 29.57
10¯⁵ 1 31.48 31.40 10¯¹³ 1 32.31 32.79 2 31.43 31.40 2 32.90 32.79 3 31.28 31.40 3 33.15 32.79
10¯⁶ 1 33.19 33.62 10¯¹⁴ 1 32.01 31.26 2 33.58 33.62 2 30.96 31.26 3 34.09 33.62 3 30.81 31.26
10¯⁷ 1 36.94 36.06 10¯¹⁵ 1 17.50 25.69 2 36.24 36.06 2 25.59 25.69
3 34.99 36.06 3 33.98 25.69
10¯⁸ 1 33.29 33.67 Control 1 21.77 21.71 2 34.69 33.67 Control 2 21.62 21.71 3 33.04 33.67 Control 3 21.74 21.71
The E. coli count obtained by CFU counting in contrast with the Real-time PCR Ct
value (Table 4.05) correlated to dilutions corresponding to bacterial counts ranging from
10⁰ to 10¯⁹ for E. coli in terms of detection the presence of organisms in the sample. The
fungi correlated in detection from 10⁰ to 10¯⁵ (Table 4.06). The Real-time PCR method
had amplification of E. coli DNA from Taq DNA polymerase in all dilutions from 10¯¹ to
10¯¹⁵ by the sensitivity test and detected the bacteria in the raw materials and OTC product
samples analyzed at 10¯⁷ and 10¯¹⁵ for TSM. Also, in A. brasiliensis was obtained

116
amplification in all samples from sample 10¯¹ to 10¯¹⁵ for sensitivity test and 10¯³ and 10¯¹⁵
for detection of the presence of the fungi in TSM for finished product and raw materials.
Table 4.07. Live and dead cells of Escherichia coli ATCC® 8739™ with Cellometer®Auto M10.
Dilution Live cell Dead cell Viability %
10⁰ 265 205 56.4
10¯¹ 225 201 52.8
10¯² 194 158 55.0
10¯³ 124 89 58.0
10¯⁴ 103 86 54.7
10¯⁵ 102 80 56.0
10¯⁶ 75 114 39.7
10¯⁷ 74 110 37.0
10¯⁸ 57 37 60.0
10¯⁹ 28 36 43.8
10¯¹⁰ 26 37 41.3
10¯¹¹ 21 32 40.4
10¯¹² 11 22 33.3
10¯¹³ 0 16 0
10¯¹⁴ 0 13 0
10¯¹⁵ 0 0 0

117
Table 4.08. Live and dead cells of Aspergillus brasiliensis ATCC® 16404™ with
Cellometer®Auto M10.
Dilution Live cell Dead cell Viability %
10⁰ 323 263 55.1
10¯¹ 284 214 57.0
10¯² 241 182 58.8
10¯³ 194 157 55.3
10¯⁴ 156 139 53.6
10¯⁵ 132 79 62.6
10¯⁶ 124 89 58.2
10¯⁷ 104 86 54.7
10¯⁸ 103 81 56.0
10¯⁹ 57 38 60.0
10¯¹⁰ 28 36 43.8
10¯¹¹ 13 24 35.1
10¯¹² 6 18 25.0
10¯¹³ 2 5 28.0
10¯¹⁴ 0 3 0
10¯¹⁵ 0 4 0

118
A comparison of Total Bacteria plate count with Ct detection in all analyzed
samples of raw material and OTC products revealed significant differences between the
microbiology pour-plate method versus Real-time PCR because the Real-time PCR
product amplified in all samples. The conventional method did not have the ability to detect
small traces of the 10¯¹⁵ sample dilutions while the Real-time PCR method was able to
detect at this dilution. Cell viability was 52% for the E. coli strain and 54% for A.
brasiliensis. The E. coli counts of more than 100 cells by the cytometry and plate count
correlated to dilutions from 10¯1 to 10¯⁶. Aspergillus correlated to dilution from 10¯¹ to 10¯²
(and from 10¯³ onwards there was no correlation). Bacteria and fungal cytometry with
dilutions from had cell viability at 10¯¹³ and from 10¯¹⁴ to 10¯¹⁵ reflected no viable cells.
Table 4.08 compares the data obtained for the detection performed by the plate count,
cytometry, and Real-time PCR methods.

119
Table 4.09. Presence in CFU, Cells and Ct value.
Escherichia coli ATCC® 8739™ Aspergillus brasiliensis ATCC® 16404™
Dilution Live cell Plate
CFU
Ct Live cell Plate CFU Ct
10¯¹ 284 TNTC 25.76 323 TNTC 28.17
10¯² 241 TNTC 28.19 284 210 26.16
10¯³ 194 TNTC 31.21 241 40 29.46
10¯⁴ 156 TNTC 32.65 194 7 32.74
10¯⁵ 132 TNTC 33.19 156 1 31.40
10¯⁶ 124 297 29.24 132 0 33.62
10¯⁷ 104 67 32.93 124 0 36.06
10¯⁸ 103 9 33.27 104 0 33.67
10¯⁹ 57 1 34.87 103 0 32.44
10¯¹⁰ 28 0 32.21 57 0 27.45
10¯¹¹ 13 0 33.74 28 0 25.39
10¯¹² 6 0 30.21 13 0 25.69
10¯¹³ 2 0 31.65 6 0 31.65
10¯¹⁴ 0 0 30.90 2 0 30.90
10¯¹⁵ 0 0 33.39 0 0 33.39

120
As shown in Table 4.09 the expected detection of E. coli and A. brasiliensis was
successfully amplified and detected with specific primers in each phosphate buffer
dilutions (sensitivity test).
The results obtained in the second phase of the study for test for specified
microorganisms (TSM) are shown in Table 4.10. Samples of finished products and raw
material contaminated with E. coli strain cells at concentrations of 10¯⁷ were recovered by
the conventional method like the molecular Real-time PCR method. However, the
conventional method failed to detect E. coli strain in samples of finished products and raw
materials to a minimum concentration of 10¯¹⁵ (Table 4.10), contrary to the Real-time PCR
that did detect the presence of bacteria in all samples of raw materials and finished
products analyzed at concentrations from 10¯⁷ to 10¯¹⁵. The TSM results obtained with the
strain of A. brasiliensis were similar to those with E.coli. The conventional methods did not
have the sensitivity to detect the contamination with A. brasiliensis in the samples of raw
material and finished product at a minimum concentration of 10¯¹⁵.
These results proved the sensitivity, acuracy and efficiency of primers and Real-
time PCR assay used in this study and, demonstrated that the raw material and
pharmaceutical finished product sample ingredients analyzed had no adverse effects on
Real-time PCR detection.

121
Table 4.10. Test for Specified Microorganisms detection by USP conventional pour-plate
and Real-time PCR 141.
TaqDNA fragment detection was amplified using specific primers for the target
bacterial and fungal DNA. The sensitivity of the Real-time PCR was constant, with 40
cycles performed in each experiments, indicatings the precision and effectiveness to
detect the strains of E. coli ATCC® 8739™ and A. brasiliensis ATCC® 16404™ in
pharmaceutical products and raw materials analyzed.
Escherichia coli
ATCC® 8739™
Aspergillus brasiliensis
ATCC® 16404™
Sample Plate count 10¯⁷ CFU
Ct 10¯⁷
Plate count 10¯¹⁵ CFU
Ct 10¯¹⁵
Plate count 10¯³ CFU
Ct 10¯³
Plate count 10¯¹⁵ CFU
Ct 10¯¹⁵
Finished product
Tablets 130 37.38 0 35.11 225 37.46 0 37.48
Liquid 10 37.46 0 37.48 24 37.70 0 36.89
Cream 5 37.70 0 37.89 26 38.28 0 37.97
Raw material
Sucrose 1 38.28 0 37.97 1 37.62 0 37.37
Corn
starch
1 37.62 0 37.37 1 35.20 0 34.71
Sodium
chloride
1 35.20 0 34.71 1 35.11 0 35.02

122
4.1. Data Analysis
4.1.1. Inferential Data Analysis
For nonparametric tests for two independent samples, the Mann-Whitney U test,
was used to determine statistical differences for the detection of Escherichia coli ATCC®
8739™ and Aspergillus brasiliensis ATCC® 16404™ for each of the two different methods:
conventional, and molecular Real-time PCR methods. There were no significantly
differences for the detection of the organisms among the two methods (Table 4.11). The
Mann-Whitney U test were not significant for the conventional method (74.000, n = 32, p
= .089); this value of p, when compared to a 0.01 significance indicates that the null
hypothesis (p > 0.05) is not rejected. Therefore, there was no statistically significant
difference between Escherichia coli ATCC® 8739™ and Aspergillus brasiliensis ATCC®
16404™ when using the conventional method.
Table 4.11. Mann-Whitney Test for detection of Escherichia coli ATCC® 8739™ and
Aspergillus brasiliensis ATCC® 16404™ for each of the two different methods.
_________________________________________________________________
Contrast Statistics
_________________________________________________________________
U de Mann-Whitney 74.000
Z -1.702
Asymptotic significance .089
________________________________________________________________ a. Grouping variable: Escherichia coli ATCC® 8739™ y Aspergillus brasiliensis
ATCC® 16404™.
The Mann-Whitney U test results were not significant for the Real-time PCR CT,
Mann-Whitney U (88.000 n = 30) =, p = .310. This value of p, when compared to a 0.01
significance indicates that the null hypothesis (p> 0.05) was not rejected. Therefore, there
is no statistically significant difference between Escherichia coli ATCC® 8739™ and

123
Aspergillus brasiliensis ATCC® 16404™ when using the Real-time PCR Ct method (see
Table 4.12).
Tabla 4.12. Mann-Whitney Test for Real-time PCR.
Contrast Statistics
U de Mann-Whitney
Z
Asymptotic significance
88.000
-1.016
.310
a. Grouping variable: Escherichia coli ATCC® 8739™
and Aspergillus brasiliensis ATCC®16404™
The Mann-Whitney U test results were not significant for the conventional and
molecular method (15.000, n = 12, p = 0.629). This value of p, when compared to a 0.01
significance indicates that the null hypothesis (p> 0.05) was not rejected. Therefore, there
is no statistically significant difference between Escherichia coli ATCC® 8739™ and
ATCC® 16404™ Aspergillus brasiliensis in different types of samples by conventional and
molecular method (see Table 4.13).
Table 4.13. Mann-Whitney Testª. _________________________________________________________________
Contrast Statistics
_________________________________________________________________
U de Mann-Whitney 15.000
Z -0.484
Asymptotic significance .629
_________________________________________________________________ a. Grouping variable: Escherichia coli ATCC® 8739™ y Aspergillus brasiliensis
ATCC® 16404™.

124
4.1.2. Inferential Analysis Methods
For nonparametric tests for two independent samples, the Kolmorgorov-Smirnov
test was used to determine statistical differences for the detection of Escherichia coli
ATCC® 8739™ and Aspergillus brasiliensis ATCC® 16404™ for the conventional and Real-
time PCR methods. This test can find differences when analyzing two methods with two
different measures (units).The Kolmogorov can analyze CFU (conventional method) with
Ct value (Real-time PCR).
The test results were significant, Kolmogorov Smirnov Z (N = 30) = 2.324, p = .000.
This value of p, when compared to a 0.01 significance indicates that the null hypothesis
(p <0.01) is rejected (Table 4.14 and Table 4.15). Therefore, there is a statistically
significant differences in the detection of Escherichia coli ATCC® 8739™ and ATCC®
16404™ Aspergillus brasiliensis in conventional microbiological pour plate and the Real-
time PCR methods.
Table 4.14. Frequencies.
Method N
Values
Conventional 30
Real-time PCR 30
Total 60

125
Table 4.15. Test statisticª.
Values
Most
Differences
Extreme
Absolute .600
Positive .600
Negative -.400
Z de Kolmogorov-Smirnov 2.324
Asymptotic significance (bilateral) .000
a. Grouping variable: Method.

126
Chapter 5
Conclusions and Recommendations
Real-time PCR testing using TaqMan® with specific primers and simple sample
protocol preparation procedure demonstrated increased sensitivity, effectiveness, and
replicability as compared to conventional pour-plate methods for detecting low levels of
bacteria and fungal contamination less than 1 CFU, in raw material and pharmaceutical
products. The Real-time PCR method detected the minimal trace of the presence of E.
coli ATCC® 8739™ at a dilution of 10ˉ¹ to 10ˉ¹⁵ for sensitivity test (minimal detection) and
of 10¯³ and 10¯¹⁵ in all samples analyzed for Test of specified Microorganisms (TSM) for
raw materials and OTC products. Also, in A. brasiliensis ATCC® 16404™ the molecular
method amplified in all samples from sample 10ˉ¹ to 10ˉ¹⁵ for sensitivity test and 10ˉ³ and
10ˉ¹⁵ for detection of the presence of the fungi in TSM for finished product (tablet, liquid
and cream) and raw materials (sucrose, corn starch and sodium chloride).
The Real-time PCR with TaqMan® was a sensitive, accurate and reproducibility
method targeting the E. coli ATCC® 8739™ and A. brasiliensis ATCC® 16404™ in raw
material and finished product. The Real-time PCR method had increased specificity at
trace levels with a concentration of 10ˉ¹⁵ of the organisms cells in comparison with the
conventional pour-plate method. It was found there is a statistically significant differences
in the terms of detection the presence of Escherichia coli ATCC® 8739™ and ATCC®
16404™ Aspergillus brasiliensis in conventional microbiological pour-plate and the Real-
time PCR methods. The RT-PCR is recommended for detecting contamination in raw
material because a minimum sensitivity of 10ˉ¹⁵ was obtained in all samples which might
not be possible for the conventional pour-plate method. This molecular methodology in
this study presented the benefits in terms of increased sensitivity, reduced the risk of
contamination and variability between runs.

127
The Real-time PCR method with TaqMan® proved be faster, and effective
methodology for the sensitive detection of objectionable microorganisms for the USP <62>
Microbiological Examination of Nonsterile Products Tests for Specified Microorganisms
and for microbial enumeration established in USP Chapter <61> Microbiological
Examination of Nonsterile Products Microbial Enumeration Tests.
Pharmaceutical industries should strive to incorporate Real-time PCR
methodologies into written standard operating procedures (SOPs), protocols, and
validation techniques. Thus, this investigation will contribute with the industry by detailing
a step-by-step protocol of microbiological molecular analyses applied directly to samples
of raw material and pharmaceutical OTC products.
This investigation will contribute in the rapid detection of the presence of
objectionable microorganisms in terms of sensitivity, specificity, and effectivity with a
minimal trace, which was not possible under conventional microbiology pour-plate
methodologies. This contribution will directly impact the traditional methodology
established in the pharmacopeia chapter <62> of the Compendium of the USP (2015).This
helps to reduce the risk of exposure of humans and animals to contaminated drugs that
do not meet the FDA and USP quality standards. The early and rapid detection of a
precise and effective methodology as the Real-time PCR helps in protecting public health
by avoiding outbreak of nosocomial infections.

128
Literature Cited
Abarca ML. 2000. Taxonomía e identificación de especies implicadas en la aspergilosis
nosocomial. Revista Iberoamericana Micología 17: 79-84.
Abdin MZ, Ahmad MM, Javed S. 2010. Advances in molecular detection of Aspergillus:
an update. Archives Microbiology 192(6): 409-425.
Abee T, Wounters JA. 1999. Microbial stress response in minimal processing.
International Journal Food Microbiology 50(1-2): 65-91.
Avallone HL. 1986. Laboratory controls – An FDA investigators viewpoint. PDA Journal
Pharmaceutical Science Technology 40(5): 178-182.
Baird RM. 1998. Pharmaceutical Microbiology 6th Ed. W.B. Hugo & A.D. Rusell (Eds)
Blackwell Science, Oxford, UK, pp 374-384.
Balajee SA, Sigler L, Brandt ME. 2007. DNA and the classical way: identification of
medically important molds in the 21st Century. Medical Mycology 45(6): 475-490.
Bennett JW. 2009. Aspergillus: a primer for the novice. Medical Mycology 47(1): 5-12.
Bomblies L, Weiss C, Bekman G. 2007. Examination of microbiological quality
of pharmaceutical raw material. Pharmaceutical Science Notes 1:1-7.
Bosch F, Rosich L. 2008. "The contributions of Paul Ehrlich to pharmacology: a
tribute on the occasion of the centenary of his Nobel Prize". Pharmacology 82 (3):
171–179.
Bosshard PP, Zbinden R, Abels S, Böddinghaus B, Altwegg M,
Böttger EC. 2006. 16S rRNA gen sequencing versus the API 20 NE
system and the VITEK 2 ID-GNB Card for identification of nonfermenting
Gram negative bacteria in the clinical laboratory. Journal Clinical Microbiology
44(4): 1359-1366

129
Brannan DK, Dille JC. 1990. Type of closure prevents microbial contamination of
cosmetic during consumer use. Applied Environmental Microbiology 56(5): 1476–
1479.
Burgos JS, Ramírez C, Tenorio R, Sastre I, Bullido MJ. 2002. Influence of reagents
formulation on real-time PCR parameters. Molecular and Cellular Probe 16: 257–
260.
Bustin SA, Benes V, Garson JA, Hellemans J, Kubista M, Mueller R, Nolan T, Pfaffl MW,
Shipley GL, Vandersompele J, Wittwer CT. 2009. The MIQE guidelines: minimum
information for publication of quantitative real-time PCR experiments. Clinical
Chemistry 55(4): 611-622.
Campana R, Scesa C, Patrone V, Vittoria E, Baffore W. 2006. Microbiological study of
cosmetic products during their use by cosmetics: health risk and efficacy of
preservative systems. Letters Applied Microbiology 42:301-306.
Casey W, Muth H, Kirby J, Allen P. 1998. Use of nonselective preenrichment media for
the recovery of enteric bacteria from pharmaceutical products. Pharmaceutical
Technology 22: 114-117.
[CDC] Centers of Dicease Control and Prevention. 2013. [Accessed 2014 December 09]
http://www.cdc.gov/medicationsafety/recalls/necc/#advice.
[CFR] Code of Federal Regulations. 2013. CFR Title 21. Vol 8: Part 210-211 current
Good Manufacturing Practice for Finished Pharmaceuticals. Available from:
http://www.accessdata.fda.gov/scripts/cdrh/cfdocs/cfcfr/CFRSearch.cfm?CFRPar
t=211.
Changsoo L, Jaai K, Seung GS, Seokhwin H. 2005. Absolute and relative QPCR
quantification of plasmid copy number in Escherichia coli. Journal of
Biotechnology 123: 273-280.
130
Chaubron F, Martin-Minvielle A, Groulon S. 2006. One step real-time
PCR kits for the universal detection of organisms in industrial products. World
Intelectual Property Organization WO2004/044247. Available from:
"http://www.sumobrain.com/patents/WO2004044247.html",
Clontz L. 1998. Microbial limit and bioburden tests. Interpharm Press, Inc. IL,
USA. 230p.
Clontz L. 2009. Microbial limit and bioburden tests: validation approaches and global
requirements. CRC Press: Taylor & Francis Group. 311p.
Coker M. 2005. An assessment of microbial contamination during drug manufacturing in
Ibadan, Nigeria. European Journal of Scientific Research 7: 19-23.
Cundell AM. 2006. Microbial identification strategies in the pharmaceutical
industry. PDA Journal Pharmaceutical Science Technology 60: 111-123.
Cundell AM. 2006. Opportunities for rapid microbial methods American Pharmaceutical
Review 9(7): 50-56.
Cundell AM, Chatellier S, Schumann P, Lilischkis R. 2010. Equivalence of quality control
strains of microorganisms used in the compendial microbiological tests: are
national culture collection strains identical? PDA Journal Pharmaceutical Science
Technology 64(2): 137-155.
Davey HM. 2011. Life, death, and in-between: Meanings and methods in microbiology.
Applied and Environmental Microbiology 77(16): 5571-5576.
De Boer E, Beumer RR. 1999. Methodology for detection and typing of foodborne
microorganisms. International Journal Food Microbiology 50(1-2): 119-130.
Denoya, CD. 2009. Nucleic Acid Amplification -Based Rapid Microbiological Methods:
Are these Technologies Ready for Deployment in the Pharmaceutical Industry?
American Pharmaceutical Review. 12(9): 12-21.

131
Denoya C, Colgan S, du Moulin GC. 2006. Alternative microbiological methods in the
pharmaceutical industry: the need for a new microbiology curriculum. American
Pharmaceutical Review 9:10-18.
Dorak MT. 2006. Real-time PCR. Taylor & Francis Group. 333p.
Duguid J, Balkovic E, du Moulin GC. 2011. Rapid Microbiological methods: Where are
they now? American Pharmaceutical Review 14(7): 18-25.
Espy MJ, Uhl JR, Sloan LM, Buckwalter SP, Jones MF, Vetter EA, Yao JDC,
Wengenack NL, Rosenblatt JE, Cockerill III FR, Smith TF. 2006. Real-time PCR
in clinical microbiology: Applications for routine laboratory testing. Clinical
Microbiology Reviews 19(1): 165-256.
Fabe J, Moritz N, Henninger N, Zepp F, Knuf M. 2009. Rapid detection of common
pathogenic Aspergillus species by a novel real time PCR approach. Mycoses
52(3): 228-233.
Farrington JK, Martz EL, Wells SJ, Ennis CC, Holder J, Levchuk JW, Avis KE, Hoffman
PS, Hitchins AD, Madden JM. 1994. Ability of laboratory methods to predict in-use
efficacy of antimicrobial preservatives in an experimental cosmetic. Applied
Environmental Microbiology 60(12): 4553-4558.
[FDA] Food and Drug Administration (US). 2014. Products recall. [Accessed 2014
December 05. In: http://www.fda.gov/Drugs/DrugSafety/DrugRecalls/default.htm
[FDA] Food and Drug Administration (US). 2014. CDC Laboratory samples results.
Accessed 2014 December 05.
In:http://www.fda.gov/Drugs/DrugSafety/FungalMeningitis/default.htm
FDAGOV Approval. 2008. Clinical Trials.
Available from: http://www.fda.gov/cder/guidance/index.htm
FDA. Food and Drug Administration. 2014. Guide to inspection of microbiological
pharmaceutical quality control laboratories. Rockville, MD: Food and Drug

132
Administration. Available from:
http://www.fda.gov/ICECI/Inspections/InspectionGuides/ucm074914.htm.
FDA Press Release. Nov-Dec 2005 Issue. Available from: http://www.fda.gov
Ferre F. 1992. Quantitative or semi-quantitative PCR: reality versus myth. PCR Methods
and Applications 2: 1–9.
Fung DYC. 2002. Rapid methods and automation in microbiology. Comprehensive
Reviews Food Science and Food Safety 1: 1-20.
Gad GFM, Aly RAI, Ashour MSE. 2011. Microbial evaluation of some non-sterile
pharmaceutical preparations commonly used in the Egyptian market. Tropical
Journal of Pharmaceutical Research 10(4): 437-445.
Gams W, Christensen M, Onions AHS, Pitt JI, Samson RA. 1985. Infrageneric taxa of
Aspergillus. In: Samson RA, Pitt JI, eds. Advances in Aspergillus systematics. New
York: Plenum Press. p 55-64.
Ghandhi M. 2006. Efficiency with Rapid Microbiology Methods. American
Pharmaceutical Review 9 (5): 16-19.
Geiser DM, Klich MA, Frisvad JC, Peterson SW, Varga J, Samson RA. 2007. The
current status of species recognition and identification in Aspergillus. Studies
Mycology 59: 1-10.
Guilfoyle DE, Friedman RL, Hughes PF, Hussong D, Rosenberg AS, Brorson D. 2013.
Microbial risk in pharmaceutical manufacturing and ICHQ9. PDA Journal
Pharmaceutical science Technology 67(2): 79-80.
Houseknecht J, Stamenova E, Suh SO, Beck B, McKee M, Zhou J. 2008.
Reclassification of ATCC® 16404™ and ATCC® 9642™ as Aspergillus
brasiliensis. Pharmaceutical Microbiology Forum Newsletter 14: 2-8.
Hussong D, Mello R. 2006. Alternative microbiology methods and pharmaceutical
quality control. American Pharmaceutical Review 9(1): 62-68.

133
ICH. 2007. International Conference on Harmonization
Available from:
http://www.ec.europa.eu/Enterprise/pharmaceuticals/eudralex/index.htm.
Li RY, Li DM, Yu J, Liu W, Ji ZH, Wang DL. 2004. Application of molecular biology
techniques in the identification of pathogenic fungi and the diagnosis of fungal
infection. Journal of Peking University, Health Science 36(5): 536-539.
Jaffe RI, Lane JD, Bates CW. 2001. Real-time identification of
Pseudomonas aeruginosa direct from clinical samples using a rapid extraction
method and polymerase chain reaction. Journal Clinical Laboratory Analysis
15(3):131-137.
Jiménez L. 2001. Molecular diagnosis of microbial contamination in cosmetic
and pharmaceutical products: a review. Journal AOAC International 84: 671-
675.
Jiménez L. 2007. Microbial diversity in pharmaceutical product recalls and environments.
PDA Journal of Pharmaceutical Science and Technology 61(5): 383-399.
Jiménez L. 2011. Molecular applications to pharmaceutical processes and cleanroom
environments. PDA Journal of Pharamceutical Science Technology 65: 242-253.
Jiménez L, Smalls S, Ignar R. 2000. Use of PCR analysis for detecting
low levels of bacteria and mold contamination in pharmaceutical
samples. Journal Microbiology Method 41: 259-265.
Jurjević Ž, Peterson SW, Stea G, Solfrizzo P, Vargas J, Hubka V, Perrone G. 2012. Two
novel species of Aspergillus section Nigri from indoor air. IMA Fungus – The Global
Micological Journal 3(2): 159-173.
Kai FH. 2004. A generalized plate method for estimating total aerobic microbial count.
PDA Journal of Pharmaceutical Science and Technology 58(5): 261-265.
Karami A, Ahmadiz Z, Safiri Z, Khalilpour A, Morrovatis S. 2006. Development of and
134
rapid and simple multiplex polymerase chain reaction technique for detection of
Salmonella typhi. Saudi Medical Journal 27(8): 1134-1138.
Karanam VR, Reddy HP, Subba RBV, Rao JC, Kavikishore PB, Vijayalakshmi M. 2008.
Detection of indicator pathogens from pharmaceutical finished products and raw
materials using multiplex PCR and comparison with conventional microbiological
methods. Journal Industrial Microbiology Biotechnology 35(9): 1007-1018.
Kearns AM, Graham C, Burdess D, Haetherington J, Freeman R. 2002.
Rapid real-time PCR for determination of Penicillin susceptibility in
pneumococcal meningitis, including cultura-negative cases. Journal Clinical
Microbiology 40 (2): 682-684.
Klein D. 2002. Quantification using real-time PCR technology: applications and
limitations. Trends in Molecular Medicine 8: 257-260.
Klingspor L, Jalal S. 2006. Molecular detection and identification of Candida
and Aspergillus spp. From clinical samples using real-time PCR. Clinical
Microbiology Infection 12(8):745-753.
Kubista M, Andrade JM, Bengtsson M, Forootan A, Jonak, Link K, Sindelka R, Sjöback
R, Strömbom L, Ståhlberg A, Zoric N. 2006. The real-time polymerase chain
reaction. Molecular Aspects Medicine 27(2-3): 95-125.
Kushwaha P. 2010. Microbial contamination: A regulatory perspective. Journal of
Pharmacy Research 3 (1): 124-131.
Lanfear D, McLeod H. 2007. Pharmacogenetics: Using DNA to Optimize Drug
Therapy. American Family Physician 76:1179-1182.
Lee C, Lee S, Shin SG, Hwang S. 2008. Real-time PCR determination of rRNA gene
copy number: absolute and relative quantification assays with Escherichia coli.
Applied Microbiology Biotechnology 78(2): 371-376.
Linter K, Genet V. 1998. A physical method for the preservation of cosmetic products.

135
International Journal Cosmetic Science 20(2): 103-115.
Livak KJ, Schmittgen TD. 2001. Analysis of relative gene expression data using real-
time quantitative PCR and the 2(-Delta Delta C (T) method. Methods 25(4): 402-
408.
Lolas AG, Metcalfe JW. 2011. Evaluation of the microbial growth potential of
pharmaceutical drug products and quality by design. PDA Journal of
Pharmaceutical Science and Technology 65(1): 63-70.
Mackay IM, Arden KE, Nitsche A. 2002. Real-time pcr in virology. Nucleic Acids
Research. 30(6):1292-1305.
Madsen RE. 2001 “New Technologies for Microbiological Testing” In Microbiology in
Pharmaceutical Manufacturing. R. Prince, Ed, p. 147-156. Parenteral Drug Assoc
Baltimore.
Manu-Tawiah W, Brescia BA, Montgomery ER. 2001. Setting threshold limits for the
significance of objectionable microorganisms in oral pharmaceutical products.
PDA Journal of Pharmaceutical Science and Technology 55(33): 171-175.
Marlowe EM, Bankowki MJ. 2011. Conventional and molecular methods for the
detection of Methicillin-Resistant Staphylococcus aureus. Journal of Clinical
Microbiology 49(9): S55-S56.
Martínez-Bermudez A, Rodríguez de Lecea J, Soto-Esteras T, Vázquez-Estevez C,
Chena-Canete C. 1991. Tipos de contaminantes microbianos de materias primas
farmacéuticas. Revista Latinoamerica Microbiología 33:153-157.
Matsuda K, Tsuji H, Asahara T, Kado Y, Nomoto K. 2007.
Sensitive quantitative detection of comensal bacterial by rRNA-targeted
reverse transcription PCR. Applied Environmental Microbiology 73(1): 32-39.
Meijer M, Houbraker JAMP, Dalhuijsen S, Samson RA, de Vries RP. 2011. Growth and

136
hydrolase profiles can be used as characteristicas to distinguish Aspergillus niger
and other black aspergilli. Studies Micology 69(1): 19-30.
McArthur M, Bibb MJ. 2008. Manipulating and understanding antibiotic
production in Streptomyces coelicolor A3(2) with decoy oligonucleotides.
Proceedings National Academy Science United State America 22:105(3):1020-
1025.
Miller HI. 1982. Recombinant DNA as a paradigm of a new technology: Its impact on
regulation by the Food Drug Administration. PDA Journal Pharmaceutical Science
Technology 36(6): 248-250.
Miller MJ. 2005. Rapid microbiological methods and FDA’s initiatives for pharmaceutical
cGMO’s for the 21st Century, PAT, and sterile drug products produced by aseptic
processing. American Pharmaceutical Review 17(2): 65-67.
Miller MJ. 2009. It's Time to get rapid!. PDA Letter. April: 16-21.
Miller MJ. 2012. Case study of a new growth-based rapid microbiological method (RMM)
that detects the presence of specific organisms and provides an estimation of
viable cell count. American Pharmaceutical Review. 15(2):18-25.
Moldenhauer J. 2006. Viability based rapid microbiological methods for sterility
testing and the need for identification of contamination. PDA Pharmaceutical
Science & Technology 60(2): 81-88.
Nigel AH. 2002. Mirobial control of pharmaceutical. Encyclopedia of Pharamceutical
Technology. Third ed. Vol. 1: 1753-1764.
Noonim P, Mahakarachanakul W, Varga J, Frisvad JC, Samson RA. 2008. Two novel
species of Aspergillus section Nigri from Thal coffee beans. International Journal
Systematic Evolutionary Microbiology 58(7): 1727-1734.
Okeke IN, Lamikanra A. 2001. Bacteriological quality of skin-mosturizing creams and

137
lotions distributed in a tropical developing country. Journal Applied Bacteriology
91: 922-928.
Parker MS. 2000. Microbiological contamination and preservation of pharmaceutical
preparations. In: Pharmaceuticals: The science of dosage from design. 2nd ed.
China, Churchill Livingstone. P220.
Pathmanathan SG, Cardona-Castro N, Sanchez-Jiménez MM, Correa-Ochoa MM,
Puthucheary SD, Thong KL. 2003. Simple and rapid detection of Salmonella
strains by direct PCR amplification of the hilA gene. Journal Medical Microbiology
52(9): 773-776.
Perrone G, Varga J, Susca A, Frisvad JC, Stea G, Kocsube S, Toth B, Kozakiewicz Z,
Samson R A. 2008. Aspergillus uvarum sp. nov., an uniseriate black Aspergillus
species isolated from grapes in Europe. International Journal Systematic
Evolutionary Microbiology 58: 1032-1039.
Postgate JR. 1969. Viable counts and viability. Methods microbial 1: 611-628.
[PMM] Pharmaceutical Microbiology Manual. 2014. ORA.007, Version 1.1
In: http://www.fda.gov/downloads/scienceresearch/fieldscience/ucm397228.pdf.
Ragheb SM, Yassin AS, Amin MA. 2012. The application of uniplex, duplex and
multiplex PCR for the absence of specified microorganism testing of
pharmaceutical excipients and drug products. PDA Journal of Pharmaceutical
Science and Technology 66(4): 307-317.
Ragheb SM, Jiménez L. 2014. Polymerase Chain Reaction/Rapid method are gaining a
foothold in developing countries. PDA journal of Pharmaceutical Science and
Technology 68(3): 239-255.
Ramírez M, Castro C, Palomares JC, Torres MJ, Aller AL, Ruiz M, Aznar J, Martín-
Mazuelos E. 2009. Molecular detection and identification of Aspergillus spp. from
clinical samples using real time PCR. Mycoses 52(2): 129-134.

138
Rapper KB, Fennell DI. 1965. The genus Aspergillus. Baltimore: Williams & Wilkins.
Rinyu E, Varga J, Ferenczy L. 1995. Phenotypic and Genotypic Analysis of
Variability in Aspergillus fumigatus. Journal Clinical Microbiology 33(10): 2567-
2675.
Rodríguez-Pérez J. 2014. The FDA andwordlwide current good manufacturing practices
and quality system requirements guidebook for finished pharmaceuticals. ASQ
Quality Press Milwaukee 53203.
Sandle T. 2014. Approaching the selection of rapid microbiological method. Institute of
Validation Technology Network.
In:http://www.ivtnetwork.com/article/approaching-selection-rapid-microbiological-
methods.
Saghee MR, Sandle T, Tidswell EC. 2010. Microbiology and Sterility Assurance in
Pharmaceuticals and Medical Devices. Ed. New Delhi: Business Horizons.
In: Pharma Manufacturing. com.
http://www.pharmamanufacturing.com/articles/2011/004/?show=all
Samadi N, Alvandi M, Fazeli MR, Azizi E, Mehrgan H, Naseri M. 2007. PCR-
based detection of low levels of Staphylococcus aureus contamination in
pharmaceutical preparations. Journal Biology Science 7(2): 359-363.
Samsom RA, Noonim P, Meijer M, Houbraken J, Frisvad JC, Varga J. 2007. Diagnostic
tools to identify black aspergilli. Studies in Mycology 59: 129-145.
Samson RA, Houbraken J, Varga J, Frisvad JC. 2009. Polyphasic taxonomy of the heat
resistant ascomycete genus Byssochlamys and its Paecilomyces anamorphs.
Persoonia 22: 14-27.
Schabereiter GC, Selitsch B, Rotter ML, Hirschl AM, Willinger B. 2007. Development

139
of novel real-time PCR assays for detection and differentiation of eleven medically
important Aspergillus and Candida species in clinical specimens. Journal Clinical
Microbiology 10: 1128-1346.
Shaikh D, Jamshed TA, Shaikh R. 1988. Microbial contamination of pharmaceutical
preparations. Pakistan Journal of Pharmaceutical Science 1: 61-66.
Simões MF, Santos C, Lima N. 2013. Structural diversity of Aspergillus (section nigri)
spores. Microscopy Microanalysis 19(5): 1151-1158.
Ŝkof A, Poljak M, Krbavĉiĉ A. 2007. Real-time polymerase chain reaction for
detection of Staphylococcus aureus and Pseudomonas aeruginosa in
pharmaceutical products for topical use. Journal Rapid Method & Automation in
Microbiology 12(3): 169-183.
Spiegelman D, Whissell G, Greer W. 2005. A survey of the method’s for the
characteristization of microbial consortium and communities. Canadian Journal
Microbiology 51: 355-386.
Sutton SVW. 2012. What is an “Objectionable Organisms” The Shifting Perspective.
American Pharmaceutical Review. Posted Ocxtibr 12, 2012.
In: http://www.americanpharmaceuticalreview.com/Featured-Articles/122201-
What-is-an-Objectionable-Organism-Objectionable-Organisms-The-Shifting-
Perspective/
Sutton S. 2011. Accuracy of plate counts. Journal of Validation Technology 17(3): 42-
46.
Sutton S, Jiménez L. 2012. A review involving microbiological control 2004-2011 with
emphasis on FDA considerations of “Objectionable Organisms”. American
Pharmaceutical Review 15(1): 42-57.
Sutton SVW, Knapp JE, Dabbah R. 2001. Activities of the USP microbiology
subcommittee of revision during the 1995-2000 revision cycle. PDA Journal of

140
Pharmaceutical Science and Technology 55(1): 33-48.
Sutton SVW, Tirumalai R. 2011. Activities of the USP microbiology and sterility
assurance expert committee during the 2005-2010 revision cycle. RMM Review
July/August 12-30.
Tasara T, Schmacher S, Stephen R. 2005. Conventional and real time PCR based
approaches for molecular detection and quantitation of bovine species material in
edible glatine. Journal of Food Protection 68(11): 2420-2426.
Torbeck L, Raccasi D, Guilfoyle DE, Friedman RL, Hussong D. 2011. Burkhloderia
cepacia: This decision is overdue. PDA Journal Pharmaceutical Science
Technology 65(5): 535-543.
Trick WE, Jarvis WR. 1998. Epidemiology of nosocomial fungal infection in the 1990s.
Resvista Iberoamericana Micología 15: 2-6.
Treviňo M, Matínez-Lamas, Romero-Jung P, Varón C, Moldes L, García-Riestra C,
Regueiro BJ. 2009. Comparación entre las pruebas para la detección de beta-
lactamasas espectro extendido de los sistemas Vitek 2 y Phoenix.
Enferemedades Infecciosas y Microbiología Clínica 27(10): 566-570.
U.S. Food and Drug Administration. 2004. Safety, background and definitions. Recalls.
In: http://www.fda.gov/Safety/Recalls/ucm165546.htm
[USP] United States of Pharmacopea Compendium. 2015. Chapetr <61>. Microbial
examination of nonsterile products: microbial enumeration test. Vol. 38-NF33 pp.
57- 62.
[USP] United States of Pharmacopea Compendium. 2015. Chapetr <62>.
Microbiological examination of nonsterile products: Tests for specified
microorganisms. Vol. 38-NF33 pp. 62-67.
[USP] United States of Pharmacopea Compendium. 2015. Chapetr <1111>.
Microbiological examination of nonsterile products: Acceptance criteria for

141
pharmaceutical preparations and substances for pharmaceutical use. Vol. 38-
NF33 pp. 923-925.
[USP] United States of Pharmacopea Compendium. 2015. Chapter <1227>. Validation
of microbial recovery from pharmacopeial articles. Vol. 38-NF33 pp. 1163-1166.
[USP] United States of Pharmacopea Compendium. 2015. Chapter <1041> Biologics.
Vol. 30-NF 25 pp.1-3 pp 618-619.
[USP] United Sates of Pharmacopea Compendium. 2015. Chapter <1045>
Biotecnology. Vol 30-NF 25 pp. 626-640.
Valasek MA, Repa JJ. 2005. The power of real time PCR. Advances Physiology
Education 29(3): 151-159.
Van der Zee H, Huis in’t Veld JH. 1997. Rapid and alternative screening methods
for microbiological analysis. Journal AOAC International 80(4): 934-940.
Varga J, Kocsabé S, Tóth B, Frisvad JC, Perrone G, Susca A, Meijer M, Samson RA.
2007. Aspergillus brasiliensis sp. nov., a biseriate black Aspergillus species with
world-wide distribution. International Journal Systematic Evolutionary
Microbiology 57: 1925-1932.
Vickery MCL, Blackstone GM, DePaola A, Burkhardt B. 2005. Novel quantitative
PCR internal control system adaptable to any standard or real-time PCR assay.
FDA Science Forum. 04p.
Vinueza-Burgos C. 2009. PCR en Tiempo Real: la nueva era de la información genética
celular. REDVET Revista Electrónica de Veterinanria [Internet]. 10(2): 1-13.
Available from Redalyc.org:
http://www.veterinaria.org/revistas/redvet/n020209.html.
Walzer A, Tiemann F, Knaeblein J, Klaus PG, Mueller RH, Bunte T. 2007. Rapid
diagnostic method for quantitative testing of <100 microbes in water. PDA
Journal Pharmaceutical Science Technology. 61(5): 41-420.

142
Yengi LG, Leung L, Kao J. 2007. The evolving role of drug metabolism in drug
discovery and development. Pharmceutical Research 24 (5): 842-858.


![1032546+8739:- ;=< 4>/@?A+rjs57/Thesis.pdf · ' (*),+.- /1032546+8739:- ;=< 4>/@?A+ BDCFEHGHI6JLKNM%OPGHQRQTSAUVSXWVJ6YZBDC@W[C]\^M_C]\^`,WVQba8WdcbGVe]W[C]GVe_f g J6\ThiSjekMk\lCmf](https://img.dokumen.tips/doc/110x75/5f0f2ba47e708231d442d5c6/10325468739-4a-rjs57thesispdf-10325468739-.jpg)