Embed Size (px)
Citation preview

Research ArticleDetection of Adulteration in Canola Oil byUsing GC-IMS and Chemometric Analysis
Tong Chen , Xinyu Chen, Daoli Lu, and Bin Chen
School of Food and Biological Engineering, Jiangsu University, Zhenjiang 212013, China
Correspondence should be addressed to Bin Chen; [email protected]
Received 14 March 2018; Revised 2 July 2018; Accepted 2 September 2018; Published 23 September 2018
Academic Editor: David Touboul
Copyright © 2018 Tong Chen et al. This is an open access article distributed under the Creative Commons Attribution License,which permits unrestricted use, distribution, and reproduction in any medium, provided the original work is properly cited.
The aim of the present study was to detect adulteration of canola oil with other vegetable oils such as sunflower, soybean, and peanutoils and to buildmodels for predicting the content of adulterant oil in canola oil. In this work, 147 adulterated samples were detectedby gas chromatography-ion mobility spectrometry (GC-IMS) and chemometric analysis, and two methods of feature extraction,histogram of oriented gradient (HOG) and multiway principal component analysis (MPCA), were combined to pretreat the dataset. The results evaluated by canonical discriminant analysis (CDA) algorithm indicated that the HOG-MPCA-CDA model wasfeasible to discriminate the canola oil adulterated with other oils and to precisely classify different levels of each adulterant oil.Partial least square analysis (PLS) was used to build prediction models for adulterant oil level in canola oil. The model built by PLSwas proven to be effective and precise for predicting adulteration with good regression (R2>0.95) and low errors (RMSE ≤ 3.23).
1. Introduction
Canola oil is a vegetable oil derived from rapeseed which haslow erucic acid content [1]. In the 1980s, in order to decreasethe health concerns about erucic acid, rapeseed varieties freefrom erucic acid were developed by using selective breeding[2, 3]. And then, these varieties were called canola.Nowadays,China has become one of the major consumers of canola oil,and it is also popular with consumers in Canada, Europe,and South America. Canola oil can provide consumers withmany health benefits that others cannot provide. For example,canola oil is low in saturated fat and high in polyunsaturatedfats, with a good ratio of omega-6 to omega-3, which makeit very suitable for cooking [4–6]. Since canola oil has itsspecific function to human body, it has become one ofthe most susceptible food materials adulterated with othervegetable oils of lower quality, which is a serious threat to thehealth of consumers. Therefore, it requires reliable tools andmethods for analyzing the purity of edible vegetable oil.
Many techniques have been developed and used todetect adulteration in oil. These techniques include physical-chemical analysis, spectral analysis, gas chromatography(GC), gas chromatography-mass spectrometer (GC-MS), and
electronic nose. Physical and chemical analysis includessensory evaluation, colorimetry, centrifugation, and freez-ing. These traditional methods are simple and convenientand suitable for local monitoring. However, physical andchemical analysis methods are not accurate, require highdegree technical expertise, and can only determine whetherthe sample is adulterated without finding out which specificcomponent is adulterated. Spectral methods, e.g., NuclearMagnetic Resonance Spectroscopy (NMR) [7], Raman [8],Fourier Transform Infrared (FTIR) [9], and Fluorescence[10], were shown to be useful for detection and quantificationof adulteration in oil. However, their data analysis requiresspecialized software and complex algorithms which are diffi-cult for common users tomaster. Chromatographic methods,such as GC-FID (flame ionization detector) [11], GC-MS [12],and high performance liquid chromatography (HPLC) [13],have been proven to be effective in detecting adulteration inoil. Nevertheless, the requirement for standard samples andhigh input of time and labor make them unsuitable for on-site analysis, thus limiting the wide use of them. Electronicnose [14] also has been used to evaluate the quality of oil.However, it needs electrode activation process during which
HindawiInternational Journal of Analytical ChemistryVolume 2018, Article ID 3160265, 8 pageshttps://doi.org/10.1155/2018/3160265

2 International Journal of Analytical Chemistry
sensor poisoning may occur depending on operation andambient conditions.
Ion mobility spectrometry (IMS) is an analytical tech-nique and was initially developed for the detection of explo-sives and chemical warfare agents [15]. At present, it has beenwidely used in novel application in the field of agriculturalproducts and foods [16]. IMS is used to separate and identifyionized molecules in the gas phase based on their mobility ina carrier gas, which is considered as a screening technique dueto its ability to identify the properties of samples at consider-able low cost and short analysis time without pretreatment.On the other hand, IMS has limitations in detecting complexsample (e.g., food) for having low resolution and the riskof mutual interferences between analytes [17]. Yet, if com-bined with GC, the capability of IMS in separating variouscomponents is strengthened. Chromatographic elution ofeach target compound can be automatically analyzed and theobtained data information is richer because both retentiontime and drift time information are included [18]. GC-IMShas been shown to be able to characterize and discriminateadulteration in oil, wines, honey, andmeat [19–23]. Successfulapplications have been reported on the determination ofaldehydes in oil, adulteration in extra virgin olive oils by usingUV-IMS [24], and determination of volatile compounds [25].
Most of the previous reports on canola oil analysis mainlyfocused on the adulteration detection and main componentquantification of oil species [8, 26], with few studies per-formed on aroma differentiation. Odour is an importantquality criterion for edible vegetable oil.Theprevious relevantstudies often transformed the matrix to vector (like peaksselected manually as variables) for chemometric analysis byUV-IMS or GC-IMS, which may result in losing informationof certain analytes. In addition, to the best of our knowledge,no recent work has been conducted using chemometricsfor feature extraction of the two-dimensional data producedfromGC-IMS instrument.Therefore, the potential use ofGC-IMS for detection of canola oil adulteration was investigated.The aims of this study were (1) to investigate the use of GC-IMS combined with pattern recognition methods to detectthe presence of adulterant in canola oil, (2) to apply a newmethod to extract information for two-dimensional data, (3)to build a model for content prediction of adulterated oil incanola oil, and (4) to develop a rapid method for adulterationdetection in canola oil.
2. Materials and Methods
2.1. Preparation of Oil Blends. 3 canola oil samples wereprovided by Ningbo Entry-Exit Inspection and QuarantineBureau (Zhejiang Province, China), while sunflower oil (2samples), soybean oil (3 samples), and peanut oil (2 samples)were all purchased from Metro Supermarket at Zhenjiang,China. All the samples were stored at -5∘C in the refrigeratorbefore experimental process.
The adulterated samples were prepared by blendingcanola oil with sunflower oil, soybean oil, and peanut oilat levels of 0%, 5%, 10%, 20%, 30%, 40%, and 50% byvolume, respectively. The mixed oil samples were broughtto room temperature before detection. All the samples (147
samples) were homogenized with vortex for 60s and analyzedimmediately after preparation.
2.2. Experimental Device. All prepared oil samples wereanalyzed with GC-IMS device (FlavourSpec�) from G.A.S.(Gesellschaft fur Analytische Sensorysteme GmbH, Dort-mund, Germany). The instrument was equipped with anincubating device intended to heat the sample and keepthe headspace container at a constant temperature and aheated splitless injector for direct sampling of headspacevolatile compounds from the oil samples into the GC-IMS.In addition, the device was coupled to an automatic samplerunit (CTC-PAL, CTC Analytics AG, Zwingen, Switzerland),which made the injection volume more accurate and repeat-able without any human manipulation. Sample vials weretransported into a heated incubator for preconditioning.After they reached equilibrium, a heated gas-tight syringemoved over the incubator and withdrew the headspacesample. After sample injection, the hot syringe was automat-ically cleaned by purging with inert gas. The experimentalparameters used for this method were summarized in Table 1.
For analysis, 2 mL of oil sample was placed in a 10mL vial which was sealed with a magnetic cap and heatedat 90∘C for 10 min in incubating box in order to generatevolatile compounds from oil sample. 200 𝜇L of headspacewas automatically injected by heated syringe (95∘C) intothe heated injector (95∘C) of the GC-IMS instrument. Afterthat, the volatile organic compounds were pushed into themulticapillary column (MCC, 40∘C) through a carrier gas (15mL/min) for timely separation. And then, a drift gas (300mL/min in counter flow) was generated to collide with thegaseous ions of separated components from the sample toproduce the ion mobility spectra at room temperature andpressure, and finally gaseous ions were captured by a detector(a Faraday plate). Data of samples were obtained by IMSControl TFTP Server software and displayed by using LAVsoftware (Version 1.3.1, from G.A.S).
2.3. Data Processing. The multidimensional signals of GC-IMS data required pretreatment before statistical analysis.The alignment is an important step before chemometricprocess of the data due to small deviation in temperature ofMCC and flow velocity causing changes in retention time andsmall deviation in temperature of drift tube causing changesin drift time. Therefore, RIP (Reaction Ion Peak: reactionions are generated by a cascade of reactions following thecollision of a fast electron emitted from ionization sourcewith the drift gas atmosphere; as a consequence, the so-calledRIP representing the total of all ions available is formed)normalization was applied to align with a shift in x-axisby LAV software. Moreover, a Savitzky-Golay smoothingmethod (order 2 and window size 15) was used to standardizethe measurement and improve the signal-to-noise rate.
Many studies [27, 28] have proposed various featureextraction methods, such as Gabor filters, local binary pat-tern, Haar, and histograms of oriented gradients (HOG).HOG is a feature descriptor used in computer vision andimage processing for the purpose of object detection. Thetheory of HOG descriptor is that local object appearance
International Journal of Analytical Chemistry 3
Table 1: Experimental conditions for GC-IMS analyses.
Parameters Value
Automatic inject system
Headspace sampling volume 200 𝜇LIncubation time 10 minSample volume 2 mL
Incubation temperature 90∘CInjector temperature 95∘C
Column
MCC OV-5 (nonpolar)Column temperature 40∘CLength of column 30 cm
Run time 15 min
IMS
Ionization source Tritium (6.5 KeV)Voltage Positive drift
Drift length 10 cmCarrier gas flow rate 15 mL min−1 (N
25.0)
Drift gas flow rate 300 mL min−1 (N25.0)
Equipment temperature 45∘CAverage 32
Electric field strength 350 V cm−1
Grid pulse with 100 𝜇sTrigger delay 100 ms
Sampling frequency 150 kHzRepetition rate 21 ms
and shape within an image can be described by the distri-bution of intensity gradients or edge directions. The imageis divided into small connected regions called cells, and forthe pixels within each cell, a histogram of gradient directionsis compiled by counting occurrences of gradient orientationin localized portions of an image. For the present, HOG isproven to offer better feature extraction that could signifi-cantly outperform existing feature sets for object detection.
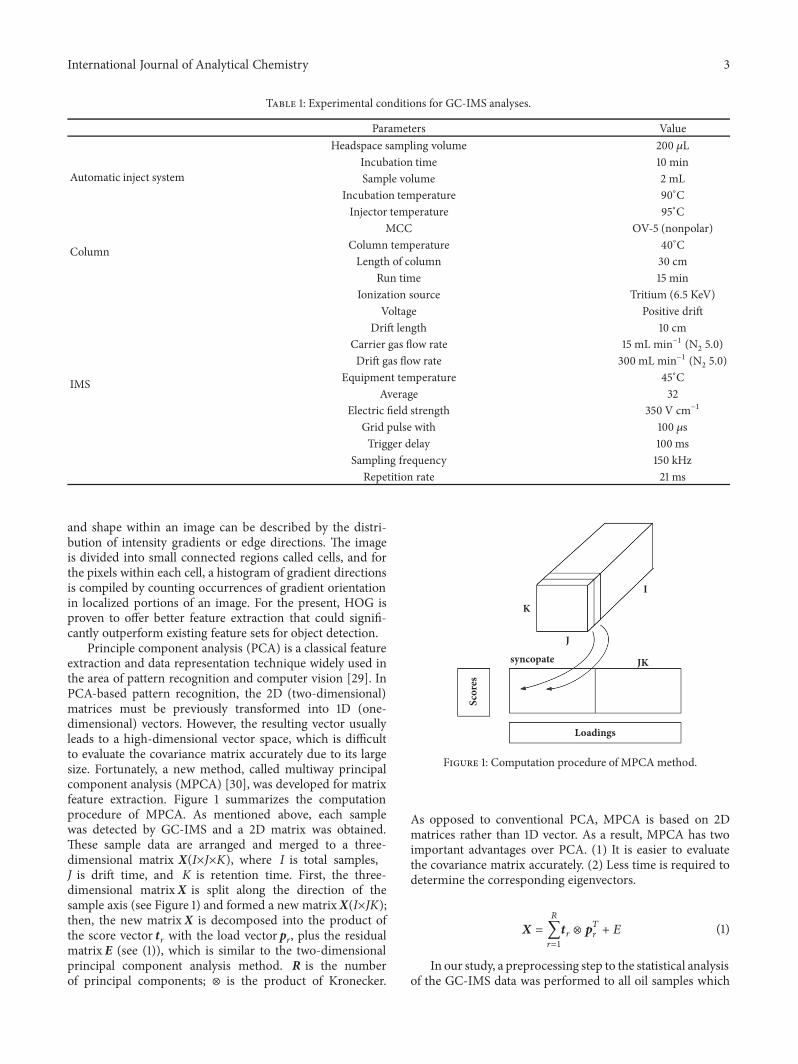
Principle component analysis (PCA) is a classical featureextraction and data representation technique widely used inthe area of pattern recognition and computer vision [29]. InPCA-based pattern recognition, the 2D (two-dimensional)matrices must be previously transformed into 1D (one-dimensional) vectors. However, the resulting vector usuallyleads to a high-dimensional vector space, which is difficultto evaluate the covariance matrix accurately due to its largesize. Fortunately, a new method, called multiway principalcomponent analysis (MPCA) [30], was developed for matrixfeature extraction. Figure 1 summarizes the computationprocedure of MPCA. As mentioned above, each samplewas detected by GC-IMS and a 2D matrix was obtained.These sample data are arranged and merged to a three-dimensional matrix X(I×J×K), where I is total samples,J is drift time, and K is retention time. First, the three-dimensional matrixX is split along the direction of thesample axis (see Figure 1) and formed a new matrixX(I×JK);then, the new matrixX is decomposed into the product ofthe score vector tr with the load vector pr, plus the residualmatrix E (see (1)), which is similar to the two-dimensionalprincipal component analysis method. R is the numberof principal components; ⊗ is the product of Kronecker.
K
I
J
syncopate
Scor
es
Loadings
JK
Figure 1: Computation procedure of MPCAmethod.
As opposed to conventional PCA, MPCA is based on 2Dmatrices rather than 1D vector. As a result, MPCA has twoimportant advantages over PCA. (1) It is easier to evaluatethe covariance matrix accurately. (2) Less time is required todetermine the corresponding eigenvectors.
𝑋 =𝑅
∑𝑟=1
𝑡𝑟 ⊗ 𝑝𝑇
𝑟+ 𝐸 (1)
In our study, a preprocessing step to the statistical analysisof the GC-IMS data was performed to all oil samples which

4 International Journal of Analytical Chemistry
350
300
250
200
150
100
50
Rete
ntio
n tim
e (s)
8.0 10.0 12.0 14.0 8.0 10.0 12.0 14.0 8.0 10.0 12.0 14.0 8.0 10.0 12.0 14.0
Drift time (ms)
0.148M 1.361M
Camellia oil 30% Sunflower oil 30% Soybean oil 30% Peanut oil
Figure 2: GC-IMS plot comparison of (a) pure canola oil, (b) 30% sunflower oil adulteration, (c) 30% soybean oil adulteration, and (d) 30%peanut oil adulteration.
consisted of a RIP normalization and a Savitzky-Golaysmoothing filter. Firstly, a HOG method was used to extracttexture and contour information. Later, as an unsupervisedmethod, MPCA was applied to further extract the featuresand visualize the dataset retaining the maximum variabil-ity present in the original data and eliminating possibledependence between variables. Then, canonical discriminantanalysis (CDA) algorithm was used to generate nonlinearboundaries between classes according to the content ofadulterated oil. Lastly, partial least square analysis (PLS) wasperformed to study the predictive capacity of GC-IMS for theadulteration content of mixed oil.
For data analysis, the MATLAB R2009a (The Math-works Inc, Natick, USA) and PLS Toolbox 5.5 (EigenvectorResearch, Inc., Manson, WA, USA) were used.
3. Results and Discussion
3.1. Sample Analysis by GC-IMS. The size of raw data fromeach oil sample was huge, so the spectral area was cut(899×1114 dimension) and selected by limiting the retentiontime from 35.49 to 385.71 s and drift time from 7.666 to 15.086ms on the basis of retaining the major information. As itis known, GC-IMS spectrum of a sample corresponded toa matrix and could be displayed as a pseudo color imagefor visualization [31]. A popular method for comparingtwo matrices is to form a difference image by subtract-ing the individual element values of one matrix from thecorresponding element values of the other matrix. In thiscondition, a positive difference indicates that the analyzedmatrix has a larger element value and a negative difference
indicates that the reference matrix has a larger element value.Therefore, taking canola oil sample as reference matrix, theother adulterated samples were regarded as analyzed matrixand colorized differences were formed by subtracting thecanola oil sample from the adulterated sample. In this way,with the increment of sunflower oil content, the changesabout volatile organic compounds from adulterated sampleswere clearly visualized. Figure 2 showed the GC-IMS pseudocolor map for change visualization when a raw canola oilsample (Figure 2(a)) was adulterated with 30% sunflower oil(Figure 2(b)), 30% soybean oil (Figure 2(c)), or 30% peanutoil (Figure 2(d)), respectively. The red region indicated thatthe sample had more volatile components compared withreference sample.The deeper the color, the more componentsit had and the blue region was the opposite. As shown inFigure 2, there were obvious changes between pure canolaoil sample and adulterated canola oil samples. Many newvolatile compounds were produced, some peaks weremarkedby black dotted rectangle for effective observation, and thosedifferences of red regions were reflected in retention time,drift time, and intensity of the corresponding peaks. On theother hand, levels of original volatile compounds in canolaoil were weakened by different degree.Those peak differences(drift time, retention time, peak volume, etc.) from volatileorganic compounds of each kind of vegetable oil are the keyto qualitative analysis or quantitative detection. On the otherhand, volatile organic compounds from samples adulteratedwith soybean oil appeared only in a short retention time,and the gas molecule materials could not be well separated,which may be caused by higher initial carrier gas flow-rate.However, only a general overall impression of the differences

International Journal of Analytical Chemistry 5
Rete
ntio
n tim
e (s)
. . . . . . .
3.5
3
2.5
2
1.5
1
0.5
0
Drift time (ms)
(a)
Rete
ntio
n tim
e (s)
1
0.8
0.6
0.4
0.2
0
. . . . . . .
Drift time (ms)
(b)
Figure 3: Visualization results of original data (a) and HOG feature extraction (b).
through the topographic plot was obtained. The contentchanges of volatile organic compoundswere not regular and itwas hard to realize digital characterization. Therefore, furtheranalysis was necessary with the help of chemometric tools.
3.2. Adulteration Classification of Oil Samples. Before MPCAanalysis, the data set was processed by HOG algorithm(24×24 block size after optimization) in order to extractuseful information and reduce the dimension of the originalmatrix. As shown in Figure 3, some peaks were selected andmarked with red solid line ellipse and Arabic numerals forvisual observation in Figure 3(a), which are correspondingto the marked area with the same Arabic numerals inFigure 3(b). It was clear that the visualization of HOG result(Figure 3(b)) could describe the characteristic information ofthe whole matrix with strong texture structure and contourinformation from the original data (Figure 3(a)), especiallythe peaks that were corresponding to volatile organic com-pounds. In addition, the dimension of the matrix from eachsample was effectively reduced (777×966 dimension).
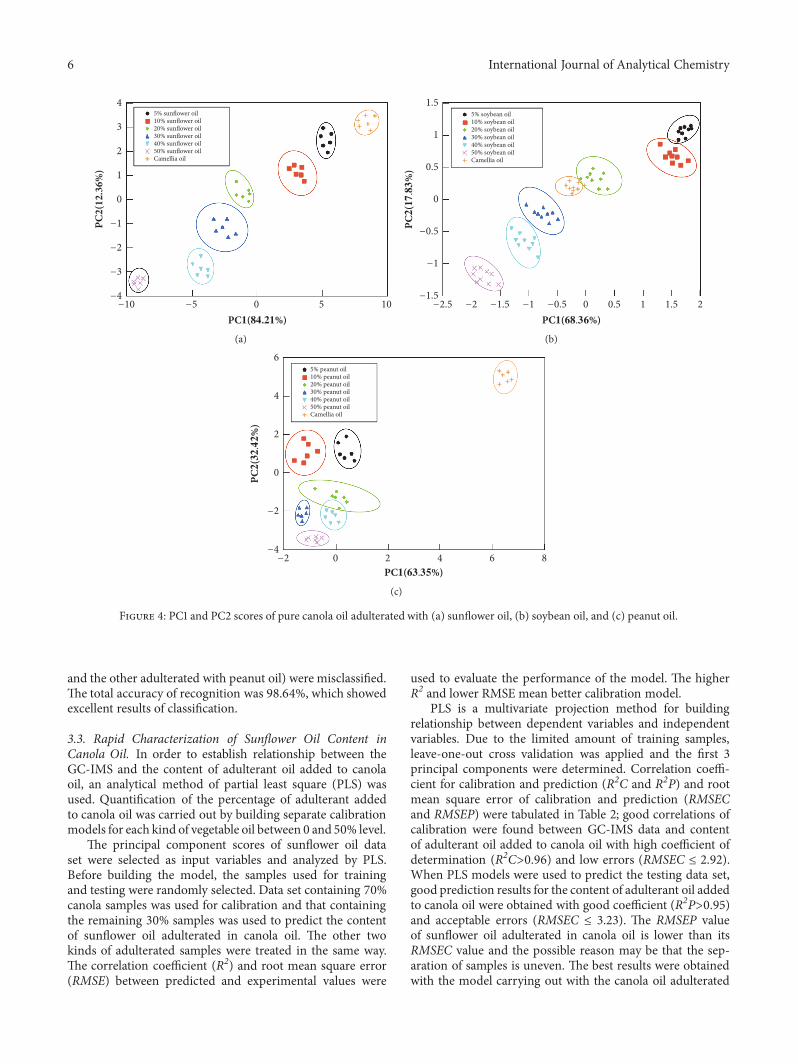
As mentioned earlier, each kind of adulterated samplesafterHOGpretreatment was arranged to a three-dimensionalmatrix andMPCA algorithm was used to process and analyzethe matrix. Principal component scores obtained were sortedfrom high to low according to the cumulative contributionrate and the first 2 principal component score matriceswere used to show the cluster of adulterated samples (seeFigure 4). As shown in Figure 4, the data were mapped ontwo most important principal components PC1 and PC2,presenting the results of canola oil adulterated with sunfloweroil (Figure 4(a)), with soybean oil (Figure 4(b)), and withpeanut oil (Figure 4(c)). The axis heading in each figure waslabeled with the respective contribution rates of PC1 and PC2after MPCA process.
Figure 4(a) showed the PCA score plot of canola oiladulterated with sunflower oil, and PC1 and PC2 explainedthe 96.57% of the original information. It could be inferredthat the first 2 PCs could give the most information of data
set. As shown, the pure canola oil samples were sufficientlywell distinguished from adulterated samples with differentlevels of adulteration and each level of adulteration hadits own cluster group. With the increase in the proportionof sunflower oil, the distribution of the samples movedfrom right to left between first two principal components.Figure 4(b) presented the result of MPCA analysis of thecanola oil adulterated with soybean oil samples. Two princi-pal components covered 86.19% of the original information.It was visible that the data points belonging to each classof adulteration rate were gathered in compact clusters andtwo principal components showed good separation in thedirection of diagonal of axis except raw canola oil samples.Although two principal components contained large amountof original information, some clusters overlapped each other(for example, clusters 0% and 20% groups). The results ofcanola oil containing peanut oil samples were shown inFigure 4(c).The reconstructed information contained 95.77%of the variance. As can be observed, pure canola oil samplesand adulterated samples were located in the opposite sideof the axis, which indicated that the raw canola oils werewell differentiated from adulterated samples. As a result,there were significant differences in aroma between canolaoil and peanut oil. Combining with Figure 2(d), it couldbe inferred that volatile compounds from peanut oil couldobviously cover up the original flavor of canola oils. On theother hand, different content of peanut oil also could bedistinguished. However, 20% adulterant oil samples clusteredin two-dimensional space overlapping with 30% and 40%groups, and its cluster region was a long and narrow strip.This phenomenonmay be resulted from the origin differencesbetween peanut oil samples purchased.
Finally, CDA was used as pattern recognition techniquesfor the authentication of canola oil. As seen in Figure 4,each kind of adulterated oil samples was all grouped into7 distinct clusters. All canola oil samples adulterated withsunflower oil could be classified without any error (100 % ofaccuracy). Only 2 samples (one adulterated with soybean oil
6 International Journal of Analytical Chemistry
4
3
2
1
0
−1
−2
−3
−4
PC2(
12.3
6%)
−10 −5 0 5 10
PC(.%)
5% sunflower oil10% sunflower oil20% sunflower oil30% sunflower oil40% sunflower oil50% sunflower oilCamellia oil
(a)
1.5
1
0.5
0
−0.5
−1
−1.5
PC
(.
%)
−2.5 −2 −1.5 −1 −0.5 0 0.5 1 1.5 2
PC(.%)
5% soybean oil10% soybean oil20% soybean oil30% soybean oil40% soybean oil50% soybean oilCamellia oil
(b)
6
4
2
0
−2
−46 8420−2
PC
(.
%)
PC(.%)
5% peanut oil10% peanut oil20% peanut oil30% peanut oil40% peanut oil50% peanut oilCamellia oil
(c)
Figure 4: PC1 and PC2 scores of pure canola oil adulterated with (a) sunflower oil, (b) soybean oil, and (c) peanut oil.
and the other adulterated with peanut oil) were misclassified.The total accuracy of recognition was 98.64%, which showedexcellent results of classification.
3.3. Rapid Characterization of Sunflower Oil Content inCanola Oil. In order to establish relationship between theGC-IMS and the content of adulterant oil added to canolaoil, an analytical method of partial least square (PLS) wasused. Quantification of the percentage of adulterant addedto canola oil was carried out by building separate calibrationmodels for each kind of vegetable oil between 0 and 50% level.
The principal component scores of sunflower oil dataset were selected as input variables and analyzed by PLS.Before building the model, the samples used for trainingand testing were randomly selected. Data set containing 70%canola samples was used for calibration and that containingthe remaining 30% samples was used to predict the contentof sunflower oil adulterated in canola oil. The other twokinds of adulterated samples were treated in the same way.The correlation coefficient (R2) and root mean square error(RMSE) between predicted and experimental values were
used to evaluate the performance of the model. The higherR2 and lower RMSE mean better calibration model.
PLS is a multivariate projection method for buildingrelationship between dependent variables and independentvariables. Due to the limited amount of training samples,leave-one-out cross validation was applied and the first 3principal components were determined. Correlation coeffi-cient for calibration and prediction (R2C and R2P) and rootmean square error of calibration and prediction (RMSECand RMSEP) were tabulated in Table 2; good correlations ofcalibration were found between GC-IMS data and contentof adulterant oil added to canola oil with high coefficient ofdetermination (R2C>0.96) and low errors (RMSEC ≤ 2.92).When PLS models were used to predict the testing data set,good prediction results for the content of adulterant oil addedto canola oil were obtained with good coefficient (R2P>0.95)and acceptable errors (RMSEC ≤ 3.23). The RMSEP valueof sunflower oil adulterated in canola oil is lower than itsRMSEC value and the possible reason may be that the sep-aration of samples is uneven. The best results were obtainedwith the model carrying out with the canola oil adulterated

International Journal of Analytical Chemistry 7
Table 2: Requisite parameters for adulteration level prediction in adulterant canola oil samples.
PLS Models Calibration Cross validation PredictionR2C RMSEC/(%) R2CV RMSECV/(%) R2P RMSEP/(%)
Adulterated with sunflower oil 0. 994 1.78 0.991 1.80 0.983 1.86Adulterated with soybean oil 0.996 1.39 0.989 1.43 0.985 1.45Adulterated with peanut oil 0.968 2.92 0.963 3.18 0.952 3.23R2C: coefficient of determination for calibration.R2CV: coefficient of determination for cross validation.R2P: coefficient of determination for prediction.RMSEC: root mean square error of calibration.RMSECV: root mean square error of cross validation.RMSEP: root mean square error of prediction.
with soybean oils. All those models are acceptable and usefulfor detecting the adulteration in canola oil. Therefore, ourpresent work verifies that adulteration in canola oil can bedetermined by PLS using the GC-IMS data.
4. Conclusions
In this paper, GC-IMS has been proposed to detect theadulteration of canola oil samples with low price vegetableoils. 147 samples were detected and the useful signals wereextracted and analyzed by HOG and MPCA algorithms. Acombination of these two methods was proved to be themost effective feature extraction method. PLS was used topredict the adulteration levels in canola oil precisely. Thecapacity in prediction showed that all those methods weresatisfactory and applicable. In addition, the model of canolaoil adulterated with soybean oil was proved to be the mosteffective.
The methodology developed has capability to detectadulteration in canola oil. The analysis time only needs about15minwhich is less than other techniques and no sample pre-treatment is required. Moreover, the device has been appliedin industrial field broadly due to low cost and portability.Therefore, GC-IMS can be seen as a powerful authenticationmethod with chemometrics for oil adulteration detection forits high efficiency and accuracy.
Data Availability
The data used to support the findings of this study areavailable from the corresponding author upon request.
Conflicts of Interest
The authors have declared no conflicts of interest.
Acknowledgments
This work was funded by the National Natural ScienceFoundation of China (Project ID: 31772056).
References
[1] A. Abbadi andG. Leckband, “Rapeseed breeding for oil content,quality, and sustainability,” European Journal of Lipid Scienceand Technology, vol. 113, no. 10, pp. 1198–1206, 2011.
[2] P. Roine, E. Uksila, H. Teir, and J. Rapola, “Histopathologicalchanges in rats and pigs fed rapeseed oil,” Zeitschrift furErnahrungswissenschaft, vol. 1, no. 2, pp. 118–124, 1960.
[3] B. Schiefer, F. M. Loew, V. Laxdal et al., “Morphologic effects ofdietary plant and animal lipids rich in docosenoic acids on heartand skeletal muscle of cynomolgus monkeys,” The AmericanJournal of Pathology, vol. 90, no. 3, pp. 551–564, 1978.
[4] T. Issariyakul and A. K. Dalai, “Biodiesel from vegetable oils,”Renewable & Sustainable Energy Reviews, vol. 31, pp. 446–471,2014.
[5] H. Lei, L. L. Cai, L. L. Cao, and S. T. Jiang, “Effect of Erucic AcidContent in Rapeseed Oil on Food Intake Safety in Mice,” FoodScience, vol. 19, pp. 321–324, 2010.
[6] F. Hashempour-Baltork, M. Torbati, S. Azadmard-Damirchi,and G. P. Savage, “Vegetable oil blending: A review of physico-chemical, nutritional and health effects,” Trends in Food Science& Technology, vol. 57, pp. 52–58, 2016.
[7] Z. Tan, E. Reyes-Suarez, W. Indrasena, and J. A. Kralovec,“Novel approach to study fish oil oxidation using 1H nuclearmagnetic resonance spectroscopy,” Journal of Functional Foods,vol. 36, pp. 310–316, 2017.
[8] S. Durakli Velioglu, H. T. Temiz, E. Ercioglu, H. M. Velioglu,A. Topcu, and I. H. Boyaci, “Use of Raman spectroscopy fordetermining erucic acid content in canola oil,” Food Chemistry,vol. 221, pp. 87–90, 2017.
[9] E. Zahir, R. Saeed, M. A. Hameed, and A. Yousuf, “Studyof physicochemical properties of edible oil and evaluationof frying oil quality by Fourier Transform-Infrared (FT-IR)Spectroscopy,”Arabian Journal of Chemistry, vol. 10, pp. S3870–S3876, 2017.
[10] J. Tan, R. Li, Z.-T. Jiang et al., “Synchronous front-face flu-orescence spectroscopy for authentication of the adulterationof edible vegetable oil with refined used frying oil,” FoodChemistry, vol. 217, pp. 274–280, 2017.
[11] D. Peng, Y. Bi, X. Ren, G. Yang, S. Sun, and X.Wang, “Detectionand quantification of adulteration of sesame oils with vegetableoils using gas chromatography and multivariate data analysis,”Food Chemistry, vol. 188, pp. 415–421, 2015.
[12] X. Sun, L. Zhang, P. Li et al., “Fatty acid profiles basedadulteration detection for flaxseed oil by gas chromatographymass spectrometry,” LWT- Food Science and Technology, vol. 63,no. 1, pp. 430–436, 2015.
[13] R. Salghi, W. Armbruster, andW. Schwack, “Detection of arganoil adulteration with vegetable oils by high-performance liquidchromatography-evaporative light scattering detection,” FoodChemistry, vol. 153, pp. 387–392, 2014.

8 International Journal of Analytical Chemistry
[14] X. Peng, W. Chen, R. Luo, C. Liu, and H. Xu, “Detection ofwalnut oil adulterated with soybean oil, rapeseed oil/corn oilusing electronic nose,” Journal of the Chinese Cereals and OilsAssociation, vol. 30, no. 11, pp. 129–134, 2015.
[15] S. Armenta, M. Alcala, and M. Blanco, “A review of recent,unconventional applications of ion mobility spectrometry(IMS),”Analytica Chimica Acta, vol. 703, no. 2, pp. 114–123, 2011.
[16] Z. Karpas, “Applications of ion mobility spectrometry (IMS) inthe field of foodomics,” Food Research International, vol. 54, no.1, pp. 1146–1151, 2013.
[17] G. W. Cook, P. T. LaPuma, G. L. Hook, and B. A. Eckenrode,“Using gas chromatography with ion mobility spectrometry toresolve explosive compounds in the presence of interferents,”Journal of Forensic Sciences, vol. 55, no. 6, pp. 1582–1591, 2010.
[18] M. T. Jafari, M. Saraji, and H. Sherafatmand, “Design for gaschromatography-corona discharge-ion mobility spectrometry,”Analytical Chemistry, vol. 84, no. 22, pp. 10077–10084, 2012.
[19] S. Liedtke, L. Seifert, N. Ahlmann, C. Hariharan, J. Franzke, andW. Vautz, “Coupling laser desorption with gas chromatographyand ionmobility spectrometry for improved olive oil character-isation,” Food Chemistry, vol. 255, pp. 323–331, 2018.
[20] Z. Karpas, A.V.Guaman,D. Calvo, A. Pardo, and S.Marco, “Thepotential of ion mobility spectrometry (IMS) for detection of2,4,6-trichloroanisole (2,4,6-TCA) in wine,”Talanta, vol. 93, pp.200–205, 2012.
[21] M. T. Jafari, T. Khayamian, V. Shaer, and N. Zarei, “Determina-tion of veterinary drug residues in chicken meat using coronadischarge ion mobility spectrometry,” Analytica Chimica Acta,vol. 581, no. 1, pp. 147–153, 2007.
[22] N. Gerhardt, M. Birkenmeier, S. Schwolow, S. Rohn, andP. Weller, “Volatile-Compound Fingerprinting by Headspace-Gas-Chromatography Ion-Mobility Spectrometry (HS-GC-IMS) as a Benchtop Alternative to 1H NMR Profiling forAssessment of theAuthenticity ofHoney,”Analytical Chemistry,vol. 90, no. 3, pp. 1777–1785, 2018.
[23] L. Zhang, Q. Shuai, P. Li et al., “Ion mobility spectrometryfingerprints: A rapid detection technology for adulteration ofsesame oil,” Food Chemistry, vol. 192, Article ID 17778, pp. 60–66, 2015.
[24] R. Garrido-Delgado, M. Eugenia Munoz-Perez, and L. Arce,“Detection of adulteration in extra virgin olive oils by usingUV-IMS and chemometric analysis,” Food Control, vol. 85, pp. 292–299, 2018.
[25] R. Garrido-Delgado, L. Arce, andM.Valcarcel, “Multi-capillarycolumn-ion mobility spectrometry: A potential screening sys-tem to differentiate virgin olive oils,” Analytical and Bioanalyti-cal Chemistry, vol. 402, no. 1, pp. 489–498, 2012.
[26] G. Ozulku, R. M. Yildirim, O. S. Toker, S. Karasu, and M. Z.Durak, “Rapid detection of adulteration of cold pressed sesameoil adultered with hazelnut, canola, and sunflower oils usingATR-FTIR spectroscopy combined with chemometric,” FoodControl, vol. 82, pp. 212–216, 2017.
[27] L. M. Surhone, M. T. Tennoe, S. F. Henssonow, and C. Vision,Histogram of Oriented Gradients. Betascript Publishing, vol. 12,no. 4, pp. 1368–1371, 2016.
[28] B. Chatterji, “Feature ExtractionMethods for Character Recog-nition,” IETE Technical Review, vol. 3, no. 1, pp. 9–22, 2015.
[29] H. Abdi and L. J. Williams, “Principal component analysis,”Wiley Interdisciplinary Reviews: Computational Statistics, vol. 2,no. 4, pp. 433–459, 2010.
[30] S.Wold, P. Geladi, K. Esbensen, and J. Ohman, “Multi-way prin-cipal components-and PLS-analysis,” Journal of Chemometrics,vol. 1, no. 1, pp. 41–56, 1987.
[31] S. Zhong, X. Jiang, and Z. Wei, “Pseudo-color coding withphase-modulated image density,” AdvancedMaterials Research,vol. 403-408, pp. 1618–1621, 2012.

TribologyAdvances in
Hindawiwww.hindawi.com Volume 2018
Hindawiwww.hindawi.com Volume 2018
International Journal ofInternational Journal ofPhotoenergy
Hindawiwww.hindawi.com Volume 2018
Journal of
Chemistry
Hindawiwww.hindawi.com Volume 2018
Advances inPhysical Chemistry
Hindawiwww.hindawi.com
Analytical Methods in Chemistry
Journal of
Volume 2018
Bioinorganic Chemistry and ApplicationsHindawiwww.hindawi.com Volume 2018
SpectroscopyInternational Journal of
Hindawiwww.hindawi.com Volume 2018
Hindawi Publishing Corporation http://www.hindawi.com Volume 2013Hindawiwww.hindawi.com
The Scientific World Journal
Volume 2018
Medicinal ChemistryInternational Journal of
Hindawiwww.hindawi.com Volume 2018
NanotechnologyHindawiwww.hindawi.com Volume 2018
Journal of
Applied ChemistryJournal of
Hindawiwww.hindawi.com Volume 2018
Hindawiwww.hindawi.com Volume 2018
Biochemistry Research International
Hindawiwww.hindawi.com Volume 2018
Enzyme Research
Hindawiwww.hindawi.com Volume 2018
Journal of
SpectroscopyAnalytical ChemistryInternational Journal of
Hindawiwww.hindawi.com Volume 2018
MaterialsJournal of
Hindawiwww.hindawi.com Volume 2018
Hindawiwww.hindawi.com Volume 2018
BioMed Research International Electrochemistry
International Journal of
Hindawiwww.hindawi.com Volume 2018
Na
nom
ate
ria
ls
Hindawiwww.hindawi.com Volume 2018
Journal ofNanomaterials
Submit your manuscripts atwww.hindawi.com


![Food Adulteration[1]](https://img.dokumen.tips/doc/110x75/577d260e1a28ab4e1ea02b30/food-adulteration1.jpg)


