Embed Size (px)
Citation preview
ORIGINAL ARTICLE
Detection accuracy of proximal caries by phosphor plateand cone-beam computerized tomography images scannedwith different resolutions
Jun-Ge Cheng & Zhi-Ling Zhang & Xiao-Yan Wang &
Zu-Yan Zhang & Xu-Chen Ma & Gang Li
Received: 20 January 2011 /Accepted: 19 July 2011 /Published online: 30 July 2011# Springer-Verlag 2011
Abstract This study was carried out to assess whether thespatial resolution has an impact on the detection accuracyof proximal caries in flat panel CBCT (cone beamcomputerized tomography) images and if the detectionaccuracy can be improved by flat panel CBCT imagesscanned with high spatial resolution when compared todigital intraoral images. The CBCT test images of 45 non-restored human permanent teeth were respectively scannedwith the ProMax 3D and the DCT Pro scanners at differentresolutions. Digital images were obtained with a phosphorplate imaging system Digora Optime. Eight observersevaluated all the test images for carious lesion within the90 proximal surfaces. With the histological examinationserving as the reference standard, observer performanceswere evaluated by receiver operating characteristic (ROC)curves. The areas under the ROC curves were analyzedwith two-way analysis of variance. No significant differ-ences were found among the CBCT images and betweenCBCT and digital images when only proximal enamelcaries was detected (p=0.989). With respect to the detectionof proximal dentinal caries, significant difference wasfound between CBCT and digital images (p<0.001) butnot among CBCT images. The spatial resolution did nothave an impact on the detection accuracy of proximal cariesin flat panel CBCT images. The flat panel CBCT images
scanned with high spatial resolution did not improve thedetection accuracy of proximal enamel caries compared todigital intraoral images. CBCT images scanned with highspatial resolutions could not be used for proximal cariesdetection.
Keywords Digital intraoral radiography . Cone beamcomputerized tomography . Spatial resolution . Proximalcaries . Detection accuracy
Introduction
It is widely accepted that radiography is a vital adjunct forthe diagnosis of caries [1]. The rapid development oftechnology has given birth to various digital dental imagingmodalities, including digital intraoral radiography and conebeam computerized tomography (CBCT) scanners. Mean-while, the widespread use of fluorides has delayedcavitation and made carious lesions difficult to detect [2].Therefore, it is imperative to identify the diagnosticaccuracy of various imaging modalities for an appropriatetreatment planning.
In the 1980s, digital imaging systems came into use indentistry. Compared with traditional film technology, digitalimaging systems have a number of advantages, such asadjustable images, avoidance of chemical processing, lowerdose, less working time and convenient communication,etc. [3]. CBCT, introduced into the dental office in 1990s,uses a 2D X-ray detector and a cone- or pyramid-shapedX-ray beam to reconstruct isotropic, high-spatial-resolution, 3D images [4]. CBCT has created a revolutionin maxillofacial imaging, facilitating the transition ofdental diagnosis from 2D to 3D images and expandingthe role of imaging from diagnosis to imaging guidance of
J.-G. Cheng : Z.-L. Zhang : Z.-Y. Zhang :X.-C. Ma :G. Li (*)Department of Oral and Maxillofacial Radiology,Peking University School and Hospital of Stomatology,#22 Zhongguancun Nandajie, Hai Dian District,100081 Beijing, Chinae-mail: [email protected]
X.-Y. WangDepartment of Operative Dentistry and Endodontics,Peking University School and Hospital of Stomatology,100081 Beijing, China
Clin Oral Invest (2012) 16:1015–1021DOI 10.1007/s00784-011-0599-7
operative and surgical procedures by application of third-party software.
Nowadays, CBCT scanners are available that can givethe user a choice between high and low spatial resolutionsettings when scanning a patient. In theory, the higher thenumber of the spatial resolution used for scanning, thesmaller the radiographic details which can be observed inthe resultant images [5]. However, one study indicates thatthe resolution did not have an impact on the detection ofdental caries, neither proximal nor occlusal caries [6]. Inthis study, the NewTom 3 G was used to scan the extracthuman permanent teeth with three different resolutionsettings (FOV 12 in, 0.36 mm; FOV 9 in, 0.25 mm; FOV6 in, 0.16 mm). The NewTom 3 G employed a detectorusing a configuration of scintillation screens, imageintensifiers (II) and charge-coupled device (CCD) sensors.
Most of nowadays CBCT scanners, however, use a typeof flat panel detector composed of Amorphous Silicon orCMOS (complementary metal–oxide semiconductor). Theflat panel detector is believed to provide a greater dynamicrange and greater performance than the II/CCD technology,which may create geometric distortion [4]. In the search ofliterature, we did not find one study exclusively evaluatingthe resolution impact on the proximal caries detection witha CBCT scanner using a flat panel detector. Therefore, theaims of the present study were: (1) to evaluate the detectionaccuracy of proximal caries in flat panel CBCT imagesscanned with different resolutions; (2) to assess whether thespatial resolutions have an impact on the detection accuracyof proximal caries in flat panel CBCT images; (3) to assesswhether the detection accuracy of proximal caries can beimproved by flat panel CBCT images scanned with highspatial resolution when compared with digital intraoralradiographs.
Materials and methods
Teeth
After preliminary visual examination, 45 non-restoredhuman permanent premolars and molars were employedin the present study. Of the 90 proximal surfaces, sixsurfaces had obvious cavities. The clinical appearance ofthe remaining tooth surfaces ranged from sound to chalkyor brown discolored after cleaning.
The teeth, four or five as a group, were mounted in 11plaster blocks. When mounting, it was ensured that theprominent part of the proximal surfaces were in contact andat the same vertical level, simulating the normal anatomicalposition.
The 11 tooth blocks were then numbered and storedseparately in 10% neutral buffered formalin solution.
Test images
CBCT images of the 11-block samples were acquired withtwo CBCT scanners: ProMax 3D (Planmeca Oy, Helsinki,Finland) and DCT Pro (VATECH, Co., Ltd., Yongin-Si,South Korea). Both scanners are flat panel type composedof CMOS. The ProMax 3D provided three resolutionsettings: low, normal and high resolutions, while the DCTPro gave two resolution settings that were normal and high.To simulate soft tissue, a 20-mm-thick water phantom wasplaced around the blocks during exposure. The CBCTimages were subsequently reconstructed with the proprie-tary software of each system.
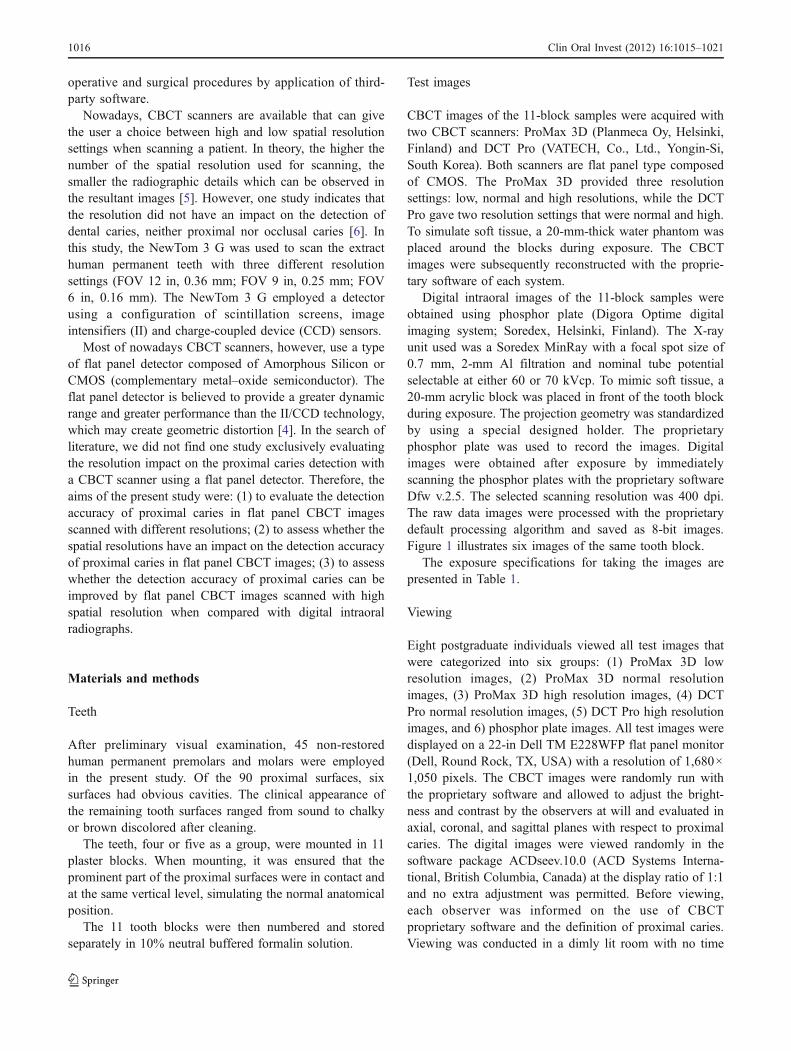
Digital intraoral images of the 11-block samples wereobtained using phosphor plate (Digora Optime digitalimaging system; Soredex, Helsinki, Finland). The X-rayunit used was a Soredex MinRay with a focal spot size of0.7 mm, 2-mm Al filtration and nominal tube potentialselectable at either 60 or 70 kVcp. To mimic soft tissue, a20-mm acrylic block was placed in front of the tooth blockduring exposure. The projection geometry was standardizedby using a special designed holder. The proprietaryphosphor plate was used to record the images. Digitalimages were obtained after exposure by immediatelyscanning the phosphor plates with the proprietary softwareDfw v.2.5. The selected scanning resolution was 400 dpi.The raw data images were processed with the proprietarydefault processing algorithm and saved as 8-bit images.Figure 1 illustrates six images of the same tooth block.
The exposure specifications for taking the images arepresented in Table 1.
Viewing
Eight postgraduate individuals viewed all test images thatwere categorized into six groups: (1) ProMax 3D lowresolution images, (2) ProMax 3D normal resolutionimages, (3) ProMax 3D high resolution images, (4) DCTPro normal resolution images, (5) DCT Pro high resolutionimages, and 6) phosphor plate images. All test images weredisplayed on a 22-in Dell TM E228WFP flat panel monitor(Dell, Round Rock, TX, USA) with a resolution of 1,680×1,050 pixels. The CBCT images were randomly run withthe proprietary software and allowed to adjust the bright-ness and contrast by the observers at will and evaluated inaxial, coronal, and sagittal planes with respect to proximalcaries. The digital images were viewed randomly in thesoftware package ACDseev.10.0 (ACD Systems Interna-tional, British Columbia, Canada) at the display ratio of 1:1and no extra adjustment was permitted. Before viewing,each observer was informed on the use of CBCTproprietary software and the definition of proximal caries.Viewing was conducted in a dimly lit room with no time
1016 Clin Oral Invest (2012) 16:1015–1021
restrictions. Each observer evaluated only one group of thetest images at a time. There was at least 1-week intervalbetween the adjacent evaluations of two groups. Toinvestigate the intra-observer agreement, each observerreassessed all images 2 weeks later.
The observers used the following 5-point rank scale torecord their level of confidence with regard to the absenceor presence of proximal carious lesion: 1=definitely nocaries, 2=probably no caries, 3=questionable, 4=probablycaries, 5=definitely caries.
Histological validation
The tooth crowns of the 45 teeth were sectioned perpendicu-larly to the long axis of the tooth at a position a little bit lowerthan the enamel–cemental junction. After cleaning and drying,the 45 tooth crownswere individually embedded in polyacrylicresin. Each polyarcylic resin blockwas then sectioned (700μmthick per slice) serially and mesiodistally in parallel with thelong axis of the tooth crowns using Leica SP1600 sawmicrotome(Leica Microsystems GmbH, Wetzlar, Germany)with a 300-μm diamond saw blade.
The tooth slices were observed with a 16× magnifyingstereomicroscope ZOOM-630E (Changfang Optical Instru-ment Ltd., Shanghai, China) by two investigators, whowere calibrated before evaluation. Proximal carious lesionwas defined as chalky white demineralization or brownishdiscoloration in the proximal surface. The following 6-pointscale was used for histological stratification of the sites: 0=sound, 1=caries in the outer half of the enamel, 2=caries inthe inner half of the enamel, 3=caries having reached butnot crossed the enamel–dentinal junction (EDJ), 4=cariesin the outer half of the dentine, 5=caries in the inner half ofthe dentine or into the pulp. The highest score from thevarious slices was considered as the true status of theassessed proximal surface. In case that two observers’ratings were not the same, they performed a jointassessment to reach a consensus.
Data analysis
With the histological examination as reference standard,each observer’s performance was converted into a receiveroperating characteristic (ROC) curve with SPSS v.16.0 for
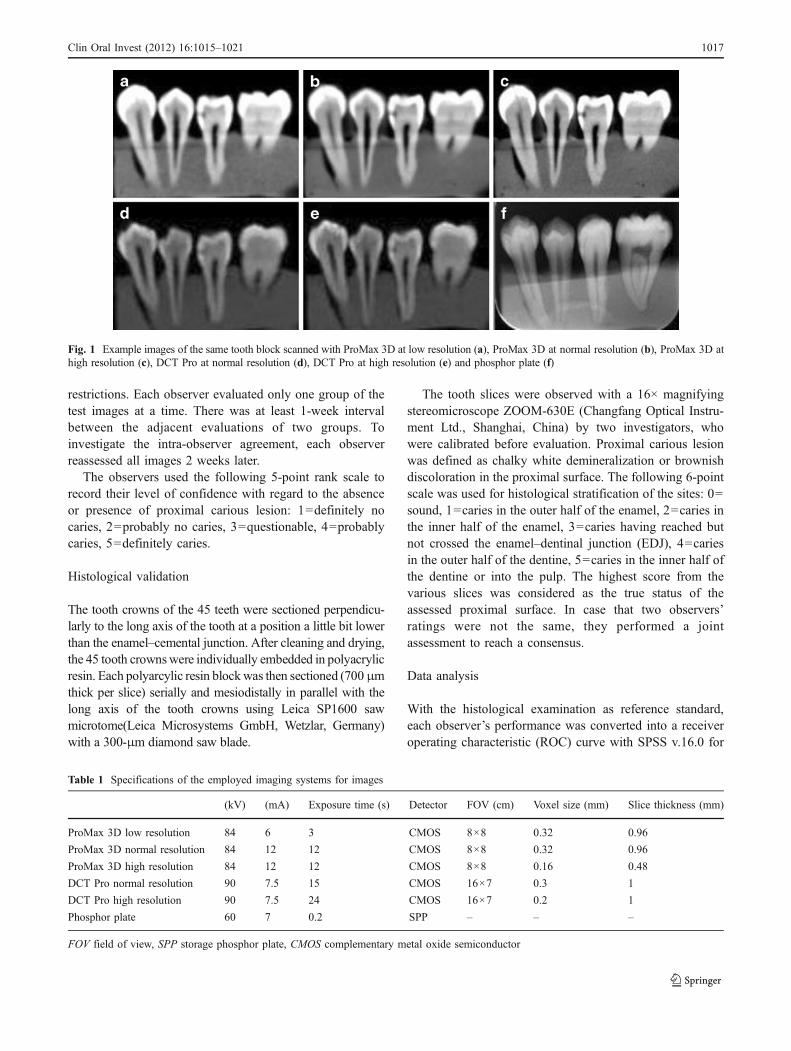
Table 1 Specifications of the employed imaging systems for images
(kV) (mA) Exposure time (s) Detector FOV (cm) Voxel size (mm) Slice thickness (mm)
ProMax 3D low resolution 84 6 3 CMOS 8×8 0.32 0.96
ProMax 3D normal resolution 84 12 12 CMOS 8×8 0.32 0.96
ProMax 3D high resolution 84 12 12 CMOS 8×8 0.16 0.48
DCT Pro normal resolution 90 7.5 15 CMOS 16×7 0.3 1
DCT Pro high resolution 90 7.5 24 CMOS 16×7 0.2 1
Phosphor plate 60 7 0.2 SPP – – –
FOV field of view, SPP storage phosphor plate, CMOS complementary metal oxide semiconductor
Fig. 1 Example images of the same tooth block scanned with ProMax 3D at low resolution (a), ProMax 3D at normal resolution (b), ProMax 3D athigh resolution (c), DCT Pro at normal resolution (d), DCT Pro at high resolution (e) and phosphor plate (f)
Clin Oral Invest (2012) 16:1015–1021 1017
Windows (SPSS, Chicago, IL, USA). The maximumlikelihood parameters were determined and the areas underthe ROC curves (AZ values) were calculated. To probe intowhether carious depth affects the observer’s performance,enamel caries and dentine caries were analyzed separately.
Two-way analysis of variance was used to analyze the AZ
values for the differences among imaging modalities andobservers. Intra-observer variation was analyzed with thepaired t test. Differences were considered to be statisticallysignificant when p<0.05.
Results
Histological examination revealed that of the 90 proximalsurfaces, 58(64.4%) were sound, 12(13.3%) had caries inthe outer half of the enamel, 3(3.3%) had caries in the innerhalf of the enamel, three (3.3%) had caries having reachedbut not crossed the EDJ, 5(5.6%) had caries in the outerhalf of the dentine, nine (10.0%) had caries in the inner halfof the dentine or into the pulp. Thus, a total of 32 proximalsurfaces (35.6%) were considered to be positive for carieswhen performing the ROC analysis. Supposing that carieshaving reached but not crossed the EDJ were defined as
enamel caries, there would be 18 enamel caries (20.0%) and14 dentine caries (15.6%).
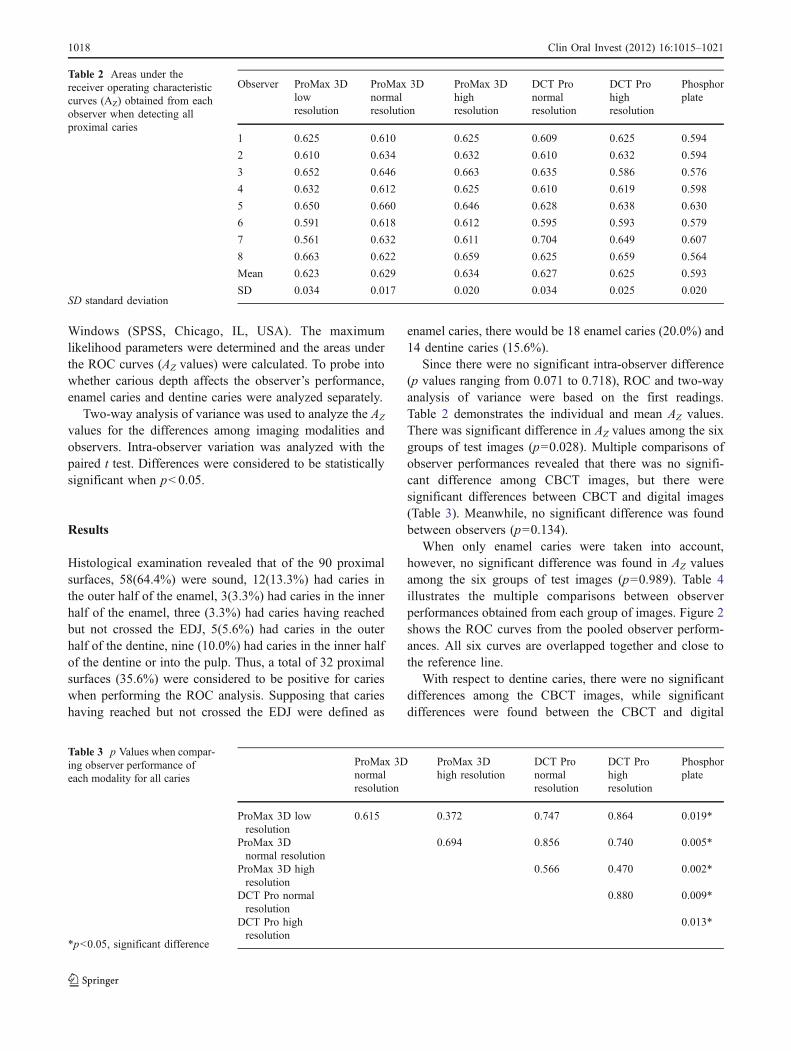
Since there were no significant intra-observer difference(p values ranging from 0.071 to 0.718), ROC and two-wayanalysis of variance were based on the first readings.Table 2 demonstrates the individual and mean AZ values.There was significant difference in AZ values among the sixgroups of test images (p=0.028). Multiple comparisons ofobserver performances revealed that there was no signifi-cant difference among CBCT images, but there weresignificant differences between CBCT and digital images(Table 3). Meanwhile, no significant difference was foundbetween observers (p=0.134).
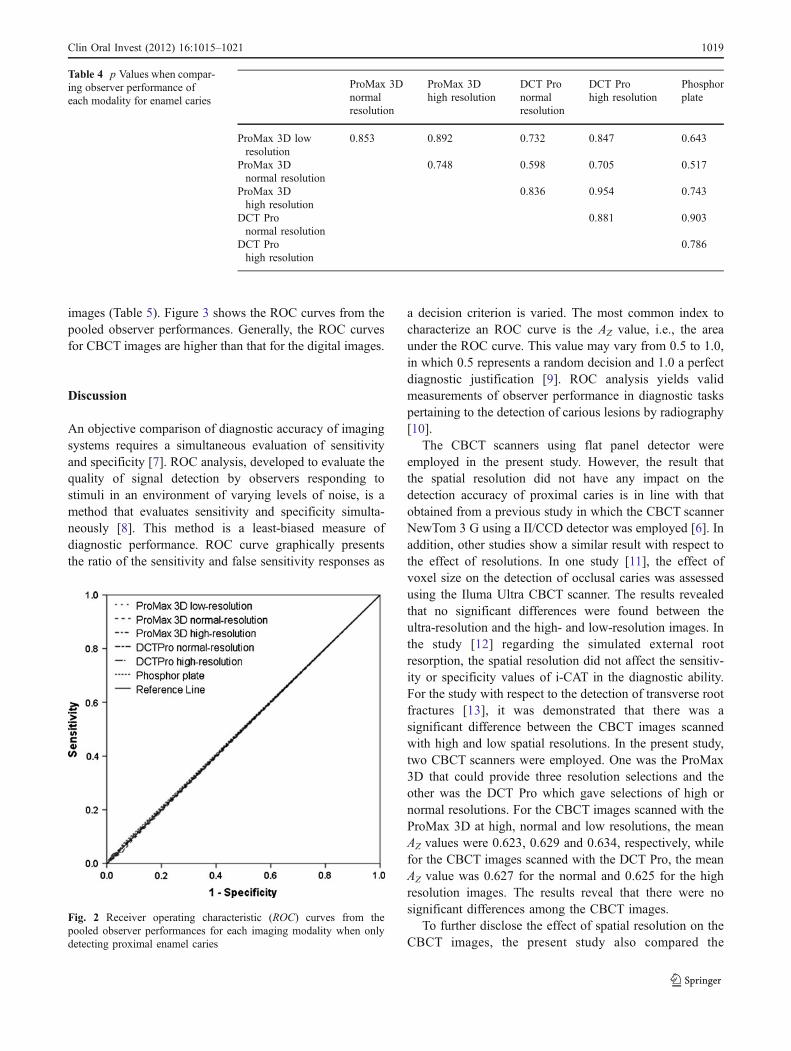
When only enamel caries were taken into account,however, no significant difference was found in AZ valuesamong the six groups of test images (p=0.989). Table 4illustrates the multiple comparisons between observerperformances obtained from each group of images. Figure 2shows the ROC curves from the pooled observer perform-ances. All six curves are overlapped together and close tothe reference line.
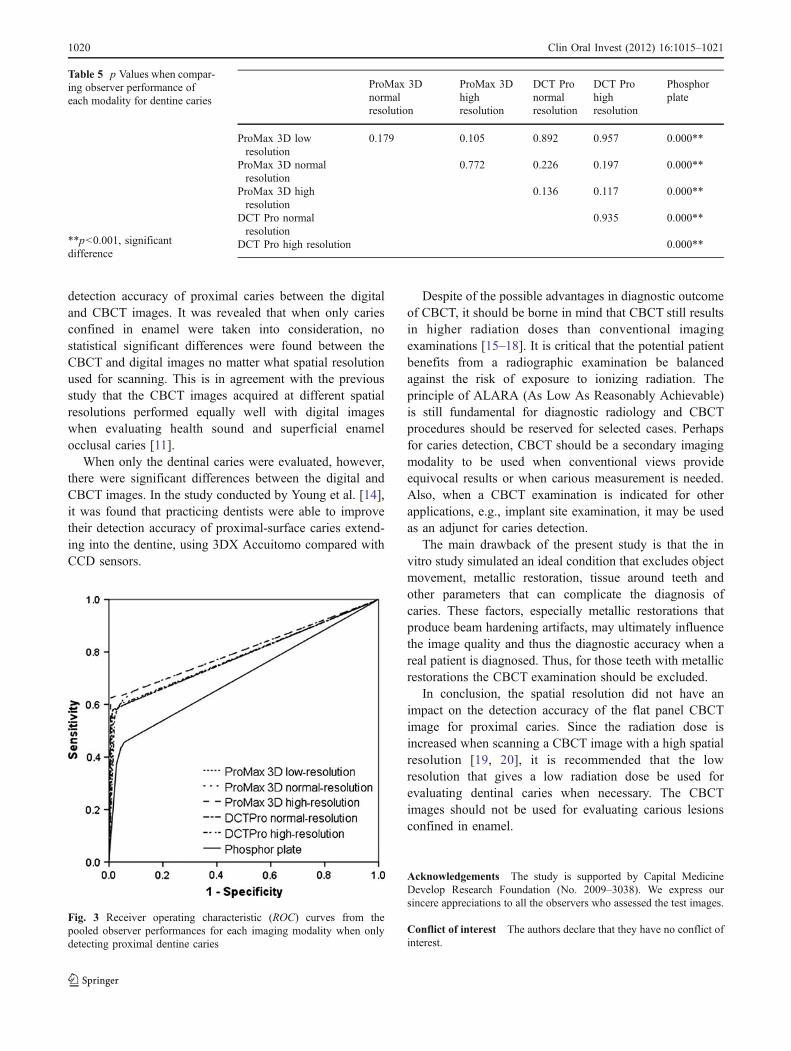
With respect to dentine caries, there were no significantdifferences among the CBCT images, while significantdifferences were found between the CBCT and digital
Observer ProMax 3Dlowresolution
ProMax 3Dnormalresolution
ProMax 3Dhighresolution
DCT Pronormalresolution
DCT Prohighresolution
Phosphorplate
1 0.625 0.610 0.625 0.609 0.625 0.594
2 0.610 0.634 0.632 0.610 0.632 0.594
3 0.652 0.646 0.663 0.635 0.586 0.576
4 0.632 0.612 0.625 0.610 0.619 0.598
5 0.650 0.660 0.646 0.628 0.638 0.630
6 0.591 0.618 0.612 0.595 0.593 0.579
7 0.561 0.632 0.611 0.704 0.649 0.607
8 0.663 0.622 0.659 0.625 0.659 0.564
Mean 0.623 0.629 0.634 0.627 0.625 0.593
SD 0.034 0.017 0.020 0.034 0.025 0.020
Table 2 Areas under thereceiver operating characteristiccurves (AZ) obtained from eachobserver when detecting allproximal caries
SD standard deviation
ProMax 3Dnormalresolution
ProMax 3Dhigh resolution
DCT Pronormalresolution
DCT Prohighresolution
Phosphorplate
ProMax 3D lowresolution
0.615 0.372 0.747 0.864 0.019*
ProMax 3Dnormal resolution
0.694 0.856 0.740 0.005*
ProMax 3D highresolution
0.566 0.470 0.002*
DCT Pro normalresolution
0.880 0.009*
DCT Pro highresolution
0.013*
Table 3 p Values when compar-ing observer performance ofeach modality for all caries
*p<0.05, significant difference
1018 Clin Oral Invest (2012) 16:1015–1021
images (Table 5). Figure 3 shows the ROC curves from thepooled observer performances. Generally, the ROC curvesfor CBCT images are higher than that for the digital images.
Discussion
An objective comparison of diagnostic accuracy of imagingsystems requires a simultaneous evaluation of sensitivityand specificity [7]. ROC analysis, developed to evaluate thequality of signal detection by observers responding tostimuli in an environment of varying levels of noise, is amethod that evaluates sensitivity and specificity simulta-neously [8]. This method is a least-biased measure ofdiagnostic performance. ROC curve graphically presentsthe ratio of the sensitivity and false sensitivity responses as
a decision criterion is varied. The most common index tocharacterize an ROC curve is the AZ value, i.e., the areaunder the ROC curve. This value may vary from 0.5 to 1.0,in which 0.5 represents a random decision and 1.0 a perfectdiagnostic justification [9]. ROC analysis yields validmeasurements of observer performance in diagnostic taskspertaining to the detection of carious lesions by radiography[10].
The CBCT scanners using flat panel detector wereemployed in the present study. However, the result thatthe spatial resolution did not have any impact on thedetection accuracy of proximal caries is in line with thatobtained from a previous study in which the CBCT scannerNewTom 3 G using a II/CCD detector was employed [6]. Inaddition, other studies show a similar result with respect tothe effect of resolutions. In one study [11], the effect ofvoxel size on the detection of occlusal caries was assessedusing the Iluma Ultra CBCT scanner. The results revealedthat no significant differences were found between theultra-resolution and the high- and low-resolution images. Inthe study [12] regarding the simulated external rootresorption, the spatial resolution did not affect the sensitiv-ity or specificity values of i-CAT in the diagnostic ability.For the study with respect to the detection of transverse rootfractures [13], it was demonstrated that there was asignificant difference between the CBCT images scannedwith high and low spatial resolutions. In the present study,two CBCT scanners were employed. One was the ProMax3D that could provide three resolution selections and theother was the DCT Pro which gave selections of high ornormal resolutions. For the CBCT images scanned with theProMax 3D at high, normal and low resolutions, the meanAZ values were 0.623, 0.629 and 0.634, respectively, whilefor the CBCT images scanned with the DCT Pro, the meanAZ value was 0.627 for the normal and 0.625 for the highresolution images. The results reveal that there were nosignificant differences among the CBCT images.
To further disclose the effect of spatial resolution on theCBCT images, the present study also compared the
ProMax 3Dnormalresolution
ProMax 3Dhigh resolution
DCT Pronormalresolution
DCT Prohigh resolution
Phosphorplate
ProMax 3D lowresolution
0.853 0.892 0.732 0.847 0.643
ProMax 3Dnormal resolution
0.748 0.598 0.705 0.517
ProMax 3Dhigh resolution
0.836 0.954 0.743
DCT Pronormal resolution
0.881 0.903
DCT Prohigh resolution
0.786
Table 4 p Values when compar-ing observer performance ofeach modality for enamel caries
Fig. 2 Receiver operating characteristic (ROC) curves from thepooled observer performances for each imaging modality when onlydetecting proximal enamel caries
Clin Oral Invest (2012) 16:1015–1021 1019
detection accuracy of proximal caries between the digitaland CBCT images. It was revealed that when only cariesconfined in enamel were taken into consideration, nostatistical significant differences were found between theCBCT and digital images no matter what spatial resolutionused for scanning. This is in agreement with the previousstudy that the CBCT images acquired at different spatialresolutions performed equally well with digital imageswhen evaluating health sound and superficial enamelocclusal caries [11].
When only the dentinal caries were evaluated, however,there were significant differences between the digital andCBCT images. In the study conducted by Young et al. [14],it was found that practicing dentists were able to improvetheir detection accuracy of proximal-surface caries extend-ing into the dentine, using 3DX Accuitomo compared withCCD sensors.
Despite of the possible advantages in diagnostic outcomeof CBCT, it should be borne in mind that CBCT still resultsin higher radiation doses than conventional imagingexaminations [15–18]. It is critical that the potential patientbenefits from a radiographic examination be balancedagainst the risk of exposure to ionizing radiation. Theprinciple of ALARA (As Low As Reasonably Achievable)is still fundamental for diagnostic radiology and CBCTprocedures should be reserved for selected cases. Perhapsfor caries detection, CBCT should be a secondary imagingmodality to be used when conventional views provideequivocal results or when carious measurement is needed.Also, when a CBCT examination is indicated for otherapplications, e.g., implant site examination, it may be usedas an adjunct for caries detection.
The main drawback of the present study is that the invitro study simulated an ideal condition that excludes objectmovement, metallic restoration, tissue around teeth andother parameters that can complicate the diagnosis ofcaries. These factors, especially metallic restorations thatproduce beam hardening artifacts, may ultimately influencethe image quality and thus the diagnostic accuracy when areal patient is diagnosed. Thus, for those teeth with metallicrestorations the CBCT examination should be excluded.
In conclusion, the spatial resolution did not have animpact on the detection accuracy of the flat panel CBCTimage for proximal caries. Since the radiation dose isincreased when scanning a CBCT image with a high spatialresolution [19, 20], it is recommended that the lowresolution that gives a low radiation dose be used forevaluating dentinal caries when necessary. The CBCTimages should not be used for evaluating carious lesionsconfined in enamel.
Acknowledgements The study is supported by Capital MedicineDevelop Research Foundation (No. 2009–3038). We express oursincere appreciations to all the observers who assessed the test images.
Conflict of interest The authors declare that they have no conflict ofinterest.
Fig. 3 Receiver operating characteristic (ROC) curves from thepooled observer performances for each imaging modality when onlydetecting proximal dentine caries
ProMax 3Dnormalresolution
ProMax 3Dhighresolution
DCT Pronormalresolution
DCT Prohighresolution
Phosphorplate
ProMax 3D lowresolution
0.179 0.105 0.892 0.957 0.000**
ProMax 3D normalresolution
0.772 0.226 0.197 0.000**
ProMax 3D highresolution
0.136 0.117 0.000**
DCT Pro normalresolution
0.935 0.000**
DCT Pro high resolution 0.000**
Table 5 p Values when compar-ing observer performance ofeach modality for dentine caries
**p<0.001, significantdifference
1020 Clin Oral Invest (2012) 16:1015–1021
References
1. Stookey GK, Jackson RD, Zandona AG, Analoui M (1999)Dental caries diagnosis. Dent Clin North Am 43:665–677
2. Robinson C (2009) Fluoride and the caries lesion: interactions andmechanism of action. Eur Arch Paediatr Dent 10:136–140
3. Wenzel A (1998) Digital radiography and caries diagnosis.Dentomaxillofac Radiol 27:3–11
4. Scarfe WC, Farman AG (2008) What is cone-beam CT and howdoes it work. Dent Clin North Am 52:707–730
5. Ludlow JB, Mol A (2009) Digital imaging. In: White SC, PharoahMJ (eds) Oral radiology: principle and interpretation, 6th edn.Mosby, Inc., Maryland Heights, pp 83–84
6. Haiter-Neto F, Wenzel A, Gotfredsen E (2008) Diagnosticaccuracy of cone beam computed tomography scans comparedwith intraoral image modalities for detection of caries lesions.Dentomaxillofac Radiol 37:18–22
7. Berkey CS, Douglass CW, Valachovic RW, Chauncey HH, McNeilBJ (1990) Statistical methods for comparing dental diagnosticprocedures. Community Dent Oral Epidemiol 18:169–176
8. Obuchowski NA (2003) Receiver operating characteristic curvesand their use in radiology. Radiology 229:3–8
9. Sanderink GC, Huiskens R, van der Stelt PF, Welander US, StheemanSE (1994) Image quality of direct digital intraoral x-ray sensors inassessing root canal length. The RadioVisioGraphy, Visualix/VIXA,Sens-A-Ray, and Flash Dent systems compared with Ektaspeedfilms. Oral Surg Oral Med Oral Pathol 78:125–132
10. Verdonschot EH, Wenzel A, Bronkhorst EM (1993) Applicability ofReceiver Operating Characteristic (ROC) analysis on discrete cariesdepth ratings. Community Dent Oral Epidemiol 21:269–272
11. Kamburoglu K, Murat S, Yuksel SP, Cebeci ARI, Paksoy CS(2010) Occlusal caries detection by using a cone-beam CT withdifferent voxel resolutions and a digital intraoral sensor. Oral SurgOral Med Oral Pathol Oral Radiol Endod 109:e63–e69
12. Liedke GS, Da Silveira HE, Da Silveira HL, Dutra V, DeFigueiredo JA (2009) Influence of voxel size in the diagnostic
ability of cone beam tomography to evaluate simulated externalroot resorption. J Endod 35:233–235
13. Wenzel A, Haiter-Neto F, Frydenberg M, Kirkevang LL (2009)Variable-resolution cone-beam computerized tomography withenhancement filtration compared with intraoral photostimulablephosphor radiography in detection of transverse root fractures inan in vitro model. Oral Surg Oral Med Oral Pathol Oral RadiolEndod 108:939–945
14. Young SM, Lee JT, Hodges RJ, Chang TL, Elashoff DA,White SC (2009) A comparative study of high-resolutioncone beam computed tomography and charge-coupled devicesensors for detecting caries. Dentomaxillofac Radiol 38:445–451
15. Danforth RA, Clark DE (2000) Effective dose from radiationabsorbed during a panoramic examination with a new generationmachine. Oral Surg Oral Med Oral Pathol Oral Radiol Endod89:236–243
16. Ludlow JB, Davies-Ludlow LE, Brooks SL (2003) Dosimetry oftwo extraoral direct digital imaging devices: NewTom cone beamCT and Orthophos Plus DS panoramic unit. DentomaxillofacRadiol 32:229–234
17. Ludlow JB, Davies-Ludlow LE, Brooks SL, Howerton WB(2006) Dosimetry of 3 CBCT devices for oral and maxillofacialradiology: CB Mercuray, NewTom 3 G and i-CAT. Dentomax-illofac Radiol 35:219–226
18. Ludlow JB, Davies-Ludlow LE, White SC (2008) Patient riskrelated to common dental radiographic examinations: the impactof 2007 International Commission on Radiological Protectionrecommendations regarding dose calculation. J Am Dent Assoc139:1237–1243
19. Pauwels R, Beinsberger J, Collaert B et al (2010) Effective doserange for dental cone beam computed tomography scanners. Eur JRadiol. doi:10.1016/j.ejrad.2010.11.028
20. Qu XM, Li G, Ludlow JB, Zhang ZY, Ma XC (2010) Effectiveradiation dose of ProMax 3D cone-beam computerized tomogra-phy scanner with different protocols. Oral Surg Oral Med OralPathol Oral Radiol and Endod 110:770–776
Clin Oral Invest (2012) 16:1015–1021 1021