Embed Size (px)
Citation preview

RH: Skink Anomaly Zone
Detecting the anomaly zone in species trees and
evidence for a misleading signal in higher-level skink
phylogeny (Squamata: Scincidae).
Charles W. Linkem1, Vladimir N. Minin1,2, and Adam D. Leache1,3
1Department of Biology, University of Washington, Seattle, Washington, 98195, USA.
2Department of Statistics, University of Washington, Seattle, Washington, 98195, USA.
3Burke Museum of Natural History and Culture, University of Washington, Seattle, Washington,
98195, USA.
Corresponding author: Charles W. Linkem, Department of Biology, University of
Washington, Box 351800, Seattle, Washington, 98195-1800, USA; E-mail:
Abstract.—The anomaly zone, defined by the presence of gene tree topologies that are more
probable than the true species tree, presents a major challenge to the accurate resolution of
many parts of the Tree of Life. This discrepancy can result from consecutive rapid
speciation events in the species tree. Similar to the problem of long-branch attraction,
including more data via loci concatenation will only reinforce the support for the incorrect
species tree. Empirical phylogenetic studies often employ coalescent-based species tree
methods to avoid the anomaly zone, but to this point these studies have not had a method
© The Author(s) 2016. Published by Oxford University Press, on behalf of the Society of Systematic Biologists. All rights reserved. For Permissions, please email: [email protected]
Systematic Biology Advance Access published January 6, 2016 at U
niversity of Washington on M
arch 17, 2016http://sysbio.oxfordjournals.org/
Dow
nloaded from

for providing any direct evidence that the species tree is actually in the anomaly zone. In
this study, we use 16 species of lizards in the family Scincidae to investigate whether nodes
that are difficult to resolve place the species tree within the anomaly zone. We analyze new
phylogenomic data (429 loci), using both concatenation and coalescent-based species tree
estimation, to locate conflicting topological signal. We then use the unifying principle of
the anomaly zone, together with estimates of ancestral population sizes and species
persistence times, to determine whether the observed phylogenetic conflict is a result of the
anomaly zone. We identify at least three regions of the Scindidae phylogeny that provide
demographic signatures consistent with the anomaly zone, and this new information helps
reconcile the phylogenetic conflict in previously published studies on these lizards. The
anomaly zone presents a real problem in phylogenetics, and our new framework for
identifying anomalous relationships will help empiricists leverage their resources
appropriately for investigating and overcoming this challenge. (Keywords: anomalous gene
trees, IDBA, incomplete lineage sorting, phylogenetics, probes, sequence capture,
ultraconserved elements, UCE)
The field of phylogenetics is poised to benefit tremendously from genomics, since
resolving evolutionary relationships often requires massive amounts of data. Empirical
phylogenetic researchers foresaw genomic data as a holy grail for resolving difficult
relationships, such as rapid speciation events (Rokas et al. 2003; Dunn et al. 2008; Edwards
2009). However, phylogenetic conflict persists with genomic data, often with greater
support, generating more questions than answers for many studies (Song et al. 2012;
at University of W
ashington on March 17, 2016
http://sysbio.oxfordjournals.org/D
ownloaded from

Gatesy and Springer 2014; Springer and Gatesy 2014; Pyron et al. 2014; Zhang et al.
2014). In addition, reanalyses of previously published phylogenomic datasets often produce
conflicting results (Dunn et al. 2008; Philippe et al. 2009, 2011), suggesting that analytical
approach and model assumptions are critical to phylogenomic studies.
Processes such as horizontal gene transfer, gene duplication, and incomplete lineage
sorting can lead to differences between species trees and gene trees (Maddison 1997).
Species histories containing rapid diversification will have a high prevalence of incomplete
lineage sorting due to few generations between speciation events. Rapid diversification in
combination with a large effective population size can result in higher probabilities for gene
trees that do not match the species tree than for gene trees that do match. These
non-matching gene trees with high probability from incomplete lineage sorting are referred
to as anomalous gene trees (AGT), and the species tree branches that produce them are
considered to be in the anomaly zone (Degnan and Rosenberg 2006). When the
demographic history of the species tree is in the anomaly zone, sampling independent loci
from the genome will result in AGT topologies being recovered at higher frequency than
gene trees that match the species tree. Concatenation of these independent loci will result
in strong support for the AGT topology whereas analyses using a species tree approach
may recover the correct species tree (Kubatko and Degnan 2007; Liu and Edwards 2009).
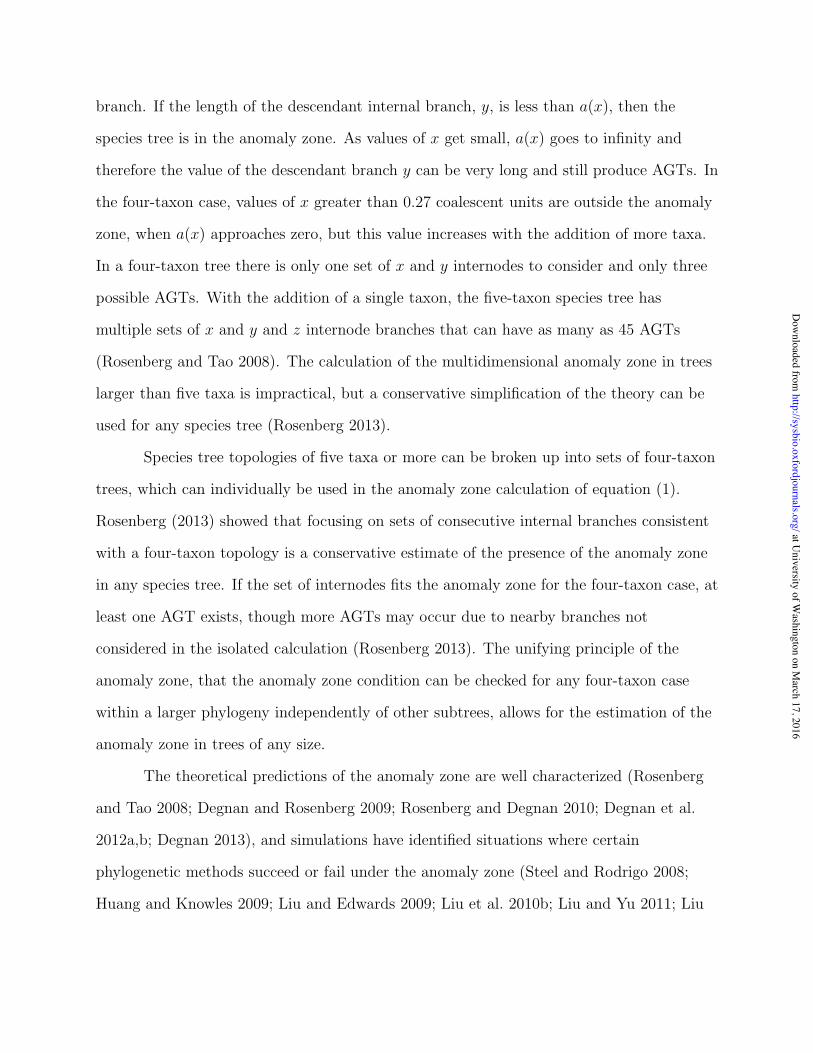
Coalescent theory characterizes the anomaly zone for a four-taxon tree (Degnan and
Rosenberg 2006) by showing that short internal branch lengths for an asymmetric topology
will result in high probability for a symmetric AGT (Figure 1). The boundary of the
anomaly zone a(x) in the four-taxon case is defined by the following equation:
a(x) = log
!
2
3+
3e2x − 2
18(e3x − e2x)
"
, (1)
where x is the length of the branch in the species tree that has a descendant internal
at University of W
ashington on March 17, 2016
http://sysbio.oxfordjournals.org/D
ownloaded from
branch. If the length of the descendant internal branch, y, is less than a(x), then the
species tree is in the anomaly zone. As values of x get small, a(x) goes to infinity and
therefore the value of the descendant branch y can be very long and still produce AGTs. In
the four-taxon case, values of x greater than 0.27 coalescent units are outside the anomaly
zone, when a(x) approaches zero, but this value increases with the addition of more taxa.
In a four-taxon tree there is only one set of x and y internodes to consider and only three
possible AGTs. With the addition of a single taxon, the five-taxon species tree has
multiple sets of x and y and z internode branches that can have as many as 45 AGTs
(Rosenberg and Tao 2008). The calculation of the multidimensional anomaly zone in trees
larger than five taxa is impractical, but a conservative simplification of the theory can be
used for any species tree (Rosenberg 2013).
Species tree topologies of five taxa or more can be broken up into sets of four-taxon
trees, which can individually be used in the anomaly zone calculation of equation (1).
Rosenberg (2013) showed that focusing on sets of consecutive internal branches consistent
with a four-taxon topology is a conservative estimate of the presence of the anomaly zone
in any species tree. If the set of internodes fits the anomaly zone for the four-taxon case, at
least one AGT exists, though more AGTs may occur due to nearby branches not
considered in the isolated calculation (Rosenberg 2013). The unifying principle of the
anomaly zone, that the anomaly zone condition can be checked for any four-taxon case
within a larger phylogeny independently of other subtrees, allows for the estimation of the
anomaly zone in trees of any size.
The theoretical predictions of the anomaly zone are well characterized (Rosenberg
and Tao 2008; Degnan and Rosenberg 2009; Rosenberg and Degnan 2010; Degnan et al.
2012a,b; Degnan 2013), and simulations have identified situations where certain
phylogenetic methods succeed or fail under the anomaly zone (Steel and Rodrigo 2008;
Huang and Knowles 2009; Liu and Edwards 2009; Liu et al. 2010b; Liu and Yu 2011; Liu
at University of W
ashington on March 17, 2016
http://sysbio.oxfordjournals.org/D
ownloaded from
et al. 2015). Empirical studies of genomic data have shown that incomplete lineage sorting
can be pervasive throughout the genome in rapidly speciating groups (Suh et al. 2015).
However, an empirical example of the anomaly zone has yet to be demonstrated. The lack
of empirical evidence for the anomaly zone has led to doubt about the influence of the
anomaly zone on real data (Huang and Knowles 2009; Tonini et al. 2015), and the utility of
coalescent methods for phylogenetic inference has been questioned (Gatesy and Springer
2014; Springer and Gatesy 2014). An investigation of the anomaly zone in an empirical
setting requires an accurate species tree topology and estimates for ancestral branch
lengths and population sizes, parameters that can be inferred accurately with hundreds of
loci. Until recently, obtaining loci at this magnitude was not feasible for most non-model
organisms, but new methods for obtaining large phylogenomic datasets are quickly
changing the scale and scope of phylogenetic studies (Faircloth et al. 2012; McCormack
et al. 2012; Song et al. 2012).
Here we present an empirical example of the anomaly zone in a diverse radiation of
lizards, the Scincidae. Using theoretical expectations, we define the set of species tree
branches expected to generate anomalous gene trees based on the multispecies coalescent,
and we apply these predictions to an empirical species tree. We use a new phylogenomic
dataset collected using sequence capture of ultraconserved elements (Faircloth et al. 2012)
and protein-coding genes (Wiens et al. 2012) to estimate the species tree, branch lengths,
and population sizes required for identifying the anomaly zone in an empirical phylogeny.
Scincidae
Scincidae is the largest family of lizards comprising >25% of all lizard species. This
globally distributed family of 1,583 species (Uetz 2015) can be found from deserts to rain
forests, across continents and on tiny Pacific islands (Greer 1970). This relatively ancient
group (80–110 ma; Mulcahy et al. (2012)) exhibits extreme variation in body-form
at University of W
ashington on March 17, 2016
http://sysbio.oxfordjournals.org/D
ownloaded from

evolution with repeated limb loss (Greer 1991; Skinner et al. 2008) and variation in
reproductive biology through multiple transitions to live birth (Blackburn 1982). The first
major division of higher-level skink taxonomy was largely based on skull morphology,
dividing the family into four subfamilies: Acontinae, Felyninae, Lygosominae, and
Scincinae (Greer 1970). Synapomorphies were defined for all but Scincinae, which was
described as possessing the “primitive” form from which the other forms evolved,
indicating Scincinae was not a natural group (Greer 1970). Molecular phylogenies have
largely supported the morphological hypotheses of Lygosominae and Acontinae monophyly
but have found Lygosominae and Feylininae nested within Scincinae (Whiting et al. 2003;
Brandley et al. 2005, 2012; Wiens et al. 2012; Pyron et al. 2013; Lambert et al. 2015). A
few molecular studies found paraphyly in Lygosominae (Whiting et al. 2003; Siler et al.
2011), though the majority of molecular phylogenies (Wiens et al. 2012; Pyron et al. 2013;
Reeder 2003; Pyron et al. 2013; Lambert et al. 2015) and a series of morphological
synapomorphies (Greer 1970, 1986) support the monophyly of this subfamily. Feylininae is
no longer considered a valid subfamily and the species within it are part of the broader
paraphyletic Scincinae (Whiting et al. 2003; Brandley et al. 2005). The relationships
among the major groups within Scincinae have remained difficult to decipher (Brandley
et al. 2005, 2012; Wiens et al. 2012; Pyron et al. 2013). Most studies have found Scincinae
to be paraphyletic with the genus Brachymeles sister to Lygosominae, but two recent
papers (Pyron et al. 2013; Lambert et al. 2015) found a monophyletic Scincinae.
Molecular phylogenies of skinks have sampled up to 44 genes for a few taxa (Wiens
et al. 2012; Lambert et al. 2015) or a few genes for up to 683 taxa (Pyron et al. 2013) but
still lack resolution or present strong conflict for many relationships. The deep branches
across this group are often found to be short when estimated from individual genes and
concatenated genes, indicating diversification may have been rapid in this group. Strong
support for different relationships from concatenated gene trees and coalescent species trees
at University of W
ashington on March 17, 2016
http://sysbio.oxfordjournals.org/D
ownloaded from
(Lambert et al. 2015) in combination with a history of rapid diversification indicate that
speciation history may fit the demographic parameters consistent with the anomaly zone.
Materials and Methods
Identification of the causes of gene tree—species tree conflict in empirical
phylogenies requires a large number of sampled genes on taxa that span difficult nodes (Liu
and Edwards 2009). To accomplish this, we use a sequence capture next-generation
sequencing approach to obtain 429 independent loci for all taxa of interest.
Taxon sampling
Sampling was focused on fifteen species of skinks that span the deep nodes in the Scincidae
tree where topological conflict is high. From Scincinae we include Brachymeles bonitae,
Chalcides ocellatus, Eurylepis taeniolatus, Mesoscincus manguae, Ophiomorus raithmai,
Plestiodon fasciatus, and Scincus scincus, which represent the broad diversity in this
difficult-to-resolve subfamily. These species have been used in prior studies of skink
relationships based on Sanger sequencing (Brandley et al. 2005, 2012; Pyron et al. 2013)
and have shown very short internode lengths and multiple alternative topologies suggesting
anomalous gene trees may be present. A single Acontinae sample, Typhlosaurus sp., is used
to represent this well-supported subfamily (Lamb et al. 2010). We include at least one
sample of four of the five groups in Lygosominae (missing Egernia group): Mabuya
unimarginata for the Mabuya group; Lygosoma brevicaudis for the Lygosoma group; Emoia
caeruleocauda for the Eugongylus group; and Lobulia elegans, Sphenomorphus tridigitus,
Sphenomorphus variegatus, and Tytthoscincus parvus for the Sphenomorphus group.
Previous studies (Honda et al. 2003; Reeder 2003; Skinner 2007; Skinner et al. 2011) have
shown variation in the relationships between the Lygosoma, Mabuya, and Eugongylus
at University of W
ashington on March 17, 2016
http://sysbio.oxfordjournals.org/D
ownloaded from

groups, some with short internode lengths. A single outgroup taxon, Xantusia vigils, was
chosen to root phylogenetic analyses.
Probe design, library preparation, sequencing, and data processing
We designed a unique set of sequence-capture probes targeting a combination of UCE loci
and loci used in squamate phylogenetics. The subset of UCE probes used are derived from
the Tetropods-UCE-5kv1 probe set (Faircloth et al. 2012) that most closely match the
Anolis genome (Alfoldi et al. 2011) and the Sceloporus occidentalis genome (Genomic
Resources Development Consortium et al. 2014). Additionally, we designed 120 bp probes
with 2x tiling (60 bp overlap) for the 44 genes used in the Squamate Tree of Life project
(Wiens et al. 2012). This resulted in a sequence capture probe set targeting 585 single copy
loci that can be used across squamates. Details of probe design and synthesis are available
in the Supplemental Materials.
Whole genomic DNA was broken through sonication using a Bioruptor Pico
(Diagenode Inc.) and prepared for sequencing using an Illumina Truseq Nano library
preparation kit. Libraries were pooled into sets of eight and hybridized to the RNA probes
using a MYBaits target enrichment kit (MYcroarray). Post-hybridized libraries were
quantified using qPCR (Applied Biosystems Inc.) and quality was assessed using an
Agilent TapeStation 2200 (Agilent Tech.). Samples were sequence at the QB3 facility at
UC Berkeley on an Illumina HiSeq2500 on a single lane 150 bp, paired-end rapid run.
Details of library preparation, sequence-capture hybridization, and sequencing are available
in the Supplemental Materials.
Sequence data were processed using Illumiprocessor v.2.0 (Faircloth 2013) and
Trimmomatic (Bolger et al. 2014) to remove low-quality reads, trim low-quality ends, and
remove adapter sequence. De novo assembly for each species was conducted with the
iterative de Bruijn graph short-read assembler IDBA (Peng et al. 2010) over a set of k-mer
at University of W
ashington on March 17, 2016
http://sysbio.oxfordjournals.org/D
ownloaded from

values from 50 to 90 with a step length of 10. We used Phyluce (Faircloth et al. 2012;
Faircloth 2014) to align species-specific contigs to the set of probes and create an SQL
database of contig-to-probe matches for each taxon. We queried this database to create the
datasets for the 429 loci that were sequenced across all taxa. Expanded details of data
processing are available in the Supplemental Materials. Datasets and analysis results are
available on Dryad (doi:10.5061/dryad.sf6s9). Sequences are available on Genbank
(KU343288–KU350151).
Model testing, gene trees, and concatenation analyses
We identified the models of substitution in the 95% credible set of the BIC for each locus
using jModelTest v2.1.5 (Guindon and Gascuel 2003; Darriba et al. 2012). The model
with the lowest BIC score was chosen as the preferred model (Supplemental Materials).
Each locus was evaluated for the number of parsimony-informative sites, number of
constant sites, and number of variable sites using PAUP* v.40b10 (Swofford
2003)(Supplemental Materials). A maximum likelihood phylogenetic analysis was
conducted on each locus using RAxML v7.2.8 (Stamatakis 2006) with 1000 rapid-bootstrap
replicates with the GTRGAMMA model.
All loci were concatenated into a single alignment for maximum-likelihood (RAxML)
and Bayesian analysis (ExaBayes) (Aberer et al. 2014). The concatenated data set was
partitioned by locus (429 partitions) for both analyses. The ML analysis was conducted
with the GTRGAMMA model with 1000 rapid-bootstrap replicates. ExaBayes analyses
were run with the GTRGAMMA model with branch lengths linked across partitions and a
parsimony starting tree with heated chains using different starting trees than the cold
chain. Four independent runs were conducted, each with four chains, sampling every 500
generations. ExaBayes runs continued until the termination condition of mean topological
difference less than 5% with at least 500,000 generations was met. Posterior distributions
at University of W
ashington on March 17, 2016
http://sysbio.oxfordjournals.org/D
ownloaded from

of trees were summarized with the consense script and posterior sample of parameters
were assessed with Tracer v1.5 (Rambaut and Drummond 2007) and combined with the
postProcParam script.
Species tree estimation
Due to the large number of genes sampled we limit our species tree estimation to a
summary statistic approach. Species tree accuracy in summary statistic approaches is
dependent on gene tree accuracy (Huang and Knowles 2009; Mirarab et al. 2014) since the
methods rely solely on the structure of the fully resolved gene trees. Loci with few
informative sites, often seen in NGS datasets, may not give strong support for all splits in
the gene trees. This can potentially bias the species tree estimate and analyses relying on
the species tree topology, such as the identification of the anomaly zone. We use the
maximum pseudo-likelihood estimation of species trees MP-EST v1.4 (Liu et al. 2010a)
because it can accurately estimate the species tree topology despite the anomaly zone and
in the presence of gene tree estimation error (Liu et al. 2010a). We accounted for gene tree
and species tree uncertainty by running MP-EST using each iteration of the 1000
maximum-likelihood bootstrap replicates from RAxML. We created 1000 new tree files
consisting of 429 trees, one bootstrap replicate of each locus. MP-EST was run on each of
these files and an extended majority-rule consensus (eMRC) tree of the resulting species
trees was calculated using sumtrees in Dendropy v4.0.3 (Sukumaran and Holder 2010).
The support values from this approach are a summary of bootstrap replicates from the
gene trees to account for error in gene tree estimates but should not be considered a true
bootstrap replicate of the species tree.
Identifying anomalous nodes
at University of W
ashington on March 17, 2016
http://sysbio.oxfordjournals.org/D
ownloaded from
We use the unifying principle of the anomaly zone (Rosenberg 2013) to determine which, if
any, parts of the Scincidae eMRC species tree topology should produce AGTs. This
procedure requires an estimate of internal branch lengths in coalescent units. We estimated
branch lengths using two different methods. First, we used the branch lengths estimated by
MP-EST, which jointly estimates internal branch lengths in coalescent units (based on
λ = 2τ/θ) while maximizing the pseudo-likelihood of the species topology given the set of
triplet topologies for each gene tree (Liu et al. 2010a, Equations: 6–8). Internal branches
estimated by MP-EST may be shorter than expected when gene tree error is high (Mirarab
et al. 2014), which may give an overestimation of internode pairs in the anomaly zone.
Second, we estimated branch lengths using BP&P v2.1b (Yang and Rannala 2010) with the
original sequence data for 429 loci and the eMRC topology from MP-EST. BP&P uses a fixed
species tree topology and the multispecies coalescent along with gene trees estimated using
the Jukes-Cantor model to estimate branch lengths (τ) and population sizes (θ) (Rannala
and Yang 2003; Burgess and Yang 2008). A gamma prior on θ (α = 2.0, β = 200) with a
mean of 0.01 was used for population size estimates on nodes. A gamma prior on τ (α =
4.0, β = 10.0) was used for the root node height with other times generated from the
Dirichlet distribution (Yang and Rannala 2010). Rate variation between loci was
accommodated with the random-rates model (Burgess and Yang 2008), in which the
average rate for all loci is fixed at 1 and the rates among loci are generated from a Dirichlet
distribution. We used an α of 2.0 for moderate variation among loci. The MCMC chain
was run for 100,000 samples, sampling every 10 generations for a total of 1,000,000 sampled
states with a burnin of 150,000 states. Three independent analyses were conducted to
verify convergence on a stable posterior. BP&P results were converted to coalescent units
(λ = 2τ/θ) consistent with those calculated by MP-EST.
Each pair of parent–child internodes were compared to the anomaly zone based on
values of λ calculated from BP&P and MP-EST. The value for the parent nodes (x-nodes)
at University of W
ashington on March 17, 2016
http://sysbio.oxfordjournals.org/D
ownloaded from
were put into equation (1) for the limit of the anomaly zone in a four-taxon asymmetric
tree to determine if they are inside the zone and would therefore produce anomalous gene
trees. If the value of the child (y-node) is less than a(x), the pair of internodes are in the
anomaly zone and AGTs are expected. This calculation was first conducted on the median
values of branch lengths from the eMRC tree of the MP-EST species tree replicates and the
median values of τ and θ from the eMRC tree of the BP&P posterior distribution.
Additionally, for the MP-EST bootstrap replicates, anomaly zone calculations were done for
each internode pair for each species tree bootstrap replicate, accounting for topological
error in estimates of branch lengths. For BP&P, 1000 random draws of joint values of τ and
θ for the internode pairs were made from the posterior distribution and compared to the
anomaly zone. The BP&P analysis is only performed on the eMRC topology. Scripts
(https://github.com/cwlinkem/anomaly zone) to perform these functions relied on the
Dendropy package (Sukumaran and Holder 2010). We report the proportion of bootstrap
replicates that match the eMRC tree and are in the anomaly zone with MP-EST and the
proportion of the 1000 draws from BP&P posterior distribution that are in the anomaly zone.
Results
Genomic data and assemblies
All samples were successfully sequenced at sufficient levels to result in high coverage of
target loci. Some samples represented a larger portion of the sequencing (Table 1)
potentially due to unequal pooling prior to hybridization. Raw reads averaged 9.8 million
(range 5.4–21.6) reads per species with most reads being of high quality, resulting in a low
rate of trimming and removal. Sequencing resulted in higher coverage than needed for the
sequence capture approach due to using 24 samples on the sequencing lane instead of the
at University of W
ashington on March 17, 2016
http://sysbio.oxfordjournals.org/D
ownloaded from

full potential of 96 samples. The added sequence coverage resulted in a higher proportion
of off-target sequencing than would be expected, including complete mitochondrial
genomes for many taxa. Results from other experiments have shown that off-target
sequencing is reduced when more samples are included in the sequencing lane without a
loss of target sequence coverage (unpublished data).
The number of contigs found for IDBA for each individual is large, averaging over
49,000 (range 18,850–155,978) contigs across the 16 species. The IDBA assemblies match
most of the 585 loci targeted. Datasets were assembled for complete taxon sampling for all
loci. IDBA assemblies resulted in 429 loci across all taxa. Of the 44 loci used in previous
squamate systematics studies, only two loci were present in IDBA assemblies for all species.
Loci informativeness and model choice
The 429 loci from the IDBA assembly totals 276,480 nucleotide positions with 5.28 %
missing data and an average length of 644 base pairs (range 338–1070). Individual loci vary
in character variability with an average of 6% parsimony-informative sites (range 0–15%)
and 18% variable sites (range 1–48%). Most loci have a best-fit model matching HKY or
K80 (400 out of 429) suggesting a prevalence of transition/transversion bias in these
genomic loci (Table 2). Model testing shows a preference for either a gamma or
invariant-sites model (376 out 429) but the combination is rarely preferred (38 out of 429).
Only 18 loci have a preferred model that does not accommodate among-site rate
heterogeneity (Table 2).
Gene trees
Maximum Likelihood searches for individual loci resulted in 429 unique topologies,
one for each locus. These topologies also differ from the concatenation ML tree and the
at University of W
ashington on March 17, 2016
http://sysbio.oxfordjournals.org/D
ownloaded from

species tree. Bootstrap replicates average 925 (range 163–1000) unique topologies out of
the 1000 replicates indicating that gene tree resolution is low for most individual loci.
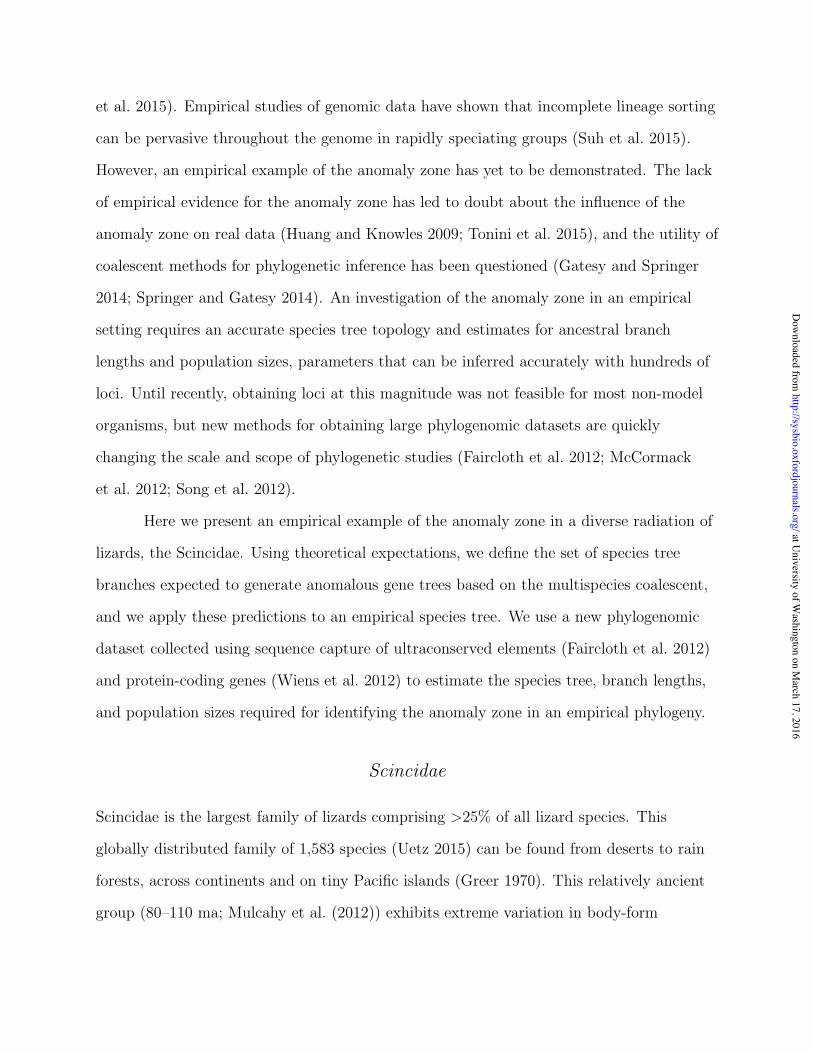
Concatenated gene trees are largely congruent between the ML and Bayesian runs
(Figure 2). Acontinae is sister to all other taxa with strong support (100 bootstrap and 100
posterior probability). Lygosominae is monophyletic and the Sphenomorphus group is
sister to the clade of the Mabuya, Lygosoma, and Eugongylus groups. The Eugongylus
group is sister to the Lygosoma group. All of these relationships have strong support in
both analyses. There is also strong support for Brachymeles to be sister to Lygosominae,
making Scincinae paraphyletic. The only topological difference between the two analyses is
the placement of Ophiomorus. In the ML analysis Ophiomorus is sister to the other genera
in Scincinae (minus Brachymeles) with a bootstrap score of 51, whereas in the Bayesian
analysis Ophiomorus is sister to all Scincinae and Lygosominae with a posterior probability
of 71. In both cases the support for the placement of Ophiomorus is low despite the large
amount of data used in these analyses.
Species trees
There were 110 unique species tree topologies found across the replicate species
trees. The MP-EST eMRC species tree is 100% consistent for many relationships (Figure 2c),
but some key relationships vary among species tree replicates and differ from the
concatenation tree. Most significantly, the placement of Brachymeles in the species trees
recovers a monophyletic Scincinae, but with moderate (77% of replicates) frequency. The
alternative placement of Brachymeles sister to Lygosominae (as seen in the concatenation
analyses) has a frequency of 21%. The sister relationships of Scincus and Mesoscincus has
the lowest frequency (48% of replicates). Ophiomorus is sister to Plestiodon with low
frequency (53% of replicated). The Lygosominae portion of the species tree is identical to
at University of W
ashington on March 17, 2016
http://sysbio.oxfordjournals.org/D
ownloaded from

the concatenation topologies. The concatenation topology from RAxML, which had >99%
support for all but one node, only matches 3% of the species tree replicates.
Nodes in the anomaly zone
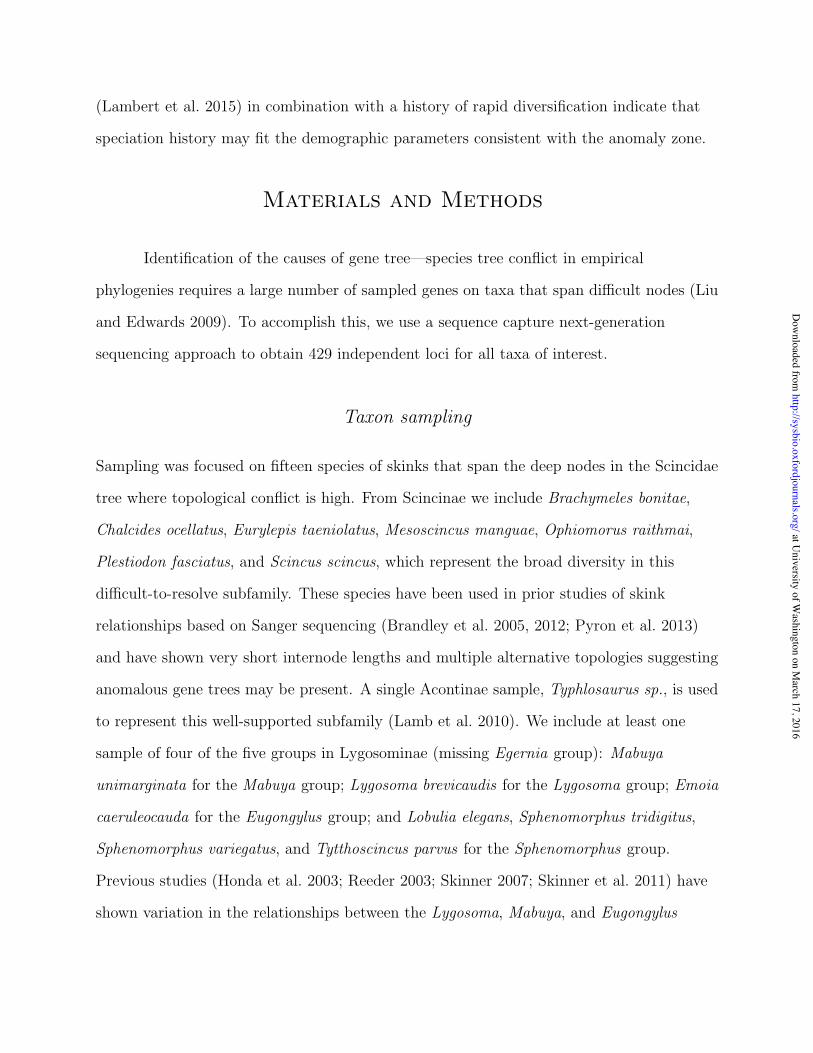
MP-EST.—Median internode lengths calculated with sumtrees (Sukumaran and Holder
2010) were used to calculate the anomaly zone for each pair of internodes in the eMRC
(equation (1)). A large region of the phylogeny is in the anomaly zone based on these
median values (Figure 3a). The majority of relationships in Scincinae have internode
lengths that are expected to produce AGTs. Examining the anomaly zone across the
species tree replicates (Figure 3b) shows that most pairs of parent–child internodes found
to be in the anomaly zone with median branch lengths remain in the anomaly zone across
replicates. One region of the phylogeny leading to Lygosominae (yellow branches) is only in
the anomaly zone for 6% of the replicates that match the eMRC topology. The species tree
replicates include relationships not found in the eMRC that represent the alternate
resolutions of the poorly resolved nodes. Many of these alternative species tree
relationships in the replicate set of trees are also in the anomaly zone (results not shown).
BP&P.—The posterior distribution from BP&P was summarized using sumtrees to obtain
the median branch length τ and population size θ for internodes. BP&P calculates τ and θ
individually, which were used to calculate λ (λ = 2τ/θ) (Table 3). Internodes B, C, and N
(Figure 2c) are particularly short and internode G is the longest. Calculations of a(x)
(equation (1)) show that six internodes (B, C, J, K, L, N) have a(x) values above zero
indicating they may produce AGTs depending on the length of the descendant internode.
Of these, B, C, J, and L have descendant internodes. The internode pairs B/C, B/I, and
L/N are in the anomaly zone because the lengths of internodes C and I are shorter than
a(x) for B and internode N is shorter than a(x) for L (Figure 3c). To account for the range
at University of W
ashington on March 17, 2016
http://sysbio.oxfordjournals.org/D
ownloaded from

in branch length estimates across the posterior distribution, 1000 random draws of τ and θ
were made. Each draw was calculated for occurrence of the anomaly zone for each pair of
internodes. Internodes inferred to be in the anomaly zone using median branch lengths
were all inferred at high frequency (Figure 3d). Additional pairs of internodes are in the
anomaly zone when taking into account the range of τ and θ values in the posterior
distribution, showing a similar pattern of anomaly zone nodes as found with estimates from
MP-EST.
Discussion
Species trees estimated using coalescent methods often differ from concatenated gene trees,
and the anomaly zone may be contributing to these disagreements. The anomaly zone
could also explain why some phylogenomic studies find low support for relationships
despite the inclusion of hundreds to thousands of loci. In the empirical example of skinks
presented here, we find strong conflict between species trees and concatenated gene trees,
as well as conflict between individual gene trees. This type of conflict is typical for
phylogenomic studies of rapid diversification events (Zou et al. 2008; McCormack et al.
2012; Jarvis et al. 2014). Our examination of the anomaly zone in skinks shows that the
parts of the tree in conflict correspond with areas of the tree that are also estimated to be
in the anomaly zone. The anomaly zone is a potential explanation for why conflicting
relationships persist in some phylogenomic studies.
The anomaly zone in empirical phylogenies
We find that the anomaly zone likely occurs in empirical studies and that it may be more
pervasive than previously assumed (but see Huang and Knowles (2009)). Although there
might be insufficient variation to resolve gene trees that are derived from a species tree in
at University of W
ashington on March 17, 2016
http://sysbio.oxfordjournals.org/D
ownloaded from

the anomaly zone, most studies are not specifically interested in whether or not we can
estimate individual gene trees. The species tree is the target of analysis, not the individual
gene trees (Edwards 2009). While it is true that estimation of any particular gene tree is
hindered by low genetic variation, this does not change whether or not speciation events
occurred quickly enough to place them into the anomaly zone. Phylogenetic analysis of
concatenated loci, as a proxy for the species tree, can result in strong support as more loci
are combined, even if there is low genetic variation in individual loci. If the speciation
history is in the anomaly zone, then the resulting phylogeny will be erroneous (Kubatko
and Degnan 2007). Our study shows that there is low support for relationships in most
individual gene trees, but after concatenating the 276,480 characters they provide strong
support for most relationships (Figure 2a–b). Huang and Knowles (2009) showed that
when the species history is in the anomaly zone, gene tree estimation error will be high and
that the lack of variation will make estimation of individual gene trees difficult. The
observation of significant gene tree discordance across hundreds of loci may be a good sign
that the species history is in the anomaly zone, and the framework that we provide here
offers one way to test this hypothesis.
Summary statistic methods for species tree inference have become a necessity, since
the more statistically rigorous full-Bayesian approaches (*BEAST and BEST) cannot
handle hundreds of loci (Bayzid and Warnow 2013). Summary methods use gene trees to
estimate species trees, and as previously discussed, gene tree estimation error is typically
high in cases where an anomaly zone is suspected. Gene tree estimation error reduces the
accuracy of species tree estimation (Bayzid and Warnow 2013; Mirarab et al. 2014), which
makes species tree inference in the anomaly zone more difficult (Liu and Edwards 2009).
We accounted for gene tree error by repeating the species tree estimation procedure using
the gene trees constructed from the bootstrap replicates, which can provide a measure of
accuracy that is not available when only using the ML gene trees (Mirarab et al. 2014).
at University of W
ashington on March 17, 2016
http://sysbio.oxfordjournals.org/D
ownloaded from
Despite this, it is still possible that gene tree estimation error is biasing the species tree.
Ideally, these inaccuracies should be reflected by the low frequency of occurrence for
inaccurate nodes in the species tree. By estimating the anomaly zone across all topologies
in the replicate species trees from MP-EST we find that the anomaly zone can be inferred
even when species trees contain low supported nodes. Species trees in the anomaly zone are
likely to have nodes with low frequency due to the high frequency of AGTs and the
occurrence of gene tree estimation error. In these situations, including more loci may not
increase node frequency due to the addition of more gene tree estimation error. Increasing
the accuracy of gene trees through sampling longer loci (McCormack et al. 2009), or by
combining loci with a shared history into larger gene fragments (Bayzid and Warnow 2013;
Betancur-R et al. 2013), may improve inference of species trees in the anomaly zone.
Inferring relationships in recently diverged species may also benefit from increased sampling
of individuals within each species (Rokas and Carroll 2005; Maddison and Knowles 2006),
though this benefit would be lost in deep divergences (Kubatko and Degnan 2007).
Frequency of anomalous gene trees
While we cannot be certain that the skink species tree that we estimated is correct,
it is clear that the set of species tree topologies estimated from these phylogenomic data
show signs of the presence of the anomaly zone over multiple pairs of internodes (Figure 3).
The extent and frequency of the anomaly zone in this empirical example indicates that
many AGTs may exist across the genomes of these taxa. It is important to keep in mind
that each inference of the anomaly zone is limited to pairs of internal branches, without
consideration of neighboring relationships. Only considering neighboring internal branches
is a simplification; accounting for other branches would increase the size of the anomaly
zone (Rosenberg and Tao 2008). Focusing on pairs of internal branches makes our
investigation of the anomaly zone a conservative approximation of the extent of AGTs.
at University of W
ashington on March 17, 2016
http://sysbio.oxfordjournals.org/D
ownloaded from

When considered together, the extent of the anomaly zone in our empirical example has
the potential to produce many AGTs.
Rosenberg and Tao (2008) showed that the number of AGTs increases rapidly as
the number of short internodes increases and that an anomaly zone that includes three
internodes (five-taxon trees or larger) can produce as many as 45 AGTs. Estimates for
trees larger than five taxa or an anomaly zone spanning more than three nodes have not
been estimated, but are expected to increase exponentially. In the example of skinks, the
429 loci sampled are all estimated to have unique ML topologies. Our sample of loci does
not show a trend for a particular topology to be more frequent, but this is not unexpected
given the large number of possible topologies (4.22x10¹³) for a 16-taxon rooted tree. Across
the 429 alternate topologies sampled, an extended majority-rule consensus of these
topologies shows that most splits occur in low frequency. Splits associated with internode
pairs estimated to be in the anomaly zone occur at lower frequency among the gene trees
than splits not estimated in the anomaly zone. It is unclear how species tree methods
perform when the anomaly zone is larger than a four-taxon case as we see in skinks.
Simulation studies testing the ability of different species tree methods to overcome
the four-taxon anomaly zone (Kubatko and Degnan 2007; Huang and Knowles 2009; Liu
and Edwards 2009) have shown that species tree methods can accurately estimate the true
species tree when provided with enough data. For concatenated gene trees, we know that
combining loci with conflicting topologies can result in strong support for a single topology
(Rokas et al. 2003). In some cases, relationships within the concatenated gene tree may not
occur within the individual gene trees, a result referred to as hidden likelihood support
(Gatesy and Baker 2005). This hidden support has been argued to be an advantage of
concatenation methods over species tree methods (Springer and Gatesy 2014; Gatesy and
Springer 2014). In cases where the speciation history fits the demographic scenario of the
anomaly zone, the hidden likelihood support in the concatenated gene tree will be for an
at University of W
ashington on March 17, 2016
http://sysbio.oxfordjournals.org/D
ownloaded from

incorrect topology, resulting in strong inference of an incorrect species history (Kubatko
and Degnan 2007). The method for inferring the anomaly zone presented here allows
researchers to identify potential conflicts and decide on appropriate analytical solutions.
Edwards (2009) predicted that phylogenomic studies would find lower support for
relationships using species tree methods than would be obtained from concatenation,
especially in older clades. This prediction is based on the idea that missing data would have
a larger effect on species trees, and that species trees use more complex models compared
to concatenation. We find these predictions to be accurate, though their cause may be
different than originally proposed. We propose that low support in species tree analyses is
due to a combination of gene tree estimation error and the presence of AGTs that bias
phylogenetic signal. Simulation studies have shown that many species tree methods can
overcome the anomaly zone in simple four-taxon scenarios (Liu and Edwards 2009), but no
study has looked at the effect of larger anomaly zone problems on trees with more taxa. We
predict that when the anomaly zone occurs across more than two internodes, the greater
number of AGTs will provide support for multiple species trees, reducing the support for
some species tree nodes. This will likely occur even when gene trees are estimated with
certainty (i.e., using simulated data), a luxury not available with empirical studies. The
increased number of AGTs may also result in low support in concatenation analyses even
when analyzing hundreds of genes if the AGTs are in direct topological conflict. In this
study, we find two nodes with RAxML and a different node in EXaBayes that have low
support despite having over 276,000 (50,666 variable; 15,524 parsimony-informative)
characters in the analyses. With multiple AGTs there may be alternative topologies with
high probability in the set of candidate genes. These alternative topologies should lower
branch support in concatenation analyses. This low support for nodes near short branches
may be an indication of an anomaly zone problem in phylogenomic datasets.
at University of W
ashington on March 17, 2016
http://sysbio.oxfordjournals.org/D
ownloaded from

Higher-level skink relationships
Resolving the relationships within Scincidae is an ongoing challenge (Brandley et al. 2012;
Wiens et al. 2012; Pyron et al. 2013; Lambert et al. 2015) which our current study
addresses with a slightly different approach compared to previous studies. Pyron et al.
(2013) used hundreds of taxa in a sparse matrix, while Wiens et al. (2012); Lambert et al.
(2015) used many loci with few taxa. Our taxon sampling is most similar to Brandley et al.
(2012) but utilizes 429 loci and species tree analyses to estimate relationships. Our
preferred estimate of species relationships (Figure 2c) shows subfamily relationships
concordant with results in Pyron et al. (2013) and Lambert et al. (2015). Acontinae is
sister to all other skinks and the subfamilies Scincinae and Lygosominae are monophyletic.
The monophyly of Scincinae conflicts with most studies and our own results from analyses
of concatenated data (Whiting et al. 2003; Brandley et al. 2005, 2012; Wiens et al. 2012)
but is likely the more accurate relationship based on our inference of the anomaly zone in
relation to the nodes preceding and in this subfamily. Similar to Lambert et al. (2015) we
find Brachymeles to be related to other Scincinae as opposed to sister to all Lygosominae
(Brandley et al. 2012). The relationships among Scincinae genera differs from those
presented in Brandley et al. (2012) though we have far fewer genera sampled and low
support so many comparisons should be made with caution. We consider the alternative
placement of Brachymeles sister to Lygosominae, seen in concatenated gene trees, to be an
artifact of rapid diversification resulting in a series of AGTs. A detailed examination of the
relationships among the genera in Scincinae with broad taxon sampling is clearly
warranted. Our inference of the anomaly zone among some Scincinae genera suggests that
hundreds of loci and species tree analyses will be necessary to accurately estimate the
phylogenetic relationships within this group.
Relationships within Lygosominae are largely concordant with previous studies in
finding the Sphenomorphus group sister to all other groups (Honda et al. 2003; Reeder
at University of W
ashington on March 17, 2016
http://sysbio.oxfordjournals.org/D
ownloaded from

2003; Skinner et al. 2011). We find the Lygosoma group to be sister to the Eugongylus
group and that this pair is sister to the Mabuya group consistent with the results of Reeder
(2003) and Skinner et al. (2011). Relationships among the sampled genera in the
Sphenomorphus group are consistent with previous results (Linkem et al. 2011). Over
three-quarters of all skink species are in Lygosominae and it appears based on our limited
sampling that the broad groupings of genera can be consistently resolved and the anomaly
zone is not an issue at this level. Within the Sphenomorphus group, previous studies have
reported short branches separating major groups (Linkem et al. 2011; Skinner et al. 2011).
We suspect that there will be anomaly zone issues within the Sphenomorphus radiation,
especially in Australia. The Eugongylus group will likely also present anomaly zone issues
given the large number of species in the group and relatively recent origin. Studies at a
more fine scale will likely find similar rapid diversification patterns that are consistent with
the anomaly zone. Further work on these diverse groups is needed to better understand
their systematic relationships.
A monophyletic Scincinae necessitates an investigation into morphological features
to define this group. Greer (1970) considered Scincinae to be the primitive morphological
form from which all other skinks were derived, but molecular studies find Scincinae taxa to
be nested and sister to Lygosominae, conflicting with the prevailing morphological
interpretation. A detailed and rigorous analysis of the morphological evolution and
biogeography of skinks will require much more rigorous taxon sampling.
Overcoming the anomaly zone
Sequencing hundreds of unlinked single copy loci provides an opportunity to explore the
conflicts between loci and analytical approaches, as well as address what may be the source
of conflict. Our work shows that researchers conducting empirical studies should closely
consider the potential impact the anomaly zone has on their phylogenetic analyses. A
at University of W
ashington on March 17, 2016
http://sysbio.oxfordjournals.org/D
ownloaded from
common trend with phylogenomic studies is to analyze the data with concatenation, an
approach that has the advantage of faster computation times and simplicity, but that
provides overwhelmingly and likely erroneous strong support across most of the tree.
Species tree analyses often result in lower support for difficult parts of the tree than
concatenation. Instead of marginalizing the species tree results, we should acknowledge
that they are a likely consequence of the speciation history for the group. The lower
support provided by coalescent-based species tree inference is potentially a more accurate
reflection of the support for the tree given the data.
As we show here, the anomaly zone is likely more pervasive than previously
suggested and should be accounted for when studying taxa that may have diverged rapidly,
even if that rapid event was in the distant past. Combining hundreds to thousands of
independent loci together with coalescent-based species tree inference is the most effective
way of getting an accurate result. Targeting longer loci will help reduce gene tree
estimation error, resulting in a better estimate of the species tree. In the most extreme
cases, resolving the nodes of a species tree with strong support may not be possible even
when sampling the entire genome.
Funding
C.W.L. was supported by a National Science Foundation Postdoctoral Research Fellowship
in Biology (Award 1202754). Data collection was funded by National Science Foundation
grant DBI-1144630 awarded to A.D.L. This work used the Vincent J. Coates Genomics
Sequencing Laboratory at UC Berkeley, supported by National Institutes of Health S10
Instrumentation Grants S10RR029668 and S10RR027303.
Acknowledgements
at University of W
ashington on March 17, 2016
http://sysbio.oxfordjournals.org/D
ownloaded from

We would like to thank R. Brown of the University of Kansas, C. Spencer and J. McGuire
of UC Berkeley, A. Resetar of the Field Museum, and K. Imada and A. Allison of the
Bishop Museum for loans of tissues necessary for this work. B. Faircloth provided detailed
help in troubleshooting early attempts at sequence capture, and we thank him for quickly
responding to our queries. R. Harris helped with designing this new probe set. R. Bryson
provided useful feedback and discussion. Members of the Leache lab contributed to early
discussions of this work.
at University of W
ashington on March 17, 2016
http://sysbio.oxfordjournals.org/D
ownloaded from

*
References
Aberer, A. J., K. Kobert, and A. Stamatakis. 2014. Exabayes: massively parallel bayesian
tree inference for the whole-genome era. Molecular Biology and Evolution 31:2553–2556.
Alfoldi, J., F. Di Palma, M. Grabherr, C. Williams, L. Kong, E. Mauceli, P. Russell, C. B.
Lowe, R. E. Glor, J. D. Jaffe, et al. 2011. The genome of the green anole lizard and a
comparative analysis with birds and mammals. Nature 477:587–591.
Bayzid, M. S. and T. Warnow. 2013. Naive binning improves phylogenomic analyses.
Bioinformatics 29:2277–2284.
Betancur-R, R., G. J. Naylor, and G. Ortı. 2013. Conserved genes, sampling error, and
phylogenomic inference. Systematic Biology 63:257–262.
Blackburn, D. G. 1982. Evolutionary origins of viviparity in the Reptilia. i. Sauria.
Amphibia-Reptilia 3:185–205.
Bolger, A. M., M. Lohse, and B. Usadel. 2014. Trimmomatic: A flexible trimmer for
illumina sequence data. Bioinformatics 30:2114–2120.
Brandley, M. C., H. OTA, T. Hikida, A. Nieto Montes De Oca, M. Ferıa-ortız, X. Guo, and
Y. Wang. 2012. The phylogenetic systematics of blue-tailed skinks (Plestiodon) and the
family Scincidae. Zoological Journal of the Linnean Society 165:163–189.
Brandley, M. C., A. Schmitz, and T. W. Reeder. 2005. Partitioned Bayesian analyses,
partition choice, and the phylogenetic relationships of scincid lizards. Systematic Biology
54:373–390.
at University of W
ashington on March 17, 2016
http://sysbio.oxfordjournals.org/D
ownloaded from
Burgess, R. and Z. Yang. 2008. Estimation of hominoid ancestral population sizes under
Bayesian coalescent models incorporating mutation rate variation and sequencing errors.
Molecular Biology and Evolution 25:1979–1994.
Darriba, D., G. L. Taboada, R. Doallo, and D. Posada. 2012. jModelTest 2: more models,
new heuristics and parallel computing. Nature Methods 9:772–772.
Degnan, J. H. 2013. Anomalous unrooted gene trees. Systematic Biology 62:574–590.
Degnan, J. H. and N. A. Rosenberg. 2006. Discordance of species trees with their most
likely gene trees. PLoS Genetics 2:762–768.
Degnan, J. H. and N. A. Rosenberg. 2009. Gene tree discordance, phylogenetic inference
and the multispecies coalescent. Trends in Ecology & Evolution 24:332–340.
Degnan, J. H., N. A. Rosenberg, and T. Stadler. 2012a. A characterization of the set of
species trees that produce anomalous ranked gene trees. IEEE/ACM Transactions on
Computational Biology and Bioinformatics (TCBB) 9:1558–1568.
Degnan, J. H., N. A. Rosenberg, and T. Stadler. 2012b. The probability distribution of
ranked gene trees on a species tree. Mathematical Biosciences 235:45–55.
Dunn, C. W., A. Hejnol, D. Q. Matus, K. Pang, W. E. Browne, S. A. Smith, E. Seaver,
G. W. Rouse, M. Obst, G. D. Edgecombe, et al. 2008. Broad phylogenomic sampling
improves resolution of the animal tree of life. Nature 452:745–749.
Edwards, S. V. 2009. Is a new and general theory of molecular systematics emerging?
Evolution 63:1–19.
Faircloth, B. C. 2013. illumiprocessor: a trimmomatic wrapper for parallel adapter and
quality trimming. http://dx.doi.org/10.6079/j9ill .
at University of W
ashington on March 17, 2016
http://sysbio.oxfordjournals.org/D
ownloaded from

Faircloth, B. C. 2014. phyluce: phylogenetic estimation from ultraconserved elements.
doi:10.6079/j9phyl .
Faircloth, B. C., J. E. McCormack, N. G. Crawford, M. G. Harvey, R. T. Brumfield, and
T. C. Glenn. 2012. Ultraconserved elements anchor thousands of genetic markers
spanning multiple evolutionary timescales. Systematic Biology 61:717–726.
Gatesy, J. and R. H. Baker. 2005. Hidden likelihood support in genomic data: can
forty-five wrongs make a right? Systematic Biology 54:483–492.
Gatesy, J. and M. S. Springer. 2014. Phylogenetic analysis at deep timescales: Unreliable
gene trees, bypassed hidden support, and the coalescence/concatalescence conundrum.
Molecular Phylogenetics and Evolution 80:231–266.
Genomic Resources Development Consortium, W. Arthofer, B. L. Banbury, M. Carneiro,
F. Cicconardi, T. F. Duda, R. B. Harris, D. S. Kang, A. D. Leache, V. Nolte,
C. Nourisson, N. Palmieri, B. C. Schlick-Steiner, C. Schltterer, F. Sequeira, C. Sim,
F. M. Steiner, M. Vallinoto, and D. A. Weese. 2014. Genomic resources notes accepted 1
august 2014–30 september 2014. Molecular Ecology Resources 15:228–229.
Greer, A. E. 1970. A subfamily classification of scincid lizards. Bulletin of the Museum of
Comparative Zoology 139:151–184.
Greer, A. E. 1986. Lygosomine (Scincidae) monophyly: a third, corroborating character
and a reply to critics. Journal of Herpetology 20:123–126.
Greer, A. E. 1991. Limb reduction in squamates: identification of the lineages and
discussion of the trends. Journal of Herpetology 25:166–173.
Guindon, S. and O. Gascuel. 2003. A simple, fast, and accurate algorithm to estimate large
phylogenies by maximum likelihood. Systematic Biology 52:696–704.
at University of W
ashington on March 17, 2016
http://sysbio.oxfordjournals.org/D
ownloaded from

Honda, M., H. Ota, G. Kohler, I. Ineich, L. Chirio, S.-L. Chen, and T. Hikida. 2003.
Phylogeny of the lizard subfamily Lygosominae (Reptilia: Scincidae), with special
reference to the origin of the new world taxa. Genes & Genetic Systems 78:71–80.
Huang, H. and L. L. Knowles. 2009. What is the danger of the anomaly zone for empirical
phylogenetics? Systematic Biology 58:527–536.
Jarvis, E. D., S. Mirarab, A. J. Aberer, B. Li, P. Houde, C. Li, S. Y. Ho, B. C. Faircloth,
B. Nabholz, J. T. Howard, et al. 2014. Whole-genome analyses resolve early branches in
the tree of life of modern birds. Science 346:1320–1331.
Kubatko, L. S. and J. H. Degnan. 2007. Inconsistency of phylogenetic estimates from
concatenated data under coalescence. Systematic Biology 56:17–24.
Lamb, T., S. Biswas, and A. M. Bauer. 2010. A phylogenetic reassessment of African
fossorial skinks in the subfamily Acontinae (Squamata: Scincidae): evidence for
parallelism and polyphyly. Zootaxa 2657:33–46.
Lambert, S. M., T. W. Reeder, and J. J. Wiens. 2015. When do species-tree and
concatenated estimates disagree? An empirical analysis with higher-level scincid lizard
phylogeny. Molecular Phylogenetics and Evolution 82:146–155.
Linkem, C. W., A. C. Diesmos, and R. M. Brown. 2011. Molecular systematics of the
Philippine forest skinks (Squamata: Scincidae: Sphenomorphus): testing morphological
hypotheses of interspecific relationships. Zoological Journal of the Linnean Society
163:1217–1243.
Liu, L. and S. V. Edwards. 2009. Phylogenetic analysis in the anomaly zone. Systematic
Biology 58:452–460.
at University of W
ashington on March 17, 2016
http://sysbio.oxfordjournals.org/D
ownloaded from

Liu, L., S. Wu, and L. Yu. 2015. Coalescent methods for estimating species trees from
phylogenomic data. Journal of Systematics and Evolution 53:380–390.
Liu, L. and L. Yu. 2011. Estimating species trees from unrooted gene trees. Systematic
Biology 60:661–667.
Liu, L., L. Yu, and S. V. Edwards. 2010a. A maximum pseudo-likelihood approach for
estimating species trees under the coalescent model. BMC Evolutionary Biology 10:302.
Liu, L., L. Yu, and D. K. Pearl. 2010b. Maximum tree: a consistent estimator of the
species tree. Journal of Mathematical Biology 60:95–106.
Maddison, W. P. 1997. Gene trees in species trees. Systematic Biology 46:523–536.
Maddison, W. P. and L. L. Knowles. 2006. Inferring phylogeny despite incomplete lineage
sorting. Systematic Biology 55:21–30.
McCormack, J. E., B. C. Faircloth, N. G. Crawford, P. A. Gowaty, R. T. Brumfield, and
T. C. Glenn. 2012. Ultraconserved elements are novel phylogenomic markers that resolve
placental mammal phylogeny when combined with species-tree analysis. Genome
Research 22:746–754.
McCormack, J. E., H. Huang, and L. L. Knowles. 2009. Maximum likelihood estimates of
species trees: how accuracy of phylogenetic inference depends upon the divergence
history and sampling design. Systematic Biology 58:501–508.
Mirarab, S., M. S. Bayzid, and T. Warnow. 2014. Evaluating summary methods for
multi-locus species tree estimation in the presence of incomplete lineage sorting.
Systematic Biology doi:10.1093/sysbio/syu063.
Mulcahy, D. G., B. P. Noonan, T. Moss, T. M. Townsend, T. W. Reeder, J. W. Sites, and
J. J. Wiens. 2012. Estimating divergence dates and evaluating dating methods using
at University of W
ashington on March 17, 2016
http://sysbio.oxfordjournals.org/D
ownloaded from

phylogenomic and mitochondrial data in squamate reptiles. Molecular Phylogenetics and
Evolution 65:974–991.
Peng, Y., H. Leung, S. Yiu, and F. Chin. 2010. IDBA a practical iterative de bruijn graph
de novo assembler. Pages 426–440 in Research in Computational Molecular Biology
(B. Berger, ed.) vol. 6044 of Lecture Notes in Computer Science. Springer Berlin
Heidelberg.
Philippe, H., H. Brinkmann, D. V. Lavrov, D. T. J. Littlewood, M. Manuel, G. Worheide,
and D. Baurain. 2011. Resolving difficult phylogenetic questions: why more sequences
are not enough. PLoS Biology 9:e1000602.
Philippe, H., R. Derelle, P. Lopez, K. Pick, C. Borchiellini, N. Boury-Esnault, J. Vacelet,
E. Renard, E. Houliston, E. Queinnec, et al. 2009. Phylogenomics revives traditional
views on deep animal relationships. Current Biology 19:706–712.
Pyron, R. A., F. T. Burbrink, and J. J. Wiens. 2013. A phylogeny and revised classification
of Squamata, including 4161 species of lizards and snakes. BMC Evolutionary Biology
13:93.
Pyron, R. A., C. R. Hendry, V. M. Chou, E. M. Lemmon, A. R. Lemmon, and F. T.
Burbrink. 2014. Effectiveness of phylogenomic data and coalescent species-tree methods
for resolving difficult nodes in the phylogeny of advanced snakes (Serpentes:
Caenophidia). Molecular Phylogenetics and Evolution 81:221–231.
Rambaut, A. and A. Drummond. 2007. Tracer v1.5, available from:
http://beast.bio.ed.ac.uk/tracer .
Rannala, B. and Z. Yang. 2003. Bayes estimation of species divergence times and ancestral
population sizes using DNA sequences from multiple loci. Genetics 164:1645–1656.
at University of W
ashington on March 17, 2016
http://sysbio.oxfordjournals.org/D
ownloaded from

Reeder, T. W. 2003. A phylogeny of the Australian Sphenomorphus group (Scincidae:
Squamata) and the phylogenetic placement of the crocodile skinks (Tribolonotus):
Bayesian approaches to assessing congruence and obtaining confidence in maximum
likelihood inferred relationships. Molecular Phylogenetics and Evolution 27:384–397.
Rokas, A. and S. B. Carroll. 2005. More genes or more taxa? The relative contribution of
gene number and taxon number to phylogenetic accuracy. Molecular Biology and
Evolution 22:1337–1344.
Rokas, A., B. L. Williams, N. King, and S. B. Carroll. 2003. Genome-scale approaches to
resolving incongruence in molecular phylogenies. Nature 425:798–804.
Rosenberg, N. A. 2013. Discordance of species trees with their most likely gene trees: A
unifying principle. Molecular Biology and Evolution 30:2709–2713.
Rosenberg, N. A. and J. H. Degnan. 2010. Coalescent histories for discordant gene trees
and species trees. Theoretical Population Biology 77:145–151.
Rosenberg, N. A. and R. Tao. 2008. Discordance of species trees with their most likely gene
trees: the case of five taxa. Systematic Biology 57:131–140.
Siler, C. D., A. C. Diesmos, A. C. Alcala, and R. M. Brown. 2011. Phylogeny of Philippine
slender skinks (Scincidae: Brachymeles) reveals underestimated species diversity,
complex biogeographical relationships, and cryptic patterns of lineage diversification.
Molecular Phylogenetics and Evolution 59:53–65.
Skinner, A. 2007. Phylogenetic relationships and rate of early diversification of Australian
Sphenomorphus group scincids (Scincoidea, Squamata). Biological Journal of the
Linnean Society 92:347–366.
at University of W
ashington on March 17, 2016
http://sysbio.oxfordjournals.org/D
ownloaded from

Skinner, A., A. F. Hugall, and M. N. Hutchinson. 2011. Lygosomine phylogeny and the
origins of Australian scincid lizards. Journal of Biogeography 38:1044–1058.
Skinner, A., M. S. Lee, and M. N. Hutchinson. 2008. Rapid and repeated limb loss in a
clade of scincid lizards. BMC Evolutionary Biology 8:310.
Song, S., L. Liu, S. V. Edwards, and S. Wu. 2012. Resolving conflict in eutherian mammal
phylogeny using phylogenomics and the multispecies coalescent model. Proceedings of
the National Academy of Sciences 109:14942–14947.
Springer, M. S. and J. Gatesy. 2014. Land plant origins and coalescence confusion. Trends
in Plant Science 19:267–269.
Stamatakis, A. 2006. RAxML-VI-HPC: maximum likelihood-based phylogenetic analyses
with thousands of taxa and mixed models. Bioinformatics 22:2688–2690.
Steel, M. and A. Rodrigo. 2008. Maximum likelihood supertrees. Systematic Biology
57:243–250.
Suh, A., L. Smeds, and H. Ellegren. 2015. The dynamics of incomplete lineage sorting
across the ancient adaptive radiation of neoavian birds. PLoS Biology 13:e1002224.
Sukumaran, J. and M. T. Holder. 2010. Dendropy: a Python library for phylogenetic
computing. Bioinformatics 26:1569–1571.
Swofford, D. 2003. PAUP*. Phylogenetic Analysis Using Parsimony (*and other methods).
Version 4. Sinauer Associates, Sunderland, Massachusetts.
Tonini, J., A. Moore, D. Stern, M. Shcheglovitova, and G. Ortı. 2015. Concatenation and
species tree methods exhibit statistically indistinguishable accuracy under a range of
simulated conditions. PLoS Currents 7.
at University of W
ashington on March 17, 2016
http://sysbio.oxfordjournals.org/D
ownloaded from

Uetz, P. 2015. The reptile database. Http://reptile-database.reptarium.cz.
Whiting, A. S., A. M. Bauer, and J. W. Sites Jr. 2003. Phylogenetic relationships and limb
loss in sub-Saharan African scincine lizards (Squamata: Scincidae). Molecular
Phylogenetics and Evolution 29:582–598.
Wiens, J. J., C. R. Hutter, D. G. Mulcahy, B. P. Noonan, T. M. Townsend, J. W. Sites,
and T. W. Reeder. 2012. Resolving the phylogeny of lizards and snakes (Squamata) with
extensive sampling of genes and species. Biology Letters 8:1043–1046.
Yang, Z. and B. Rannala. 2010. Bayesian species delimitation using multilocus sequence
data. Proceedings of the National Academy of Sciences 107:9264–9269.
Zhang, G., C. Li, Q. Li, B. Li, D. M. Larkin, C. Lee, J. F. Storz, A. Antunes, M. J.
Greenwold, R. W. Meredith, et al. 2014. Comparative genomics reveals insights into
avian genome evolution and adaptation. Science 346:1311–1320.
Zou, X.-H., F.-M. Zhang, J.-G. Zhang, L.-L. Zang, L. Tang, J. Wang, T. Sang, and S. Ge.
2008. Analysis of 142 genes resolves the rapid diversification of the rice genus. Genome
Biology 9:R49.
at University of W
ashington on March 17, 2016
http://sysbio.oxfordjournals.org/D
ownloaded from

Table 1: Genomic data collected and assembly results for 15 species of skinks and theoutgroup.
Total reads Clean reads IDBAa
Species Voucher (Million) (Million) Contigs LociBrachymeles bonitae AJB077c 8.71 7.71 29,942 550Chalcides ocellatus MVZ242790b 6.59 5.93 26,745 569Emoia caeruleocauda KU307155c 6.08 5.64 21,414 563Eurylepis taeniolatus MVZ246017b 7.42 6.72 30,163 572Lobulia elegans BPBM18690d 10.2 9.44 49,859 556Lygosoma brevicaudis MVZ249721b 8.40 7.70 47,774 553Mabuya unimarginata CWL615e 19.5 17.9 134,666 533Mesoscincus manguae CWL614e 11.4 10.5 38,828 550Ophiomorus raithmai MVZ248453b 7.78 7.00 35,506 568Plestiodon fasciatus KU289464c 12.6 11.7 67,908 542Scincus scincus MVZ234538b 6.54 5.94 20,231 566Sphenomorphus tridigitus FMNH258830f 8.39 7.82 39,350 560Sphenomorphus variegatus KU315087c 8.99 8.31 43,927 550Typhlosaurus sp MVZ164850b 8.35 7.60 31,261 549Tytthoscincus parvus JAM6275b 5.41 5.00 18,850 568Xantusia vigilis KU220092c 21.5 19.9 155,978 550
a Iterative de Bruijn graph short-read assembler.b Museum of Vertebrate Zoology, UC Berkeley, CA.
c University of Kansas, Lawrence KS.d Bernice Pauahi Bishop Museum, Honolulu, HI.e No voucher specimen. Tissue deposited at KU.f Field Museum of Natural History, Chicago Il.
at University of W
ashington on March 17, 2016
http://sysbio.oxfordjournals.org/D
ownloaded from
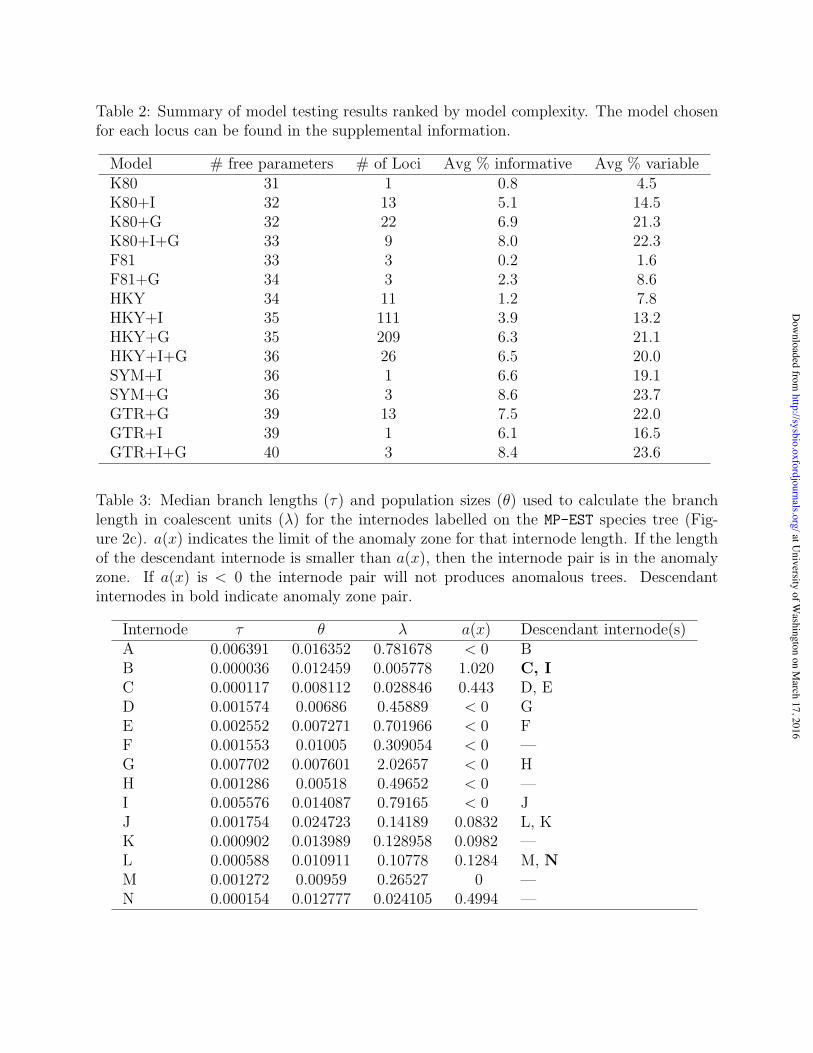
Table 2: Summary of model testing results ranked by model complexity. The model chosenfor each locus can be found in the supplemental information.
Model # free parameters # of Loci Avg % informative Avg % variableK80 31 1 0.8 4.5K80+I 32 13 5.1 14.5K80+G 32 22 6.9 21.3K80+I+G 33 9 8.0 22.3F81 33 3 0.2 1.6F81+G 34 3 2.3 8.6HKY 34 11 1.2 7.8HKY+I 35 111 3.9 13.2HKY+G 35 209 6.3 21.1HKY+I+G 36 26 6.5 20.0SYM+I 36 1 6.6 19.1SYM+G 36 3 8.6 23.7GTR+G 39 13 7.5 22.0GTR+I 39 1 6.1 16.5GTR+I+G 40 3 8.4 23.6
Table 3: Median branch lengths (τ) and population sizes (θ) used to calculate the branchlength in coalescent units (λ) for the internodes labelled on the MP-EST species tree (Fig-ure 2c). a(x) indicates the limit of the anomaly zone for that internode length. If the lengthof the descendant internode is smaller than a(x), then the internode pair is in the anomalyzone. If a(x) is < 0 the internode pair will not produces anomalous trees. Descendantinternodes in bold indicate anomaly zone pair.
Internode τ θ λ a(x) Descendant internode(s)A 0.006391 0.016352 0.781678 < 0 BB 0.000036 0.012459 0.005778 1.020 C, IC 0.000117 0.008112 0.028846 0.443 D, ED 0.001574 0.00686 0.45889 < 0 GE 0.002552 0.007271 0.701966 < 0 FF 0.001553 0.01005 0.309054 < 0 —G 0.007702 0.007601 2.02657 < 0 HH 0.001286 0.00518 0.49652 < 0 —I 0.005576 0.014087 0.79165 < 0 JJ 0.001754 0.024723 0.14189 0.0832 L, KK 0.000902 0.013989 0.128958 0.0982 —L 0.000588 0.010911 0.10778 0.1284 M, NM 0.001272 0.00959 0.26527 0 —N 0.000154 0.012777 0.024105 0.4994 —
at University of W
ashington on March 17, 2016
http://sysbio.oxfordjournals.org/D
ownloaded from

Figure 1: The length of branches X and Y in coalescent units in the species tree determinethe probability of the gene tree topology. For branches under the anomaly zone curve thesymmetric anomalous gene tree will have a higher probability than the asymmetric gene treethat matches the species tree. at U
niversity of Washington on M
arch 17, 2016http://sysbio.oxfordjournals.org/
Dow
nloaded from

Figure 2: Majority-rule consensus trees from the concatenated loci run in RAxML (a),ExaBayes, (b) and the species tree from MP-EST (c). Open circles indicate 100% bootstrapsupport or a Bayesian posterior probability of 1.0. Nodes with lower support are labelled.Both concatenation analyses have similar topologies with differences in the placement ofOphiomorus and the RAxML tree is slightly longer. The species tree (c) is shown as a clado-gram. Relationships within Lygosominae are the same across analyses. The relationshipswithin Scincinae differ both between the concatenation analyses and in comparison to thespecies tree. Letters on species tree nodes are used for Table 3 and discussion of internodepairs.
at University of W
ashington on March 17, 2016
http://sysbio.oxfordjournals.org/D
ownloaded from

Figure 3: Majority-rule consensus topology shown as a cladogram. Pairs of internodes thatare under the anomaly zone curve are highlighted in bold on each tree. Tree a) is basedon median values of branch lengths calculated from MP-EST. Tree b) shows the frequencyof the internodes in the anomaly zone across species tree replicates that match the eMRCtopology. Tree c) shows the occurrence based on the median values of branch lengths fromthe posterior distribution of BP&P. Tree d) shows the frequency of the internode in theanomaly zone based on 1000 draws of joint internode values from the posterior distribution.
at University of W
ashington on March 17, 2016
http://sysbio.oxfordjournals.org/D
ownloaded from
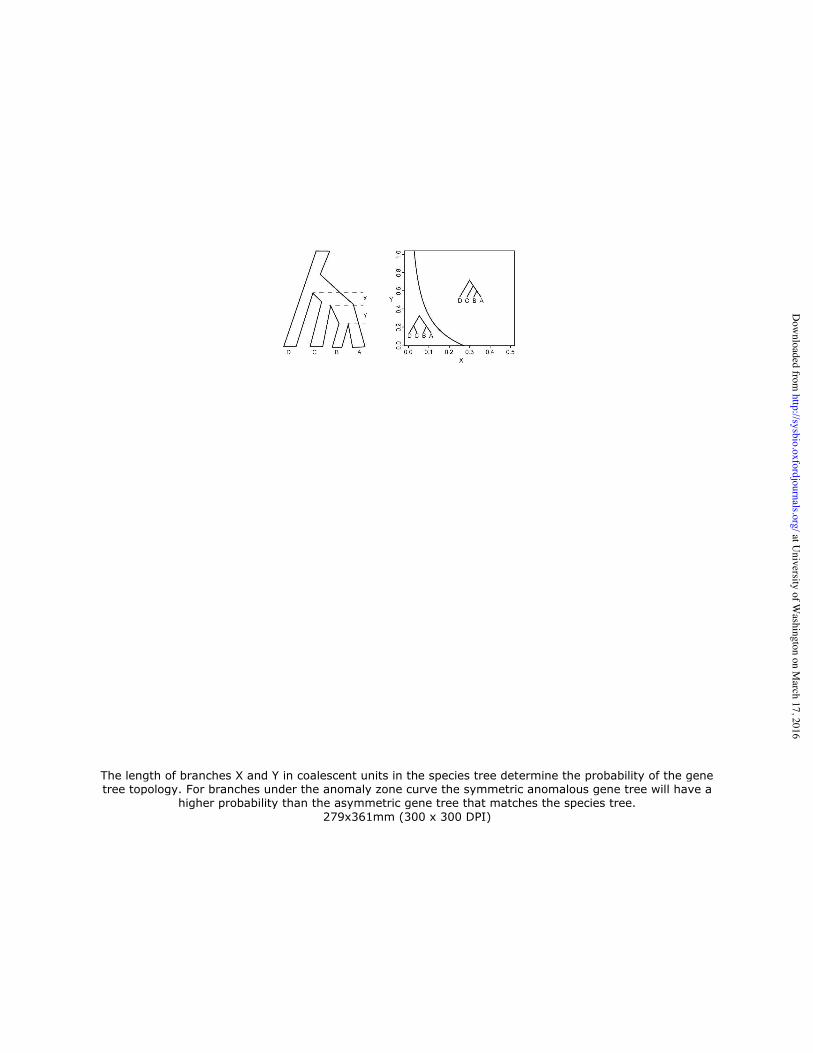
The length of branches X and Y in coalescent units in the species tree determine the probability of the gene tree topology. For branches under the anomaly zone curve the symmetric anomalous gene tree will have a
higher probability than the asymmetric gene tree that matches the species tree. 279x361mm (300 x 300 DPI)
at University of W
ashington on March 17, 2016
http://sysbio.oxfordjournals.org/D
ownloaded from
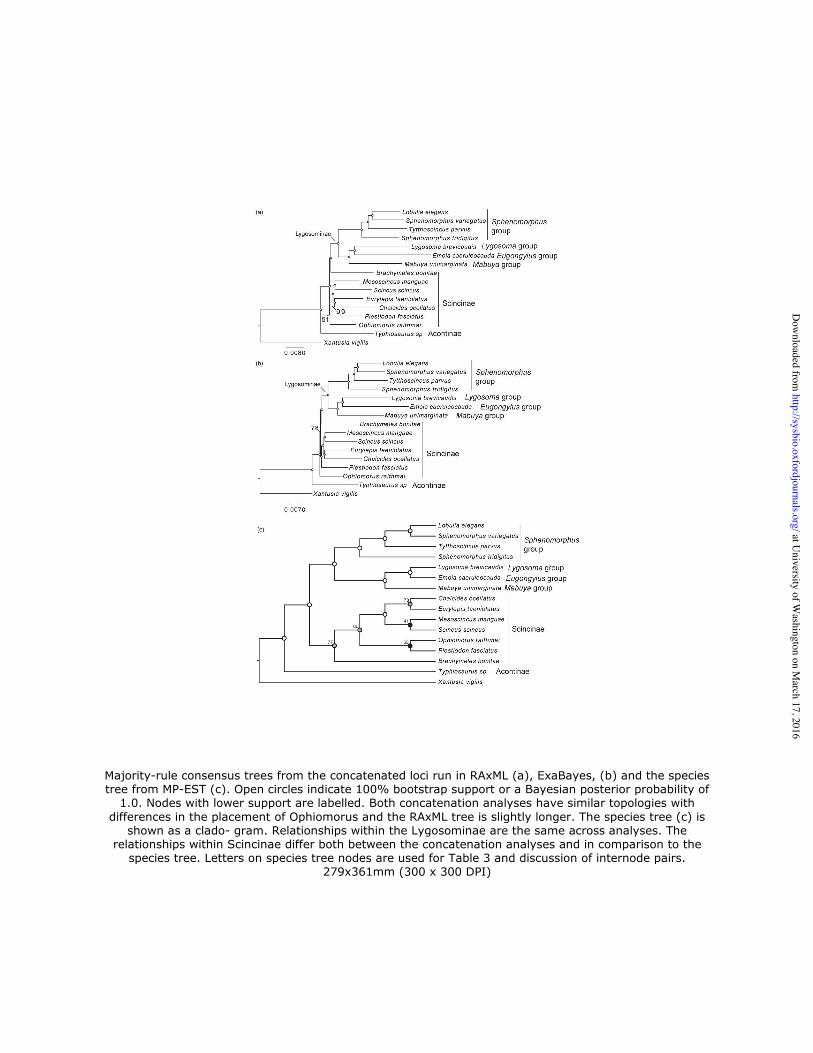
Majority-rule consensus trees from the concatenated loci run in RAxML (a), ExaBayes, (b) and the species tree from MP-EST (c). Open circles indicate 100% bootstrap support or a Bayesian posterior probability of
1.0. Nodes with lower support are labelled. Both concatenation analyses have similar topologies with differences in the placement of Ophiomorus and the RAxML tree is slightly longer. The species tree (c) is
shown as a clado- gram. Relationships within the Lygosominae are the same across analyses. The relationships within Scincinae differ both between the concatenation analyses and in comparison to the
species tree. Letters on species tree nodes are used for Table 3 and discussion of internode pairs. 279x361mm (300 x 300 DPI)
at University of W
ashington on March 17, 2016
http://sysbio.oxfordjournals.org/D
ownloaded from

100
100
100100
100
b) c) d)98
99
6 100
14
84
99 86
96
70
100
Xantusiidae
Mesoscincus
Lygosoma
Acontinae
Lobulia
Emoia
Sph. variegatus
Plestiodon
Scincus
Chalcides
Brachymeles
Tytthoscincus
Sph. tridigitus
Ophiomorus
Eurylepis
Mabuya
a)
at University of W
ashington on March 17, 2016
http://sysbio.oxfordjournals.org/D
ownloaded from