Embed Size (px)
Citation preview

Detecting Changes in Alternative mRNA Processing From Microarray Expression Data
by
Timothy J. Robinson
Department of Molecular Cancer Biology Duke University
Date:_______________________ Approved:
___________________________
Mariano Garcia-Blanco, Co-Advisor
___________________________ Mark Dewhirst, Co-Advisor
___________________________
Michael Datto
___________________________ Joseph Lucas
___________________________
Joseph Nevins, Chair
Dissertation submitted in partial fulfillment of the requirements for the degree of Doctor of Philosophy in the Department of
Molecular Cancer Biology in the Graduate School of Duke University
2010

ABSTRACT
Detecting Changes in Alternative mRNA Processing From Microarray Expression Data
by
Timothy J. Robinson
Department of Molecular Cancer Biology Duke University
Date:_______________________ Approved:
___________________________
Mariano Garcia-Blanco, Co-Advisor
___________________________ Mark Dewhirst, Co-Advisor
___________________________
Michael Datto
___________________________ Joseph Lucas
___________________________
Joseph Nevins, Chair
An abstract of a dissertation submitted in partial fulfillment of the requirements for the degree of Doctor of Philosophy in the Department of
Molecular Cancer Biology in the Graduate School of Duke University
2010

Copyright by Timothy J. Robinson
2010

iv
Abstract
Alternative mRNA processing can result in the generation of multiple,
qualitatively different RNA transcripts from the same gene and is a powerful engine of
complexity in higher organisms. Recent deep sequencing studies have indicated that
essentially all human genes containing more than a single exon generate multiple RNA
transcripts. Functional roles of alternative processing have been established in virtually
all areas of biological regulation, particularly in development and cancer. Changes in
alternative mRNA processing can now be detected from over a billion dollars’ worth of
conventional gene expression microarray data archived over the past 20 years using a
program we created called SplicerAV. Application of SplicerAV to publicly available
microarray data has granted new insights into previously existing studies of oncogene
over-expression and clinical cancer prognosis.
Adaptation of SplicerAV to the new Affymetrix Human Exon arrays has resulted
in the creation of SplicerEX, the first program that can automatically categorize
microarray detected changes in alternative processing into biologically pertinent
categories. We use SplicerEX’s automatic event categorization to identify changes in
global mRNA processing and demonstrate the ability of the conventional U133 platform
to detect five times as many 3’ terminal mRNA isoform changes as the Human Exon
array during B cell transformation.

v
Dedication
In memory of John J. Dinan.

vi
Contents
Abstract ......................................................................................................................................... iv
List of Tables .............................................................................................................................. viii
List of Figures ............................................................................................................................... ix
Acknowledgements ..................................................................................................................... xi
1. Alternative mRNA processing ................................................................................................ 1
1.1 Alternative mRNA processing as an engine of diversity in Eukaryotes ................. 1
1.2 High throughput methods available for the study of mRNA processing ................ 4
1.3 Computational Analysis of mRNA Processing ............................................................ 6
1.4 Focus of this work ............................................................................................................ 8
2. SplicerAV: a tool for mining microarray expression data for changes in RNA
processing .................................................................................................................................... 10
2.1 Introduction ..................................................................................................................... 10
2.2 Results and Discussion .................................................................................................. 13
2.3 Methods ........................................................................................................................... 41
2.4 General Comments ......................................................................................................... 46
3. Conventional Affymetrix U133 Arrays Provide Superior Detection of 3’ Located
Differential mRNA Processing Compared to Human Exon Arrays .................................... 48
3.1 Introduction ..................................................................................................................... 48
3.2 Results .............................................................................................................................. 49
3.3 Methods ........................................................................................................................... 61
3.4 Discussion ........................................................................................................................ 67

vii
4. Future Directions .................................................................................................................... 72
4.1 Proposed Role for the Alternative mRNA processing of Oncostatin M Receptor in
the Tumor Microenvironment ............................................................................................ 72
4.2 Isoform signature generation ........................................................................................ 75
4.3 Automated sequence extraction and motif finding ................................................... 76
4.4 Concluding Remarks ...................................................................................................... 76
Appendix A: Genes increased in LCLs vs. naïve B cells ....................................................... 77
Appendix B: Genes decreased in LCLs vs. naïve B cells ....................................................... 84
Appendix C: Genes alternatively processed in LCLs vs. naïve B cells ................................ 86
Appendix D: SplicerEX Categorization Algorithm ................................................................ 94
Appendix E: Discovery of Dengue virus host factors in insects and humans ................... 98
References .................................................................................................................................. 103
Biography ................................................................................................................................... 112

viii
List of Tables
Chapter 2
Table 1: SplicerAV related probeset features of commonly used Affymetrix microarrays. .......... 12
Table 2: SplicerAV predicts oncogene-induced changes in isoform specific mRNA levels. ........ 26
Table 3: GO analysis of 241 genes predicted to undergo isoform changes between grade I and grade III breast tumors (GUYT). ................................................................................................... 33
Table 4: Isoform changes in gene expression significantly associated with patient outcomes in both validation datasets. ................................................................................................................. 35
Chapter 3
Table 5: Gene ontology enrichment in genes increased in LCLs vs. naïve B cells ....................... 53
Table 6: Gene ontology enrichment in genes decreased in LCLs vs. naïve B cells ....................... 54
Table 7: Gene ontology enrichment in genes differentially processed between LCLs vs. naïve B cells ................................................................................................................................................ 56
Table 8: Categories of mRNA processing events assigned by SplicerEX ..................................... 57
Appendix D
Table 9: Common transcript inference (CTI) categories ............................................................... 97

ix
List of Figures
Chapter 1
Figure 1: Mechanisms of alternative mRNA isoform generation ................................................... 3
Figure 2: Comparison of exon array and 3’ gene expression array probeset features ..................... 5
Figure 3: Gaussian mixture model of changes in alternative processing ....................................... 15
Chapter 2
Figure 4: HRAS over-expression results in substantial relative isoform changes ......................... 24
Figure 5: HRAS over-expression causes isoform specific regulation of Epidermal Growth Factor Receptor (EGFR) in human mammary epithelial cells .................................................................. 28
Figure 6: SplicerAV Index of ARHGEF7 is associated with breast cancer survival ..................... 37
Figure 7: EIF4E2 probesets are associated with breast cancer survival ........................................ 39
Figure 8: A six isoform signature provides improved prediction of breast cancer survival compared to individual isoforms ................................................................................................... 41
Chapter 3
Figure 9: EBV induced transformation of Naïve B cells ............................................................... 50
Figure 10: U133 and HuEx arrays detect non-overlapping changes in alternative mRNA processing. ..................................................................................................................................... 52
Figure 11: Distribution of events observed by array platform. ...................................................... 58
Figure 12: U133 and HuEx arrays preferentially detect changes in mRNA processing in 3’ vs. 5’/internal transcript regions .......................................................................................................... 59
Figure 13: B cell transformation reduces 3’UTR length and internal exon content ...................... 60
Figure 14: Number of features targeting individual genes by array platform. ............................... 64

x
Chapter 4
Figure 15: Splicer AV predicted alternative processing of OSMR validated by RT-PCR ............ 73
Figure 16: Schematic of hypothesized OSMR regulation of OSM signaling within the tumor microenvironment .......................................................................................................................... 74
Appendix D
Figure 17: Binary decision tree used to categorize alternative mRNA processing events into discrete categories. ......................................................................................................................... 95
Appendix E
Figure 18: Heat map of low infectivity hits detected from the screen by plate positition ............. 99
Figure 19: Histogram of empirical and theoretical distributions of expected Sum Rank values. 102

xi
Acknowledgements
I thank my thesis advisors, Dr. Mariano Garcia-Blanco and Dr. Mark Dewhirst,
for their mentorship and advice during my graduate studies. In addition, I would like to
thank James Pearson, Micah Luftig, Caroline Le Sommer, Sebastian Oltean, and
Eleonora Forte for their contributions to my work. I would also like to extend my thanks
to Uwe Ohler, Ashley Chi, Alexander Hartemink, Sayan Mukherjee for their valued
teaching and insight, without which I would not have been able to enter the field of
genomics.
My thesis committee has been instrumental in forming my projects and helping
direct my research: Michael Datto, Joseph Lucas, Joseph Nevins.
I cannot thank my parents enough for their unwavering support and my brother
Davin for imparting his creativity. Finally, I thank my wife, Michaela, for her loyal
support, complementary perspective, drive, and uncanny ability to do back flips in heels.

1
1. Alternative mRNA processing
1.1 Alternative mRNA processing as an engine of diversity in Eukaryotes
The key postulate that one gene encodes one polypeptide chain (one enzyme) has
been overhauled with the discovery that one gene can generate multiple RNA transcripts
(and indirectly many different polypeptide chains) through a process referred to as
alternative mRNA processing (Blencowe 2006). Alternative processing defines a range
of events, including alternative splicing (AS) and alternative polyadenylation (APA),
which result in distinct mRNA species. Recent deep sequencing studies indicate that
94% of all protein coding genes generate multiple mRNA transcripts (Wang et al. 2008)
and mutations affecting mRNA splicing are responsible for an estimated 15-60% of
human genetic diseases (Krawczak et al. 1992; Lopez-Bigas et al. 2005). Functional
consequences of alternative processing have been shown across a wide variety of
biological processes (reviewed by (Garcia-Blanco et al. 2004; Venables 2006; Cooper et
al. 2009)) including drug metabolism, stem cell renewal, neurologic disease, autoimmune
disease, and especially cancer.
All multiple exon genes, by definition, contain tracks of intronic sequences that
are spliced, or removed, from pre-mRNA transcripts to yield mature, protein coding
transcripts. When more than one mature mRNA transcript is created from a single pre-
mRNA transcript, that gene is said to be alternatively processed.
There are several common mechanisms by which alternative mRNA transcripts
can be generated from the same gene (Black 2003; Wang et al. 2008)(Figure 1).

2
Alternative promoter use describes differential use of alternative 5’ pre-mRNA transcript
initiation sites. Alternative mRNA processing can occur through alternative mRNA
splicing or polyadenylation. Alternative mRNA splicing describes removal or retention
of internal pre-mRNA transcript content, including single cassette exons, mutually
exclusive cassette exons, introns, and alternative 5’ or 3’ definition of exon boundaries
(alternative 3’ or 5’ splice site (SS) use, respectively). Alternative splicing that results in
differential open reading frame (ORF) content can result in the production of proteins
with altered structure and function. Polyadenylation describes the addition of multiple
adenine (A) nucleotides to mature messenger RNAs, required for mature mRNA stability.
Alternative polyadenylation (APA) occurs when there are multiple locations within a pre-
mRNA that can signal for polyadenylation to occur, resulting in differential length or
selection of 3’ terminal exons.

3
Figure 1: Mechanisms of alternative mRNA isoform generation. Adapted from (Wang et al. 2008).
Databases of alternative mRNA processing events have emerged in recent years.
These databases contain sets of observed, predicted, or curated alternative mRNA
isoforms and associated regulatory sequence motifs (Koscielny et al. 2009) (Lee et al.
2003; de la Grange et al. 2005; Zheng et al. 2005; Bhasi et al. 2007; de la Grange et al.
2007; Foissac and Sammeth 2007; Kim et al. 2007; Castrignano et al. 2008). Fast DB,
developed by Auboeuf and colleagues, is one such resource that has become popular
among biologists (http://www.fast-db.com) by providing tools for visualizing known
alternative mRNA transcript structure and performing preliminary in silico analyses of
isform function, and regulation.

4
1.2 High throughput methods available for the study of mRNA processing
Despite the importance of alternative processing in cancer, current understanding
of its global regulation remains sparse (Takeda et al. 2006) and limits the ability to fully
harness alternative processing as a tool in cancer prognosis, diagnosis, and treatment.
Attempts to obtain a genome scale understanding of alternative processing in cancer have
focused on large-scale characterizations of changes between normal tissue and cancer.
Initial attempts to elucidate alternative mRNA transcript structure on a genomic
level began shortly after the sequencing of the human genome. Using the genome as a
reference point, researchers have been able to align partially sequenced mRNA
transcripts, or expressed sequence tags (ESTs), to detect alternative mRNA transcript
structures within thousands of genes(Kan et al. 2001). EST-based methods have been
used to compare EST databases of normal tissue vs. human cancer to detect enrichment
of cancer-specific splice variants(Xu and Lee 2003; He et al. 2009). EST-based methods
use databases pooled from numerous samples, and do not provide an indication of how
commonly any specific observed variant might be expected to appear within an
individual cancer. The inability of EST-based methods to infer changes in mRNA
structure at the individual level have largely prevented their use in profiling individual
cancer patients.
Quantification of changes in alternative processing between individual samples
became feasible with the advent of splicing sensitive microarrays (reviewed in (Blencowe
2006)). Splicing sensitive microarrays infer changes in alternative mRNA processing by

5
assaying the expression of individual exons and/or exon-junctions using complimentary
oligonucleotide probes printed as a small array on a chip. Splicing sensitive microarrays
differ from gene expression arrays primarily through the location and number of features
detected (Figure 22). One of the first commercially available human splicing arrays, the
Affymetrix Human Exon 1.0 ST, detects roughly 1.4 million features, 30 times more than
the current most commonly used gene expression array (HG-U133 2.0 plus). Exon arrays
have been used to detect changes in alternative processing between normal human tissues
and in breast, brain, colon, prostate, and bladder carcinomas(Gardina et al. 2006; Cheung
et al. 2008; Thorsen et al. 2008; Xi et al. 2008; Andre et al. 2009).
Figure 2: Comparison of exon array and 3’ gene expression array probeset features. Probesets are chosen from probeset selection regions (PSR) that target selected mRNA transcript exon features. Exon array probesets target exons throughout the entire length of known mRNA transcripts. 3’ gene expression array probesets preferentially target 3’ ends of known mRNA transcripts. Each probeset is composed of 4 probes on the exon arrays and 11 probes on the 3’ arrays.
Non array-based technologies capable of interrogating genome-wide changes in
alternative mRNA processing have recently emerged and include high throughput RT-

6
PCR and deep sequencing. Venables et al. have used a custom, high-throughput RT-PCR
technology to identify changes in mRNA splicing in both breast and ovarian cancer
samples compared to normal tissue and have used them to identify a role of FOX2 in a
large number of splicing events associated with these cancers (Venables et al. 2009).
High-throughput RT-PCR in its present form is not widely available to the research
community and can only examine internal cassette type splicing events. High-throughput
deep sequencing has been recently been used to perform extensive analysis of alternative
mRNA transcripts in normal human tissue, selected cell lines (Wang et al. 2008), and
lymphoblastoid cell lines(Pickrell et al.). At present, current costs and complex data
analysis make deep sequencing largely unavailable within the general research
community.
1.3 Computational Analysis of mRNA Processing
Genome-wide analysis of alternative mRNA transcript generation, compared to
conventional gene expression analysis, is inherently complex. Recent analyses of the
human genome place the number of known exons at 380,000, roughly an order of
magnitude greater than the number of known genes (Zhu et al. 2009). Traditional gene
expression analyses typically ignore details of transcript structure, while analyses of
mRNA processing, by definition, must describe changes in this structure.
Several algorithms have been developed to detect changes in mRNA processing
using exon array data, recently reviewed in [(Laajala et al. 2009)]. Although these
programs vary in their specific approach, common concepts have emerged in the field to
describe analyses of changes in alternative mRNA processing.

7
The statistic that is most commonly used to describe an isoform-specific change
between two groups is the splicing index (SI) (Srinivasan et al. 2005; Li et al. 2006; Clark
et al. 2007). The splicing index is analogous to the gene expression concept of “fold
change”, and is defined as the gene-level normalized change in expression of an isoform
between two comparison groups. In most analyses, minor isoforms are often represented
by a single exon or probeset. For single exon events, the splicing index is calculated as
follows:
SI = ( ExonTreat / GeneTreat ) / ( ExonControl / GeneControl )
Where:
ExonTreat = mean expression level of the AS exon in the treatment group
GeneTreat = mean expression level of the overall gene in the treatment group
ExonControl = mean expression level of the AS exon in the control group
GeneControl = mean expression level of the overall gene in the treatment group
[1]
Analyses of microarray expression data are typically conducted in log space, in
which case equation 1 becomes the following:
SI = ( ExonTreat - GeneTreat ) - ( ExonControl - GeneControl )
[2]
The basic statistical foundation of algorithms used to evaluate changes in
alternative mRNA processing is the null hypothesis that all features within a gene came
from the same distribution. The MIDAS (Microarray Detection of Alternative Splicing)

8
and ANOSVA methods both employ an analysis of variance (ANOVA) test for non-zero
interactions between treatment groups and exon (Affymetrix 2005) (Cline et al. 2005).
For ANOVA-based methods, the estimated interaction coefficient between exon and
treatment group provides an error bounded estimate of the splice index. PLATA (Probe-
Level Alternative Transcript Analysis) (Sandberg et al. 2008), MADS(Microarray
Analysis of Differential Splicing)(Xing et al. 2008), and PECA-SI (Probe-level
Expression Change Averaging - Splice Index) all use individual probes to test for mean
probe differences or non-zero splice indicies. FIRMA (Finding Isoforms using Robust
Multichip Analysis) frames detection of alternative events in terms of outlier
detection(Laajala et al. 2009). In practice, researchers appear to analyze exon array data
using either their own custom software or a commercially available analysis package
such as EASANA (www.genosplice.com), XRAY (www.biotique.com), or PARTEK.
1.4 Focus of this work
Existing models of alternative mRNA processing test the alternative hypothesis
that microarray features targeting the same gene do not come from the same
distribution. In this thesis, I have framed a more specific alternative hypothesis that
tests whether microarray features targeting the same gene come from two distinct
distributions. By modeling alternative mRNA processing as two distinct events, we
have created a more focused model that tests a specific hypothesis. Throughout the
remainder of this thesis, I describe the implementation of this model and how we have

9
tailored it to assist biologists in search of experimental models of alternative mRNA
processing regulation.
In chapter 2, I describe the implementation of a biologically motivated model of
alternative mRNA splicing, SplicerAV and demonstrate its ability to yield new
biological insights from archival conventional gene expression microarray data.
Chapter 3 describes the adaption of SplicerAV to exon microarrays, called
SplicerEX. In this chapter we extend the specific hypothesis generated by SplicerEX to
include inference on the type and direction of predicted changes in mRNA processing,
and use this to identify previously unobserved characteristic changes in mRNA
structure in a model of B cell transformation by Epstein Barr Virus.
Chapter 4 describes areas of potential future research. Appendices A-C provide
hit lists from the analysis presented in chapter 3. Appendix D provides a description of
the SplicerEX categorization algorithm. Appendix E describes my role in analyzing a
genome-wide siRNA screen in Dengue fever host factors.
10
2. SplicerAV: a tool for mining microarray expressi on data for changes in RNA processing
In this chapter, I describe the creation and implementation of a novel program,
SplicerAV, that is capable of analyzing archival conventional 3’ gene expression arrays
for evidence of changes in alternative mRNA processing. We exploit the ability of
SplicerAV to analyze changes associated with clinical cancer progression.
2.1 Introduction
Large scale clinical cancer analyses of changes in alternative processing remain
sparse, and there have been no high-throughput analyses of changes in mRNA processing
directly associated with poor patient prognosis. Such studies require years of patient
follow-up and have not been reported using the new splicing arrays, which have instead
only analyzed changes between normal tissue and cancer.
Public repositories such as the Gene Expression Omnibus (GEO) currently
contain conventional gene expression data from hundreds of thousands of unique
biological or clinical samples ((Barrett et al. 2009)). Data previously generated by the
microarray community provide an untapped source of potential insight to the regulation
of alternative mRNA processing in human cancer. It is likely that well over a billion
dollars have been invested in these data through reagents, facility, and personnel costs
over the past two decades.
The first commercially available high-density gene expression microarrays were
invented three decades ago by Affymetrix (Fodor et al. 1993) to quantify expression
changes in tens of thousands of genes in a single experiment, but were not intended to

11
detect isoform specific mRNA changes resulting from alternative processing. Two of the
most commonly used human expression microarrays, the Affymetrix U95 and U133
series, use individual probesets to report expression of many genes. Each probeset is
composed of 11 individual 25nt oligomers that interrogate a subsequence of the target
gene. Both platforms, however, contain thousands of genes whose expression is assayed
by more than one probeset. The use of multiple probesets, which often interrogate non-
overlapping regions of the target gene, was originally intended to provide a robust assay
of gene expression. We and others have previously observed that discrepancies between
fold-changes in probesets interrogating the same gene can represent isoform-specific
changes in mRNA levels [20-22]. Such isoform changes can result from alternative
transcription start sites, alternative mRNA processing, or changes in mRNA isoform
stability.
Methods that detect isoform-specific mRNA changes have been developed for
splicing microarrays such as the Affymetrix Human Exon 1.0 ST (reviewed in (Laajala et
al. 2009)), but have not been developed for or applied to conventional gene expression
microarrays. In fact, it has been suggested in such reviews that “detection of disease-
relevant splicing differences may be entirely missed in gene-level expression profiling
studies” (Laajala et al. 2009). Although it may be possible in theory to apply such
methods to conventional gene expression microarrays, to our knowledge this has not been
done. To fully investigate the potential to detect isoform-specific mRNA changes in
conventional gene expression microarray data, we elected to develop a novel method,

12
SplicerAV, which we have applied to conventional Affymetrix gene expression
microarray data.
For the Affymetrix GeneChip Human U133 plus 2.0 arrays, 11,193 genes, which
represent 57% of uniquely annotated genes assayed by the array, are interrogated by
multiple probesets and can therefore be queried for mRNA isoform changes, with an
average of 3.2 probesets interrogating these genes (Table 1). For the U133A arrays, 36%
are interrogated by multiple probesets, with an average of 2.7 probesets per gene for a
total of 4,609 genes. The U133 series of array platforms are among the most commonly
used platforms within GEO (over 40,000 samples) and have the potential to detect
isoform changes in thousands of genes.
Table 1: SplicerAV related probeset features of commonly used Affymetrix microarrays.
Platform Unique Annotated Genes
Genes w/ Mult Probesets
Fraction of genes w/ mult probesets
Avg. Probesets per gene
Unannotated Probesets
Total Probesets
U133 Plus 2.0 19,761 11,193 57% 3.2 9818 54,675 U133 A 12,737 4,609 36% 2.7 1917 22,283 U95 A 8,690 1,946 22% 2.4 1253 12,651 Mouse 430A 2 12,755 4,934 39% 2.6 2118 22,690
SplicerAV is a program created to systematically assess the likelihood of changes
in alternative processing evidenced by discrepancies in probeset behavior using a
Gaussian mixture model of mRNA transcript regulation. A beta version of this program,
which lacked biological modifiers and the ability to generate estimates of statistical
significance, was initially used to identify differential regulation of transcript isoforms by
TCERG1 (Pearson et al. 2008). SplicerAV can be applied to any expression microarray
platform with multiple probesets interrogating the same gene, without the need for

13
detailed transcript annotation. The program provides a non-computationally intensive
algorithm capable of analyzing probeset-summary level datasets for evidence of changes
in alternative mRNA processing. We provide here a description of SplicerAV, which has
been developed to provide a rigorous statistical model and incorporate biologically
motivated modifications with the goal of assisting biologists in identifying alternative
processing events most amenable for in-depth study from conventional gene expression
microarray data.
In this study SplicerAV’s unique value in detecting previously overlooked
changes in mRNA processing is demonstrated using publicly available Affymetrix U133
gene expression datasets. SplicerAV was used to uncover previously uncharacterized
isoform specific changes in epidermal growth factor receptor (EGFR) caused by in vitro
HRAS over-expression (Bild et al. 2006). In a separate analysis, SplicerAV was used to
identify changes in alternative mRNA processing associated with poor patient prognosis
in over 400 breast tumors. Here we demonstrate SplicerAV’s ability to examine archival
data, performing the largest analysis of alternative mRNA processing in human cancer to
date and the only high-throughput analysis of changes in alternative mRNA processing
associated with human cancer prognosis.
2.2 Results and Discussion
SplicerAV Algorithm
There are two main steps in the SplicerAV analysis. The first step summarizes
individual probeset changes in expression between a user defined group of control and

14
treatment observations. The second step evaluates these probeset level summaries for
evidence of changes in alternative processing using a Gaussian mixture model (Figure 3).
In the first step, changes in probeset expression levels are summarized by
calculating their average log2fold changes and corresponding t-statistics. These metrics
were taken from conventional gene expression analysis. Probesets targeting the same
gene are then grouped together and each probeset is assigned a weight. Individual
probeset weights are calculated using a combination of that probeset’s t-statistic, number
of observations, and comparison with other probesets targeting the same gene (see
methods).

15
Figure 3: Gaussian mixture model of changes in alternative processing. Absolute expression of a hypothetical gene is reported by four independent probesets targeting different regions of this gene; I, II, III, IV (left panels) for control and treatment conditions (open and closed bars respectively). The idealized Gaussian mixture models representing changes in probeset behavior are illustrated in the right panels. Panels A, B, and C represent concordant probeset behaviors corresponding to no change, an increase, and a decrease, respectively. Panel D represents discordant behavior; two probesets (I, II) report an increase, while the remaining probesets (III, IV) report a decrease in expression between conditions (control and treatment). Probesets may report discrepant changes in gene expression depending on which region of the mRNA transcript they interrogate.

16
Once these weights are assigned, each gene is evaluated for evidence of
alternative processing using a Gaussian mixture model. In the Gaussian mixture model
used by SplicerAV, probesets interrogating a transcriptionally activated gene are
predicted to detect the same proportional increase in expression. For example, probesets
targeting an mRNA that doubles in abundance would be expected to double in intensity
(Figure 3B). Conversely, probesets targeting an mRNA which is down-regulated by half
would be expected to be reduced by half Figure 3C). Multiple probesets targeting a gene
that is alternatively processed or undergoes isoform specific mRNA regulation would be
expected to report discordant changes in probeset intensities (Figure 3D).
Plotting the same aforementioned hypothetical data as log2 fold-changes
emphasizes that in alternatively processed mRNAs, summarized probeset behavior
clusters into discrete groups (Figure 3, right). SplicerAV assesses this grouping
mathematically assuming a Gaussian mixture model, which compares fitting the data
using one vs. two Gaussian distributions. Fitting the probeset expression data with a
single Gaussian curve equates to a biological model in which the gene is regulated as one
expression unit (e.g., all transcripts are destabilized equally). Fitting the data with a two
Gaussian model equates to a biological model in which the gene is regulated as two or
more expression units, corresponding to changes in isoform specific regulation.
Comparing the ratio of how well each model fits the summarized probeset data gives a
maximum likelihood ratio, or MLR, which gives an indication of how well the
summarized probeset data are described by changes in alternative processing relative to
whole transcript regulation. The lowest possible log MLR for a gene is zero, which

17
indicates that all probesets change proportionally and suggests no evidence of alternative
processing. Log MLRs greater than zero indicate discrepancy in the expression changes
in the probesets, which can be caused by an alternative processing event. The greater the
value of the log MLR the more likely a gene is to be alternatively processed (see methods
for more details).
( )( )CurveGaussianSingledataprobesetofLikelihood
CurvesGaussianTwodataprobesetofLikelihoodMLR
|
|=
[1]
SplicerAV uses the chip annotation file (“platform_annot.csv” for Affymetrix
arrays) to determine which probesets interrogate the same gene. For most microarray
platforms the gene symbol provides an appropriate annotation scheme, however any
provided annotation (Transcript cluster ID, WormBase, FlyBase, Ensembl, etc.) can be
used.
Probeset Annotation & Filtering
Our analyses used the default probeset annotation provided by Affymetrix. This
annotation contains probesets that in some cases target multiple exons or are poorly
annotated (Ferrari et al. 2007) (Lu et al. 2007) (Yu et al. 2007). Re-defining probeset
definition, for example using exon-based definitions of probesets, may improve the
ability of SplicerAV to detect changes in mRNA processing (Ferrari et al. 2007) (Lu et al.
2007). However, using the standard annotation provided by Affymetrix makes our
findings here directly comparable to the vast majority of expression analyses conducted

18
using the U133 series of arrays, allowing reference to specific probeset IDs and enabling
us to directly analyze summarized expression datasets deposited in GEO. Roughly half
of all (not limited to Affymetrix) microarray expression datasets deposited in GEO do not
contain CEL files (Yu et al. 2007) and cannot be re-analyzed using custom annotation.
The use of standard Affymetrix annotation also allows us to make
presence/absence probeset detection calls using previously validated methods (Warren et
al. 2007). As described above, SplicerAV detects discrepancies in fold changes between
probesets targeting the same gene, using these discrepancies to infer changes in
alternative mRNA processing. Nevertheless, such discrepancies can also reflect the
presence of negative strand matching probesets (NSMPs) or probesets that do not
produce signal above background, which can be caused by low transcript levels or non-
functional probes. NSMPs hybridize or detect RNAs transcribed in the opposite direction
of the annotated gene; they do not reflect the expression of the target transcript and are
identified and removed by SplicerAV using information available in standard Affymetrix
annotation files (Warren et al. 2007). Probesets that do not produce signal can also
falsely suggest isoform specific mRNA changes. These probesets are removed by
SplicerAV if they are not expressed above background (P<.05) in either treatment or
control groups using the Presence-Absence calls with Negative Probesets (PANP)
algorithm (Warren et al. 2007).
Biological Modifiers
The original motivation for SplicerAV was to identify statistically significant
changes in alternative processing that would also provide ideal targets for further

19
experimental validation and study. To this end, we incorporated additional, user-
modifiable parameters, which can preferentially rank events expected to be more
amenable to experimental investigation. There are three biological modifiers applied to
the MLR to generate the final splice score: a multiple probeset correction to adjust for
total possible paired groupings of probesets, an expression cutoff modifier to specify the
minimum change required between isoforms, and a centering modifier to preferentially
rank genes whose probeset expression levels change in opposite directions. All modifiers
are normalized by the average number of paired control and treatment observations for all
probesets within a gene (Avg_Obs), so that large samples with higher statistical power
will be as influenced by the modifiers as smaller samples, providing parameters that can
be applied with consistent effects across varying sample sizes (see equation 2 and
methods).
)(*
_
ModifiersCenteringCutoffprobesetMultiple
ObsAvgMLRScoreSplice
++
+=
[2]
These modifiers do not affect the p-value generated by SplicerAV, but allow the
program to preferentially rank predicted changes in alternative processing that generate
less complicated hypotheses, are larger in magnitude, reflect changes in expression which
are qualitatively different, and are less likely to reflect probesets targeting non-
transcribed regions or probesets that do not linearly reflect changes in transcript
abundance. Genes that exhibit statistically significant discordant probeset behavior and

20
are given a positive splice score represent ideal candidates for experimental investigation
of isoform specific regulation.
SplicerAV generates several additional outputs with each file. These include a
file containing assessment of statistically significant expression changes for all probesets,
a log file containing all user set parameters and comparisons made, as well as a FASTA
file for each gene. These fasta files contain the target sequences of all probesets targeting
that gene, allowing quick and easy mapping to known and predicted mRNA sequences
using the UCSC genome browser (http://genome.ucsc.edu) (Kent et al. 2002). All
genomic analyses in this study were performed using the March 2006 release of the
human genome (hg18).
SplicerAV Index Generation
To perform analyses of isoform changes within individual samples we derived an
index of relative isoform abundance predicted by SplicerAV. High-throughput analyses
of alternative processing have previously defined “splice index” as a quantitative measure
to compare isoform abundances between individual samples. The splice index of a
probeset equals its expression relative to other probesets targeting the same gene
(Srinivasan et al. 2005). Using SplicerAV we defined a modified version of the splice
index, referred to as the SplicerAV index. SplicerAV assumes a Gaussian mixture
model, whereby all probesets are classified as belonging to one of two groups based on
similarity of expression changes. The group of probesets exhibiting the largest increases
in expression are referred to as the “A” (up) group and the group of probesets exhibiting
the largest decreases in expression are referred to as the “B” (down) group. The

21
SplicerAV index of a probeset equals its expression relative to the average expression of
probesets in the opposite group. For example, the SplicerAV index of a probeset in the
“A” group would be calculated by subtracting the average expression of the “B” group
from that probeset’s log2 expression value. In our analysis, SplicerAV indexes of
probesets in the “A” group were defined as increased in aggressive cancers, while
indexes of probesets in the “B” group were defined as decreased in aggressive cancers.
Pre-specified hypotheses generated in training datasets made unidirectional significance
tests appropriate in independent validation datasets.
SplicerAV Implementation
SplicerAV was implemented in Perl, with a typical run time of 3-5 minutes on a
standard personal computer and has not been tested using other operating systems. The
program will only assess changes in alternative mRNA processing for genes interrogated
by multiple probesets, which varies widely by microarray platform. To explore the
potential for SplicerAV to identify novel changes in mRNA isform abundance in breast
cancer, we applied SplicerAV to several publicly available, archival Affymetrix HG-
U133 plus 2.0 datasets.
SplicerAV predicts oncogene induced changes in alternative processing of splicing factors Studies of SRC (Neel et al. 1995), HRAS (Chandler and Bourgeois 1991; Chandler et al.
1994), and E2F family binding sites (Darville and Rousseau 1997) have demonstrated
isolated roles of these oncogenes in affecting alternative mRNA processing.
Nonetheless, prior to this study no large-scale examination of changes in alternative

22
mRNA processing had been undertaken for any of these oncogenes. We examined an
oncogene over-expression microarray dataset published by Nevins and colleagues (Bild
et al. 2006) (GEO accession GSE3151) to demonstrate SplicerAV’s ability to detect
oncogene driven changes in alternative processing. In this experiment, activated HRAS,
SRC, E2F3, activated β-catenin (CTNNB1), MYC, or green fluorescent protein (GFP)
was over-expressed in human primary mammary epithelial cells. The Affymetrix U133
plus 2.0 microarray platform was used to assay gene expression in seven to ten replicates
of each condition. Probeset level intensities were estimated using the Robust Multichip
Averaging (RMA) procedure (Irizarry et al. 2003).
SplicerAV compared changes in probeset expression between GFP and over-
expression of the HRAS, SRC, E2F3, CTNNB1, or MYC oncogenes. Roughly 7,000
genes were expressed above background in either GFP or oncogene over-expression,
depending on the oncogene (“Total” column; Table 2). More than 2,000 of these genes
were interrogated by multiple probesets, and could therefore be examined by SplicerAV
for evidence of changes in alternative mRNA processing (“Multi-probeset Genes”
column). More than a hundred isoform specific changes were predicted for each
oncogene (Example SplicerAV output shown in Figure 4Error! Reference source not
found.A; “Alt. Processed Genes” column Table 2). HRAS over-expression caused 645
significant isoform changes, suggesting HRAS-induced changes in alternative processing
in nearly a tenth of all expressed genes. The median relative fold change between
isoforms was 1.39 (log2 fold change of .48), with 61 (9%) of these genes predicted to
undergo a greater than two fold change in relative isoform abundance (Figure 4B).

23
Figure 4: HRAS over-expression results in substantial relative isoform changes.

24
Figure 4: HRAS over-expression results in substantial relative isoform changes. A) Example SplicerAV output comparing HRAS to GFP over-expression. Genes are ranked in order of descending Splice Score (top three genes shown), with EGFR receiving the top score in HRAS over-expression. Log2 fold change in expression and corresponding p-values from two tailed homoskedastic t-test of differential expression are shown for individual probesets targeting each gene. Probesets are placed into A and B groupings by SplicerAV (see text). Splice score, SplicerAV p-value, and two way ANOVA p-values are shown for each gene. (B) Distribution of the 645 isoform changes (AS Events) predicted by SplicerAV (p<.01) upon HRAS over-expression in human primary mammary epithelial cells. For each gene, SplicerAV separates probesets into two similarly behaving groups based on similar fold changes in expression. The average change in expression between probesets in these two groups (AvgChange, see Equation 8 in methods) reflects the relative fold change in isoform abundance predicted by SplicerAV. Absolute relative fold change in isoform abundance is shown in log base 2.

25
Gene isoform changes receiving both a significant p-value and a positive splice
score indicate ideal candidates for further experimental study (“Genes with Splice Score
> 0” column; Table 2). HRAS and SRC over-expression resulted in 212 and 119 such
events, while MYC over-expression resulted in only 12 (Table 2). One gene,
Programmed Cell Death Protein 5 (PDCD5), underwent the same change in alternative
processing upon over-expression of each of the five oncogenes. PDCD5 switched from
an alternative isoform (mRNA AK293486) to the major isoform (mRNA BC015519),
which codes 37 isoform specific c-terminal amino acids required for PDCD5 nuclear
entry & activation of apoptosis (Yao et al. 2009). Gene ontology (GO) analysis of
isoform specific changes revealed a common selection for genes involved in mRNA
splicing (see methods). Over-expression of all oncogenes other than MYC each resulted
in significant (p≤.05) enrichment of isoform specific changes in mRNA splicing, pre-
mRNA splicing, or mRNA processing factors (Table 2). HRAS and SRC over-
expression resulted in predicted isoform changes in 12 (p=.009) and seven (p=.05) factors
involved in mRNA splicing, respectively. Both HRAS and E2F3 isoform specific
changes were enriched for G-protein mediated signaling (p = .04; p = .0009) and roles in
immune function (p=.02; p=.01). Sixty-seven genes were predicted to undergo isoform
changes in common between two or more oncogenes. Messenger RNA processing
factors (5 genes, p=.008; WDR33, HNRPC, SF3A1, SNRPA1, TRA2A) and mRNA
splicing factors (8 genes, p=.0003; HNRPC, HNRPD, TARDBP, HNRPH1, SF3A1,
HNRPA2B1, SNRPA1, TRA2A) were the most significant molecular function and
biological process represented by these genes.

26
Table 2: SplicerAV predicts oncogene-induced changes in isoform specific mRNA levels.
Unique Expressed
Genes SplicerAV
Predictions (P<.01)
GFP vs.
Total Multi-
probeset Genes
Alt. Processed
Genes
Genes with
Splice Score > 0
Significant Gene Ontologies
HRAS 7227 2185 645 212 mRNA splicing (12)
Complement med immunity (3) G-protein mediated signaling (10)
SRC 7007 2015 291 119 Transcription Elongation (2)
mRNA splicing (7) CTNNB1 7023 2019 159 54 mRNA processing factors (4)
E2F3 7313 2139 187 45
Cell surface receptor signal (10) G-protein mediated signaling (6)
Mesoderm development (6) Cell structure and motility (11)
pre-mRNA splicing (5) Granulocyte-mediate immunity
(2) MYC 7081 2040 115 12 ---
HRAS over-expression results in isoform specific EGFR mRNA regulation
Epidermal growth factor receptor (EGFR) was the top ranked gene prediction in
HRAS over-expression (p< 10-5). EGFR expression was interrogated by seven
probesets, providing an ideal opportunity to examine the behavior of multiple probesets
targeting different regions of the same gene. Depending on the EGFR region being
interrogated, probesets reported either a significant increase or decrease in expression
upon HRAS over-expression (Figure 5). Four main mRNA isoforms of EGFR are
annotated in the NCBI database, labeled A, B, C, and D. Isoform A encodes the full
length membrane bound tyrosine kinase receptor (Ullrich et al. 1984; Kashles et al.
1991). Variants of isoform A have been observed with either long (ALong) or short
(AShort) 3’UTRs (UCSC mRNA accession X00588(Ullrich et al. 1984) and AK225422

27
(Suzuki et al. 1997)). Isoforms B and D encode truncated intracellular domains (RefSeq
NM_201282; RefSeq NM_201284) and isoform C (RefSeq NM_201283) encodes an
EGFR variant that lacks a trans-membrane domain and is expected to be soluble (Reiter
et al. 2001).

28
Figure 5: HRAS over-expression causes isoform specific regulation of Epidermal Growth Factor Receptor (EGFR) in human mammary epithelial cells. (A) Probesets on the Affymetrix U133 2.0 plus array interrogate EGFR expression at seven different genomic locations. Up and down arrows indicate each probeset’s expression changes in HRAS over-expression compared to GFP controls. Probeset 5 experienced a significant decrease in expression with HRAS over-expression, but was not expressed above background. B) UCSC genomic alignment of probesets and EGFR isoforms. Four previously observed EGFR isoforms (A, B, C and D) are shown with exons represented as black boxes and introns as hashed lines. Extracellular, transmembrane, and intracellular domain regions are shown below the alignment. C-F) Scatter plots of logged expression levels of all 55 samples (GFP, MYC, SRC, CTNNB1, E2F3, and HRAS) for selected pairs of probesets C) Probesets 1 and 2 target a transcript region common to all major isoforms and exhibit highly correlated expression (R2 = .95). D) Probesets 1 and 3 target the common region vs. isoform B specific region and demonstrate a weak inverse relationship (R2 = .36). E) Probesets 1 and 6 interrogate the common vs. AShort isoform region, demonstrating a high degree of correlation across all samples (R2 = .87). F) In contrast, probesets 1 and 7 interrogate common and ALong isoform region and are not correlated (R2 = .01) due to the HRAS induced 3’UTR shortening of EGFR A transcripts.

29
Probesets 1 and 2, which target a region common to all four isoforms, reported
highly concordant (R2 = .95) expression levels across all 55 samples in the dataset
(Figure 5C). Probesets targeting different transcript regions (1 and 3) reported poor or
even inversely correlated expression levels, (R2 = .36, Figure 5Figure D). Due to this
“outlier” behavior these probesets would be discarded during conventional microarray
expression analysis (Jaksik et al. 2009), however, SplicerAV data suggest that this
behavior reflects isoform-specific regulation of EGFR expression
EGFR isoform A (AShort) appeared to be the primary transcript upregulated by
HRAS over-expression, as evidenced by highly correlated expression of the probesets
targeting the common and AShort isoforms (probesets 1 and 6; R2 = .87). HRAS over-
expression caused a robust decrease in the probeset targeting the long 3’UTR of EGFR
(probeset 7; ALong) that was not correlated with expression of the common transcript
region (Figure 5Figure F, R2 = .01). In contrast, common and ALong expression levels
were well correlated in non-HRAS samples (R2 = .70). These data suggest a HRAS-
specific shortening of the isoform A 3’UTR.
We hypothesize that these HRAS-induced isoform changes promoted EGFR
activation via several mechanisms. HRAS increased overall isoform A transcript levels,
as evidenced by significant increases in probesets interrogating common regions of the
gene (probesets 1 & 2). At the same time, HRAS over-expression resulted in selection of
a shorter 3’ UTR, which removes known miRNA binding sites present in the ALong
UTR and likely increased translation of EGFR mRNAs (Weiss et al. 2008). Widespread
3’UTR shortening to escape miRNA regulation has been observed previously in

30
proliferating cells (Sandberg et al. 2008). EGFR isoforms B & D code for a truncated
intracellular domain, which if translated could dimerize with and inhibit activation of
both EGFR and HER2 (Kashles et al. 1991). The observed down-regulation of these
isoforms is predicted to promote EGFR1 and HER2 activation (Kashles et al. 1991). It
should be noted, however, that the corresponding truncated receptors have not been
observed. Soluble isoforms composed of the extracellular domain occur naturally and
suppress ligand-dependent EGFR signaling and oncogenic transformation in a dominant
negative manner (Basu et al. 1989). Our data indirectly address expression levels of the
soluble isoforms, which appear to be unchanged.
Our data suggest that HRAS acts through several isoform-specific mechanisms to
promote EGFR family signaling. EGFR signaling plays known roles in cell survival,
proliferation, adhesion, migration, and differentiation (Adamson and Wiley 1997) . Both
EGFR and HER2 are currently therapeutic targets in breast cancer (Browne et al. 2009).
Our analysis here suggests that modified regulation of alternative mRNA processing
could be used as a novel means of EGFR inhibition, similar to that shown recently for
HER2 using splice site switching oligonucleotides (Wan et al. 2009).
SplicerAV predicted isoform changes exhibit low overlap with gene expression changes
Using the same gene expression dataset, SplicerAV was able to predict a number
of previously unappreciated changes in isoform specific mRNA regulation. Genes
predicted to undergo isoform changes exhibited small overlap with genes predicted to
undergo expression changes by conventional analysis, consistent with previous findings

31
in the field (Blencowe 2006) (Li et al. 2006) (Zhang et al. 2006). HRAS and SRC over-
expression resulted in the largest changes in both gene expression and isoform changes.
Of the212 genes predicted to undergo ideal isoform changes (significant p-value and
positive splice score) in HRAS over-expression, only 8 genes (3.8%) were also among
the top 212 most significant changes by conventional expression analysis (data not
shown). Of the top 119 predicted isoform changes in SRC over-expression, none were in
the top 119 most significant expression changes. This low degree of overlap suggests
that the results obtained via SplicerAV are largely orthogonal to that of conventional
gene expression analyses. This low degree of overlap provides the potential for
combining traditional gene expression signatures with SplicerAV isoform-based
signatures to improve signature performance.
SplicerAV predicts isoform changes in high vs. low grade breast tumors Our analysis of oncogene regulated isoform expression demonstrated the ability to
generate novel insights into cancer biology. We next determined if similar insights could
be obtained from the analysis of alternative processing in clinical tumor samples. Breast
cancer has been extensively studied using high-throughput analyses of gene expression at
the transcriptome level (Reviewed in (Sotiriou and Pusztai 2009)). In contrast, high-
throughput analysis of alternative mRNA processing in breast cancer has been addressed
in only a handful of studies (Li et al. 2006) (Andre et al. 2009) (Dutertre et al. 2010). We
explored the ability of SplicerAV to detect changes in alternative processing between low
and high grade breast tumors in archival expression data.

32
Sotiriou and colleagues profiled 87 Tamoxifen treated, estrogen receptor (ER)
positive tumors obtained from Guys Hospital, London (GUYT) using the Affymetrix
HG-U133 PLUS2 GenechipTM(Loi et al. 2008)( GEO accession GSE6532, RMA
normalized). Using this dataset, we examined changes in probeset expression between
low grade (I, n=17) and high grade (III, n=16) breast tumors. Analysis was limited to
probesets present on either the U133A or U133B arrays in order to validate changes in
two independent data sets discussed in the next section. 11,248 unique genes were
expressed above background in either the low or high grade tumor samples. Among the
4,031 genes interrogated by multiple probesets, SplicerAV predicted that 974 genes
underwent significant isoform changes between aggressive and non-aggressive breast
tumors (p<.01). Removing genes with negative splice scores yielded a refined list of 241
genes. GO analyses of these 241 genes revealed significant (p<.05) enrichment for
several molecular functions including guanyl-nucleotide exchange factors (RAB3IP,
RAPGEF2, GAPVD1, CD47, TRIO, ARHGEF7, AKAP13; p=.006), metalloprotease
inhibitors(TIMP2, TIMP3; p=.007), ubiquitin-protein ligases (RNF130, TTC3 UBE3B,
PML, TRIM26, RBCK1, MIB1, ZNF294, ZUBR1, TRIAD3; p=.007), and mRNA
processing factors (SYNCRIP, WDR33, SFRS8, SFRS15,TAF15, SF1, SF3B1, SFPQ,
PRP6; p=.01; Table 3).

33
Table 3: GO analysis of 241 genes predicted to undergo isoform changes between grade I and grade III breast tumors (GUYT).
Molecular Function
# Genes P-Value Gene Symbols
Guanyl-nucleotide exchange factor
7 6.22E-03 RAB3IP, RAPGEF2, GAPVD1, CD47, TRIO, ARHGEF7, AKAP13
Metalloprotease inhibitor 2 6.52E-03 TIMP2, TIMP3
Ubiquitin-protein ligase 10 7.40E-03 RNF130, TTC3 UBE3B, PML, TRIM26, RBCK1, MIB1, ZNF294, ZUBR1, TRIAD3
mRNA processing factor 9 1.27E-02 SYNCRIP, WDR33, SFRS8, SFRS15,TAF15, SF1, SF3B1, SFPQ, PRP6
Cytoskeletal protein 4 3.42E-02 DNAL1, NF2, KIF5C, DYNC1H1
Anion channel 2 3.63E-02 PML, CLCN3
G-protein modulator 12 4.64E-02 RAB3IP, RAPGEF2, GAPVD1, CD47,
mRNA splicing factor 6 4.94E-02 TAF15, SFRS8, SF1, SF3B1, SFPQ, PRP6
Tyrosine protein kinase receptor
4 4.97E-02 TEK, TPR, IGF1R, PDGFRA
SplicerAV predicted isoform changes are associated with breast cancer survival
SplicerAV probeset groupings of genes identified in the GUYT training set were
used to create individual sample level indexes of relative isoform abundance. We tested
an association of these SplicerAV indexes in two independent validation datasets to
examine whether specific isoform changes observed in high grade tumors were also
associated with poor patient prognosis (see methods). Previous datasets generated by
Miller (Miller et al. 2005) (GSE3494) and Pawitan (Pawitan et al. 2005) (GSE1456)
have independently profiled breast tumor gene expression using the Affymetrix U133 A
and B microarrays (probeset intensities were estimated using MAS5 (69)). These studies

34
include patient outcome, providing the opportunity to test for an association of isoform
changes with survival in ER positive tumors.
We generated 687 SplicerAV Indexes from the 241 genes identified in the GUYT
training set and calculated their value for each tumor sample in the validation sets. For
each SplicerAV Index, tumors were sorted into the top and bottom 50th percentile of
tumors. High and low SplicerAV Index groups were then tested for a difference in
survival. The GUYT training set had previously determined whether a SplicerAV index
was predicted to be increased or decreased in aggressive cancer (defined as Grade III vs
Grade I). This pre-specified association with aggressive cancer was used to conduct one-
sided logrank tests (p<.05) for an association with breast cancer survival for each
SplicerAV index in the validation datasets. Failure in the Miller dataset was defined as
death from any cause and failure in the Pawitan dataset was defined as death from breast
cancer (inherent to the clinical data available). Of the 241 genes tested, 15 genes
possessed indexes that were significantly associated with survival in both datasets (Table
4). Guanyl-nucleotide exchange factors (GEFs) and mRNA processing factors were both
enriched among the original 241 genes tested. Interestingly, these GO categories were
both represented among the 15 validated genes including ARHGEF7, a guanyl-nucleotide
exchange factor, and SFPQ, an mRNA processing factor.

35
Table 4: Isoform changes in gene expression significantly associated with patient outcomes in both validation datasets.
SplicerAV Predictions Association with
Survival Gene
Symbol† Isoform Probeset Hypothesis Miller Pawitan
ARHGEF7 202548_s_at DOWN *0.009 *0.008 DPP7 241973_x_at DOWN *0.001 *0.007
EIF4E2 209393_s_at UP **0.002 *0.003 MAPKAP1 222426_at DOWN *0.019 *0.003 SLC28A10 230448_at UP *0.007 0.032
PDXK 202671_s_at UP **0.001 0.025 POLI 238992_at UP 0.037 0.052 SFPQ 201585_s_at UP 0.062 0.041 SIVA1 203489_at UP *0.005 0.075 SSU72 223051_at UP *0.018 *0.007 TFDP2 203588_s_at UP 0.054 *0.008 TIMP2 231579_s_at DOWN **0.001 0.056
TncRNA 234989_at UP **0.001 0.034 WDFY3 212606_at UP 0.049 *0.010 WDR26 224897_at UP **0.001 0.049
†For genes possessing multiple significant SplicerAV Indices, only one isoform is shown. *Significant association with survival (p<.01), one sided log rank test ** Significant association with survival (p<.001), one sided log rank test
Few studies have performed high-throughput examination of alternative
processing in clinical tumor samples (Gardina et al. 2006; Andre et al. 2009) and to our
knowledge no prior studies have examined changes in alternative mRNA processing
directly associated with cancer patient survival. This study examined isoform specific
mRNA levels in over 400 human clinical samples, providing support for the use of
changes in alternative processing as potential prognostic markers in cancer.
ARHGEF7 & EIF4E2 isoform changes are associated with breast cancer survival

36
A SplicerAV index for Rho guanine nucleotide exchange factor 7 (ARHGEF7)
was decreased in high vs. low grade tumors within the GUYT dataset, and was
significantly associated with survival in both the Miller (p=.008) and Pawitan (p=.009)
datasets. ARHGEF7 expression was assayed by three annotated probesets, providing an
opportunity to compare associations of survival with either SplicerAV index or individual
probeset expression. The SplicerAV index for ARHGEF7 compared the ratio of a
decreasing (“Down”) probeset located in the 3’UTR of ARHGEF7 to that of two
increasing (“Up1” and “Up2”) probesets located in shorter transcripts (Figure 6Figure
A). We compared the ARHGEF7 SplicerAV index and each individual probeset for an
association with breast cancer survival and noted that the SplicerAV index outperformed
individual probeset in both datasets (Figure 6Figure B).
37
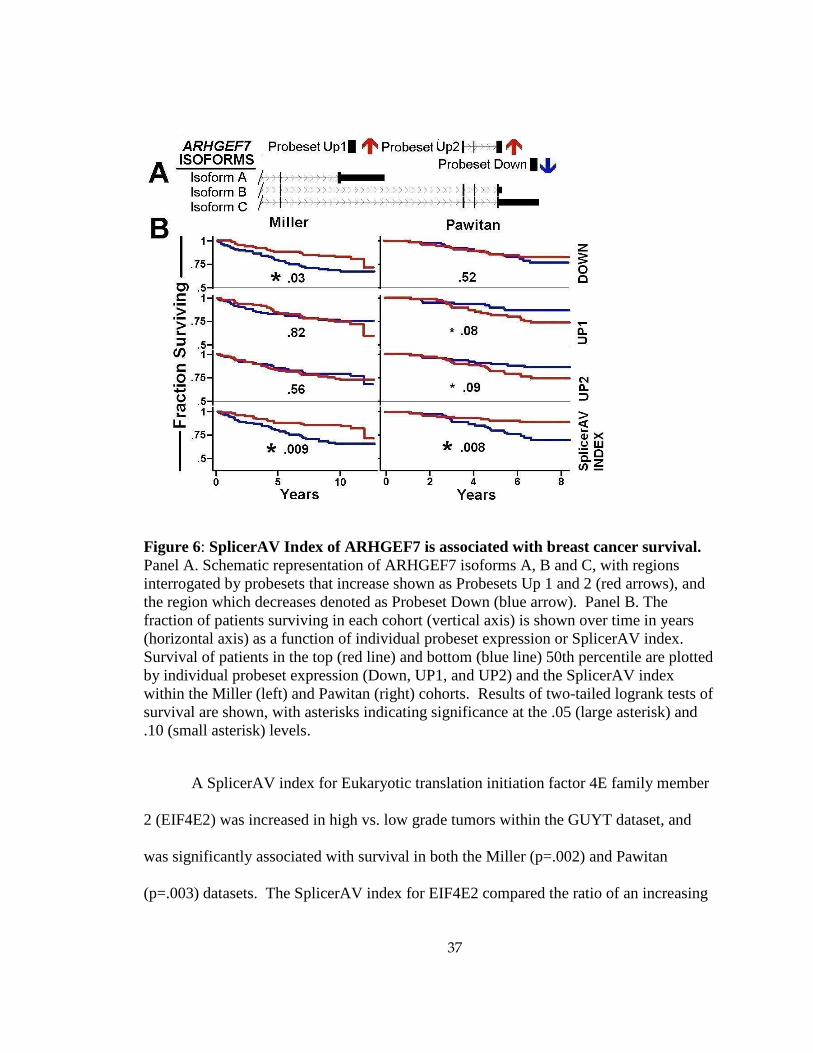
Figure 6: SplicerAV Index of ARHGEF7 is associated with breast cancer survival. Panel A. Schematic representation of ARHGEF7 isoforms A, B and C, with regions interrogated by probesets that increase shown as Probesets Up 1 and 2 (red arrows), and the region which decreases denoted as Probeset Down (blue arrow). Panel B. The fraction of patients surviving in each cohort (vertical axis) is shown over time in years (horizontal axis) as a function of individual probeset expression or SplicerAV index. Survival of patients in the top (red line) and bottom (blue line) 50th percentile are plotted by individual probeset expression (Down, UP1, and UP2) and the SplicerAV index within the Miller (left) and Pawitan (right) cohorts. Results of two-tailed logrank tests of survival are shown, with asterisks indicating significance at the .05 (large asterisk) and .10 (small asterisk) levels.
A SplicerAV index for Eukaryotic translation initiation factor 4E family member
2 (EIF4E2) was increased in high vs. low grade tumors within the GUYT dataset, and
was significantly associated with survival in both the Miller (p=.002) and Pawitan
(p=.003) datasets. The SplicerAV index for EIF4E2 compared the ratio of an increasing
38
“Up” probeset targeting a coding region to that of a decreasing “Down” probeset located
in the 3’UTR of the longest transcript (Figure 7A). For EIF4E2, survival could be
predicted by an increase in the “Up” probeset alone (Miller, p=.003; Pawitan, p=.0007;
Figure 7B). Low levels of the “Down” probeset were only significantly associated with
poor survival in the Pawitan cohort (p=.04).
Whether or not individual probesets could demonstrate a consistent association with
survival differed by gene. Although individual probeset behavior may represent an
alternative processing event, only through comparison with other probesets for that gene
can SplicerAV uncover these relevant and predictive isoforms that would go unnoticed in
conventional analyses.
39
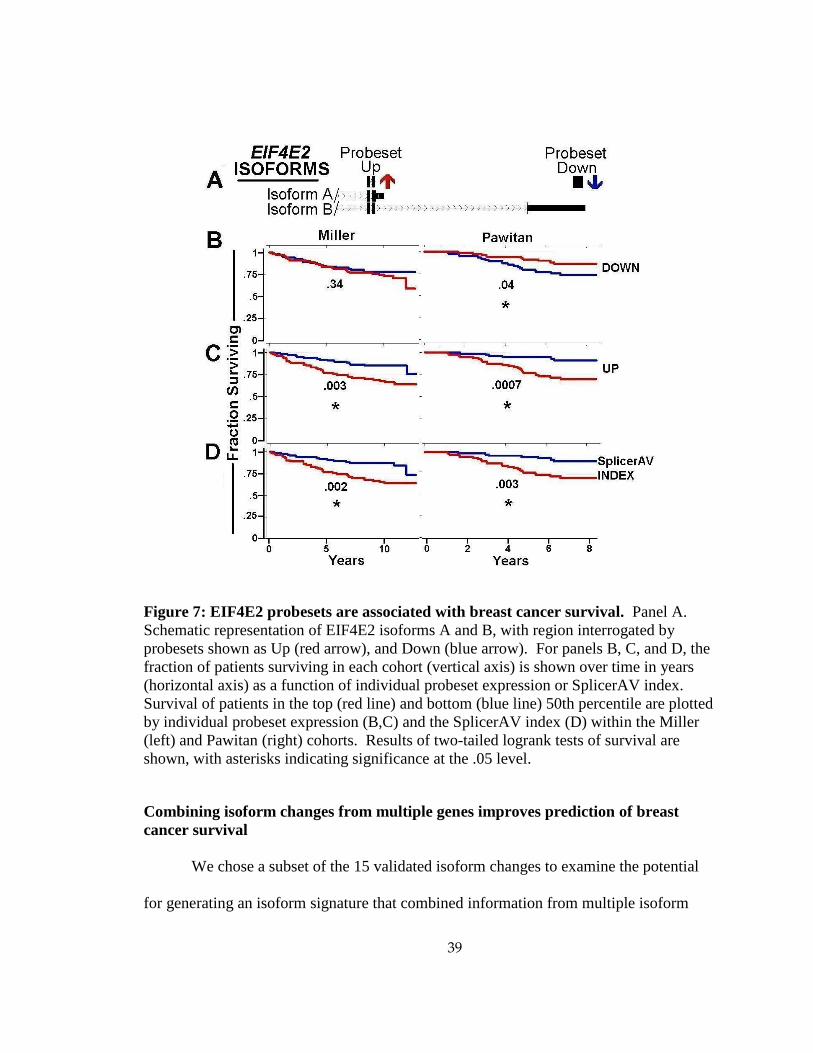
Figure 7: EIF4E2 probesets are associated with breast cancer survival. Panel A. Schematic representation of EIF4E2 isoforms A and B, with region interrogated by probesets shown as Up (red arrow), and Down (blue arrow). For panels B, C, and D, the fraction of patients surviving in each cohort (vertical axis) is shown over time in years (horizontal axis) as a function of individual probeset expression or SplicerAV index. Survival of patients in the top (red line) and bottom (blue line) 50th percentile are plotted by individual probeset expression (B,C) and the SplicerAV index (D) within the Miller (left) and Pawitan (right) cohorts. Results of two-tailed logrank tests of survival are shown, with asterisks indicating significance at the .05 level.
Combining isoform changes from multiple genes improves prediction of breast cancer survival
We chose a subset of the 15 validated isoform changes to examine the potential
for generating an isoform signature that combined information from multiple isoform

40
changes to improve prognostic accuracy. We initially chose the six genes, EIF4E2,
ARHGEF7, SLC28A10, PDXK, TncRNA, and MAPKAP1, that produced the clearest
separation between good and poor survival in individual prognostic analyses (data not
shown). Stratifying patients by SplicerAV index for each gene demonstrated the
expected association with survival (Figure 8A-F). The number of poor prognostic events
was tallied for each patient. Survival was then plotted for individuals with low (0-1
events, blue), intermediate (2-4 events, black), or high (5-6 events, red) numbers of poor
prognostic events (Figure 8G). This stratification of patients by total poor prognostic
events demonstrated highly significant associations with survival in both the Miller
(p=6e-7) and Pawitan (p=4e-7) cohorts. The combined isoform signature demonstrated
prognostic value beyond that of any individual isoform or probeset change.
Similar to our in vitro analyses of oncogene over-expression, we observed low
overlap between gene expression and SplicerAV changes. Of the 241 isoform changes
predicted by SplicerAV in the GUYT training set that were later tested for an association
with poor prognosis, only one gene (0.4%), BTD, was also among the top 241
differentially expressed genes. The orthogonality of candidate gene lists identified by
SplicerAV and conventional methods suggests that these two methods detect different
biological processes and may provide independent value in generating molecular
classifiers. SplicerAV can generate both conventional and isoform specific gene
expression analyses, and therefore provides two non-redundant datasets from one
experiment.
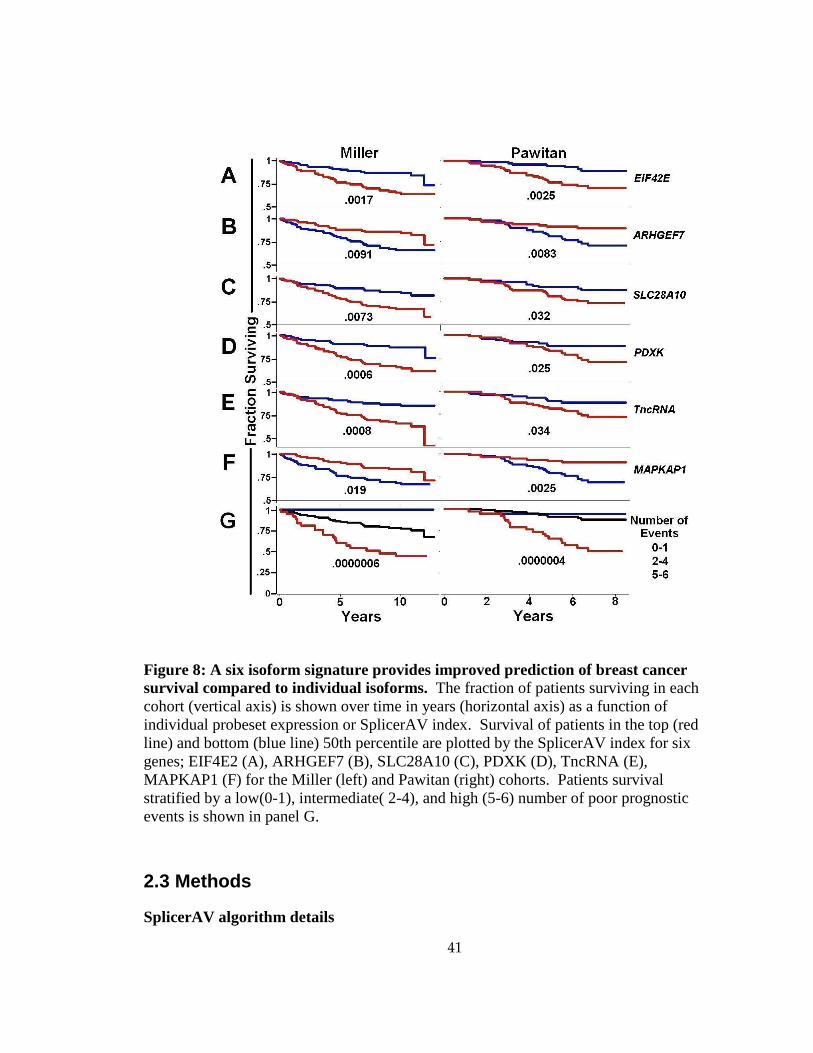
41
Figure 8: A six isoform signature provides improved prediction of breast cancer survival compared to individual isoforms. The fraction of patients surviving in each cohort (vertical axis) is shown over time in years (horizontal axis) as a function of individual probeset expression or SplicerAV index. Survival of patients in the top (red line) and bottom (blue line) 50th percentile are plotted by the SplicerAV index for six genes; EIF4E2 (A), ARHGEF7 (B), SLC28A10 (C), PDXK (D), TncRNA (E), MAPKAP1 (F) for the Miller (left) and Pawitan (right) cohorts. Patients survival stratified by a low(0-1), intermediate( 2-4), and high (5-6) number of poor prognostic events is shown in panel G.
2.3 Methods
SplicerAV algorithm details

42
SplicerAV takes probeset intensities generated using conventional normalization
methods (i.e. MAS5 or RMA output) as input. SplicerAV first summarizes the average
log2fold change in expression and the corresponding t-statistic for each probeset on the
array. Probeset changes are assigned an initial weight based on their normalized t-
statistic, TNorm. Conceptually, weighting by TNorm counts probesets undergoing
significant expression changes one time. This is because TNorm equals one for probesets
reporting expression changes significant at the .05 level (two tailed t-test).
Critical
ControlTreatment
ControlTreatmentNorm TT ÷
−=
22
||
σσ
µµ
[3]
Probesets targeting the same gene are next grouped together using annotation
provided by the array manufacturer. Genes targeted by probesets with a TNorm value
greater than one scale their weights so that the maximum TNorm within that gene is
reduced to one. This prevents counting any probeset more than once.
)(1)(
Norm
NormNorm TMax
TWeightthenTMaxIf =>
[4]
NormTWeightElse =
At this step, individual probeset weights are raised to a user specified power
(Wt_scale, default = 2), which allows preferential focus on more significant probeset
changes in expression at the cost of removing information from less reliable probesets
and reducing the power of significance tests.

43
This weighting scheme assigns a weight between 0 and 1 to each probset,
indicating the number of times a probeset’s observations will be counted in the Gaussian
mixture model. In the final Gaussian mixture model, each probeset weight is multiplied
by the average number of paired observations among treatment and control groups for
that probeset (Navg_obs = (Ntreat_obs + Ncontrol_obs)/2). The resulting model counts each
effective pair of observations for a probeset at most once, with less reliable probesets
being counted less.
prbsetScaleWt
prbset
prbset
prbset
ObsAvgWeight
EfWt
WeightEffective
_*)( _=
=
[5]
The Effective Weight for each probeset is used as the final probeset summary
weight in the Gaussian mixture model. Average probeset log2fold changes in expression
are fitted using two models, which contain one and two Gaussian distributions,
respectively. Comparison of the relative fit under these two models yields a maximum
likelihood ratio (MLR), which can be assessed for statistical signifance using a standard
likelihood ratio (LR) test statistic, asymptotically distributed as χ2(2), for each gene.
∏=
=prbsetsTot
prbset Single
IfBB
IfAA
Likelihood
LikelihoodLikelihoodMLR
_
1
** *
[6]
Where:

44
prbsetEfWt
i
iprbset
i
i
XLikelihood
−−=
2
2
2
)(exp
2
1
σ
µ
πσ
Xprbset = the log2fold expression change of that probeset
µA = the weighted average log2fold change in expression for probesets assigned to groupA
µB = the weighted average log2fold change in expression for probesets assigned to groupB
µSingle = the weighted average log2fold change in expression for all probesets targeting the gene
σA, σB, and σsingle for groups A,B, and all probesets are determined by expectation
maximization, bounded by a minimum value of 10% to prevent over-fitting by the model.
The value of 10% was chosen as a conservative limit based on empirical observations of
summarized significant log2fold probeset changes, which consistently exhibited standard
deviations (σ) below 10% across analyzed datasets (data not shown).
Biological Modifiers
SplicerAV incorporates biologically motivated modifiers to alter the relative
ranking of potential changes in alternative processing to suit the final objectives of the
user. These modifiers can be adjusted by the user and do not affect the p-values reported
by SplicerAV. The specified form and magnitude of these biologically motivated
modifiers were empirically derived through analysis of several datasets.
Multiple Probeset Modifier
The multiprobeset modifier adjusts the splice score by the total possible ways that
all the probesets targeting a given gene can be placed into groups of two. This method
penalizes genes containing large numbers of probesets capable of generating a large

45
number of alternative processing hypotheses which are difficult to interpret, using a
bonferroni multiple hypothesis correction.
)12ln( 1_ −−= −prbsetstotModifiersetMultiprobe
[7]
Expression Cutoff Modifier
The expression cutoff modifier calculates the log2 difference in average
expression between the two groups of probesets, A and B. Genes whose expression
between groups falls below a user specified threshold minimum fold change are
penalized using a smoothed function whose steepness is set using a user specified
sharpness parameter.
)/ln(*
,
CutoffAvChangeSharpnessModifierCutoff
CutoffAvgChangeIf
=
<
[8]
Centering Modifier
The centering modifier preferentially ranks genes whose probeset expression
changes in opposite directions, suggesting a qualitatively different event which cannot be
explained by poor annotation of probesets targeting intronic regions, saturated probeset
signals, non-hybridizing probesets, or other probeset expression behavior deviating from
a linear relationship with transcript abundance. Genes in which both groups of probesets
change in the same direction (either both increasing or decreasing) are penalized, while
genes containing groups of probesets with mean expression levels moving in opposite
directions are given a bonus.

46
|)||,(|*
,0)*(
GrpBGrpA
GrpBGrpA
ExpMeanMeanMinFactorCentering
ModifierCentering
FactorCenteringFactorCenteringthen
ExpMeanMeanIf
∆∆=
−=
<∆∆
[9]
Gene Ontology Analyses
Gene ontology (GO) analyses compared genes with SplicerAV predicted
isoform changes (p<.01, splice score > 0) to a reference set of all genes evaluated for
isoform changes in each condition using PANTHER (Thomas et al. 2003; Thomas et al.
2006). Non-overlapping GO categories with more than one gene were reported.
2.4 General Comments
Traditional analyses of gene expression data have considered the probeset as the
basic unit of expression. Under this paradigm, the presence of multiple probesets has
been viewed largely as a nuisance. Current approaches dealing with the issue of multiple
probesets have used either probeset location or the mean, median, or largest probeset
expression change to distill multiple probesets into a single gene level expression value.
Each of these approaches would have yielded a different readout of EGFR expression
changes in HRAS over-expression, making conventional interpretation inadequate for
such genes. Software has even been developed whose sole purpose is the removal of
discordant probeset expression values for probesets targeting the same gene (Jaksik et al.
2009).
We propose that for genes with multiple probesets, isoform specific expression
changes may be a more appropriate means of interpreting standard microarray expression

47
data than the current one gene = one probeset paradigm. Previous algorithms (Fan et al.
2006) (Hu et al. 2001) have examined the possibility of investigating changes in
alternative processing using individual probe level data. These methods have relied on
custom chips, or would not have detected events predicted by SplicerAV in this paper
because such methods do not examine events spanning multiple probesets. SplicerAV
provides a systematic means by which to detect and interpret inconsistent probeset
behavior within the same gene, a situation where an oversimplified perspective may be
obscuring relevant and important biological changes.
This study marks the first en masse analysis of mRNA isoform changes in
existing conventional expression microarray data. We have shown here that re-analyzing
such data using a different paradigm can uncover novel biological insights and potential
prognostic markers.
Conclusion
The combination of material, personnel, and clinical costs of obtaining gene
expression microarray data has resulted in a massive archive of these data accumulated
over the past two decades. Many previously created datasets, particularly clinical
datasets, are unique and cannot be reproduced. Numerous private and public repositories
of microarray expression data exist, with the largest public repository, Gene Expression
Omnibus, containing over 50,000 data samples from the Affymetrix U133 and U95 series
alone. In this chapter we demonstrated the utility of SpicerAV, the first program used to
analyze this existing data en masse for isoform specific changes that can result from
alternative mRNA processing(Robinson et al. 2010).

48
3. Conventional Affymetrix U133 Arrays Provide Superior Detection of 3’ Located Differential mRNA Processing Compared to Human Exon Arrays
In this chapter, I describe the implementation and application of SplicerAV to
exon array data (SplicerEX) to analyze and characterize changes in mRNA processing
during Epstein Barr Virus induced transformation of naïve B cells into lymphoblastoid
cell lines (LCLs).
3.1 Introduction
Genome-wide analysis of differential mRNA processing became accessible to the
general research community with the introduction of the commercially available splice-
sensitive microarrays. One of the first commercially available splice-sensitive arrays was
the Affymetrix Human Exon 1.0 ST array, alternatively referred to as the HuEx or
Affymetrix exon array. The novelty of the Affymetrix Human Exon 1.0 ST platform has
been a source of trepidation for scientists deciding whether to replace conventional 3’
IVT (3’ in vitro transcription) gene expression arrays with the new HuEx arrays.
Commercially available 3’ IVT microarrays have existed for decades and have provided a
benchmark to test the ability of exon array arrays to reliably assay gene expression. The
general consensus that has emerged is that the HuEx array performs reasonably well in
replicating U133 assessment of differential gene expression (Bemmo et al. 2008)
(Abdueva et al. 2007) (Robinson and Speed 2007). The ability of U133 and HuEx arrays
to detect changes in alternative mRNA processing has not been compared previously.

49
In this chapter we use an expanded version of the SplicerAV algorithm,
SplicerEX, to study a B cell model of EBV induced lymphoma to compare isoform
changes detected using the U133 and HuEx microarrays. We have automated the
characterization of predicted differential mRNA processing events, which has made it
feasible to characterize widespread differences in events detected with the U133 and
HuEx platforms.
We find that the U133 array is more sensitive than the HuEx platform at detecting
changes in both tandem 3’ UTR length and 3’ terminal exon (TE) choice. This study
suggests that the U133 2.0 plus array, originally designed to interrogate gene expression,
may be the Affymetrix microarray of choice for detecting differential processing of 3’
transcript regions. Using SplicerEX, we demonstrate significant biases in differential
mRNA processing towards 3’UTR shortening and removal of internal exon content in
LCLs vs. naïve B cells.
To our knowledge, the SplicerAV/EX set of programs remain the only programs
currently available to analyze differential mRNA processing on U133 arrays at the level
of the probeset (Robinson et al.). SplicerEX is the only program available capable of
automatically categorizing differential mRNA processing events by mechanistic and
directional characteristics using commercially available microarrays. SplicerEX is freely
available upon request and is designed for experimental biologists interested in finding
models of AS for in depth study.
3.2 Results
Sample Selection

50
We were able to obtain three sets of lymphoblastoid cell lines (LCL) created from
matching B cell donors, and one set of unmatched LCL and B cells. RNA from all 4
LCL samples and all 4 naïve B cell samples were successfully hybridized to both the
U133 2.0 plus and Human Exon arrays for a total of 16 independent hybridizations (4
LCL and 4 B cell on the U133 array and 4 LCL and 4 B cells on the exon array)(Figure
9).
Figure 9: EBV induced transformation of Naïve B cells. B cells are infected with EBV and surviving cells are allow to proliferate. Lymphoblastoid cell lines emerge following several weeks of serial passaging.
Affymetrix U133 and HuEx arrays detect non-overlapping changes in genes undergoing changes in alternative mRNA processing
A total of 5,682 genes were detected as being expressed above background on
both the U133 and HuEx array platforms in either Naïve B cells or LCLs (Figure 10).
These genes composed 72% of the 7,874 genes detected by the U133 arrays and 74.3% of
51
the 7646 genes detected by the HuEx arrays. The overlap of genes that were detected
above background by both platforms was highly significant (χ2 = 6122, p < .0001).
Of the 5,682 genes detected on both arrays, there was considerable overlap
between genes that were detected as differentially expressed. A total of 512 genes
increased significantly (p < .01, fold change > 2) on both array platforms, corresponding
to 40% of the 1,291 genes increased on the U133 and 76% of the 678 genes increased on
the HuEx platform (χ2 = 1219, p < .0001) . Similar overlap was found among decreased
genes. A total of 118 genes decreased significantly (p < .01, fold change > 2) on both
array platforms, corresponding to 64% of the 184 genes decreased on the U133 and 53%
of the 222 genes decreased on the HuEx platform (χ2 = 1820, p < .0001) .

52
Figure 10: U133 and HuEx arrays detect non-overlapping changes in alternative mRNA processing.
In contrast, there was no significant overlap between genes that were detected to
be alternatively processed by both arrays (χ2 = 0, p = 1). Only 2 genes, AURKB and
TXNDC5, were independently considered hits by both arrays (splice score > 0, splicer p
< .01, ANOVA p < .01). These two genes corresponded to 2% of the total genes
detected by either the U133 (126 total) or HuEx (110) array.
SplicerEX reveals distinct gene ontologies regulated by transcription vs. alternative mRNA processing in B cell transformation

53
High confidence lists of differentially expressed genes were obtained by limiting
genes to those detected as differentially increased or decreased on both the U133 and
HuEx array platforms (Appendices A and B).
Ontology analyses of genes increased in LCLs vs. naïve B cells revealed
enrichment for biological processes involved in cell cycle and cell structure (both P
<.001;Table 5 ). Among the list of 512 genes increased within LCLs vs. naïve B cells,
only one gene with functions in mRNA splicing, HNRPLL, was found. This indicated a
significant depletion of genes involved in mRNA splicing among the list of 512 genes,
which was expected to contain nine such genes (P < .001). Enrichment of molecular
functions were observed in cytoskeletal proteins, oxidoreductases, and reductases (all P <
.002).
Table 5: Gene ontology enrichment in genes increased in LCLs vs. naïve B cells
Biological Process P value Genes Cell cycle 1.7E-06 ASPM,AURKA,AURKB,BRCA1,BUB1,BUB1B,C1
4orf166,CALM3,CCNA2,CCNB1,CCNB2,CCND2,CCNE1,CDC25A,CDC45L,CDC6,CDCA4,CDK6,CENPE,CENPF,CHEK1,NEDD9,NUF2,ORC1L,PLK4,PRC1,PTTG1,RCBTB2,RFC3,RPN2,SESN2,SLFN13,STK38L,SUMO3,TFDP1,TOP2A,TRIM69,TRIP10,TTF2,TTK,TUBA8,TUBGCP5,UBE2C
mRNA splicing (depleted)
9.0E-04 HNRPLL
Cell structure 9.2E-04 ACTN1,CKAP5,CORO1C,CTNNAL1,DBN1,DCTN5,FOXM1,GTSE1,KIF14,KIF20A,KIF21A,KLHL2,LCP1,LIMA1,LMNB1,LMNB2,MX2,SCARB1,STK38L,TJP2,TMOD1

54
Table 5, continued. Molecular Function P value Gene Cytoskeletal protein 3.1E-04 ACTN1,ASPM,CCIN,CENPE,CKAP5,CORO1C,C
SRP1,CTNNAL1,DBN1,DCTN5,KIF11,KIF14,KIF20A,KIF21A,KIF23,KIF2C,KLHL2,LCP1,LIMA1,LMNB1,LMNB2,MX2
Oxidoreductase 1.1E-03 ACADM,AHRR,ALDH18A1,BLVRA,CRYZ,CYBRD1,DECR1,DHCR24,DHCR7,FAR2,FAS,HSD17B12,HSDL2,IDH1,IDH2,LOXL1,MDH2,ME1
Reductase 1.4E-03 CRYZ,CYBRD1,DECR1,DHCR24,DHCR7,FAR2,HSD17B12,HSDL2,MSRB2,NDUFS3,NDUFV1,RRM1,UQCRC2
Ontology analyses of genes decreased in LCLs vs. naïve B cells revealed
enrichment for pathways involved in JAK/STAT signaling, apoptosis, and inflammation
mediated by chemokines (all P < .007; Table 6). Biological processes among decreased
genes were enriched for B cell and antibody mediated immunity, cytokine signaling, and
cell surface receptor signaling (all P < .001). Molecular functions among decreased
genes were enriched for receptors, homeobox transcription factors, and signaling
molecules (all P < .005).
Table 6: Gene ontology enrichment in genes decreased in LCLs vs. naïve B cells
Pathway P value Genes JAK/STAT signaling pathway 5.07E-
03 JAK1,PTPRC,STAT4
Apoptosis signaling pathway 5.20E-03
BCL2L11,CASP8,LTB,MALT1,REL,TNFRSF10A,
Inflammation mediated by chemokine and cytokine signaling pathway
6.11E-03
CXCR4,CXCR5,INPP5D,JAK1,NFATC1,REL,STAT4,VAV3,
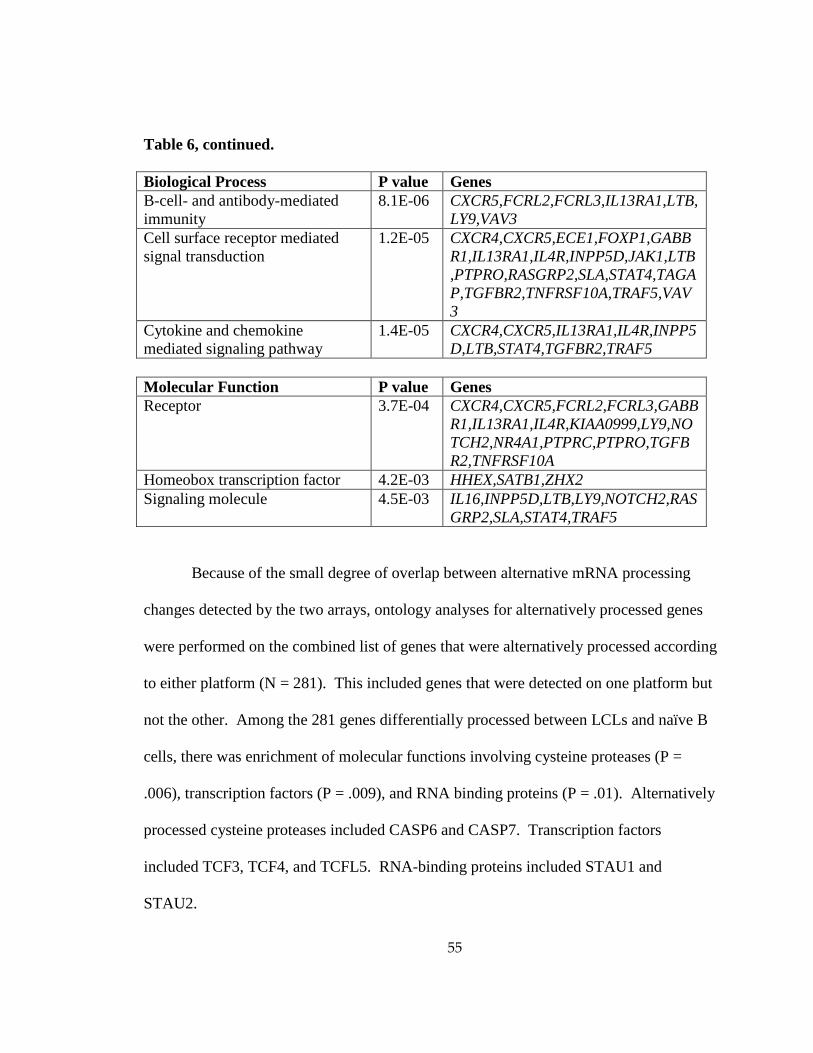
55
Table 6, continued.
Biological Process P value Genes B-cell- and antibody-mediated immunity
8.1E-06 CXCR5,FCRL2,FCRL3,IL13RA1,LTB,LY9,VAV3
Cell surface receptor mediated signal transduction
1.2E-05 CXCR4,CXCR5,ECE1,FOXP1,GABBR1,IL13RA1,IL4R,INPP5D,JAK1,LTB,PTPRO,RASGRP2,SLA,STAT4,TAGAP,TGFBR2,TNFRSF10A,TRAF5,VAV3
Cytokine and chemokine mediated signaling pathway
1.4E-05 CXCR4,CXCR5,IL13RA1,IL4R,INPP5D,LTB,STAT4,TGFBR2,TRAF5
Molecular Function P value Genes Receptor 3.7E-04 CXCR4,CXCR5,FCRL2,FCRL3,GABB
R1,IL13RA1,IL4R,KIAA0999,LY9,NOTCH2,NR4A1,PTPRC,PTPRO,TGFBR2,TNFRSF10A
Homeobox transcription factor 4.2E-03 HHEX,SATB1,ZHX2 Signaling molecule 4.5E-03 IL16,INPP5D,LTB,LY9,NOTCH2,RAS
GRP2,SLA,STAT4,TRAF5
Because of the small degree of overlap between alternative mRNA processing
changes detected by the two arrays, ontology analyses for alternatively processed genes
were performed on the combined list of genes that were alternatively processed according
to either platform (N = 281). This included genes that were detected on one platform but
not the other. Among the 281 genes differentially processed between LCLs and naïve B
cells, there was enrichment of molecular functions involving cysteine proteases (P =
.006), transcription factors (P = .009), and RNA binding proteins (P = .01). Alternatively
processed cysteine proteases included CASP6 and CASP7. Transcription factors
included TCF3, TCF4, and TCFL5. RNA-binding proteins included STAU1 and
STAU2.

56
Table 7: Gene ontology enrichment in genes differentially processed between LCLs vs. naïve B cells
Molecular Function P value Genes Cysteine protease 5.71E-
03 CASP6,CASP7,CTSS,PGPEP1,USP30,USP48,USP6
Basic helix-loop-helix transcription factor
8.76E-03
MSC,MXD4,TCF3,TCF4,TCFL5
Other RNA-binding protein 1.18E-02
C1orf107,CPSF6,CUGBP2,RBM19,RBM8A,RCL1,RTCD1,STAU1,STAU2
B cell transformation reduces 3’UTR length and internal exon content
SplicerEX assigned one of the following six mutually exclusive categories to
genes detected as alternatively processed: 1) Alternative 5’ initiation 2) Internal Event 3)
Tandem 3’ UTR 4) Alternative 3’ Terminal Exon choice 5) Alternative transcript length,
and 6) unclassified (Table 8). All classified categories generated specific hypotheses that
agreed with subjective assessments and could be directly tested using experimental
validation methods such as RT-PCR or northern blot. Of the top 20 hypotheses
automatically generated by SplicerEX for both the U133 and HuEx platforms, all 40
automated hypotheses agreed with the subjective categorization assigned by the
researchers.

57
Table 8: Categories of mRNA processing events assigned by SplicerEX
Category Description Directional Subtypes Optimal Detection Platform
5’ Initiation Change in 5’ transcription initiation site. Considered to result in coding changes if 5’ isoform possess three or more exons prior to the start of the 3’ isoform.
Relative increase in 5’ most initiation site (more 5’)
Exon Array
Relative decrease in 5’ most initiation site (more 3’)
Internal Event Changes in internal exon content. Includes primarily cassette exons, alt 5’ SS, alt 3’ SS, and intron retention.
Inclusion Exon Array
Exclusion
Tandem 3’ Terminal Exons
Change in length of 3’ TE. Almost universally results in non-coding changes in 3’ UTR length.
Shorten U133 Lengthen
3’ Terminal Exon Choice
Change in choice of 3’ TE. Almost universally results in protein coding changes.
More 5’ U133
More 3’
Alternative Transcript Length
1) Metaprobeset 1 or 2 interrogates 3’ TE
N/A
Unclassified/ No class
Unable to be categorized using above
N/A
These general categories reflect basic mechanistic descriptions of each alternative
processing event, and are the same regardless of which condition is considered the
reference group. SplicerEX also assigns directional subtypes, which describe a change in
processing associated with a specific phenotype. Alternative 5’ initiation start sites and
alternative 3’ terminal exons were subcategorized as being more 5’ or 3’ located within
UCSC gene transcripts. Internal cassette exons made up the bulk of observed internal
events, and were succesfully characterized with regards to inclusion vs. exclusion.

58
Tandem 3’ terminal exon events were uniformly observed to result in 3’UTR length
changes, which were either lengthened or shortened.
B cell transformation reduces 3’UTR length and internal exon content
Alternative mRNA processing categories differed significantly by platform (χ2 =
141, 5 df, P < .001; Figure 11). The U133 array detected primarily changes in 3’ UTR
length (50%) and alternative 3’ terminal exon choice (26%), while the HuEx array
detected mostly internal cassette exons (45%) and alternative 5’ initiation sites (21%).
Figure 11: Distribution of events observed by array platform.
The U133 and HuEx platforms exhibited similar performance with regards to the
total number of events detected and hypotheses created. Testable hypotheses could be
automatically generated for the majority of genes on both the U133 (125/ 144, 87%) and
HuEx (123/139, 88%) arrays. Of the 125 hypotheses created by the U133 array, 39
(31%) were predicted to result in alternative ORF usage and subsequent isoform specific

59
protein coding changes. Of the 139 hypotheses created by the HuEx array, 69 (56%)
were predicted to result in changes in protein coding transcript regions.
As expected, the U133 arrays displayed a strong tendency to detect changes in
mRNA processing at the 3’ end of genes. HuEx arrays displayed an equally strong
tendency to detect events in the 5’ and internal portions of genes (Figure 12).
Figure 12: U133 and HuEx arrays preferentially detect changes in mRNA processing in 3’ vs. 5’/internal transcript regions
Relative to naïve B cells, LCLs preferentially shortened mRNA 3’UTR lengths (P
= 2e-15) and excluded internal exon content (both P = 3e-8; Figure 13).

60
Figure 13: B cell transformation reduces 3’UTR length and internal exon content
Of the 82 changes in tandem 3’UTR length detected by SplicerEX, 76 (93%)
shortened the 3’UTR (P = 2e-15). Of the 65 internal splicing events detected by
SplicerEX, 53 (82%) excluded internal exon content (P = 3e-8). There was no preference
towards more 5’ or more 3’ located terminal exon choice in LCLs vs. naïve B cells
(P=.19). There was no significant preference towards choosing a more 5’ located
alternative start site, however a weak trend (P = .08) was observed for choosing more 5’
located initiation sites in LCLs vs. Bcells.

61
3.3 Methods
Adaption of SplicerAV to exon array data
Previously, we created a program, SplicerAV, which employs a Gaussian mixture
model to detect changes in mRNA processing from conventional Affymetrix 3’ IVT
expression microarrays. We adapted our original Gaussian mixture model to efficiently
function on a wider array of newer splicing arrays, in particular the Affymetrix Human
Exon 1.0 ST (HuEx). The updated algorithm has been tested on both conventional and
exon array data, and is capable of both detecting and categorizing changes in alternative
mRNA processing. To differentiate this algorithm from the previous SplicerAV
program, we refer to the new program as SplicerEX.
Creation of an algorithm capable of correctly categorizing alternative mRNA
processing event types in both conventional and exon array data posed several
challenges. Within the U133 2.0 plus series, genes are targeted by an average of 3.2
probesets per gene, with few genes interrogated by more than four or five probesets. In
contrast, the HuEx series uses an average of 10 probesets per gene, with the majority of
genes targeted by 4-40 probesets per gene. This raised two concerns 1) excessive
multiple hypothesis testing and 2) difficulty identifying specific isoform ratios.
The large number of hypotheses being tested per gene presented two issues. First,
each gene on the exon array was receiving a large penalty for multiple hypothesis testing,
likely resulting in a increased rate of false negatives. Second, the sheer number of
hypotheses tested raised a simultaneous concern of overtesting and may have increased
the number of false positive results.

62
As a separate issue, the large number of probesets present on exon arrays made
identification of specific isoform ratios and subsequent categorization of splicing events
difficult. Isoform ratios within the original U133 array were calculated by identifying the
single most significant increasing probeset (Group A) and contrasting it the single most
significant decreasing probeset (Group B). We found that with the U133 arrays, these
single probesets provided the appropriate level of focus to accurately categorize mRNA
processing events, described in the next section. In contrast, categorization using single
probesets within the exon arrays resulted in largely arbitrary selection of transcript
features that were too focused on single internal exons to reliably identify commonly
observed isoform changes. We attempted isoform categorization using the entire group
A and group B probesets, but found that the inclusion of all interrogated probesets
provided too large a focus and incorporated many non-changing or irrelevant probesets.
Metaprobeset feature definition
We resolved these challenges by collapsing highly correlated probesets together
into metaprobeset features. Analyzing exon array data at the metaprobeset feature level
both reduced multiple hypothesis testing and simultaneously focused feature selection by
collapsing related probeset changes together and ignoring irrelevant probesets. By
adjusting the correlation threshold used to collapse probesets, we were able to tune our
analysis to the appropriate level of focus. We found that the original SplicerAV
algorithm was able to operate well on exon array data analyzed at the metaprobeset
feature level, allowing us to combine these approaches into a single program, SplicerEX,

63
that was capable of analyzing both U133 and exon array data by simply changing the
level of feature selection.
Metaprobeset Implementation and Selection of Correlation Threshold
Metaprobeset feature selection was accomplished in several steps. First, pairwise
Pearson correlations were calculated between all probesets targeting the same gene. If
this correlation exceeded a user set threshold, these two probesets would be joined
together into a single probeset. Correlations between the joined probesets and remaining
probesets would then be averaged to create a new pairwise correlation matrix. The
process was then repeated until no remaining features were correlated above the set
threshold. The resulting features, each made up of one or multiple probesets, each
constituted a metaprobeset.
Metaprobeset collapse using an empirically derived correlation threshold of .7
maximized our ability to effectively categorize mRNA processing events and greatly
reduced the average number of features per gene (Figure 14). Within each gene, the
single largest metaprobeset was considered to be interrogating the main isoform, and was
used to calculate changes in overall gene expression.

64
Figure 14: Number of features targeting individual genes by array platform.
Automated categorization of mRNA processing events
In order to fully benefit from large scale analyses of mRNA processing, we
devised an algorithm capable of automatically categorizing SplicerEX hits into
mechanistically distinct categories: 1) Tandem 3’UTR choice 2) Alternative 3’ terminal
exon choice 3) Alternative 5’ transcript initiation 4) Internal exon choice 5) Alternative
transcript length and 6) Unclassified. These categories were chosen to correspond
loosely to event categories described previously in deep sequencing studies of alternative
mRNA processing by Burge and colleagues (Wang et al. 2008): The Burge categories
were adapted to what we were able to reliably differentiate within the framework of event
inference based on two single metaprobesets. At the same time, we wanted to keep the
classification scheme reasonably simple to promote transparency and encourage external
adoption.

65
In addition to categorizing AS events by mechanistic class, SplicerEX also
assessed directional changes in treatment vs. control conditions for categories 1-4.
Specifically, SplicerEX differentiates 1) lengthened vs. shortened 3’UTR choice, 2) 5’
prime vs. 3’ located TE choice, 3) 5’ vs. 3’ located alternative 5’ initiation start site, and
4) Internal event inclusion vs. exclusion. The detailed schema used to categorize
alternative processing events into mechanistic and directional categories is described in
detail in Appendix D.
Preprocessing and implementation Details
SplicerEX takes normalized probe or probeset intensities as input, which can be
generated using a number of existing software options. Readily available options for
probeset level normalization of U133 and exon array data include the Affymetrix
Expression Console, bioconductor R packages, Partek, XRAYS, and others. For our
exon array analysis, we used XRAY (Biotique Systems, Inc.) to check for quality control,
limit analysis to the “core” probeset level, generate probeset level normalized expression
values, and filter out probesets not detected above background. Background detection in
XRAY was assessed by removing individual probes with high or low GC content, low
variance, or expression below background and probesets for which three or more probes
were retained were included for analysis. Median derived probeset expression levels for
81,828 probesets were used as input for SplicerEX. As an additional background
expression filter, SplicerEX further removed any probesets with log2 expression below 6.
For the U133 analysis, we used RMA Express to generate probeset level normalized
expression values and PANP (described in chapter 2) to filter out probesets not detected

66
above background. The full set of 54,675 U133 probesets were used as input for the
SplicerEX program.
To improve the quality of hypotheses generated by SplicerEX, the program can
limit the analysis to a user-specified set of probesets. We have generated default probeset
lists for both the U133 and exon array platforms that limit analysis to probesets that
overlap one or more UCSC gene transcripts. Overlap was determined using Affymetrix
annotated target probeset sequence coordinates and comparing them to the March 2006
(hg18) version of the human genome and checking for overlap with known UCSC genes.
Genomic coordinates of U133 probeset target coordinates were not publicly available
from Affymetrix or from the UCSC genome browser, and were generated using BLAT to
align Affymetrix probeset sequences against the March 2006 genome and will be
provided as supplemental material in a later publication..
SplicerEX was implemented in Perl, with typical PC run times of 3-5 minutes for
U133 2.0 plus data and 10-15 minutes for exon aray data using metaprobeset features.
Perl is a freely available programming language that is widely available for most
operating systems: SplicerEX has only been tested using a PC.
EBV-induced B cell transformation and mRNA preparation
Human B cells were obtained from normal donor buffy coats through the Carolina
Red Cross and peripheral blood mononuclear cells (PBMC) were isolated by Ficoll
Hystopaque gradient (Sigma #H8889). CD19+ B cells were purified from PBMC using
the BD iMag Negative Isolation Kit (BD,cat #558007). Purity was routinely greater than
90% as determined by flow cytometry. Total mRNA was prepared from four normal

67
donors in two conditions: 1) uninfected purified CD19+ B cells and 2) monoclonal LCL
derived by limiting B95-8 virus dilution on PBMC. B95-8 virus was produced from the
B95-8 Z-HT cell line as previously described (Johannsen et al. 2004).
cDNA preparation, labeling, and fragmentation was performed using the Gene
Chip wt cDNA synthesis and amplification kit (Affymetrix cat# 900673) and Exon Array
labeling kits (Affymetrix cat# 900671). Eight samples (4 of each condition) were
hybridized to HuEx 1.0ST Exon Arrays (Affymetrix cat# 900650) and the chips were
scanned in the Duke Microarray Facility.
Gene ontology and hit lists of increased, decreased, and differentially processed genes
To compare the performance of U133 and HuEx platforms, the set of genes
differentially detected, expressed, and processed were compared. Comparisons of
differential gene expression and processing were limited to genes detected by both arrays
to provide a fair assessment of overlap. All gene ontology analyses were performed
using PANTHER(Thomas et al. 2003). The set of genes detected above background by
both platforms (N=5,682) was used as the reference list for increased and decreased gene
expression lists. The set of genes detected above background on either platform
(N=9,838) was used as the reference list the differentially processed gene list.
3.4 Discussion
In this chapter, I have described the first comparison of the ability of U133 and
Exon arrays to detect changes in alternative mRNA processing using a novel program,
SplicerEX. We found that both the U133 and HuEx platforms were capable of detecting

68
comparable numbers of overall changes in differential mRNA processing, but detected
almost no events in common. We attribute the low overlap between the platforms to
biases in the types of events detected by each array.
We found that the U133 array was superior to the HuEx platform for detecting
changes in both 3’ UTR length (72 vs 10 events) and 3’ TE choice (38 vs. 8 events). This
study suggests that the U133 2.0 plus array, originally designed to interrogate overall
gene expression, is currently the most sensitive Affymetrix microarray for detecting
differential processing of 3’ transcript regions.
It is well known that the U133 array design preferentially targets probesets
towards the 3’ ends of genes. Among U133 probesets that target any known UCSC gene,
we found that 90% interrogated a 3’ terminal exon. U133 arrays use cDNA prepared
using oligo dT reverse transcription, which provides the strongest amplification of the 3’
ends of transcripts.
A somewhat surprising finding of this analysis was the relative inability of HuEx
arrays to detect differential processing at the 3’ end of genes. There are several likely
explanations as to why this might be the case. An analysis by Bemmo et al previously
examined the ability of HuEx arrays to detect changes in differential mRNA processing
and found that a large number of false positive events were detected at the 5’ and 3’ ends
of genes (Bemmo et al. 2008). The authors demonstrated that the signal strength of the
HuEx arrays was particularly weak at the 3’ ends of genes, and hypothesized that the lack
of signal was due as a consequence of using random primed cDNAs. A study by
Robinson and Speed suggested that individual HuEx array probeset signals are less

69
reliable than U133 probesets as a result of smaller probe feature size and the use of fewer
probes per probeset (Robinson and Speed 2007). Lastly, it is possible that HuEx array
probeset target locations within the genome do not represent all 3’ UTRs. However, we
found in preliminary analyses that HuEx probesets interrogated 90% of all U133 probeset
target sequences, suggesting that this is unlikely.
The analysis presented here suggests that researchers deciding between the U133
and HuEx platforms should choose which platform to use based on their specific research
objectives. Changes in 3’ terminal processing may be of particular interest in studying
gene regulation by miRNAs, known to largely target the 3’ UTRs of most transcripts
(Friedman et al. 2009) (Sandberg et al. 2008). Changes in 5’ transcript initiation may be
of interest to studying using of alternative promoters. Internal processing events,
composed largely of cassette exons, may be of interest to those interested in identifying
splicing events that result in changes in ORFs and resultant encoded protein structure.
We found that roughly half of events detected by exon array were hypothesized to result
in protein coding changes in transcript structure, compared with only a quarter of U133
predictions.
We combined both HuEx and U133 arrays to demonstrate highly significant
biases towards 3’ UTR shortening and internal exon exclusion in LCLs vs. naïve B cells.
A previous study has demonstrated widespread 3’ UTR shortening in proliferating cell
types (Sandberg et al. 2008), which agrees with the highly significant 3’UTR shortening
we observed in the rapidly proliferating LCLs relative to naïve B cells. In addition to
reproducing this observation, our study finds a comparably significant preference for

70
exclusion of internal exon content in LCLs vs. B cells. Reduction of 3’UTR length in
proliferating cells has been suggested as a mechanism of global evasion of regulatory
inhibition by miRNAs (Sandberg et al. 2008). We speculate that removal of internal
exons may provide a similar role in avoiding miRNA inhibition in proliferating cell
types. Confirmation of this hypothesis would mark a significant change in our current
understanding of miRNA message inhibition, which has not been observed within
internally located exons on a genome wide scale (Bartel 2009).
There are a number of programs that have been developed to analyze Affymetrix
exon array data for changes in alternative mRNA processing, discussed in chapter 1. Of
these programs, PLATA (Sandberg et al. 2008) has been previously been used to
calculate changes in tandem 3’UTR length within proliferating cell types, but is not
capable of otherwise characterizing differential processing events. Previous algorithms
have been used to deconvolute relative abundance of specific splice variants (Li and
Wong 2001; Wang et al. 2003). However, these algorithms have only been applied to a
handful of well-characterized genes and are not applicable to commercially available
microarrays.
To our knowledge, the SplicerAV/EX set of programs remain the only programs
currently available to analyze differential mRNA processing on U133 arrays at the level
of the probeset (Robinson et al. 2010). SplicerEX is the only program available capable
of automatically categorizing differential mRNA processing events by mechanistic and
directional characteristics using commercially available microarrays. SplicerEX is freely
available upon request and is designed for experimental biologists interested in finding

71
models of AS for in depth study. RT-qPCR experimental validation of events predicted
in this chapter is currently underway.

72
4. Future Directions
The SplicerAV and SplicerEX programs are designed to generate biological
hypotheses that provide potential areas of future research. One such thread is the story of
Oncostatin M Receptor (OSMR), which was originally detected by SplicerAV and
confirmed by RT-PCR to be alternatively processed in a model of breast tumor
microenvironment.
4.1 Proposed Role for the Alternative mRNA processing of Oncostatin M Receptor in the Tumor Microenvironment
In solid tumors, unrestricted and unorganized cell growth leads to an environment
in which the supply of oxygen, nutrients, and waste removal afforded by local
vasculature becomes limited. This so-called tumor microenvironment is characterized by
spatially and temporally fluctuating hypoxia, acidosis, and nutrient deprivation(Gatenby
and Gilles 2004; Bristow and Hill 2008; Dewhirst et al. 2008). Cancer cells within this
harsh environment are prone to apoptosis, decreased cell survival, and stress-related
signaling, all of which act to promote the evolution of more aggressive tumors (Gatenby
and Gilles 2004; Bristow and Hill 2008; Dewhirst et al. 2008; Dewhirst 2009).
In order to identify and study potential alternative processing events of interest in
the tumor microenvironment, SplicerAV was used to analyze U133 2.0 plus microarray
data generated from primary human mammary epithelial cells exposed to both lactic
acidosis (25mM, pH 6.7) and hypoxia (.5%) for 24 hours (Chen et al. 2008). Oncostatin
M receptor was the top hit detected as undergoing changes in mRNA processing, which
was validated by RT-PCR (Figure 15).

73
Figure 15: Splicer AV predicted alternative processing of OSMR validated by RT-PCR. OSMR isoform specific regulation was predicted by Splicer AV as shown on the left. The location and expression change of each Affymetrix probeset interrogating the OSMR transcript is shown as a circle with arrows indicating changes in that probeset’s expression level upon exposure to hypoxia and lactic acid. The relative abundance of each predicted transcript (left) was confirmed by semi-quantitative P32 labeled RT-PCR (right). PCR primer locations are indicated with left and right arrows.
Overexpression of the OSM receptor has been associated with poor patient
outcomes in cervical cancer (Ng et al. 2007) and knockout mice lacking the OSM
receptor have deficiencies in maintaining specific progenitor cell populations (Tanaka et
al. 2003; Nakamura et al. 2004). OSMR’s principle ligand, oncostatin M (OSM), was
initially discovered as a soluble protein able to inhibit melanoma proliferation and
survival without affecting normal fibroblasts (Zarling et al. 1986). It is an inflammatory
cytokine produced by activated human T-lymphocytes, monocytes, macrophages, and
neutrophils (Miles et al. 1992; Nair et al. 1992) that has been shown to inhibit growth of a
number of human tumor cell lines (Zarling et al. 1986; Horn et al. 1990) and stimulate
tumor invasion (Holzer et al. 2004; Queen et al. 2005; Jorcyk et al. 2006), epithelial-
mesenchymal transition (Queen et al. 2005; Pollack et al. 2007), fibroblast, endothelial,
and vascular smooth muscle cell proliferation (Brown et al. 1991; Grove et al. 1993),

74
angiogenesis and VEGF production (Vasse et al. 1999; Repovic et al. 2003; Weiss et al.
2003; Queen et al. 2005; Ehashi et al. 2007; Rega et al. 2007), and coagulation (Mirshahi
et al. 2002).
Figure 16: Schematic of hypothesized OSMR regulation of OSM signaling within the tumor microenvironment. Normally, OSM signals through the OSMR:gp130 heterodimeric receptor to promote tumor invasion and angiogenesis of cancer cells (left). As cells near hypoxic and acidic regions of a tumor, they encounter soluble OSMR (sOSMR), which sequesters and inactivates OSM via paracrine inhibition (middle). Breast cancer cells directly exposed to hypoxia and lactic acidosis not only produce the antagonistic sOSMR, but also reduce membrane expression of membrane bound OSMR (right).

75
Regulation of OSMR and related gene pre-mRNA processing could be involved
in the angiogenic switch from benign to malignant solid cancers and may function as an
important mechanism of regulating angiogenesis, metastases, and inflammatory
responses in the breast tumor microenvironment. Future investigation into regulation of
OSMR at the level of alternative mRNA processing may provide novel opportunities for
therapeutic interventions in the treatment of breast and other solid tumors.
4.2 Isoform signature generation
Gene expression signatures are now being used clinically to help assess breast
cancer patient prognosis through the application of tests such as Oncotype DX and
Mammoprint. The creation of such signatures follows a standard process. Typically one
or two gene expression data sets are used to select and refine a set of genes that are
individually associated with patient prognosis or some other phenotype (chemoresistant,
etc). A summary statistic is created using a weighted sum of these genes’ expression
values. The equation for this summary statistic, which is often referred to as a gene
signature, is then tested for the ability to generate a summary statistic that is reproducibly
associated with prognosis or another phenotype in one or more validation cohorts.
Gene signatures are created typically by choosing some subset of genes whose
expression levels are most significantly correlated with the phenotype of interest in the
training sets. In our analyses of oncogene over-expression, breast cancer prognosis, and
B cell transformation, we observed minimal overlap between the most significant gene
expression changes and the top scored isoform ratio changes. The creation of an isoform
signature, analogous to a gene signature, could be created in the same way that a gene

76
signature is created. This isoform signature could be created and tested on the same set
of data as the original gene signature. Because of the low overlap between top isoform
ratios and top genes, this isoform signature could have the potential to represent an
independent biological dimension of the phenotype of interest.
By providing an orthogonal indicator of prognosis, isoform signatures could in
theory be used in the future to augment existing gene signatures to possibly provide a
more robust phenotypic indicator.
4.3 Automated sequence extraction and motif finding
Part of the novelty of the SplicerEX algorithm relates to its ability to generate
specific hypotheses associated with a mechanistic category and directionality. Further
work on the SplicerEX algorithm may be able to automate extraction of relevant
regulatory sequences of top targets. With adequate numbers of top hits or relaxation of
top hit criteria, the program may be used to find cis-acting regulatory elements involved
in the regulation of alternative mRNA processing, including miRNA seed sequences.
4.4 Concluding Remarks
As our current understanding of biology and our ability to generate data become
increasingly more complex, there will be an ever increasing need for biologically
motivated mathematical models. As mathematical models become increasingly more
complex in their structure and ability to generate data, there will be an ever increasing
need for experimental biology. Also, never put a bacteria plate in the cell culture
incubator.

77
Appendix A: Genes increased in LCLs vs. naïve B cel ls
Fold
Increase P-Val Gene
TCluster
ID
Fold
Change P-Value Gene
TCluster
ID
8.4 4.4E-03 LAMP3 2707876 2.5 1.7E-03 ACAT2 2934131
8.2 6.8E-05 CD226 3812385 2.5 5.6E-04 C1orf85 2438093
6.8 6.4E-04 IL32 3645626 2.5 2.4E-05 ANLN 2997376
6.6 2.9E-03 CHI3L2 2351687 2.5 1.3E-03 NCOR2 3476457
6.5 3.6E-03 TXNDC5 2940826 2.5 4.9E-03 STARD13 3508898
6.2 3.1E-04 CCND2 3401704 2.5 7.1E-03 CCT3 2438125
6.2 4.1E-04 SLC12A8 2693014 2.5 1.8E-04 DUSP16 3444958
6.0 2.5E-03 FCER2 3848492 2.5 2.7E-04 SGMS1 3289235
5.8 3.7E-04 SCARB1 3476665 2.5 4.5E-03 NCALD 3147173
5.7 9.9E-04 UBE2C 3887049 2.5 8.9E-04 AK3 3197318
5.6 4.9E-03 IFI44L 2343473 2.5 1.0E-04 FLOT1 2948587
5.4 7.0E-03 CD300A 3734379 2.5 1.4E-07 MBOAT1 2944491
5.1 8.1E-04 SLAMF7 2363202 2.4 4.9E-04 ZFAT 3154700
5.0 1.3E-03 EBI3 3817380 2.4 7.6E-03 MX2 3922037
4.9 6.1E-05 USP18 3936550 2.4 2.6E-04 AACS 3436571
4.9 4.0E-05 LTA 2902407 2.4 5.3E-03 ZNF215 3318989
4.9 1.8E-03 CD38 2719656 2.4 2.2E-04 ACADM 2342576
4.9 2.3E-03 IFITM1 3315675 2.4 8.2E-04 EBP 3976670
4.8 6.7E-03 UCHL1 2725013 2.4 2.7E-04 PBK 3129149
4.7 9.2E-03 ZWINT 3290210 2.4 8.1E-05 SEC61A1 2641032
4.7 2.9E-03 C12orf75 3429857 2.4 2.7E-06 AIG1 2928690
4.7 1.5E-04 BLVRA 2999544 2.4 7.7E-04 TMEM55A 3144235
4.6 5.2E-04 BUB1 2570616 2.4 4.7E-04 TNFRSF8 2320683
4.6 2.2E-04 CCNA2 2784113 2.4 1.1E-03 PSMD14 2512701
4.6 1.7E-06 HDGFRP3 3636522 2.4 1.6E-03 LMAN2 2888698
4.6 1.1E-03 HJURP 2604254 2.4 2.3E-04 CHEK1 3354799
4.5 3.8E-04 P4HB 3774241 2.4 1.8E-04 DENND1A 3224650
4.5 6.0E-05 AICDA 3443206 2.4 4.1E-04 PDIA6 2540317
4.5 2.1E-03 HSPA5 3225398 2.4 1.7E-05 TPM4 3823511
4.4 8.0E-05 MKI67 3312490 2.4 6.2E-04 PCBD1 3293537
4.4 2.8E-03 DUSP4 3129731 2.4 1.7E-04 IDH1 2597010
4.4 3.9E-04 ZMAT3 2706791 2.4 9.0E-03 ANXA4 2487412
4.4 7.1E-06 CYBRD1 2515240 2.4 6.8E-04 INSIG1 3033209
4.3 2.2E-05 MSC 3140213 2.4 5.9E-03 LRRC59 3762355

78
4.3 4.7E-05 TJP2 3173880 2.4 8.5E-05 PBX3 3189311
4.3 1.1E-04 DST 2958325 2.4 1.3E-04 HSDL2 3185205
4.3 1.0E-03 NEK6 3188697 2.4 5.1E-04 ORC1L 2412799
4.3 1.1E-03 AHRR 2798586 2.4 6.7E-03 DUSP2 2565119
4.3 8.2E-05 GTSE1 3949055 2.4 1.8E-05 KIF11 3258168
4.3 1.2E-04 AURKB 3744263 2.4 2.0E-04 NT5DC1 2922521
4.2 8.0E-04 DHCR24 2413907 2.4 4.2E-05 UBE2J1 2964200
4.2 5.0E-03 CCNB2 3595979 2.4 7.0E-03 RAB35 3474228
4.2 1.5E-03 TNFRSF17 3648391 2.4 6.7E-04 GAS7 3744965
4.2 9.0E-04 OAS1 3432438 2.4 4.5E-03 CUTA 2950714
4.1 7.7E-04 HYOU1 3394123 2.4 9.2E-04 SLC16A1 2428501
4.1 5.1E-03 KIAA0101 3629103 2.4 1.2E-05 RAD54B 3144973
4.1 2.9E-03 PSAT1 3175971 2.4 4.3E-04 ALDH18A1 3301512
4.1 1.1E-03 LAP3 2720145 2.4 8.1E-04 NIPSNAP1 3956909
4.1 2.7E-04 FAS 3257098 2.4 2.1E-04 RCBTB2 3513549
4.1 1.4E-03 FEZ1 3396593 2.4 6.1E-04 HMMR 2838656
4.0 6.0E-04 DHCR7 3380697 2.4 3.4E-06 STIL 2411228
4.0 2.9E-04 KCNN3 2436826 2.4 9.6E-05 RAD51AP1 3401804
4.0 2.4E-05 CDC20 2333136 2.4 8.3E-04 SRM 2396461
4.0 5.6E-04 BST2 3854454 2.4 1.2E-03 SLC31A1 3185522
4.0 1.0E-04 RCN1 3325503 2.4 5.6E-07 PLK1 3653072
4.0 2.0E-03 IDH2 3638760 2.4 2.7E-04 SLC1A4 2485636
3.9 6.2E-05 MACC1 3040518 2.3 1.5E-05 ABCC4 3521174
3.9 1.2E-04 RHOC 2428405 2.3 3.5E-03 CLPP 3818376
3.9 1.2E-03 LY6E 3119339 2.3 6.7E-04 PDIA5 2639225
3.9 3.8E-06 ARNTL2 3409127 2.3 2.5E-03 C22orf9 3963676
3.8 8.9E-05 LIMA1 3454331 2.3 2.3E-03 NUP62 3868183
3.8 1.5E-05 LDLR 3821015 2.3 4.6E-04 TRIM69 3592054
3.8 2.4E-04 TNIK 2705266 2.3 2.8E-03 TMEM106C 3413278
3.8 5.4E-04 NUSAP1 3590388 2.3 5.6E-04 TFRC 2712632
3.8 8.5E-05 CCNB1 2813414 2.3 1.5E-04 MRPL53 2560141
3.8 8.6E-03 ENOSF1 3795866 2.3 5.2E-05 PLK4 2742985
3.8 6.0E-05 SMAD1 2746119 2.3 9.1E-05 FNDC3A 3489212
3.8 3.0E-03 TOP2A 3756193 2.3 1.8E-03 HSD17B12 3328069
3.7 5.1E-04 PCCB 2644014 2.3 8.1E-05 LGALS9 3715274
3.7 4.7E-06 TRPV2 3712062 2.3 2.2E-04 YES1 3795942
3.7 3.0E-04 MAP2K6 3733065 2.3 2.8E-05 RRM1 3318009
3.7 5.0E-03 ENTPD1 3259253 2.3 1.6E-03 SCPEP1 3728037

79
3.6 5.2E-03 TACC1 3094778 2.3 3.2E-04 CARM1 3820865
3.6 2.2E-03 MTHFD1 3540007 2.3 1.4E-05 HS2ST1 2345196
3.6 4.3E-04 MRPL4 3820414 2.3 1.8E-04 MCM10 3235789
3.6 4.8E-04 WDR40A 3203855 2.3 1.1E-05 BRCA1 3758317
3.6 1.4E-04 GNA15 3816815 2.3 8.4E-06 SYT11 2361154
3.6 6.3E-06 SESN2 2327391 2.3 1.9E-03 C14orf166 3535674
3.6 1.9E-04 CDK6 3061319 2.3 7.3E-04 WHSC1 2715076
3.6 1.2E-03 MTHFD2 2489172 2.3 2.9E-04 PRDM1 2919669
3.5 5.6E-04 DLGAP5 3565663 2.3 2.4E-04 CALU 3023060
3.5 2.9E-03 CD274 3161082 2.3 2.1E-03 SSR4 3995975
3.5 1.1E-04 SEC24D 2783316 2.3 6.9E-04 SAMHD1 3904691
3.5 1.1E-04 CORO1C 3470549 2.3 1.3E-03 HNRPLL 2548871
3.5 1.0E-03 IRF4 2891341 2.3 2.8E-04 AIFM1 4021469
3.5 5.0E-03 PTTG1 2838201 2.3 1.2E-03 F11R 2440476
3.5 2.3E-03 DUSP5 3263743 2.3 8.5E-04 FH 2463425
3.4 3.2E-03 PPIB 3628994 2.3 1.5E-04 TYW3 2342391
3.4 3.5E-03 DDB2 3329649 2.3 1.8E-04 ARF3 3453370
3.4 8.8E-03 SRGN 3250146 2.3 1.0E-03 ATIC 2526759
3.3 8.4E-04 CREB3L2 3075136 2.3 2.9E-04 TTF2 2353773
3.3 7.6E-05 SPATS2 3413950 2.3 2.7E-04 BAIAP2L1 3062868
3.3 1.0E-03 NCAPG 2720251 2.3 2.3E-03 CYB5B 3666732
3.3 5.4E-04 PIK3R3 2410470 2.3 2.3E-05 DEPDC1 2417528
3.3 1.2E-03 FOXM1 3440598 2.3 3.2E-04 ACLY 3757433
3.3 1.6E-03 MYL6B 3417435 2.3 5.2E-03 CRELD2 3950452
3.3 2.6E-04 WSB2 3473727 2.3 5.0E-03 RAC2 3960061
3.3 1.6E-03 GLCCI1 2989537 2.3 3.6E-04 RSU1 3279575
3.3 2.1E-04 HMGB2 2793951 2.3 7.0E-05 TRAPPC1 3744039
3.3 8.4E-06 CEP55 3258444 2.3 9.7E-04 NCAPG2 3082181
3.3 1.3E-03 MRPS15 2406766 2.3 3.8E-04 AARS 3697015
3.3 1.4E-04 DPP3 3336238 2.3 3.4E-03 SLC25A1 3952543
3.3 1.9E-03 OASL 3474831 2.3 5.8E-05 PCK2 3529508
3.2 2.9E-05 NCAPH 2494484 2.2 3.9E-05 SH3RF1 2793137
3.2 5.0E-05 ZNRF1 3668834 2.2 2.0E-04 MTDH 3108433
3.2 1.1E-03 DTL 2378937 2.2 7.9E-05 WDR41 2863535
3.2 2.9E-04 NCAPD2 3402571 2.2 5.5E-04 SUSD1 3220846
3.2 4.4E-06 HDLBP 2607110 2.2 9.0E-06 GALNT10 2836518
3.2 1.6E-03 GINS1 3880827 2.2 1.1E-03 ALCAM 2634494
3.2 2.1E-03 B4GALT6 3803120 2.2 5.5E-04 ME1 2962820

80
3.2 1.2E-03 BATF 3544605 2.2 1.2E-03 ATF3 2379132
3.2 2.2E-04 BSG 3815014 2.2 6.6E-04 ACSL4 4017810
3.2 2.1E-03 IFI44 2343511 2.2 2.8E-05 NUF2 2364438
3.2 7.6E-04 B3GNT2 2484841 2.2 2.3E-03 CBX5 3456630
3.1 6.3E-04 PLA1A 2638077 2.2 4.7E-04 MAPKAP1 3225456
3.1 7.0E-03 CRYZ 2418451 2.2 2.8E-04 TFDP1 3502710
3.1 5.2E-04 SLC1A1 3160658 2.2 2.4E-03 TRAM2 2957227
3.1 7.6E-04 IGF2BP3 3041409 2.2 3.1E-06 RFC3 3485074
3.1 1.8E-03 RGL1 2371346 2.2 3.6E-03 RRBP1 3899173
3.1 9.9E-05 TUBG1 3721926 2.2 3.5E-04 RDX 3390542
3.1 4.2E-05 40429 2875454 2.2 3.4E-03 UCHL3 3494102
3.1 7.2E-04 SEC24A 2829416 2.2 4.1E-03 CHMP2A 3872983
3.1 4.0E-03 SSR3 2702154 2.2 4.1E-03 THOC4 3774331
3.1 5.5E-04 SLAMF1 2440327 2.2 2.3E-05 CENPE 2780172
3.1 2.5E-04 KIF2C 2334098 2.2 2.9E-05 CASC5 3590014
3.1 3.6E-03 ITM2C 2531589 2.2 9.2E-03 PSMC3 3372209
3.1 3.1E-03 DOK3 2888879 2.2 3.8E-03 CTNNAL1 3219621
3.0 5.5E-06 KIF23 3599811 2.2 1.7E-03 COPG 2641532
3.0 9.4E-06 TWSG1 3778372 2.2 2.7E-04 TTK 2914777
3.0 1.3E-04 LMNB1 2827185 2.2 2.4E-04 CALM3 3836841
3.0 1.6E-04 SPARC 2882098 2.2 5.7E-04 POMP 3483348
3.0 7.8E-04 TMEM97 3715489 2.2 2.1E-06 CCDC88A 2553771
3.0 1.9E-04 GFPT1 2558045 2.2 5.9E-05 AP2S1 3866302
3.0 4.6E-04 CDC6 3720896 2.2 2.3E-04 MRPS33 3076489
3.0 2.8E-04 CDC45L 3936913 2.2 5.2E-04 FECH 3809621
3.0 9.4E-05 SPAG5 3750785 2.2 7.6E-03 ORMDL3 3755934
3.0 3.6E-04 40432 2732273 2.2 3.2E-03 SC4MOL 2750594
3.0 1.9E-03 CYFIP1 3583638 2.2 1.4E-03 NDUFV1 3337196
3.0 6.1E-05 PRC1 3639031 2.2 1.3E-03 LRP8 2413203
3.0 1.8E-03 MELK 3168508 2.2 1.2E-04 PHF19 3223687
3.0 7.0E-03 PMAIP1 3790704 2.2 1.1E-03 GINS2 3703112
3.0 7.1E-04 SEMA4A 2361342 2.2 1.7E-05 E2F8 3365776
3.0 4.0E-03 PLOD1 2320581 2.2 1.6E-04 CBX3 2993639
3.0 2.3E-03 IL10 2452948 2.2 3.5E-03 TCEAL4 3985615
3.0 8.8E-04 SORD 3592109 2.2 3.8E-03 RAD54L 2334646
2.9 1.7E-04 SORBS2 2796995 2.2 6.8E-05 NFE2L1 3725035
2.9 2.9E-04 FEN1 3333226 2.2 9.1E-03 NOMO3 3682893
2.9 1.3E-04 DBI 2502821 2.2 1.8E-04 LRRC42 2336913

81
2.9 2.5E-04 OAS2 3432514 2.2 1.6E-04 MCM2 2640855
2.9 2.8E-04 CDCA2 3090697 2.2 2.7E-05 MREG 2598496
2.9 7.3E-03 ASF1B 3852565 2.2 2.1E-03 KEAP1 3850363
2.9 1.3E-04 TLR7 3969081 2.2 6.8E-03 ETV5 2709132
2.9 5.5E-04 AAK1 2558150 2.2 6.4E-05 NETO2 3690154
2.9 7.1E-04 ASPM 2449559 2.2 5.2E-04 DDOST 2400220
2.9 3.3E-04 BCL2L12 3838795 2.2 2.3E-04 PML 3601387
2.9 4.2E-03 SLC43A3 3373845 2.2 8.1E-03 RAPGEF2 2749699
2.9 1.2E-03 KIAA1797 3164601 2.2 4.3E-04 CCNG1 2838598
2.9 9.5E-03 TMOD1 3181240 2.2 6.4E-03 FADS2 3333247
2.9 4.8E-03 OPTN 3235726 2.2 1.1E-03 CDC25A 2673085
2.9 1.0E-03 CAMK4 2823880 2.1 1.4E-03 CLTA 3168415
2.9 3.2E-03 TRAF1 3223738 2.1 5.2E-04 ILDR1 2691850
2.9 6.5E-05 STK38L 3409081 2.1 7.8E-04 THOP1 3816611
2.8 3.7E-04 DSG2 3783529 2.1 3.4E-03 RHOBTB3 2820925
2.8 1.7E-03 PTPN6 3403092 2.1 1.3E-04 NDFIP2 3495076
2.8 6.8E-04 GMDS 2938636 2.1 2.2E-03 MBD2 3808600
2.8 6.0E-04 FNDC3B 2652410 2.1 2.7E-04 PMM1 3962000
2.8 1.4E-03 ST7 3020496 2.1 1.6E-04 DRAP1 3335736
2.8 4.4E-03 GOT1 3302990 2.1 5.5E-03 ERH 3570049
2.8 3.6E-04 HN1 3770606 2.1 3.6E-03 NDUFAB1 3685306
2.8 6.2E-04 CDR2 3684782 2.1 2.2E-05 RAD51 3590086
2.8 1.3E-03 HMGA1 2904000 2.1 4.2E-05 DECR1 3106310
2.8 6.3E-03 PAK1 3382861 2.1 1.9E-05 PGRMC1 3988740
2.8 1.9E-04 SHCBP1 3689880 2.1 1.9E-03 ARHGAP18 2973694
2.8 1.7E-04 BIRC5 3736290 2.1 9.4E-04 GPHN 3540862
2.8 1.2E-03 MGC29506 2877893 2.1 3.8E-05 ECT2 2652675
2.8 6.3E-04 NUCB2 3322251 2.1 2.6E-04 WDHD1 3565571
2.8 2.0E-03 ATP1B1 2366422 2.1 8.8E-04 CKAP5 3371719
2.8 7.7E-06 DEPDC1B 2858592 2.1 9.3E-03 DPAGT1 3394192
2.8 1.5E-04 UBE2T 2451200 2.1 8.7E-04 TXNDC11 3680479
2.7 1.1E-04 MCM4 3097152 2.1 5.1E-03 CABLES1 3781531
2.7 8.2E-05 CDCA4 3581386 2.1 6.6E-04 CTNNA1 2830946
2.7 4.6E-03 AHCY 3903361 2.1 7.9E-03 PPP1R15A 3838004
2.7 7.8E-03 LMNB2 3845909 2.1 2.8E-03 GRN 3722917
2.7 8.7E-05 RPS27L 3628469 2.1 5.7E-03 FUCA1 2401643
2.7 1.1E-03 MLEC 3434525 2.1 6.1E-04 SLC39A14 3089360
2.7 3.0E-04 CCNE1 3828112 2.1 4.6E-03 TARS 2805786

82
2.7 7.1E-04 TRIB3 3873160 2.1 1.1E-05 XRCC4 2818454
2.7 7.8E-04 KIF20A 2830638 2.1 4.5E-03 LHFPL2 2863885
2.7 7.9E-05 CENPF 2379863 2.1 1.4E-03 SNX4 2693149
2.7 7.3E-03 SCD 3260586 2.1 1.2E-05 MSRB2 3238761
2.7 1.9E-03 APOBEC3B 3945545 2.1 4.9E-03 TCF19 2902178
2.7 2.5E-03 RPN2 3884100 2.1 2.5E-03 CMAS 3407926
2.7 7.3E-03 DNAJB11 2656569 2.1 1.0E-03 ATP5J2 3063305
2.7 1.9E-04 TRIP13 2798915 2.1 5.1E-03 PPIL1 2952065
2.7 1.4E-03 VASH2 2379314 2.1 2.1E-03 DNMT3A 2544662
2.7 5.3E-03 SLC25A23 3847873 2.1 2.3E-03 TIPARP 2649113
2.7 3.4E-03 LGALS3 3536706 2.1 2.1E-03 SELS 3642137
2.7 3.2E-05 HSPA4L 2742935 2.1 6.5E-03 TMEM184B 3960440
2.7 4.1E-04 FAR2 3409605 2.1 1.8E-04 CAMSAP1L1 2374345
2.7 6.8E-04 SUMO3 3934669 2.1 4.8E-04 MTMR2 3387483
2.7 4.1E-03 OAS3 3432467 2.1 4.2E-04 MPZL1 2365958
2.7 2.0E-05 C13orf3 3504617 2.1 3.7E-04 RABGAP1L 2367963
2.7 9.4E-03 PLEK 2486811 2.1 9.4E-04 HRSP12 3145980
2.7 6.8E-04 STAG3 3015338 2.1 1.5E-04 KIF14 2450345
2.7 4.6E-04 CKS1B 2360452 2.1 1.4E-03 CSRP1 2450865
2.7 2.0E-05 AURKA 3910785 2.1 2.1E-03 PNPO 3724969
2.6 3.1E-04 TBC1D4 3518086 2.1 3.5E-05 HERC5 2735409
2.6 7.8E-04 PFKM 3413344 2.1 8.6E-03 SEC23B 3878467
2.6 3.1E-04 MOXD1 2974413 2.1 8.3E-04 SLFN13 3753568
2.6 6.4E-04 SH3KBP1 4001850 2.1 2.8E-04 CPEB4 2841699
2.6 3.5E-04 ICAM1 3820443 2.1 5.4E-03 GTPBP4 3231774
2.6 4.5E-04 OBFC2B 3417485 2.1 1.0E-03 BPNT1 2456805
2.6 1.2E-04 FAM33A 3764738 2.1 2.0E-03 EIF2B2 3544387
2.6 5.4E-03 TUBB 2901913 2.1 5.0E-03 NUS1 2923060
2.6 2.9E-03 TUBA1B 3453732 2.1 1.6E-03 NEDD9 2941784
2.6 6.6E-04 TM7SF3 3448481 2.1 5.8E-04 DMXL2 3624145
2.6 9.2E-03 CDCA7 2516023 2.1 1.0E-03 XPOT 3419807
2.6 5.6E-04 MCOLN2 2420642 2.1 7.8E-03 GRAMD3 2827057
2.6 4.8E-04 CLIC2 4027769 2.1 5.5E-04 DDX49 3825446
2.6 6.8E-07 TNFRSF10B 3127703 2.1 1.2E-04 MRPL37 2337003
2.6 5.3E-04 STOM 3223928 2.1 1.1E-03 OSTC 2738949
2.6 1.2E-04 MYO6 2914070 2.1 5.2E-04 OSBPL9 2336099
2.6 3.6E-05 CTSC 3385769 2.0 1.5E-05 SEL1L 3574207
2.6 3.2E-03 FGR 2403215 2.0 4.0E-05 CD99L2 4025771

83
2.6 2.5E-04 HELLS 3258910 2.0 2.3E-04 FBXO5 2980241
2.6 4.7E-03 BOLA3 2559792 2.0 6.4E-04 PPIF 3253880
2.6 8.8E-04 ACTN1 3569814 2.0 1.3E-03 SMARCA4 3820921
2.6 7.6E-04 TRIP10 3818515 2.0 6.8E-04 GSK3B 2691014
2.6 6.6E-04 MAPK6 3594129 2.0 9.9E-03 BUD31 3014742
2.6 2.9E-03 LSS 3935243 2.0 2.9E-04 C12orf4 3441215
2.6 1.6E-03 PRDX3 3309383 2.0 4.3E-04 UQCRC2 3652218
2.6 4.7E-04 FBN1 3623031 2.0 7.0E-03 LCP1 3512874
2.6 7.1E-04 MDH2 3009299 2.0 5.7E-03 CPNE8 3450655
2.6 2.3E-03 EIF2AK2 2548402 2.0 3.8E-04 GNS 3460127
2.6 1.2E-04 TRIM14 3217123 2.0 2.8E-03 MRPL48 3340032
2.5 1.7E-04 EXO1 2388219 2.0 4.4E-03 MRPS9 2497892
2.5 1.6E-03 SIAE 3396003 2.0 8.3E-03 EBNA1BP2 2409220
2.5 7.0E-04 LMAN1 3810472 2.0 1.3E-03 BTG3 3926080
2.5 5.0E-04 KIF21A 3450775 2.0 8.8E-04 PRKAG1 3453556
2.5 3.6E-05 FUT8 3540552 2.0 3.5E-05 AGK 3027808
2.5 7.4E-03 LCK 2328841 2.0 3.8E-03 NDUFS3 3329904
2.5 2.3E-03 MLLT3 3200982 2.0 7.0E-03 ACP2 3372097
2.5 1.0E-03 CHMP5 3166844 2.0 2.3E-05 MOV10 2352275
2.5 3.3E-04 SLC7A11 2786322 2.0 2.4E-04 NUP37 3468261
2.5 3.6E-04 SLC38A5 4007437 2.0 1.3E-03 ASNA1 3821847
2.5 1.1E-03 MNDA 2362333 2.0 2.2E-03 SURF4 3228674
2.5 1.9E-05 C19orf48 3868659 2.0 1.4E-04 SRA1 2878347
2.5 5.7E-04 RBM47 2766788 2.0 1.6E-04 NOD2 3660175
2.5 2.2E-03 YARS 2405192 2.0 2.4E-03 TTC35 3111375
2.5 1.2E-03 FERMT3 3334257 2.0 9.7E-03 TROAP 3413875
2.5 2.6E-04 BUB1B 3589697 2.0 7.3E-04 GALK2 3593339
2.5 2.0E-04 FANCI 3607537 2.0 1.3E-03 RAB11A 3598482
2.5 7.4E-04 TNFSF10 2705706 2.0 6.3E-03 RTN3 3333942
2.5 1.0E-04 ACAT1 3347615 2.0 5.2E-04 NDUFA8 3224197
2.5 2.3E-03 CD80 2690900 2.0 5.3E-05 GMNN 2898597
2.5 6.0E-04 ANXA6 2881747 2.0 7.7E-03 ZMYND8 3908149

84
Appendix B: Genes decreased in LCLs vs. naïve B cel ls
Fold
Decrease P-Value Gene
TCluster
ID
Fold
Decrease P-Value Gene
TCluster
ID
15.5 1.0E-04 FAM129C 3824427 2.9 1.1E-03 FAM65B 2945741
15.2 6.8E-05 TGFBR2 2615360 2.9 3.0E-03 KIAA0999 3392996
11.1 1.2E-07 ADAM28 3090209 2.9 7.8E-04 FAM53B 3311269
11.0 3.0E-04 CXCR4 2578028 2.9 7.9E-03 RASA3 3526831
11.0 7.1E-06 ARRDC2 3824713 2.9 7.2E-04 DCK 2730714
9.2 2.8E-06 FOXP1 2681753 2.8 7.6E-05 FCRL2 2439052
7.7 1.0E-03 TAGAP 2982076 2.8 2.6E-03 IL13RA1 3988538
7.7 6.2E-04 BANK1 2737596 2.7 3.0E-04 TMEM71 3154185
7.5 2.5E-03 C13orf18 3512948 2.7 3.5E-04 PLEKHA1 3268274
7.3 3.9E-05 BACH2 2964553 2.7 6.8E-04 VAV3 2426385
6.5 7.7E-03 KIAA0746 2764192 2.7 3.1E-04 SLC6A16 3867734
6.5 4.7E-05
GALNAC4S-
6ST 3268940 2.6 3.7E-03 GABBR1 2947889
6.2 1.2E-04 RASGRP2 3376976 2.6 5.5E-03 BANP 3673091
5.9 5.6E-04 ARHGAP25 2486927 2.6 8.4E-03 EZR 2981912
5.5 7.3E-06 HHEX 3258221 2.6 4.4E-03 HLA-DMB 2950263
5.5 2.8E-06 NOTCH2 2431112 2.6 1.5E-03 IL16 3604287
5.2 1.2E-03 BCL6 2709778 2.6 2.0E-03 BCL2L11 2500275
5.2 1.0E-03 FCRL3 2439001 2.6 4.2E-03 DGKD 2532894
5.0 6.0E-03 HIP1R 3435548 2.5 6.1E-03 PTPRC 2373842
5.0 5.3E-05 MTSS1 3151970 2.5 1.1E-03 RASSF2 3896034
4.9 5.9E-03 CD83 2895841 2.5 1.2E-03 KIAA0226 2713555
4.9 3.6E-03 TXNIP 2356115 2.5 1.5E-03 TNFRSF10A 3127775
4.8 1.9E-07 COBLL1 2584787 2.5 1.7E-03 SLA 3154263
4.8 2.7E-03 CD72 3204648 2.5 1.5E-04 NBPF14 2433686
4.8 6.4E-03 APLP2 3356115 2.5 7.2E-04 RP11-94I2.2 2432851
4.8 7.1E-05 NUAK2 2452405 2.4 2.4E-03 ZNF238 2388794
4.4 3.6E-05 MAP4K4 2496727 2.4 3.9E-04 RP11-94I2.2 2355365
4.4 8.5E-06 CMTM7 2615938 2.4 3.1E-03 GGA2 3685183
4.4 1.6E-03 SATB1 2665199 2.4 1.9E-04 USP24 2413943
4.3 1.1E-03 LTB 2949118 2.3 3.4E-03 MLXIP 3435192
4.3 3.8E-05 OSBPL10 2667809 2.3 1.8E-03 FAM65A 3665550
4.1 3.6E-05 PFKFB3 3233605 2.3 1.4E-04 TRAK1 2619120
3.9 2.7E-03 FADS3 3375582 2.3 4.7E-03 SH3BP5 2664209

85
3.9 6.7E-03 NDRG1 3154317 2.3 5.1E-04 --- 3734966
3.7 4.9E-04 ARHGAP24 2734421 2.2 2.7E-03 BACE2 3921933
3.6 4.2E-05 JAZF1 3043264 2.2 2.9E-04 SIDT2 3350775
3.6 4.7E-03 IL4R 3654175 2.2 8.4E-03 ABLIM1 3307939
3.6 4.4E-04 TGIF1 3776504 2.2 4.6E-03
CSGALNACT
1 3126504
3.5 6.3E-03 MED13L 3473083 2.2 6.7E-03 NT5E 2915828
3.5 5.8E-04 IGF1R 3610804 2.2 6.9E-03 MLL5 3017547
3.5 1.0E-03 ZNF395 3129304 2.2 1.3E-03 ECE1 2400518
3.3 2.6E-05 COL9A3 3892974 2.2 1.4E-04 FLOT2 3751121
3.3 5.9E-04 PMEPA1 3911217 2.2 9.7E-03 CASP8 2522728
3.2 4.0E-04 PDE3B 3321512 2.2 2.1E-03 ZNF532 3790361
3.2 1.9E-04 CXCR5 3351675 2.2 1.2E-05 BZW2 2991103
3.2 6.4E-04 JAK1 2416522 2.1 1.6E-04 PRDM2 2321238
3.2 1.8E-03 REL 2484358 2.1 9.1E-03 NR4A1 3415229
3.2 2.8E-03 LY9 2363248 2.1 9.1E-04 ABCA1 3218528
3.2 3.9E-04 QSOX2 3229797 2.1 5.2E-03 ZMAT1 4016001
3.2 6.7E-03 ADAM19 2883440 2.1 2.6E-03 FYN 2969886
3.1 6.7E-03 STAT4 2592356 2.1 9.2E-03 KIAA0355 3829638
3.1 3.0E-03 PTPRO 3406329 2.1 8.7E-03 KDM6B 3709153
3.1 2.0E-03 CHMP7 3089853 2.0 4.5E-04 TRAF5 2378662
3.1 6.6E-03 ZHX2 3113894 2.0 2.7E-03 KMO 2388085
3.1 1.9E-03 PXK 2626167 2.0 1.0E-03 ADAM6 3581637
3.0 9.6E-04 INPP5F 3267382 2.0 7.1E-04 EZH1 3758078
3.0 2.8E-04 NFATC1 3795184 2.0 2.5E-03 ABCB4 3060117
3.0 4.3E-04 EBF1 2883878 2.0 7.5E-05 EVL 3551566
2.9 4.7E-03 C12orf42 3468610 2.0 1.7E-03 INPP5D 2532699

86
Appendix C: Genes alternatively processed in LCLs v s.
naïve B cells
Array Rank Gene TCluster ID Hyp Prot Category Subtype
Exon 1 KIAA1797 3164601 Yes No Alt 5' Init More 3' start
U133 2 TRIM37 3764680 Yes Yes Internal Event Exclusion
U133 2 NFYA 2906607 No No Unclassified ---
U133 3 CPSF2 3548788 Yes No Tandem 3' UTR Shorten
Exon 4 CASC5 3590014 Yes Yes Internal Event Exclusion
Exon 5 ADFP 3200648 Yes No Alt 5' Init More 5' start
U133 5 ZNF277 3019401 Yes Yes Alt 3' TE – APA More 3' TE
Exon 6 PRKDC 3134034 Yes Yes Internal Event Exclusion
U133 6 DDX59 2450416 Yes Yes Alt 3' TE - Alt 3' SS More 5' TE
Exon 7 RRBP1 3899173 Yes Yes Internal Event Inclusion
U133 7 DDX58 3203086 Yes No Tandem 3' UTR Shorten
U133 8 WDR33 2575054 Yes Yes Alt 3' TE – APA More 5' TE
U133 9 HAUS2 3591044 Yes No Tandem 3' UTR Shorten
U133 10 PHC3 2704894 Yes No Tandem 3' UTR Shorten
U133 11 CTSS 2434575 Yes No Tandem 3' UTR Shorten
Exon 12 MYO3B 2514745 Yes Yes Internal Event Exclusion
U133 12 ATXN3 3576889 Yes No Tandem 3' UTR Shorten
U133 13 MARCH6 2801608 Yes No Transcript Length ---
Exon 14 DYNC1H1 3552847 No No Unclassified ---
U133 14 FAM36A 2389062 Yes No Tandem 3' UTR Shorten
U133 15 MXD4 2757751 Yes No Tandem 3' UTR Shorten
Exon 16 TMEM135 3343546 Yes Yes Alt 3' TE - Alt 3' SS More 3' TE
U133 16 UBE2I 3643703 No No Unclassified ---
Exon 17 STAU1 3908786 Yes Yes Internal Event Exclusion
U133 17 N4BP2L2 3508696 No No Unclassified ---
U133 18 RUNX1 3930360 No No Unclassified ---
U133 19 6-Sep 4019486 Yes Yes Alt 3' TE - Alt 3' SS More 5' TE
U133 20 RRP7B 3962469 No No Unclassified ---
Exon 21 CDC2L5 2998536 Yes No Alt 5' Init More 5' start
U133 21 DBT 2425212 Yes No Tandem 3' UTR Shorten
U133 22 ZNF207 3717635 Yes Yes Alt 3' TE – APA More 5' TE
U133 24 NASP 2334404 Yes No Tandem 3' UTR Shorten
U133 25 C17orf69 3723572 No No Unclassified ---

87
Exon 27 PASK 2607055 Yes Yes Alt 3' TE – APA More 3' TE
U133 27 NUB1 3032017 Yes No Tandem 3' UTR Shorten
Exon 29 FAM111A 3331926 Yes No Internal Event (3' TE) Exclusion
U133 29 ALMS1 2488785 No No Unclassified ---
U133 30 TXNL4B 3698055 Yes No Tandem 3' UTR Shorten
U133 31 JMJD7 3590709 Yes Yes Alt 3' TE – APA More 5' TE
U133 32 RER1 2316558 Yes No Tandem 3' UTR Shorten
U133 33 POLR1B 2500838 Yes No Tandem 3' UTR Shorten
Exon 34 TCFL5 3913483 Yes No Alt 5' Init More 5' start
U133 36 HEXA 3632152 Yes No Internal Event (3' TE) Exclusion
U133 37 ALPK1 2739792 Yes Yes Alt 3' TE - Alt 3' SS More 3' TE
Exon 38 CCDC90A 2942578 Yes Yes Internal Event Exclusion
U133 38 PCTK1 3976124 Yes No Tandem 3' UTR Shorten
U133 39 LRCH4 3064082 No No Unclassified ---
U133 40 TPCN2 3337918 No No Unclassified ---
Exon 41 SH2B3 3431892 No No Unclassified ---
U133 41 CDC42SE2 2828146 Yes No Tandem 3' UTR Shorten
U133 42 PHF17 2743315 Yes Yes Alt 3' TE – APA More 5' TE
Exon 43 CRTAP 2616166 Yes No Tandem 3' UTR Shorten
Both 43 TXNDC5 2940826 Yes Yes Alt 3' TE - Alt 3' SS More 3' TE
U133 44 SYMPK 3865715 Yes Yes Alt 3' TE – APA More 3' TE
U133 45 ATF7IP 3406015 Yes Yes Alt 3' TE – APA More 3' TE
U133 46 RBBP6 3653317 Yes No Alt 5' Init More 3' start
Exon 47 SCMH1 2408499 Yes Yes Internal Event Exclusion
U133 47 VKORC1 3688197 Yes Yes Alt 3' TE - Alt 3' SS More 5' TE
Exon 48 SYNE1 2979871 Yes Yes Alt 5' Init More 5' start
U133 48 PPP2R5C 3552729 Yes Yes Alt 3' TE – APA More 5' TE
U133 50 UBOX5 3895232 Yes Yes Alt 3' TE - Alt 3' SS More 5' TE
U133 51 CLPTM1 3835935 Yes No Internal Event (3' TE) Exclusion
U133 52 TRIOBP 3944922 Yes Yes Alt 3' TE - Alt 3' SS More 3' TE
Exon 53 PGPEP1 3824963 Yes Yes Internal Event Exclusion
Exon 54 ARCN1 3351531 Yes No Alt 5' Init More 5' start
U133 54 PNO1 2486740 Yes No Tandem 3' UTR Shorten
Exon 56 CASP7 3264948 Yes Yes Internal Event Exclusion
U133 56 HAUS5 3830571 Yes No Tandem 3' UTR Shorten
Exon 57 TCL6 3550139 No No Unclassified ---
U133 57 CRAMP1L 3643966 Yes No Tandem 3' UTR Shorten
U133 59 ATG5 2967550 Yes No Tandem 3' UTR Shorten

88
U133 61 AGGF1 2816563 Yes No Tandem 3' UTR Shorten
U133 62 FLYWCH1 3645402 Yes Yes Alt 3' TE – APA More 5' TE
U133 64 PRMT2 3924783 Yes No Transcript Length ---
Exon 65 SCLT1 2785282 Yes Yes Internal Event Exclusion
U133 65 BCL2 3811339 Yes No Tandem 3' UTR Shorten
U133 66 PPHLN1 3412008 Yes Yes Alt 3' TE – APA More 5' TE
Exon 68 PFAS 3709540 Yes No Tandem 3' UTR Shorten
U133 68 C2orf64 2566383 Yes No Tandem 3' UTR Shorten
U133 70 CBR4 2793054 Yes Yes Alt 3' TE – APA More 3' TE
U133 72 ARGLU1 3524618 Yes No Alt 5' Init More 5' start
U133 73 TRIM4 3063536 Yes No Tandem 3' UTR Shorten
Exon 74 PTER 3236786 Yes Yes Internal Event Exclusion
U133 75 TRIM27 2947572 Yes No Tandem 3' UTR Shorten
Exon 77 ARHGAP26 2833286 Yes Yes Internal Event Exclusion
U133 77 MBNL1 2648141 No No Unclassified ---
Exon 78 MTRF1 3511189 Yes Yes Internal Event Exclusion
U133 78 LONP2 3659306 No No Unclassified ---
Exon 79 ZNF3 3063646 Yes No Alt 5' Init More 3' start
U133 80 HPS1 3302805 Yes Yes Alt 3' TE – APA More 5' TE
U133 83 CPT1B 3966057 Yes Yes Alt 3' TE – APA More 3' TE
Exon 85 BRCA1 3758317 Yes No Transcript Length ---
U133 87 TRMT61A 3553803 Yes No Tandem 3' UTR Shorten
U133 88 GNL3L 3978453 Yes No Tandem 3' UTR Shorten
U133 89 CHCHD7 3099089 Yes No Tandem 3' UTR Shorten
U133 90 C10orf4 3300793 No No Unclassified ---
U133 91 BTN2A2 2899340 Yes No Tandem 3' UTR Lengthen
U133 92 HNRNPH1 2890148 Yes No Transcript Length ---
U133 94 MBNL2 3497586 No No Unclassified ---
Exon 95 DCTN1 2559967 Yes Yes Internal Event Exclusion
Exon 96 SAP18 3480657 Yes No Tandem 3' UTR Shorten
U133 96 TMEM97 3715489 Yes No Tandem 3' UTR Shorten
U133 97 TTLL4 2528020 Yes No Transcript Length ---
Exon 99 C19orf54 3862785 Yes No Internal Event (3' TE) Exclusion
U133 101 PECR 2598606 Yes No Tandem 3' UTR Shorten
U133 102 ANP32E 2434319 Yes No Tandem 3' UTR Shorten
U133 106 TMC8 3736162 Yes No Tandem 3' UTR Shorten
U133 108 STXBP2 3819016 Yes Yes Alt 3' TE – APA More 3' TE
U133 112 TCP11L1 3325839 Yes No Tandem 3' UTR Lengthen

89
Exon 114 MOSPD1 4022833 Yes No Tandem 3' UTR Shorten
U133 115 TRNAU1AP 2327542 Yes No Tandem 3' UTR Shorten
Exon 116 IFT81 3431426 Yes Yes Internal Event Exclusion
U133 117 SLC35E1 3854000 Yes Yes Alt 3' TE – APA More 3' TE
U133 119 GCOM1 3595441 Yes Yes Alt 3' TE - Alt 3' SS More 3' TE
U133 120 CALM3 3836841 Yes No Tandem 3' UTR Shorten
U133 126 FAM129C 3824427 Yes Yes Alt 3' TE – APA More 5' TE
U133 127 LIMK2 3942838 Yes No Tandem 3' UTR Lengthen
U133 128 FCRL5 2438892 Yes Yes Alt 3' TE – APA More 5' TE
Exon 129 FBXL17 2870113 Yes Yes Internal Event Exclusion
U133 131 SFRS15 3928866 Yes Yes Alt 3' TE – APA More 3' TE
Exon 132 IFT20 3750595 Yes Yes Internal Event Exclusion
U133 132 DENND1A 3224650 Yes Yes Alt 3' TE - Alt 3' SS More 5' TE
U133 133 MTSS1 3151970 Yes No Tandem 3' UTR Shorten
Exon 135 E2F2 2401448 Yes No Tandem 3' UTR Shorten
U133 136 ACSL4 4017810 No No Unclassified ---
U133 137 C1orf107 2378180 Yes No Tandem 3' UTR Shorten
U133 142 CASP6 2781693 Yes No Internal Event (3' TE) Inclusion
U133 145 TRIM69 3592054 Yes Yes Alt 3' TE - Alt 3' SS More 3' TE
Exon 147 PDIA6 2469529 Yes Yes Internal Event Exclusion
U133 148 C18orf25 3787031 Yes No Tandem 3' UTR Shorten
U133 150 PRKRIP1 3016692 Yes No Tandem 3' UTR Shorten
U133 153 STAU2 3140640 Yes Yes Alt 3' TE – APA More 5' TE
U133 154 DGCR8 3937183 Yes No Alt 5' Init More 3' start
U133 157 STAT5B 3757770 Yes Yes Alt 3' TE – APA More 3' TE
Exon 160 RAB3IP 3421706 Yes Yes Internal Event Exclusion
Exon 165 EPS15L1 3853814 Yes Yes Internal Event Exclusion
Exon 166 STAB1 2623922 No No Unclassified ---
U133 166 RBM19 3472468 Yes Yes Alt 3' TE – APA More 5' TE
Exon 167 PLD2 3707214 Yes Yes Internal Event Exclusion
Exon 169 SLFN11 3753500 Yes No Internal Event (3' TE) Inclusion
U133 172 CCDC88C 3576441 No No Unclassified ---
U133 175 SOS1 2549092 No No Unclassified ---
Exon 176 TCF4 3808854 Yes Yes Alt 5' Init More 3' start
U133 177 XRCC4 2818454 Yes Yes Alt 3' TE - Alt 3' SS More 3' TE
U133 179 ST7 3020496 Yes Yes Alt 3' TE - Alt 3' SS More 3' TE
U133 181 TRIM14 3217123 Yes No Tandem 3' UTR Lengthen
U133 182 STS 3967689 Yes No Tandem 3' UTR Lengthen

90
Exon 183 VGLL4 2662956 No No Unclassified ---
U133 183 CACYBP 2368198 Yes No Tandem 3' UTR Shorten
U133 184 PHF19 3223687 Yes Yes Alt 3' TE – APA More 5' TE
U133 187 MLF1IP 2796510 Yes No Tandem 3' UTR Lengthen
U133 188 ZKSCAN5 3014855 Yes No Tandem 3' UTR Shorten
Exon 189 PTPRE 3270270 Yes Yes Internal Event Inclusion
U133 189 TRMT5 3567469 Yes No Tandem 3' UTR Shorten
U133 192 SLC25A17 3961622 Yes No Tandem 3' UTR Shorten
U133 193 EIF1 3721400 No No Unclassified ---
Exon 198 C21orf7 3917204 Yes Yes Internal Event Exclusion
Exon 199 C20orf27 3895679 Yes No Transcript Length ---
U133 201 CCDC25 3129121 Yes No Tandem 3' UTR Shorten
Exon 203 USP30 3430894 Yes Yes Internal Event Exclusion
Exon 207 ANKRD20B 2564520 Yes Yes Internal Event Exclusion
Exon 208 FZR1 3816988 No No Unclassified ---
Exon 209 TERF1 3103187 Yes No Alt 5' Init More 5' start
Exon 211 LILRB2 3870733 Yes Yes Internal Event Inclusion
U133 216 MYO19 3754227 Yes Yes Alt 3' TE – APA More 3' TE
U133 219 RCL1 3160773 Yes No Tandem 3' UTR Shorten
U133 220 EXOC7 3771336 Yes Yes Alt 3' TE – APA More 3' TE
U133 224 KIAA1715 2588319 Yes No Tandem 3' UTR Shorten
U133 231 CPSF6 3421446 Yes No Tandem 3' UTR Shorten
U133 233 C16orf35 3674886 Yes No Transcript Length ---
Exon 239 WDR74 3376235 No No Unclassified ---
U133 243 MGEA5 3304012 Yes Yes Alt 3' TE – APA More 3' TE
Exon 246 RTCD1 2348854 Yes Yes Internal Event Exclusion
Exon 249 USP6 3707498 Yes No Alt 5' Init More 3' start
Both 250 AURKB 3744263 Yes No Transcript Length ---
U133 252 DIS3 3517594 Yes No Tandem 3' UTR Shorten
U133 253 CLCC1 2426791 Yes No Tandem 3' UTR Shorten
Exon 255 TJAP1 2908008 Yes No Alt 5' Init More 5' start
Exon 256 BTG3 3926080 Yes Yes Internal Event Exclusion
U133 258 MSH3 2817837 Yes No Transcript Length ---
Exon 261 PPIL5 3534785 Yes Yes Internal Event Exclusion
Exon 270 ZNF215 3318989 Yes No Transcript Length ---
Exon 271 --- 2563785 Yes Yes Internal Event Inclusion
Exon 283 ITPA 3874249 Yes Yes Internal Event Exclusion
Exon 287 C12orf48 3428845 Yes Yes Internal Event Exclusion

91
Exon 290 LTB 2949118 Yes No Alt 5' Init More 5' start
Exon 291 KAT2A 3757630 Yes No Alt 5' Init More 5' start
U133 303 COPZ1 3416522 Yes No Tandem 3' UTR Shorten
Exon 309 LPAL2 2982630 Yes No Transcript Length ---
U133 317 ZMYM4 2329752 Yes No Tandem 3' UTR Shorten
Exon 327 --- 3850832 Yes No Alt 5' Init More 3' start
Exon 328 ZNHIT6 2420958 Yes No Alt 5' Init More 5' start
Exon 333 CTCF 3665603 Yes Yes Internal Event Inclusion
Exon 340 APBB2 2766893 Yes Yes Alt 5' Init More 5' start
U133 346 ETNK1 3408018 Yes No Tandem 3' UTR Shorten
U133 348 KLHDC5 3409364 Yes No Tandem 3' UTR Shorten
Exon 356 ABCC4 3521174 Yes Yes Alt 3' TE - Alt 3' SS More 3' TE
Exon 358 FAM160B2 3089140 Yes Yes Internal Event Exclusion
U133 367 PDXK 3923257 Yes No Tandem 3' UTR Shorten
Exon 375 MESDC2 3635456 Yes Yes Alt 3' TE – APA More 5' TE
Exon 381 ZNF613 3839955 Yes Yes Internal Event Exclusion
U133 397 CAST 2821194 Yes No Tandem 3' UTR Shorten
Exon 399 MARK3 3553690 Yes No Alt 5' Init More 5' start
Exon 400 GKAP1 3212189 Yes No Transcript Length ---
U133 401 TCF3 3845365 Yes No Tandem 3' UTR Shorten
U133 412 SRR 3706219 Yes No Tandem 3' UTR Shorten
Exon 421 PRKAR1A 3732885 Yes No Alt 5' Init More 5' start
U133 423 SMARCA4 3820921 Yes Yes Alt 3' TE – APA More 3' TE
U133 427 TPR 2448232 Yes No Transcript Length ---
Exon 434 RABGAP1L 2367963 Yes Yes Alt 3' TE - Alt 3' SS More 3' TE
Exon 444 ATMIN 3670668 Yes No Alt 5' Init More 5' start
U133 449 RAD50 2828564 No No Unclassified ---
Exon 455 SF1 3377044 Yes Yes Internal Event Inclusion
Exon 481 SMYD5 2488680 Yes No Alt 5' Init More 5' start
U133 488 RABL3 2691475 Yes No Tandem 3' UTR Shorten
Exon 490 STAG3 3015338 Yes Yes Internal Event Exclusion
Exon 493 PSMD12 3768103 Yes Yes Internal Event Exclusion
U133 493 RAB35 3474228 Yes No Tandem 3' UTR Shorten
Exon 496 OBFC2B 3417485 Yes No Internal Event (3' TE) Exclusion
Exon 498 H3F3B 3770944 Yes No Tandem 3' UTR Shorten
Exon 500 SLC25A45 3377569 Yes Yes Internal Event Inclusion
U133 503 MSI2 3728147 Yes Yes Alt 5' Init More 3' start
Exon 505 C19orf28 3846238 Yes Yes Internal Event Exclusion

92
U133 518 CUGBP2 3234760 No No Unclassified ---
U133 522 FBXO9 2910477 Yes No Tandem 3' UTR Shorten
Exon 537 ACD 3695786 Yes Yes Internal Event Exclusion
Exon 550 COL9A3 3892974 Yes No Transcript Length ---
Exon 556 DPEP2 3696142 Yes Yes Internal Event Exclusion
U133 568 GRK6 2843163 Yes No Tandem 3' UTR Shorten
Exon 572 GARNL4 3706439 No No Unclassified ---
U133 575 DENR 3435490 Yes No Tandem 3' UTR Shorten
Exon 578 KDM4B 3817733 Yes No Transcript Length ---
Exon 580 ZNF335 3907561 Yes Yes Internal Event Exclusion
Exon 593 SLFN13 3753568 Yes No Tandem 3' UTR Shorten
Exon 602 PRDM1 2919669 Yes Yes Internal Event Exclusion
U133 606 --- 3717052 Yes No Tandem 3' UTR Shorten
Exon 607 MSC 3140213 Yes No Alt 5' Init More 3' start
Exon 614 RAD54L 2334646 Yes Yes Internal Event Exclusion
Exon 616 HOMER2 3636391 Yes Yes Internal Event Inclusion
Exon 622 PKD2 2735221 Yes Yes Internal Event Exclusion
Exon 645 ELMO1 3046197 Yes Yes Alt 5' Init More 3' start
Exon 648 MRPL35 2492015 Yes No Alt 5' Init More 3' start
U133 664 OGT 3981120 Yes No Tandem 3' UTR Shorten
Exon 665 C2orf18 2473965 Yes No Transcript Length ---
Exon 667 ZFAT 3154700 Yes Yes Alt 3' TE – APA More 3' TE
U133 671 SYT11 2361154 Yes No Tandem 3' UTR Shorten
Exon 672 TNS1 2599153 Yes Yes Internal Event Inclusion
Exon 675 ACSF2 3726406 Yes Yes Internal Event Exclusion
Exon 678 RABEP2 3686750 No No Unclassified ---
Exon 679 STAP2 3846709 Yes Yes Internal Event Exclusion
Exon 692 BAI1 3119017 Yes Yes Internal Event Exclusion
Exon 713 C1orf85 2438093 Yes Yes Internal Event Exclusion
Exon 714 PIP5K1A 2358761 Yes No Alt 5' Init More 5' start
Exon 719 ENTPD5 3571667 No No Unclassified ---
Exon 731 ZEB2 2579572 Yes No Internal Event (3' TE) Inclusion
U133 766 OTUB1 3334137 Yes No Tandem 3' UTR Shorten
U133 787 USP48 2400718 Yes No Tandem 3' UTR Shorten
Exon 797 YES1 3795942 Yes Yes Internal Event Exclusion
Exon 806 SPNS1 3655172 Yes No Transcript Length ---
Exon 885 KIAA0513 3672059 Yes Yes Internal Event Exclusion
Exon 886 ZWINT 3290210 Yes Yes Internal Event Exclusion

93
Exon 899 IL10 2452948 Yes No Alt 5' Init More 3' start
Exon 907 HIST2H4A 2357891 Yes No Tandem 3' UTR Shorten
Exon 939 PDE2A 3381150 Yes No Alt 5' Init More 3' start
Exon 988 C11orf51 3380996 No No Unclassified ---
Exon 1019 CCDC48 2641449 No No Unclassified ---
Exon 1055 NBEA 3485292 Yes No Alt 5' Init More 5' start
Exon 1071 ALG13 3987446 Yes No Tandem 3' UTR Shorten
Exon 1238 SH3PXD2A 3304853 Yes No Transcript Length ---
Exon 1252 HIST2H4A 2434102 Yes Yes Alt 3' TE - Alt 3' SS More 5' TE
Exon 1256 MAP3K12 3456212 Yes No Alt 5' Init More 5' start
Exon 1263 METTL8 2586744 Yes No Transcript Length ---
Exon 1264 MAN1B1 3195174 No No Unclassified ---
Exon 1275 DNM2 3820758 No No Unclassified ---
Exon 1316 FAM63A 2434746 Yes No Transcript Length ---
Exon 1399 PCMTD1 3134922 No No Unclassified ---
Exon 1449 NSDHL 3995371 Yes Yes Internal Event Exclusion
Exon 1601 SNAP29 3937755 Yes No Transcript Length ---
Exon 1639 RBM8A 2356181 No No Unclassified ---
Exon 1672 RRAS2 3363868 Yes No Alt 5' Init More 5' start
Exon 1724 MRPS25 2664099 Yes No Tandem 3' UTR Shorten

94
Appendix D: SplicerEX Categorization Algorithm
We devised an algorithm to categorize SplicerEX predicted changes in alternative
mRNA processing into distinct mechanistic and directional categories. This algorithm
was created with two main goals 1) to provide biologically useful distinct categories and
2) to provide an algorithm that was as simple as possible to promote transparency of the
method.
Algorithm Input
To categorize AS events, the algorithm uses two sources of input for each gene 1)
the genomic coordinates of the two features used to generate the isoform ratio (chapter 2)
and 2) a database of all known UCSC gene transcript genomic coordinates. The two
features used to generate isoform ratios come from the single most significant
probesets/metaprobesets found in the A and B probeset groups. The program uses single
probesets as features for the U133 array and single metaprobesets for the HuEx array.
The UCSC known gene list has been developed and maintained by the University of
California, Santa Cruz, which also runs the UCSC genome browser (Kent et al. 2002).
The UCSC known gene list contains predictions based on data from RefSeq, Genbank,
CCDS and UniProt and contains about 10% more protein coding genes than RefSeq and
about twice as many splice variants.
Categorization Decision Tree
The categorizer works by stepping through a binary decision tree that asks
questions about the two probesets (or metaprobesets) and their overlap with known
UCSC genes (Figure 17). The categorizer sequentially asks a set of five questions. If the

95
answer to any of these questions is no, the program assigns a category and then
terminates. If no category has been assigned after these five questions, the common
transcript inference algorithm is used to assign a category.
Figure 17: Binary decision tree used to categorize alternative mRNA processing events into discrete categories.
The first question (panel A) asks whether both probesets interrogate any known
UCSC genes. Because we filter out probesets that do not meet this criteria, this first step
does not exclude any possible categories for our analysis. This step would, however,
allow others to run the program where such a filter was unavailable, such as on a novel
platform. In this case, events where either probeset did not interrogate a UCSC gene
would be unclassified.
The second question (panel B) asks if interrogated UCSC genes share any
common 5’ start location. This removes poorly annotated events in which probesets are
targeting unrelated transcripts that begin in two separate locations and for which no

96
overlapping transcript has ever been observed. Events that do not pass this criteria are
placed into the unclassified (no class) category.
The next question (panel C) asks if the probesets target a common 3’ TE. In this
case, we have evidence that the same 3’TE is undergoing different changes in abundance,
which is most commonly explained by changes in 3’UTR length. Changes in 3’TE
regional abundance can also be explained by two other events 1) inclusion/exclusion of
internal 3’TE content and 2) use of an alternative 3’ SS. The program checks for internal
inclusion/exclusion (described in common transcript inference). If an internal
inclusion/exclusion is ruled out, then the program assigns this category as “Tandem 3’
TE”. All events categorized in this step are assumed to result in non-coding changes (the
ORF is not altered), as they are typically limited to the 3’ UTR.
Step 4 (panel D) asks if each probeset interrogates a different 3’TE. In this case,
the suggestion is that a gene is undergoing mutually exclusive selection of which 3’ end
of the gene it will use. These events almost uniformly result in changes in transcript
ORF. All events identified in this step are categorized as affecting protein coding
regions.
The next question asks if both probesets interrogate any common UCSC known
transcript. If the answer is no, the event is unclassifiable and the program terminates. If
the answer is yes, the categorizer attempts categorization using only the common UCSC
transcript. In the case where there are multiple common UCSC transcripts interrogated,
these transcripts are combined into a single representative transcript that comprises only
common exons.

97
Common Transcript Inference (CTI)
Events placed in the common transcript inference (CTI) category are categorized
based on each probeset’s exon count and location within the common transcript. CTI
events can be categorized as internal events, alternative 5’ initiation, alternative transcript
length, or uncategorized (Table 9).
Table 9: Common transcript inference (CTI) categories
Category Criteria SubTypes Criteria Internal Event 1) probeset1: Contained internally
within probeset2 OR
2) probeset1: Single exon, internal probeset2: Multiple exons
Inclusion
Probeset1 is from Group A
Exclusion Probeset1 is from Group B
5’ Alt Initiation 1) Probeset1: Single 5’ located exon OR
2)Probesets 1 &2 each target 3 or more exons & do not overlap
More 5’
Group A probeset is more 5’
More 3’ Group A probeset is more 3’
Alt Transcript Length
1) Probeset 1 or 2 interrogates 3’ TE
N/A
Unclassified/ No class
Unable to be categorized using above
N/A
Of events not assigned hypotheses, only a handful of events had reasonably clear
hypotheses that could be assessed subjectively by the researchers. These additional
events could be accurately categorized by SplicerEX with additional modifications to the
categorization algorithm. However, it was felt that the increased additional complexity
required to categorize these few events was not worth the loss in transparency. These
modifications were not included in the final SplicerEX program.

98
Appendix E: Discovery of Dengue virus host factors in insects and humans
In 2009, Sessions et al. published the first genome wide siRNA screen for Dengue
virus host factors in Drosophila (Sessions et al. 2009). I performed the data analysis to
select hits from the first round of the screen, which required the development of a
nonparametric screen statistic to deal with data that violated assumptions of normality
and was subject to several sources of bias and noise.
Screen/Data Structure
The Dengue screen was performed in duplicate using 384 well plates. Each of the
384 wells had a unique dsRNA printed on it from the screening library. After 72 hours of
infection by Dengue, the percent of cells that had been infected and total cell counts
within each well were assayed in order to determine the effect of each dsRNA on
infectivity. The primary goal of the screen was to identify Dengue host factors, defined
by factors required by Dengue. Knockdown of a Dengue host factor in a well would be
expected to decrease infectivity in that well. The primary goal of the study was therefore
to identify wells with unusually low levels of infectivity as a result of dsRNA knockdown
of a required Dengue host factor.
Data Analysis
We observed that the infectivity rates within each plate were not normally
distributed and had highly variable infection rates from plate to plate and day to day. This
us to approach the data analysis using a nonparametric approach, which was similar in
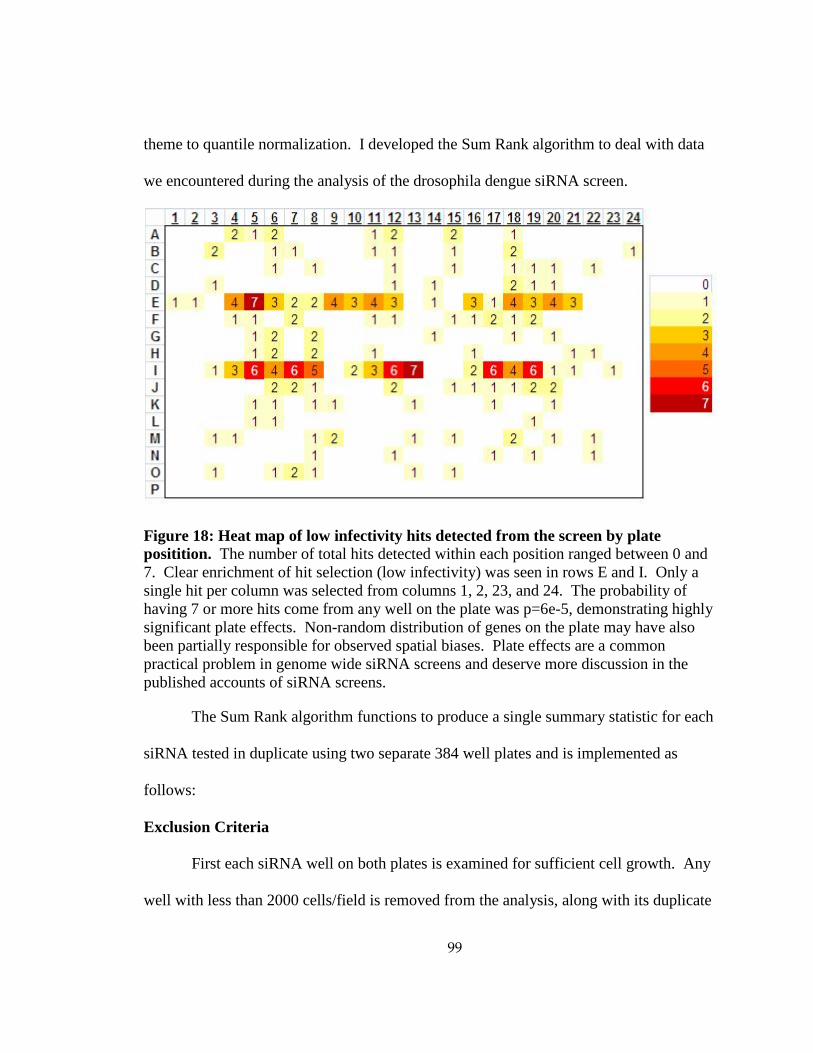
99
theme to quantile normalization. I developed the Sum Rank algorithm to deal with data
we encountered during the analysis of the drosophila dengue siRNA screen.
Figure 18: Heat map of low infectivity hits detected from the screen by plate positition. The number of total hits detected within each position ranged between 0 and 7. Clear enrichment of hit selection (low infectivity) was seen in rows E and I. Only a single hit per column was selected from columns 1, 2, 23, and 24. The probability of having 7 or more hits come from any well on the plate was p=6e-5, demonstrating highly significant plate effects. Non-random distribution of genes on the plate may have also been partially responsible for observed spatial biases. Plate effects are a common practical problem in genome wide siRNA screens and deserve more discussion in the published accounts of siRNA screens.
The Sum Rank algorithm functions to produce a single summary statistic for each
siRNA tested in duplicate using two separate 384 well plates and is implemented as
follows:
Exclusion Criteria
First each siRNA well on both plates is examined for sufficient cell growth. Any
well with less than 2000 cells/field is removed from the analysis, along with its duplicate

100
in the other plate. The 16 control wells are also removed prior to analysis. For each pair
of 384 well plates, up to 368 (= 384 – 16) wells are included in the analysis.
Sum Rank algorithm
Within each plate, wells are ranked by the percent of infected cells, with the least
infected well being given rank 1. For each siRNA, its rank from each plate is summed to
yield that well’s Sum Rank statistic.
Sum Rank = Rank on plate #1 + Rank on plate #2 [1]
For each pair of duplicate plates, we obtain a distribution of Sum Ranks. For an
experiment with no excluded wells (368), the Sum Ranks can potentially range from 2 to
734 (= 368 * 2). In generally the Sum Rank can range from 2 to (#Valid Wells * 2). In
order to assess the significance of observing a given Sum Rank, we calculated a null
distribution for the Sum Rank statistic.
All possible ranks are present on every plate. For example, every plate will
contain one well ranked #1, one well ranked #, etc on up to the # of valid wells. When
the ranks from a duplicate plate are added to this first plate, there is only one way that a
Sum Rank of 2 can be achieved. The #1 ranked well from plate must also be ranked #1
on the duplicate plate. Since there are 368 wells on this second plate, there is only 1/368
ways that a Sum Rank of 2 would be observed. On average, a Sum Rank of 2 would be
expected to be observed in 1/368 (= .0027) plate pairs. This is the expected number of
times we would observe a Sum Rank of 2 by chance alone. There are two possible ways
to achieve a Sum Rank of 3 (Ranked #1 on plate A and #2 on plate B, or #2 on plate A

101
and #1 on plate B). The resulting expectation is 2/368 ( = .0054). In this way, the
expectation of Sum Rank for the lowest infected wells is given by the following equation:
E[SR] = (SR - 1) / 368 [2]
For the highest infected wells, within a pair of plates with no excluded wells, the
distribution mirrors that of the low infected wells with the maximum Sum Rank being
least likely:
E[SR] = (734 - SR) / 368 [3]
These equations can be generalized to apply to all pair plates, regardless of the
number of valid wells:
Expectation of observing lowest Sum Ranks:
E[SR] = (SR - 1) / (# Valid Wells) [4]
Expectation of observing highest Sum Ranks:
E[SR] = ((#Valid Wells * 2) – (SR - 1)) / (# Valid Wells) [5]
I confirmed this theoretical distribution using computational simulations in R.
The key assumption of this null distribution is that ranks within a plate are randomly
distributed. This assumption can be invalid if there are local biases in infectivity within a
plate, for example if edges are infected more than center wells. Such affects are likely
present in our assay, and we therefore expect a slightly higher false discover rate than
would be predicted by theory alone. We have not yet assessed the magnitude or
implication of such spatial biases within duplicate plates. Such spatial biases would
affect any statistical analyses and not just the Sum Rank method.

102
Figure 19: Histogram of empirical and theoretical distributions of expected Sum Rank values. For each paired well in the screen, a Sum Rank statistic was calculated. Each Sum Rank’s expected frequency by random chance is shown on the horizontal axis, with uncommon extremes in low infectivity to the left and high infectivity to the right. The vertical axis indicates the frequency with which each expectation value was actually observed during the screen (A) and during a simulation of random infectivity (B). Sum Ranks expected to occur fewer than 0.065 times per paired duplicate plates are highlighted in blue and red, representing extremes of low and high infectivity, respectively. Wells from the Drosophila screen (A) yielded a significantly larger number of wells with extremes of low (χ2 = 62.8, p<.0001) and high (χ2 = 108, p<.0001) infectivity compared to that expected by wells assigned random infectivity (B), suggesting significant departures from random biological variation upon treatment of cells with dsRNAs. Using the random infectivity analysis to determine the false discovery rate suggests approximately 24% of detected “hits” (expectation less than 0.065) were due to random chance alone, in rough agreement with the validation rate of putative hits.

103
References
Affymetrix (2001) Microarray Suite User Guide, Version 5. Affymetrix, http://www.affymetrix.com/support/technical/manuals.affx.
Abdueva, D., M. R. Wing, et al. (2007). "Experimental comparison and evaluation of the
Affymetrix exon and U133Plus2 GeneChip arrays." PLoS One 2(9): e913. Adamson, E. D. and L. M. Wiley (1997). "The EGFR gene family in embryonic cell
activities." Curr Top Dev Biol 35: 71-120. Affymetrix (2005). "Alternative transcript analysis methods for exon
arrays. Affymetrix Whitepaper 2005 [http://www.affymetrix.com/sup port/technical/whitepapers.affx]."
Andre, F., S. Michiels, et al. (2009). "Exonic expression profiling of breast cancer and
benign lesions: a retrospective analysis." Lancet Oncol 10(4): 381-90. Barrett, T., D. B. Troup, et al. (2009). "NCBI GEO: archive for high-throughput
functional genomic data." Nucleic Acids Res 37(Database issue): D885-90. Bartel, D. P. (2009). "MicroRNAs: target recognition and regulatory functions." Cell
136(2): 215-33. Basu, A., M. Raghunath, et al. (1989). "Inhibition of tyrosine kinase activity of the
epidermal growth factor (EGF) receptor by a truncated receptor form that binds to EGF: role for interreceptor interaction in kinase regulation." Mol Cell Biol 9(2): 671-7.
Bemmo, A., D. Benovoy, et al. (2008). "Gene expression and isoform variation analysis
using Affymetrix Exon Arrays." BMC Genomics 9: 529. Bhasi, A., R. V. Pandey, et al. (2007). "EuSplice: a unified resource for the analysis of
splice signals and alternative splicing in eukaryotic genes." Bioinformatics 23(14): 1815-23.
Bild, A. H., G. Yao, et al. (2006). "Oncogenic pathway signatures in human cancers as a
guide to targeted therapies." Nature 439(7074): 353-7. Black, D. L. (2003). "Mechanisms of alternative pre-messenger RNA splicing." Annu
Rev Biochem 72: 291-336.

104
Blencowe, B. J. (2006). "Alternative splicing: new insights from global analyses." Cell 126(1): 37-47.
Bristow, R. G. and R. P. Hill (2008). "Hypoxia and metabolism. Hypoxia, DNA repair
and genetic instability." Nat Rev Cancer. 8(3): 180-92. Brown, T. J., J. M. Rowe, et al. (1991). "Regulation of IL-6 expression by oncostatin M."
J Immunol 147(7): 2175-80. Browne, B. C., N. O'Brien, et al. (2009). "HER-2 signaling and inhibition in breast
cancer." Curr Cancer Drug Targets 9(3): 419-38. Castrignano, T., M. D'Antonio, et al. (2008). "ASPicDB: a database resource for
alternative splicing analysis." Bioinformatics 24(10): 1300-4. Chandler, L. A. and S. Bourgeois (1991). "Posttranscriptional down-regulation of
fibronectin in N-ras-transformed cells." Cell Growth Differ 2(8): 379-84. Chandler, L. A., C. P. Ehretsmann, et al. (1994). "A novel mechanism of Ha-ras
oncogene action: regulation of fibronectin mRNA levels by a nuclear posttranscriptional event." Mol Cell Biol 14(5): 3085-93.
Chen, J. L., J. E. Lucas, et al. (2008). "The genomic analysis of lactic acidosis and
acidosis response in human cancers." PLoS Genet 4(12): e1000293. Cheung, H. C., K. A. Baggerly, et al. (2008). "Global analysis of aberrant pre-mRNA
splicing in glioblastoma using exon expression arrays." BMC Genomics 9: 216. Clark, T. A., A. C. Schweitzer, et al. (2007). "Discovery of tissue-specific exons using
comprehensive human exon microarrays." Genome Biol 8(4): R64. Cline, M. S., J. Blume, et al. (2005). "ANOSVA: a statistical method for detecting splice
variation from expression data." Bioinformatics 21 Suppl 1: i107-15. Cooper, T. A., L. Wan, et al. (2009). "RNA and disease." Cell 136(4): 777-93. Darville, M. I. and G. G. Rousseau (1997). "E2F-dependent mitogenic stimulation of the
splicing of transcripts from an S phase-regulated gene." Nucleic Acids Res 25(14): 2759-65.
de la Grange, P., M. Dutertre, et al. (2007). "A new advance in alternative splicing
databases: from catalogue to detailed analysis of regulation of expression and function of human alternative splicing variants." BMC Bioinformatics 8: 180.

105
de la Grange, P., M. Dutertre, et al. (2005). "FAST DB: a website resource for the study
of the expression regulation of human gene products." Nucleic Acids Res 33(13): 4276-84.
Dewhirst, M. W. (2009). "Relationships between cycling hypoxia, HIF-1, angiogenesis
and oxidative stress." Radiat Res. 172(6): 653-65. Dewhirst, M. W., Y. Cao, et al. (2008). "Cycling hypoxia and free radicals regulate
angiogenesis and radiotherapy response." Nat Rev Cancer. 8(6): 425-37. Dutertre, M., M. Lacroix-Triki, et al. (2010). "Exon-based clustering of murine breast
tumor transcriptomes reveals alternative exons whose expression is associated with metastasis." Cancer Res 70(3): 896-905.
Ehashi, T., T. Koyama, et al. (2007). "Effects of oncostatin M on secretion of vascular
endothelial growth factor and reconstruction of liver-like structure by fetal liver cells in monolayer and three-dimensional cultures." J Biomed Mater Res A 82(1): 73-9.
Fan, W., N. Khalid, et al. (2006). "A statistical method for predicting splice variants
between two groups of samples using GeneChip expression array data." Theor Biol Med Model 3: 19.
Ferrari, F., S. Bortoluzzi, et al. (2007). "Novel definition files for human GeneChips
based on GeneAnnot." BMC Bioinformatics 8: 446. Fodor, S. P., R. P. Rava, et al. (1993). "Multiplexed biochemical assays with biological
chips." Nature 364(6437): 555-6. Foissac, S. and M. Sammeth (2007). "ASTALAVISTA: dynamic and flexible analysis of
alternative splicing events in custom gene datasets." Nucleic Acids Res 35(Web Server issue): W297-9.
Friedman, R. C., K. K. Farh, et al. (2009). "Most mammalian mRNAs are conserved
targets of microRNAs." Genome Res 19(1): 92-105. Garcia-Blanco, M. A., A. P. Baraniak, et al. (2004). "Alternative splicing in disease and
therapy." Nat Biotechnol 22(5): 535-46. Gardina, P. J., T. A. Clark, et al. (2006). "Alternative splicing and differential gene
expression in colon cancer detected by a whole genome exon array." BMC Genomics 7: 325.

106
Gatenby, R. A. and R. J. Gilles (2004). "Why do cancers have high aerobic glycolysis?"
Nat Rev Cancer. 4(11): 891-9. Grove, R. I., C. Eberhardt, et al. (1993). "Oncostatin M is a mitogen for rabbit vascular
smooth muscle cells." Proc Natl Acad Sci U S A 90(3): 823-7. He, C., F. Zhou, et al. (2009). "A global view of cancer-specific transcript variants by
subtractive transcriptome-wide analysis." PLoS ONE 4(3): e4732. Holzer, R. G., R. E. Ryan, et al. (2004). "Oncostatin M stimulates the detachment of a
reservoir of invasive mammary carcinoma cells: role of cyclooxygenase-2." Clin Exp Metastasis 21(2): 167-76.
Horn, D., W. C. Fitzpatrick, et al. (1990). "Regulation of cell growth by recombinant
oncostatin M." Growth Factors 2(2-3): 157-65. Hu, G. K., S. J. Madore, et al. (2001). "Predicting splice variant from DNA chip
expression data." Genome Res 11(7): 1237-45. Irizarry, R. A., B. Hobbs, et al. (2003). "Exploration, normalization, and summaries of
high density oligonucleotide array probe level data." Biostatistics 4(2): 249-64. Jaksik, R., J. Polanska, et al. (2009). "Calculation of reliable transcript levels of annotated
genes on the basis of multiple probe-sets in Affymetrix microarrays." Acta Biochim Pol.
Johannsen, E., M. Luftig, et al. (2004). "Proteins of purified Epstein-Barr virus." Proc
Natl Acad Sci U S A 101(46): 16286-91. Jorcyk, C. L., R. G. Holzer, et al. (2006). "Oncostatin M induces cell detachment and
enhances the metastatic capacity of T-47D human breast carcinoma cells." Cytokine 33(6): 323-36.
Kan, Z., E. C. Rouchka, et al. (2001). "Gene structure prediction and alternative splicing
analysis using genomically aligned ESTs." Genome Res 11(5): 889-900. Kashles, O., Y. Yarden, et al. (1991). "A dominant negative mutation suppresses the
function of normal epidermal growth factor receptors by heterodimerization." Mol Cell Biol 11(3): 1454-63.
Kent, W. J., C. W. Sugnet, et al. (2002). "The human genome browser at UCSC."
Genome Res 12(6): 996-1006.

107
Kim, N., A. V. Alekseyenko, et al. (2007). "The ASAP II database: analysis and
comparative genomics of alternative splicing in 15 animal species." Nucleic Acids Res 35(Database issue): D93-8.
Koscielny, G., V. Le Texier, et al. (2009). "ASTD: The Alternative Splicing and
Transcript Diversity database." Genomics 93(3): 213-20. Krawczak, M., J. Reiss, et al. (1992). "The mutational spectrum of single base-pair
substitutions in mRNA splice junctions of human genes: causes and consequences." Hum Genet 90(1-2): 41-54.
Laajala, E., T. Aittokallio, et al. (2009). "Probe-level estimation improves the detection of
differential splicing in Affymetrix exon array studies." Genome Biol 10(7): R77. Lee, C., L. Atanelov, et al. (2003). "ASAP: the Alternative Splicing Annotation Project."
Nucleic Acids Res 31(1): 101-5. Li, C., M. Kato, et al. (2006). "Cell type and culture condition-dependent alternative
splicing in human breast cancer cells revealed by splicing-sensitive microarrays." Cancer Res 66(4): 1990-9.
Li, C. and W. H. Wong (2001). "Model-based analysis of oligonucleotide arrays:
expression index computation and outlier detection." Proc Natl Acad Sci U S A 98(1): 31-6.
Loi, S., B. Haibe-Kains, et al. (2008). "Predicting prognosis using molecular profiling in
estrogen receptor-positive breast cancer treated with tamoxifen." BMC Genomics 9: 239.
Lopez-Bigas, N., B. Audit, et al. (2005). "Are splicing mutations the most frequent cause
of hereditary disease?" FEBS Lett 579(9): 1900-3. Lu, J., J. C. Lee, et al. (2007). "Transcript-based redefinition of grouped oligonucleotide
probe sets using AceView: high-resolution annotation for microarrays." BMC Bioinformatics 8: 108.
Miles, S. A., O. Martinez-Maza, et al. (1992). "Oncostatin M as a potent mitogen for
AIDS-Kaposi's sarcoma-derived cells." Science 255(5050): 1432-4. Miller, L. D., J. Smeds, et al. (2005). "An expression signature for p53 status in human
breast cancer predicts mutation status, transcriptional effects, and patient survival." Proc Natl Acad Sci U S A 102(38): 13550-5.

108
Mirshahi, F., M. Vasse, et al. (2002). "Oncostatin M induces procoagulant activity in
human vascular smooth muscle cells by modulating the balance between tissue factor and tissue factor pathway inhibitor." Blood Coagul Fibrinolysis 13(5): 449-55.
Nair, B. C., A. L. DeVico, et al. (1992). "Identification of a major growth factor for
AIDS-Kaposi's sarcoma cells as oncostatin M." Science 255(5050): 1430-2. Nakamura, K., H. Nonaka, et al. (2004). "Hepatocyte proliferation and tissue remodeling
is impaired after liver injury in oncostatin M receptor knockout mice." Hepatology 39(3): 635-44.
Neel, H., P. Gondran, et al. (1995). "Regulation of pre-mRNA processing by src." Curr
Biol 5(4): 413-22. Ng, G., D. Winder, et al. (2007). "Gain and overexpression of the oncostatin M receptor
occur frequently in cervical squamous cell carcinoma and are associated with adverse clinical outcome." J Pathol 212(3): 325-34.
Pawitan, Y., J. Bjohle, et al. (2005). "Gene expression profiling spares early breast cancer
patients from adjuvant therapy: derived and validated in two population-based cohorts." Breast Cancer Res 7(6): R953-64.
Pearson, J. L., T. J. Robinson, et al. (2008). "Identification of the cellular targets of the
transcription factor TCERG1 reveals a prevalent role in mRNA processing." J Biol Chem 283(12): 7949-61.
Pickrell, J. K., J. C. Marioni, et al. "Understanding mechanisms underlying human gene
expression variation with RNA sequencing." Nature. Pollack, V., R. Sarkozi, et al. (2007). "Oncostatin M-induced effects on EMT in human
proximal tubular cells: differential role of ERK signaling." Am J Physiol Renal Physiol 293(5): F1714-26.
Queen, M. M., R. E. Ryan, et al. (2005). "Breast cancer cells stimulate neutrophils to
produce oncostatin M: potential implications for tumor progression." Cancer Res 65(19): 8896-904.
Rega, G., C. Kaun, et al. (2007). "Vascular endothelial growth factor is induced by the
inflammatory cytokines interleukin-6 and oncostatin m in human adipose tissue in vitro and in murine adipose tissue in vivo." Arterioscler Thromb Vasc Biol 27(7): 1587-95.

109
Reiter, J. L., D. W. Threadgill, et al. (2001). "Comparative genomic sequence analysis
and isolation of human and mouse alternative EGFR transcripts encoding truncated receptor isoforms." Genomics 71(1): 1-20.
Repovic, P., C. Y. Fears, et al. (2003). "Oncostatin-M induction of vascular endothelial
growth factor expression in astroglioma cells." Oncogene 22(50): 8117-24. Robinson, M. D. and T. P. Speed (2007). "A comparison of Affymetrix gene expression
arrays." BMC Bioinformatics 8: 449. Robinson, T. J., M. A. Dinan, et al. (2010). "SplicerAV: A tool for mining microarray
expression data for changes in RNA processing." BMC Bioinformatics 11(1): 108.
Sandberg, R., J. R. Neilson, et al. (2008). "Proliferating cells express mRNAs with
shortened 3' untranslated regions and fewer microRNA target sites." Science 320(5883): 1643-7.
Sessions, O. M., N. J. Barrows, et al. (2009). "Discovery of insect and human dengue
virus host factors." Nature 458(7241): 1047-50. Sotiriou, C. and L. Pusztai (2009). "Gene-expression signatures in breast cancer." N Engl
J Med 360(8): 790-800. Srinivasan, K., L. Shiue, et al. (2005). "Detection and measurement of alternative splicing
using splicing-sensitive microarrays." Methods 37(4): 345-59. Suzuki, Y., K. Yoshitomo-Nakagawa, et al. (1997). "Construction and characterization of
a full length-enriched and a 5'-end-enriched cDNA library." Gene 200(1-2): 149-56.
Takeda, J., Y. Suzuki, et al. (2006). "Large-scale identification and characterization of
alternative splicing variants of human gene transcripts using 56,419 completely sequenced and manually annotated full-length cDNAs." Nucleic Acids Res 34(14): 3917-28.
Tanaka, M., Y. Hirabayashi, et al. (2003). "Targeted disruption of oncostatin M receptor
results in altered hematopoiesis." Blood 102(9): 3154-62. Thomas, P. D., M. J. Campbell, et al. (2003). "PANTHER: a library of protein families
and subfamilies indexed by function." Genome Res 13(9): 2129-41.

110
Thomas, P. D., A. Kejariwal, et al. (2006). "Applications for protein sequence-function evolution data: mRNA/protein expression analysis and coding SNP scoring tools." Nucleic Acids Res 34(Web Server issue): W645-50.
Thorsen, K., K. D. Sorensen, et al. (2008). "Alternative splicing in colon, bladder, and
prostate cancer identified by exon array analysis." Mol Cell Proteomics 7(7): 1214-24.
Ullrich, A., L. Coussens, et al. (1984). "Human epidermal growth factor receptor cDNA
sequence and aberrant expression of the amplified gene in A431 epidermoid carcinoma cells." Nature 309(5967): 418-25.
Vasse, M., J. Pourtau, et al. (1999). "Oncostatin M induces angiogenesis in vitro and in
vivo." Arterioscler Thromb Vasc Biol 19(8): 1835-42. Venables, J. P. (2006). "Unbalanced alternative splicing and its significance in cancer."
Bioessays 28(4): 378-86. Venables, J. P., R. Klinck, et al. (2009). "Cancer-associated regulation of alternative
splicing." Nat Struct Mol Biol 16(6): 670-6. Wan, J., P. Sazani, et al. (2009). "Modification of HER2 pre-mRNA alternative splicing
and its effects on breast cancer cells." Int J Cancer 124(4): 772-7. Wang, E. T., R. Sandberg, et al. (2008). "Alternative isoform regulation in human tissue
transcriptomes." Nature 456(7221): 470-6. Wang, H., E. Hubbell, et al. (2003). "Gene structure-based splice variant deconvolution
using a microarray platform." Bioinformatics 19 Suppl 1: i315-22. Warren, P., D. Taylor, et al. (2007). "PANP - a New Method of Gene Detection on Oligonucleotide Expression Arrays." Proc. 2007 IEEE 7th International
Symposium on BioInformatics & BioEngineering,Cambridge, USA, 2007, pp.108-115.
Weiss, G. J., L. T. Bemis, et al. (2008). "EGFR regulation by microRNA in lung cancer:
correlation with clinical response and survival to gefitinib and EGFR expression in cell lines." Ann Oncol 19(6): 1053-9.
Weiss, T. W., W. S. Speidl, et al. (2003). "Glycoprotein 130 ligand oncostatin-M induces
expression of vascular endothelial growth factor in human adult cardiac myocytes." Cardiovasc Res 59(3): 628-38.

111
Xi, L., A. Feber, et al. (2008). "Whole genome exon arrays identify differential expression of alternatively spliced, cancer-related genes in lung cancer." Nucleic Acids Res 36(20): 6535-47.
Xing, Y., P. Stoilov, et al. (2008). "MADS: a new and improved method for analysis of
differential alternative splicing by exon-tiling microarrays." Rna 14(8): 1470-9. Xu, Q. and C. Lee (2003). "Discovery of novel splice forms and functional analysis of
cancer-specific alternative splicing in human expressed sequences." Nucleic Acids Res 31(19): 5635-43.
Yao, H., L. Xu, et al. (2009). "Structure-function correlation of human programmed cell
death 5 protein." Arch Biochem Biophys 486(2): 141-9. Yu, H., F. Wang, et al. (2007). "Transcript-level annotation of Affymetrix probesets
improves the interpretation of gene expression data." BMC Bioinformatics 8: 194. Zarling, J. M., M. Shoyab, et al. (1986). "Oncostatin M: a growth regulator produced by
differentiated histiocytic lymphoma cells." Proc Natl Acad Sci U S A 83(24): 9739-43.
Zhang, C., H. R. Li, et al. (2006). "Profiling alternatively spliced mRNA isoforms for
prostate cancer classification." BMC Bioinformatics 7: 202. Zheng, C. L., Y. S. Kwon, et al. (2005). "MAASE: an alternative splicing database
designed for supporting splicing microarray applications." Rna 11(12): 1767-76. Zhu, L., Y. Zhang, et al. (2009). "Patterns of exon-intron architecture variation of genes
in eukaryotic genomes." BMC Genomics 10: 47.

112
Biography
Timothy John Robinson was born on October 11, 1981 in Chesapeake, Virginia.
Tim attended Engineering School at the University of Virginia as a Rodman Scholar. He
graduated with a Bachelor’s of Science in Engineering Sciences with an emphasis and
minor in Biomedical Engineering in 2003. During his time at UVA, Tim worked in a
computational neurosurgery laboratory under Dr. William Levy studying computational
simulations of action potential dynamics and spent his summers working at NASA
Langley studying atmospheric sciences. In the fall of 2003, Tim began medical school at
Duke University as part of the Medical Scientist Training (MD/PhD) Program. In 2005,
Tim began his PhD studies in Molecular Cancer Biology where he joined the laboratories
of both Dr. Mariano Garcia-Blanco and Dr. Mark Dewhirst. During his tenure at Duke,
Tim presented his research at the 2009 Annual MSTP Symposium. Tim was also the
recipient of a Pre-doctoral Department of Defense Breast Cancer Research grant. From
2006-2007 Tim was a voting member of the Duke University Institutional Review Board
where he currently remains an alternate member. Tim currently resides in Durham and
will be returning to Duke Medical School to finish his MD.

113
List of Publications:
1. Robinson TJ, Dinan MA, Dewhirst M, Garcia-Blanco MA, and Pearson JL. SplicerAV: A tool for mining microarray expression data for changes in RNA processing. BMC Bioinformatics. 2010 Feb 25;11(1) 2. Robinson TJ, Forte, E, Lutig, M, Garcia-Blanco MA. Conventional Affymetrix U133 Arrays Provide Superior Detection of 3’ Located Differential mRNA Processing Compared to Human Exon Arrays. In preparation. 3. Miller HB, Robinson TJ, Gordan R, Hartemink AJ, Garcia-Blanco MA. Identification of Tat-SF1 cellular targets by exon array analysis reveals widespread roles in alternative exon choice. Submitted to RNA. 4. Sessions OM, Barrows NJ, Souza-Neto JA, Robinson TJ, Hershey CL, Rodgers MA, Ramirez JL, Dimopoulos G, Yang PL, Pearson JL, Garcia-Blanco MA. Discovery of insect and human dengue virus host factors. Nature. 2009 Apr 23;458(7241):1047-50. 5. Pearson JL, Robinson TJ, Muñoz MJ, Kornblihtt AR, Garcia-Blanco MA. Identification of the cellular targets of the transcription factor TCERG1 reveals a prevalent role in mRNA processing. J Biol Chem. 2008 Mar 21;283(12):7949-61.