Embed Size (px)
Citation preview

Detecting Change in Soil Erosion in 8-Digit Hydrologic Units in Iowa: Correlation Between Level of Soil Erosion and Active Conservation Practices from 1992-1997 Adel M. Gilroy Department of Resource Analysis, Saint Mary’s University of Minnesota, Winona, MN 55987 Keywords: Conservation Reserve Program (CRP), Natural Resource Conservation Service (NRCS), riparian multi-species buffer, soil erosion Abstract One of the biggest problems in the farming industry is erosion on farmland from water and the transport of sediment into watersheds. This study compared the level of soil erosion by water on farmland of eight-digit hydrologic units between the years of 1992-1997, and whether or not the presence of acreage enrolled in the Conservation Reserve Program (CRP) affected soil loss levels within the study area. The Conservation Reserve Program is a program provided by the Natural Resources Conservation Service, administered by the United States Department of Agriculture, to install conservation practices and assist private landowners with sustaining their land. A geographic information system (GIS) analysis using CRP and NRCS data, along with county, elevation and agricultural data, was conducted to determine factors contributing to differences in soil erosion levels for the state of Iowa from 1992-1997. For further analysis, two sections of various counties were chosen: one encompassed by an eight-digit hydrologic unit that showed a high level of erosion, and secondly, by a unit with a low erosion level. Introduction Iowa has a soil erosion loss average of six tons per acre per year (Trees Forever, 2001). The ground used for cropland is more susceptible to erosion due to farming practices such as plowing that disturb the top layer of the soil. “Annual cultivation has reduced soil quality, lower[ed] rates of infiltration and increase[ed] surface runoff” (Isenhart et al, 1997). The natural occurrence of rainfall to this land rushes the water off of the land into the adjacent waterway, transporting soil and chemicals from fertilizers into the water. This study focuses on sheet and rill erosion, (shown in
Figure 3) which is defined as the “removal of soil by runoff water of a fairly uniform, usually imperceptible, thin layer of soil” (Resource Assessment Division, 2000). This is often accompanied by formation of many small eroding channels. Over 80 percent of the rain and snow that falls on the contiguous United States falls on private lands before making its way into public streams, lakes, and rivers (USDA, 1999). To help conserve this land and improve water quality, the Natural Resources Conservation Service (NRCS) started various farmland protection programs such as the Conservation Reserve Program (CRP).
___________________________________________________________________________ Gilroy, Adel. 2006. Detecting Change in Soil Erosion in 8-Digit Hydrologic Units in Iowa: Correlation Between Level of Soil Erosion and Active Conservation Practices from 1992-1997. Volume 8, Papers in Resource Analysis. 10 pp. Saint Mary’s University of Minnesota Central Services Press. Winona, MN. Retrieved [date] from http://www.gis.smumn.edu/
1

This program provides technical assistance to landowners, resulting in the implementation and maintenance of specific conservation practices and improvement of the welfare of natural and wildlife habitat on their land.
One such practice is a riparian multi-species buffer. Planted at creek edge, these buffers consist of sections of native grasses, shrubs, and trees that help filter out nitrates and control sedimentation, thereby improving bank stabilization and water quality. These buffers, as seen in Figure 1a and 1b, have proven to decrease sedimentation, slow runoff, and enhance water infiltration (Trees Forever, 2001). They also can cut erosion by 30 percent on highly erodible lands - those with steep drainage ways (NRCS, 2000).
Figure 1a. Before: a stream section in the Bear Creek watershed located in Iowa, shown with severe bank instability and vegetative degradation (NRCS, USDA, Iowa, 2002).
Figure 1b. After: the same stream section shown with implemented riparian buffers.
There are three key zones involved in a multi-species riparian buffer system. Zone 1 consists of a 4.5 meter-wide strip of “undisturbed, existing or planted, forest whose major function is to maintain bank stability.” Zone 2 uses an 18 meter-wide strip of managed forest where the main job is to seize nutrients from the soil. Zone 3 contains a 6 meter-wide strip of grass that intercepts surface runoff (USEPA, Office of Water, 1996).
This study seeks to detect the change in soil erosion by water in the state of Iowa in all respective eight-digit hydrologic units between the years of 1992-1997, and to examine the factors that may have caused any decrease or increase in soil erosion levels.
Specific goals include: 1) find the change within the five-year period of soil erosion by water for the state of Iowa within the eight-digit hydrologic units 2) compare areas where soil erosion by water became worse and those that improved from 1992-1997 (either 1-3, 3.001-5, or 5.001-10 tons/acre/year) 3) utilize Iowa county data to find significant agricultural or topographical factors that may affect the difference in soil erosion in the two areas.
Study Area The primary study area includes all eight-digit hydrologic units in the state of Iowa. The second part of the study involves two study areas, consisting of two hydrologic units (nine counties total). The eight-digit hydrologic unit encompasses O’Brien, Plymouth, Sioux, Franklin, Hamilton, Hancock, Hardin, Marshall, and Wright counties. The location of these counties can be seen in Figure 2. Methods Data Collection
2

O ' B r i e n P l y m o u t h S i o u x
F r a n k l i n H a m i l t o n H a n c o c k H a r d i n M a r s h a l l W r i g h t
Figure 2. Locator map of study area.
Figure 3. Photograph of erosion runoff from a waterway in Iowa. Soil erosion characteristics were determined with eight-digit hydrologic unit areas downloaded from the Resource Assessment Division of the Natural Resources Conservation Service, which is the National Resources Inventory. Only data pertinent to soil loss by water were taken into consideration. The Iowa state and county data were derived from the National Resources Inventory (NRI). Using TIGER/Line files, seamless data were extracted and ultimately utilized as an independent data set for the state of Iowa. Elevation data were downloaded from the Iowa Geological Survey. The photographs were supplied by Lynn Betts, NRCS Iowa State Conservationist and Public Affairs Specialist, and the NRCS photo website. All Conservation Reserve Program tabular data were derived from Conservation Reserve Program Reports for State and County of Iowa; supplied by the Farm Service Agency. Values for farmland use in each county in the study were derived from
publications on Agricultural Data for Decision Makers, gathered from the Iowa State University website. Software/Extension The project was completed using the ArcView 3.2 software program developed by the Environmental Systems Research Institute (ESRI). Extensions and programs used for this analysis included the Projection Utility Wizard, X-Tools, Import 71, Microsoft Excel, and an Avenue script to calculate acreage and area (m2). ArcCatalog was also used to verify metadata. Analysis The ASCII data files from the NRI website (Soil Erosion by Water on cropland in 1992 and 1997) were downloaded, unzipped, imported, and pasted into Excel. The final table from these files was imported into ArcView. The hydrologic units were encoded with an eight-digit number that indicates the hydrologic region (first two digits), hydrologic sub-region (second two digits), basin unit (third two digits), and sub-basin unit (fourth two digits). Shapefiles were created from this table.
A query was performed on the table to delineate only those hydrologic units of Iowa. The query entailed selecting from the entire set of the eight-digit hydrologic units of the contiguous United States, those with the first two digits of 07 or 19, as those first two digits encompass the state of Iowa. A new field was calculated as a string and added with the eight-digit codes mentioned above.
The parameters chosen for Soil Erosion Loss by Water: Category 1 = 1-3 tons/acre/year, Category 2 = 3.001-5 tons/acre/year, and Category 3 = 5.001-10 tons/acre/year. A field was created for each year (1992 & 1997) that included the eight-
3

digit hydrologic units and the tons/acre/year of soil erosion by water. The cells were formatted to comma-delimited text as a number with three decimal places and saved as a DBFIV table.
To show differences in soil erosion, the areas for each polygon needed to be converted into acreage. The table showed the area of the hydrologic unit from each year. A new field was created as a string in order to convert the area (m^2) into acreage. The values listed in the tables are averages of the number of acres. Since 1m^2 = 0.000247 acres, using the table calculator, the new field could now show acres. Acre=Area*0.00247.
The tables were linked in ArcView, and multiple queries were performed to analyze the change in soil loss. The map units of each view were set to meters. A shapefile was created of eight-digit hydrologic units of Iowa and saved in a view in ArcView.
After clipping respective study areas from nationwide shapefiles of hydrologic units and importing county data into ArcView, area and acreage were recalculated to update the spatial information of the new polygons. The view.calculateAcreage script was used to update area, perimeter and acres fields after clipping out the state of Iowa from the entire hydrologic unit coverage.
County data were successfully imported into ArcView and utilizing X-tools, the county data of Iowa were clipped and then laid over the hydrologic units. Hydrologic units that decreased, increased, or had no significant change in soil erosion by water within the five-year period were analyzed and affected counties were cut from the Iowa county shapefile. The affected counties possessed acreages composed of more than 5% of the total acreage of the hydrologic unit that encompassed it. These counties were
evaluated to show contributing factors to any increase or decrease in soil erosion per hydrologic unit.
Elevation data were downloaded, unzipped and added to ArcView as polygons. These data represented the land surface of Iowa in 100-foot intervals, and showed a significant difference in the landscape of the two study areas. Results and Discussion
The change in the rate of soil loss from 1992 to 1997 is shown in Figure 4. Table 1 shows the type of category associated with the specific parameters set in the beginning of the analysis, Category 1, 2, and 3. Data were organized into the following parameters: those units that had soil erosion loss by water between 1-3 tons per acre per year, 3.001-5 tons per acre per year, and 5.001-10 tons per acre per year. A significant change can be seen in the south central region of the state where nine hydrologic units moved from a Category 3 (5.001-10 tons/acre/year) to a Category 2 (3.001-5 tons/acre/year). The amount of soil lost by water decreased. Additional hydrologic units decreased in soil erosion over the five-year time period in the north central part of the state. Their values moved from the parameters of a Category 2 (3.001-5 tons/acre/year) to a Category 1 (1-3 tons/acre/year). Table 1. Categories of soil loss by water in eight-digit hydrologic units in Iowa, 2.9 tons/acre/year being the national erosion rate average in 1992.
Category 1 2 3 Tons/Acre/Yr 1-3 3.01-5 5.01-10
Figure 5 shows those eight-digit
hydrologic units whose values over the five-year time period have made a significant change, placing them into a different category.
4

1992
1.001 - 33.001 - 55.001 - 10
tons/acre/yr
1997
Figure 4. Soil erosion by water (tons/acre/year) per eight-digit hydrologic unit within the state of Iowa from 1992 to 1997. The hydrologic unit that had an increase in soil erosion and moved from a Category 2 to Category 3 is shown as red. The hydrologic units that decreased in the rate of soil loss and moved from a Category 3 to a Category 2 are shown as pink, and those units that moved from a Category of 2 to a Category 1 are shown as white. The averaged values that changed over the course of five years were significant enough to move these hydrologic units from one set of parameters to another. The gray area represents no substantial change in soil loss within the hydrologic unit.
Hydrologic Units that Changed in Category
IowaIA Hydro UnitCategory 2-3Category 3-2Category 2-1
Figure 5. Eight-digit hydrologic units in Iowa categorized by loss of soil erosion by water from 1992 to 1997.
In Figure 6, three hydrologic units were isolated outside the state of Iowa to show those hydrologic units with an increase, decrease, and no significant change in soil erosion by water over the five-year period.
For this particular study, two hydrologic units were chosen: one that increased in soil erosion (10230002 – the polygon isolated and set to the left of Iowa) and one that had lower soil erosion levels by water over the five-year period (07080207 – set apart to the far right of Iowa). Soil erosion levels in 1992 are shown as red bars, whereas soil erosion levels in 1997 are shown as blue.
Figure 6. Bar charts on each 8-digit hydrologic unit in Iowa, showing soil erosion by water in 1992 and in 1997. Hydrologic unit 07080207 had a decrease in soil erosion over the five-year
5
period. The change in the average acreage of this hydrologic unit is significant enough to move the unit from a Category 2 soil erosion loss by water, (3.001-5 tons/acre/year) to a Category 1 (1-3 tons/acre/year) as supported by results found in Table 2. Eight-digit hydrologic unit 10230002 increased in soil loss; values over the five-year period moved the unit from a Category 2 (3.001-5 tons/acre/year) to a Category 3 (5.001-10 tons/acre/year).
Table 2. Two eight-digit hydrologic units in Iowa displaying the change in soil erosion by water from 1992 to 1997.
8-Digit HU Total Acres
SEW 92
SEW 97
Cat 92
Cat 97
07080207 916022 3.500 2.921 2 1 10230002 570941 4.732 5.382 2 3
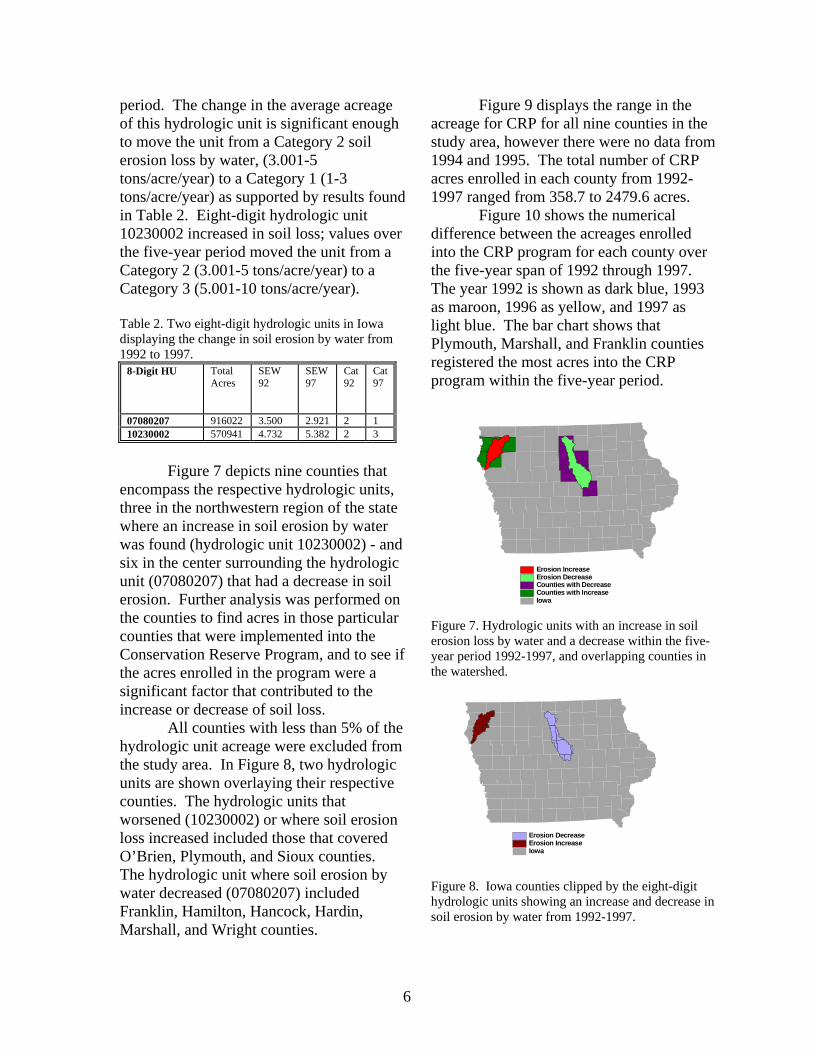
Figure 7 depicts nine counties that
encompass the respective hydrologic units, three in the northwestern region of the state where an increase in soil erosion by water was found (hydrologic unit 10230002) - and six in the center surrounding the hydrologic unit (07080207) that had a decrease in soil erosion. Further analysis was performed on the counties to find acres in those particular counties that were implemented into the Conservation Reserve Program, and to see if the acres enrolled in the program were a significant factor that contributed to the increase or decrease of soil loss.
All counties with less than 5% of the hydrologic unit acreage were excluded from the study area. In Figure 8, two hydrologic units are shown overlaying their respective counties. The hydrologic units that worsened (10230002) or where soil erosion loss increased included those that covered O’Brien, Plymouth, and Sioux counties. The hydrologic unit where soil erosion by water decreased (07080207) included Franklin, Hamilton, Hancock, Hardin, Marshall, and Wright counties.
Figure 9 displays the range in the acreage for CRP for all nine counties in the study area, however there were no data from 1994 and 1995. The total number of CRP acres enrolled in each county from 1992-1997 ranged from 358.7 to 2479.6 acres.
Figure 10 shows the numerical difference between the acreages enrolled into the CRP program for each county over the five-year span of 1992 through 1997. The year 1992 is shown as dark blue, 1993 as maroon, 1996 as yellow, and 1997 as light blue. The bar chart shows that Plymouth, Marshall, and Franklin counties registered the most acres into the CRP program within the five-year period.
IowaCounties with IncreaseCounties with DecreaseErosion DecreaseErosion Increase
Figure 7. Hydrologic units with an increase in soil erosion loss by water and a decrease within the five-year period 1992-1997, and overlapping counties in the watershed.
IowaErosion IncreaseErosion Decrease
Figure 8. Iowa counties clipped by the eight-digit hydrologic units showing an increase and decrease in soil erosion by water from 1992-1997.
6

I o w a I A C o u n t y
T o t a l C R P A c r e s 9 2 - 9 7 8 5 4 . 3 3 5 8 . 7 1 0 3 3 4 1 1 . 6 9 5 3 . 6 5 3 1 . 8 1 3 8 0 . 5 8 2 0 . 5 2 4 7 9 . 6
E r o s i o n I n c r e a s e E r o s i o n D e c r e a s e
Figure 9. Total acres enrolled into the Conservation Reserve Program between the years of 1992 and 1997 in Franklin, Hamilton, Hancock, Hardin, O’Brien, Plymouth, Marshall, Sioux, and Wright Counties.
Plymouth County is located in the 8-digit hydrologic unit that showed an increase in soil erosion during this time period. However, the total CRP acres in each county for that particular hydrologic unit do not surpass those of the hydrologic unit that had a decrease in soil loss over the five-year time period.
Table 3 shows that the total number of CRP acres implemented from 1992-1997 within the counties inside hydrologic unit 07080207 (a decrease in erosion) were 5573.7. The total amount of CRP acres installed into counties outlining the eight-digit hydrologic unit 10230002 (with an increase in soil erosion) was 3249.9. In general, these data show that a higher amount of acres enrolled in the Conservation Reserve Program reflects a decrease in soil erosion by water on the land. However, CRP acres associated with that particular county may not geographically be within the eight-digit hydrologic unit.
To further the accuracy of the correlation between CRP acreage and soil erosion, additional analyses on a smaller study area within each county could be completed; one which would show the actual location of CRP acres inside the respective eight-digit hydrologic unit.
In Table 4, a decrease in the number of farms from 1992 to 1997 can be observed in every county. Acres used for cropland decreased from 1992 to 1997 in Franklin,
Wright, O’Brien, and Plymouth counties. However, there appears to be no significance in the decrease of acreage used for cropland as it applies to the amount of soil erosion, per hydrologic unit, per year - as the percentage of land used for corn and soybean production for each county remains above 90% throughout the five year period. The landowners did not take a significant amount of acreage out of production and apply it to the Conservation Reserve Program.
0200400600800
100012001400
Fran
klin
Ham
ilton
Han
cock
Har
din
Mar
shal
lO
'Brie
nPl
ymou
th
Siou
x
Wrig
ht
1992199319961997
Figure 10. Iowa county acres enrolled in the Conservation Reserve Program within the years of 1992, 1993, 1996 and 1997. No data from 1994 and 1995. Table 3. Counties that encompass three 8-digit hydrologic units, and acreages for active contracts beginning in the program of that year.
8-Digit HU
County CRP 1992 Acres
CRP 1993 Acres
Total CRP 1996 Acres
Total CRP1997 Acres
Total Acres
07080207 916,022 Acres
Franklin Hamilton Hancock Hardin Marshall Wright
626.2 116 35.5 339.5 492.8 163.9
130.1 30.5 11.8 314.1 783.9 127.8
80.8 42.3 84.6 88.2 43.3 314.2
195.9631.7399.9112.560.5 347.7
1033 820.5 531.8 854.3 1380.5953.6
10230002 570,941 Acres
O’Brien Plymouth Sioux
24.7 495.8 75.7
16 1222.8 8.7
49 662.2 87.5
321.998.8 186.8
411.6 2479.6358.7
Figure 11 visually illustrates the
difference in surface elevation for the state of Iowa. The closer the surface lines are to each other, the greater the incline over land. The land is at a significantly steeper slope along the western and eastern boundaries of the state than in the middle.
7
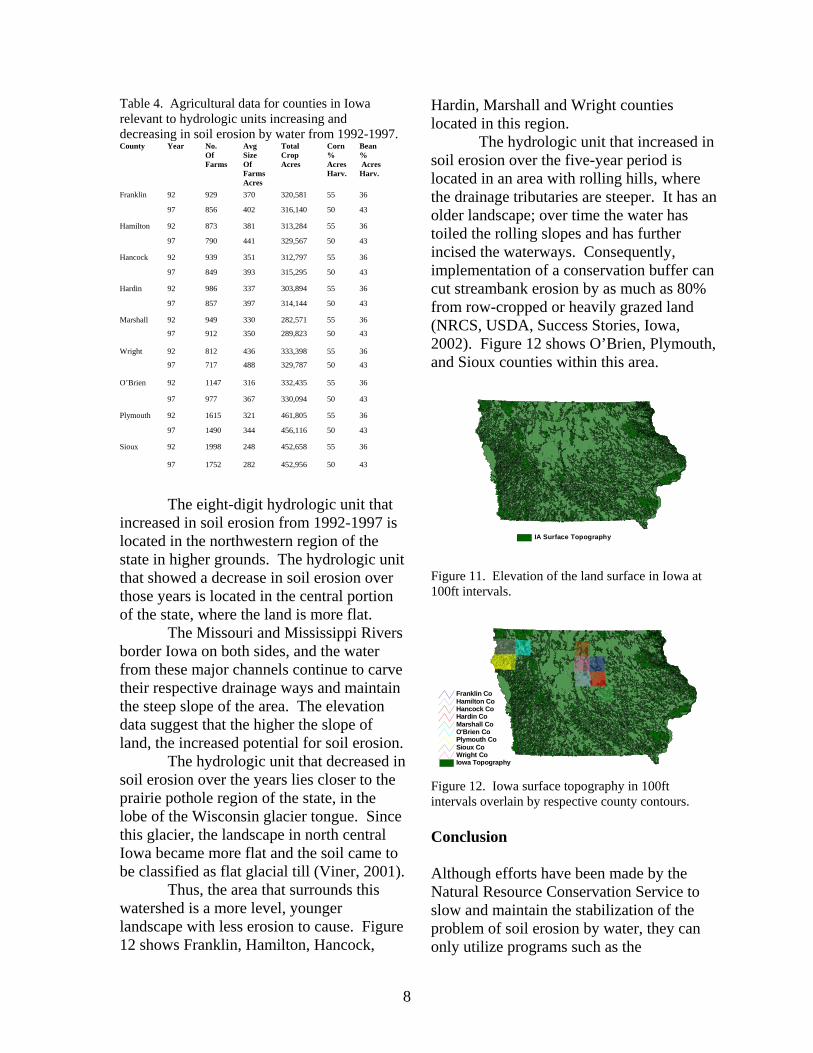
Table 4. Agricultural data for counties in Iowa relevant to hydrologic units increasing and decreasing in soil erosion by water from 1992-1997. County Year
No. Of Farms
Avg Size Of Farms Acres
Total Crop Acres
Corn % Acres Harv.
Bean % AcresHarv.
Franklin 92 929 370 320,581 55 36
97 856 402 316,140 50 43
Hamilton 92 873 381 313,284 55 36
97 790 441 329,567 50 43
Hancock 92 939 351 312,797 55 36
97 849 393 315,295 50 43
Hardin 92 986 337 303,894 55 36
97 857 397 314,144 50 43
Marshall 92 949 330 282,571 55 36
97 912 350 289,823 50 43
Wright 92 812 436 333,398 55 36
97 717 488 329,787 50 43
O’Brien 92 1147 316 332,435 55 36
97 977 367 330,094 50 43
Plymouth 92 1615 321 461,805 55 36
97 1490 344 456,116 50 43
Sioux 92 1998 248 452,658 55 36
97 1752 282 452,956 50 43
The eight-digit hydrologic unit that
increased in soil erosion from 1992-1997 is located in the northwestern region of the state in higher grounds. The hydrologic unit that showed a decrease in soil erosion over those years is located in the central portion of the state, where the land is more flat.
The Missouri and Mississippi Rivers border Iowa on both sides, and the water from these major channels continue to carve their respective drainage ways and maintain the steep slope of the area. The elevation data suggest that the higher the slope of land, the increased potential for soil erosion.
The hydrologic unit that decreased in soil erosion over the years lies closer to the prairie pothole region of the state, in the lobe of the Wisconsin glacier tongue. Since this glacier, the landscape in north central Iowa became more flat and the soil came to be classified as flat glacial till (Viner, 2001).
Thus, the area that surrounds this watershed is a more level, younger landscape with less erosion to cause. Figure 12 shows Franklin, Hamilton, Hancock,
Hardin, Marshall and Wright counties located in this region.
The hydrologic unit that increased in soil erosion over the five-year period is located in an area with rolling hills, where the drainage tributaries are steeper. It has an older landscape; over time the water has toiled the rolling slopes and has further incised the waterways. Consequently, implementation of a conservation buffer can cut streambank erosion by as much as 80% from row-cropped or heavily grazed land (NRCS, USDA, Success Stories, Iowa, 2002). Figure 12 shows O’Brien, Plymouth, and Sioux counties within this area.
IA Surface Topography
Figure 11. Elevation of the land surface in Iowa at 100ft intervals.
Iowa TopographyWright CoSioux CoPlymouth CoO'Brien CoMarshall CoHardin CoHancock CoHamilton CoFranklin Co
Figure 12. Iowa surface topography in 100ft intervals overlain by respective county contours. Conclusion Although efforts have been made by the Natural Resource Conservation Service to slow and maintain the stabilization of the problem of soil erosion by water, they can only utilize programs such as the
8

Conservation Reserve Program to an extent to repair damage that has already been caused to the landscape by geologic erosion. The eight-digit hydrologic units of the state of Iowa suggest a significant decrease in soil erosion from the years of 1992 to 1997, but one area did indicate an increase in soil erosion. The CRP acreage generally is reflected on the distribution of highly eroded land; it can critically decrease the amount of soil eroding, but not eliminate it. A considerable difference of a decrease in soil erosion cannot be directly observed, but can be realized when looking at sediment deposition in a stream or river.
A further study focusing on the amount of this sediment could be performed and attributed to the current study to show how much sediment actually builds up within the waterway. More attributing factors may be able to be seen in a similar study developed over time.
The biggest factor in the level of soil loss in the two hydrologic units was acreage applied to Conservation Reserve Program practices and elevation. The three counties in the northwest region of Iowa that contributed to soil loss - O’Brien, Plymouth, and Sioux County, had just over half the CRP acres implemented within the five-year period than those counties that improved in soil stabilization. Also, due to the area’s steeper drainage ways, the level of soil erosion was and continues to be at a higher rate.
The area that was subset from Franklin, Hamilton, Hancock, Hardin, Marshall and Wright counties had more CRP acres implemented into its farmland over the five-year period, and the soil erosion levels decreased. However, these counties also share a more level landscape, which gives a less chance of extreme soil erosion by water than those areas with steep topography.
Acknowledgements I would like to thank Martha Kelty Roldan and Tracy Trople for all of their ideas, technical assistance and guidance for this particular project. Also, John Ebert and Dean Mierau, for their insight and positive outlook while I finished my degree. Thank you EZ! You stuck with me through the completion of my project. I would also like to thank Patrick Thorsell for overseeing the completion of my project; I couldn’t have done it without you! And last but not least, I would like to express my gratitude to Dr. McConville, for all of the hope and encouragement sent my way, from the beginning to the end of my career at St. Mary’s University. References Isenhart, T.M; J.D. Coletti, & R.C.
Shultz, 1997. Watershed restoration and agricultural practices in the Midwest: Bear Creek in Iowa. Chapter 15 in J.E. Williams, M.P. Dombeck, and C.A. Woods (Eds.). Watershed Restoration: Principles and Practices. American Fisheries Society. Beltsville, MD.
Natural Resource Conservation Service, 2000. News Release. “Save Tons of Soil with Buffers and Continuous CRP.” Retrieved March 2002 from http://www.ianrcs.usda.gov/news/newsreleases/2000/buffer2.htm.
Natural Resource Conservation Service, U.S. Department of Agriculture, Iowa, 2002. Success Stories. Retrieved January 2002 from http://www.ia.nrcs.usda.gov/News/SuccessStories /successstories.htm.
Resource Assessment Division. Natural Resources Conservation Service. USDA, 2000. “Average Annual Soil Erosion by Water on Cropland and
9

CRP Land, 1992” brochure. Retrieved February 2002 from http://www.nhq.nrcs.usda.gov/land/meta/m5057.html.
Trees Forever, 2001. Forever Iowa Buffer Initiative. A Water Quality Initiative. Marion, Iowa.
United States Environmental Protection Agency, Office of Water. March 26, 1996. Ecological Restoration: A Tool to Manage Stream Quality. Retrieved January 2002 from http://www. epa.gov/OWOW/NPS/ Ecology.
USDA, 1999. “Preserving the Health of the Land: America’s Conservation Challenge” brochure.
Viner, Paul. April 2001. Phone Interview. Natural Resource Conservation Service. Davenport, Iowa.
10