Embed Size (px)
Citation preview

Detecting and Diagnosing Problems when z/OS “Thinks” it is Running Okay
z/OS Soft Failure Detection, Avoidance, Diagnosis
Bob Abrams
IBM Poughkeepsie, NY
Thursday, March 15, 2012
Session Number: 10603

2
Agenda:Detecting and Diagnosing Problems when z/OS “Thinks”it is Running Okay
Soft Failures: Detection, Prevention, Diagnosis
• Soft Failure detection & avoidance • Provided at multiple levels of the stack• Types of problems handled by each type of soft failure detection
• Soft Failure Detect/Diagnose/Avoid Capabilities in z/OS• Detection: z/OS Components• Avoidance: Health Checks• Detection & diagnosis: PFA, Runtime Diagnostics• Business Application view: Systems Management products
• Lessons learned on reducing impact of soft failures
All elements work together for an integrated IBM solutionAll elements work together for an integrated IBM solution
approachapproach

3
“Sick, but not dead” or
soft failures
Hard failures
Masked failures
“Sick, but not dead” or
soft failures
Hard failures
Masked failures
“Sick, but not dead” or
soft failures
Hard failures
Masked failures
“Sick, but not dead” or
soft failures
Hard failures
Masked failures
What is a soft failure?
“Your systems don’t break. They just stop working and we don’t know why.”
“Sick, but not dead” or Soft failures
Symptoms of a Soft Failure
� 80% of business impact, but only about 20% of the problems
� Long duration
� Infrequent
� Unique
� Any area of software or hardware
� Cause creeping failures
� Hard to determine how to isolate
� Hard to determine how to recover
� Hard for software to detect internally
� Probabilistic, not deterministic
Manifested as
� Stalled / hung processes
� Single system, sysplex members
� Sympathy Sickness
� Resource Contention
� Storage growth
� CF, CDS growth
� I/O issues (channel paths, response time)
� Repetitive errors
� Queue growth
� Configuration
� SPOF, thresholds, cache structure size, not enabling new features
Soft Failures
� Exhaustion of shared resources
� Recurring or recursive failures
� Serialization problems (deadlocks, priority inversions)
� Unexpected state transition

4
Multi-domain consolidationNetworks
Business applicationsSecurity
Integrated z/OS Soft Failure Detection & Prevention
Health
Checker
Console / Operlog
Performance analysis
Resource managementAutomation
Runtime
Diagnostics
z/OS 1.13
Operating System
z/OS Components(System resources & structures … Single system, Sysplex)
Predictive Failure Analysis (PFA)Soft FailureAvoidance
Soft FailureDetection
Soft FailureProblemDetermination
Soft Failure Detection- Performance- Events- Take corrective actions
Systems Management Products
5
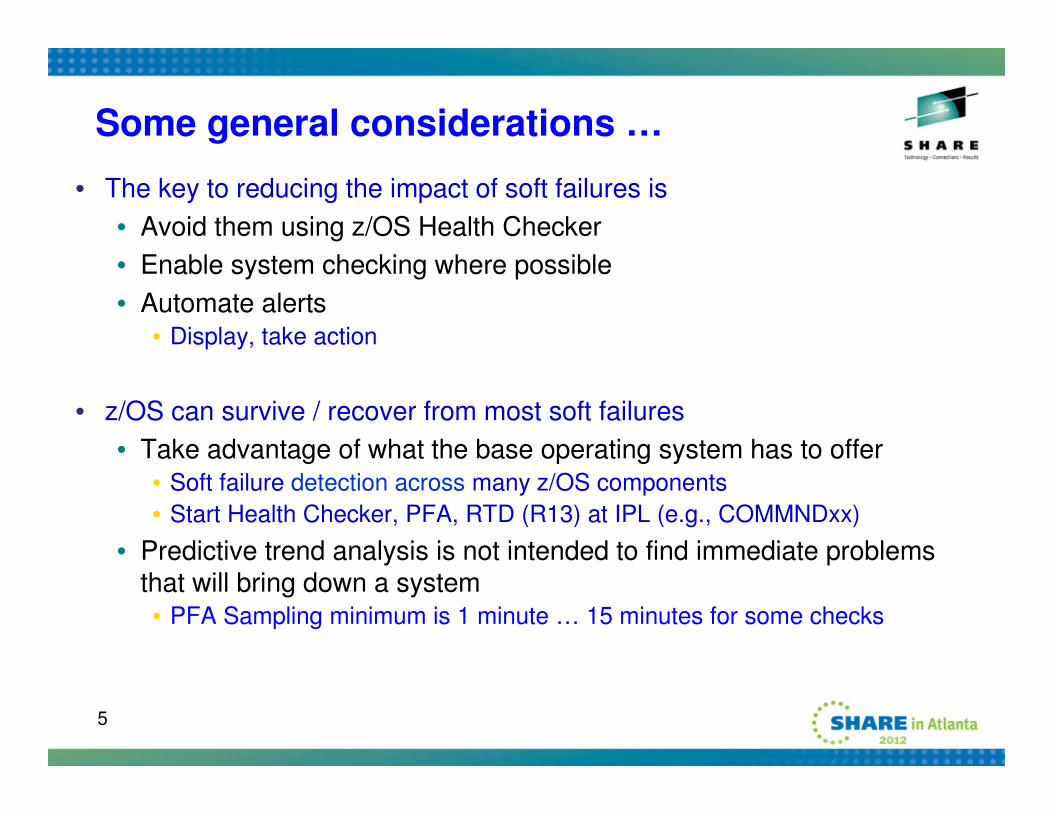
Some general considerations …
• The key to reducing the impact of soft failures is
• Avoid them using z/OS Health Checker
• Enable system checking where possible
• Automate alerts• Display, take action
• z/OS can survive / recover from most soft failures
• Take advantage of what the base operating system has to offer• Soft failure detection across many z/OS components
• Start Health Checker, PFA, RTD (R13) at IPL (e.g., COMMNDxx)
• Predictive trend analysis is not intended to find immediate problems that will bring down a system• PFA Sampling minimum is 1 minute … 15 minutes for some checks

6
Detection of Soft Failures by z/OS Components
• z/OS attempts to detect soft failures as close to the source as possible
• Uses the least amount of resources
• Requires the smallest amount of the stack to do detection
• Detection of a soft failure requires ability to identify when something is wrong
• Thresholds set by the installation
• Whenever possible, components try to avoid soft failures
• Examples …

7
Component Examples: Detection, Identification of soft failures … Single system
CAS contention detection
VSAM RLS index traps
Media Manager
DFSMS
Missing Interrupt Handler
Identify systems sharing a reserve
Captured UCB protection
I/O timing facility
Detect & remove “flapping links”
Dynamic Channel Path Management
IOS
JES2 MonitorJES2
Latch identity exploitation
XCF communication improvements (R13)
System limits
D OMVS,WAITERS to diagnose file system latch contention
UNIX System Services
Enhanced contention analysis for ENQ, Latch
GRS Latch Identify string
WLM management of blocking units
GRS
FeaturesComponent
Details in backup section

8
Component Examples: Detection of soft failures … Sysplex
• Not updating status, Not sending signals (ISOLATETIME(0): Fencing initiated n seconds after FDI exceeded)
• System updating status, not sending signals (Loss of connectivity: CONNFAIL(YES): remove systems with low weights)
• System Not Updating Status, But IS Sending Signals (SSUMLIMIT(900) … length of time system can remain not updating heartbeat (semi-sick), but sending signals)
• Sysplex Member Stalled (MEMSTALLTIME … break out of of an XCF signaling jam by removing the largest build-up)
• Structure Hang conditions … Take action when connector does not respond, avoiding user hangs (CFSTRHANGTIME) (R12)
Sysplex Failure Management, scenarios
How long to allow …
If a critical member is “impaired” for long enough, XCF will eventually terminate the member; GRS: remove system
Critical Member support;
GRS exploitation (R12)
Avoid waiting the Failure Detection Interval (FDI) if the system is truly dead … detect & reset failed system, eliminate data corruption, avoid sympathy sickness.
Exploitation of BCPii to determine dead system more quickly
Identify unresponsive system, restore to normal operation OR remove it to avoid sympathy sickness
Stalled member supportXCF / XES
FunctionsFeaturesComponent
Details in backup section

9
Multi-domain consolidationNetworks
Business applicationsSecurity
Integrated z/OS Soft Failure Detection & Prevention
HealthHealth
CheckerChecker
Console / Operlog
Performance analysis
Resource managementAutomation
Runtime
Diagnostics
z/OS 1.13
z/OS Components(System resources & structures … Single system, Sysplex)
Predictive Failure Analysis (PFA)
Soft FailureAvoidance
Soft FailureDetection
Soft FailureProblemDetermination
Soft Failure Detection- Performance- Events- Take corrective actions
Operating System
Systems Management Products

10
IBM Health Checker for z/OSSoft Failure Avoidance
• Health checker’s role is to keep subtle configuration errors from resulting in Soft Failures• Performance• System effects • Check configuration for best practices• Single points of failure for log structures, data sets, CDS• Storage utilization, running out of resources• How many ASIDs do I have left? LXs? When will I run out?• Whether DAE is inactive• VSAM RLS latch contention, CF Cache size, CDS SPOF, etc.• System Logger structure usage• I/O timing, protection• …
• Also used to emit PFA alerts• Warnings of detected soft failures
• 187 z/OS Health Checks in z/OS R13 (plus ISVs)

11
Health Checker: Soft Failure avoidance Important examples
Threshold for loss of connectivityXCF_SFM_CONNFAIL
Verifies CFSTRUCTURE hang timeXCF_SFM_CFSTRHANGTIME
Verifies SFM active, policy valuesXCF_SFM_ACTIVE
Checks status update missing (SUMLIMIT) valueXCF_SFM_SUMLIMIT
Check ISOLATETIME value, to allow SFM to fence and partition a system without operator intervention and without undue delay.
XCF_SFM_SUM_ACTION
Evaluate primary & secondary CDS configuration to determine if Sysprog inadvertently created a single point of failure
XCF_CDS_SPOFXCF
Evaluates whether the RACF ENQ names are in a GRSRNL list: system exclusion resource name list (SERNL) or the system inclusion resource name list (SIRNL)
RACF_GRS_RNLRACF
FunctionsHealth CheckComponent
Details in backup section

12
Health Checker: Soft Failure avoidance examples
Validate current system against parmlib IPL’d with
Remind you to update parmlib (due to dynamic changes)
USS_PARMLIBUNIX System Services
With Sysplex, some file systems accessed locally, some of function shipped to the File system owner. Some are accessed locally, but are configured to function ship
USS_CLIENT_MOUNTS
Checks if mount attribute access is read only; whether HFS’s in Sysplex root
USS_FILESYS_CONFIG
Validates SADMP, MVS IPL devicesSVA_AUTOIPL_DEV_VALIDATION
Check whether Program-Directed IPL and not GDPS, and whether AUTOIPL policy is active
SVA_AUTOIPL_DEFINED
DAE suppressing duplicate SVC dumps, saving system resources for unnecessary dumps
DAE_SUPPRESSINGServiceability
FunctionsHealth CheckComponent
Details in backup section

13
Important considerations when enablingz/OS Health Checks
1. Don't just change the configuration … investigate the exception and then take appropriate action
2. There are 187 Health Checks in z/OS R13
a. Start Health Checker, activating all checks and try to resolve exceptions
b. Don’t think that you must activate all health checks at once to get benefit
c. Goal should be to remove all exceptions• by fixing the condition• by tuning the check so that it looks for what you need it to look for• (as a last resort) by deactivating the check
d. Consider categorizing health checks by1) Checks I expect no exceptions from2) Checks not turned on because exceptions not cleaned up yet3) Plan to move checks to group 1 as you clean up exceptions
e. Once you can run cleanly, you will be in the ideal position to know that an exception indicates something has changed
3. GDPS recommendations for changing z/OS checks trump z/OS in a GDPS environment

14
Multi-domain consolidationNetworks
Business applicationsSecurity
Integrated z/OS Soft Failure Detection & Prevention
Health
Checker
Console / Operlog
Performance analysis
Resource managementAutomation
z/OS 1.13
z/OS Components(System resources & structures … Single system, Sysplex)
RuntimeRuntime
DiagnosticsDiagnostics
Predictive Failure Analysis (PFA)Predictive Failure Analysis (PFA)Soft FailureAvoidance
Soft FailureDetection
Soft FailureProblemDetermination
Soft Failure Detection- Performance- Events- Take corrective actions
Operating System
Systems Management Products

15
Problem Determination in a complex environment
Significant skill level needed to analyze problems, interact with IBM and ISVs to obtain additional diagnostic info
Data collection very time-consuming
Troubleshooting a live system and recovering from an apparent failure
Complexity of performing the task
Risk to the business
• The impact of the symptoms
• Risk of recurrence
• Impact in getting system stabilized
• Mean time to recovery too long
Requirement: Manage / capturedata to determine cause of problem
Solution: z/OSMF Incident Log
Requirement: Diagnose the cause in real time to allow operations to mitigate event inquiries
Solution: Runtime Diagnostics
Requirement: Detect “sick, but not dead” event BEFORE it causes problems; turn it into a correctable incident
Solution: Predictive Failure Analysis
Installation Pain Points Requirement Areas

16
Soft Failures: Hypothetical IT Example
1. A transaction -- � that has worked for a long time starts
to fail, or� occasionally (yet, rarely) fails� Example – “Reset Password and send
link to registered email account”
2. The transaction starts failing more regularly
3. Recovery is successful – � Such that the overall, applications
continue to work� Generates burst of WTO’s, SMF
records and LOGREC entries
4. BUT, THEN! Multiple, failing transactions occur together on a heavily loaded system� Recovery occurs� Slows down transaction processor� Random timeouts of other transactions
occur� System becomes “sick, but not dead”
This is a hypothetical problem which is a combination of multiple actual problems
Problem seen externallyTime period when everything running OK. PFA sees problem internally.

17
Soft Failure Detection: Predictive Failure Analysis
• Models trends in certain z/OS system resources & metrics• Predicts expected, normal behavior as well as future behavior; identifies
exceptions as Soft Failures• … when the resources will run out, or when metrics become abnormal
when compared to expected prediction• Machine-learning technology used to determine what’s normal
• Statistical analysis used to identify exceptions … focusing on metrics affecting different layers of the software stack
• Exceptions alerted and reports written using Health Checker for z/OS
• Tune comparison algorithms using configurable parameters such as STDDEV; defaults selected based on IBM test systems and customer data
• Tunable sensitivity and configuration parameters per check
• Identifies areas related to • resource exhaustion• damaged address spaces and damaged systems
• Invokes Runtime Diagnostics to check for hung address spaces (R13); RTD validates and suggests next steps

18
How PFA Chooses Address Spaces to Track
� Some metrics require data for the entire system to be tracked� Exhaustion of common storage for entire system� LOGREC arrivals for entire system grouped by key
� Some metrics call for tracking only persistent address spaces� Those that start within the first hour after IPL.� For example, tracks frames and slots usage to detect potential virtual storage leaks in
persistent address spaces.
� Some metrics are most accurate when using several categories� “Chatty” persistent address spaces tracked individually
– Start within the first hour after IPL and have the highest rates after a warm-up period– Data from first hour after IPL is ignored.– After an IPL or PFA restart, if all are running, same address spaces are tracked.– Duplicates with the same name are not tracked – Restarted address spaces that are tracked are still tracked after restart.
� Other persistent address spaces as a group� Non-persistent address spaces as a group� Total system rate (“chatty” + other persistent + non-persistent)

19
PFA Functions
• PFA address space …
• Collects data from the system
• Models the data from the system to create predictions
• Performs comparisons on current vs. predictions
• Issues exceptions or “OK” messages and reports via IBM Health Checker for z/OS
• When PFA detects a problem …
• Health check exception written to console• New exceptions suppressed until new model is available
• Prediction report available in SDSF (s.ck)• “Top address spaces” = potential villains• Address spaces causing exception
• Current and predicted values provided• Reports also available when no problem occurs
• Modeling automatically runs more frequently

20
Example Report: Logrec Arrival Rate Prediction Report
�Available in SDSF (s.ck)
�Heading information �Configuration and status
�Current and predicted information for metric
�Top predicted users�Tries to pinpoint potential
villains
� IBM Health Checker for z/OS message in its entirety
LOGREC Arrival Rate Prediction Report
(heading information intentionally omitted)
Key 0 Key 1-7 Key 8-15
__________ __________ __________
Arrivals in last
collection interval: 1 0 2
Predicted rates based on...
1 hour of data: 1 0 1
24 hours of data: 0 0 1
7 days of data: 0 0 1
30 days of data: 0 0 1
Jobs having LOGREC arrivals in last collection interval:
Job Name ASID Arrivals
________ ____ ________
LOGREC08 0029 2
LOGREC00 0027 1

21
The PFA Health Checks
� z/OS 1.10 SPE
– Common storage exhaustion check• CSA + SQA below the line• ECSA + ESQA above the line
– LOGREC arrival rate check• Groups arrivals by key• Four time ranges
� z/OS 1.11
– Frames and slots usage check
• Tracks all address spaces that start within an hour after IPL (persistent)
– Message arrival rate (WTO/WTOR) check• Chatty, persistent address spaces• Non-chatty, persistent address
spaces• Non-persistent address spaces• Total system
� z/OS 1.12
– SMF arrival rate check• Same categories as message arrival
rate check
– Modeling improvements• More granular common storage check• Supervised learning (exclude jobs)• Dynamic modeling
– Performance and serviceability
� z/OS 1.13– JES spool usage check
• Tracks all persistent address spaces• JES2 only
– Enqueue request rate check• Chatty, persistent address spaces• Total system
– Integration with Runtime Diagnostics to detect rates that are “too low”
How often do you see soft failures on your systems?

22
PFA updates
• Eliminate setup issues• Use zFS size recommendations in Doc APAR (OA33776)
• Problem where PFA not closing files (OA38786 – HIPER)
• Use supported Java version and configure location
• Java 5.0 and up (31-bit only)
• Use one PFA ini file (/etc/PFA/ini) (R12)
• Follow instructions in z/OS Problem Management
• Tune comparison algorithms
• Adjust sensitivity -- STDDEV, EXCEPTIONMIN, etc.
• EXCLUDED_JOBS (exclude jobs with erratic behavior)
• Use a zAAP and start PFA at IPL
• Get the latest PTFs!!
• Some algorithms tuned -- FSU, MAR, CSA, JSU checks
• Changed EXCEPTIONMIN & STDDEV defaults
• Design changes• Exclude interactive users from being persistent jobs
• Skip comparisons for ESQA
Details in backup

23
Runtime Diagnostics
• Analyzes a “sick, but not dead” system in a timely manner
• Performs analysis similar to a very experienced system programmer
• But faster – goal of 60 seconds or less
• More comprehensive
• Looks for specific evidence of “soft failures”
• Provides suggested next steps
• Runtime Diagnostics
• Is not automation or a monitor
• Takes no corrective action, but recommends next steps
• Has no background processing and minimal dependencies on system services
Component Analysis
Address Space Execution
Global Resource Contention
Analyzes Operlog for specific component msgs
Detects contention in ENQs in system address spaces, GRS latches, and the z/OS UNIX file system
Detects important execution information: CPU usage, local lock usage, and TCB loops

24
Runtime Diagnostics Invocation and Output
� z/OS 1.12 → Started task -- “Run” the analysis via a START command
– START HZR,SUB=MSTR
� z/OS 1.13 → Address space – Start with command above and Run with modify command
– f hzr,analyze
f hzr,analyze
HZR0200I RUNTIME DIAGNOSTICS RESULT 581
SUMMARY: SUCCESS
REQ: 004 TARGET SYSTEM: SY1 HOME: SY1 2010/12/21 - 13:51:32
INTERVAL: 60 MINUTES
EVENTS:
FOUND: 04 - PRIORITIES: HIGH:04 MED:00 LOW:00
TYPES: HIGHCPU:01
TYPES: LOOP:01 ENQ:01 LOCK:01
----------------------------------------------------------------------
EVENT 02: HIGH - HIGHCPU - SYSTEM: SY1 2010/12/21 - 13:51:33
ASID CPU RATE:99% ASID:002E JOBNAME:IBMUSERX
STEPNAME:STEP1 PROCSTEP: JOBID:JOB00045 USERID:IBMUSER
JOBSTART:2010/12/21 - 11:22:51
ERROR: ADDRESS SPACE USING EXCESSIVE CPU TIME. IT MIGHT BE LOOPING.
ACTION: USE YOUR SOFTWARE MONITORS TO INVESTIGATE THE ASID.
----------------------------------------------------------------------
EVENT 03: HIGH - LOOP - SYSTEM: SY1 2010/12/21 - 13:51:14
ASID:002E JOBNAME:IBMUSERX TCB:004FF1C0
STEPNAME:STEP1 PROCSTEP: JOBID:JOB00045 USERID:IBMUSER
JOBSTART:2010/12/21 - 11:22:51
ERROR: ADDRESS SPACE MIGHT BE IN A LOOP.
ACTION: USE YOUR SOFTWARE MONITORS TO INVESTIGATE THE ASID.
F HZR,ANALYZE
HZR0200I RUNTIME DIAGNOSTICS RESULT 692
SUMMARY: SUCCESS
REQ: 002 TARGET SYSTEM: SY1 HOME: SY1 2010/12/21 - 14:32:01
INTERVAL: 60 MINUTES
EVENTS:
FOUND: 02 - PRIORITIES: HIGH:02 MED:00 LOW:00
TYPES: LATCH:02
----------------------------------------------------------------------
EVENT 01: HIGH - LATCH - SYSTEM: SY1 2010/12/21 - 14:32:01
LATCH SET NAME: SYSTEST.LATCH_TESTSET
LATCH NUMBER:3 CASID:0039 CJOBNAME:TSTLATCH
TOP WAITER - ASID:0039 - JOBNAME:TSTLATCH - TCB/WEB:004E2A70
TOP BLOCKER- ASID:0039 - JOBNAME:TSTLATCH - TCB/WEB:004FF028
ERROR: ADDRESS SPACES MIGHT BE IN LATCH CONTENTION.
ACTION: D GRS,AN,LATCH,DEP,CASID=0039,LAT=(SYSTEST.L*,3),DET
ACTION: TO ANALYZE THE LATCH DEPENDENCIES. USE YOUR SOFTWARE
ACTION: MONITORS TO INVESTIGATE BLOCKING JOBS AND ASIDS.
Example output� Left → HIGHCPU and LOOP� Below → GRS Latch Contention

25
Runtime Diagnostics Symptoms Detected
� z/OS 1.12
� Component-specific, critical messages in OPERLOG
� Looks one hour back, if available� Additional analysis for some msgs� Message summary found in output� Can analyze messages in other
system in sysplex
� Enqueue Contention Checking
� Looks for system address space waiting > 5 seconds
� Lists both waiter and blocker� Can detect contention in other system
in sysplex
� Local Lock Suspension
� Any address space whose local lock suspension time is > 50%
� z/OS 1.12 (continued)
� CPU Analysis
� Takes 2 samples over 1 sec. interval� Any task using > 95% is considered a
potential problem
� Loop Detection
� Investigates all tasks in all address spaces looking for TCP loops
� z/OS 1.13
� z/OS UNIX Latch Contention
� Looks for z/OS UNIX latch contention or waiting threads that exit for > 5 minutes.
� GRS Latch Contention
� Obtains latch contention info from GRS� Omits z/OS UNIX file system latch
contention� Returns longest waiter for each latch set

26
z/OS 1.13 PFA Integration with Runtime Diagnostics
� Detects damaged or hung system or address space based on rates being “too low”
� When PFA detects too low, Runtime Diagnostics is executed
� Output� “Too low” exception message sent
as WTO by default
� Runtime Diagnostics outputincluded in PFA report
� Prediction report and result message available in SDSF (sdsf.ck)
� PFA current rates and predictionsrelevant to category causing exception
� Supported for Message Arrival Rate, SMF Arrival Rate, Enqueue Request Rate
Message Arrival Rate Prediction Report
(Heading information intentionally omitted.)
Persistent address spaces with low rates:
Predicted Message
Message Arrival Rate
Job Arrival
Name ASID Rate 1 Hour 24 Hour 7 Day
________ ____ ____________ ____________ ____________ ____________
JOBS4 001F 1.17 23.88 22.82 15.82
JOBS5 002D 2.01 8.34 11.11 12.11
Runtime Diagnostics Output:
Runtime Diagnostics detected a problem in job: JOBS4
EVENT 06: HIGH - HIGHCPU - SYSTEM: SY1 2009/06/12 - 13:28:46
ASID CPU RATE: 96% ASID: 001F JOBNAME: JOBS4
STEPNAME: PFATEST PROCSTEP: PFATEST JOBID: STC00042 USERID:
++++++++
JOBSTART: 2009/06/12 - 13:28:35
Error:
ADDRESS SPACE USING EXCESSIVE CPU TIME. IT MAY BE LOOPING.
Action:
USE YOUR SOFTWARE MONITORS TO INVESTIGATE THE ASID.
-----------------------------------------------------------------
-----
EVENT 07: HIGH - LOOP - SYSTEM: SY1 2009/06/12 - 13:28:46
ASID: 001F JOBNAME: JOBS4 TCB: 004E6850
STEPNAME: PFATEST PROCSTEP: PFATEST JOBID: STC00042 USERID:
++++++++
JOBSTART: 2009/06/12 - 13:28:35
Error:
ADDRESS SPACE APPEARS TO BE IN A LOOP.
Action:
USE YOUR SOFTWARE MONITORS TO INVESTIGATE THE ASID.
(Additional output intentionally omitted.)

27
Extending to Systems Management Products
• Many (ISV) Systems Management products support
• Actions based on WTO message events
• Automation of Health Check events • PFA Health Check events = soft failures
• Performance analysis
• Integration of Alert displays, performance exceptions, event based actions

28
Integrated z/OS Soft Failure Detection & Prevention
Health
Checker
Console / Operlog
MultiMulti--domain consolidationdomain consolidation
NetworksNetworks
Business applicationsBusiness applications
SecuritySecurity
Performance analysisPerformance analysis
Resource managementResource managementAutomationAutomation
Runtime
Diagnostics
z/OS 1.13
z/OS Components(System resources & structures … Single system, Sysplex)
Predictive Failure Analysis (PFA)Soft FailureAvoidance
Soft FailureDetection
Soft FailureProblemDetermination
Soft Failure Detection- Performance- Events- Take corrective actions
Operating System
Systems Management Products

29
Integrated z/OS Soft Failure Detection & Prevention
Health
Checker
Console / Operlog
OMEGAMON XE on z/OS
OMEGAMON zMC
AGENTS
AGENTS
Tivoli SA
Netcool/OMNIbus
Runtime
Diagnostics
z/OS 1.13
z/OS Components(System resources & structures … Single system, Sysplex)
Tivoli Event Pump
Predictive Failure Analysis (PFA)Soft FailureAvoidance
Soft FailureDetection
Soft FailureProblemDetermination
Soft Failure Detection- Performance- Events- Take corrective actions
Operating System
TIVOLI Management Products

30
zMC Health Check display

31

32
Overall: Reducing Impact of Soft Failures• Automation of alerts is key
• Display, take action
• z/OS can survive / recover from most soft failures
• But, take advantage of what the base operating system has to offer• Soft failure detection across many z/OS components
• Start Health Checker, PFA, RTD (R13) at IPL (e.g., COMMNDxx)
• Most metrics are very time sensitive
• Defaults selected based on z/OS test environments; should be good for most
• Predictive trend analysis typically not done on a Machine-time scale
• PFA not designed to detect anomalies that could terminate a system on machine-time scale
• Shortest data comparison is once a minute; identification of a program consuming CSA make take a couple minutes
• PFA has tuned comparison algorithms using what is learned from your system• Configuration parameters are tunable to make the algorithms more accurate for your workloads
• All checks have configurable parameters, e.g. STDDEV (Lower � more sensitive)

33
Summary
IBM provides an integrated solution approach to
Avoiding, Detection, Diagnosing Soft Failures
Business Application View
Performance, Automation
Analysis / Diagnosis
Avoidance
First point of defense z/OS Components
Health Checker
Predictive Failure AnalysisRuntime Diagnostics
All elements work together for an integrated All elements work together for an integrated IBM soft failure solution IBM soft failure solution …… Set Them Up!Set Them Up!
Systems Management Products

34
Acknowledgements
• Thank you to all who contributed information for this presentation
JES2Tom Wasik
OmegamonBrian Kealy
USS File SystemJohn Case
DFSMS - RLSTerri Menendez
Health CheckerPeter Relson
USS KernelScott Bender
DFSMS - Media ManagerRon Bretschneider
System LoggerDoug Zobre
z/OS ArchitectDave Surman
DFSMSWayne Rhoten
IOSDale Riedy
GRS, AvailabilityNick Matsakis
XCF, XES, CFMark Brooks
PFA / RTDKarla Arndt
z/OS Predictive TechnologiesJim Caffrey

35
Backup Reference –Recent PFA Enhancements

36
How to Get the Most Out of PFA
� Use check-specific tuning parameters to adjust sensitivity of comparisons if needed
� To minimize customer configuration
– Default parameter values constructed from in-house and external data– Some defaults changed via PTFs using customers' data
Parameter Description
STDDEV Increase value to decrease sensitivity.Not available on the Common Storage Usage check.
EXCEPTIONMIN Increase value to decrease exceptions issued for relatively low rates.Not available on the Common Storage Usage check or Frames and Slots Usage check.
THRESHOLD Increase value to decrease sensitivity.Common Storage Usage check only
STDDEVLOW Increase value to decrease sensitivity for “too low” checking.Available on checks where “too low” checking is supported.
LIMITLOW Defines the maximum rate where “too low” checking is performedAvailable on checks where “too low” checking is supported.

37
How to Get the Most Out of PFA (continued)
� Use PFA check-specific parameters to affect other behavior
Parameter Description
COLLECTINT Number of minutes between collections
MODELINT Number of minutes between modelsPFA automatically and dynamically models more frequently when neededz/OS 1.12 default updated to 720 minutes. First model will occur within 6 hours (or 6 hours after warm-up)
COLLECTINACTIVE Defines whether PFA should collect and model if check not active/enabled in IBM Health Checker for z/OS
DEBUG Use only if IBM service requests it
CHECKLOW z/OS 1.13 – Turns on/off “too low” checking with RTD for checks that support it
TRACKEDMIN Requires a persistent job to have this minimum rate at the end of the warm-up in order to be tracked (where supported)
Health Checker parameters
For example, SEVERITY -- All PFA checks default = SEVERITY(MED): Eventual action WTO

38
How to Get the Most Out of PFA (continued)
�z/OS 1.12 – Eliminate jobs causing false positives
�Unsupervised learning is the machine learning that PFA does automatically.
�Supervised learning allows you to exclude jobs that are known to cause false positives. For example,
– Exclude test programs that issue many LOGRECs and cause exceptions.
– Exclude address spaces that issue many WTOs, but are inconsistent or spiky in their behavior and cause message arrival rate exceptions.

39
How to Get the Most Out of PFA (continued)
� z/OS 1.12 -- Implementing supervised learning
� Supported by all checks except Common Storage Usage
� Create EXCLUDED_JOBS file in the check’s /config directory
– Simple comma-separated value format
• JobName,Systems,Date,Reason
– Supports wildcards in both job name and system name
• KKA*,*,04/05/2011,Exclude all KKA* jobs on all systems
� Use f pfa,update,check(check_name) if PFA running
� PFA creates an EXCLUDED_JOBS file for some checks during installation
� See z/OS Problem Management for more information

40
How to Get the Most Out of PFA (continued)
� Use a zAAP to offload PFA's Java Processing
� Start z/OS Resiliency functions at IPL� IBM Health Checker for z/OS
� PFA
� Runtime Diagnostics (z/OS 1.13)
� Automate the PFA IBM Health Checker for z/OS exceptions� Simplest: Add exception messages to existing message automation product
� More complex: Use exception messages and other information to tailor alerts� See z/OS Problem Management for exceptions issued for each check
� Create a policy in an HZSPRMxx member for persistent changes� Not all check-specific parameters are required on an UPDATE of PFA checks!
– UPDATE CHECK=(IBMPFA,PFA_COMMON_STORAGE_USAGE) PARM(‘THRESHOLD(3)')

41
� Get the latest PTFs! � Configuration value default changes
� Comparison algorithm tuning changes
� Changes to design
– Exclude interactive users from being persistent jobs
– Skip comparisons for ESQA
� zFS growth problem – in progress (OA38376)
� Help us to make PFA's results better for everyone!
How to Get the Most Out of PFA (continued)

42
SUMMARY examples:
f pfa,display,checks
f pfa,display,check(pfa*),summary
AIR013I 10.09.14 PFA CHECK SUMMARY
LAST SUCCESSFUL LAST SUCCESSFUL
CHECK NAME ACTIVE COLLECT TIME MODEL TIME
PFA_COMMON_STORAGE_USAGE YES 04/05/2008 10.01 04/05/2008 08.16
PFA_LOGREC_ARRIVAL_RATE YES 04/05/2008 09.15 04/05/2008 06.32
(all checks are displayed)
PFA Serviceability
DETAIL examples:
f pfa,display,check(pfa_logrec_arrival_rate),detail
f pfa,display,check(pfa_l*),detail
AIR018I 02.22.54 PFA CHECK DETAIL
CHECK NAME: PFA_LOGREC_ARRIVAL_RATE
ACTIVE : YES
TOTAL COLLECTION COUNT : 5
SUCCESSFUL COLLECTION COUNT : 5
LAST COLLECTION TIME : 04/05/2008 10.18.22
LAST SUCCESSFUL COLLECTION TIME: 04/05/2008 10.18.22
NEXT COLLECTION TIME : 04/05/2008 10.33.22
TOTAL MODEL COUNT : 1
SUCCESSFUL MODEL COUNT : 1
LAST MODEL TIME : 04/05/2008 10.18.24
LAST SUCCESSFUL MODEL TIME : 04/05/2008 10.18.24
NEXT MODEL TIME : 04/05/2008 16.18.24
CHECK SPECIFIC PARAMETERS:
COLLECTINT : 15
MODELINT : 360
COLLECTINACTIVE : 1=ON
DEBUG : 0=OFF
STDDEV : 10
EXCEPTIONMIN : 25
EXCLUDED_JOBS:
(excluded jobs list here)
STATUS examples:
f pfa,display
f,pfa,display,status
AIR017I 10.31.32 PFA STATUS
NUMBER OF CHECKS REGISTERED : 5
NUMBER OF CHECKS ACTIVE : 5
COUNT OF COLLECT QUEUE ELEMENTS: 0
COUNT OF MODEL QUEUE ELEMENTS : 0
COUNT OF JVM TERMINATIONS : 0
Modify command to display status

43
Backup Reference –Component Soft Failure detection

44
Component Examples: Detection, Identification of soft failures … Single system
Assists in determining why JES2 is not responding to requests
“Monitor” msgs issued for conditions that can seriously impact JES2 performance
JES2 MonitorJES2
Prevent deadlocks caused by starvationWLM management of blocking units
Identifies holders, waiters, latches, file device numbers, file inode numbers, latch set identifiers, file names, and owning file systems
D OMVS,WAITERS to diagnose file system latch contention
(enhanced R13: file latch activity)
Checks for buildup of processes, pages of shared storage (process & system level)
System Limits
Detected lost messages in sysplex, via message ordering
XCF communication improvements (R13)
Explanations for latch usage on D GRSLatch identity exploitationUNIX System Services
Prevent exhaustion of common storage resulting from GRSQSCAN processing
GRS ENF 51
Associate name with Latch numberGRS Latch identity string
Identify Blocker/Waiter, Deadly embraces, Job name, Creator ASID
Enhanced contention analysis for ENQ, Latch
GRS
FunctionsFeaturesComponent
Details in backup section

45
Component Examples: Detection, Identification, recovery of soft failures … Single system
Improved channel recovery (hardware)Detect & remove “Flapping Links”
Prevent accidental overlays of real UCBsin SQA by Legacy applications
Captured UCB protection
Abnormally end I/O requests exceeding I/O timing limits for device; Hyperswapdevices as well
I/O timing facility
Recover channel program error retry from I/O errors, using a lower level protocol
Media manager
Checks the structure of all index CIsbefore writing them to DASD
VSAM RLS index traps
Identify, terminate service tasks beyond a monitored wait time
CAS contention detectionDFSMS
WLM dynamically move channel paths from one CU to another, in response to workload changes
Dynamic Channel Path Management
Identify partner system sharing device
D U,VOL= … D GRS,DEV= …
Identify systems sharing a reserve
Detect incomplete I/O operations, within a policy driven time period (device, CU, fabric); recover, FFDC
Missing Interrupt HandlerIOS
FunctionsFeaturesComponent
Details in backup section

46
Component Examples: Detection of soft failures … Sysplex
• Not updating status, Not sending signals (ISOLATETIME(0): Fencing initiated n seconds after FDI exceeded)
• System updating status, not sending signals (Loss of connectivity: CONNFAIL(YES): remove systems with low weights)
• System Not Updating Status, But IS Sending Signals (SSUMLIMIT(900) … length of time system can remain not updating heartbeat (semi-sick), but sending signals)
• Sysplex Member Stalled (MEMSTALLTIME … break out of of an XCF signaling jam by removing the largest build-up)
• Structure Hang conditions … Take action when connector does not respond, avoiding user hangs (CFSTRHANGTIME) (R12)
Sysplex Failure Management, scenarios
How long to allow …
If a critical member is “impaired” for long enough, XCF will eventually terminate the member; GRS: remove system
Critical Member support;
GRS exploitation (R12)
Avoid waiting the Failure Detection Interval (FDI) if the system is truly dead … detect & reset failed system, eliminate data corruption, avoid sympathy sickness.
Exploitation of BCPii to determine dead system more quickly
Identify unresponsive system, restore to normal operation OR remove it to avoid sympathy sickness
Stalled member supportXCF / XES
FunctionsFeaturesComponent
Details in backup section

47
Detection of Soft Failures on a z/OS image:GRS serialization
• Enhanced contention analysis for ENQ / Latch • D GRS,ANALYZE,BLOCKER / WAITER / DEPENDENCY• D GRS,ANALYZE,LATCH,BLOCKER / WAITER / DEPENDENCY
• Blocker/Waiter, Deadly embraces, Job name, Creator ASID, etc.
• GRS Latch identity string• Associate name with latch number• Included in D GRS latch analysis responses• Exploited by USS, RRS, Logger, RACF
• GRS interacts with WLM to manage priority of blocking units of work• Prevent deadlocks causing starvation• WLM’s “trickle” support ensures that critical work is given cycles gradually to resolve
any deadlocks
• GRS monitor• ENF 51 generates blocks in common storage (SQA)• SRBs suspended due to stuck receiver (e.g., RMF)
• Therefore too many requests can cause common storage outage
• GRS piped the requests elsewhere to avoid exhausting common storage
• Exploits XCF Critical member support (see XCF critical member support)

48
Detection of Soft Failures on a z/OS image:UNIX System Services serialization
• Latch identity explanations for the latches used by USS (R13)• FS: <fs name> … MOUNT … MessageQ ID=<msg-ID in decimal>
• System traversing or modifying structures related to the message queue
• XCF communication improvements• Lost XCF message detection (R13)
• Utilizes XCF message ordering to detect lost messages• Activate with parmlib option, SETOMVS LOSTMSG=ON/OFF
• Member Gone detects stall, attempts fix; if takeover fails, initiates sysplex-wide dump
• USS System Limits (R10)• Checks for buildup of processes, pages of shared storage (process & system level)• When 85% process utilization is reached, WTO messages are issued• For example: MAXASSIZE, MAXCPUTIME, MAXFILEPROC, MAXPROCUSER,
MAXQUEDSIGS, MAXTHREADS• Displayed via D OMVS,LIMITS
• DISPLAY OMVS,WAITERS to diagnose file system latch contention problems• Enhanced in R13 to show a table for file latch activity• Holders, waiters, latches, file device numbers, file inode numbers, latch set identifiers,
file names, and owning file systems

49
Detection of Soft Failures on a z/OS image:IOS examples
Missing Interrupt Handler• Incomplete I/O: Prevents an application or system outage due to an error in any one of
the following places:► Device
► Control Unit
► Fabric
► Operator/CE error (IML, cable pulls, etc…)
• Outage is prevented by:► Detecting when an I/O operation has not completed within a policy driven time period
► Invoking system diagnostic routines to understand the scope of the error
► Driving hardware and software recovery mechanisms
► First Failure Data Capture
Identify sharing systems holding a reserve • Start-pending MIH condition � D U,VOL= to identify device number• D GRS,DEV=dddd to determine reserve status• Identify other system with reserve, in message (IOS431I device reserve to CPU …)
Captured UCB protection• Creates a temporary copy of UCBs for Legacy applications• Prevents accidental overlays of real UCBs in SQA

50
I/O Timing Facility – Identify slow I/O response time
• Times the entire I/O request• If exceeds timing limit …• Abnormally ends I/O
requests exceeding I/O timing limits for device
• Application posted with permanent error, error logged to Logrec
• Facility can trigger a Hyperswap when I/O timeout occurs for a device monitored• Whether I/O operation
should be terminated or started on the “swap TO”device
Figure 1 - MIH vs. I/O Timing
ApplicationIssues I/O
ApplicationPosted
IOS issues SSCH
I/O Interrupt
ERP Retries
I/O QueueTime
MIH Time
I/O Timing Time
Figure 1 - MIH vs. I/O Timing
ApplicationIssues I/O
ApplicationPosted
IOS issues SSCH
I/O Interrupt
ERP Retries
I/O QueueTime
MIH Time
I/O Timing Time
51
Improved Channel Recovery
• For frequently-occurring path errors, better to have hardware problem cause path taken offline than continue to cause problems
• IOS recovery delays application I/O even when there are other paths
Proactively Removing Paths – Flapping Links
• Logic path between channel & control unit becomes available, unavailable multiple times over a short period
• Drives IOS recovery for all devices on the affected link• May cause application I/O delays• When channel detects that link has “flapped” 5-9 times in 5 minutes, it stops attempting
to establish a logical path
Dynamic Channel Path Management• Simplify I/O configuration definition task• Static channel path definitions needed to be re-evaluated when workloads shift• DCM lets WLM dynamically move channel paths from 1 CU to another, in response to
workload changes• Improve workload management• DASD I/O resources are used more efficiently• Improves Availability• Foundation for auto-configuration• Balance mode, Goal mode

52
Detection of Soft Failures on a z/OS image:DFSMS examples
• CAS Contention Detection• Runs as part of the CAS analysis task• Periodically checks the Catalog Address Space (CAS) service tasks list
(every 30 seconds or upon request)• Based on a set wait time and reason class, determines those tasks which are
beyond the wait time. • Checks for service tasks that are active and waiting on the SYSZTIOT enqueue. It sets
timer for each waiting task (10 min)
• Creates a symptom record for each task past the limit• Terminates some of the violating tasks, which were considered safe to
terminate
• VSAM RLS index traps• Set the trap using a V SMS,MONDS command• Checks the structure of all index CIs before writing them to DASD.
• If problem, abend is issued and write is avoided
• Media Manager• Channel program error retry from I/O errors, using a lower level protocol
supported by the device • zHPF transport mode channel program• Command mode channel program with MIDAWs• Command mode channel program with IDAWs
• Media Manager will retry the I/O with one of the lower level protocols

53
Detection of Soft Failures on a z/OS image:JES2 Monitor
• Assists in determining why JES2 is not responding to requests (single system)
• “Monitor” messages issued when conditions exist that can seriously impact JES2 performance (z/OS or JES2 issues)
• Automatically started when JES2 is started
• Results displayed via $JD STATUS command
• Any conditions the monitor detected that could impact JES2
• Corresponding monitor address space for each JES2 address space
• $JD MONITOR displays status info for each monitor task
• Samples values at regular intervals
• Incident categories:
• Normal processing
• Tracking: processing time exceeds threshold
• Alerts: Incident being tracked crosses a second (sampling) threshold• Exclusive incidents focus attention on primary incident
• Resource utilization
• Low, high, average, current utilization
• $JD HISTORY displays up to 72 hours of resource utilization & CPU sample statistics
For more information, see JES2 Diagnosis book, GA22-7531

54
Detection of Soft Failures in a Sysplex:XCF stalled member support
• A system may appear to be healthy with respect to XCF system status monitoring:
• Updating status in the sysplex CDS• Sending signals
• But is the system actually performing useful work?• There may be critical functions that are non-operational, making the system
unusable• Could induce sympathy sickness elsewhere in the sysplex• Waiting for a response; waiting to get an ENQ, latch, lock
• Causes include• Dead system• Loops (spin, SRB)• Low weighted LPAR• Loss of a Coupling Facility
• Long periods of sympathy sickness may have a greater negative impact on the sysplex than termination of an XCF group member, address space, structure connector, or even a system
• Action should be taken to restore the system to normal operation OR remove it to avoid sympathy sickness
• Helps reduce the incidence of sysplex-wide problems that can result from unresponsive critical components

55
Detection of Soft Failures in a Sysplex:Sysplex Failure Management (SFM)
• Single system “Sick but not dead” issues can escalate to cause sysplex-wide problems
• Typically holds resources needed by other systems in the sysplex
• Implements best practices of a resilient sysplex
• Enables automatic, timely, corrective action to be taken when applications or systems appear to be causing sympathy sickness
• Protects your sysplex when your operators and/or your automation are inattentive, unable, or incapable of resolving the problem
• Define an SFM policy to help meet availability and recovery objectives
• Applications or systems are not permitted to linger in an extremely sick state such that they adversely impact other systems in the sysplex
• Applications or systems are not terminated prematurely
• Failure Detection Interval (FDI): amount of time a system is permitted to appear unresponsive (Not updating heartbeat, Not sending signals)
• Use of BCPii to determine a system is down dramatically improves this detection (over use of heartbeat) (see BCPii topic)

56
Detection of Soft Failures in a Sysplex: SFM• System Not Updating Status, Not Sending Signals
• ISOLATETIME(0) • n seconds after the FDI exceeded fencing is initiated by all systems• Commands are sent across the coupling facility to the target system and I/O is isolated• After fencing completes successfully, sysplex partitioning continues
• System updating status, not sending signals• Loss of connectivity: CONNFAIL(YES)
• SFM determines sets of systems that do have full signal connectivity• Selects a set with largest combined system weights• Systems in that set survive, others are removed• Ensure the weights assigned to each z/OS system adequately reflect the relative
importance of the system
• System Not Updating Status, But IS Sending Signals• SSUMLIMIT(900)
• Indicates the length of time a system can remain in the state of not updating the heartbeat and sending signals
• This is the amount of time a system will remain in a “semi-sick” state.• Once the SSUMLIMIT has been reached the specified action will be initiated against the
system
• Sysplex Member Stalled• MEMSTALLTIME (600-900)
• Enable XCF to break out of an XCF signaling traffic jam• SFM automatically starts removing the largest build-up, adversely impacting other
systems in the sysplex• Action XCF will take: terminate the stalled member with the highest quantity of signals
backed up

57
Taking Action When a Connector Does Not Respond
• Connectors to CF structures participate in processes, respond to relevant events
• XES monitors the connectors, reports unresponsive connectors
• Users of the structure may hang until offending connector responds or is terminated
• CFSTRHANGTIME (z/OS R12)
• How long the system should allow a structure hang condition to persist before taking action
• Enables XES to automatically take action if a connector does not respond to a structure event in a timely fashion
• XES corrective actions:
• Stop rebuild
• Force user to disconnect
• Terminate connector task, address space or system
• RAS: ABEND026 dumps collected
• CFSTRHANGTIME(900-1200)
Detection of Soft Failures in a Sysplex: SFM

58
Detection of Soft Failures in a Sysplex: SFM
BCPii: Avoid waiting the FDI+ if the system is truly dead !
• BCPii allows XCF to query the state of other systems via authorized interfaces through the support element and HMC network
• Benefits:• XCF can detect and/or reset failed systems more quickly• Works in scenarios where fencing cannot work
• CEC checkstop or powered down• Image reset, deactivated, or re-IPLed• No CF
• Eliminates the need for manual intervention, which may lead to data corruption problems
• Reduction in sympathy sickness time
• Set this up. It is a critical component of Resiliency AND Soft Failure Avoidance

59
Detection & Prevention of Soft Failures in a Sysplex: Critical Member support
• A Critical Member is a member of an XCF group that identifies itself as “critical” when joining its group
• If a critical member is “impaired” for long enough, XCF will eventually terminate the member
• Per the member’s specification: task, space, or system
• SFM parameter MEMSTALLTIME determines “long enough”before terminating the stalled member with the highest quantity of backed up signals
• GRS declares itself a “critical member”
• If GRS cannot perform work for as long as the FDI, GRS is said to be “impaired”
• XCF will remove a system from the sysplex if GRS on that system becomes “impaired” (key tasks not operating) to avoid sympathy sickness
• Based on SFM MEMSTALLTIME(n)
• For MEMSTALLTIME(NO), N=MAX(FDI, 120 seconds)

60
Health Check details

61
Health Checker: Soft Failure avoidance Important examples
Threshold for loss of connectivityXCF_SFM_CONNFAIL
Verifies CFSTRUCTURE hang timeXCF_SFM_CFSTRHANGTIME
Verifies SFM active, policy valuesXCF_SFM_ACTIVE
Checks status update missing (SUMLIMIT) value
XCF_SFM_SUMLIMIT
Checks ISOLATETIME value, to allow SFM to fence and partition a system without operator intervention and without undue delay.
XCF_SFM_SUM_ACTION
Evaluates primary & secondary CDS configuration to determine if Sysproginadvertently created a single point of failure
XCF_CDS_SPOFXCF
Evaluates whether the RACF ENQ names are in a GRSRNL list: system exclusion resource name list (SERNL) or the system inclusion resource name list (SIRNL)
RACF_GRS_RNLRACF
FunctionsHealth CheckComponent
Details in backup section

62
Health Checker: Soft Failure avoidance examples
Validate current system against parmlib IPL’d with
Remind you to update parmlib (due to dynamic changes)
USS_PARMLIBUNIX System Services
With Sysplex, some file systems accessed locally, some of function shipped to the File system owner. Some are accessed locally, but are configured to function ship
USS_CLIENT_MOUNTS
Checks if mount attribute access is read only; whether HFS’s in Sysplex root
USS_FILESYS_CONFIG
Validates SADMP, MVS IPL devicesSVA_AUTOIPL_DEV_VALIDATION
Check whether Program-Directed IPL and not GDPS, and whether AUTOIPL policy is active
SVA_AUTOIPL_DEFINED
DAE suppresses duplicate SVC dumps so that system resources (processor cycles and dump space) are not used for a dump which provides little or no additional diagnostic value
DAE_SUPPRESSINGServiceability
FunctionsHealth CheckComponent
Details in backup section
63
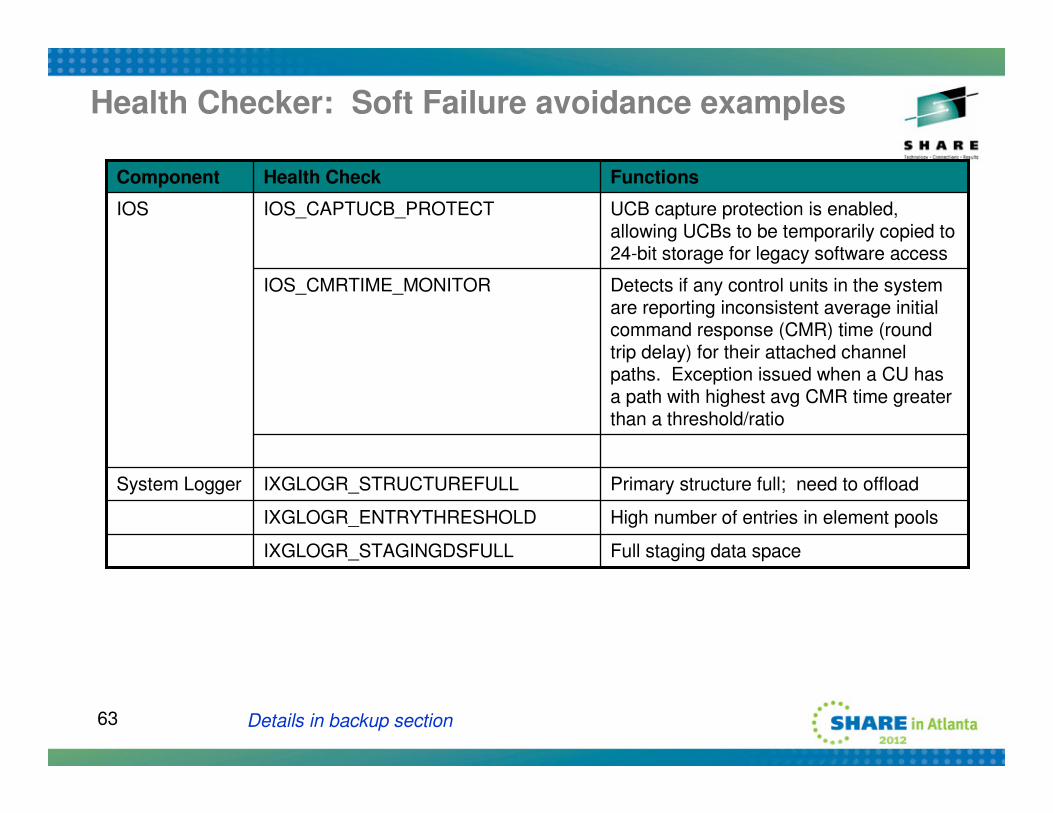
Health Checker: Soft Failure avoidance examples
Primary structure full; need to offloadIXGLOGR_STRUCTUREFULLSystem Logger
High number of entries in element poolsIXGLOGR_ENTRYTHRESHOLD
Full staging data spaceIXGLOGR_STAGINGDSFULL
Detects if any control units in the system are reporting inconsistent average initial command response (CMR) time (round trip delay) for their attached channel paths. Exception issued when a CU has a path with highest avg CMR time greater than a threshold/ratio
IOS_CMRTIME_MONITOR
UCB capture protection is enabled, allowing UCBs to be temporarily copied to 24-bit storage for legacy software access
IOS_CAPTUCB_PROTECTIOS
FunctionsHealth CheckComponent
Details in backup section

64
z/OS Health Check: Example Categories
ExamplesCategory
IOS_CAPTUCB_PROTECT
IOS_CMRTIME_MONITOR (Check for inconsistent average initial command response (CMR))
IOS_MIDAW (MIDAW enabled)
I/O
GRS_MODE (system configured in STAR mode)
GRS_SYNCHRES (GRS synchronous reserve processing enabled)
GRS_CONVERT_RESERVES (reserves converted to ENQs)
GRS
IEA_ASIDS (number of ASIDs remaining)
IEA_LXS (number of LX’s remaining)
SUP_LCCA_ABOVE_16M
Address space checks
RACF_GRS_RNL (for RACF datasets)
SDSF_CLASS_SDSF_ACTIVE (SDSF settings)
Security
VSAMRLS_SINGLE_POINT_FAILURE (SHCDS data sets)
XCF_CDS_SPOF (XCF Couple Data Sets)
XCF_CF_CONNECTIVITY (CF links, SPOF)
Detect Single points of failure

65
z/OS Health Check: Example Categories
ExamplesCategory
XCF_*
XCF_CF_*
CSTCB_*
RRS_*
IXGLOGR_*
VSAMRLS_*
XCF_SFM_*
CNZ_*
Etc.
Sysplex configuration
ALLOC_* (Allocation)
CNZ_* (Consoles)
CSRES (Comm Server), CSTCP_* (TCP/IP)
SDSF_*, …
Optimal component settings

66
z/OS Health Check: Example Categories
CSTCP_TCPMAXRCVBUFRSIZE
CSVTAM_CSM_STG_LIMIT
VSAMRLS_CFCACHE_MINIMUM_SIZE
XCF_MAXMSG_NUMBUF_RATIO
RSM_MEMLIMIT
RSM_MAXCADS
RSM_AFQ
RSM_REAL
RSM_RSU
VSM_*
Buffer sizes, storage limits
ExamplesCategory
SDUMP_AVAILABLE
SDUMP_AUTO_ALLOCATION (auto-alloc SDUMP data sets)
CSTCP_SYSTCPIP_CTRACE (CTRACE active, options)
CSVTAM_VIT_SIZE (VTAM Internal Trace table size)
CSVTAM_VIT_DSPSIZE (VTAM Internal Trace)
SVA_AUTOIPL_DEFINED
SVA_AUTOIPL_DEV_VALIDATION
DAE_SHAREDSN
DAE_SUPPESSING
Serviceability (Dump, Trace options)

67
z/OS Health Check: Example Categories
Migration checks
Console configurationHSM control data set backupsJES2 ready to upgradeReconfigurationSMS CDS configurationSystem loggerStaging data sets full, entry thresholds, structure fullUSS/ zFS: File system issuesVSAM RLS: false contention, monitor contention, monitor unresponsive CICS regions, TVS enabled
Other component specifics
ExamplesCategory
SUP_HIPERDISPATCH (Verify Hiperdispatch enabled)SUP_HiperdispatchCPUConfig (monitors the number of CPUs installed and Hiperdispatch state of the system)
Hardware

68
Health Checker: Soft Failure avoidance examples
• DAE_SUPPRESSING• DAE suppresses duplicate SVC dumps so that system resources
(processor cycles and dump space) are not used for a dump which provides little or no additional diagnostic value
• IBM recommendation is to activate this function. • If turned off, then health checker will issue an exception to alert the team to this
sub optimal configuration.
• XCF_CDS_SPOF• z/OS uses two coupling data sets (CDS) to manage a parallel sysplex,
primary and alternative. • This check evaluates the I/O configuration to determine if the I/O
configuration has inadvertently created a single point of failure (SPOF) when accessing the data on the primary and alternative CDS.
• Alternative CDS created to handle a problem with a switch or a storage device.
• SVA_AUTOIPL_DEFINED, SVA_AUTOIPL_DEV_VALIDATION• Check whether environment can support AUTOIPL, whether active• Validates SADMP, MVS IPL devices

69
Health Checker: Soft Failure avoidance examples
• System Logger• IXGLOGR_STRUCTUREFULL
• Primary structure full; need to offload
• IXGLOGR_ENTRYTHRESHOLD• High number of entries in element pools
• IXGLOGR_STAGINGDSFULL• Full staging data space
• UNIX System Services
• USS_PARMLIB• Validate current system against parmlib IPL’d with• Remind you to update parmlib (due to dynamic changes)
• USS_CLIENT_MOUNTS • With Sysplex, some file systems accessed locally, some of function shipped to the File
system owner. Some are accessed locally, but are configured to function ship • Check if function ship but could be done locally (performance awareness)
• USS_FILESYS_CONFIG• Checks if mount attribute access is read only• HFS’s in Sysplex root
• Sysplex Failure management• Examines / validates SFM values
• XCF_SFM_ACTIVE• XCF_SFM_CFSTRHANGTIME• XCF_SFM_CONNFAIL• XCF_SFM_SSUMLIMIT• XCF_SFM_SUM_ACTION

70
Health Checker: Soft Failure avoidance examples
• IOS_CAPTUCB_PROTECT
• UCB capture protection is enabled, allowing UCBs to be temporarily copied to 24-bit storage for legacy software access
• IOS_CMRTIME_MONITOR
• Fabric issues have resulted in unacceptable I/O service times• RMF device activity reports show average service times to be higher than normal
• I/O queuing reports show abnormally high “initial command response” times on a subset of the paths to a device (5x)
HostCage
4Cage3
Switch
Switch
ControlUnit
Encl2 Encl
1
Cage2Cage
1FC
FC
Initial Command Response (CMR) Time isolatesthe round trip fabric delay portion of the command
Execution. This allows host to identify wherecongestion is occurring.

71
Tivoli Management Products
• Tivoli Management Products integrate
• Soft Failures detected by PFA • Health Check exceptions surfaced by zMC (to be supported on
Omegamon XE)
• Tivoli System Automation policy to control of corrective actions
• Performance issues detected by Omegamon
• Evaluate entire software stack
• Customer-defined model, selection of critical events
• Netcool/OMNIbus provide centralized monitoring of Health Check Alerts, Performance, Situations, Network activity, etc.

72
Event Pump for z/OS
Each subsystem writes messages to z/OS
• These messages may contain state and status information• The Event Pump parses the message, interprets the resource information, and converts the message to an EIF event
Event Pump
LPAR
CICS
DB2
IMS
z/O
S m
essag
es
EIF events
CICS
EIF Probe
DB2
IMS
Severity
map
pin
g
OMNIbus
TBSMTIP

73
How PFA Detects Soft Failures
� Causes of “sick, but not dead”
� Damaged systems
– Recurring or recursive errors caused by software defects anywhere in the software stack
� Serialization
– Priority inversion
– Classic deadlocks
– Owner gone
� Resource exhaustion
– Physical resources
– Software resources
� Indeterminate or unexpected states
� Predictive failure analysis uses� Historical data
� Machine learning and mathematical modeling
to detect abnormal behavior and the potential causes of this abnormal behavior
� Objective � Convert “sick, but not dead” to a
correctable incident