Embed Size (px)
Citation preview
Detailed Temperature and Humidity Climatology for Middle East Ports
Project code: W.LIV.0267
Prepared by: Bruce Buckley (Ph. D.)
Weather Australia
Date published: March 2009
ISBN: 9781741913606
PUBLISHED BY
Meat & Livestock Australia Locked Bag 991 NORTH SYDNEY NSW 2059
Meat & Livestock Australia acknowledges the matching funds provided by the Australian Government to support the research and development detailed in this publication.
This publication is published by Meat & Livestock Australia Limited ABN 39 081 678 364 (MLA). Care is taken to ensure the accuracy of information in the publication. Reproduction in whole or in part of this publication is prohibited without the prior written consent of MLA.

Climate Analysis for Middle East Ports
Page 2 of 50
Abstract An assessment of the Voluntary Observing Ship (VOS) data was completed with a focus on how well these data, as incorporated into the livestock export heat stress risk assessment software, “HotStuff 3.0”, accurately represents the heat stress risk of livestock carrying ships in Middle Eastern ports. For each of the ten major Middle East ports used by the Australian livestock trade, the best possible historical wet bulb temperature datasets were identified. The VOS data were considered to have limited applicability to the ports of Adabiya, Aqaba and Kuwait, with limitations to the applicability of the data also likely at Muscat. In almost every case there exists an historical land-based record of wet bulb temperatures that could provide improved guidance on the most likely wet bulb conditions to be experienced within these ports.

Climate Analysis for Middle East Ports
Page 3 of 50
Executive summary The purpose of this review was to ensure the best possible historical wet bulb temperature data are used to assess the port specific heat stress risk of livestock as incorporated into the latest version of HotStuff (3.0; B.LIV.0249). Available datasets included the Voluntary Observing Ship (VOS) weather observations, held by the US based National Climate Data Center, and the land-based observations operated by the National Weather Services of the countries in which the ports are located. In many cases the nearest land-based data to a port of discharge is from an airport location. The suitability of both of these datasets was assessed in terms of the likely similarity of the climatological wet bulb temperature data to that experienced by a ship in the port of discharge. The VOS data covered the period 1991 to 2008 while the land based observations are available from various starting dates beginning as early as the mid 1940s through to 2008. The suitability of the aggregated VOS data for adequately representing the expected wet bulb temperature conditions, and hence the likely heat stress risk to livestock, at the ten major ports of discharge used for the Australian livestock trade to the Middle East was found to vary significantly from port to port. Table 1 summarises the extent to which the VOS wet bulb temperature data was considered suitable for this purpose. Port VOS Data
Suitability Land Based Stations Comments
Adabiya Not suitable Port Tawfik, El-Suez VOS data biased to more southern conditions
Aqaba Not suitable Aqaba Airport, Eilat VOS data biased to more southern conditions
Jeddah Generally suitable
Jeddah (King Abdul Aziz) International Airport, Jeddah I.E.
Both should be suitable
Kuwait Not suitable Kuwait International Airport, Ahmadi New Oil Pier
VOS data biased to more southern conditions
Bahrain Generally suitable
Bahrain International Airport Airport preferred as it has similar climate to port
Dhahran Generally suitable
Dhahran Airport Airport preferred as it is adjacent to port
Doha Generally suitable
Doha International Airport (new and old)
Airport preferred as it is adjacent to port
Dubai Generally suitable
Dubai International Airport, Rashid Port / Ras Ganadah
Exclude Gulf of Oman data from VOS analysis
Fujairah Generally suitable
Fujairah Airport Exclude Persian Gulf data from VOS analysis
Muscat Limited applicability
Seeb International Airport Data from Mina Sultan Qaboos should be investigated
Table 1: Summary of the suitability of the VOS data to represent in-port wet bulb temperature climatology, with best available land-based weather stations as alternative data sources.

Climate Analysis for Middle East Ports
Page 4 of 50
In general, for the three northern-most ports of Adabiya, Aqaba and Kuwait, the VOS data is not likely to reflect the semi-continental nature of the wet bulb temperature climates experienced at these locations. The VOS climatologies provide an oceanic climate which is more representative of the voyage conditions more than 100km south of the respective ports. For Muscat neither the VOS nor Seeb International Airport data are considered to truly represent the wet bulb temperature regime at the Muscat port during periods of light winds. The Seeb data is assessed as being slightly more representative of the in-port conditions, but there may be alternative weather stations with more suitable data. A weather station at Mina Sultan Qaboos (23.61N 58.56E, elevation 4m) is known to exist with data potentially available from May 1983 through to December 2008 that warrants investigation. It is recommended that the land based wet bulb temperature climatologies provided in this report be incorporated into the port of discharge component of HotStuff 3.0. Concurrent consideration should be given to acquiring the complete historical weather data for the relevant weather stations near each port of discharge, with priority given to the ports where the VOS data has lower applicability. It should also be noted that, although outside the scope of this project, it is possible to provide predictions of expected weather conditions for the times of arrival of the livestock carrying vessels, to assist in decisions made to avoid major heat stress events during the period of the animal discharge. Moderately high resolution numerical weather predictions are available for the Middle Eastern region on a routine basis.

Climate Analysis for Middle East Ports
Page 5 of 50
Contents Page
1 Background ...........................................................................7
1.1 Methodology for Heat Stress Risk Assessment: Sea Voyages to Middle East Ports .......................................................................................................................7
2 Objective................................................................................7
3 General Assessment of the Utility of the Voluntary Observing Ship Data.............................................................8
3.1 Voluntary Observing Ship Observations.............................................................8 3.2 Quality Control Procedures used by Maunsell for VOS data ............................8
4 Suitability of Wet Bulb Temperature Data for Middle East Ports.......................................................................................9
4.1 Port specific evaluation of wet bulb temperature data ......................................9
4.1.1 Adabiya ...................................................................................................................9
4.1.2 Aqaba ....................................................................................................................12
4.1.3 Jeddah...................................................................................................................16
4.1.4 Kuwait....................................................................................................................20
4.1.5 Bahrain ..................................................................................................................23
4.1.6 Dhahran / Ad Dammam.........................................................................................26
4.1.7 Doha......................................................................................................................28
4.1.8 Dubai / Jebel Ali.....................................................................................................32
4.1.9 Fujairah .................................................................................................................35
4.1.10 Muscat...................................................................................................................36
5 Conclusions and recommendations .................................42
6 Appendices..........................................................................49
6.1 Appendix 1 – Sources of Meteorological Information......................................49 6.2 Appendix 2 – Aqaba Daily Wet Bulb Climatology and Spreadsheets .............49 6.3 Appendix 3 – Jeddah Daily Wet Bulb Climatology and Spreadsheets ...........49 6.4 Appendix 4 – Kuwait Daily Wet Bulb Climatology and Spreadsheets ............49 6.5 Appendix Bahrain Daily Wet Bulb Climatology and Spreadsheets.................49 6.6 Appendix 6 – Doha Daily Wet Bulb Climatology and Spreadsheets ...............49

Climate Analysis for Middle East Ports
Page 6 of 50
6.7 Appendix 7 – Dubai Daily Wet Bulb Climatology and Spreadsheets ..............49 6.8 Appendix 8 – Muscat Daily Wet Bulb Climatology and Spreadsheets............50

Climate Analysis for Middle East Ports
Page 7 of 50
1 Background
1.1 Methodology for Heat Stress Risk Assessment: Sea Voyages to Middle East Ports
Maunsell Australia recently completed a revision of the methodology used to estimate the heat stress risk to livestock on voyages to the Middle East (B.LIV.0249). The methodology of this version includes an estimate of the heat stress mortality risk on open and closed decks during the discharge phase of the voyage. The envoyage component of the study does not place reliance on the existence of cross winds greater than 5 knots and this aspect is left to the discretion of the user. The new methodology is incorporated into version 3.0 of the Heat Stress Risk Assessment Model “HotStuff”. The availability of suitable historical meteorological data for this purpose is very limited. The ship observations from the world-wide network of Voluntary Observing Ships (VOS), obtained from the US based National Climate Data Center, was used to determine the wet bulb climatologies for both the enroute and discharge components of the voyages from Australia to the Middle East ports. This report discusses the suitability of the VOS data for each of the main ports of discharge in the Middle East and identifies potential alternative, land-based historical observations that could be used to refine this methodology.
2 Objective The objective of this study was to analyse and advise on the most suitable wet bulb temperature data to be used in HotStuff version 3.0 to develop port specific heat stress risk estimates. For both VOS and land based data the analysis will include the following for each of the ten key ports (Aqaba, Adabiya and Jeddah in the Red Sea, Kuwait, Bahrain, Dhahran, Doha and Jebel Ali (Dubai) in the Persian Gulf, and Muscat and Fujairah in the Gulf of Oman):
Wet bulb observation records (and other relevant climate data) available for each port the reliability and accuracy of each data set the ability of each data set to reflect the heat stress that livestock on vessels in port may
experience (e.g. location of recording relevant to port) a discussion on the attributes of each data set and their relative merit to the assessment
of heat risk as done by HotStuff, e.g. derived or measured wet bulb, frequency of measurement

Climate Analysis for Middle East Ports
Page 8 of 50
3 General Assessment of the Utility of the Voluntary Observing Ship Data
3.1 Voluntary Observing Ship Observations
The VOS weather observations are the most comprehensive set of historical weather observations available for oceanic areas of the world. Voluntary Observing Ships are encouraged to provide weather observations at the standard international times of 00, 06, 12 and 18 Coordinated Universal Time (UTC). In many cases the observations are only provided at 00 and 12 UTC, with a few ships providing observations at other times. Most of the observations are based upon manual reading of wet and dry bulb thermometers. There is a slow trend towards installing automatic weather stations on some of the ships that ply the more remote ocean areas. The data is quality controlled through automated systems as it is stored in the US National Climate Data Center (NCDC) archives. However, there are inherent data quality problems with these weather observations. The collection of the data is through voluntary agreements with the owners of the various ships that ply international waters. Hence the task of gathering the weather data is typically a secondary function, usually assigned to a more junior crew member. There is a network of Port Meteorological Agents (PMA) whose task it is to assist the VOS ships, provide training to crew members and to replace and undertake calibration checks on the VOS instrumentation. However, the PMA are located at a relatively small number of ports world-wide and hence it can be a year or more before a VOS ship visits a port with a PMA. Hence, opportunities to train crew members and check equipment can be limited for some vessels. The measurement of wet bulb temperature is also more subject to errors caused by poor maintenance of the equipment than other weather observations. As the wet bulb thermometer typically has a muslin sock connecting the thermometer bulb to a reservoir of water, there is considerable scope for errors to creep into the observations. If the water reservoir dries out, the wet bulb temperature will equal the dry bulb temperature and the humidity reading will climb to near 100%. If the muslin becomes contaminated by salt or other contaminants such as dust, the rate of evaporation of the water will be affected. If the contaminant is salt, which is very common on a ship, the wet bulb reading will normally be higher than it actually is. Siting of the instrumentation can also be a problem. The instrumentation should be in a ventilated screen protecting the instruments from direct sunlight. Locating the thermometers against a metal bulkhead can alter the local temperature regime quite significantly. Also, if the screen is sheltered from the wind, the thermometers may not be properly ventilated, also affecting the readings. Other problems, such as mis-reading the thermometers, mis-typing the data into the coded messages and loss of calibration of the instrumentation are all issues that adversely affect data quality. 3.2 Quality Control Procedures used by Maunsell for VOS data
Maunsell describe in section 3 of their report (B.LIV.0249) the steps taken to quality control the VOS data. The techniques used are all valid and the approach taken was rigorous and thorough. It was concluded that all reasonable steps that could be taken to remove erroneous observations and data from suspect ships has been done. Therefore the quality of the VOS data used in HotStuff 3.0 is as good as could be realistically expected. Further quality control could be undertaken to select individual outlying wet bulb temperature records and compare them with neighbouring observations

Climate Analysis for Middle East Ports
Page 9 of 50
where they exist. However, this process would be extremely time consuming and, in many cases, there would be no certainty in determining whether or not the observation was correct.
4 Suitability of Wet Bulb Temperature Data for Middle East Ports
This section provides a port by port assessment of the suitability of wet bulb temperature data, from either the VOS dataset, or land-based observations. This assessment includes a discussion of the availability of wet bulb temperature data for each port, the reliability and accuracy of the data, the ability of the wet bulb temperature data to reflect the heat stress that livestock on vessels in port will experience, and options to improve the reliability of the wet bulb data. VOS data for the period from 1991 to 2008 was used to develop the climatologies. The VOS data is the only available data for the component of the voyage while the ships are enroute from the Australian ports to the destination ports. There is no alternative suitable dataset at the current time and hence this approach should be accepted as being the best available given the current availability of data. No further comments will be made on this aspect of HotStuff 3.0. 4.1 Port specific evaluation of wet bulb temperature data
4.1.1 Adabiya
The Port of Abadiya is located at the extreme northern end of the Gulf of Suez on the western side of the Gulf (see Figure 1). It is almost directly opposite the much longer established Port Taufiq, located at the southern entrance to the Suez Canal. There is a large populated area of El-Suez / As Suways at the northern end of the Gulf.

Climate Analysis for Middle East Ports
Page 10 of 50
Figure 1: Google Earth image showing the location of Adabiya at the northern end of the Gulf of Suez. The port is relatively well protected from the prevailing northerly winds in this region (see Figure 2). The prevailing winds in this region experienced at the port are predominantly off the desert areas. Hence this region does not have a particularly high risk of prolonged elevated wet bulb temperature data. It is only in calm conditions following a prolonged period of south south-easterly winds that this port can expect to experience elevated wet bulb temperatures. Hence the wet bulb temperature climate of this region is likely to be highly localised, with only weather observations from the Adabiya – Port Taufiq (Tawfik) – El-Suez region likely to be representative of the weather conditions experienced at the Port of Adabiya.

Climate Analysis for Middle East Ports
Page 11 of 50
Figure 2: Larger scale Google Earth image of the Gulf of Suez. The 3o radius black ring shows the geographical extent of the region used for aggregating wet bulb temperature data. The wet bulb temperature data for Adabiya as used in HotStuff 3.0 has been aggregated over all areas contained inside the circle shown in Figure 2. As Figure 3.2 in the Maunsell report shows, there is a sudden increase in the number of ship observations from the Red Sea outside the Gulf of Suez, and potentially from ships within the Gulf of Aqaba. The wet bulb climate of these areas is likely to differ quite significantly from that experienced at Adabiya with higher wet bulb temperatures likely. Therefore it is to be expected that HotStuff3.0 would over-estimate the heat stress risk at the Port of Adabiya. Ideally, HotStuff 3.0 should use wet bulb climatological data based upon historical observations from the Adabiya region. This data has not been obtained at the date of this report and the wet bulb climatology will need to be prepared if this improvement is to be implemented. There are real time

Climate Analysis for Middle East Ports
Page 12 of 50
weather observations available from El-Suez and it is likely the Egyptian Meteorological Authority, located in Cairo, holds historical data that has the potential to date back to the opening of the Suez Canal, as the British probably established a weather station at this location during the construction of the Suez Canal. However, based upon data held by the US based NOAA National Data Center (NNDC), the potentially available on-line historical dataset for El-Suez (Station ID 624490) extends from January 1960 to December 2008. For Port Tawfik (Station ID 624500) the NNDC dataset extends from October 1979 to November 2004. There is no way of knowing in advance of purchasing these datasets what the extent of missing data might be for these locations. The quality of the historical datasets for these two locations is not known, as neither appear to be international airports where observation standards are enforced by the International Civil Aviation Organisation (ICAO). However, the potential to analyse both stations in parallel should enable fairly good quality control. The historical VOS dataset is generally comprised of ship observations at 00UTC and 12UTC with reduced numbers of observations at 06UTC and 18UTC. A small number of ships report at other times of the day. The general limitations of the quality of the VOS wet bulb temperature dataset apply. For the land based stations of El-Suez and Port Tawfik, the observation program is not known but would become immediately evident if the data were to be purchased. It is most likely based upon observations at the standard synoptic observing times of 00, 06, 12 and 18UTC, similar to those of the VOS dataset. The quality control procedures applied to the historical land based observational dataset held by the NNDC are not known. Details of these procedures can potentially be obtained from the Egyptian Meteorological Department. However, given the existence of two sets of observations in relatively close proximity and with between 24 and 49 years of historical data available, it is thought that a detailed analysis of these datasets would provide a climatology that would closely reflect the wet bulb climate experienced at the Port of Adabiya. This climatology should be superior to that provided by the VOS dataset. Until such time as data is obtained from Port Tawfik and/or El Suez, as a guide of what to expect, the comparisons between the VoS data and land-based data for Aqaba should be viewed as the meteorological and geographical situations of the two ports is broadly similar. 4.1.2 Aqaba
The Port of Aqaba (see Figure 3) is similar in many respects to that of Adabiya, being a largely land-locked port. The prevailing winds are primarily from the north to north northwest and hence tend to be from the land, which is normally very dry. The VOS dataset used for Aqaba in HotStuff 3.0 is aggregated over a radius of 2.4o, a region depicted by the black circle in Figure 4. It is very likely the wet bulb climatology produced by the VOS dataset would over estimate the heat risk for the Port of Aqaba as it includes a considerable amount of VOS observations from ships in the northern red Sea (refer to Maunsell Figure 3.2). Hence data from land based weather stations is likely to provide a better estimate of the heat stress risk at this location.

Climate Analysis for Middle East Ports
Page 13 of 50
Figure 3: Google Earth image showing the location of Aqaba at the northern end of the Gulf of Aqaba. The Port of Aqaba is located at the bottom centre of the image with Aqaba Airport at the top of the image. The Israeli city of Eilat is on the lower left. As is the case for all locations in the Middle East, the VOS dataset is the same as outlined for Adabiya. Historical land-based weather data for Aqaba is from the Airport at Aqaba (Station ID 403400), shown in Figure 3. A subset of this dataset formed the basis of the preliminary Aqaba wet bulb temperature climatology provided to the MLA in May 2008 and forms Appendix 2 to this report. The NNDC currently holds data for Aqaba Airport from July 1961 to December 2008. The NNDC also holds data for the closed weather station at Aqaba Port (Station ID 403410), spanning the period of time from August 1965 to October 2003. If required additional data may be available from the nearby Israeli city of Eilat. The NNDC holds data for the city of Eilat (Station ID 401990) for the period from January 1951 to December 2008. The potential to use data from three weather stations in this location would indicate a relatively high quality analysis of wet bulb temperatures should be possible for this location, although the Aqaba Airport data alone should be superior to the VOS dataset for the Aqaba Port.

Climate Analysis for Middle East Ports
Page 14 of 50
Figure 4: Larger scale Google Earth image of the Gulf of Aqaba and northern Red Sea. The 2.4o radius black ring shows the geographical extent of the region used for aggregating wet bulb temperature data. There is potentially 38 years of wet bulb temperature data from the now closed weather station at the Port of Aqaba. The quality of this dataset is not known. However, the observations from Aqaba Airport and Eilat are subject to the observation standards set by ICAO and hence are likely to be of good quality. The frequency of the weather observations from the Port of Aqaba are not known as it is not likely to be a standard, internationally exchanged weather observation. Data for Aqaba Airport should be available at the standard 6 hourly time steps as this dataset is exchanged internationally. It is also possible the Jordan Meteorological Department holds an archive of hourly weather observations for Aqaba Airport as the observations are recorded on an hourly basis. The land based climatologies from the three weather stations in this region should be able to provide wet bulb climatologies that are superior to the VOS based climatology currently used in HotStuff 3.0 which would accurately reflect the heat stress that livestock in the Port of Aqaba would experience. Comparisons between the VOS and Aqaba Airport wet bulb temperatures are shown for the 50th and 98th percentiles in Figure 5a and b respectively. The drier, more continental nature of the data for Aqaba Airport can clearly be seen with the differences greater at the 50th percentile than for the 98th. This clearly shows using the VOS wet bulb data for the location of Aqaba would erroneously portray

Climate Analysis for Middle East Ports
Page 15 of 50
the wet bulb climatology, significantly over estimating the frequency of high wet bulb days. This would imply worse heat stress conditions occur at Aqaba than they do in reality. This can be attributed to the fact that the VOS data represents wet bulb temperatures over a significant portion of the northern red Sea and the southern Gulf of Aqaba which do not reflect the conditions typically experienced at the Port of Aqaba. The VOS data is for 1991 to 2008 and the Aqaba data is from 1998 to February 2008 (Appendix 2).
(a)

Climate Analysis for Middle East Ports
Page 16 of 50
(b) Figure 5: Comparisons between the HotStuff 3.0 Voluntary Observing Ship and Aqaba Airport wet bulb temperature observations for the (a) 50th and (b) 98th percentiles. 4.1.3 Jeddah
The Port of Jeddah (see Figure 6) is in an indentation of the eastern edge of the Red Sea. There is a relatively strong prevailing north north-westerly wind in Jeddah which, combined with the deep nature of the Red Sea, reduces the typical wet bulb temperatures below those of comparable eastern Arabian ports. Episodes of high wet bulb temperature normally occur here at the height of summer in light wind periods which can often be experienced on either side of a period of southerly to south south-east winds, which is a very hot wind direction for Jeddah.

Climate Analysis for Middle East Ports
Page 17 of 50
Figure 6: Google Earth image showing the location of Jeddah on the eastern side of the Red Sea. The Jeddah Islamic Port is located at the bottom centre of the image with The Jeddah (King Abdul Aziz International) Airport at the top of the image. There is a considerable amount of shipping that passes Jeddah through the Red Sea and hence the radius used to aggregate the VOS data for this location is relatively small at around 1.2o. As Figure 7 shows, the region over which VOS data is aggregated is relatively evenly distributed to the north and south of Jeddah. Hence the VOS based wet bulb climatology as used for Jeddah Islamic Port is likely to be relatively representative of the conditions experienced by livestock in Jeddah Port. If anything, the VOS data is likely to include data from ships in the centre of the Red Sea where winds are more consistent resulting in marginally lower wet bulb temperatures, it is possible the VOS data would slightly under-estimate the “in-port” heat stress risk at this location.

Climate Analysis for Middle East Ports
Page 18 of 50
Figure 7: Larger scale Google Earth image of the eastern Red Sea centred on Jeddah. The 1.2o radius black ring shows the geographical extent of the region used for aggregating wet bulb temperature data. The alternative to this is to use land-based data. The most comprehensive weather data for this region is from the Jeddah (King Abdul Aziz International) Airport (Station ID 410240). The NNDC holds data for this location from January 1983 to December 2008. This is supplemented by data from the old Jeddah Airport (Station ID 404770), which is approximately 5km due east of the Islamic Port. Data is also available from the Jeddah Industrial Estate (Station ID 410200), which is around 2km inland from the Red Sea. Although none of these stations lies right on the Red Sea, during the light wind regimes when the wet bulb temperatures are at their highest, the conditions across the coastal zone of the Red Sea, which includes all of these stations, would be fairly similar. An initial analysis using approximately 10 years of data is shown in Appendix 3. In Figures 8, comparisons between the VOS and Jeddah (King Abdul Aziz) International Airport wet bulb temperatures are shown for the 50th and 98th percentiles. The Airport data is drier than the VOS data, although the differences are not as great as for some of the Middle East locations. This is due to the ship data collected over the open Red Sea region being from regions both north and south of the port of Jeddah. However, as the ship data is collected almost entirely away from the coast, the dry continental effects are again under-represented, leading to the VOS data portraying a slightly

Climate Analysis for Middle East Ports
Page 19 of 50
higher wet bulb temperature climatology than that experienced inside Jeddah Port. The VOS data is for 1991 to 2008 and the Jeddah data is from 1997 to February 2008.
(a)
(b) Figure 8: Comparisons between the HotStuff 3.0 Voluntary Observing Ship and Jeddah (King Abdul Aziz) International Airport wet bulb temperature observations for the (a) 50th and (b) 98th percentiles.
Climate Analysis for Middle East Ports
Page 20 of 50
4.1.4 Kuwait
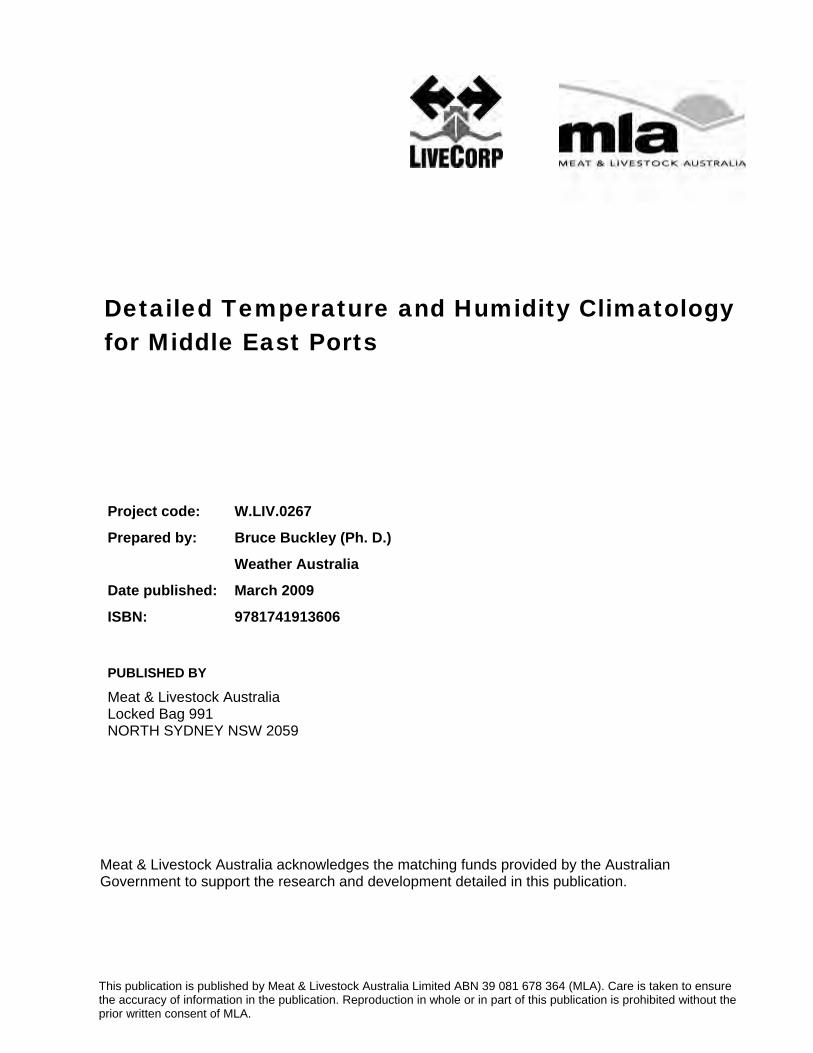
The Port of Kuwait (Figure 9) is essentially a land-locked port with desert on three sides. The wet bulb climate is quite continental in nature when the prevailing north north-westerly winds are blowing. It is only when the winds are from between the east north-east and south south-east that the wet bulb climate represents that of the open Arabian (Persian) Gulf.
Figure 9: Google Earth image showing the location of Kuwait on the northwestern corner of the Arabian Gulf (Persian Gulf). The Port is located at the top left of the image with the Kuwait International Airport at the lower centre of the image. As Figure 10 shows, the Port of Kuwait is situated in an inlet in the far northwest of the Gulf and the aggregation technique used for the VOS dataset extends out to a radius of 2o. This includes data from almost as far south as Al Jubayl and across to the eastern side of the Gulf. As the rise in wet bulb temperatures works its way northwards up the Gulf as summer progresses, this aggregation technique artificially lengthens the period of highest wet bulb temperatures at the Port of Kuwait, as well as raising the mean wet bulb temperature significantly above what it is likely to be for this region.

Climate Analysis for Middle East Ports
Page 21 of 50
Figure 10: Larger scale Google Earth image of the northwestern Arabian (Persian) Gulf showing the location of Kuwait. The 2.0o radius black ring shows the geographical extent of the region used for aggregating wet bulb temperature data. Data from the Kuwait International Airport (Station ID 405820) is likely to be of the highest quality of the available weather stations for Kuwait, being subject to the ICAO accuracy standards. The NNDC holds data for Kuwait International Airport for the period from August 1945 to December 2008. Appendix 4 shows the preliminary wet bulb temperature analysis for this location. As with other internationally exchanged datasets, the archives most likely hold data at 6 hourly time steps. The Department of Meteorology at Kuwait International Airport may hold hourly weather observations for this location. There are other datasets from across Kuwait of unknown quality that could prove useful. The weather station at Ahmadi New Oil Pier (Station ID 405830), a port-side location and with a dataset from August 1977 to May 2008, could be worthy of analysis in the future.

Climate Analysis for Middle East Ports
Page 22 of 50
(a)
(b) Figure 11: Comparisons between the HotStuff 3.0 Voluntary Observing Ship and Kuwait International Airport wet bulb temperature observations for the (a) 50th and (b) 98th percentiles.

Climate Analysis for Middle East Ports
Page 23 of 50
In Figures 11, comparisons between the VOS and Kuwait International Airport wet bulb temperatures are shown for the 50th and 98th percentiles. The much drier, more continental nature of the data for Kuwait International Airport can clearly be seen with the differences greater at the 50th percentile than for the 98th. The differences between the land based wet bulb temperature data and the VOS data for Kuwait is, for most months of the year, the largest for all of the port comparisons. Hence this is the location where the VOS data is least representative of the heat stress conditions likely to be experienced within the port of discharge. The land based wet bulb climatology is strongly preferred over the VOS climatology for this location. The VOS data is for 1991 to 2008 and the Kuwait data is from 1997 to February 2008 (Appendix 4). 4.1.5 Bahrain
The Port of Bahrain (Figure 12) is located on the north-eastern corner of the island of Bahrain, relatively close to the Bahrain International Airport. As Figure 12 clearly shows, this part of Bahrain has large areas of relatively shallow water. During the height of summer these shallow water areas could produce locally high wet bulb temperatures, although the relatively low-lying nature of the island means that the region is relatively well exposed to the prevailing winds, thus rapidly dissipating periods of high wet bulb temperature once the winds build through the Gulf.
Figure 12: Google Earth image showing the location of Bahrain Port and Airport on the western side of the Arabian Gulf (Persian Gulf).

Climate Analysis for Middle East Ports
Page 24 of 50
Figure 13 shows the region of the Gulf over which the VOS data has been aggregated for the Port of Bahrain. Although the port is centrally located within this region, it is not clear how well the VOS data would capture the finer detail of the Bahrain wet bulb temperature climatology. It is assessed that the VOS dataset should provide an adequate assessment of the wet bulb climatology for Bahrain, although the fact that the VOS data spans such a large part of the Arabian Gulf makes it unlikely the local scale features would be entirely captured by the analyses.
Figure 13: Larger scale Google Earth image of the western Arabian (Persian) Gulf showing the location of Bahrain. The 1.5o radius black ring shows the geographical extent of the region used for aggregating wet bulb temperature data. The best wet bulb climatology for the Port of Bahrain is likely to be based upon the wet bulb temperature observations from Bahrain International Airport (Station ID 411500). Observations from this location are subject to ICAO observation standards and hence should be reliable. An analysis of wet and dry bulb temperatures for this location, based upon approximately one decade of data, can be found in Appendix 5. The NNDC holds data for this location for the period from January 1944 through to December 2008, most likely in six hourly time steps. Higher (hourly) weather observations may be available from the Bahrain Meteorological Directorate. Other weather stations on Bahrain

Climate Analysis for Middle East Ports
Page 25 of 50
have a very limited length of record with unknown data quality and hence are not likely to add much value to the analyses. Comparisons between the VOS and Bahrain International Airport wet bulb temperatures are shown for the 50th and 98th percentiles (Figure 14a and b respectively). Being essentially a maritime location, the data for Bahrain International Airport can clearly be seen to be relatively close to the VOS data, particularly at the 50th percentile. Differences are slightly larger for the 98th percentile during the height of summer when some continental influences extend as far off the Arabian Peninsula as Bahrain. The VOS data is for 1991 to 2008 and the Bahrain data is from 1997 to February 2008.
(a)

Climate Analysis for Middle East Ports
Page 26 of 50
(b) Figure 14: Comparisons between the HotStuff 3.0 Voluntary Observing Ship and Bahrain International Airport wet bulb temperature observations for the (a) 50th and (b) 98th percentiles. 4.1.6 Dhahran / Ad Dammam
The port of Ad Dammam is relatively exposed to the Arabian Gulf and the land in this region is very flat (see Figure 15). All would be relatively well exposed to the prevailing winds which blow down the Arabian Gulf for much of the year. This side of the Gulf tends to be relatively shallow and with the Gulf of Salwa to the south, this region could be susceptible to periods of very high wet bulb temperature from time to time. The Gulf of Salwa has one of the highest measured sea surface temperatures of any oceanic Gulf in the world and hence could be a source of air with an extremely high wet bulb temperature. Fortunately, winds from the south southeast which blow over the Gulf of Salwa are not common in this region.

Climate Analysis for Middle East Ports
Page 27 of 50
Figure 15: Google Earth image showing the location of ports in the Dhahran – Ad Dammam – Al Khobar region of eastern Saudi Arabia. The Dhahran Airport is located just south of the location of Az Zahran on this image. In Figure 16, the region over which the VOS data is aggregated is shown by the black circle. Although this circle includes the Gulf of Salwa it is unlikely there would be any VOS ships operating in this region and hence the effects of this Gulf would not be captured in the dataset. The most positive aspect of the VOS data is that Dhahran is quite centrally located within the region over which the VOS data is aggregated. This dataset is more likely to represent the conditions over the open waters of the Gulf, with the near-coastal effects being less well captured.

Climate Analysis for Middle East Ports
Page 28 of 50
Figure 16: Larger scale Google Earth image of the western Arabian (Persian) Gulf showing the location of Dhahran / Ad Dammam. The 1.7o radius black ring shows the geographical extent of the region used for aggregating wet bulb temperature data. Until the King Fahd International Airport was opened in around 1990, the Dhahran Airport served as the main international airport for the eastern province of Saudi Arabia. It still serves as a major regional airport hub. The observations program has been subject to ICAO observational standards for much of its history and hence the dataset should be of relatively high quality. As Figure 16 shows, the Dhahran Airport (Station ID 404160) is only around 6km inland from the coast as well as being situated on a peninsula. Thus, it is likely to closely represent the conditions experienced by livestock on ships in the adjacent ports. The NNDC holds data for Dhahran from February 1946 to December 2008, most likely in six hourly time steps. Hourly weather observations may be able to be obtained from the Presidency of Meteorology and Environment, situated in Jeddah. 4.1.7 Doha
This is a location where the wet bulb climatology of the Doha International Airport should be identical to that of the port, as they are situated adjacent to each other (see Figure 17). The coastline is also

Climate Analysis for Middle East Ports
Page 29 of 50
flat, so it would only be local obstructions within the port that could affect the wet bulb climatology. Hence the wet bulb climatology for the land based weather stations should quantify the heat stress risk to livestock on a ship in the port to a very high degree.
Figure 17: Google Earth image showing the location of port at Doha with the airport situated immediately to the south. In contrast to the land-based observations, the VOS data aggregation region is again quite large, as can be seen from Figure 18. It is also noted that in the Maunsell report Figure 3.2, the bulk of the ships that contribute observations into the Doha dataset appear to be traversing the central Gulf. Hence the climatology is more likely to represent conditions more than 100km offshore rather than in the port itself. Offsetting this to some extent is the fact that Doha is quite centrally located within the VOS data aggregation region. Being on the eastern coastline of Qatar, the near-shore effects at this port are likely to be far less than for other Middle East destinations. Hence, the VOS dataset would still be considered to provide a fair representation of the wet bulb climatology at the Port of Doha.

Climate Analysis for Middle East Ports
Page 30 of 50
Figure 18: Larger scale Google Earth image of the Qatar region of the Gulf showing the location of Doha. The 1.7o radius black ring shows the geographical extent of the region used for aggregating wet bulb temperature data. The NNDC holds data for two locations at Doha International Airport. The earliest data would be from the original Doha International Airport (Station ID 404280) with data available from January 1973 to June 2003 when the station was closed. An arguably better dataset is the new Doha International Airport (Station ID 411700), which is available from January 1983 to December 2008. A decade long climatology based upon data from the latter station can be found in Appendix 6. Both of these weather stations should have data at six hourly intervals and is likely to be of a high standard, the data having been subjected to ICAO observational standards. The NNDC also holds data for the Doha Port from January 1983 through to April 2004. This dataset would not have been subject to the same set of standards. However, having a comprehensive set of data from the nearby airport, it should be possible to identify whether or not this dataset is of a satisfactory quality. Comparisons between the VOS and Doha International Airport wet bulb temperatures are shown for the 50th and 98th percentiles in figure 5a and b respectively. As this location is well exposed to the open Arabian Gulf, like Bahrain, the Doha International Airport wet bulb temperatures can be seen to

Climate Analysis for Middle East Ports
Page 31 of 50
be relatively close to the VOS data, particularly at the 98th percentile. Differences are slightly larger for the 50th percentile as there tends to be greater continental influences than at Bahrain throughout the year. The VOS data is once more for 1991 to 2008 and the Doha data is from 1997 to February 2008.
(a)
(b) Figure 19: Comparisons between the HotStuff 3.0 Voluntary Observing Ship and Doha International Airport wet bulb temperature observations for the (a) 50th and (b) 98th percentiles.

Climate Analysis for Middle East Ports
Page 32 of 50
4.1.8 Dubai / Jebel Ali
The location of the Port of Jebel Ali is in an artificial indentation facing the waters of the Persian (Arabian) Gulf to the northwest (see Figure 20). The coastline has a northeast to southwest orientation on this part of the United Arab Emirates coastline.
Figure 20: Google Earth image showing the location of port at Jebel Ali in the lower left with the Dubai International Airport located in the top right of this image. The Dubai International Airport is just to the east of the Creek, a naturally occurring inlet in the downtown Dubai area, inland from the city of Dubai and is centred around 7km inland from the waters of the Gulf. The land in this area is very flat, with no natural obstructions to the winds blowing across the waters of the Gulf. However, there are very large areas of high rise building developments along sections of the Dubai coastline. These would provide local sheltering from the prevailing winds. It is thought that the exposure of the Port of Jebel Ali and of the Dubai International Airport to the winds blowing off the southern Gulf would be fairly similar. Hence, the climatological

Climate Analysis for Middle East Ports
Page 33 of 50
data from the airport should be similar to that of the port and the airport data should accurately represent the heat risk of a ship in Jebel Ali Port.
Figure 21: Larger scale Google Earth image of the eastern Gulf region centred on Dubai. The 1.7o radius black ring shows the geographical extent of the region used for aggregating wet bulb temperature data. The region for aggregating the VOS data is shown in Figure 21. From this it is apparent that the VOS data includes data from both inside the Arabian Gulf and also from ships in the Gulf of Oman, including those off Muscat and Fujairah. It would be desirable to exclude observations from outside of the Arabian (Persian) Gulf, as they are likely to adversely affect the wet bulb climatology as it relates to Jebel Ali Port. On the positive side of things, most of the ship observations would lie within approximately 150km of Dubai, where Dubai can be seen to be quite centrally located in the aggregation region. However, it is concluded that using data from the Dubai International Airport (Station ID 411940), available from the NNDC from January 1983 to December 2008, should provide a superior wet bulb climatology for Jebel Ali Port. Appendix 7 shows the Dubai data from 1997 to February 2008. Additional data is available from the old Dubai Airport (Station ID 404480) from June 1973 to December 1982. Both of these datasets should be available at six hourly intervals and should be of high quality, being subject to the ICAO observation standards. Data of unknown quality

Climate Analysis for Middle East Ports
Page 34 of 50
and time period may also be obtained from the National Centre for Meteorology and Seismology for Rashid Port / Ras Ganadah. It is not known how frequent this data was collected or how reliable the data would be.
(a)
(b) Figure 22: Comparisons between the HotStuff 3.0 Voluntary Observing Ship and Dubai International Airport wet bulb temperature observations for the (a) 50th and (b) 98th percentiles.

Climate Analysis for Middle East Ports
Page 35 of 50
In Figure 22 compares the VOS and Dubai International Airport wet bulb temperatures for the 50th and 98th percentiles. There are persistent continental influences at Dubai which tends to produce a slightly lower wet bulb temperature throughout the year than over the open waters of the Arabian Gulf. The VOS data is once more for 1991 to 2008 and the Dubai data is from 1997 to February 2008 (Appendix 7). 4.1.9 Fujairah
The Port of Fujairah (Figure 23) is only protected from the open ocean by a breakwater and is well exposed to the conditions experienced over the Gulf of Oman. Although this part of the UAE is relatively mountainous, the Fujairah Airport is also well exposed to the ocean, being between 2 and 3km inland from the coast over a flat coastal plain, apart from a low range of hills on the northeast side of the airport which are unlikely to affect the wet bulb temperature readings.
Figure 23: Google Earth image showing the location of port at Fujairah on the western edge of the Gulf of Oman with the Fujairah Airport located to the southwest of the city.

Climate Analysis for Middle East Ports
Page 36 of 50
Figure 24: Larger scale Google Earth image of the Gulf of Oman centred on Fujairah, located at the central blue square. The 1.3o radius black ring shows the geographical extent of the region used for aggregating wet bulb temperature data. The VOS aggregation region for Fujairah encompasses much of the Gulf of Oman, but also includes a little VOS data from inside the Arabian (Persian) Gulf (Figure 24). It would be desirable to exclude the data from inside the Arabian Gulf as the wet bulb climatologies are likely to differ. Given the open nature of the port at Fujairah, it is concluded that the VOS wet bulb climatology should generally represent the climatology experienced within the port. Land based data from the Fujairah International Airport (Station ID 411980) should also produce a good climatology, given its close proximity to the port and flat terrain in that particular location. The NNDC holds data for this airport from November 1988 to December 2008. As is the case for other international airports, the Fujairah dataset should be six hourly and be of a high quality, being subject to ICAO quality standards. 4.1.10 Muscat
The Port of Muscat (Figure 25) has the most topographically influenced climates of all of the Middle East Ports. Matrah port, just to the northwest of the city of Muscat, is the port used for the livestock trade. A detailed view of the Matrah Port shown in Figure 26 shows the port to be ringed by

Climate Analysis for Middle East Ports
Page 37 of 50
significant mountains on three sides which are likely to result in this port having a micro-climate of its own, not well represented by weather observations taken outside of the port and town location.
Figure 25: Google Earth image showing the location of port at Muscat (Matrah) on the southern edge of the Gulf of Oman with Seeb International Airport located to the west of the port. The availability of suitable historical weather observations for this region is less clear. The Seeb (Muscat) International Airport should be the most reliable weather station in the region. It is likely the wet bulb temperatures within the Port of Matrah could well be higher than those measured at Seeb for days in which there is little wind at the port. The NNDC holds data for this station (Station ID 412560) for the period from January 1944 to December 2008. The land based data used for Figure 29 was based upon data from the real-time data feeds for Seeb and spanned the period from 1997 to February 2008 (Appendix 8). An investigation of other weather stations in Oman has indicated that there is potentially weather data available for a weather station named Mina Sultan Qaboos (Station ID 12580) for the period from 1983 to 2008. This weather station is within the Matrah region at an elevation of 4m, although the latitude and longitude of this station is not provided with sufficient precision to identify exactly where it is within Matrah. The quality, location and frequency of observations from this station is not known. More details on this datasets should be available by contacting the Meteorology Department in the Directorate General of Civil Aviation and Meteorology.

Climate Analysis for Middle East Ports
Page 38 of 50
Figure 26: Detailed Google Earth image showing the marked topographical features surrounding the Port at Matrah (near Muscat). The VOS dataset for this location is aggregated over the smallest area for all ports, being the VOS data within approximately 1o of the port (see Figure 28). The Port at Muscat is also centrally located in the data collection region, further increasing the degree to which the data should, all things being equal, represent the data at the port. Countering this is the fact that the ocean is quite deep in the Gulf of Oman off Muscat and there are likely to be steep gradients in wet bulb temperatures during times when the south west monsoon is active through the Arabian Sea. During these periods, which occur at the peak of the northern hemisphere summer, there is an arm of the monsoon that curves into the Gulf of Oman as a persistent east south-easterly airflow which tends to be strongest through central and northern parts of the Gulf of Oman. There is a persistently weaker wind region close to the coast of Oman, notably the region near Muscat.

Climate Analysis for Middle East Ports
Page 39 of 50
Figure 27: Quikscat ocean surface wind image for 0203UTC 18 July 2008 (Image courtesy of NOAA / NESDIS/Office of search and Applications). An example of this wind regime is shown in Figure 27, where a sea surface wind image from the Quikscat satellite is shown for 18 July 2008. There is also likely to be a corresponding strong gradient in wet bulb temperatures with higher wet bulb temperatures close to the coast and particularly inside the port area during these weather situations. The VOS data is likely to produce a wet bulb temperature climatology that is weighted slightly towards the offshore conditions rather than the localised near-shore and in port conditions.

Climate Analysis for Middle East Ports
Page 40 of 50
Figure 28: Larger scale Google Earth image of the Gulf of Oman centred on Muscat. The 1.0o radius black ring shows the geographical extent of the region used for aggregating wet bulb temperature data.

Climate Analysis for Middle East Ports
Page 41 of 50
(a)
(b) Figure 29: Comparisons between the HotStuff 3.0 Voluntary Observing Ship and Muscat (Seeb) International Airport wet bulb temperature observations for the (a) 50th and (b) 98th percentiles.

Climate Analysis for Middle East Ports
Page 42 of 50
Figure 29 highlights comparisons between the VOS and Seeb (Muscat) International Airport wet bulb temperatures for the 50th and 98th percentiles. The comparisons show different characteristics for this location compared to all the other Middle Eastern ports. The land-based Seeb International Airport data is equal to or higher than the VOS data at the 50th percentile level from June through to September, during the period of time that the SW monsoon is dominating the weather across the Arabian Sea. This wind regime swings to an easterly through the Gulf of Oman as illustrated in Figure 27 and it is possible that within the Matrah Port area, wet bulb temperatures are even higher than at Seeb through this period of time. The VOS data is once more for 1991 to 2008 and the Seeb data is from 1997 to February 2008.
5 Conclusions and recommendations The suitability of the aggregated VOS data for adequately representing the expected wet bulb temperature conditions, and hence the likely heat stress risk to livestock, at the ten major ports of discharge used for the Australian Livestock Trade to the Middle East, was found to vary significantly from port to port. In most cases the land based historical observations are considered to provide more representative wet bulb climatologies than the corresponding VOS based climatologies. The monthly comparisons for the wet bulb temperature climatologies are shown in Figure 30 for the 50th and 98th percentiles for the seven Middle East ports for which wet bulb climatologies are included in the Appendices to this report for both land based and VOS data. Corresponding comparisons for VOS ship data alone are shown in Figure 31 and for land based data alone in Figure 32.

Climate Analysis for Middle East Ports
Page 43 of 50
(a)
(b) Figure 30: Comparisons between the HotStuff 3.0 Voluntary Observing Ship and Land based wet bulb temperature observations for the (a) 50th and (b) 98th percentiles for the 7 ports for which land based wet bulb climatologies have been prepared.

Climate Analysis for Middle East Ports
Page 44 of 50
VOS 50th Percentile Comparisons
10
12
14
16
18
20
22
24
26
28
30
January
February
March
April
May
June Ju
ly
August
September
October
November
December
Month
Wet Bulb Temperature
Aqaba VOS 50th
Jeddah VOS 50th
Kuwait VOS 50th
Bahrain VOS 50th
Doha VOS 50th
Dubai VOS 50th
Muscat VOS 50th
(a)

Climate Analysis for Middle East Ports
Page 45 of 50
VOS 98th Percentile Comparisons
10
15
20
25
30
35
January
February
March
April
May
June Ju
ly
August
September
October
November
December
Month
Wet Bulb Temperature
Aqaba VOS 98th
Jeddah VOS 98th
Kuwait VOS 98th
Bahrain VOS 98th
Doha VOS 98th
Dubai VOS 98th
Muscat VOS 98th
(b)
re 31: Comparisons between the HotStuff 3.0 Voluntary Observing Ship wet bulb temperature observations th and (b) 98th percentiles for the 7 ports for which land based wet bulb climatologies have been
prepared.
Figufor the (a) 50
Climate Analysis for Middle East Ports
Page 46 of 50
Land Based 50th Percentile Comparisons
5
10
15
20
25
30
January
February
March
April
May
June Ju
ly
August
September
October
November
December
Month
Wet Bulb Temperature
Aqaba Airport 50th
Jeddah Airport 50th
Kuwait Airport 50th
Bahrain Airport 50th
Doha Airport 50th
Dubai Airport 50th
Muscat Airport 50th
(a)

Climate Analysis for Middle East Ports
Page 47 of 50
Land Based 98th Percentile Comparisons
5
10
15
20
25
30
35
January
February
March
April
May
June Ju
ly
August
September
October
November
December
Month
Wet Bulb Temperature
Aqaba Airport 98th
Jeddah Airport 98th
Kuwait Airport 98th
Bahrain Airport 98th
Doha Airport 98th
Dubai Airport 98th
Muscat Airport 98th
(b) Fand (b) 98
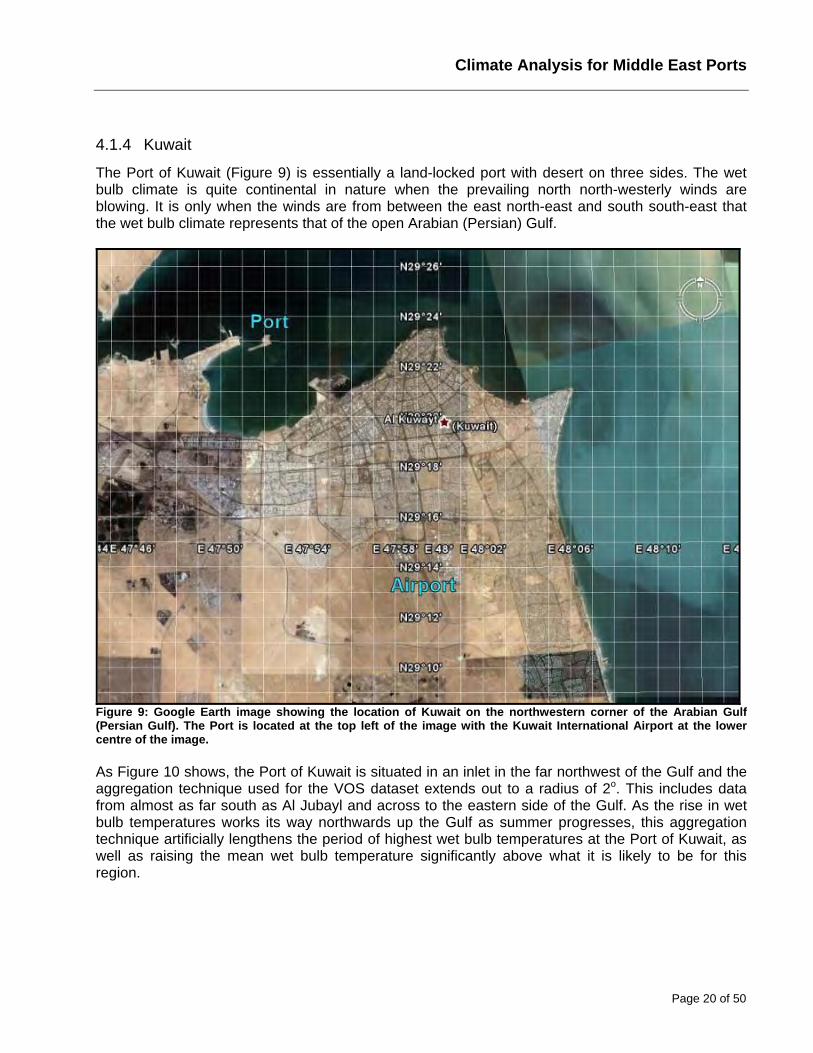
igure 32: Comparisons between the HotStuff 3.0 Land based wet bulb temperature observations for the (a) 50th th percentiles for the 7 ports for which land based wet bulb climatologies have been prepared.
Table 1 summarises the suitability of VOS wet bulb temperature data for each of the 10 Middle East ports that are of interest for the Australian live stock trade. In general, for the three northern-most ports of Adabiya, Aqaba and Kuwait, the VOS data is not likely to reflect the semi-continental nature of the wet bulb temperature climates of these locations, rather representing the oceanic climate of the enroute conditions, more than 100km south of the ports. For Muscat, neither the VOS nor Seeb International Airport data are considered to truly represent the wet bulb temperature regime at the Muscat port during periods of light winds. The Seeb data is assessed as being slightly more representative of the in-port conditions, but there may be alternative weather stations available. Contacting the Meteorology Department of Oman may identify additional more representative weather stations.

Climate Analysis for Middle East Ports
Page 48 of 50
Port VOS Data Suitability
Land Based Stations Comments
Adabiya Not suitable Port Tawfik, El-Suez VOS data biased to more southern conditions
Aqaba Not suitable Aqaba Airport, Eilat VOS data biased to more southern conditions
Jeddah Generally suitable
Jeddah (King Abdul Aziz) International Airport, Jeddah I.E.
Both should be suitable
Kuwait Not suitable Kuwait International Airport, Ahmadi New Oil Pier
VOS data biased to more southern conditions
Bahrain Generally suitable
Bahrain International Airport Airport preferred as it has similar climate to port
Dhahran Generally suitable
Dhahran Airport Airport preferred as it is adjacent to port
Doha Generally suitable
Doha International Airport (new and old)
Airport preferred as it is adjacent to port
Dubai Generally suitable
Dubai International Airport, Rashid Port / Ras Ganadah
Exclude Gulf of Oman data from VOS analysis
Fujairah Generally suitable
Fujairah Airport Exclude Persian Gulf data from VOS analysis
Muscat Limited applicability
Seeb International Airport Data from Mina Sultan Qaboos should be investigated
Table 1: Summary of the suitability of the VOS data to represent in-port wet bulb temperature climatology, with best available land-based weather stations as alternative data sources. It is recommended that the land-based wet bulb temperature climatologies that have been prepared for 7 of the 10 ports, and are included as appendices to this report, be incorporated into the port of discharge component of HotStuff 3.0, noting that climatologies were prepared using only approximately a decade of historical data due to the limited time frame associated with the initia
roach to the author of this review.
stations ear each port of discharge be acquired, with priority given to the three ports where the VOS data as lower applicability and for the three locations for which the is currently no land based
ta, if it has been archived within each
istorical data. No provision is made for the ffects of climate change, noting that the Middle East region is predicted to experience significant
l app It is further recommended that the complete historical weather data for the relevant weathernhclimatology. Local assistance would be required for suitable contacts to be made with the National Weather Services in most of the Middle East countries for formal approval processes for the datasets and to access hourly wet bulb temperature dacountry. It should also be noted that, although outside the scope of this project, it is possible to provide predictions of expected weather conditions for the times of arrival of the livestock carrying vessels to assist in decisions made to avoid major heat stress events during the period of the animal discharge. Moderately high resolution numerical weather predictions are available for the Middle Eastern region on a routine basis. It must also be noted that these climatologies relate to ha

Climate Analysis for Middle East Ports
Page 49 of 50
n tem unquantified e wet bulb climates of the ports .
p
p ource
rises i perature during the of discharge
next few decades with effects on th
6 Ap endices
6.1 Ap endix 1 – S s of Meteorological Information
This appMiddle E
en potenas the n on the ccess ttr , the in ration h
be con stance within each ct datase
pp qaba
dix contains t who own
tial contact points for the National Meoriginal datasets of potential intere
teorological Services across the st to the Livestock trade. For
compreheof the ins
sive detailsumentation
historical data and possible astrumentation types and calib
o metadata concerning the siting istory of these weather stations,
these agenaccess to
cies shouldhe required
tacted. Local assits.
ountry would be required to gain
6.2 A endix 2 – A Daily Wet Bulb Climatology and Spreadsheets
This appe ins the uspreadshee data is o
6.3 Appendix 3 – Jeddah Daily Wet Bulb Climatology and Spreadsheets
ndix contat with the
detailed daily wet bulb temperatn the attached DVD.
re climatology for Aqaba. A
This appe the detailed daily wet bulb temperature climatology for Jeddah. A preadsheet with the data is on the attached DVD.
ndix containss 6.4 Appendix 4 – Kuwait Daily Wet Bulb Climatology and Spreadsheets
This appendix contains the detailed daily wet bulb temperature climatology for Kuwait. A spreadsheet with the data is on the attached DVD. 6.5 Appendix Bahrain Daily Wet Bulb Climatology and Spreadsheets
This appendix contains the detailed daily wet bulb temperature climatology for Bahrain. A spreadsheet with the data is on the attached DVD. 6.6 Appendix 6 – Doha Daily Wet Bulb Climatology and Spreadsheets
This appendix contains the detailed daily wet bulb temperature climatology for Doha. A spreadsheet ith the data is on the attached DVD. w
6.7 Appendix 7 – Dubai Daily Wet Bulb Climatology and Spreadsheets
This appendix contains the detailed daily wet bulb temperature climatology for Dubai. A preadsheet with the data is on the attached DVD. s

Climate Analysis for Middle East Ports
Page 50 of 50
6.8 Appendix 8 – Muscat Daily Wet Bulb Climatology and Spreadsheets
This appendix contains the detailed daily wet bulb temperature climatology for Muscat (Seeb). A preadsheet with the data is on the attached DVD. s