Embed Size (px)
Citation preview

P12452 – Vibration Isolation and Novel Cooling System
Detailed Design Review
February 17, 2012

Agenda
• Team Members and Support (1 min) • Project Background (5 min) • Customer Needs (2 min) • Updated Engineering Specs (5 min) • Risk Management (5 min) • Proposed Design Overview (10 min) • Detailed Analysis (30 min) • Bill of Materials (15 min) • Testing (10 min) • MSD II Deliverables & Schedule (10 mins) • Q&A (10 min)
2

Members
Team John Burns – Project Manager Ryan Hurley – Principle Engineer Chris Guerra – Thermo-Fluids Engineer Matt Kasemer – Vibrations Engineer Support Bill Nowak – Faculty Guide Dr. Jason Kolodziej – Primary Customer Scott Delmotte – Dresser-Rand Contact James Sorokes – Dresser-Rand Contact
3

PROJECT BACKGROUND
4
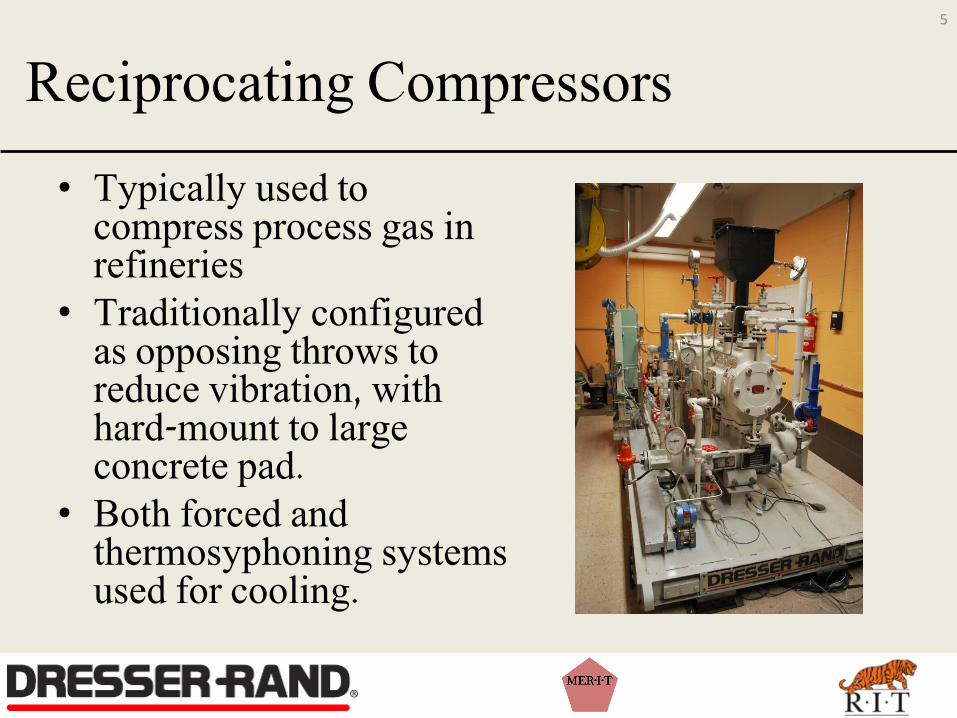
Reciprocating Compressors
• Typically used to compress process gas in refineries
• Traditionally configured as opposing throws to reduce vibration, with hard-mount to large concrete pad.
• Both forced and thermosyphoning systems used for cooling.
5
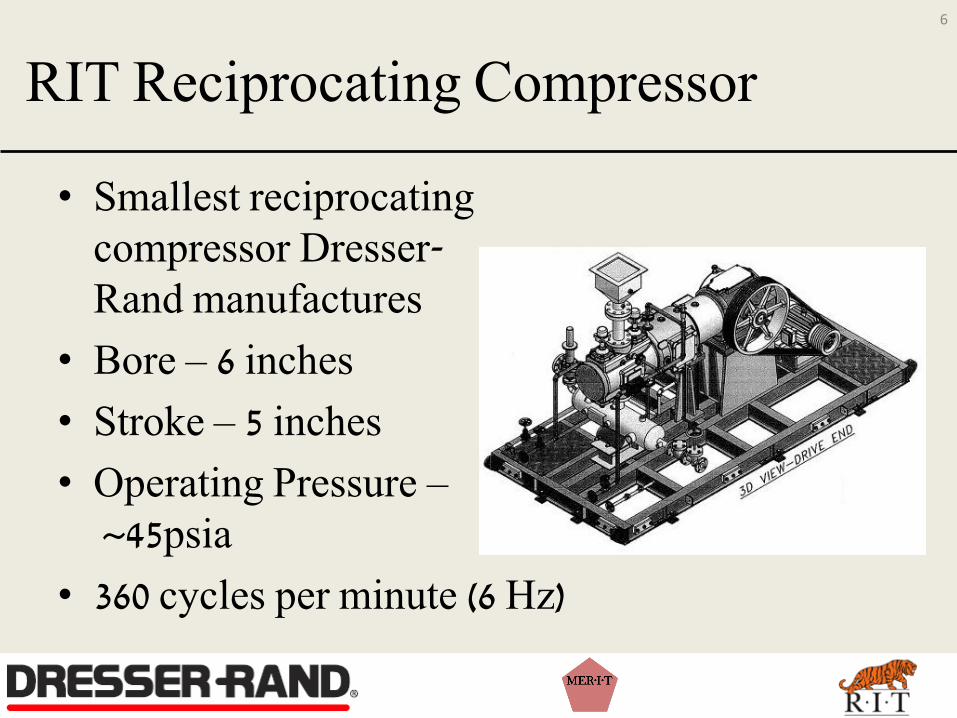
RIT Reciprocating Compressor
6
• Smallest reciprocating compressor Dresser- Rand manufactures
• Bore – 6 inches
• Stroke – 5 inches
• Operating Pressure – ~45psia
• 360 cycles per minute (6 Hz)
P12452 Project Scope
• Understand operating conditions of the compressor
• End Goals
– Design, evaluate, install and test a vibration isolation system.
– Design, evaluate, implement and analyze a thermosyphoning system.
7

CUSTOMER NEEDS
8

Vibration System Needs
9
CN# Description Weight
1. Vibration Damping System
1.1 Reduce motion ~50% 9
1.2 Design System to be removable 3
1.3 Keep work area around compressor manageable and safe 3

Cooling System Needs
10
CN# Description Weight
2. Thermosyphoning Coolant System
2.1 Thermosyphoning system works comparable to current pump-based system 3
2.2 System must keep pump at safe operating temperature 9
2.3
Design system so that it can easily switch back and forth between thermosyphoning system and pump-based system 3
2.4 Design system so it is mounted in a fashion that does not obstruct movement around the compressor 1
2.5 Design system so it does not require any external power 9

UPDATED ENGINEERING SPECIFICATIONS
11

Engineering Spec’s - Vibration
12
Engineering Specifications Vibration Isolation System
# Specification Goal Value Acceptable Range Units
ES 10 Reduction in deflection 50 > 50 %
ES 11 Number of on-compressor mounts 2 < 4 #
ES 12 Number of off-compressor mounts 2 < 4 #
ES 13 Total Damping Coefficient for System 119500 >119500 N-s/m

Engineering Spec’s - Thermosyphoning
13
Engineering Specifications Thermosyphoning Coolant System
# Specification Goal Value Acceptable Range Units
ES 1 Efficiency TS v Efficiency Forced 100 > 80 %
ES 2 Environmental safety of coolant Go Go/No-Go --
ES 3 Valve and piping losses 5 <10 m
ES 4 Thermal efficiency of system 90 > 80 %
ES 5 External Power Consumption 0 0 Watts
ES 6 Weight of filled coolant tank 7 < 10 kg
ES 7 Number of mounting points 9 < 12 --
ES 8 Durability of system Go Go/No-Go --
ES 9 Insulation's environtmental safety Go Go/No-Go --

RISK MANAGEMENT
14

15
Risk # Risk Item Effect Cause Likelihood Severity Importance Mitigation Action Owner
R6 Damping analysis performed incorrectly
System is not properly damped
Poor implementation of engineering principles
5 9 45 Perform thorough analysis and obtain input from experts
Matt
R7 Thermosyphoning analysis performed incorrectly
Thermosyphoning system does not work
Poor implementation of engineering principles
5 9 45 Perform thorough analysis and obtain input from experts
Chris
R16 System introduces unforseen vibration
Pump is damaged, building is damaged
Poor implementation of engineering principles
5 9 45 Perform thorough engineering analysis prior to installation
Matt
R17 Concerete cannot support mounts for dampers
Building is damaged, pump might be damaged
Poor implementation of engineering principles
5 9 45 Perform thorough engineering analysis prior to installation
Ryan
R21 Damping system damages physical plant
Building is damaged, pump might be damaged
Poor planning; Poor implementation of good plans
5 9 45 Plan thoroughly, and ensure that failsafe measures are in place
Ryan
R26 Design does not properly damp system
Pump is damaged Poor design or poor manufacturing
5 9 45 Peform a thorough analysis, and solicitic expert and faculty input
Matt
R27 Systems fails catestrophically
Pump is destroyed, building is seriously damaged
Poor design, poor manufacturing, or poor installation
5 9 45
Perform a thorough analysis, a thorough installation, and double-check everything before starting the pump.
All
R2 Ordered Parts are not ordered on time
Adjust Schedule; Worst-case, adjust project goals
Poor planning on the team's part
5 7 35 Create design plan, check-in with group members, build-in buffer time for emergencies
John
R9 Parts manufactuered improperly
Parts do not fit or system fails catestrphically
Poor design or poor manufacturing
5 7 35 Ensure that everyone is trained and comfortable on the given machine
Ryan

16
Risk # Risk Item Effect Cause Likelihood Severity Importance Mitigation Action Owner
R19 DAQ inteferes with thermosyphoning system
DAQ or thermosyphonings system needs to be modified
Poor communication between SD teams
7 5 35 Plan and communication with the other team, plan thoroughly
Chris
R22 Trip hazard from damping system
Team member/faculty/staff get hurt
Bad planning for safety concerns
7 5 35 Design a cover that preventing tripping hazards
Ryan
R23 Thermosyphoning system mounting fails
Team member/faculty/staff get hurt; pump is damaged; building is damaged
Poor design or poor manufacturing
5 7 35 Perform thorough analysis prior to manufacturing and installation, assemble according to plan
Chris
R24 Thermosyphoning system does not properly cool pump
Pump is damaged or destroyed
Poor health monitoring or poor design of cooling system
5 7 35 Ensure that the existing pump system can be switched to quickly
Chris
R10 Pump is run while "down" for installation
Pump is damaged or destroyed
Failure to follow Lock-Out, Tag-Out Proceedure; poor communication
3 9 27 Follow Lock-Out, Tag-Out proceedures, continuous communication between groups
John
R12 Compressor is damaged during installation
Pump is damaged or destroyed
Lack of training or planning
3 9 27 Follow safe practices, do not work alone, stop if unsure.
All
R15 Contract engineers do not do properly perform analysis
System fails catestrphically Poor choice of contract engineering firm
3 9 27 Ensure that the contract firm is qualified for the job
All
R11 Injury during installation
Team member/faculty/staff get hurt
Lack of training or unsafe practices
5 5 25 Follow safe practices, do not work alone, stop if unsure.
All
R18 DAQ interfers with dampers
DAQ or damping system needs to be modified
Poor communication between SD teams
5 5 25 Plan and communication with the other team, plan thoroughly
Matt

17
Risk # Risk Item Effect Cause Likelihood Severity Importance Mitigation Action Owner
R20 DAQ installation is damaged
DAQ system is no longer functional
Poor communication between SD teams; poor installation processes
5 5 25 Plan and communication with the other team, plan thoroughly, and install very carefully
All
R25 Thermosyphoning system leaks
Pump is damaged, building is damaged
Poor installation or design quality
5 5 25 Perform a high-quality installation Chris
R1 Ordered Parts do not arrive on time
Adjust Schedule; Worst-case, adjust project goals
Not enough lead time, failure of shipper or supplier
3 7 21 Create design plan, check-in with group members, build-in buffer time for emergencies
All
R13 Contract engineers run over budget
Funding for other components is missing
Poor planning or unforseen problems
3 7 21 Perform thorough planning prior to starting work
John
R14 Contract engineers fail to install mounts properly
System fails catestrphically Poor choice of contract engineering firm
3 7 21 Ensure that the contract firm is qualified for the job
Ryan
R8 Injury during part manufacturing
Team member/faculty/staff get hurt
Lack of training or unsafe use of machines
3 5 15 Ensure that everyone is trained and comfortable on the given machine
Ryan
R4 Engineering Specs are incorrect
Improper models created and project fails
Failure to perform proper engineering verification
1 9 9 Verify specs with knowledgable authorities and engineering principles
All
R5 No Funding Adjust schedule, limit project goals
Budget constraints, team failure
1 9 9 Focus more energy on fundraising and sponsorship
All
R3 Incorrect parts delivered
Adjust schedule. Supplier Failure 1 7 7 Build-in buffer time for emergencies All
Primary Risks
• Vibration or Thermosyphoning analysis are done incorrectly – Perform thorough analysis and obtain input from
experts
• System Fails Catastrophically – Perform a thorough analysis, a thorough installation,
and double-check everything before starting the compressor
• Concrete cannot support mounts for dampers – Perform thorough engineering analysis prior to
installation
18

PROPOSED DESIGN OVERVIEW
19

Proposed Vibration Isolation Solution
• Magneto-Rheological (MR) dampers mounted between crane hooks and mounts off compressor
• Adjustable damping
• LORD is willing to sponsor the shocks and donate them
• Meet safety requirements
20

Vibration Isolation CAD
21

Proposed Thermosyphoning System
• No use of power and easily modified to fit into current system
• Mounted close to compressor
• Valves on pipes to change from forced to thermosyphoning
• Finned tubing used to remove heat from system
• Piping diameters same as forced cooling system
22

Thermosyphoning CAD
23

Design Choice Justification
• 2 Proposed Solutions at Systems Design Review: – Ordinary vehicle shock absorbers
– LORD Corp. Magneto-Rheological shock absorbers
• Similarities of two systems allow for parallel design paths to be pursued
• MR dampers and car-style dampers were the clear winners over the other concepts per the Pugh process.
24

Design Choice Justification
• MR Dampers were decided to be the team’s favored design for a number of reasons
– Price (LORD has agreed to donate shocks)
– Adjustability (electronically controllable)
– Safety (Does not require preloaded springs)
– Capacity (Safely handles our application)
– Form factor (Easily replaceable with conventional dampers if they prove to be unacceptable.)
25

DETAILED ANALYSIS
26

Vibration Analysis – Initial Model
• Gathered acceleration data on both ends of skid
• Created a Simulink model as a simple spring-mass-damper system
27
Theoretical Vibrations Model

Vibration Analysis – Current System
28
0 0.5 1 1.5 2 2.5 3 3.5 4 4.5 5-20
-15
-10
-5
0
5
10
15
20Model of Acceleration of Existing System
Time (s)
Accele
ration (
m/s
2)
Steady State Minimum: 11.4 m/s2
Steady State Maximum: 11.4 m/s2
Acceleration Model of Current System produced by Simulink modeling - very accurate to the empirical data collected - Steady state maximum and minimum: ±11.4 m/s2

Vibration Analysis – Current System
29
0 0.5 1 1.5 2 2.5 3 3.5 4 4.5 5-0.015
-0.01
-0.005
0
0.005
0.01
0.015Model of Deflection of Existing System
Time (s)
Deflection (
m)
Steady State Minimum: 0,8015 cm
Steady State Maximum: 0.8015 cm
Deflection model of current system produced by Simulink modeling - Steady state maximum/minimum: ±0.8015 cm - This is the value we need to reduce by 50%

Vibration Analysis – Initial Model
30
Used to determine the number of MR dampers necessary

Vibration Analysis – Initial Model
31

Vibration Analysis – MR System
32
Deflection Model of proposed MR Shock system optimized for ~50% deflection reduction, produced through Simulink modeling - Steady state maximum/minimum: ±0.405 cm, achieved with MR shocks set at 0.5A
0 0.5 1 1.5 2 2.5 3 3.5 4 4.5 5-6
-4
-2
0
2
4
6x 10
-3
Time (s)
Deflection (
m)
Model of Deflection for MR Dampers Optimized to 50% Deflection Reduction
Steady State Maximum: 0.405 cm
Steady State Minimum: -0.405 cm

Vibration Analysis – MR System
33
Force Model of proposed MR Shock system optimized for ~50% deflection reduction, produced through Simulink modeling - Steady state maximum/minimum: ±3520 N - This is the amount of force being translated to each MR Shock Absorbers
0 0.5 1 1.5 2 2.5 3 3.5 4 4.5 5-4000
-3000
-2000
-1000
0
1000
2000
3000
4000Model of Force for MR Dampers Optimized for 50% Deflection Reduction
Time (s)
Forc
e (
N)
Steady State Minimum: -3520 N
Steady State Maximum: 3520 N

Vibration Analysis – MR System
34
Deflection Model of proposed MR Shock system set at maximum damping, produced through Simulink modeling - Steady state maximum/minimum: ±0.2526 cm (~68% Reduction, achieved at 1A)
0 0.5 1 1.5 2 2.5 3 3.5 4 4.5 5-3
-2
-1
0
1
2
3
4x 10
-3
Time (s)
Deflection (
m)
Model of Deflection of MR Dampers at Maximum Damping
Steady State Maximum: 0.2526 cm

Vibration Analysis – MR System
35
Force Model of proposed MR Shock system set at maximum damping, produced through Simulink modeling - Steady state maximum/minimum: ±4661 N - This is the amount of force being translated to each MR Shock Absorber
0 0.5 1 1.5 2 2.5 3 3.5 4 4.5 5-6000
-4000
-2000
0
2000
4000
6000
Time (s)
Forc
e (
N)
Model of Force for MR Dampers at Maximum Damping
Steady State Maximum: 4661 N

Vibration Analysis – Shock Absorber
36
Deflection Model of proposed GK shock absorbers set at maximum damping, produced through Simulink modeling - Steady state maximum/minimum: ±0.3018 cm (~63% Reduction) - This is achieved using 4 dampers
0 0.5 1 1.5 2 2.5 3 3.5 4 4.5 5-4
-3
-2
-1
0
1
2
3
4
5x 10
-3
Time (s)
Deflection (
m)
Model of Deflection of Traditional Dampers at Maximum Damping
Steady State Maximum: 0.3018 cm
Steady State Minimum: -0.3018 cm

Vibration Analysis – Shock Absorber
37
Force Model of proposed GK shock absorbers set at maximum damping, produced through Simulink modeling - Steady state maximum/minimum: ±4483 N - This is the amount of force being translated to each shock absorber
0 0.5 1 1.5 2 2.5 3 3.5 4 4.5 5-5000
-4000
-3000
-2000
-1000
0
1000
2000
3000
4000
5000
Forc
e (
N)
Time (s)
Model of Force for Traditional Dampers at Maximum Damping
Steady State Maximum: 4483 N
Steady State Minimum: -4483 N

Mechanical Mounting Analysis
38
Bolt Load (N/bolt)
Max Shear (N/bolt)
Max Tensile (N/bolt)
Factor of Safety
¾”-10 3,107.3 136,067.959 294,774.617 (S) 43.7
5/8”-11 3,107.3 94,491.636 204,704.592 (T) 65.8
5/8”-11 2,330.5 29,000* 56,300* (S) 12.4
M12x1.5 2330.5 54,163.44 43,920 (S) 23.2
Component Max Stress (ksi)
Max Displacement (in)
Min. Factor of Safety
Compressor Mount
.725 .00002 44.5
Floor Mount 1.71 .0003 21
Baseplate 1.71 .0003 21
Brace 1.71 .0003 21
Design Goals •Very high factor of safety •Infinite life •Permanent Installation •Matainence-free •Safety
* Supplied by Hilti

Concrete Mounting
• Concrete mounting will consist of eight 5/8” studs sunk into the floor, and epoxied in place using Hilti HIT-HY 150 MAX adhesive.
• Hand calculations showed that bolt, not concrete shear was the governing factor
• Hilti supplies a proprietary software tool to help chose anchor combinations, which matched well with hand and table calculations.
39

Mounting Boss Analysis
40
Max Deflection: .00002 in
Cycles to Failure: >1,000,000 Max Stress: 5 MPa
Min F.o.S.: 44.5

Floor Assembly Analysis
41
Max Deflection: .0003 in
Cycles to Failure: >1,000,000 Max Stress: 11.8 MPa
Min F.o.S.: 21

Fatigue Analysis of Damper Bolts
• Due to design restrictions, it was necessary to use a significantly smaller bolt to mount the dampers.
• A fatigue study determined that fatigue failure would not be a source of concern.
42

Material Specifications
http://www.matweb.com/search/DataSheet.aspx?MatGUID=afc003f4fb40465fa3df05129f0e88e6&ckck=1
43
A36 Steel Plate was used as the material for this analysis.

FEA Validation
Stress = σ = W*L*c/I = Mc/I
Displacement = δ=-PL3/3EI = -ML2/3EI
44
Theoretical FEA % Diff.
Max Stress (ksi) 17,604 17,959 2%
Displacement (in)
.050 .044 13.6%
W8x58 W-flange I-Beam

Thermosyphoning Analysis
• First Law of Thermodynamics modified to Engineering Bernoulli
• Assumed – – Hot side at 43°C (~110°F), Cold side at 27°C (~80°F)
– Pressures are atmospheric
– Height difference is from hot discharge to lowest point
– Head loss used average density and velocity,
– 1” Schedule 80 piping for full system
45

Control Volume
46

Thermosyphoning Excel
47

Thermosyphoning Results
Heat Rate (W) Hot Temperature (°C)
Cold Temperature (°C)
Elevation (m) Flow Rate (l/min) (gpm)
4333.33 43 27 1.105 2.7 (.72)
4333.33 43 27 1.105 2.7 (.72)
4333.33 43 27 .9 2.7 (.72)
2000 43 27 1.105 1.26 (.33)
3758 43 27 1.105 2.36 (.62)
48
1 – Proposed design, absorbing all heat due to compression, No head loss 2 – Same as 1 except incorporating head loss 3 – Same as 2 except more compact design to reduce head losses 4 – Only taking 2000W of heat, solving for flow rate 5 – Same amount of heat current forced system

Finned Tubing Analysis
Manufacturer Material Diameter (in) Heat Rate (W/m) Length Needed (m)
Slant/Fin (Series 2000)
Cu/Al ¾ 8650 .5
Slant/Fin (Series 30)
Cu/Al ¾ 9230 .47
Slant/Fin (Multi/Pack 80)
Cu/Al 1 10095 .43
Trane (Series 40)
Steel 1 ¼ 14422 .3
Trane (Series 68)
Cu/Al 1 10962 .4
49
• Length Values based on 4333W heat removal • Max length available is 1.2 m • System comes into finned tubing at 1” Schedule 80

Thermosyphoning Conclusions
• Head loss not a major factor
• Heat rate and flow rate are linearly proportional
• Different finned tubing can be used in system
• Excel sheet can become flexible to solve for different parameters
50

BILL OF MATERIALS
51
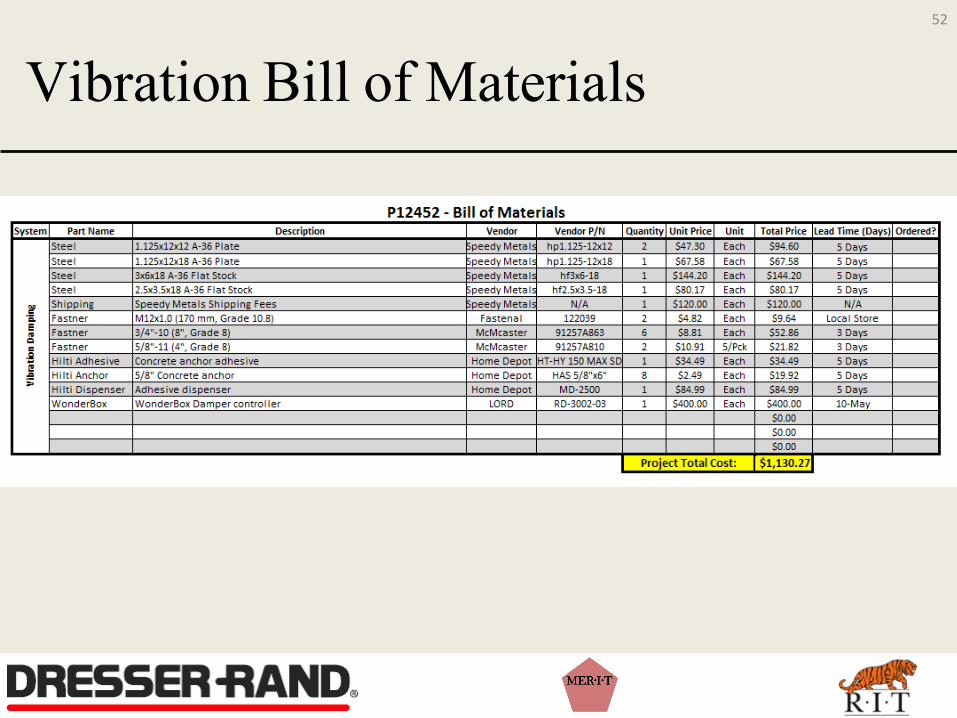
Vibration Bill of Materials
52

Thermosyphoning Bill of Materials
53

Major Expenses
• Flow Meter - $184 Total
• 3-way ball valves - 2 @ $228.45 Each - $457 Total
• 1” Flanges – 14 @ $9.75 Each - $136.50 Total
• Finned Tubing – 2 @ $35.65 Each - $71.30 Total
Total Cost Both Systems – $2175.93
54

TESTING
55

Vibration Test Plan
• Testing Will Utilize: – pre-installed accelerometers – pre-installed data acquisition unit – LabView data acquisition program created by P12453
• Testing will need to analyze four (4) vibration cases: – Before dampers are installed – After dampers are installed, but when turned off (new
baseline “un-damped” data) – With dampers at maximum setting (~65% vibration
reduction) – With dampers at 0.5 Amp power setting (~50% vibration
reduction)
56

Vibration Test Plan
• The testing will also need to encompass the following scenarios: – 0% Compressor Load – 50% Compressor Load – 100% Compressor Load – 0% 50% Transition – 50% 100% Transition – 100% 50% Transition – 50% 0% Transition – 100% Off Transition – 50% Off Transition – 0% Off Transition
• To acquire appropriate data: – All Scenarios A-J to be tested before new damping hardware installed (Case I above) – Scenarios A-C are to let the compressor reach steady (~2-3 mins) before acquiring data – Scenarios D-J are to start taking data during steady state, and continue collecting data
through the transition until the next steady state is reached – Approximately 5-10 seconds of data to be acquired in each case
57

Thermosyphoning Test Plan
• Testing Will Utilize: – Thermocouples installed by team P12453 – Additional thermocouples being installed by P12452 – Flow meter installed by team P12453 for pump-driven system – Flow meter being installed by P12453 for thermosyphoning system – Pre-installed data acquisition unit – LabView data acquisition program created by P12453
• Flow rate and temperature data will need to be acquired for three (3) different cooling cases: – Current existing pump-driven system, unmodified – Pump-driven system using modified plumbing to incorporate
thermosyphoning system; this case to be analyzed in order to ensure that the additional plumbing hardware does not inhibit the existing system
– Thermosyphoning system with entire pump-driven system plumbing closed off completely
58

Thermosyphoning Test Plan
• To acquire appropriate data:
– Pump must be allowed to reach a steady state temperature (~60 minutes)
– Temperature and flow rate data to be collected
– Temperature and flow rate to be factored in to calculating a corresponding heat transfer rate
– Data from case III to be compared to cases I and II from above. Case III should perform as well (down to 80% as well) as the other cases.
59

NEXT STEPS
60

MSD II Timeline – Weeks 1-5
61

MSD II Timeline – Weeks 6-11
62

Acknowledgments
• Dr. Stephen Boedo
• Dr. Marca Lam
• Dr. Mark Kempski
• Dr. Amitabha Ghosh
• Scott Delmotte
• LORD Corporation
63

Questions?
64