Embed Size (px)
Citation preview

23
2Designing an OutcomesResearch Study
David M. Radosevich
TYPES OF STUDY DESIGNS
A health outcomes research study design is a plan for executing thestudy. At a minimum, the design depicts the groups studied; for example,treatment and control group, instances of the treatment and the timing, andfrequency of health outcomes measures. The design provides a high-leveloverview of the health outcomes study and insights into the plan for analy-sis. Finally, the design should specify whether the individuals studied arerandomly assigned to either receive the treatment of interest or no treat-ment, also referred to as a control group.
Control over treatment assignment through randomization is the basisfor distinguishing two types of outcomes studies: experiments and quasi-experiments. Random assignment of subjects is central to controlling forextraneous differences between groups, but it does not guarantee compar-ability; it simply asserts that any differences are due to chance. Withoutrandomization of study participants, the outcomes researcher runs the riskof individuals with particular characteristics having a higher probability ofbeing included in the study or one of the study groups. These differencescan arise from patient self-selection or from clinician decisions about whoshould get treatment. Selection bias or self-selection has the potential toconfound the treatment-outcome relationship, thereby biasing results.Some of these differences can be measured and controlled for in the analy-sis, but others may remain unmeasured and uncorrected. Overall, selectionbias may be the greatest threat to the validity of health outcomes researchstudies.
34411_CH02_021_058 6/24/05 12:13 PM Page 23

Although the randomized controlled trial (RCT) is considered the “goldstandard” for clinical research, most outcomes studies are conducted asquasiexperiments, which lack control over the assignment of participantsto receipt of treatment. As a consequence, the outcomes researcher is facedwith controlling for self-selection and underlying differences betweentreatment and no treatment groups, by other means such as the timing ofthe outcome measurement (relationship to randomization? can be done inobservational studies) or statistical adjustment. Many treatments cannot bepractically investigated using an experimental design. In outcomes studiesconducted in health plans, fairness is a frequently voiced concern regard-ing allocating individuals on the basis of randomization (DiseaseManagement Association of America Outcomes Consolidation SteeringCommittee, 2004). Consequently, the quasiexperimental design, alsocalled the observational study (Kelsey, Whittlemore, Evans, & Thompson,1996), serves as the backbone of health outcomes research.
Self-Criticism in the Design Process
There is no perfect health outcomes research study. Every investigatormust weigh trade-offs between internally valid designs, like the RCTs, andquasiexperiments where inferences could be erroneous because of an inabil-ity to randomly assign treatments to study participants. Designing an out-comes research study requires a process of self-criticism and self-evaluation.This is accomplished by raising questions concerning the validity of thestudy design or the accuracy of inferences drawn. In this iterative process ofself-criticism, the outcomes researcher comes to recognize the imperfectionof the study design, its strengths and limitations, and identifies strategies forstrengthening the overall design. In truth, validity encompasses all the greyareas of research and is always context specific. It is mistaken to interpret thevalidity of study designs as simply good or bad.
The goal of a health outcomes research study is to achieve the bestapproximation of the truth of the treatment-outcomes relationship. Does agiven treatment cause a particular outcome? Understanding and evaluatingthe threats to the validity of human inferences about the results of an out-comes study is critical to success. This involves addressing four studydesign questions. The remainder of this chapter discusses the implicationsof these questions and the common threats to the validity of health out-comes studies.
24 CHAPTER 2 DESIGNING AN OUTCOMES RESEARCH STUDY
34411_CH02_021_058 6/24/05 12:13 PM Page 24

EVALUATING THE THREATS TO OUTCOMES RESEARCH
Validity concerns the truth or falsity of propositions about cause. (Cook& Campbell, 1979). Although a discussion of the multiple threats to studydesigns is outside the scope of this chapter, a selected few, which are fre-quently encountered in outcomes research study designs, need to be consid-ered in planning and implementation. They are listed in Table 2–1. For acomplete discussion of validity and study designs, the reader is referred tothe texts by Campbell & Stanley (1963); Cook & Campbell (1979); andShadish, Cook and Campbell (2002). For a more humorous treatment of va-lidity, also referred to as bias, see the papers by David Sackett (1979) andAlvin Feinstein (Feinstein, Sosin, & Wells, 1985).
Evaluating the Threats to Outcomes Research 25
Table 2–1 Adaptation of Cook and Campbell’s Scheme (1979) forClassifying Threats to the Validity of Health Outcomes Research
Internal Validity
• Statistical Conclusion
° Low statistical power° Fishing and error rate problems° Violated assumptions and inappropriate statistical tests° Reliability of measures° Inconsistent implementation of the intervention
• Internal Validity
° Selection° Regression to the mean° Attrition° Missing data° History
External Threats
• Construct Validity
° Inadequate conceptual design° Monooperation and monomethod biases° Treatment diffusion
• External Validity
° Person° Setting° Time
34411_CH02_021_058 6/24/05 12:13 PM Page 25

Internal Versus External Validity
Under Cook and Campbell’s scheme, threats to validity can be classifiedas either internal or external. This distinction neatly divides threats intothose that concern the validity of conclusions drawn about the relationshipbetween the treatment and the outcome and whether the results are exter-nally applicable to other persons, places, and time. Internal validity is theminimum necessary to interpret an outcomes study. All outcomes studiesneed to be internally valid; that is, the study design avoids errors that couldcompromise conclusions. For example, the researcher wants to avoid draw-ing spurious conclusions regarding results because the subjects in thegroups being compared are not comparable.
Issues around external validity concern the generalizability or represen-tativeness of study results. Can the results of an outcomes study be appliedacross different populations of persons, in different settings, and in otherperiods of time? Generalizability questions usually can be traced to themethods of recruitment of study subjects. RCTs have been criticized fortheir lack of generalizability, because study conclusions are limited to thepopulation being studied. Recruitment may employ strict inclusion andexclusion criteria for enrollment; therefore, individuals recruited bear littleresemblance to individuals seeking health care in the “real world.” ManyRCTs rely on volunteers, who themselves are highly self-selected. In con-trast with RCTs, quasiexperiments have the potential for being more rep-resentative.
Even RCTs can encounter selection bias when the rate of follow-up ispoor or even worse when it is different in treatment and experimentalgroups. The standard way to handle such loss is through a process known asintention to treat (ITT). Basically, the last observation is carried forward asthe final observation for that subject. Thus, someone who leaves treatmentearly is retained at the state when they were last observed. This approach isgenerally conservative for treatments designed to improve the situation, butit can have the opposite effect if the treatment is simply designed to slow therate of deterioration. Thus, it must be employed thoughtfully.
A second aspect of external validity concerns the validity of inferencesdrawn about higher order constructs or traits that cannot be directlyobserved. Can one generalize from the operational definitions used in thestudy to abstract constructs? From this perspective, external validity con-cerns the measurements concepts, the interrelationship of the conceptswith one another, and integrity of the treatment investigated. This form of
26 CHAPTER 2 DESIGNING AN OUTCOMES RESEARCH STUDY
34411_CH02_021_058 6/24/05 12:13 PM Page 26

validity is referred to as construct validity. There is a theoretical basis forconstruct validity in two approaches to constructing outcomes measures:latent-trait theory and factor analysis. According to latent-trait theory, theindividual’s responses to an item on an outcomes measure depend on thelevel of the attribute present (Streiner & Norman, 1995). Factor analysis,on the other hand, attempts to represent a set of variables as a smaller num-ber of constructs (Kim & Mueller, 1978). Both latent-trait analysis and fac-tor analysis are useful techniques for confirming construct validity.
Four Study Design Questions
The process for evaluating study designs was best articulated in educa-tional psychology by Campbell and Stanley (1963). Their disciples built onthis early work, expanding it to include applications in health servicesresearch, epidemiology, and clinical research. More recent work (Cook &Campbell, 1979; Shadish, et al., 2002) stressed the importance of four crit-ical questions in the design of scientific experiments. These questions,which reflect four major threats to the validity of outcomes study designs,have been restated to make them relevant to outcomes research.
1. Is there a relationship between the treatment and outcome? 3. Is the observed relationship between treatment and outcome causal? 4. What concepts explain the treatment outcome relationship? 5. How representative is the treatment and outcome relationship across
persons, settings, and times?
Each question relates to a form of validity: statistical conclusion, inter-nal, construct, and external validity respectively. The process of designinga health outcomes research study involves its critique and redesign.
Epidemiologists describe the threats to validity as biases or systematicerrors in the design or implementation of a study (Szklo & Nieto, 2000).In addition to confounding, biases are categorized according to type:selection or information. Selection bias was mentioned earlier.Information biases are unique to epidemiological studies and concernmisclassification of the treatment (or exposure), the outcome, and impre-cise definition of study variables. Two types of misclassification errors arerecognized in clinical studies. First, First, one could falsely conclude thatthe individual received the treatment of interest or has the outcome of
Evaluating the Threats to Outcomes Research 27
34411_CH02_021_058 6/24/05 12:13 PM Page 27

interest. These are referred to as false positives. The second type of mis-classification error is one in which the individual did not receive the treat-ment or the outcome of interest. These latter are referred to as falsenegatives. Together, these errors define the accuracy of treatment and out-comes measures, thereby defining the sensitivity and specificity of mea-sures (Szklo & Nieto, 2000). In applying the internal and external validityscheme discussed earlier, information biases bridge both forms of validity.Epidemiologists have recognized that misclassification significantlybiases the results of observational studies. For a full appreciation of howthese biases impact outcomes studies, several sources offer a fundamentalreview of epidemiological methods (Kelsey et al., 1996; Szklo & Nieto,2000). What follows is a brief review of threats to validity that are impor-tant in health outcomes research.
STATISTICAL CONCLUSION VALIDITY
Question 1: Is there a relationship between the treatment and the out-come? This statistical question concerns whether the treatment and theoutcome covary and the strength of association between them. Five threatsto statistical validity are commonly observed in outcomes research studydesigns. These include low statistical power, fishing and error rate prob-lems, violated assumptions of statistical tests, reliability of the outcomemeasures, and inconsistent implementation of the intervention.
Low Statistical Power
All too frequently, the first question asked by researchers is: how manysubjects do I need for my study? This question is always premature beforeplanning the study and preparing an analysis strategy. Planning for statisti-cal power begins by addressing the following questions:
• What is the research question?• Who is the target population?• How am I going to recruit study subjects?• How large an effect is expected?• How much variation is anticipated?
28 CHAPTER 2 DESIGNING AN OUTCOMES RESEARCH STUDY
34411_CH02_021_058 6/24/05 12:13 PM Page 28

• What analysis is needed to answer the question?• It is feasible to study the question?
All health outcomes studies need to be designed to detect differencesbetween persons receiving the treatment and those not receiving the treat-ment. The goal is to detect a true effect. Formally stated, the primary con-cern of statistical power is the likelihood of detecting the truth about thetreatment-outcome relationship.
The determinants of sample size can be best understood in the context ofhypothesis testing. For example, in a study to investigate the differencebetween the risk of occurrence of adverse outcomes between a “new” med-ical treatment e and usual care signified by c, one sets up a hypothetical testscenario as follows.
Null Hypothesis: Pe � Pc
Alternative Hypothesis: Pe � Pc
Where Pe represents the probability of the event among experimentalsubjects and Pc the probability of the event among controls
Statistics test the likelihood that an observed difference occurred bychance. Where In a study is designed to test for differences in the adverseevent rates between the “new” treatment and usual care, the determinant ofthe sample size is statistical significance level, also called the type I errorrate (�); it reflects the likelihood that one sees a difference that could sim-ply have occurred by chance. This is equivalent to the risk of drawing afalse conclusion that there is a difference between Pe and Pc. By contrast, atype II error claims no difference when in fact one exists. Statistical power,or one minus the type II error (�), is the probability of discovering a truedifference between Pe and Pc. Next, the size of difference consideredimportant is considered. The latter is defined in terms of the effect size, astandardized difference, which reflects how large a difference one wants tobe able to demonstrate statistically. Finally, one considers the number ofsubjects or the number of groups necessary. Examining the interrelation-ship of the type I error rate, the type II error rate, and the magnitude of theeffect being sought is referred to as statistical power analysis.
Many factors under the direct control of the outcomes researcher directlyaffect the statistical power of outcomes studies. Figure 2–1 shows theimpact of various threats to validity on sample size. In the center of the fig-ure, there is general function for estimating sample size (Friedman,
Statistical Conclusion Validity 29
34411_CH02_021_058 6/24/05 12:13 PM Page 29

Furberg, & DeMets, 1996). Delays in implementing a treatment interven-tion (lag), individuals not taking prescribed study medications (noncom-pliance), and treatments spilling over to individuals assigned to the controlgroup (diffusion, compensatory rivalry, and equalization), all increase thenumber of individuals needed to detect differences between treatment andcontrol groups. In the numerator, poor standardization of the study, indi-viduals being lost to follow-up (attrition), persons dying from causes otherthan target condition (competing risk), and selecting a health outcomemeasure with poor responsiveness characteristics inflate sample size. Lowstatistical power is a recurring threat to the validity of health outcomesresearch study designs. The best advice is to seek the consul of an expert,preferably someone who will conduct the analysis.
Planning and implementing a health outcome study is a collaborativeendeavor. Because statistical power is critical to the design and planning anoutcomes study, statistical power should always be specified in advancethrough an a priori power analysis. Using the results from published stud-ies and knowledge regarding the outcomes measure, it is possible to makean “educated guess” regarding the likely size of the effect of the interven-tion. This is quantified in terms of an effect size or detectable difference. It
30 CHAPTER 2 DESIGNING AN OUTCOMES RESEARCH STUDY
HealthOutcome
CompetingRisk
Lost toFollow-up
Lack ofStandardization
Compensatory Rivalry andEqualization
DiffusionNoncompliance
Lag
2 � Variability � [Constant (�,� )]2
Delta2
Figure 2–1 Threats to Validity and How They Impact on the Statistical Power ofa Health Outcomes Study
34411_CH02_021_058 6/24/05 12:13 PM Page 30

may be asked another way: How big a difference is needed to convince thetarget audience that the treatment effect is meaningful? Although thisenhances the efficiency of study designs and eliminates frivolous outcomesstudies, most statistical power analysis is done at the end of the study. Thispost hoc power analysis is only justified under circumstances in which theinvestigator lacks advanced knowledge regarding the size of treatment dif-ferences. Post hoc power analysis should always be done where no statisti-cally significant differences were found in the analysis to be sure a realdifference has not been overlooked. The sample size needed to support aclaim of no difference is usually much larger than that needed to show adifference.
The following are some guidelines for statistical power analysis.
• Consult with an expert; remember that statistical power analysis andestimating sample size is a collaborative endeavor.
• Sample size should be specified in advance. • Set standards for considering statistical power.
1. Type I error less than 5%3. Type II error less than 20%4. Lowest common denominator for comparison5. Plan for available data; response rates, eligibility, missing data
• Be guided by research objectives; consider monetary and indirectcosts.
• “Parameters on which sample size is based should be evaluated as partof interim monitoring.” (Neaton, 2001)
• Be conservative in estimates of statistical power.
Design a study for the smallest subgroup analysis planned and availabledata. Guided by the study objectives, always consider the monetary andnonmonetary costs of a study and be conservative in estimates. It is gener-ally a good idea to continuously evaluate the study assumptions as theresearch unfolds.
Most analysts perform statistical power analysis using any one or a com-bination of three resources. Formulas for the direct calculation of statisticalpower can be found in a number of different sources (Friedman, et al., 1996;Murray, 1998; Schlesselman, 1982). In general, most formulas incorporate
Statistical Conclusion Validity 31
34411_CH02_021_058 6/24/05 12:13 PM Page 31
measures of the type I error, type II error, and the effect size. The arith-metic expression in the center of Figure 2–1 provides a conceptual depic-tion of the interrelationship of these elements. Tables for frequently usedstatistical tests can be found in resources such as Cohen (1988). Finally,shareware over the Internet and commercial available software, such asnQuery Advisor (Elashoff, et al., 2000) are available.
Statistical power analysis calculations are more involved when it comesto multivariate analysis. Because these frequently involve complex compu-tations and multiple design parameters, these are best left to skilled biosta-tisticians, epidemiologists, and health services researchers.
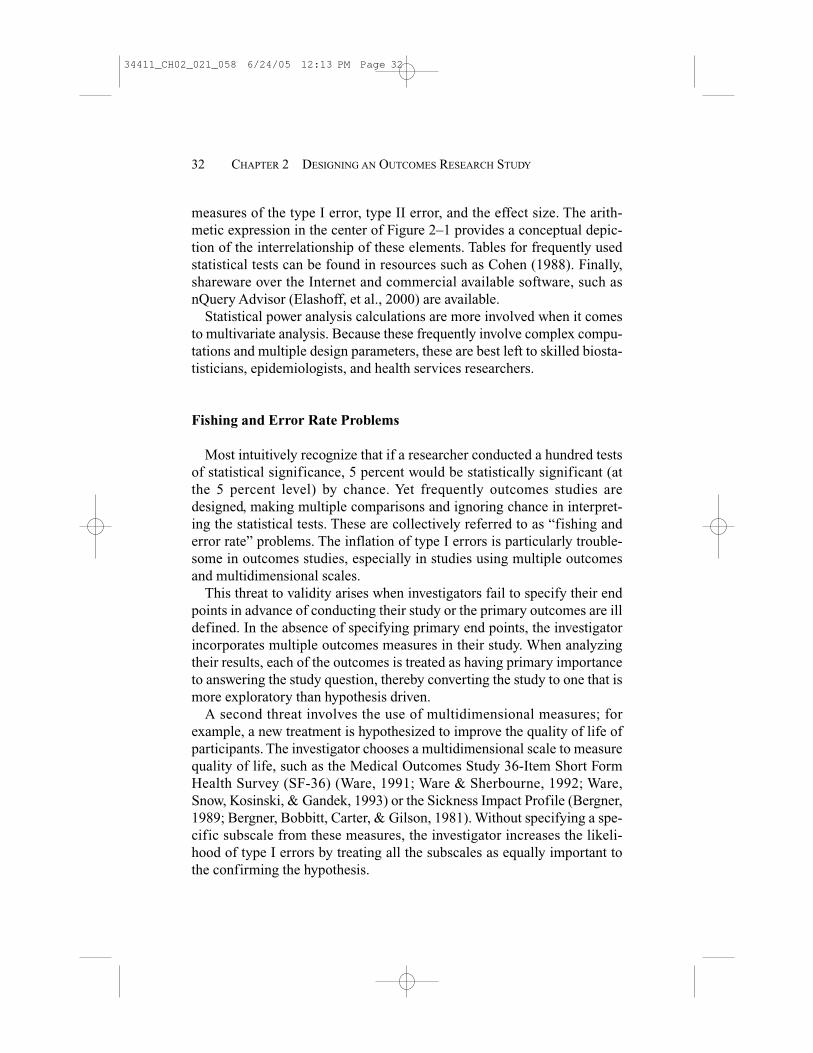
Fishing and Error Rate Problems
Most intuitively recognize that if a researcher conducted a hundred testsof statistical significance, 5 percent would be statistically significant (atthe 5 percent level) by chance. Yet frequently outcomes studies aredesigned, making multiple comparisons and ignoring chance in interpret-ing the statistical tests. These are collectively referred to as “fishing anderror rate” problems. The inflation of type I errors is particularly trouble-some in outcomes studies, especially in studies using multiple outcomesand multidimensional scales.
This threat to validity arises when investigators fail to specify their endpoints in advance of conducting their study or the primary outcomes are illdefined. In the absence of specifying primary end points, the investigatorincorporates multiple outcomes measures in their study. When analyzingtheir results, each of the outcomes is treated as having primary importanceto answering the study question, thereby converting the study to one that ismore exploratory than hypothesis driven.
A second threat involves the use of multidimensional measures; forexample, a new treatment is hypothesized to improve the quality of life ofparticipants. The investigator chooses a multidimensional scale to measurequality of life, such as the Medical Outcomes Study 36-Item Short FormHealth Survey (SF-36) (Ware, 1991; Ware & Sherbourne, 1992; Ware,Snow, Kosinski, & Gandek, 1993) or the Sickness Impact Profile (Bergner,1989; Bergner, Bobbitt, Carter, & Gilson, 1981). Without specifying a spe-cific subscale from these measures, the investigator increases the likeli-hood of type I errors by treating all the subscales as equally important tothe confirming the hypothesis.
32 CHAPTER 2 DESIGNING AN OUTCOMES RESEARCH STUDY
34411_CH02_021_058 6/24/05 12:13 PM Page 32
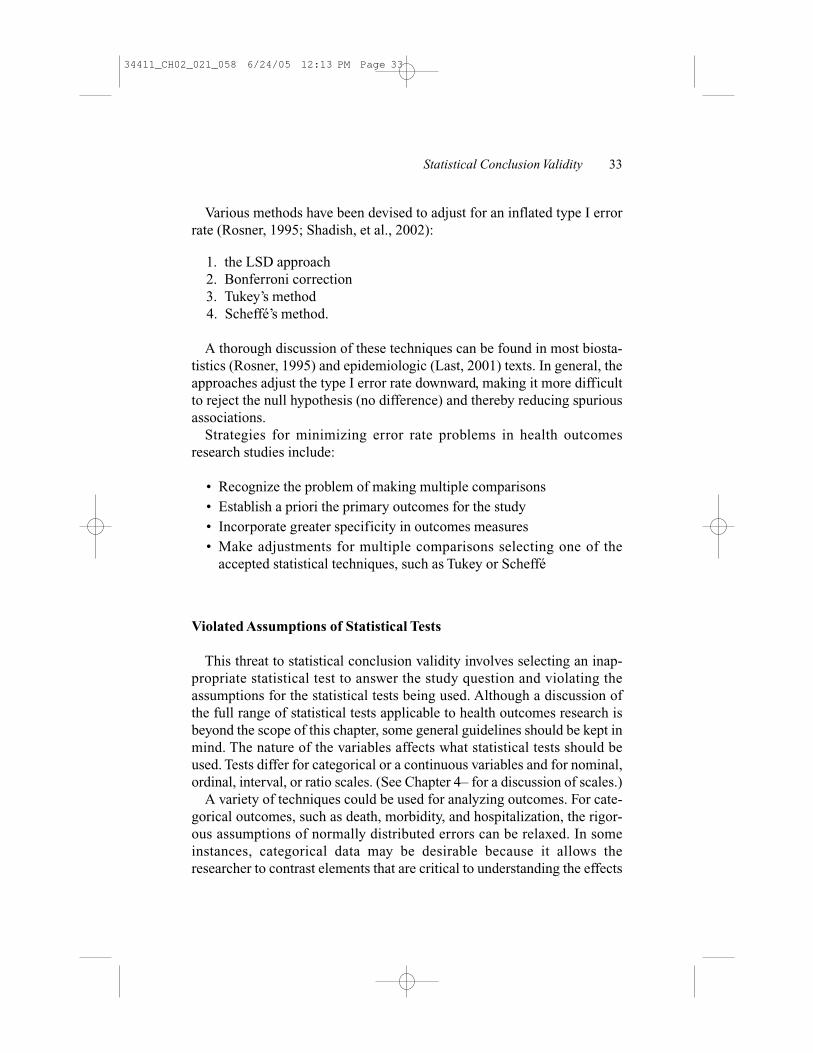
Various methods have been devised to adjust for an inflated type I errorrate (Rosner, 1995; Shadish, et al., 2002):
1. the LSD approach2. Bonferroni correction3. Tukey’s method4. Scheffé’s method.
A thorough discussion of these techniques can be found in most biosta-tistics (Rosner, 1995) and epidemiologic (Last, 2001) texts. In general, theapproaches adjust the type I error rate downward, making it more difficultto reject the null hypothesis (no difference) and thereby reducing spuriousassociations.
Strategies for minimizing error rate problems in health outcomesresearch studies include:
• Recognize the problem of making multiple comparisons• Establish a priori the primary outcomes for the study• Incorporate greater specificity in outcomes measures • Make adjustments for multiple comparisons selecting one of the
accepted statistical techniques, such as Tukey or Scheffé
Violated Assumptions of Statistical Tests
This threat to statistical conclusion validity involves selecting an inap-propriate statistical test to answer the study question and violating theassumptions for the statistical tests being used. Although a discussion ofthe full range of statistical tests applicable to health outcomes research isbeyond the scope of this chapter, some general guidelines should be kept inmind. The nature of the variables affects what statistical tests should beused. Tests differ for categorical or a continuous variables and for nominal,ordinal, interval, or ratio scales. (See Chapter 4– for a discussion of scales.)
A variety of techniques could be used for analyzing outcomes. For cate-gorical outcomes, such as death, morbidity, and hospitalization, the rigor-ous assumptions of normally distributed errors can be relaxed. In someinstances, categorical data may be desirable because it allows theresearcher to contrast elements that are critical to understanding the effects
Statistical Conclusion Validity 33
34411_CH02_021_058 6/24/05 12:13 PM Page 33

of a treatment. For example, whereas a linear model that uses mean agemay not get at the effects of age 85+, a model that compares those 85+ tothose younger might address the issue more directly. In the biomedical lit-erature, logistic regression is widely used to analyze categorical outcomes,such as death or morbidity (Allison, 2001; Hosmer & Lemeshow, 2002;Kleinbaum & Klein, 2002; Le, 1998). Based on a logit function, the tech-nique can be used to simultaneously adjust for covariates and expanded toordered categorical end points called ordered logit. Multivariate logisticregression is frequently applied techniques for analyzing categorical out-comes data in biomedical studies. Logistic regression yields the odds ratioas the measure of association between the treatment of interest and the out-come (Szklo & Nieto, 2000). A variant, multinomial logit can be usedwhen there is more than one outcome of interest.
Analysis of categorical outcomes can be further strengthened if theinvestigator knows about the timing of occurrence of the outcome. In thiscase, time-to-event analysis, also called survival analysis, has been widelyused (Allison, 1995; Hosmer & Lemeshow, 1999; Kleinbaum, 1996; Le,1997). Survival analysis is a powerful technique to analyze time-to-eventdata. In general, survival analysis improves statistical power for analyzingcategorical outcomes by using the time to occurrence of an event to weightthe importance of that event. However, this may be easier said than done.The timing of some outcome events may be hard to determine precisely orimpossible to obtain. An outcomes investigator might procure deathrecords to determine the date of death for a subject or administrative datato ascertain the date of hospitalization, but the onset of an acute myocar-dial infarction (MI) can be clouded by an uncertain history of previousMIs, misdiagnosis, and a failure to seek medical care needed to record theevent., Finally, one rarely knows the specific date of onset of some condi-tions such as disability or chronic diseases such as diabetes mellitus.
A second analytic issue is best illustrated by the use of general linearregression in the analysis of continuous outcomes such as health status scalescores, blood pressures, and laboratory values. Replicate outcomes, such asbaseline and follow-up health status measure, have the potential to be cor-related. The correlated nature of these repeated measures makes it unjusti-fied to use traditional fixed-effects models. Using general linear regressionfails to account for the correlated nature of the outcomes measure, therebyartificially increasing the type I error rate for the statistical test (Murray,1998). In recent years, mixed-model methods have become widely used tohandle correlated data (Liang & Zeger, 1993; Littell, Milliken, Stroup, &
34 CHAPTER 2 DESIGNING AN OUTCOMES RESEARCH STUDY
34411_CH02_021_058 6/24/05 12:13 PM Page 34

Wolfinger, 1996; Murray, 1998). This analytic method has two applicationsin outcomes studies. Mixed model methods are used in the analysis of datafrom studies with repeated outcomes measures. This is equivalent to repeatedmeasures analysis and is the basic design for the pretest/posttest study.Outcome study participants are repeatedly measured (e.g., serial blood pres-sure readings), completing a health status survey at regular intervals. Thisapproach is important in outcomes studies because replicate measures arehighly correlated. General linear regression fails to take this into account.
Mixed-model methods are appropriate when the units of assignment orsampling include factors other than the individual, a frequently encounteredproblem in health services, and public health research. Public health servicesare frequently delivered at the level of the community. Individuals withincommunities are more similar than individuals outside the community. Thecommunity as a source of variability, called a random effect, is nicely han-dled using mixed-model methods. By extension, mixed effects can be hospi-tals, schools, clinics, health plan, or any other type of grouping. Thesemixed-model methods can be applied to categorical or continuous outcomes.
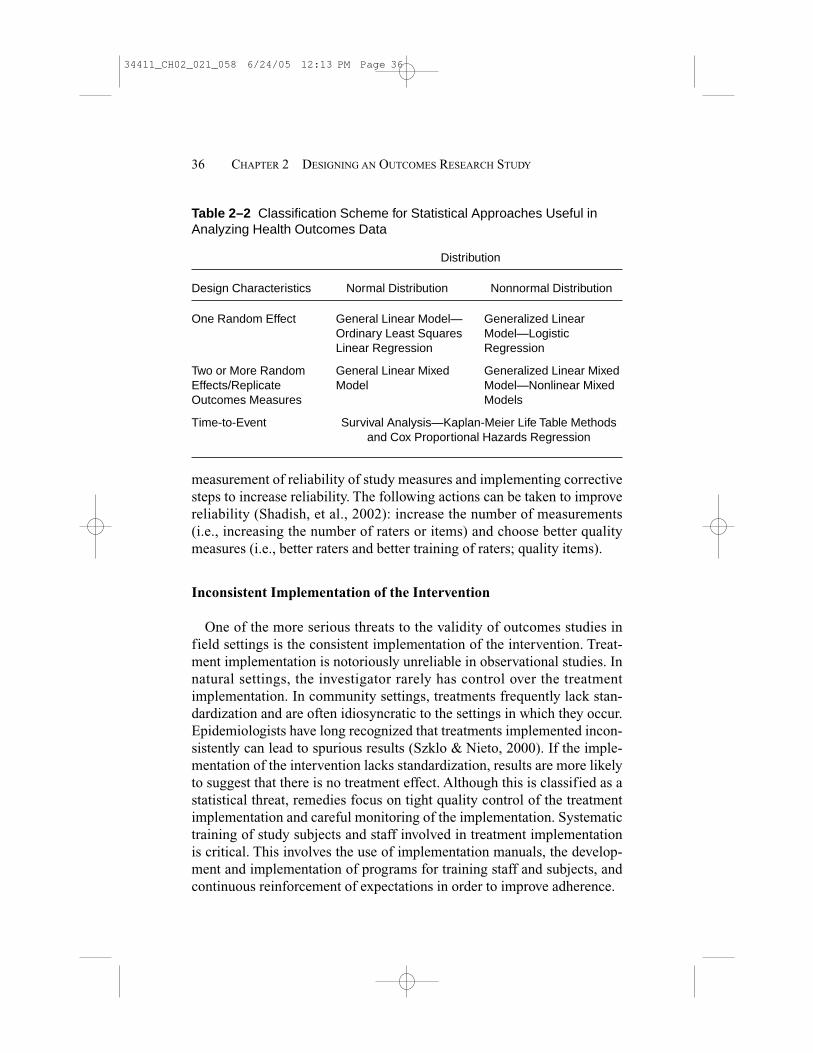
Some sources of random error beyond the individual participant occurwithin study designs that draw participants from other units of interest, suchas hospitals, clinics, health plans, and communities. These are often referredto as hierarchical or nested outcomes designs in which the treatment or inter-vention may be influenced by the level of the group—hospital, clinics, and soon. These designs lend themselves to mixed-model methods because of thecorrelated nature of their data within the level of the group (Murray, 1998).These are called mixed models because there two or more random effects,random effects at the level of the participant, and random effects at the level ofthe group. Table 2–2 summarizes the appropriate types of analytic approachesfor different combinations of distributions, random effects, and data types.Table 2–3 gives recommended guidelines for analyzing outcomes study data.
Reliability of Outcomes Measures
The failure to reliably measure either the treatment or the outcome couldresult in a misclassification of the treatment status, the outcome, or both.The reliability of a measure imposes an upper bound on that measure’sability to discriminate. Unreliable measures can attenuate the relationshipbetween the treatment status and the outcome, mask a relationship, or cre-ate a spurious relationship. This underscores the importance of the routine
Statistical Conclusion Validity 35
34411_CH02_021_058 6/24/05 12:13 PM Page 35
measurement of reliability of study measures and implementing correctivesteps to increase reliability. The following actions can be taken to improvereliability (Shadish, et al., 2002): increase the number of measurements(i.e., increasing the number of raters or items) and choose better qualitymeasures (i.e., better raters and better training of raters; quality items).
Inconsistent Implementation of the Intervention
One of the more serious threats to the validity of outcomes studies infield settings is the consistent implementation of the intervention. Treat-ment implementation is notoriously unreliable in observational studies. Innatural settings, the investigator rarely has control over the treatmentimplementation. In community settings, treatments frequently lack stan-dardization and are often idiosyncratic to the settings in which they occur.Epidemiologists have long recognized that treatments implemented incon-sistently can lead to spurious results (Szklo & Nieto, 2000). If the imple-mentation of the intervention lacks standardization, results are more likelyto suggest that there is no treatment effect. Although this is classified as astatistical threat, remedies focus on tight quality control of the treatmentimplementation and careful monitoring of the implementation. Systematictraining of study subjects and staff involved in treatment implementationis critical. This involves the use of implementation manuals, the develop-ment and implementation of programs for training staff and subjects, andcontinuous reinforcement of expectations in order to improve adherence.
36 CHAPTER 2 DESIGNING AN OUTCOMES RESEARCH STUDY
Table 2–2 Classification Scheme for Statistical Approaches Useful inAnalyzing Health Outcomes Data
Distribution
Design Characteristics Normal Distribution Nonnormal Distribution
One Random Effect General Linear Model— Generalized Linear Ordinary Least Squares Model—Logistic Linear Regression Regression
Two or More Random General Linear Mixed Generalized Linear Mixed Effects/Replicate Model Model—Nonlinear Mixed Outcomes Measures Models
Time-to-Event Survival Analysis—Kaplan-Meier Life Table Methods and Cox Proportional Hazards Regression
34411_CH02_021_058 6/24/05 12:13 PM Page 36

In general, it is easier to measure outcomes than it is to measure treat-ments. Outcome studies should measure treatment. This is accomplished bymonitoring whether a standard treatment was delivered, received by the sub-ject and adhered to. The processes of delivery, receipt and adherence shouldbe incorporated into all outcomes studies. If the researcher has measured thetreatment, it is possible to compare the outcomes for those receiving varyinglevels of the treatment. However, it is possible that subjects self-selectinglevels of treatment. Hence, this is generally viewed as weak evidence for anoutcomes effect. It is better to use these data to supplement the preferredanalytic method, intent-to-treat (Shadish, et al., 2002).
OTHER THREATS TO INTERNAL VALIDITY
Question 2: Does the observed relationship likely reflect causation fromthe treatment to the outcome or might this same relationship reflect theeffects of other factors? This distinction concerns the validity of inferencesdrawn about the observed relationship. This concern falls into what has
Other Threats to Internal Validity 37
Table 2–3 Recommended Guidelines for Analyzing Health OutcomesStudy Data
1. What is the nature of the study outcome?a. Categorical outcomes can be either nominal, dichotomous, or ordered
categorical.b. Continuous variables are in a raw form or require a transformation, e.g.,
cost data is highly skewed and should log transformed.c. Time-to-event analysis
2. Is the data highly correlated? Aside from random errors within the subject, arethere different sources of random error? a. Correlated outcomes data and data with multiple sources of error are best
handled using some form of mixed-model method. Linear mixed and nonlin-ear mixed model methods are useful along with generalized estimatingequation approaches.
b. Noncorrelated data might use a general linear model or logistic regression.
3. Adopt generally acceptable standards for statistical power.Type I error less than 5%Type II error less than 20%Lowest common denominator for comparisonPlan for available data: response rates, eligibility, missing data
34411_CH02_021_058 6/24/05 12:13 PM Page 37

previously been described as threats to internal validity. Shadish, Cook, andCampbell (2002) describe nine threats to internal validity that might biasinferences drawn about the treatment outcome relationship. Five of thesethreats hold particular relevance to health outcomes research study designs:selection, regression to the mean, attrition, missing data, and history.
Selection
Selection is the most serious internal validity threat in health outcomesresearch studies. As mentioned earlier, selection occurs because at thebeginning of the study, on average, individuals in the treatment group differfrom those in the nontreatment group in both known and unmeasurableways. This difference frequently occurs because the treatment cannot berandomly assigned to individuals. Selection is a major problem in case-control studies (Schlesselman, 1982) in which the investigator has diffi-culty finding a comparable control group for cases that are of studyinterest. If the study involves hospitalized patients, exposure and riskincrease the likelihood of hospitalization, leading to a higher rate of expo-sure among hospitalized cases than hospitalized controls. The observeddistortion in the relationship is referred to as Berkson’s Bias (Berkson,1946; Last, 2001).
The treatment–outcome relationship could be confounded by differencesbetween the treatment and control group. For example in epidemiologicalstudies of obesity and all-cause mortality, the relationship is confoundedby cigarette smoking. Smokers often have a leaner body mass but are atincreased risk of sudden death, cardiovascular disease, and cancer fromcigarette smoking. One approach to deal with the problems of selection isthe use of propensity scores (Rosenbaum, 2002). Logistic regression isused to predict membership in either the treatment or control group.Propensity scores derived from the logistic regression are used to matchsubjects, thereby minimizing group differences across study variables.However, propensity scores cannot account for unmeasured variables thatmay be the source of the selection bias.
Selection can interact with other threats to internal validity, such as history,attrition, and regression. The following are examples of these interactions:
• Selection-history interaction: An outside event affects one of thegroups more than another.
38 CHAPTER 2 DESIGNING AN OUTCOMES RESEARCH STUDY
34411_CH02_021_058 6/24/05 12:13 PM Page 38

• Selection-attrition interaction: One group of participants are morelikely than another to withdraw or drop out from the program.
• Selection-regression interaction: This is a problem of differentialregression. In other words, one of the groups by being sicker or health-ier is more likely to be average at a later date.
Regression to the Mean
Some outcomes studies are designed by selecting individuals on thebasis of being very sick or healthy. For example, in orthopedic surgerystudies, one selects study subjects on the basis of those having the poorestfunctioning and in need of a joint replacement. Using the same functionalstatus measure before surgery and after surgery, individuals typically look“average” after surgery and hence appear to have improved. This tendencyto obtain scores approaching the average with remeasurement is calledregression to the mean.
Because all outcomes measures carry some level of uncertainty or error intheir administration, outcomes measures are never perfectly reliable. Thelack of reliability in outcomes measures exaggerates regression to the mean;that is, an unreliable measure is more prone to regress to the mean with repli-cate administration. In order to minimize the risk of regression, do not selectcomparison groups on the basis of extreme scores and use measures withdemonstrated reliability. Poor reliability in an outcomes measure can beobviated by avoiding single-item indexes and employing multi-item scales.
Attrition
The bane of most outcomes studies is attrition, also referred to as exper-imental mortality. Study participants fail to complete the outcomes mea-sure that is administered or they drop out of the study. The more frequentlyan outcomes measure is planned for collection, the greater the possibilitythat there will be attrition. This is a special type of selection that occursbecause subjects drop out after the study begins or certain data is missing.Using the earlier orthopedic surgery example, following surgery, individu-als fail to return for follow-up and hence do not complete the planned-foroutcomes measures. Randomization of subjects fails to control for theeffects of attrition. Individuals with poorer results from the treatment or
Other Threats to Internal Validity 39
34411_CH02_021_058 6/24/05 12:13 PM Page 39
those with less education might be less likely to return for follow-up orcomplete study measures. This selective attrition biases results acrossgroups making results applicable to those that are better educated and mostbenefited by the treatment.
A related facet of attrition that is a form of selection is survival selection.This occurs when there is a correlation between patient survival and thetreatment studied. For example, in observational studies involving patientswith AIDs, those surviving longer are more likely to receive the treatment(Glesby & Hoover, 1996). When treated and untreated patients are com-pared, the treated group appears to have a longer survival. Survival bias canalso distort results. If only survivors are compared, the group with the bettersurvival rate may appear worse because the most vulnerable died. One wayto counter this effect is to include those who died in the assessment of out-comes; for example, death may be treated as the worst functional state.
Missing Data
In outcomes studies, data will always be missing. The best way to minimizethreats posed by missing data is good quality control. This includes carefulstudy management, well-defined project protocols, and clear and well-thought-out operations. Continuous monitoring for quality control minimizesmissing data. In addition, it is always best to use available data rather than dis-carding study variables or cases. Missing data is positive information.
Murphy’s Law for outcomes research could read: “If there are any waysin which data can be missing, they will be” (Cohen & Cohen, 1983).Observations needed for conducting outcomes research could be missingfor a number of reasons. Attrition, which was discussed earlier, is one rea-son for missing data. In health outcomes questionnaires, individuals mayskip questions either accidentally or deliberately. In other cases, informa-tion requested might be difficult or impossible for participant to provide(e.g., questions are too personal or difficult), data systems crash and cannotbe recovered, or measuring instruments, such as automatic blood pressuremachines, fail. Missing data threatens the integrity of outcomes researchand greatly complicates statistical analysis. It threatens the validity of sta-tistical conclusions drawn, particularly if the method for handling missingdata is unacceptable and introduces systematic bias. Missing data effec-tively reduces data for analysis by attenuating statistical power; thereby,reducing the likelihood of detecting differences.
40 CHAPTER 2 DESIGNING AN OUTCOMES RESEARCH STUDY
34411_CH02_021_058 6/24/05 12:13 PM Page 40

The best solution for missing outcomes is improved quality control in thedata-collection process. In order to effectively reduce problems posed bymissing data, it is critical to distinguish between the types of missing data(Cohen & Cohen, 1983). Is the data missing for the outcome or the treat-ment? If the outcome is missing, the investigator is faced with dropping thesubject from the study. This can lead to a comparison of unbalanced groups,less-representative samples, and a loss of statistical power.
Is data randomly or selectively missing? Health survey researchers expecta certain amount of random nonresponses in every study. If the pattern ofnonresponse is equally distributed across all subjects, it should not intro-duce a systematic bias. Selectively missing data poses a more serious prob-lem. Selectively missing data is frequently encountered in studies of specialpopulations, such as the elderly or persons with mental health problems. Instudies of the elderly, those with cognitive deficits are less likely to providerisk factor data than those with full cognitive function (Radosevich, 1993),but individuals who are unable to provide requested information about theirbaseline status are at higher risk for poor health outcomes.
Are many versus few items missing? As a general rule, no more than 1 to2 percent of values should be missing for outcomes study variables. If thepattern of missing values shows that certain data is missing more fre-quently, then questionnaires and data collection forms should be revised.
Dropping variables with high rates of missing values may be safer thandropping subjects (Cohen & Cohen, 1983). Some investigators elect todrop variables from their analysis if extensive data is missing. If the databeing dropped makes no material contribution to the outcomes study, drop-ping it is of little consequence. In that case, the investigator might recon-sider why the variable was included in the study. Resources were wastedand information is being lost.
On occasion, the investigator chooses to drop participants from thestudy. In many advanced statistical packages used for analyzing health out-comes data, this procedure is referred to as listwise deletion. If the data isan outcome, as noted earlier, dropping participants might be perfectly jus-tified. However, beyond 1 or 2 percent of participants, this could introducesignificant attrition bias into studies. The outcomes study overall loses sta-tistical power and becomes less representative of the target population.This selective loss of subjects is an unacceptable strategy for handlingmissing data.
Pairwise deletion of participants is generally found in studies using cor-relation methods or bivariate techniques. Associations are examined only
Other Threats to Internal Validity 41
34411_CH02_021_058 6/24/05 12:13 PM Page 41

for the paired observations in which the study factor of interest and out-come are both present. If data is randomly missing, this approach mightwork, but the investigator is unclear as to the study population.
A number of acceptable methods for handling missing data in outcomesstudies have been suggested. First, use dummy variable codes for missingvalues. This means that in the place of a missing value for a variable, oneemploys a dummy code that flags the variable as missing. In the analysis,this strategy has the effect of creating an additional variable for the missingfactor and quantifying potential bias introduced by the absence of a valuefor that variable.
A second group of techniques involves the interpolation of outcomesvalues: (1) carrying the last observed outcome forward, (2) interpolationbetween known outcomes, and (3) assuming the worst outcome. Differentassumptions underlie each of these approaches. For example, in a study ofthe long-term follow-up of mechanical heart valve recipients, individualslost to follow-up are assumed to have died from a heart value–related con-dition. This involves assuming the worst case scenario. As an alternative,one might assume the individual was still alive because that was their sta-tus at the time of their last contact.
Finally, mean substitution is an extension of linear regression techniquesand frequently used where the outcome variable is derived from a multi-item scale. The basis for this approach is that the best predictor of missingvalue is the other values for the same individual. For multi-item scales suchas the 10-item Physical Functioning Scale (PF-10) score (McHorney,Kosinski, & Ware, 1994; Ware, 1991; Ware & Sherbourne, 1992; Ware, etal., 1993), a mean scale score is computed on the basis of available items.If the individual completes 7 of the 10 items comprising the PF-10, thescale score is based on the available seven items. This approach under-scores an additional advantage of using multi-item scales.
History
History concerns events that occur between the treatment and the out-come that are outside the control of the researcher. For example, in an obser-vational study of the effectiveness of primary care–based treatment programfor diabetes mellitus, the introduction of a new drug to treat diabetes islikely to affect the outcome. In the real world, it is impossible to isolate rou-tine care from external changes that occur in the health care environment.
42 CHAPTER 2 DESIGNING AN OUTCOMES RESEARCH STUDY
34411_CH02_021_058 6/24/05 12:13 PM Page 42
Because it is impossible to control for outside events, outcomesresearchers have employed several strategies to control for history effects.First, investigators have attempted to isolate the study participants from theoutside. This can more easily be accomplished in the laboratory than in thefield. In laboratory experiments, study participants receive the experimen-tal intervention in a setting isolated from the field. In field settings, assign-ment groups could be separated from one another; for example, hospitalsand clinics located in different communities. A second strategy to reducehistory effects is to use nonreactive outcomes measures. Examples of thesemeasures include laboratory tests and physiological measures that are lesssusceptible to outside effects. A third strategy is to use a control groupdrawn from a comparable group of participants. If the intervention and thecontrol groups are comparable and outcomes measurements occur at sametime, history effects would be uniform across the study groups. They mightminimize the effect of treatment but will not inflate it.
CONSTRUCT VALIDITY
Question 3: What constructs are involved in the particular cause-and-effect relationship? Constructs are abstractions inferred from specificobservations. Outcomes research is generally concerned with drawing con-clusions about attributes that cannot be directly observed. For example, onecannot directly observe physical functioning in a subject but can observethe manifestations of physical functioning (e.g., walking, climbing stairs,standing from a seated position). Physical functioning is a construct.
Construct validity involves understanding of how the concepts used inthe model relate to one another and how they are measured. There are anumber of threats to construct validity (Shadish, et al., 2002).
Inadequate Conceptual Design
Inadequate preoperational explication of constructs simply means that themeasures and treatments have not been adequately defined and explainedprior to implementing the study. Many investigators fail to adequatelydefine and analyze the concepts they are studying. Before commencing anoutcomes study, an operating model needs to be spelled out. At the veryleast, the following conceptual planning needs to occur (see Chapter 1):
Construct Validity 43
34411_CH02_021_058 6/24/05 12:13 PM Page 43
• Develop and define concepts in the operating model.• Create an operational model of the study that shows the relationship
between concepts.• Operationally define and critique the concepts.
Good conceptual planning is at least as important as choosing the rightmeasures.
Monooperation and Monomethod Bias
Monooperation concerns using only a single measure of each concept;for example, using a single outcomes measure or treatment measure.Single operations of study constructs pose the risk of not measuring theconcept in the correct way or measuring irrelevant facets of the concept.One way of reducing this threat is by using a number of instances of theconcept. For example, to reduce this bias in the measurement of treatment,the design could incorporate various doses of an experimental drug. Thisstrategy would enable the investigator to demonstrate a dose-response rela-tionship. Alternatively, the investigator might increase the number and typeof interventions. For example, in a diabetes mellitus disease managementprogram, different forms of patient coaching might be employed: nursetelephone calls, patient learning materials, and physician coaching.
Monomethod bias is a related threat to validity, wherein a single methodis used to collect data. For example, a study of the effectiveness of a par-ticular diabetes intervention might use only self-reported survey data toanswer the question. This design is susceptible to a monomethod biasthreat. It would be better to include other measures of effectiveness such aslaboratory values or medical records review. The distinction betweenmonooperation and monomethod bias is often not clear. For this reason,they might be lumped as the monobias threats. They include what mea-sures are used to assess the concepts and what data collection methods areemployed.
Treatment Diffusion
Treatment diffusion is a recurring problem in observational studies.Participants in the control group sometimes receive some of the treatment.
44 CHAPTER 2 DESIGNING AN OUTCOMES RESEARCH STUDY
34411_CH02_021_058 6/24/05 12:13 PM Page 44

This is sometimes called a “spillover effect.” For example, in a study of theeffects of a hospital nursing care model, hospital units not receiving theintervention could be exposed to the intervention through staff contactbetween units implementing the care model and those not implementingthe care model. Unknown to the investigator, nursing units assigned to thecontrol condition could implement facets of the nursing care model. Thediffusion of the treatment would be likely to attenuate differences in theoutcomes between the treatment and control conditions. At a minimum,one needs to look for the possibility of a diffusion effect. Other designs canmitigate this effect—for example, by allocating treatment to differentphysicians or clinics—but this design imposes other problems.
EXTERNAL VALIDITY
Question 4: How representative is the relationship across persons, set-tings, and times? Randomized controlled trials are the backbone of bio-medical research and the “gold standard” for determining the efficacyof medical therapies. Through randomization of participants to treat-ment conditions, the RCT gains in terms of internal validity. However, amajor limitation of the RCT is the lack of generalizability. BecauseRCTs use strict criteria for the inclusion and exclusion of study subjects,results are not as representative of the persons and settings of greatestinterest in health care and outcomes research. Moreover, RCTs arecostly to implement.
Although observational studies suffer from many of the threats to inter-nal validity discussed earlier, they more successfully represent the popula-tions that are receiving the care. The representativeness, also calledgeneralizability, applies to three facets of study designs: the individualsparticipating in the study, where the treatment occurs, and the timing ortime interval for the study. No single design can adequately address thethreats to validity. There are tradeoffs. The most discussed and major trade-off is between internal and external validity. Some argue that timely, repre-sentative, and less-rigorous observational studies are to be preferred overinternally valid study designs. There are no hard and fast rules.
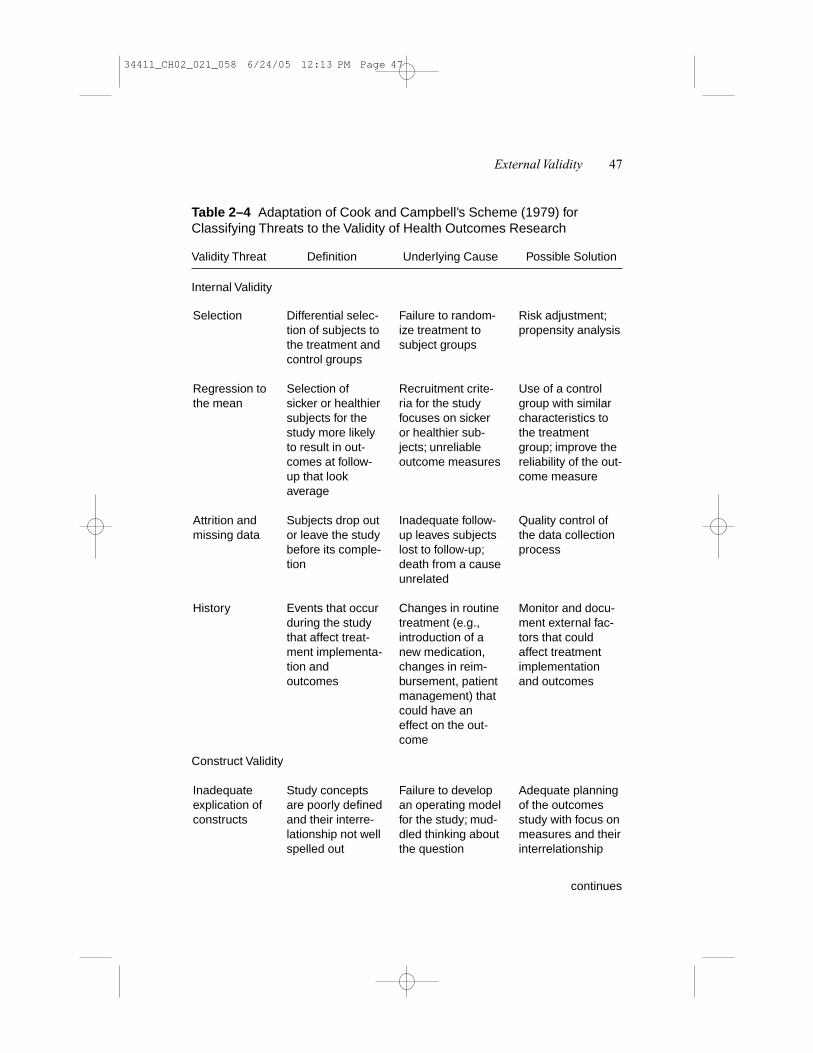
Table 2–4 summarizes the threats to validity discussed. These are a fewof many possible threats but are the ones that hold greatest relevance tohealth outcomes research studies. For those listed, the table briefly definesthe threat, provides an underlying cause, and gives some possible solutions.
External Validity 45
34411_CH02_021_058 6/24/05 12:13 PM Page 45

46 CHAPTER 2 DESIGNING AN OUTCOMES RESEARCH STUDY
Table 2–4 Adaptation of Cook and Campbell’s Scheme (1979) forClassifying Threats to the Validity of Health Outcomes Research
Validity Threat Definition Underlying Cause Possible Solution
Statistical Conclusion Validity
Low statisticalpower
Fishing anderror rateproblems
Violatedassumptions ofstatistical testsand inappropri-ate statisticaltest
Reliability ofmeasures
and treatmentimplementation
Study designdoes not permitdetecting a trueeffect
Multiple compar-isons increasethe likelihood ofmaking a type 1error
Inappropriatelyapplied statisticaltest or theassumption of thestatistical test isviolated
Unreliable out-come measures
Inconsistentimplementation ofthe treatment
Inadequate samplesize and respon-siveness of out-comes measure
Too many hypothe-ses; lack of a pri-mary hypothesis
Careless analysis;plan for analysisnot well thoughtout; failure to con-sult with an analyticexpert
Selecting unstablemeasures; lack ofstandardization ofmeasurement
Lack of standardi-zation of treatmentimplementation;lack of clarityregarding treatmentimplementation
Increase samplesize; choose anoutcomes measurewith optimalresponsivenesscharacteristics
Identify primaryand secondaryhypotheses; posthoc adjustments formaking multiplecomparisons
Consult with ananalytic expert; usea statistical methodthat takes intoaccount the corre-lated nature out-comes data
Monitor the qualityof measurement;select measuresbased on soundpsychometricproperties
Monitor the qualityof treatment imple-mentation; take cor-rective measures toassure standardiza-tion; closely monitorthe treatmentimplementation;incorporate treat-ment measures intostudy design
34411_CH02_021_058 6/24/05 12:13 PM Page 46
External Validity 47
Table 2–4 Adaptation of Cook and Campbell’s Scheme (1979) forClassifying Threats to the Validity of Health Outcomes Research
Validity Threat Definition Underlying Cause Possible Solution
Internal Validity
Selection
Regression tothe mean
Attrition andmissing data
History
Inadequateexplication ofconstructs
Differential selec-tion of subjects tothe treatment andcontrol groups
Selection ofsicker or healthiersubjects for thestudy more likelyto result in out-comes at follow-up that lookaverage
Subjects drop outor leave the studybefore its comple-tion
Events that occurduring the studythat affect treat-ment implementa-tion andoutcomes
Study conceptsare poorly definedand their interre-lationship not wellspelled out
Failure to random-ize treatment tosubject groups
Recruitment crite-ria for the studyfocuses on sickeror healthier sub-jects; unreliableoutcome measures
Inadequate follow-up leaves subjectslost to follow-up;death from a causeunrelated
Changes in routinetreatment (e.g.,introduction of anew medication,changes in reim-bursement, patientmanagement) thatcould have aneffect on the out-come
Failure to developan operating modelfor the study; mud-dled thinking aboutthe question
Risk adjustment;propensity analysis
Use of a controlgroup with similarcharacteristics tothe treatmentgroup; improve thereliability of the out-come measure
Quality control ofthe data collectionprocess
Monitor and docu-ment external fac-tors that couldaffect treatmentimplementationand outcomes
Adequate planningof the outcomesstudy with focus onmeasures and theirinterrelationship
Construct Validity
continues
34411_CH02_021_058 6/24/05 12:13 PM Page 47

48 CHAPTER 2 DESIGNING AN OUTCOMES RESEARCH STUDY
Table 2–4 Adaptation of Cook and Campbell’s Scheme (1979) forClassifying Threats to the Validity of Health Outcomes Research
Validity Threat Definition Underlying Cause Possible Solution
Monomethodand monooper-ation biases
Treatment diffusion
External Validity
Representativeness to person,setting, andtime
Using singlemethods to col-lect data; using asingle measure ofthe treatment andoutcome
In natural set-tings, the treat-ment spills over togroups notintended toreceive the inter-vention
Results of thestudy limited byperson, setting,and time
Cost prohibitive touse multiple mea-sures of treatmentand outcomes;using single meth-ods of data collec-tion
Inadequate segre-gation of treatmentand control groupsubjects; rivalrybetween groupsnot given the treat-ment and thosereceiving the treatment
Inclusion andexclusion criterialimit the findings
Employ multiplemethods to collectthe factors of studyinterest, e.g., written surveys,personal inter-views, and physio-logical testing;employ multipleapproaches inmeasuring thetreatment and outcomes, e.g.,self-report, interview, observation
Whenever possi-ble, plan to give the control subjects the treatment after the study has concluded; blind subjects to thetreatment; givecontrol subjects a“sham” therapy
Replicate studiesacross differentpopulations, indiverse setting, andat other points oftime
34411_CH02_021_058 6/24/05 12:13 PM Page 48

QUASIEXPERIMENTAL DESIGNS
Types of Quasiexperimental Designs
Most outcome studies will be observational and hence will rely on quasi-experimental designs. A bare-bones experimental design has an interventionand an outcome. In the absence of a control group, these are sometimesreferred to as preexperiments. The preexperimental design could be ex-panded by adding control groups and pretest measures. All outcomes studydesigns can be described using a standard nomenclature (see Table 2–5). Thepreexperimental design consisting of an intervention and outcome could bedepicted as follows:
X O
In this posttest-only design, an outcome (O) is observed only after atreatment (X). This type of design is frequently used in medical practiceand is referred to as a case study; patients receive a treatment and theresearchers observe an outcome. A number of problems are associated withthis design, selection, history, and attrition, to name a few. From a statisti-cal perspective, this design is not interpretable. One cannot observe covari-ation because the design fails to incorporate either a pretest or a control
Quasiexperimental Designs 49
Table 2–5 Standard Nomenclature for Describing Quasixperiments
O — outcomes measures or an observation
X — treatment
X — removed treatment
R — random assignment of subjects/groups to separate treatments
NR — no random assignment of subjects/groups to separate treatments
Subjects/groups separated by dashes – – – – are not equated by randomassignment
Subject/groups divided by a vertical dashed line are not necessarily equivalent toone another
34411_CH02_021_058 6/24/05 12:13 PM Page 49
50 CHAPTER 2 DESIGNING AN OUTCOMES RESEARCH STUDY
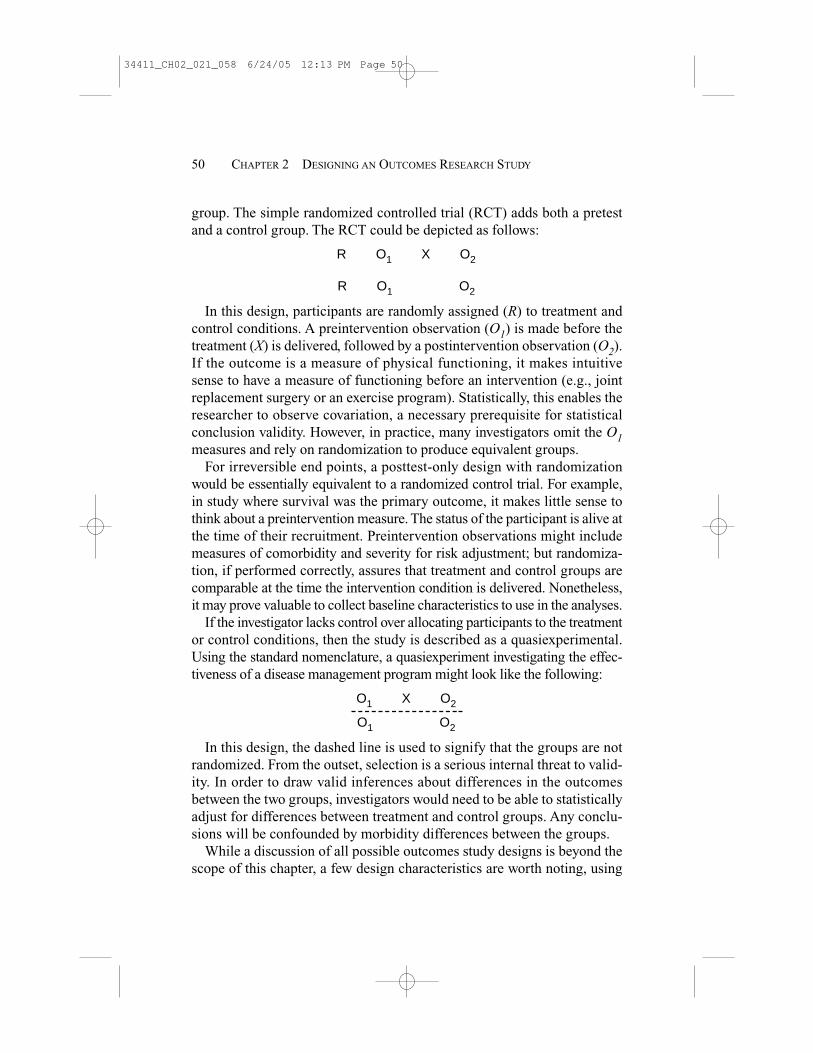
group. The simple randomized controlled trial (RCT) adds both a pretestand a control group. The RCT could be depicted as follows:
R O1 X O2
R O1 O2
In this design, participants are randomly assigned (R) to treatment andcontrol conditions. A preintervention observation (O1) is made before thetreatment (X) is delivered, followed by a postintervention observation (O2).If the outcome is a measure of physical functioning, it makes intuitivesense to have a measure of functioning before an intervention (e.g., jointreplacement surgery or an exercise program). Statistically, this enables theresearcher to observe covariation, a necessary prerequisite for statisticalconclusion validity. However, in practice, many investigators omit the O1measures and rely on randomization to produce equivalent groups.
For irreversible end points, a posttest-only design with randomizationwould be essentially equivalent to a randomized control trial. For example,in study where survival was the primary outcome, it makes little sense tothink about a preintervention measure. The status of the participant is alive atthe time of their recruitment. Preintervention observations might includemeasures of comorbidity and severity for risk adjustment; but randomiza-tion, if performed correctly, assures that treatment and control groups arecomparable at the time the intervention condition is delivered. Nonetheless,it may prove valuable to collect baseline characteristics to use in the analyses.
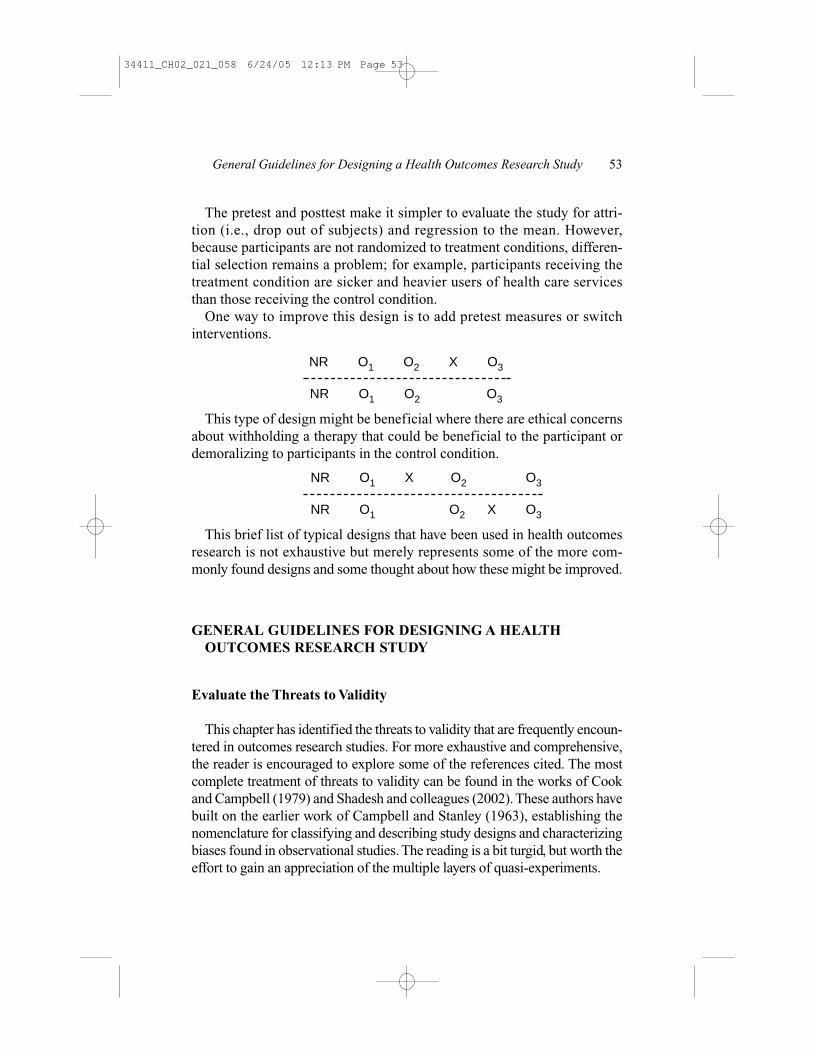
If the investigator lacks control over allocating participants to the treatmentor control conditions, then the study is described as a quasiexperimental.Using the standard nomenclature, a quasiexperiment investigating the effec-tiveness of a disease management program might look like the following:
O1 X O2
O1 O2
In this design, the dashed line is used to signify that the groups are notrandomized. From the outset, selection is a serious internal threat to valid-ity. In order to draw valid inferences about differences in the outcomesbetween the two groups, investigators would need to be able to statisticallyadjust for differences between treatment and control groups. Any conclu-sions will be confounded by morbidity differences between the groups.
While a discussion of all possible outcomes study designs is beyond thescope of this chapter, a few design characteristics are worth noting, using
34411_CH02_021_058 6/24/05 12:13 PM Page 50

the scheme of Shadish and his colleagues (2002): designs without controlgroups, designs without pretest measures, and combination designs.
Designs Without Control Groups
The posttest-only design described earlier can be improved by adding apretest measure. This type of approach has been used in evaluating the effec-tiveness of programs such as disease management and health education(Linden, Adams, & Roberts, 2003).
O1 X O2
The investigator makes a pretreatment observation and looks for a changein that measure with follow-up. Although this provides some evidence forchange that could be a result of the intervention, it fails to rule out otherthings that might have happened to the participants (history), such as othertreatments, practice changes, or statistical regression to the mean. Oneimprovement to this design is to add additional pretest measures.
O1 O2 X O3
Adding multiple pretest measures reduces the threat of statistical regres-sion, but one cannot rule out the possibility that other external factors mighthave led to the changes that occurred. This type of design lends itself to sit-uations in which repeated pretest measures are available to the investigator.For example, in a study intended to reduce the use of medical services, prioruse of services might serve as pretest measures. The lack of a trend in theuse of health care services before the intervention strengthens the argumentfor the effect of the intervention minimizing threats of regression or age.Shadish and his colleagues (2002) discuss other types of designs withoutcontrol groups such as the removed-treatment design, repeated-treatmentdesign, and designs that use nonequivalent observations. The interestedreader is referred to this source for a more comprehensive discussion.
Designs Without Pretest Measures
The pretest is an observation taken before the intervention condition inorder to ascertain the preliminary status of the participant. In many out-comes research studies, it is impossible to obtain a pretest measure; for
Quasiexperimental Designs 51
34411_CH02_021_058 6/24/05 12:13 PM Page 51

example, participants are emergent cases. In this type of study, a non-equivalent control group might be used. One of the more frequently useddesign without a pretest is the posttest-only design with nonequivalentgroups.
NR X O1
NR O2
Here the dashed horizontal line indicates that the group receiving theintervention is different from the control group. Campbell and Stanley(1963) called this the static group comparison. Participants receiving thetreatment are compared to those who did not, thereby establishing theeffect of the intervention. Certainly, the biggest problem with this type ofdesign is selection; participants in one group could systematically differfrom those in the other group leading the observations made. One approachto dealing with this threat is to add an independent pretest sample.
NR O1 X O2
NR O1 O2
Here the vertical dashed line signifies that the participants at time 1 andtime 2 may be different. These observations are independent of oneanother. This design is used frequently in epidemiology and public healthwhere it is impossible to collect data on the same group of participantspretest and posttest. The level of intervention is at a group or system leveland participant level of control is less critical to the study question. Forexample, what are the effects of community level intervention to increasesmoking cessation?
Combination Designs
Some quasiexperimental designs use both pretests and control groups.The simplest design is the nonequivalent treatment and control groupdesign with a dependent pretest and posttest.
NR O1 X O2
NR O1 O2
52 CHAPTER 2 DESIGNING AN OUTCOMES RESEARCH STUDY
34411_CH02_021_058 6/24/05 12:13 PM Page 52
The pretest and posttest make it simpler to evaluate the study for attri-tion (i.e., drop out of subjects) and regression to the mean. However,because participants are not randomized to treatment conditions, differen-tial selection remains a problem; for example, participants receiving thetreatment condition are sicker and heavier users of health care servicesthan those receiving the control condition.
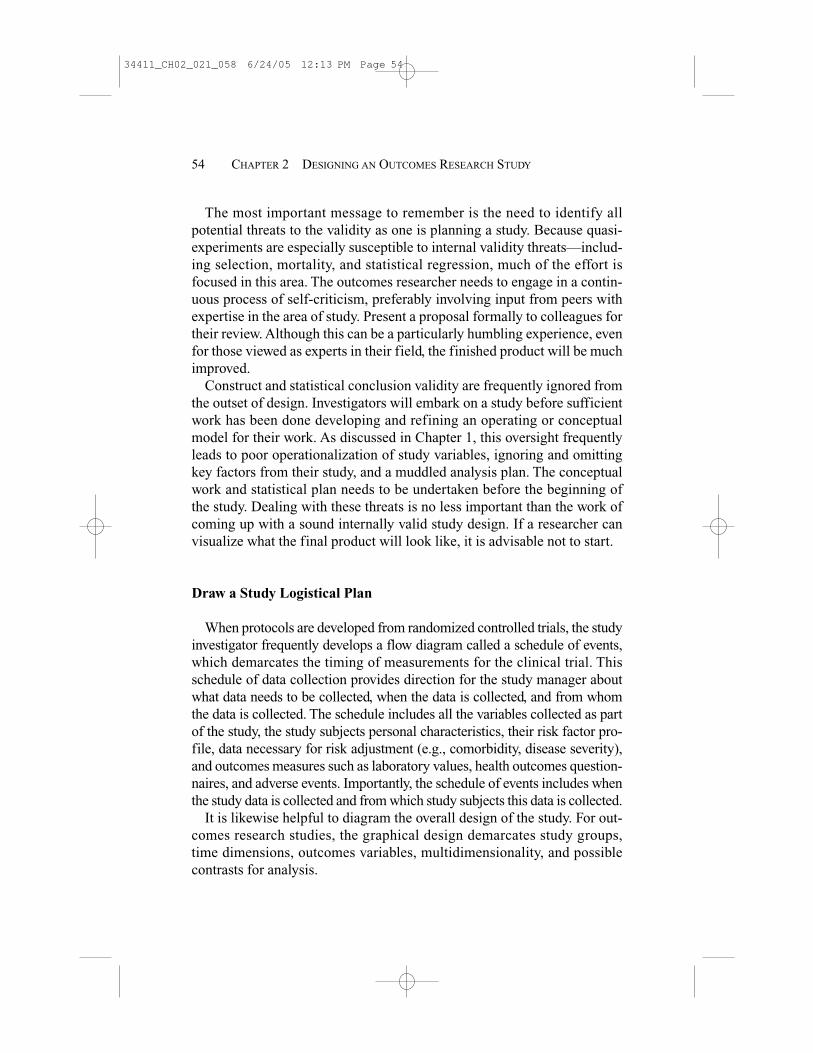
One way to improve this design is to add pretest measures or switchinterventions.
NR O1 O2 X O3
NR O1 O2 O3
This type of design might be beneficial where there are ethical concernsabout withholding a therapy that could be beneficial to the participant ordemoralizing to participants in the control condition.
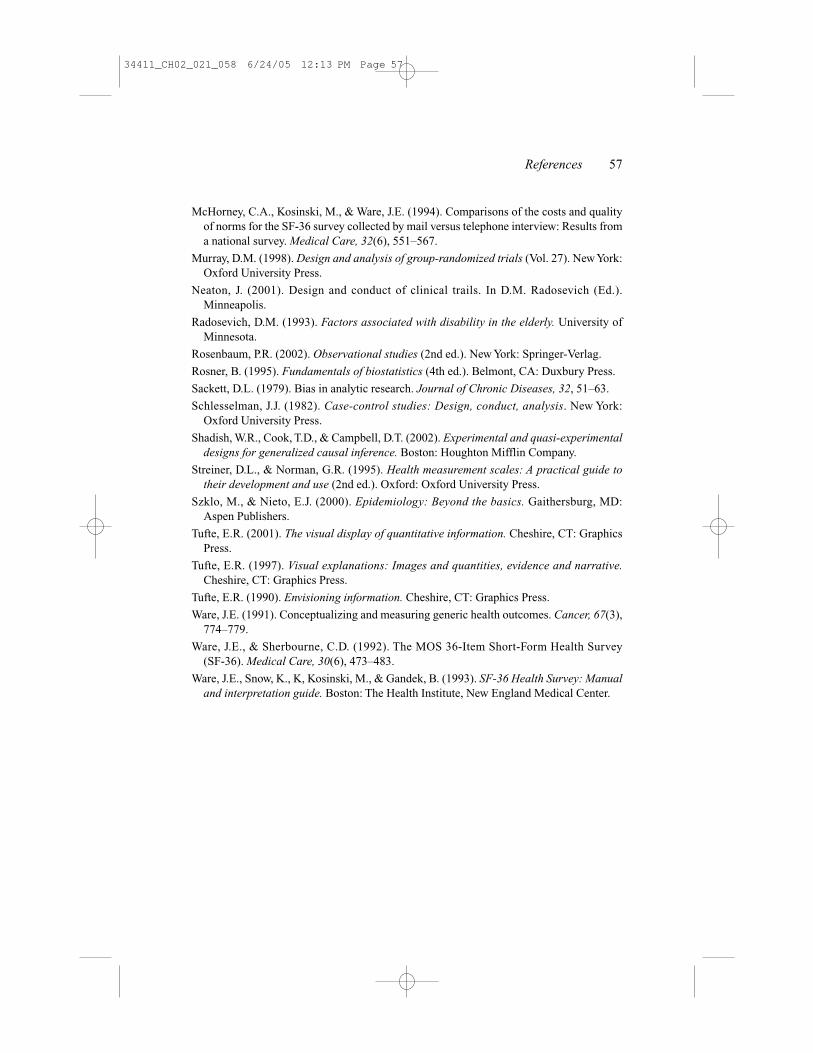
NR O1 X O2 O3
NR O1 O2 X O3
This brief list of typical designs that have been used in health outcomesresearch is not exhaustive but merely represents some of the more com-monly found designs and some thought about how these might be improved.
GENERAL GUIDELINES FOR DESIGNING A HEALTHOUTCOMES RESEARCH STUDY
Evaluate the Threats to Validity
This chapter has identified the threats to validity that are frequently encoun-tered in outcomes research studies. For more exhaustive and comprehensive,the reader is encouraged to explore some of the references cited. The mostcomplete treatment of threats to validity can be found in the works of Cookand Campbell (1979) and Shadesh and colleagues (2002). These authors havebuilt on the earlier work of Campbell and Stanley (1963), establishing thenomenclature for classifying and describing study designs and characterizingbiases found in observational studies. The reading is a bit turgid, but worth theeffort to gain an appreciation of the multiple layers of quasi-experiments.
General Guidelines for Designing a Health Outcomes Research Study 53
34411_CH02_021_058 6/24/05 12:13 PM Page 53
The most important message to remember is the need to identify allpotential threats to the validity as one is planning a study. Because quasi-experiments are especially susceptible to internal validity threats—includ-ing selection, mortality, and statistical regression, much of the effort isfocused in this area. The outcomes researcher needs to engage in a contin-uous process of self-criticism, preferably involving input from peers withexpertise in the area of study. Present a proposal formally to colleagues fortheir review. Although this can be a particularly humbling experience, evenfor those viewed as experts in their field, the finished product will be muchimproved.
Construct and statistical conclusion validity are frequently ignored fromthe outset of design. Investigators will embark on a study before sufficientwork has been done developing and refining an operating or conceptualmodel for their work. As discussed in Chapter 1, this oversight frequentlyleads to poor operationalization of study variables, ignoring and omittingkey factors from their study, and a muddled analysis plan. The conceptualwork and statistical plan needs to be undertaken before the beginning ofthe study. Dealing with these threats is no less important than the work ofcoming up with a sound internally valid study design. If a researcher canvisualize what the final product will look like, it is advisable not to start.
Draw a Study Logistical Plan
When protocols are developed from randomized controlled trials, the studyinvestigator frequently develops a flow diagram called a schedule of events,which demarcates the timing of measurements for the clinical trial. Thisschedule of data collection provides direction for the study manager aboutwhat data needs to be collected, when the data is collected, and from whomthe data is collected. The schedule includes all the variables collected as partof the study, the study subjects personal characteristics, their risk factor pro-file, data necessary for risk adjustment (e.g., comorbidity, disease severity),and outcomes measures such as laboratory values, health outcomes question-naires, and adverse events. Importantly, the schedule of events includes whenthe study data is collected and from which study subjects this data is collected.
It is likewise helpful to diagram the overall design of the study. For out-comes research studies, the graphical design demarcates study groups,time dimensions, outcomes variables, multidimensionality, and possiblecontrasts for analysis.
54 CHAPTER 2 DESIGNING AN OUTCOMES RESEARCH STUDY
34411_CH02_021_058 6/24/05 12:13 PM Page 54

Graphics can also be an important adjunct in presenting the results of thestudy. The graphical image provides greater depth and dimensionality thatis impossible to communicate verbally. For an excellent discussion of thegraphical display of quantitative information, the reader is encouraged toreview works by Tufte (1990, 1997, 2001).
Use Design and Statistical Controls
Statistical control, or risk-adjustment control, can never overcome theeffects of a poorly designed study. In general, the best strategy is to use acombination of sound study design and statistical controls in implement-ing the health outcomes research study. Shadish and colleagues (2002)refer to this as the “primacy of control by design.” Design involves addingcontrol groups, making additional observations before the treatment inter-vention, and timing data collection.
Analyzing outcomes data requires statistical techniques that are oftenbeyond the skills of most investigators. The use of correlated methods,described as mixed-model methods, and time-to-event analysis, called sur-vival analysis, requires advanced statistical course work. Because of thecomplexity of analysis, sound study design must involve input from askilled data analyst at an early stage of the planning process. This assuresthat the study question has been clarified, the analysis plan fits the studydesign, the right variables are being collected, and the study can producethe desired results.
REFERENCES
Allison, P.D. (2001). Logistic regression using the SAS® System: Theory and application.Cary, NC: SAS Institute Inc.
Allison, P.D. (1995). Survival analysis using the SAS® System: A practical guide. Cary, NC:SAS Institute Inc.
Bergner, M. (1989). Quality of life, health status, and clinical research. Medical Care, 27(3,Supplement), S148–S156.
Bergner, M.B., Bobbitt, R.A., Carter, W.B., & Gilson, B.S. (1981). The sickness impact pro-file: Development and final revision of a health status measure. Medical Care, 19,787–805.
Berkson, J. (1946). Limitations of the fourfold table analysis to hospital data. BiometricsBulletin, 2, 47–53.
References 55
34411_CH02_021_058 6/24/05 12:13 PM Page 55

Campbell, D.T., & Stanley, J.C. (1963). Experimental and quasi-experimental designs forresearch. Chicago: Rand McNally and Company.
Cohen, J. (1988). Statistical power analysis for the behavioral sciences. Hillsdale, NJ:Lawrence Erlbaum Associates.
Cohen, J., & Cohen, P. (1983). Applied multiple regression/correlation analysis for thebehavioral sciences (2nd Ed.). Hillsdale, NJ: Lawrence Erlbaum Associates.
Cook, T.D., & Campbell, D.T. (1979). Quasi-experimentation: Design and analysis issuesfor field settings. Boston: Houghton Mifflin Company.
Disease Management Association of America Outcomes Consolidation SteeringCommittee. (2004). Disease management: Program evaluation guide (1st ed.).Washington, DC: Disease Management Association of America.
Elashoff, J.D., Oliver, M.R., Yeghiazarian, K., Zheng, M., Jamshidian, M., & Koyfman, I.(2000). nQuery Advisor (Version 4.0). Los Angeles, CA.
Feinstein, A.R., Sosin, D.M., & Wells, C.K. (1985). The Will Rogers phenomenon. The NewEngland Journal of Medicine, 312(25), 1604–1608.
Friedman, L.M., Furberg, C.D., & DeMets, D.L. (1996). Fundamentals of clinical trials. St.Louis, MO: Mosby.
Glesby, M.J. & Hoover, D.R. (1996). Survivor treatment selection bias in observationalstudies. Annals of Internal Medicine, 124(11), 999–1005.
Hosmer, D.W., & Lemeshow, S. (2002). Applied logistic regression (2nd ed.). New York:John Wiley and Sons, Inc.
Hosmer, D.W., & Lemeshow, S. (1999). Applied survival analysis: Regression modeling oftime to event data. New York: Wiley-Interscience.
Kelsey, J.L., Whittlemore, A.S., Evans, A.S., & Thompson, W.D. (1996). Methods in obser-vational epidemiology (Vol. 26). New York: Oxford University Press.
Kim, J.-O., & Mueller, C.W. (1978). Introduction to factor analysis: What it is and how todo it (Vol. 13). Beverly Hills, CA: Sage Publications.
Kleinbaum, D.G. (1996). Survival analysis: A self-learning text. New York: Springer-Verlag.
Kleinbaum, D.G., & Klein, M. (2002). Logistic regression: A self-learning text. New York:Springer-Verlag.
Last, J.M. (Ed.). (2001). A dictionary of epidemiology (4th ed.). New York: OxfordUniversity Press.
Le, C.T. (1998). Applied categorical data analysis. New York: John Wiley and Sons, Inc.
Le, C.T. (1997). Applied survival analysis. New York: Wiley-Interscience.
Liang, K.-Y., & Zeger, S.L. (1993). Regression analysis for correlated data. Annual Reviewof Public Health, 14, 43–68.
Linden, A., Adams, J.L., & Roberts, N. (2003). An assessment of the total populationapproach for evaluating disease management program effectiveness. DiseaseManagement, 6(2), 93–102.
Littell, R.C., Milliken, G.A., Stroup, W.W., & Wolfinger, R.D. (1996). System for mixedmodels. Cary, NC: SAS Institute, Inc.
56 CHAPTER 2 DESIGNING AN OUTCOMES RESEARCH STUDY
34411_CH02_021_058 6/24/05 12:13 PM Page 56
McHorney, C.A., Kosinski, M., & Ware, J.E. (1994). Comparisons of the costs and qualityof norms for the SF-36 survey collected by mail versus telephone interview: Results froma national survey. Medical Care, 32(6), 551–567.
Murray, D.M. (1998). Design and analysis of group-randomized trials (Vol. 27). New York:Oxford University Press.
Neaton, J. (2001). Design and conduct of clinical trails. In D.M. Radosevich (Ed.).Minneapolis.
Radosevich, D.M. (1993). Factors associated with disability in the elderly. University ofMinnesota.
Rosenbaum, P.R. (2002). Observational studies (2nd ed.). New York: Springer-Verlag.
Rosner, B. (1995). Fundamentals of biostatistics (4th ed.). Belmont, CA: Duxbury Press.
Sackett, D.L. (1979). Bias in analytic research. Journal of Chronic Diseases, 32, 51–63.
Schlesselman, J.J. (1982). Case-control studies: Design, conduct, analysis. New York:Oxford University Press.
Shadish, W.R., Cook, T.D., & Campbell, D.T. (2002). Experimental and quasi-experimentaldesigns for generalized causal inference. Boston: Houghton Mifflin Company.
Streiner, D.L., & Norman, G.R. (1995). Health measurement scales: A practical guide totheir development and use (2nd ed.). Oxford: Oxford University Press.
Szklo, M., & Nieto, E.J. (2000). Epidemiology: Beyond the basics. Gaithersburg, MD:Aspen Publishers.
Tufte, E.R. (2001). The visual display of quantitative information. Cheshire, CT: GraphicsPress.
Tufte, E.R. (1997). Visual explanations: Images and quantities, evidence and narrative.Cheshire, CT: Graphics Press.
Tufte, E.R. (1990). Envisioning information. Cheshire, CT: Graphics Press.
Ware, J.E. (1991). Conceptualizing and measuring generic health outcomes. Cancer, 67(3),774–779.
Ware, J.E., & Sherbourne, C.D. (1992). The MOS 36-Item Short-Form Health Survey (SF-36). Medical Care, 30(6), 473–483.
Ware, J.E., Snow, K., K, Kosinski, M., & Gandek, B. (1993). SF-36 Health Survey: Manualand interpretation guide. Boston: The Health Institute, New England Medical Center.
References 57
34411_CH02_021_058 6/24/05 12:13 PM Page 57

34411_CH02_021_058 6/24/05 12:13 PM Page 58