Embed Size (px)
Citation preview

Submitted to INFORMS Journal on Applied Analyticsmanuscript 101-11-20-OM
Authors are encouraged to submit new papers to INFORMS journals by means ofa style file template, which includes the journal title. However, use of a templatedoes not certify that the paper has been accepted for publication in the named jour-nal. INFORMS journal templates are for the exclusive purpose of submitting to anINFORMS journal and should not be used to distribute the papers in print or onlineor to submit the papers to another publication.
Designing an Integrated Delivery Routing Optimizerfor a Logistics Service Provider: Key Requirements,
Techniques and Lessons Learned.
Mayssoun MessaoudiMathematics and Industrial Engineering Department, Polytechnique Montreal, GERAD, [email protected]
Issmail El HallaouiMathematics and Industrial Engineering Department, Polytechnique Montreal, GERAD, [email protected]
Louis-Martin RousseauMathematics and Industrial Engineering Department, Polytechnique Montreal, CIRRELT, [email protected]
In this paper we present a real-life case study which investigates how to solve a rich vehicle routing problem
in practice. The study was carried out within a logistics service provider, operating in Morocco; an emergent
country. We provide a detailed description of the methodological approach that we have developed in practice.
This entails several steps including the problem assessment, the data preparedness and the modelling of cost
functions. Based on an exact primal algorithm, our solution approach was able to provide executable and
cost-effective transportation plans. Meanwhile, the flexible formulation and the algorithm framework made
it possible to accommodate technical and business-rule constraints. This study also reveals the complexity
of the LSP environment, and highlights its specific needs in terms of resilient and generic solution models.
Key words : Rich VRP; OR practice; integer primal algorithm; transport and logistics; decision-support
systems . . .
Introduction
With its 180 worldwide connections and proximity to the Strait of Gibraltar, Tangier
Med Port has become the 35th largest container port in the world (Source: Med Port Author-
ity). Surrounded by a multi-sector industrial hub including automotive, aeronautics, logis-
tics, textiles, food processing and trade, this world-world port has elevated Morocco to
a truly global scale of logistics. Since 2010, an ambitious national logistics strategy has
been launched to consolidate this dynamic and to upgrade the logistics sector in Morocco.
Indeed, the success of this transformation requires the emergence of integrated and efficient
1

Author: VRP System for a Logistics Service Provider2 Article submitted to INFORMS Journal on Applied Analytics; manuscript no. 101-11-20-OM
logistics service actors offering adapted and sophisticated services. Several 3PL operators
on the market offer an integrated range of logistics services including transport, warehous-
ing, order preparation and other value-added operations. The courier activity is growing
by 15% annually with more than 6 million parcels shipped annually, however, 40% of the
market is held by the informal sector. On another level, the market for IT equipment for
logistics has grown by 30 to 40% over the last 5 years. Nevertheless, the adoption rate of
IT remains low in the logistics sector in Morocco (Source: MLD Agency, National Strategy report, June
2016). Overall, the multiplication of operators on the market and the diversification of the
offer of logistics services had a beneficial impact on logistics costs. Despite these efforts,
logistics activities are severely penalized by: (i) unfair competition from the informal sector,
(ii) competition from new international actors, (iii) lack of transparency, and (iv) scarcity
of standardized regulations. This said, the implementation of the related action plan must
be the subject of close collaboration between the ministerial departments, local authorities
and stakeholders.
The present paper is a part of a project aiming at developing a new vehicle routing
optimizer for a 3PL provider which operates in an extremely complex landscape. This case
study summarizes the pre-implementation phase of our system. It is aimed at (i) testing the
performance of our solution on several real business configurations at a 3PL company, and
(ii) verifying that the developed system’s functionality meets specification and business
requirements.
The company that participated in this case study is SNTL Group, a leading Moroccan
logistics provider since 1937, offering a range of value-added services involving four business
activities: supply chain; infrastructure and urban logistic; fleet management; finance and
insurance. With the aim of contributing to the foundation of African resilient supply chain
solutions, the company has established a research centre, focusing on research, consulting,
certification and training activities.
The main contribution of this paper is an integrated approach able to provide prac-
tical and efficient vehicle routing solutions that integrate both the sourcing level (carrier
selection and outsourcing decision) and the control of operations, for long-haul and last-
mile deliveries. The proposed models and algorithms are based on a novel primal-based
algorithm that produces better solutions in smaller times compared to state-of-the-art
metaheuristics. In contrast with classical branch-and-price methods, the proposed approach

Author: VRP System for a Logistics Service ProviderArticle submitted to INFORMS Journal on Applied Analytics; manuscript no. 101-11-20-OM 3
can display numerous alternatives to the planner, who can then select the most suitable
solution and it guarantees feasible solutions wherever we stop the process.
This paper is organized as follows: first, we give an insight into the VRP systems. Next,
we describe the problem and the scope of our study. Then, we describe the overall process of
data preparedness, and the adoption of new technical and managerial patterns. Given the
unavailability of relevant data, managerial accounting techniques were used to construct
reliable cost models. After that, we describe our system’s capabilities. Finally, we report
the results achieved and the lessons learned.
Relevant Work
Logistics services providers (LSP), commonly known as the third party logistics provider
(3PL), are the backbone of logistics operations, and act as a link between the shipper and
its operational solutions by handling logistics and transportation operations and developing
both standardized and customized services.
In the operations research (OR) literature, planning transportation activities is defined
as a vehicle routing problem (VRP), often claimed to be easy to understand but hard to
solve. VRP has been extensively covered in the operations research literature in the sense
that it props up the logistics and transportation industry as well as the decision-making
process. In fact, in the years between 2009 and 2015, 277 papers have been published, they
are analyzed and classified in the VRP taxonomy of Braekers et al. (2015). More recent
study (Konstantakopoulos et al. 2020) revealed that 263 papers on the subject of freight
transportation have been published; from 2010 to 2020. We summarized some of their
results in Figure 1, which represents the classification of algorithms for the VRP. For each
class, the related number of published papers during the last decade is indicated between
parentheses.
The VRP literature shows a predominant trend of heuristics and metaheuristics, which
do not guarantee optimality, but they do find improving solutions for large-sized problem
instances within a reasonable amount of time. On the other hand, exact methods are rarely
applied to solve rich VRPs as they are computationally demanding.
3PLs handle logistics operations of different customers; hence, constraints atomize into
hundreds of complex ones, making route planning even more challenging and making it
impossible to solve the problem manually. Hence, using VRP software (VRPS) systems

Author: VRP System for a Logistics Service Provider4 Article submitted to INFORMS Journal on Applied Analytics; manuscript no. 101-11-20-OM
AppliedMethodsforsolvingVRPvariants
ExactMethods
(32)
ApproximateMethods
(374)
ColumnGenerationDynamicProgramming
Heuritics
(122)
Metaheuristics
(199)
Hybrid
(53)
ConstructionTwo-phaseLocalimprovements
PopulationsearchLocalsearch
Figure 1 Classification of algorithms for solving VRP variants, adopted from Lin et al. (2014) and Konstanta-
kopoulos et al. (2020)
helps them control costs and maintain customer service levels. The main capabilities of
commercial VRPS are presented in Figure 2; adopted from the studies of Rincon-Garcia
et al. (2018), Braysy and Hasle (2014), Crainic et al. (2009), Drexl (2012).
According to Drexl (2012), Braysy and Hasle (2014), Rincon-Garcia et al. (2018), Crainic
et al. (2009), commercial VRPS systems commonly use a large set of heuristics, derived
from published research, internally customized methods, and in-house algorithms (Holland
et al. 2017). Certainly, heuristic methods are fast and generally provide a good compromise
between efficiency and quality of the solution. However, some heuristic implementations are
tailored to work well in specific test instances, by carefully tuning parameters, these might
be a barrier to their practical take-up. Particularly, 3PLs market segment is known for
its dynamic constraints (new clients requirements, regulations amendments, etc). There-
fore, only agile and resilient VRP systems (Aka., algorithms) can keep these businesses
profitable.
Problem Statement
Through this section, we will present the general framework of our case study. We will
first introduce the scope of our mission, and then we will bring the reader closer to the
operational context of the company.
Scope and Mission
SNTL Supply Chain is a 3PL operating a very large central mixed flows logistics platform,
located in the vibrant economic centre of the country and benefiting from a multimodal

Author: VRP System for a Logistics Service ProviderArticle submitted to INFORMS Journal on Applied Analytics; manuscript no. 101-11-20-OM 5
Capabilities
Daily routing; weekly routing;
turn-by-turn route instructions;
re-optimization (orders, stops, rest
periods, etc); manual adjustments;
historical travel times; statistical
reports.
Supported constraints
Time-windows; heterogeneous fleet;
pickup-and-delivery; FTL/LTL shipment;
geographical restrictions; multi-criterion
compatibility; service times; driver rules
and skills; overnight parking and resting;
cost functions and tariffs.
Applied methods
Heuristics:
1) Constructive procedures:
Parallel saving; Insertion; Cluster
first, route second; Nearest Neighbour;
Proprietary
2) Improvement procedures:
Relocate; k -opt; Swap/exchange;
String-relocate; Cross/string-exchange;
Proprietary
Metaheuristics:
Tabu search; genetic algorithms; threshold
accepting; simulated annealing; adaptive
large neighbourhood search; ant colony
Exact:
Branch-and-cut; branch-and-price; column
generation; constraints programming
Performance:
Problem size:
Unrestricted (stops and vehicles)
Running time:
Seconds-20 minutes
Benchmarks:
Solomon VRPTW instances
Solomon (1987);
Gehring/Homberger VRPTW
instances Gehring and Homberger
(1999);
Li/Lim PDPTW instances Li and
Lim (2003)
Solvers
Cplex; Boost; COIN; Express;
Gurobi; LEDA
Figure 2 VRPS in a nutshell
logistic connectivity. The company is the exclusive logistics subcontractor for a wide range
of customers from different industries: household appliances (eg.,Samsung, Whirlpool, . . . ),
home furniture (eg.,Ikea), automotive (Renault), textile (Government) and food products.

Author: VRP System for a Logistics Service Provider6 Article submitted to INFORMS Journal on Applied Analytics; manuscript no. 101-11-20-OM
Transport operations fall into three categories: urban last-mile delivery, regional delivery
and national delivery.
As part of its 2025 strategic vision, the company wants to strengthen and develop its
transport offer both for inbound (long haul) and outbound (last mile) activities. On a fur-
ther level, the company is expanding rapidly in West Africa, hence the need for automated,
generic and resilient transport planning solutions that are effective in practice, scalable
with the dynamic environment of the 3PL, and that come as close as possible to the real
business process.
The study we are presenting in this paper is the result of a research project carried
out jointly with the company’s research centre over a period of 3 years. The elicitation
phase was the subject of a one-year observation internship within the company. Prior
implementation was carried out at the Samsung warehouse. The next step is to deploy to
production.
Template of an Operational Day
LSP manages the logistics activities of its contractors, by ensuring all operations from the
receiving of goods, through the storage, to the delivery of products as required by the final
customers. As illustrated in Figure 3, on a daily basis, contractors (retails or manufacturer)
receive purchase orders (POs) from their customers, spread throughout the country, and
transfer them from SAP to the 3PL’s WMS system. He also forwards the arrival plannings
(AP) in preparation for the receiving of goods at the warehouse. After the cut-off time, POs
are extracted to excel files, to proceed to a manual planning according to the cluster first,
customer second strategy. Then, the assignment of vehicles is carried out by a dedicated
department. Once the orders are prepared for the dispatch, the loading operators proceed
to place the parcels inside the vehicles following the delivery orders (DOs). Manual loading
operation is often efficient, as it is carried out according to field experience, whereas the
sequence of visits is the driver’s decision.
Delivery time agreements vary according to the transport type. Urban destinations must
be served within one day, while the lead time for regional and national deliveries is up to
two days. Plus, the company outsources some deliveries to an external courier service in
three cases: (i) the destination is poorly connected; (ii) the parcels are light but have high
value; and (iii) for facing urgent events. The in-house fleet consists of 300 vehicles of various
types and capacities (see Table 1), in addition to the external fleet, chartered as required.

Author: VRP System for a Logistics Service ProviderArticle submitted to INFORMS Journal on Applied Analytics; manuscript no. 101-11-20-OM 7
DO
POAP
PO
AP
PO
DO
Figure 3 Value Stream Mapping of the 3PL
Acronym GCW*(ton) Road Network
T1 3.5 Street class 1T2 7 Urban areaT3 14 Road class 2T4 19 Road class 3T5 25 Road class 3*Gross Combination Weight.
Table 1 Vehicles types and network classes
The 3PL orchestrates very heterogeneous flows in terms of customer segmentation, product
types and sectors. This amplifies the complexity of delivery planning, each one subject to
a different set of constraints as shown in Table 2.
Once we have introduced the global context of this study, we can observe that planning
transport activity for a 3PL is a major challenge, regulated by a set of endogenous and
exogenous constraints. In the following sections, we will describe the fundamental steps
and tools undertaken to solve this difficult problem.

Author: VRP System for a Logistics Service Provider8 Article submitted to INFORMS Journal on Applied Analytics; manuscript no. 101-11-20-OM
Attribute Related context
Time windows CustomersHeterogeneous fleet Customers, professionMin/Max fill rate Business-rules, regulationCompatibility (site/vehicle) Business-rulesCompatibility (product/vehicle) Business-rulesRestricted urban accessibility RegulationDriving hours Work-Unions
Table 2 The relevant attributes related to the 3PL context
Data Preparedness
In this section, we will outline a key stage for solving a VRP, namely the modelling and
the data preparedness. In what follows, we will present how to successfully conduct this
process.
Requirements Elicitation
In practice, things are not as neat and linear as they appear in theory. To gather, evaluate
and process accurate requirements, we have followed the following steps:
1) Requirements Gathering. Modelling a real-world problem involves hierarchical
sources of information, multi-echelon levels of flows, field-related practices, etc. We used
the following techniques:
- Observation: a one-year observation internship was carried out within the company.
The direct follow-up of the operations allowed us to identify the main delivery incidents
which involve order reject, order return and delivery failure. These incidents are mainly
triggered by wrong addresses, wrong orders, unavailable customers, reported requested
delivery dates, truck delays, technical problems, expired POs, and lost DOs.
- Interviews: involving executive managers, stakeholders, users, operators, drivers, cus-
tomers, and authorities.
- Analysis of internal documents: including customer database, carrier database, POs
history, DOs history, contracts agreements, financial reports, and legal documents.
Note that diversifying the sources of information contributes to building a mathematical
model that is close to reality and prevents obtaining solutions that are not feasible in
practice.
2) Evaluation. A good analysis of activities and flows allowed us to determine which
factors drive margins at the end-user node, which can be used as guidelines to best improve

Author: VRP System for a Logistics Service ProviderArticle submitted to INFORMS Journal on Applied Analytics; manuscript no. 101-11-20-OM 9
future profits. Also, this step provided opportunities to examine new supply chain and
distribution approaches. Indeed, the profit margin losses and the rise in operating costs
are not only the result of the distribution plans, but also the result of the global transport
master plan. That said, the mathematical program had to meet operational and strategic
objectives. At the end of this step, we have identified the weakest legs affecting both the
operational level (transport planning) and the strategic level (contract negotiation and
bidding). These are summarized in Table 3.
Operational level Strategic level
Faulty design of the transportation Low customer service levelnetwork and schedules. and responsiveness.Poor data accuracy. Complex business scenarios.Manual data entry. Cannot assign the best rate.Non-optimized planning capabilities No constraints are checkedacross different modes of deliveries. before the proposal.Non-compliance with regulation.
Table 3 The main inherent weaknesses in the process.
3) Prioritization. Since the context is extremely complex and entangled, incidents and
problems are recorded every hour and every day. Their global management is impossible,
however, the Pareto principle comes in handy in this context since that 80% of incidents
come from 20% of factors, the importance of prioritizing becomes therefore obvious. We
have identified the sources of the most penalizing problems which we will expand in the
following section; covering data correction.
4) Consolidation. Once the problem is understood, analyzed and separated, it was then
possible to consolidate the gathered requirements to set the mathematical formulation of
the rich VRP and the definition of its specific attributes. A careful study of the literature
investigating close VRP variants provided the guideline for the solution methods that
might be successful. Then, the next step is to analyze and prepare the key data.
Data Correction
The company suffers from a major challenge: many of the essential data components were
either incorrect, incomplete or unstructured. In what follows, we will describe how this
issue has been addressed. We will also provide the statistical analysis techniques that we
have used to model the cost functions. This crucial step, entailing correcting and building
data, required over 6 months of work.

Author: VRP System for a Logistics Service Provider10 Article submitted to INFORMS Journal on Applied Analytics; manuscript no. 101-11-20-OM
Customer address. Over a quarter of the customer addresses were incorrect. Physical
addresses have been corrected and then transformed into geocodes (i.e. latitudes and lon-
gitudes). For a dynamic adjustment, we utilized the internal tracking service to discard
long, problematic and risky roads. We will show latter how we were able to make accurate
delivery locations by introducing the new service address concept.
Service Time. Delivery stop times are heavily dependent on the processes that occur at
each delivery. These processes are often dictated by the customer receiving the delivery and
the sidewalk distance from the park point to the actual delivery point. The service time
was established with regard to the customer segment. It took into account the loading time
per unit of volume, the confirmation orders time, the average wait. These elements have
been developed based on the experience of the drivers, business rules, the geographical
area of the customers and the delivery reports which indicate the delay factors.
Customer segmentation. Customer analysis is a crucial step and must be done in a
loop to maintain control and be sure to integrate all constraints and relevant details. The
3PL manages a wide range of subcontractors from different industries. As a result, down-
stream customers are very heterogeneous in terms of geographical locations (urban, rural
areas), order characteristics (volume, declared value, type), and constraints (multiple time
windows, vehicle compatibility, service time). Thus, the customers and related constraints
had to be split into subsets.
Fleet of vehicles. The fleet K contains 300 owned vehicles, and when required, these are
chartered from external carriers. Each vehicle k ∈K is characterized by the type (rear open-
ing, side opening, swap body, semi-trailer); the volume capacity in cubic meters (CBM);
the Vehicle Fill Rate (VFR); the ownership (owned or chartered vehicle); the fixed cost
F k, and the variable cost V k. Note that the VFR is the ratio of the actual capacity used
in a vehicle to the total capacity available in terms of weight and volume. To secure loads
against movements, and to maximise efficiency, each vehicle must satisfy VFRmin = 60%
and VFRmax = 90%.
Business rules. It is extremely difficult to accommodate exogenous constraints for the
3PL as customers and flows come from different sectors. Business rules file was created,
where all rules and constraints from the profession, transport agreements, national trans-
port agency, the ministry, and work union were translated into appropriate readable rules.

Author: VRP System for a Logistics Service ProviderArticle submitted to INFORMS Journal on Applied Analytics; manuscript no. 101-11-20-OM 11
The Need for New Paradigms
Following the elicitation phase, we came up with the conclusion that financial inefficiency
comes both from operations and business models, highlighting the need not only to optimize
operations, but above all to implement new solutions paradigms based on best practices.
Service address vs. physical address. The thorough analysis of the data let us state that
the addresses of the customers appearing in the official files, represent physical addresses
and do not correspond to the accurate location where the deliveryman will park to make the
deliveries (delivery door or the loading dock). This results in errors of several kilometers and
hours. Indeed, in urban areas, stops and U-turns might cause security incidents, tickets and
delays. We have therefore come to an agreement that a new customer must communicate
his exact delivery address. For existing customers, the information was provided by their
agents and also by the drivers.
Courier service delivery option. We have already mentioned that, in predefined cases,
some deliveries are outsourced; they are operated by an external courier operator. By
analyzing transport costs, as well as the operational flows, we have noticed that parcel
delivery is a useful transport solution offering a good compromise between cost, efficiency
and safety. That said, we have integrated the courier option as a new vehicle type, and
the solver decides when to outsource a delivery according to the profitability of the route.
Note that additional assignment constraints have been considered, including the maximum
number of daily requests, or the order CBM range. The impact of this strategy will be
outlined in Table 6.
Inter-regional delivery. In order to facilitate planning, the internal business processes
banned inter-regional deliveries. As explained earlier, the operator consolidates orders so
that each vehicle visits one city. This decision was the result of a weak information sys-
tem and a lack of planning resources. Based on data analytic techniques, the distribution
network was clustered into five zones, connected by non-overlapping delivery axis. Also,
infeasible arcs regarding the real road network and traffic regulations were discarded.
Finally, nodes located at the same shopping malls and supermarkets were aggregated.
The distribution network was modelled on an expert-guided graph G(ASDd , VSDd) where
ASDd represents the connecting arcs towards the five shipping direction SDd, and VSDd
represents the cluster of customers where cycles are permitted. This modelling, efficiently
solved by the dynamic programming algorithm, made it possible to tackle both inter and
intra-regional deliveries, which proved to be very practical.

Author: VRP System for a Logistics Service Provider12 Article submitted to INFORMS Journal on Applied Analytics; manuscript no. 101-11-20-OM
Order planning. Loading and unloading operations benefit from the human know-how
and the field- experience, thus arrangement of the goods in the vehicles is often optimized.
Our concern was rather the automation of loading orders. This process must comply with
several constraints, mostly practical: (i) a stock keeping unit (SKU) cannot be split; (ii)
prioritize least-cost vehicles assignment; (iii) respect the permitted VFR intervals; (iv)
respect the customer contractual terms (full truckload and less than truckload modes);
and (v) minimize empty space.
After going through the crucial stages of modelling and preparedness, in the following
section, we will present the implemented solution, its components and advantages.
Managerial Accounting Techniques
In practice, the cost function is not always structured and yet further analytical processing
is required. Our objective function aims at maximizing the profit generated from operating
deliveries. It is calculated as revenue (transport rate less transport cost). In the following,
we will describe the statistical analysis tools we employed to model the transport rate and
the transport cost functions.
Transport Rate Model
The transport rate is the price paid by the customer n to receive the order ξn. For a
better comprehension, Figure 4 displays a sample of the pricing grid used by the 3PL. The
columns framed in red indicate thirty CBM volume intervals of the demand ξn, ranging
from 0.1 CBM to 40 CBM. The rate is quoted in accordance with the destination and
the volume interval. Here for example, a customer n, located in Boujdour, with demand
ξn = 0.26 CBM, will pay the rate circled in green. Note that for higher volumes, pricing is
switched to FTL; a flat rate depending on the destination and the shipment type (20”FN,
40”FH, 40”FN). The transport rate is a piecewise linear function, given by:
P(ξn) = Rnv × ξn av ≤ ξn ≤ bv ∀v= 1,2, . . . ,30 (1)
where Rnv stands for rate associated with the vth volume interval [av, bv].
Transport Cost Model
In what follows, we describe the steps that allowed us to model the transport cost function.

Author: VRP System for a Logistics Service ProviderArticle submitted to INFORMS Journal on Applied Analytics; manuscript no. 101-11-20-OM 13
Figure 4 Example of the transport rate (tariffs) data file
Figure 5 Example of the transport cost data file
Linear Interpolation. To analyze the total transport cost, we examined first the relative
database, an extract of which is presented in Figure 5.
On the one hand, we can notice that for each destination and for each vehicle type,
there are several price quotations offered by third-party carriers. For the sake of simplicity,
and since these offers are generally similar, we have considered an average transportation
cost per destination and for each vehicle type. On the other hand, as it is shown in Figure
5, entries for truck type T2 are not available. Therefore, we used the linear interpolation
technique to predict the missing transport cost from data of trucks T1 and T3, according
to the following interpolation equation:
y2 = y1 + (y3− y1)(x2−x1)
(x3−x1)
where xi (resp., yi) is the volume capacity (resp., the transport cost) of vehicle Ti, i= 1,2,3.
Linear Regression Analysis. In this section, we explain how regression analysis was used
to estimate fixed and variable costs of each vehicle type. First, in the input data file (see

Author: VRP System for a Logistics Service Provider14 Article submitted to INFORMS Journal on Applied Analytics; manuscript no. 101-11-20-OM
Figure 5), we added a column that displays the distance travelled between the destination
(city) and the central warehouse. Then, linear regression was calculated to predict variable
cost V k of vehicle k (dependent variable) based on the travelled distance ηk by vehicle k
(independent variable). In fact, linear regression uses a series of mathematical equations
to find the best possible fitting line to the data points (see example in Figure 6).
Regression analysis calculates: CkT the total cost; F k the fixed cost; V k the variable cost
per travelled distance units ηk, where distance is measured in kilometers and costs are
measured in Moroccan currency (MAD). The total transport cost is given by:
CkT = V k× ηk +F ∀k ∈K (2)
Regression analysis in Excel ToolPak add-in provided the summarized output presented in
Table 4. In the column marked “Coeff”, the number labeled F k is a statistical estimate of
the fixed cost, and the number labeled V k is a statistical estimate of the variable cost per
distance unit. The column labeled “p−value” expresses the level of statistical significance.
Finally, columns 4 and 5 display the confidence interval values.
Costs Coeff p-value Lower 95% Upper 95%
F k 510.74 1.4e-11 396.15 625.33
V k 5.45 3.2e-41 5.23 5.67
(a) Vehicle type K1 = 3.5t
Costs Coeff p-value Lower 95% Upper 95%
F k 528.27 4.1e-09 381.79 674.75
V k 6.73 1.4e-40 6.45 7.01
(b) Vehicle type K2 = 7t
Costs Coeff p-value Lower 95% Upper 95%
F k 545.82 1.1e-06 349.91 741.73
V k 8.01 2.3e-38 7.64 8.38
(c) Vehicle type K3 = 14t
Costs Coeff p-value Lower 95% Upper 95%
F k 458.96 6e-08 316.15 601.78
V k 9.59 7e-48 9.32 9.86
(d) Vehicle type K4 = 19t
Costs Coeff p-value Lower 95% Upper 95%
F k 499.97 1e-05 292.50 707.44
V k 12.21 2e-45 11.81 12.60
(e) Vehicle type K5 = 25tTable 4 Regression analysis calculations summary for each vehicle type

Author: VRP System for a Logistics Service ProviderArticle submitted to INFORMS Journal on Applied Analytics; manuscript no. 101-11-20-OM 15
y = 6.7309x + 528.28R² = 0.9814
0
2000
4000
6000
8000
10000
12000
14000
0 200 400 600 800 1000 1200 1400 1600 1800
Tota
l Cos
t (M
AD)
Travelled distance (km)
The best fitting regression line (Truck T2, 7ton)Observed dataRegression line
Figure 6 Regression line, vehicle type T2
From Project to Reality
After a period of testing on several configurations, we were able to successfully implement
the solution. Notations, mathematical formulations and algorithms are provided in the
Appendix. For extensive details on the primal-based solution approach, we refer the reader
to the following papers Tahir et al. (2019), Messaoudi et al. (2020), Zaghrouti et al. (2014),
Bouarab et al. (2017).
Applied Methods
The main objective aimed at solving a complex vehicle routing problem, with time windows,
a heterogeneous fleet, site compatibility, delivery options and a set of business constraints.
The master problem (MP) was modelled as a set partitioning problem (SPP). The subprob-
lem (SP) was modelled as the shortest path with resource constraints (SPPRC), defined
on a customized cyclic urban network, and solved using a dynamic programming (DP)
algorithm (Feillet et al. 2004). To provide feasible and efficient solutions, we utilized a pri-
mal integer programming algorithm, called integral column generation (ICG) (Tahir et al.
2019). ICG is a sequential algorithm, embedding an integral primal algorithm in a column
generation scheme. As shown in Figure 7, the column generation (CG) process splits the
problem into two problems: SP and restricted MP (RMP). The latter is solved using the
integral simplex using decomposition (ISUD) algorithm (Zaghrouti et al. 2014) and decom-
posed into two subproblems: (i) the reduced problem (RP) contains a very small number

Author: VRP System for a Logistics Service Provider16 Article submitted to INFORMS Journal on Applied Analytics; manuscript no. 101-11-20-OM
of variables and constraints. (ii) The complementary problem (CP) finds a direction which
improves the actual solution by updating the set of variables and constraints.
Pricingsubproblem(SP)
Simproved
NeighbourhoodSearch(NS)
Simproved
ReducedProblem(RP)
improvingdirectiond
ComplementaryProblem(PC)
Snotsufficientlyimproved
dualsolutions
columns
Figure 7 ICG algorithm process
ICG takes advantage of the performance of CG and the dynamic decomposition of the
RMP allowing its fast re-optimization. Also, the primal programming framework guaran-
tees that the feasible solutions can be obtained at any moment of the solution process; no
necessity to wait until the final iteration. The four ICG modules collaborate in a coordi-
nated approach to find fast and feasible solutions, without time-consuming tuning proce-
dures, as only three easy parameters are used. Mainly, the latter define, according to the
situation, the improvement rate of the output solutions as well as the stopping conditions
of the process.
Key Features
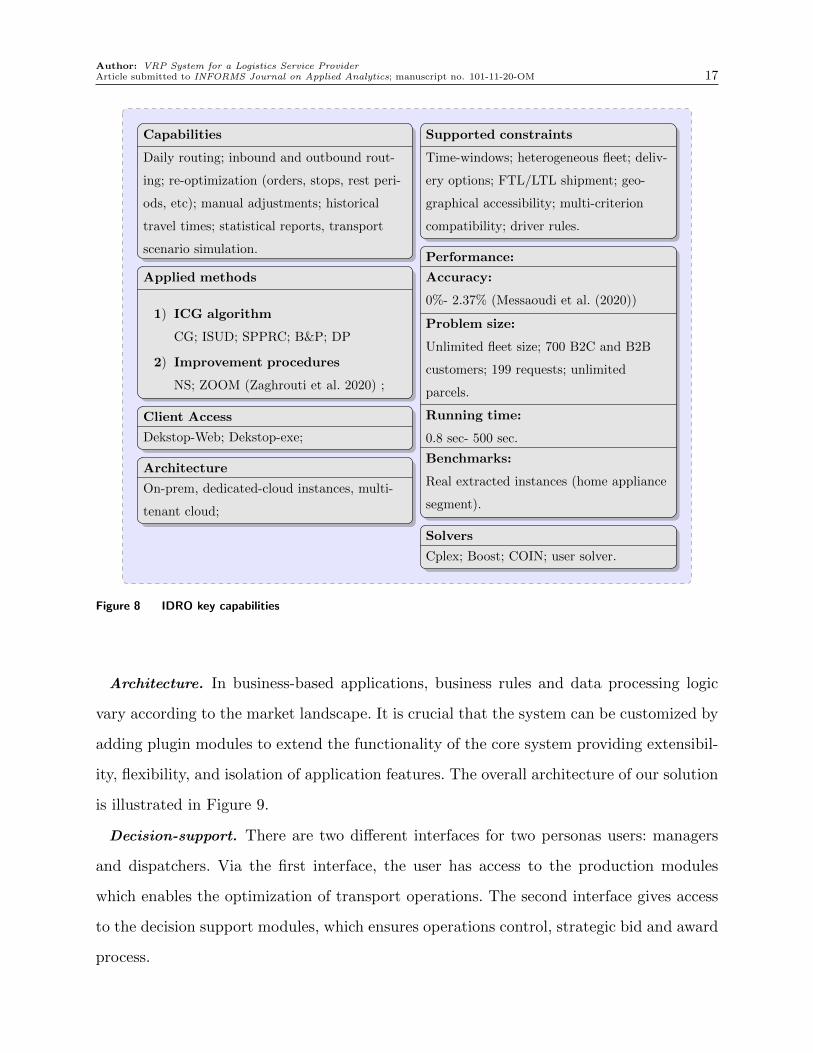
The main features of our systems are summarized in Figure 8. The integrated delivery
routing optimizer (IDRO) provides many advantages:
Algorithm. The solution approach is a fair compromise between the efficiency of heuristic
methods and the reliability of exact methods, which results in a neat and generic scientific
code; thus, the system does not become obsolete if it is confronted with new constraints or
new customers. Indeed, SPPRC makes it possible to accommodate complex and non-linear
constraints, while the neat decomposition of RMP provides fast re-optimization, required
in case of a vehicle breakdown, insertion or cancellation of orders, road closures, etc.
Author: VRP System for a Logistics Service ProviderArticle submitted to INFORMS Journal on Applied Analytics; manuscript no. 101-11-20-OM 17
Capabilities
Daily routing; inbound and outbound rout-
ing; re-optimization (orders, stops, rest peri-
ods, etc); manual adjustments; historical
travel times; statistical reports, transport
scenario simulation.
Supported constraints
Time-windows; heterogeneous fleet; deliv-
ery options; FTL/LTL shipment; geo-
graphical accessibility; multi-criterion
compatibility; driver rules.
Applied methods
1) ICG algorithm
CG; ISUD; SPPRC; B&P; DP
2) Improvement procedures
NS; ZOOM (Zaghrouti et al. 2020) ;
Client Access
Dekstop-Web; Dekstop-exe;
Architecture
On-prem, dedicated-cloud instances, multi-
tenant cloud;
Performance:
Accuracy:
0%- 2.37% (Messaoudi et al. (2020))
Problem size:
Unlimited fleet size; 700 B2C and B2B
customers; 199 requests; unlimited
parcels.
Running time:
0.8 sec- 500 sec.
Benchmarks:
Real extracted instances (home appliance
segment).
Solvers
Cplex; Boost; COIN; user solver.
Figure 8 IDRO key capabilities
Architecture. In business-based applications, business rules and data processing logic
vary according to the market landscape. It is crucial that the system can be customized by
adding plugin modules to extend the functionality of the core system providing extensibil-
ity, flexibility, and isolation of application features. The overall architecture of our solution
is illustrated in Figure 9.
Decision-support. There are two different interfaces for two personas users: managers
and dispatchers. Via the first interface, the user has access to the production modules
which enables the optimization of transport operations. The second interface gives access
to the decision support modules, which ensures operations control, strategic bid and award
process.

Author: VRP System for a Logistics Service Provider18 Article submitted to INFORMS Journal on Applied Analytics; manuscript no. 101-11-20-OM
User Interface
IDRO-optimizerICG
Customers BusinessRules
Expert user Interface
Routegenerator(SP)
Masterplanner(RMP)
RP CP
Simulation KPIs
Distance
Figure 9 IDRO architecture overview
System parameters. We use five parameters that are easy to configure and understand,
without requiring that the user should have technical or theoretical knowledge. In addition,
it is possible to set up default settings by type of business or contractors.
Human knowledge. The system accommodates manual interventions for example set up
priorities, discard some constraints, activate and deactivate vehicles, etc. Besides, a feasible
solution is always available, means that the dispatcher could stop the process whenever he
deems it beneficial. This is a particularly required asset in breakdown situations.
Available information. It is crucial for a primal algorithm to start from a good initial
point to enhance its performance. Thus, we take advantage of available information such as
delivery history to build feasible visit patterns. The algorithm is primal insofar as it opti-
mizes the problem itself and uses the currently available information to build the improving

Author: VRP System for a Logistics Service ProviderArticle submitted to INFORMS Journal on Applied Analytics; manuscript no. 101-11-20-OM 19
solutions. In such a competitive environment, governed by bidding and contracting, it is
essential to capitalize on the information at hand.
Results and Impact
Through this section, we will present the impact that the solution has achieved. The
realized benefit is roughly divided into financial and nonfinancial components.
Financial Results
The finance department has estimated a 5% increase in overall profit, and is projecting 15%
growth within 5 years, with roll-out to all other seven warehouses. Table 5 reports a small
insight on the performance of the integrated delivery route optimizer (IDRO); compared
to the in-house solution of the 3PL. For a meaningful, unbiased results, the instances
correspond to nine operational days from different periods. Column 1 is for the name of the
instance (Name). Column 2 is for the number of customers (|N |). Column 3 displays the
percentage of customers served through a last-mile network (% L.Mile). Columns 4 and 7
display the financial profit generated by the route in Moroccan currency (Profit); columns
5 and 8 display the number of trucks (Nb.Trucks). Finally, column 6 displays the total
computing real time in seconds (Time). IDRO successfully solved all the instances in just
a few seconds. This applies even to large instances. The gain is calculated as the difference
between the profit made by our solution and the profit made by the in-house solution.
The partial profit achieved by IDRO showed a substantial improvement compared to the
in-house solution ( 50%). The total projected gain was estimated considering: (i) roll-out
to the other seven warehouses, (ii) coverage of all customers, and (iii) the average number
of daily requests. Finally, we note that no profit could be achieved for the instance S-03.
Indeed, this is the result of poorly negotiated selling rates.
Nonfinancial Results
Service Address. The new geocoding paradigm we have introduced made it possible to
locate the exact address of the unloading, avoiding delays, U-turns and stops. This has
resulted in considerable savings in terms of delivery times. A minimum of 15 minutes per
route visiting 3 customers can be saved. For an average of 45 vehicles per day, this results
in monthly savings of 20,250 minutes.

Author: VRP System for a Logistics Service Provider20 Article submitted to INFORMS Journal on Applied Analytics; manuscript no. 101-11-20-OM
Instance IDRO In-house.Sol
Name |N | % L.Mile Profit(MAD) Nb.Trucks Time(sec) Profit(MAD) Nb.Trucks
S-01 27 78 3768 21 1.15 2505 8S-03 34 76 -1207 26 0.62 -6027 6S-04 40 90 2100 36 2.2 510 4S-05 45 38 5780 17 2.29 3700 13M-02 63 65 4005 41 7.48 1711 9M-03 66 52 3708 34 6.61 2600 18M-04 66 89 2080 59 7.36 594 18M-05 83 64 6200 53 24.46 5500 10M-08 98 41 7048 40 67.61 5390 23
Total 9-day profit 33,482 16,4839-day gain (MAD) 16,999Annual partial gain (US) 49,485.98Annual total gain (US) 519,277,5
Table 5 Numerical results comparing IDRO and the in-house solution on 9 real instances
Courier Service delivery option. Let us now look at the impact of the courier service
integration. Table 6 compares the performance of the algorithm implemented with and
without the courier delivery option: IDRO and DRO, respectively. The improved version
yielded a daily substantial cost decrease, reaching 1,600 US on average.
Instances IDRO DRO
Name |N | Time(sec) Cost(MAD) No.Veh Time(sec) Cost(MAD) No.Veh
S-03 34 0.9 6854 26 1.1 27891 10S-04 40 4.4 5294 36 5.6 23209 10S-07 49 1.1 27099 21 2.2 30676 14M-01 62 4.4 9366 50 709 35752 14M-03 66 6.6 18775 34 19.8 31979.8 14M-04 123 12.9 116130 59 12.87 129783 52
Avg 62 4.6 30586 38 125 46548.9 19
Table 6 Quantitative impact of the Courier Service delivery options on six real-world instances
Customer service. An analysis of the results obtained over a period of 30 days showed
that delivery incidents were reduced by 70%, particularly those caused by address errors,
delays, order errors and lost documents. Incidents intrinsic to the customers and to the
fleet’s management are still persistent, and are the result of the holistic environment.
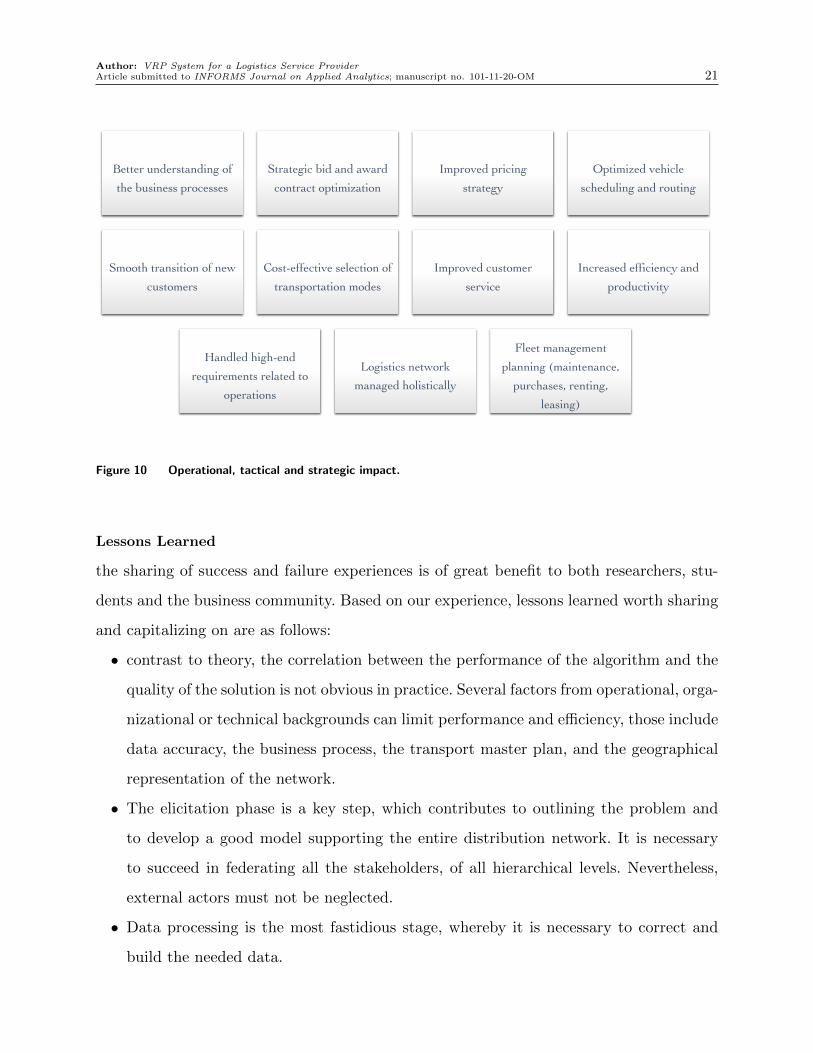
From operational, tactical and strategic angles, the indirect repercussions of the solution
are summarized in Figure 10.
Author: VRP System for a Logistics Service ProviderArticle submitted to INFORMS Journal on Applied Analytics; manuscript no. 101-11-20-OM 21
Better understanding of the business processes
Strategic bid and award contract optimization
Improved pricing strategy
Optimized vehicle scheduling and routing
Smooth transition of new customers
Cost-effective selection of transportation modes
Improved customer service
Increased efficiency and productivity
Handled high-end requirements related to
operations
Logistics network managed holistically
Fleet management planning (maintenance,
purchases, renting, leasing)
Figure 10 Operational, tactical and strategic impact.
Lessons Learned
the sharing of success and failure experiences is of great benefit to both researchers, stu-
dents and the business community. Based on our experience, lessons learned worth sharing
and capitalizing on are as follows:
• contrast to theory, the correlation between the performance of the algorithm and the
quality of the solution is not obvious in practice. Several factors from operational, orga-
nizational or technical backgrounds can limit performance and efficiency, those include
data accuracy, the business process, the transport master plan, and the geographical
representation of the network.
• The elicitation phase is a key step, which contributes to outlining the problem and
to develop a good model supporting the entire distribution network. It is necessary
to succeed in federating all the stakeholders, of all hierarchical levels. Nevertheless,
external actors must not be neglected.
• Data processing is the most fastidious stage, whereby it is necessary to correct and
build the needed data.

Author: VRP System for a Logistics Service Provider22 Article submitted to INFORMS Journal on Applied Analytics; manuscript no. 101-11-20-OM
• Allow two to three attempts to reach a first suitable solution. Each attempt should
serve as a prototype, which will be used to gain shareholder support when validating
decisions or new investments.
• The risk entailed by organizational changes, and business process reevaluation should
be expected. Solutions must be smoothly implemented close to the drivers and oper-
ators to reduce and manage their resistance to change.
• Separating customers into sub-segments enables clustering customers with similar
needs, which leads to a more effective analysis.
• Develop the skill to transform complex mathematical models and business processes
into simple configuration such that the user does not see the complexity.
Conclusion
In this paper, we presented a summary of a real case study conducted within a 3PL. The
objective was twofold: (i) to show what the implementation of VRP looks like in practice,
and (ii) to highlight the needs of 3PLs in terms of planning and optimization tools to face
the great challenges they face. In this study, we presented the various stages that led to the
implementation of the solution. The direct follow-up of the operations on the field and the
close collaboration with the actors gave us a good understanding of the flows, bottlenecks,
sources of losses and also the potential areas for improvement. To summarize, the solution
was able to achieve interesting results on the operational, tactical and strategic levels.
With the aim of creating solutions capable of solving more general VRPs, our system is
currently undergoing improvement, by the integration of additional improving and accel-
erating approaches, from heuristics to Machine Learning techniques.

Author: VRP System for a Logistics Service ProviderArticle submitted to INFORMS Journal on Applied Analytics; manuscript no. 101-11-20-OM 23
Appendix
Notation
In the remainder, we use the notation organized in Table 7.
Notation Type Description
Ω − Set of feasible routesN − Set of customers to visitK − Set of heterogeneous k-type vehicles
air binary Is equal to 1 if and only if customer i is served by route r
ξi real Demand associated with customer i∈Npr real Profit collected by the route r ∈Ωqk real Capacity of vehicle k ∈K
θr binary Is equal to 1 if and only if route r is selected
Table 7 Mathematical notation
Mathematical Models
The master problem and the subproblem are formulated as SPP and SPPRC, respectively.
(SPP ) : maxθ
∑r∈Ω
prθr (3)
s.t.∑r∈Ω
airθr = 1 ∀i∈N, (4)
θr ∈ 0,1 ∀r ∈Ω (5)
Each variable θr is associated with a feasible route r ∈Ω which specifies a sequence of customers i∈N to be
served. The objective function (3) aims to maximize the profit made by the feasible route r. The constraints
(4) guarantee that each customer is delivered exactly once. The choice of binary variables is imposed by
(5). The subproblem is modelled as a shortest path problem with resource constraints, and is solved using a
dynamic algorithm as shown in Feillet et al. (2004). We have one supbroblem for each k−vehicle, put simply
we omit the k-index. The reduced cost of feasible route r travelled by k−vehicle, starting and ending at the
depot O and visiting a sequence of customers i∈N is computed as :
pr = pr −∑i∈N
airπi > 0
where π is the dual variable associated to the partitioning constraints (4). If all columns have negative
reduced cost, the algorithm stops and an optimal solution is obtained for the linear relaxation of (SPP )
(3-4).

Author: VRP System for a Logistics Service Provider24 Article submitted to INFORMS Journal on Applied Analytics; manuscript no. 101-11-20-OM
ISUD Algorithm
Columns in A are partitioned into three sets such that:
A=[S C I
]Where S, C and I denote respectively the columns of the current integer solution, compatible columns subset
and incompatible columns subset. ISUD algorithm (see Algorithm 1), splits the RMP into two small sub-
problems: the complementary problem (CP ) handles the incompatible columns and finds a descent direction
d leading to an improved solution, while the reduced problem (RP ) handles the compatible columns and
seeks to improve the current solution. Let θ denote the current integer solution, and d denote the direction
leading to the next improved solution.
Algorithm 1: ISUD pseudocode
1 Find initial solution θ0 and set θ← θ0
2 [S C I]← Partition the binary matrix A into columns subsets
3 do4 Solve RMP (θ,C) to improve the current solution
5 (ZCP , d)← Solve CP to find a descent direction6 while ZCP > 0 and d is integer
7 θ= θ+ d
8 return θ
ICG Algorithm.
The integral column generation (ICG) algorithm is outlined in Algorithm 2.
1. The initialization step builds an artificial initial solution (θ0, π0).
2. The first step starts by solving the subproblems SP (πt). Using the duals πt, positive-reduced cost
routes are generated and included in RMP. If no such routes are generated, we stop the algorithm and
the best solution found θ∗ is returned.
3. In the second step, ISUD solves the RMP to improve the solution. The criterion minImp decides
whether the improvement is sufficient or not. If so, neighborhood search is explored around θt by solving
a very small MIP using a commercial solver (Cplex ). This improvement step is iterated until the number
of consecutive improvement failures consFail reaches maxConsFail.

Author: VRP System for a Logistics Service ProviderArticle submitted to INFORMS Journal on Applied Analytics; manuscript no. 101-11-20-OM 25
Algorithm 2: ICG pseudo-codeParameters: maxConsFail, minImp.
Initialize : t← 0; (θ,π)← (θ0, π0); consFail← 0
Output : (z∗, θ∗)
1 repeatStep 1: CG
2 Ω′← Solve the SP (πt)
3 if Ω′ =∅ then4 break
5 end
6 Ω←Ω′ ∪Ω
7 t← t+ 1
Step 2: RMP
8 (θt, zt, πt)← Solve the RMP using ISUD
9 if zt−1−ztzt−1 ≤minImp then
10 consFail← consFail+ 1
11 θtNS← search an improved solution around θt by solving a restricted MIP
12 if ztNS > zt then
13 θt← θtNS
14 (θt, zt, πt)← Resolve RMP using ISUD15 end16 else17 consFail← 0
18 end
19 (z∗, θ∗)← (zt, θt)20 until consFail≥maxConsFail
21 return (z∗, θ∗)

Author: VRP System for a Logistics Service Provider26 Article submitted to INFORMS Journal on Applied Analytics; manuscript no. 101-11-20-OM
References
Bouarab H, El Hallaoui I, Metrane A, Soumis F (2017) Dynamic constraint and variable aggregation in
column generation. European Journal of Operational Research 262(3):835–850.
Braekers K, Ramaekers K, Van Nieuwenhuyse I (2015) The vehicle routing problem: State of the art classi-
fication and review. Computers & Industrial Engineering .
Braysy O, Hasle G (2014) Chapter 12: Software tools and emerging technologies for vehicle routing and
intermodal transportation. Vehicle Routing: Problems, Methods, and Applications, Second Edition,
351–380 (SIAM).
Crainic TG, Gendreau M, Potvin JY (2009) Intelligent freight-transportation systems: Assessment and the
contribution of operations research. Transportation Research Part C: Emerging Technologies 17(6):541–
557.
Drexl M (2012) Rich vehicle routing in theory and practice. Logistics Research 5(1):47–63.
Feillet D, Dejax P, Gendreau M, Gueguen C (2004) An exact algorithm for the elementary shortest path
problem with resource constraints: Application to some vehicle routing problems. Networks 44(3):216–
229.
Gehring H, Homberger J (1999) A parallel hybrid evolutionary metaheuristic for the vehicle routing problem
with time windows. Proceedings of EUROGEN99, volume 2, 57–64 (Citeseer).
Holland C, Levis J, Nuggehalli R, Santilli B, Winters J (2017) Ups optimizes delivery routes. Interfaces
47(1):8–23.
Konstantakopoulos GD, Gayialis SP, Kechagias EP (2020) Vehicle routing problem and related algorithms
for logistics distribution: a literature review and classification. Operational Research 1–30.
Li H, Lim A (2003) A metaheuristic for the pickup and delivery problem with time windows. International
Journal on Artificial Intelligence Tools 12(02):173–186.
Lin C, Choy KL, Ho GT, Chung SH, Lam H (2014) Survey of green vehicle routing problem: past and future
trends. Expert systems with applications 41(4):1118–1138.
Messaoudi M, El Hallaoui I, Rousseau LM, Tahir A (2020) Solving a real-world multi-attribute vrp using a
primal-based approach. International Symposium on Combinatorial Optimization, 286–296 (Springer).
Rincon-Garcia N, Waterson BJ, Cherrett TJ (2018) Requirements from vehicle routing software: perspectives
from literature, developers and the freight industry. Transport Reviews 38(1):117–138.
Solomon MM (1987) Algorithms for the vehicle routing and scheduling problems with time window con-
straints. Operations research 35(2):254–265.
Tahir A, Desaulniers G, El Hallaoui I (2019) Integral column generation for the set partitioning problem.
EURO Journal on Transportation and Logistics 8(5):713–744.
Zaghrouti A, El Hallaoui I, Soumis F (2020) Improving set partitioning problem solutions by zooming around
an improving direction. Annals of Operations Research 284(2):645–671.

Author: VRP System for a Logistics Service ProviderArticle submitted to INFORMS Journal on Applied Analytics; manuscript no. 101-11-20-OM 27
Zaghrouti A, Soumis F, El Hallaoui I (2014) Integral simplex using decomposition for the set partitioning
problem. Operations Research 62(2):435–449.