Embed Size (px)
Citation preview
TRANSPORTATION RESEARCH RECORD 1273 21
Designing an Improved International Passenger Processing Facility: A Computer Simulation Analysis Approach
VICTOR GULEWICZ AND }IM BROWNE
During the past 20 years, the management engineering and analysis group of the Port Authority of New York and New Jersey has periodically performed design and operational evaluations of the international passenger processing system facilities at the John F. Kennedy International Airport. The most recent effort included the development and validation of a computer simulation model of the Federal Immigration and Naturalization and Customs Services and the baggage processing operations. This model was developed to perform operational analyses of planned improvements to the federal inspection facilities. The simulation was initially used to evaluate the expected operational performance of two alternative baggage system expansion plans. The model development, initial model application, and results are described in this paper.
The Port Authority of New York and New Jersey is a public agency responsible for promoting and facilitating trade, commerce, and transportation in the New York-New Jersey region. It is a self-supporting bistate agency that finances it activities through bonds paid off by its own revenues. It has about $6 billion invested in existing transportation (tunnels and bridges, airports, bus and marine terminals, rapid transit, etc.) and trade and commerce facilities (World Trade Center, industrial parks, etc.). An equal amount of capital expenditures is currently being spent for new facilities and improvements of existing ones.
The three major New York metropolitan airports are operated by the Port Authority under long-term leases from local governments, and the authority is responsible for such commonuse facilities as runways and taxiways, heating, ventilating and air conditioning plant and equipment, roadways, and security, among other things. The Port Authority plans an approximately $3 billion package of expansions and improvements for John F. Kennedy International Airport (JFK), which will include new roadways, a new transportation center, a hotel, and passenger and baggage distribution systems that will serve some 45 million passengers a year by the turn of the century. More than 30 million air travelers currently use JFK annually. The goal is that it will remain competitive and meet air transport needs in the year 2000 and beyond. The International Arrivals Building (JAB) is a common-use facility that handles about 50 international air carriers and their passengers. The Port Authority is responsible for the planning, design, operation, and maintenance of this facility. Both the Port Authority and the airlines using the common federal inspection ser-
Port Authority of New York and New Jersey, One World Trade Center, 48th Floor, New York, N.Y. 10048.
vices (immigration, customs, and agricultural processing) at the JAB are, of course, concerned about the levels of service provided during the interim period from now until the end of the 1990s when the airport redevelopment program is completed.
MODEL DEVELOPMENT
Objectives and Scope
JFK staff requested the Port Authority to develop a simulation model of the federal inspection services and baggage claim processes. Upon development and validation, the model would be used to evaluate alternative plans, facilities and equipment, and operations in terms of their expected service levels and adequacy to handle future projected demand. It was agreed that the full federal inspection system from "blocking" (arrival at gate) of the aircraft through immigration processing, baggage delivery and pick up, and customs inspection should be modeled because these operations are integral to the system. Desired evaluative data included estimates of flows, queues, and space requirements for each process as well as the expected elapsed times for different categories of passenger from block time to clearing of customs. The initial application, described later, was to evaluate alternative plans to replace existing baggage claim devices, because some extended delays were occurring during peak periods.
Study Duration and Approach
Model development was designed to be completed in 4 months, including model structuring, data collection to obtain processing rates, programming in General Purpose System Simulation (GPSS), validation testing, and reporting on the evaluations. An appropriate model was needed to complete the initial application within 6 months. Primary reasons for choosing GPSS for personal computers was to maintain independence and reduce coordination requirements and possible delays in a mainframe environment. Also, the GPSS "gather" command facilitates increased accuracy in analyzing baggage claim operations by keeping track of individual passenger and bag movements. The simulation assigns each bag to the associated passenger, randomly mixes bags, and models the matching process at the baggage belt so that each passenger leaves the area only when all of his or her bags have arrived. This pro-

22
vides the potential for greater accuracy than treating baggage claim as a fixed processing-rate activity or estimating the number of passenger-bag matches by formula.
Model Assumptions and Inputs
The development of a simulation model of the federal inspection and baggage claim process was important to international airlines to ensure competitiveness and service levels while maintaining reasonabie costs at the IAB. Therefore, the management engineering and analysis study team and the Port Authority manager who requested the study met on a number of occasions with the Kennedy International Airport Tenants Association (KIATA), a group representing airline needs and viewpoints, to obtain concurrence on its plans and objectives and to develop a set of assumptions on which the model would be based. Thus, the basic assumptions and methodology were agreed upon before programming the model began. The major concepts and relationships used in the simulation are described in the next section. Input data on flow rates, passenger walking times, baggage delivery and unloading rates, and so on, were obtained by direct observation and data collection. Projected airline schedules and citizen and visitor passenger loadings were available from a previous forecasting study. For the initial application of the model these inputs and assumptions were reviewed and modified as necessary (e.g., level and time frame for passenger demand and arrival) to satisfy the specific requirements of the analysis.
Model Structure
The conceptual basis of the simulation model is that the passenger and baggage flows in the model will predict flows in the actual operation; thus the flowchart mirrors the operation that occurs at the airport. Figure 1 is a simplified flowchart
PASSENGERS l
PLANE ARRIVAL
BAGGAGE UNLOADING
I DELIVERY TO BELT
CUSTOMS PROCESSING
FIGURE 1 Conceptual model of the operation.
TRANSPORTATION RESEARCH RECORD 1273
of the operation and of the model for each aircraft arrival. Of course, the simulation has its "internal clock" and keeps track ot all planes, passengers, and baggage m the system. This flowchart describes the sequence of operations for each plane arrival.
When the simulation reaches the arrival time of the plane, the program stores key data including the block time; the citizen-to-visitor ratio; location of plane arrival at a wing. finger, or remote gate; and the number of passengers and bags. Passenger "transactions" are generated; these are the units that are tracked as they progress through the remainder of the simulation logic over the time being simulated. The model also generates and randomly mixes the apropriate number of bags, each carrying a special code (parameter value) to identify the passenger to whom it belongs.
On the basis of the blocking location (wing, finger, or remote gate) of the flight, passengers are assigned walk times to immigration processing (for those from outside the United States) or to baggage claim (for citizens). Immigration processing rates are based on direct observations of immigration outflows for differenl numbers of boolhs in opera lion. Similarly, Limes required for delivery of bags to assigned baggage belts and unloading rates for the transfer of bags from delivery cart to belt are based on actual rates observed for specified unloading crew sizes. The passenger-bag matching process at baggage claim is modeled so that a passenger does not leave until all associated bags are available on the belt and claimed. Observations showed that once the passenger and associated bag or bags were available, the bag or bags were claimed within one revolution of the baggage belt. This time is incorporated into the travel to customs for each passenger.
The modeling of the customs operation allows for the designation of three different processing rates-one for "red" booths (for passenger with goods to declare), one for "green" booths (for other passengers), and an expedited processing rate for cases in which total queues exceed a certain leveland "rovers" (additional moving inspectors) are introduced to speed processing.
Output Information
Because the simulation tracks each passenger and bag through the process, there is great flexibility in the types of output that can be obtained to meet a user's needs. Examples of typical output information are described. For each major processing area (immigration, baggage claim, customs), the simulation routinely summarizes waiting time and queue-length data. Queues at each of these operations are typically provided at 5-min (or shorter, if needed) intervals so that the performance of the component parts of the federal inspection process can be tracked through the peak period and interrelationships identified. For example, in baggage claim, this would include both the number of passengers and the number of bags so that estimates of required belt capacities and floor space can be calculated. Delays in unloading bags due to unavailability of belts are also accumulated, if desirell. The elapsed times to or between each of the key points in the operation (immigration, baggage claim, and customs) are routinely provided. A wide variety of specialized outputs can be obtained by making minor modifications to the program.

Gulewicz and Browne
Validation
In addition to cooperative development of assumptions with facility and airline staff and establishment of processing rates and other operational data on the basis of on-site observations to ensure realism and accuracy in the model, an extensive validation test and analysis were performed. On a peak day, two data teams visited the IAB and simultaneously collected operational data . One team obtained input and processingrate data-plane arrivals, passenger loads, crew sizes, baggage unloading rates, and so on; the other obtained data on flows and service levels-passenger flows out of baggage claim, queue length at 5-min intervals, and so on. The input data were run through the simulation to obtain simulated results at each step in the process for each time period for comparison with the actual observed results. Whenever significant differences occurred, the data were analyzed in detail to determine whether the differences resulted from unpredictable fluctuations (e.g., in citizen-to-visitor ratio or in customs inspection processing rate) or whether they indicated an area in which changes in the model could improve the correspondence between actual and predicted results. This led to a number of model enhancements (e.g., the specification of wing or finger arrivals rather than simply a building gate as opposed to a remote gate arrival) .
In sample validation results (Figure 2) as well as ail other numerical results in this paper, reasonable but hypothetical values are used because of the sensitivity of the data (in particular the various processing rates for federal inspections). In the authors' opinions, this does not detract from the value of the comparative analyses that were performed and reported here. The remainder of this paper will describe the initial application of the model. Further applications at both JFK and Newark International Airports were subsequently requested .
MODEL APPLICATION
The Federal Inspection Services (FIS) hall is in the JAB, one of nine separate terminals at JFK. International air travelers arriving on foreign-flag carriers are processed through federal immigration and customs inspections at this facility. As noted
300
260 ---SIM
260 --ACTUAL
240
220
200
160
160
140 t'\ 120 I I t-, 100 I I./ I
I • I 60 I \
( I 60 I \
40 I \ 20 \
0 115PM 2 00 3:00
TIME
r~ I I I I I I I I I I I I I \ I I
) \ I I I I
4:00 5:00
FIGURE 2 FIS model validation-total immigration queue, simulated versus actual.
23
earlier, following passenger arrival the federal inspection process includes immigration inspection, baggage claim, and customs inspection .
The ability to efficiently process significant numbers of passengers at the baggage claim is critical to providing an efficient overall federal inspection process. This ability has been compromised for some time because of the unreliability and limited baggage processing capabilities of the existing claim devices, which were installed in 1965. These devices do not have sufficient capacity to handle baggage being generated by the predominately wide-body aircraft that now characterize arrivals at the JAB. As a result, bags sometimes must be removed from the devices and stored on the floor to permit subsequent flight arrival processing. Because of downtime and lack of adequate storage capacity, passenger processing times have exceeded desired service standards on occasion. Consequently, arriving international passengers sometimes experience congestion and delay at the baggage claim area . Also, there was concern that desired standards be achieved with the expected increases in passenger volume projected through the 1990s. This concern resulted in a decision to replace the existing claim devices.
Following a review of several design concepts, two alternative baggage system designs were selected for further evaluation of expected service level. The systems were characterized generally as being either "in-ceiling" or "at-grade." Both systems would include eight baggage claim devices, four each in the east and west wings of the JAB. The systems additionally would be continuous-loop flat-plate devices that have interlocking movable plates (covered by a rugged material) that are supported and guided and travel along a framed structure. The systems differed in how the desired baggage storage capacity and the required number of devices within the existing confines of the hail would be achieved. The inceiling system would use available unused space and loop above the hall; the at-grade system would employ devices with snakelike configurations using available space on the airside apron adjacent to the hall (Figures 3 and 4). Each system would consist of high-capacity claim devices capable of holding baggage generated from a fully loaded, wide-body aircraft (e.g., 747).
Simulation Modeling Approach
The evaluations of expected service levels for 1990 and 1995 (chosen to evaluate the projected short- and long-term performance of the proposed baggage systems) were done using the GPSS computer simulation model developed for the FIS
Ln~w·' nn,J,{ 11 •I ,, • !t ., " • ~ ,. I ". ., ,, u - • " :: _..,.. --- _, " I
± li ·-· ... , i! " ± -- _, .. ~ Ei!Eil i ----~----------- - ---------..--·~---------------· --------... · -------------~-~-~---------------------- ___ :
CUSTOMS CUSTOMS CUSTOMS rr,--,-;-~ ,-.1 H IF>TT lr---------i .,-,
FIGURE 3 Proposed new baggage system-in-ceiling device.

24
APRON
17'/~~ I CUSTOMS CUSTOMS CUSTOMS L
r r FIGURE 4 Proposed new baggage system-at-grade device.
processes and baggage claim operation. Structuring the simulation model to evaluate the performance of the proposed baggage systems required a modeling approach that incorporated the applicable components of lhe FIS am! baggage claim operations. Specifically, the simulation included the flow and processing of arriving passengers from the plane block through primary immigration inspection or citizen bypass (at immigration) to baggage claim . Similarly, baggage flow from the plane block to the claim device, including dolly train processing and loading onto the claim devices, was simulated (Figure 5). A key element was modeling the matching of passengers and bags, which determines the time spent in the baggage claim area.
Modeling assumptions and input parameters that were broadly discussed earlier were developed for this particular application of the model. The simulation was then run, using summer peak-period passenger demand estimates for 1990 and 1995. This provided information (output at simulated 5-
AIRCRAFT AND PAX ARRIVALS
CITIZEN VS VISITOR
SEPARATION
SIMULATION FLOWCHART OF FIS PROCESSES
AND BAGGAGE CLAIM
BAGGAGE TRAVEL
TIME TO BELTS
LEAVE SYSTEM
BAGGAGE LOADING PROCESS
BAGGAGE CLAIM
FIGURE 5 Simulation flowchart of FIS processes and baggage claim.
TRANSPORTA TION RESEARCH RECORD 1273
min intervals) for a peak 4-hr period of flight arrivals, which included the number of queued passengers and unclaimed baggage by flight in baggage claim (selected indexes of system performance).
Model Assumptions and Inputs
Passenger Demand
To establish base demand, actual aircraft and passenger arrival information for 26 summer Friday and weekend <lays in 19R7 (which approximated peak conditions) was reviewed. This information was entered into a PC-based spreadsheet to identify the rolling peak hour of demand for each day (e.g., 2:10 to 3:09 p.m.). The average (3,505 passengers) of these peak rolling hours was recommended for use as a base demand volume.
To simulate the processing of passengers through the FIS operation, information relating to actual aircraft arrival times, passenger loadings for a peak period, including a peak rolling hour , was selected from data on the 26 days surveyed . The day chosen was July 3, 1987, with a peak rolling hour volume of 3,468, which approximated the average demand for the 26 days surveyed. Demand was documented for a 4-hr period, which was necessary to "load" the simulation to report results for the peak 3 hr period (2:00 to 5:00 p.m.).
To establish future year demand estimates, growth factors for 1990 and 1995 were documented. These factors were applied to the chosen base passenger loadings to establish the future demand estimates for 1990 and 1995 (Table 1).
The number of citizens and visitors by flight was established by applying a 40:60 percentage split (used hy aviation staff for planning purposes at JFK) , respectively, to the 1990 and 1995 forecast passenger loadings.
Passenger Travel Time from Plane to Immigration
Travel times for hardstand and gate locations were based on available information and data collected at the IAB (see Table 2).
Visitor Processing
Visitor processing, through primary immigration inspection, assumed full staffing of booths . Also, it was agreed that the modeling of visitor processing through immigration inspection would be based on the current practice of preclearance at the airport of origin for Aer Lingus, Air India, and El Al flights (expected to have this status by 1990). Visitors on these flights therefore did not require primary immigration inspection at JFK. The primary immigration inspection rate used was based on past data collection and discussions with the Immigration and Naturalization Services.
Citizen Walk Time to Baggage Claim
Citizens bypass primary immigration inspection and proceed directly to the baggage claim area. Citizen walk time from

TABLE 1 FUTURE YEARS' PEAK PERIOD DEMAND ESTIMATES
PASSENGERS
FLIGHT TIME VlHG BLOCK LOC 1987 1990 1995
FF33 1305 EAST HS 476 533 643 SRllO 1305 EAST F 322 361 435 VA800 1315 EAST v 47 53 63 SP4116 1325 VEST HS 469 525 633 EI103 1350 EAST 'ii 330 370 446 SK903 1405 'ilEST F 211 236 285 DF3306 1425 EAST HS 359 402 485 AZ610 1435 VEST F 353 395 477 N\l43 1435 EAST HS 283 317 382 SK911 1440 VEST F 225 252 304 PK715 1440 VEST v 304 340 410 KL645 1450 EAST F 373 418 504 LH410 1455 EAST v 77 86 104 SRlOO 1455 VEST v 331 371 447 AF077 1500 VEST v 318 356 429 BB692 1510 VEST HS 345 386 466 N\l37 1510 EAST HS 127 142 171 IB951 1515 EAST F 373 418 504 BR267 1525 VEST F 242 271 327 LH408 1540 EAST v 214 240 289 AY105 1545 VEST HS 224 251 302 HS985 1555 EAST HS 385 431 520 N\ll8 1600 EAST HS 329 363 444 LH404 1605 EAST v 312 349 421 SK901 1610 VEST v 220 246 297 El105 1625 EAST F 246 276 332 AI109 1635 VEST F 385 431 520 OA411 1640 VEST HS 195 218 263 KL641 1650 EAST v 382 428 516
Hypothetical Data
TABLE 2 PASSENGER ARRIVAL DISTRIBUTIONS
ELASPED TIME BLOCK TO PASSENGER ARRIVAL AT NUMBER OR PERCENT OF ARRIVING
LOCATION IMMIGRATION PASSENGERS
Hardstand 1 20 minutes first passenger
Hardstand 25 minutes 66% of flight
Hardstand 30 minutes 100% of flight
Gate/Ving 2 10 minutes first passenger
Gate/Ving 15 minutes 75% of flight
Gate/Ving 20 minutes 100% of flight
Gate/Finger 2 5 minutes first passenger
Gate/Finger 10 minutes 75% of flight
Gate/Finger 20 minutes 100% of flight
1. Hardstands are remote locations from the IAB where planes block
2. Ving or Finger denote different gate locations at the IAB where planes block
26
the beginning of the bypass in the immigration area to baggage claim was measured at 2 min and was used as the basis for simulating this movement.
Baggage Processing
The modeling of baggage processing encompassed the movement of bags for each arriving flight, from plane blocked at a building or remote gate to loading onto claim devices. The assumptions and inputs used for simulating these activities included the following:
•The number of bags by flight was 1.5 bags/passenger (consistent with current planning assumptions).
• Dolly train travel time, from plane block to the claim device area for the first consist, was measured at average values of 15 min for flights arriving at building gates and 20 min for remote gates. From the data collected, baggage loading from the dolly trains to belts for each flight was observed to be a continuous operation, with no delays occurring between loadings from the dolly transports.
•A staffing level of 12 handlers/wing (east and west) in the load area was assumed on the basis of discussions with JFK operations staff and observations made. A loading rate of 6 bags/min/handler was used (consistent with observations and current planning assumptions). This figure represented an average processing rate, with allowance for handler fatigue.
Baggage Claim
It was assumed that passengers claim baggage indiviJually and that all pieces must be claimed before the passenger can depart from the claim area. Passengers were randomly assigned a processing time for seeking, claiming, and loading baggage onto a cart from a time distribution ranging from 3.5 to 6.5 min. This time distribution was based on the observation that passengers claim baggage before a second full revolution of their baggage on the claim device occurs and that passenger seek time includes their movement from the baggage area entrance to a specific claim device and time required to locate and select their baggage.
Approach for Evaluating Alternative Baggage Claim Systems
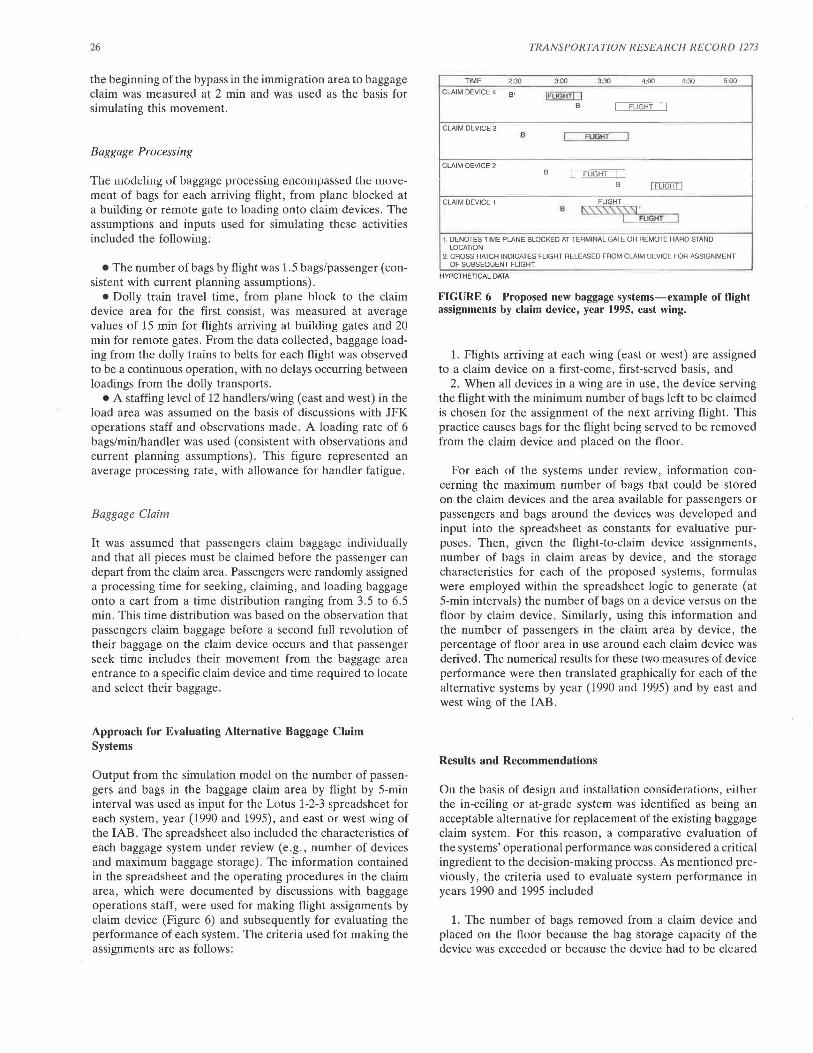
Output from the simulation model on the number of passengers and bags in the baggage claim area by flight by 5-min interval was used as input for the Lotus 1-2-3 spreadsheet for each system, year (1990 and 1995), and east or west wing of the JAB. The spreadsheet also included the characteristics of each baggage system under review (e.g., number of devices and maximum baggage storage) . The information contained in the spreadsheet and the operating procedures in the claim area, which were documented by discussions with baggage operations staff, were used for making flight assignments by claim device (Figure 6) and subsequently for evaluating the performance of each system. The criteria used for making the assignments are as follows:
TRANSPORTATION RESEARCH RECORD 1273
TIME 2:30 3:00 3:30 4:00 4:30 5:00
CLAIM DEVICE 4 B' IFmHTI I B I FLIGHT =:J
CLAIM DEVICE 3 B I Fl!QHT I
CLAIM DEVICE 2 B c:::£QQ.8i:.IJ
B I FLIGHT I CLAIM DEVICE 1 FLIGHT
8 ~SSSSS('. Sl FLIGHT=:)
1 UcNUI ES TIME PLANE BLOCKED AT TEHMINAL GAi EUR REMOTE HARO STAND LOCATION
2. CROSS HATCH INDICATES FLIGHT RELEASED FROM CLAIM DEVICE FOR ASSIGNMENT OF SUBSEQUENT FLIGHT
HYPOTHETICAL DATA
FIGURE 6 Proposed new baggage systems-example of tlight assignments by claim device, year 1995, east wing.
1. Flights arriving at each wing (east or west) are assigned to a claim device on a first-come, first-served basis, and
2. When all devices in a wing are in use, the device serving the flight with the minimum number of bags left to be claimed is chosen for the assignment of the next arriving flight. This practice causes bags for the flight being served to be removed from the claim device and placed on the floor.
For each of the systems under review, information concerning the maximum number of bags that could be stored on the claim devices and the area available for passengers or passengers and bags around the devices was developed and input into the spreadsheet as constants for evaluative purposes. Then, given the llight-lo-daim device assignments , number of bags in claim areas by device, and the storage characteristics for each of the proposed systems, formulas were employed within the spreadsheet logic to generate (at 5-min intervals) the number of bags on a device versus on the floor by claim device. Similarly, using this information and the number of passengers in the claim area by device, the percentage of floor area in use around each claim device was derived. The numerical results for these two measures of device performance were then translated graphically for each of the alternative systems by year (1990 and 1995) and by east and west wing of the JAB.
Results and Recommendations
On the basis of design and installation cnnsiden11inns, eilher the in-ceiling or at-grade system was identified as being an acceptable alternative for replacement of the existing baggage claim system. For this reason, a comparative evaluation of the systems' operational performance was considered a critical ingredient to the decision-making process. As mentioned previously, the criteria used to evaluate system performance in years 1990 and 1995 included
1. The number of bags removed from a claim device and placed on the floor because the bag storage capacity of the device was exceeded or because the device had to be cleared

Gulewicz and Browne
for assignment so that a subsequent flight arrival could be assigned ; and
2. The percentage of dedicated floor space around each claim device used for the storage of bags removed from a device and passengers waiting to claim baggage.
Although the in-ceiling system had only moderately lower practical operational capacity, it showed a significantly lower level of performance when compared with the at-grade system. For the in-ceiling system , large volumes of bags would be required to be placed on the floor , with the situation worsening markedly from 1990 to 1995 (Figures 7- 14). This was largely because the storage capacity of the devices was exceeded and not a result of bag placement on the floor to clear devices for fl ight assignment. Also , the increase in passenger demand levels projected for 1995 would generate higher numbers of bags and therefore exacerbate situations exceeding storage capacity .
Generally, significantly less floor space was used by the atgrade alternative when compared with the in-ceiling proposal (Figures 15- 22) . Interestingly, fo r 1995, there was a noticeable decrease in service level (fl oor space criterion) for the in-ceiling system, although fo r the at-grade system, projected
2:30 :40 :50 3:00 :10 :20 :30 :40 :50 4:00 :10 :20 :30 :40 :50 5:00
CLAIM DEVICE 4
BAGS ON FLOOR = DUE TO CAPACITY 173 296 57 DUE TO ASSIGN
CLAIM DEVICE 3
BAGS ON FLOOR = DUE TO CAPACITY 170 229 100 25 DUE TO ASSIGN
CLAIM DEVICE 2
BAGS ON FLOOR = D DUE TO CAPACITY 96106 35 68 DUE TO ASSIGN
CLAIM DEVICE 1
BAGS ON FLOOR = DUE TO CAPACITY 70 DUE TO ASSIGN 92 72 70 70 53
FIGURES NOTED ARE THE SUM OF BAGS ON FLOOR AS A RESULT OF EITHER CAPACITY OF DEVICE BEING EXCEEDED AND/OR DEVICE CLEARED FOR ASSIGNMENT TO A SUBSEQUENT FLIGHT ARRIVAL
HYPOTHETICAL DATA
FIGURE 7 Proposed new in-ceiling baggage system-year 1990, bags on floor-east wing.
2:30 :40 :50 3:00 :10 :20 :30 :40 :50 4:00 :10 :20 :30 :40 :50 5 00
CLAIM DEVICE 4
BAGS ON FLOOR DUE TO CAPACITY DUE TO ASSIGN
CLAIM DEVICE 3
BAGS ON FLOOR DUE TO CAPACITY DUE TO ASSIGN
CLAIM DEVICE 2
BAGS ON FLOOR DUE TO CAPACITY DUE TO ASSIGN
CLAIM DEVICE 1
BAGS ON FLOOR = DUE TO CAPACITY DUE TO ASSIGN 92 72 7070 53
FIGURES NOTED ARE THE SUM OF BAGS ON FLOOR AS A RESULT OF EITHER CAPACITY OF DEVICE BEING EXCEEDED AND/OR DEVICE CLEARED FOR ASSIGNMENT TO A SUBSEQUENT FLIGHT ARRIVAL
HYPOTHETICAL DATA
FIGURE 8 Proposed new at-grade baggage system-year 1990, bags on floor-east wing.
2:30 :40 :50 3:00 :10 :20 :30 :40 :50 4:00 :10 :20 :30 :40 :50 5:00
CLAIM DEVICE 5
BAGS ON FLOOR D = DUE TO CAPACITY 29 198 320 198155 90 23 DUE TO ASSIGN
CLAIM DEVICE 6
BAGS ON FLOOR DUE TO CAPACITY 123119 98 3 DUE TO ASSIGN 97110 55 28 5
CLAIM DEVICE 7
BAGS ON FLOOR = = DUE TO CAPACITY 12105 36 100 84 29 DUE TO ASSIGN
CLAIM DEVICE 8
BAGS ON FLOOR = = DUE TO CAPACITY 78 148126 183 73 DUE TO ASSIGN
FIGURES NOTED ARE THE SUM OF BAGS ON FLOOR AS A RESULT OF EITHER CAPACITY OF DEVICE BEING EXCEEDED AND/OR DEVICE CLEARED FOR ASSIGNMENT TO A SUBSEOUENT FLIGHT ARRIVAL.
HYPOTHETICAL DATA
FIGURE 9 Proposed new in-ceiling baggage system-year 1990, bags on floor-west wing.
2:30 :40 :50 3:00 :10 :20 :30 :40 :50 4:00 :10 :20 :30 :40 :50 5:00
CLAIM DEVICE 5
BAGS ON FLOOR DUE TO CAPACITY DUE TO ASSIGN
CLAIM DEVICE 6
BAGS ON FLOOR = DUE TO CAPACITY DUE TO ASSIGN 9711055 28 5
CLAIM DEVICE 7
BAGS ON FLOOR DUE TO CAPACITY DUE TO ASSIGN
CLAIM DEVICE 8
BAGS ON FLOOR DUE TO CAPACITY DUE TO ASSIGN
FIGURES NOTED ARE THE SUM OF BAGS ON FLOOR AS A RESULT OF EITHER CAPACITY OF DEVICE BEING EXCEEDED AND/OR DEVICE CLEARED FOR ASSIGNMENT TO A SUBSEQUENT FLIGHT ARRIVAL.
HYPOTHETICAL DATA
FIGURE 10 Proposed new at-grade baggage system-year 1990, bags on floor-west wing.
2:30 :40 :50 3:00 :10 :20 :30 :40 :50 4:00 :10 :20 :30 :40 :50 5:00
CLAIM DEVICE 4
BAGS ON FLOOR = = DUE TO CAPACITY 179 404 158 6 42 5 DUE TO ASSIGN 33
CLAIM DEVICE 3
BAGS ON FLOOR = DUE TO CAPACITY 165 274 186 119 82 27 DUE TO ASSIGN
CLAIM DEVICE 2
BAGS ON FLOOR = = = DUE TO CAPACITY 144 205 168 79 14 127 97 8513 DUE TO ASSIGN 43 2
CLAIM DEVICE I
BAGS ON FLOOR c==~ DUE TO CAPACITY 158 276 219 88 DUE TO ASSIGN 125 100 90 90 90 90 68
FIGURES NOTED ARE THE SUM OF BAGS ON FLOOR AS A RESULT OF EITHER CAPACITY OF DEVICE BEING EXCEEDED AND/OR DEVICE CLEARED FOR ASSIGNMENT TO A SUBSEQUENT FLIGHT ARRIVAL
HYPOTHETICAL DATA
FIGURE 11 Proposed new in-ceiling baggage system-year 1995, bags on floor-east wing.
27

2:30 :40 :50 3:00 :10 :20 :30 :40 :50 4:00 :10 :20 :30 :40 :50 5:00
CLAIM DEVICE 4
DAGO mJ rLOon D D DUE TO CAPACITY 49 DUE TO ASSIGN 33
CLAIM DEVICE 3
BAGS ON FLOOR D DUE TO CAPACITY 34 DUE TO ASSIGN
CLAIM DEVICE 2
RAGS ON FLOOR ,----, DUE TO CAPACITY DUE TO ASSIGN 43 2
CLAIM DEVICE 1
BAGS ON FLOOR DUE TO CAPACITY DUE TO ASSIGN 125100 90 90 90 90 68
FIGURES NOTED ARE THE SUM OF BAGS ON FLOOR AS A RESULT OF EITHER CAPACITY OF DEVICE BEING EXCEEDED AND/OR DEVICE CLEARED FOR ASSIGNMENT TO A SUBSEQUENT FLIGHT ARRIVAL
HYPOTHETICAL DATA
FIGURE 12 Proposed new at-grade baggage system-year 1995, bags on floor-east wing.
2:30 :40 :50 3:00 :10 :20 :30 :40 :50 4:00 :10 :20 :30 :40 :50 5:00
CLAIM DEVICE 5
BAGS ON FLOOR D = DUE TO CAPACITY 41 21 291 304 254 254 254 241176 131 45 DUE TO ASSIGN 33 2
CLAIM DEVICE 6
BAGS ON FLOOR DUE TO CAPACITY 921B5 237 237 233133 22 DUE TO ASSIGN 100 155159 7B 46 24
CLAIM DEVIC~ I
BAGS ON FLOOR = DUE TO CAPACITY 43102159 97 24 129129129 120 64 DUE TO ASSIGN 145 55
CLAIM DEVICE B
BAGS ON FLOOR = = DUE TO CAPACITY 3B 114 195135 171194 133 92 92 37 DUE TO ASSIGN 104 67 37 3
FIGURES NOTED ARE THE SUM OF BAGS ON FLOOR AS A RESULT OF EITHER CAPACITY OF DEVICE BEING EXCEEDED AND/OR DEVICE CLEARED FOR ASSIGNMENT TO A SUBSEQUENT FLIGHT ARRIVAL
HYPOTHETICAL DATA
FIGURE 13 Proposed new in-ceiling baggage system-year 1995, bags on floor-west wing.
2:30 :40 :50 3:00 :10 :20 :30 :40 :50 4:00 :10 :20 :30 :40 50 5 00
CLAIM DEVICE 5
BAGS ON FLOOR = DUE TO CAPACITY DUE TO ASSIGN 33 2
CLAIM DEVICE 6
BAGS ON FLOOR = rll IF Tn C:APAC:ITY DUE TO ASSIGN 100155159 73 48 24
CLAIM DEVICE 7
BAGS ON FLOOR = DUE TO CAPACITY DUE TO ASSIGN 149 55
CLAIM DEVICE B
BAGS ON FLOOR = DUE TO CAPACITY DUE TO ASSIGN 104 67 37 3
FIGURES NOTED ARE THE SUM OF BAGS ON FLOOR AS A RESULT OF EITHER CAPACITY OF DEVICE BEING EXCEEDED AND/OR DEVICE CLEARED FOR ASSIGNMENT TO A SUBSEQUENT FLIGHT ARRIVAL
HYPOTHETICAL DATA
FIGURE 14 Proposed new at-grade baggage system-year 1995, bags on floor-west wing.
I
100
=cl1 . CL2 90
-CLJ lillilll!lCL4
BO
70
0 w 60 CJ) ::0 ,_
50 z w 0 I ([
40 w - -"-
30
20
10 I 11' I 11 ~ I 0
2:00 2:15 2:30 2:45 3 00 3:15 3•30 J.45 TIME
-I 00 4, IS 4'3() 4:<5 5.00
HYPOTHETICAL DATA
FIGURE 15 Proposed new in-ceiling baggage system-1990 percent of floor space utilized-east wing.
100
90
BO
70
0 w 60 CJ) ::0 ,_
50 ' w u ([
40 w "-
30
20
10
0 2:00 2:15 2"30
HYPOTHETICAL DATA
c:::J CL1 !:l'IZI CL2
- CL3 11111i1 CL4
I r ~ r ~ R 2-45 3.00 3:15 3:30 3 45 4.00 4 15 4 30 4'45 5:00
TIME
FIGURE 16 Proposed new at-grade baggage system-1990 percent of floor space utilized-east wing.
100
= CL5 tll!!l!l CL6 90
-CL7 111111111 CLB
BO
70
0 w 60 CJ) ::0 ,_
50 z w u ([
40 w -"-
30
20 - -10
I ii ' II ~ ~ 0
2:00 2:15 2 30 2 45
HYPOTHETICAL DATA
3 00 3.15 3:30 3 45 4 00 TIME
415 4.30 4.45 5:00
FIGURE 17 Proposed new in-ceiling baggage system-1990 percenl of floor space utilized-west wing.

Gulewicz and Browne
100
=cL5 CO! CLS 90
- CL7 lllllil\l CLS
60
70
~ 60 :i
~ 50
~ 40
30
20 ~
~ I ~ m rRe n ID
0 2:00 2:15 2 30 2:45 3 00 3·15 3:30 345 400 415 430 445 500
HYPOTHETICAL DATA TIME
FIGURE 18 Proposed new at-grade baggage system-1990 percent of floor space utilized-west wing.
100 139 = CL1 l1!J}Zl CL2
90 -CL3 lllillilCL4
60
70
0 w 60 "'
; :i ' !z 50 w (.) l a:
40 w - ----Q.
30
20
10 i f I r I 0
2.00 2:15 2::.l 2:45 3:00 3:15 3:30 3:45 4:00 4:15 4:30 4:45 5:00
HYPOTHETICAL DATA TIME
FIGURE 19 Proposed new in-ceiling baggage system-1995 percent of floor space utilized-east wing.
100
90
60
70
0 tJl 60 :i
!z 50 w &! w 40 Q.
30
20
10
0
-..__ ..__
I ~ ~ 2:00 2:15 2 30 2 45 3;00 3•15
HYPOTHETICAL DATA
c::J cu l!l1Z!ICL2
- CL3 illlllltCL4
---- I--
rL I l ~ . 3:30 3·45 4·00 4;15 4·30 4:45 5 00
TIME
FIGURE 20 Proposed new at-grade baggage system-1995 percent of floor space utilized-east wing.
100
90
60
70
~ 60 :i
!z 50 w &1 w 40 Q.
30
20
10
0
'---
f, ~
29
c::J CL5 CL6
- CL7 BCLB
~
'--- '-
I-
r ,_
I -2:00 2:15 2 30 2:45 3.00 3.15 3:30 3 45 4 00 4:15 4:30 4:45 5:00
HYPOTHETICAL DATA TIME
FIGURE 21 Proposed new in-ceiling baggage system-1995 percent of tloor space utilized-west wing.
100
=CL5 llillillCL6 !IO
- CL7 111111 CLS
80
7tl
0 w liO "' :i ....
50 z w (.) a:
40 w Q.
30
20
10
- -
1 1 ru m l ~ .. 0 2:00 2:15 2:30 2:45 3:00 3:15 3:30 3:45 4:00 4:15 4:30 4:45 5:00
HYPOTHETICAL DATA TIME
FIGURE 22 Proposed new at-grade baggage system-1995 percent of floor space utilized-west wing.
service levels for 1990 were generally maintained through 1995, despite the higher expected demand level.
Hence, because of higher service levels projected for the at-grade system, it was preferred operationally and was recommended to replace the existing system. The system, which was also found to be less costly than the other alternative, was being installed at the time of this writing.
SUMMARY
This project developed and validated a computer-based simulation model that could be used for various analyses relating to the Federal Immigration and Naturalization and Customs Inspection Services system facilities. The initial application of the model led to selecting a new baggage claim system , largely on the basis of its operational attributes, which were shown through the model to improve service levels for international air travelers through the 1990s.
Publication of this paper sponsored by Committee on Airport Landside Operations.