Embed Size (px)
Citation preview

REDD+ For the Guiana Shield, 3rd Working Group Meeting, Design of a Multipurpose National
Designing a National
Forest Inventory in the
context of REDD+
Matieu Henry (FAO)

2
1. National Forest Monitoring System
2. Objectives
3. Definition & classification system
4. Forest attributes
5. Forest mensuration (plot size)
6. Sampling design
7. Designing the NFI in Cambodia – (under progress)
8. Different sampling design in Latin America
9. Options for harmonization of land classification systems
and integration of sub-national and national activities
Content

The goal is to assess the condition of forests for an entire nation using data
collected from a sample of field plots.
(1) to obtain national estimates of the total area of forest, subdivided by major
categories of different forest types and conditions;
(2) to obtain sufficiently precise estimates (quantitative and qualitative) for selected
geographic regions such as the nation, sub-national areas, provinces or states, and
municipalities;
(3) to collect sufficient kinds and amounts of information to satisfy international
reporting requirements; and
(4) to achieve an acceptable compromise between cost and the precision and
geographic resolution of estimates. See Variables typically assessed in National
Forest Inventories .
1. National Forest Monitoring System

New mechanisms for mitigation actions in non-Annex I Parties under the UNFCCC:
the Cancun agreements request developing countries to develop
Par
a 7
1
1. National Forest Monitoring System
5 REDD+ activities
Par
a 7
0
Forest conservation
Sustainable management of
forest
Enhancement of forest carbon
stocks
Forest degradation

5
Unpublished data – based on the data collected from 128 countries who have already implemented an
NFI
1. National Forest Monitoring System

6
FAO (1998) Guidelines for the management of tropical forests 1. The production of
wood. FAO forestry paper 135. FAO, Rome
1. Objectives need to be determined jointly by the people who will use the
results, (forest managers, planners, decision-makers, inventory specialists,
indigenous people, inventory objectives).
2. Not all inventory objectives have the same level of importance. Some have
higher priority than others.
3. Inventory objectives should reflect the physical effort that will be required
to conduct an inventory, the organization, estimated costs and time, the
existing knowledge of resources, the availability of specific aspects of
inventory technologies, and institutional capability.
4. All objectives should be SMART (specific, measurable, agreed, realistic, time-
framed)
2. Objectives of the NFMS
7
Increase in information needs about forest lands in the USA (after Lund and Smith 1997)
2. Objectives of the NFMS

8
Accurate, up-to-date information about the size,
distribution, composition and condition of our forests
and woodlands is essential for developing and
monitoring policies and guidance to support their
sustainable management. To gather this information
and keep it up to date, we carry out periodic surveys of
forests and woodlands across the country.
NFI definition of Great Britain
3. Definition and classification system
9
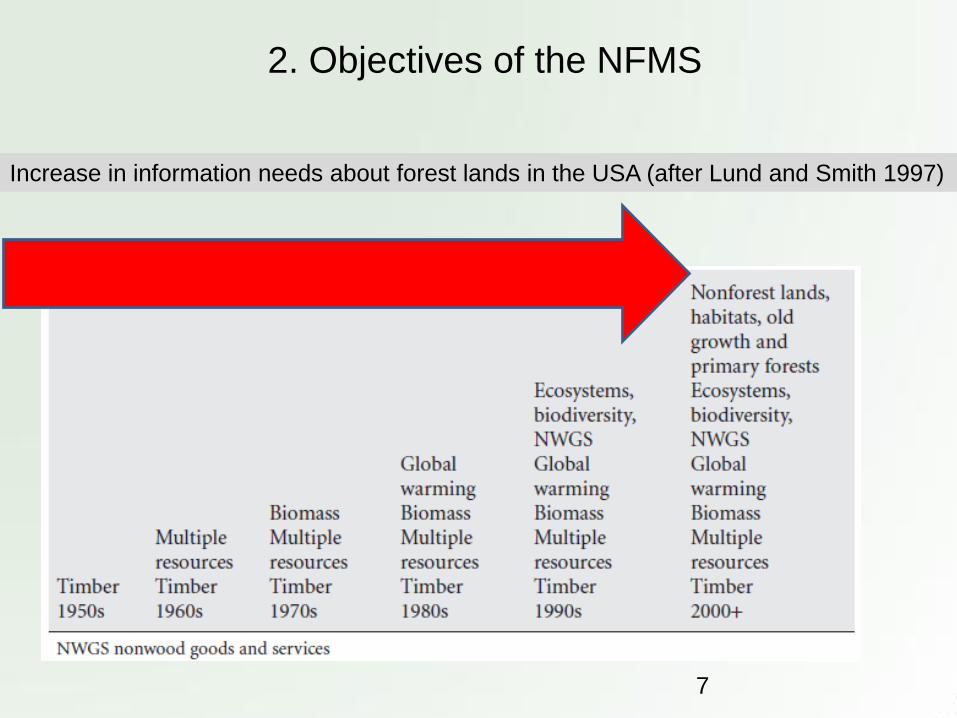
The national forest inventory is the assessment, at
national scale, of forest variables at a certain point in
time. Repeated inventories may provide trends over time
of such variables. Among variables the most relevant
has historically been timber volume, biomass, other
carbon stocks are currently being added to modern
inventories as well as variables related to the socio-
economic use of forest.
Proposed NFI definition
3. Definition and classification system
10
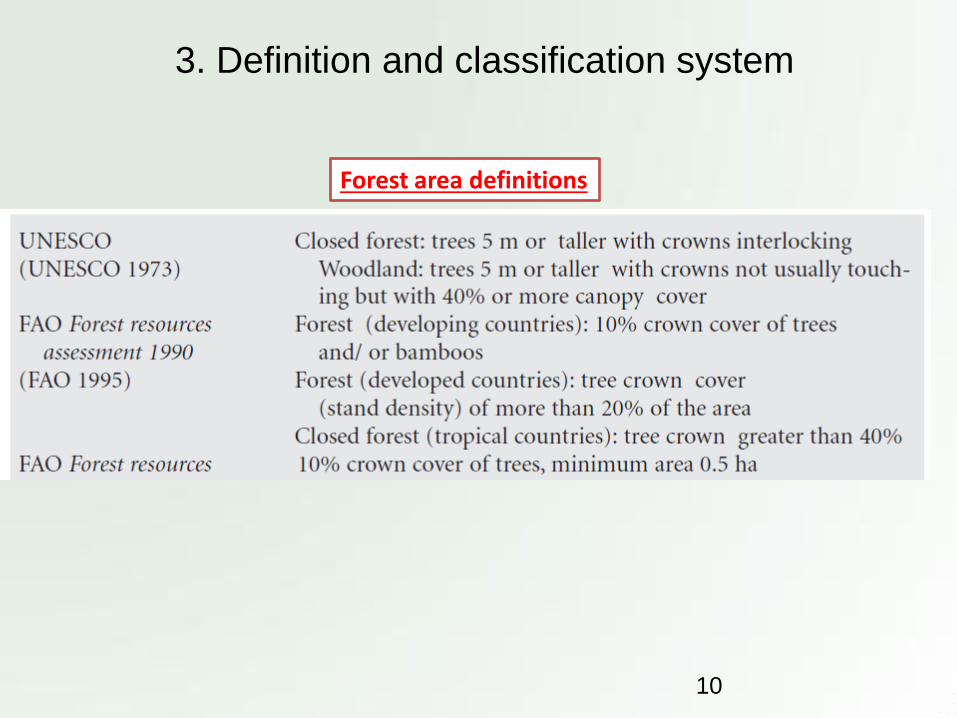
Forest area definitions
3. Definition and classification system

11
3. Definition and classification system
12
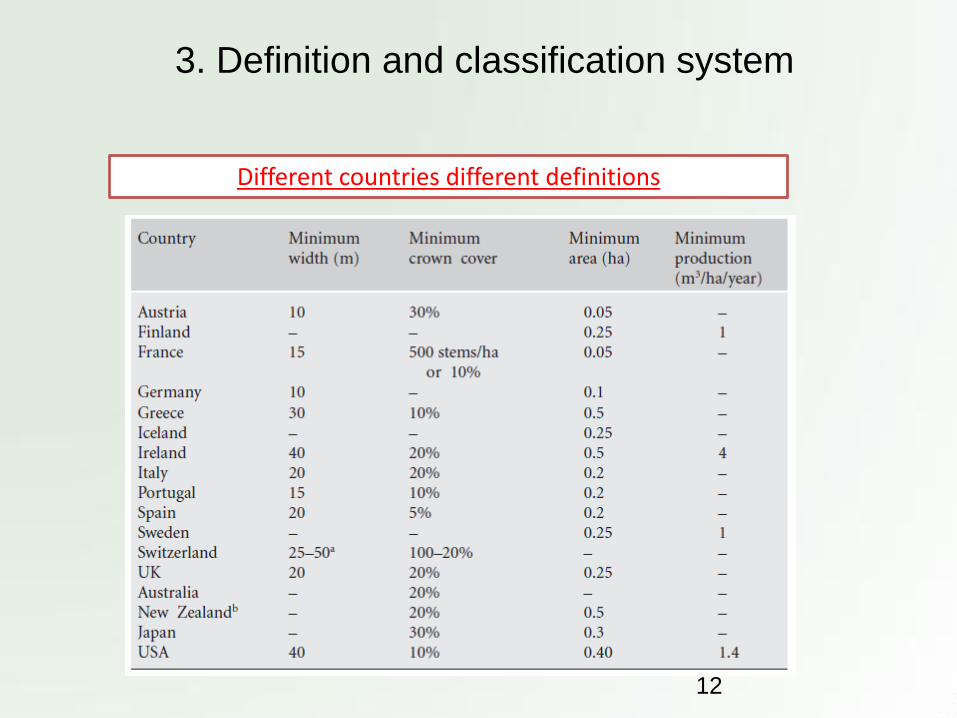
Different countries different definitions
3. Definition and classification system

13
Based on the objectives, the attributes for field assessments, remote-sensing imagery,
or other data sources have to be derived
The number of attributes observed on each plot can be as high as over 250 and is usually not less than about 100
land use
wood production
Height
growing stock
forest type
DBH
biodiversity
non-wood forest
products mortality
soil erosion
4. Forest attributes
14
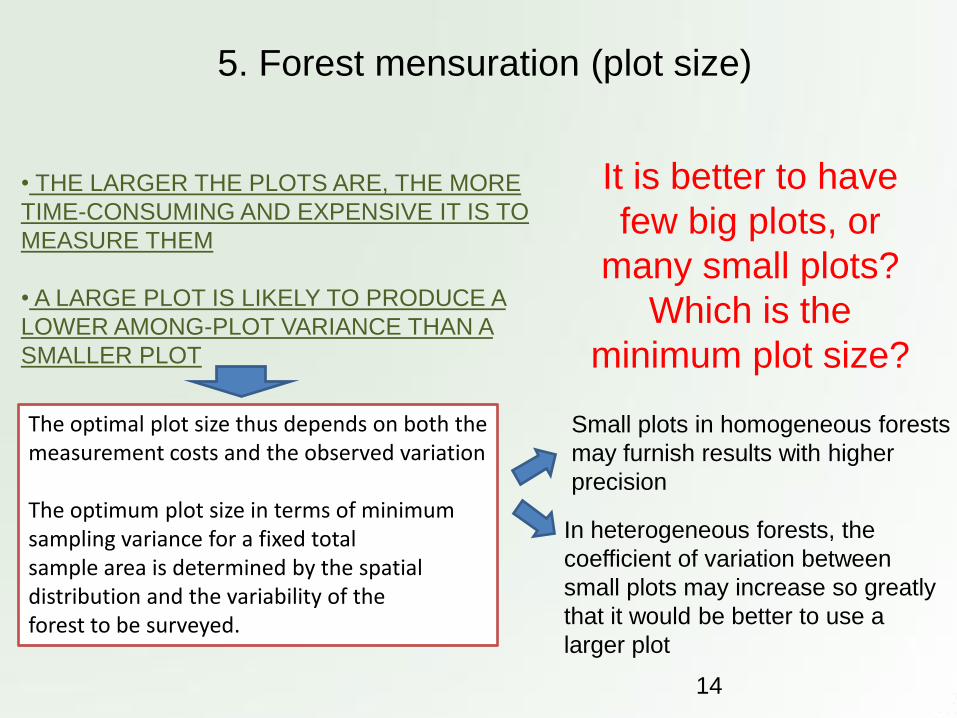
• THE LARGER THE PLOTS ARE, THE MORE
TIME-CONSUMING AND EXPENSIVE IT IS TO
MEASURE THEM
• A LARGE PLOT IS LIKELY TO PRODUCE A
LOWER AMONG-PLOT VARIANCE THAN A
SMALLER PLOT
It is better to have
few big plots, or
many small plots?
Which is the
minimum plot size?
The optimal plot size thus depends on both the measurement costs and the observed variation The optimum plot size in terms of minimum sampling variance for a fixed total sample area is determined by the spatial distribution and the variability of the forest to be surveyed.
Small plots in homogeneous forests
may furnish results with higher
precision
In heterogeneous forests, the
coefficient of variation between
small plots may increase so greatly
that it would be better to use a
larger plot
5. Forest mensuration (plot size)

15
Over estimate
example:
projection
of crowns
in an
evergreen
seasonal
forest in
Cambodia.
Under
estimate
5. Forest mensuration (plot size)

Basically, the more similar the observations are, the
more efficient is the small plot, and vice versa.
When travel time is significant, as in a tropical forest, the size of inventory plots tends to be large, often in the 0.4–0.5-ha range.
As a rule of thumb, a plot should be large enough to
contain enough trees per plot to be representative of
the population
It follows that small plots should be employed for dense
stands with small trees, and large ones for open stands
and large trees
5. Forest mensuration (plot size)

17
A Case study:
Biomass assessment in 9 ha
of tropical rainforest in Ghana.
Data from Henry et al. 2010
We produced different
estimates of AGB/ha by
reducing progressively the
sample size of the plots.
The analyzed sample size
were:
-100 x 100 m
-50 x 50 m
-20 x 20 m
-10 x 10 m
5. Forest mensuration (plot size)
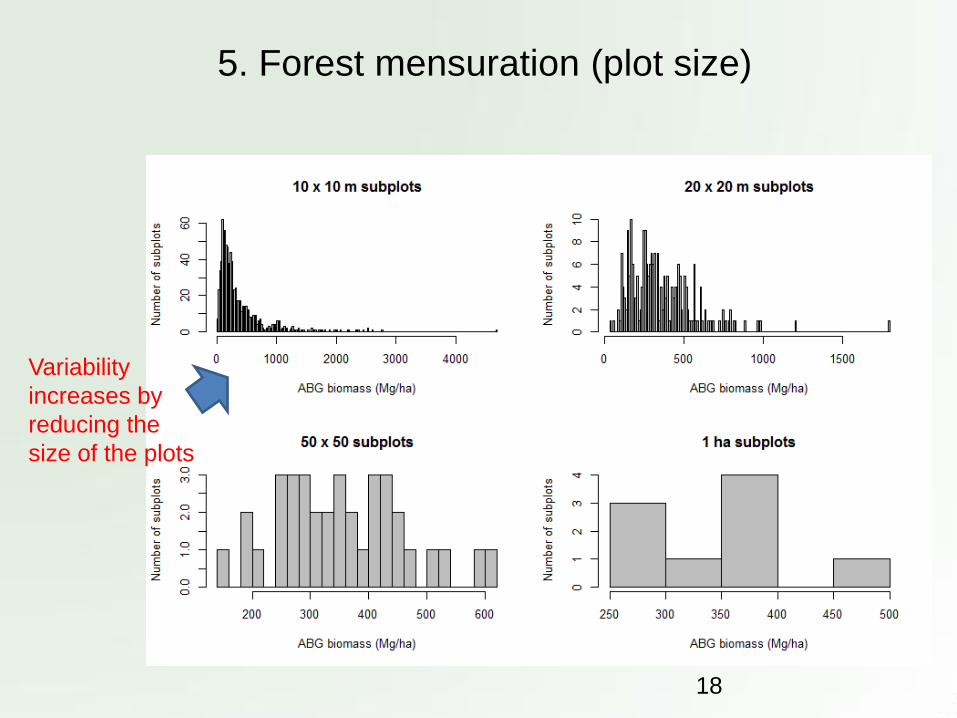
18
Variability
increases by
reducing the
size of the plots
5. Forest mensuration (plot size)

19
sub plot
size (m)
number of
plots
standard
deviationmin max skewness kurtosis
10x10 900 414.218 1.791 4682 3.559777 20.17818
20x20 225 216.5173 32.85 1798 2.056152 8.700663
50x50 36 109.9192 145.4 612.2 0.344912 -0.42346
100x100 9 71.22415 277.4 499.9 0.634359 -0.6779
Uncertainty and normality of the AGB estimates in the sub plot
One quarter hectare is the minimal size such that the normality criterion is
satisfied in this forest.
This result is consistent with that of Chave et. al 2004
5. Forest mensuration (plot size)

20
sub plot
size (m)
number of
plots
standard
deviationmin max skewness kurtosis
10x10 900 414.218 1.791 4682 3.559777 20.17818
20x20 225 216.5173 32.85 1798 2.056152 8.700663
50x50 36 109.9192 145.4 612.2 0.344912 -0.42346
100x100 9 71.22415 277.4 499.9 0.634359 -0.6779
Also between the 100 x 100 m plots variability was high. A single 1–ha plot
would have provided very little information.
This can be explain by two reason:
-Sampling error in a narrow sense (Sample means are different, also in a
homogeneous population)
-Spatial variation in AGB: different parts of the forest are really different
5. Forest mensuration (plot size)

21
The usual plot shapes used in forest inventories are rectangular, square and circular
45°
the last two corners and the diagonal should be measured to check the measurement
rectangular plot is fairly vulnerable to errors in determination of the right angles
A*√2
This approach is much less vulnerable to Errors
Circular plots are easy to establish (when the radius is not too large), and not very vulnerable to errors in plot area
the perimeter is smaller in relation to the area and thus the number of trees on the edge is less
5. Forest mensuration (plot size)

22
Nested plots contain smaller subunits of various
shapes and sizes depending on the variables to be
measured
For example, saplings could be measured on a
small subunit, trees between 5-50 cm on a
medium subunit and trees above 50 cm could be
measured on the entire plot
Nested plots can be cost-efficient for forests with
a wide range of tree diameters or stands with
changing diameters and stem densities
5. Forest mensuration (plot size)

Subunit 1 (e.g. saplings)
Subunit 2 (e.g. small trees,
5-50 cm dbh)
Subunit 3 (e.g. large trees,
> 50 cm dbh)
Plot center
FOREST MENSURATION
Sample Plot. Nested plot.

Subunit 1 (e.g. saplings)
Subunit 2 (e.g. small trees,
5-50 cm dbh)
Subunit 3 (e.g. large trees,
> 50 cm dbh)
FOREST MENSURATION
Sample Plot. Nested plot.

6. Sampling design
It is not possible to measure every trees in the country
Population Sample
Selection
Inference
You need to select a subset of units from a
population, to measure this subset
intensively, and to draw inference from the
sample to the entire population

SAMPLING DESIGN
The principle of sampling
Some common sample estimators

SAMPLING DESIGN
The principle of sampling
•Simple Random Sampling
•Systematic Sampling
•Cluster Sampling
•Stratified Sampling

SAMPLING DESIGN
Cluster Sampling
The cluster plot is composed by sub-
plot.
The cluster pot can have different
shapes
Every cluster plot produce one observation for estimation

Cluster sampling is widely used in large area forest inventories, such as National Forest
Inventories. The major reason does not lie in the statistical performance but in practical
aspects
• The cluster-plot, being a
larger plot, covers more
variability within the plot and ,
thus, decreases the variability
between the plots
• Practical efficiency (once a
field team has reached a field
plot location (which in some
cases may take many hours or
even some days), then one
wishes to collect as much
information as possible at this
particular sample point)
• Biased variance estimator
(difficult to assess the error of
the estimate)
Advantages Disadvantages
SAMPLING DESIGN
Cluster Sampling
cost and time considerations

SAMPLING DESIGN
Stratified Sampling
In stratified sampling we use auxiliary
information to stratify the entire
population into strata. Stratification
aims at forming groups of elements
(units) with similar attribute values.
Stratified sampling is efficient
especially in those cases where the
variability inside the strata is low and
the differences of means between the
strata is large

Three factors are relevant in respect to the decision of how to allocate the samples to the strata: •Stratum sizes (The bigger the stratum the more samples) •Variability inside the strata (The more variability the more samples) •Inventory costs that might vary between strata (The more costly the fewer samples).
SAMPLING DESIGN
Stratified Sampling
IPCC 2006 guidelines:
“Greenhouse gas emissions and removals per hectare vary according
to site factors, forest or plantation types, stages of stand development
and management practices. It is good practice to stratify Forest Land
into various
sub categories to reduce the variation in growth rate and other forest
parameters and to reduce uncertainty”

Countries are encouraged to carry out the greenhouse gas emissions inventory calculations at a
finer level of detail
Many countries
have more
detailed
information
available about
forests and
land-use change
than were used
in constructing
default values in
this Chapter.
SAMPLING DESIGN
Stratified Sampling

SAMPLING DESIGN
Stratified Sampling

two general approaches for stratification
PRESTRATIFICATIOON POSTSTRATIFICATIOON
strata are formed before the
sampling study starts
strata are formed after the sampling
study starts
SAMPLING DESIGN
Stratified Sampling
The auxiliary strata information was not used during the sampling process. Poststratification may apply to a field survey completed before a remote-sensing-based stratification becomes available

35
A (area of the stratum)
n (number of sample plots)
Stratum 1 3400 12
Stratum 2 900 3
Stratum 3 700 3
INFERENCE FROM THE DATA
It is good practice to resample 10% of the total plots by an independent 3rd party in order to identify errors in the sampling and to obtain the accuracy of the estimates
From the data collected, conclusions can be drawn, including standard errors of mean and total values per hectare and the confidence interval of the population mean

7. Different sampling design in Latin America
First NFI Countries
1947 Panama
1964 Honduras
1971 Chile
1997 Costa Rica
Uruguay
1998 Argentina
Belize
2000 Bolivia
2002 Guatemala
2003 El Salvador
2007 Nicaragua
Ecuador
Guyana
Paraguay
Peru
Venezuela
Brazil
French Guiana
Suriname
Colombia
NA
Plot shape Countries
(1) Rectangular, (2)
Rectangular, (3)
Circular
Costa Rica
Guatemala
Nicaragua
(1) Circular, (2) Circular Argentina
(1) Rectangular, (2)
Squared Brazil
NA others
Argentina
Brazil

37
8. Different sampling design in Latin America
Sampling Strategy n countries
Simple random sampling 0
Stratified random sampling 0
Systematic Sampling: permanent plot 1?
Systematic Sampling: temporary plot 3?
Systematic Sampling: Aligned 4
Systematic Sampling: Unaligned 1
Stratified Systematic Sampling: permanent plot 3
Stratified Systematic Sampling: temporary plot 0
Stratified Systematic Sampling: Aligned 1
Stratified Systematic Sampling: Unaligned 2
Cluster Sampling 8
NFI for: Only Trees in
FL: Argentina
Other countries
consider tree in FL and
other land uses
Sample size:
Guatemala 106
Honduras 339
Uruguay 1,242