Embed Size (px)
Citation preview

1
Robert PittDepartment of Civil, Construction, and Environmental
EngineeringUniversity of Alabama
Tuscaloosa, AL, USA 35487
Design/Construction/Maintenance Design/Construction/Maintenance Techniques for Successful Stormwater Techniques for Successful Stormwater
Bioretention and InfiltrationBioretention and InfiltrationSeminar #16 (Part 1)Seminar #16 (Part 1)
• Conservation design approach• Site hydrology and application of
controls• Examples of bioretention and
infiltration controls• Site evaluations• Soil compaction and soil restoration
Photo by Lovena, Harrisburg, PA
Stormwater Effects• Sediment (amount and quality)• Habitat destruction (mostly through high flows
[energy] and sedimentation)• Eutrophication (nutrient enrichment)• Low dissolved oxygen (from organic materials)• Pathogens (urban wildlife vs. municipal wastewater)• Toxicants (heavy metals and organic toxicants)• Temperature• Debris and unsafe conditions• etc.
Conservation Design Approach for New Development
• Better site planning to maximize resources of site• Emphasize water conservation and water reuse on
site• Encourage infiltration of runoff at site but prevent
groundwater contamination• Treat water at critical source areas and encourage
pollution prevention (no zinc coatings and copper, for example)
• Treat runoff that cannot be infiltrated at site

2
Probability distribution of rains (by count) and runoff (by depth).
Birmingham Rains:<0.5”: 65% of rains(10% of runoff)
0.5 to 3”: 30% of rains(75% of runoff)
3 to 8”: 4% of rains(13% of runoff)
>8”: <0.1% of rains(2% of runoff)
0.5” 3” 8”
Birmingham, AL, rains from 1952 through 1989
111 rains per year during this 37 year periodMost rains < 3 inchesAbout 5 rains a year between 3 and 8 inches3 rains (in 37 years) > 8 inches
Suitable Controls for Almost Complete Elimination of Runoff Associated with
Small Rains (<0.5 in.)
• Disconnect roofs and pavement from impervious drainages
• Grass swales• Porous pavement walkways• Rain barrels and cisterns for local
reuse
Suitable Controls for Treatment of Runoff from Intermediate-
Sized Rains (0.5 to 3 in.)• Initial portions of these rains will be
captured/infiltrated by on-site controls or grass swales, but seldom can infiltrate all of these rains
• Remaining portion of runoff should be treated to remove particulate-bound pollutants

3
Roof drain disconnections
Not this!
Rain Garden Designed for Complete Infiltration of Roof Runoff
Land and Water, Sept/Oct. 2004
97% Runoff Volume Reduction
Calculated Benefits of Various Roof Runoff Controls (compared to typical directly connected residential pitched roofs)
100
87
77
67
21
Seattle, Wash. (33.4 in.)
87
84
75
66
13
Birmingham, Alabama (55.5 in.)
96%Rain garden with amended soils (10 ft. x 6.5 ft.)
91%Disconnect roof drains to loam soils
84%Planted green roof (but will need to irrigate during dry periods)
88%Cistern for reuse of runoff for toilet flushing and irrigation (10 ft. diameter x 5 ft. high)
25%Flat roofs instead of pitched roofs
Phoenix, Arizona (9.6 in.)
Annual roof runoff volume reductions

4
Grass-Lined Swales
Runoff from Pervious/
impervious area
Trapping of sedimentsand associated pollutantsReducing velocity of
runoff
Infiltration
Reduced volume and treated runoff
Sedimentparticles
Particulate Removal in Shallow Flowing Grass Swales and in Grass Filters
Head (0ft)
Date: 10/11/2004
2 ft
25 ft
6 ft
3 ft
116 ft75 ft
TSS: 10 mg/L
TSS: 20 mg/L
TSS: 30 mg/L
TSS: 35 mg/L
TSS: 63 mg/L
TSS: 84 mg/L
TSS: 102 mg/L
University of Alabama swale test site at Tuscaloosa City Hall
WI DNR photo
Conventional curbs with inlets directed to site swales

5
Grass Swales Designed to Infiltrate Large Fractions of Runoff (Alabama).
Also incorporate grass filtering before infiltration
Porous paver blocks have been used in many locations to reduce runoff to combined systems, reducing overflow frequency and volumes (Sweden, Germany, and WI).
Not recommended in areas of heavy automobile use due to groundwater contamination (provide little capture of critical pollutants, plus most manufactures recommend use of heavy salt applications instead of sand for ice control).
Parking lot medians easily modified for bioretention (OR and MD).
Bioretention and biofiltration areas having moderate capacity
6
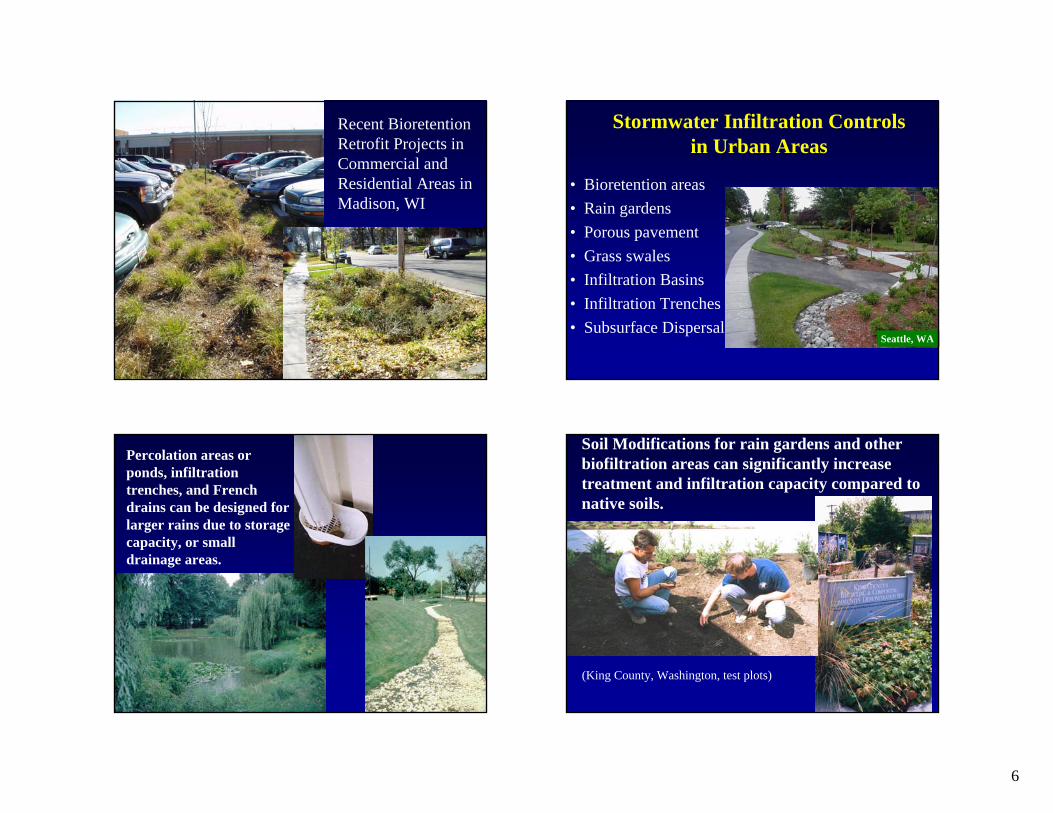
Recent Bioretention Retrofit Projects in Commercial and Residential Areas in Madison, WI
Stormwater Infiltration Controls in Urban Areas
• Bioretention areas• Rain gardens • Porous pavement• Grass swales • Infiltration Basins• Infiltration Trenches• Subsurface Dispersal
Seattle, WA
Percolation areas or ponds, infiltration trenches, and French drains can be designed for larger rains due to storage capacity, or small drainage areas.
Soil Modifications for rain gardens and other biofiltration areas can significantly increase treatment and infiltration capacity compared to native soils.
(King County, Washington, test plots)

7
Site Evaluation Tests
• Needed to characterize and quantify:– Site soil conditions (infiltration capacity, soil
texture, cation exchange capacity, sodium adsorption capacity, etc.)
– Groundwater conditions (depth and movement)
Measure Soil Characteristics to Predict Infiltration Problems
(Before and After Construction)
• Infiltration Tests (bulk density)• Evaluate soil texture with cores• Estimate depth to groundwater• Estimate potential for mounding
Subsurface Exploration Needed for Most Infiltration Systems
– Backhoe Test Pits– Test Borings– Monitoring Wells
Number of Pits and Borings Needed
Pits to 10 Ft. or Borings to 20 Ft.
2 Pits per Area; With 1 Pit or Boring for Every 10,000 sq. ft.
Pits or Borings; Mounding
Infiltration Basin
5 Feet or Depth to Limiting Layer
1 test/50 linear feet of device with a Minimum of 2
Pits or Borings; Mounding
Bioretention
Minimum Drill/Test Depth
Minimum Number of Pits or Borings
Tests Required
Infiltration Device
8
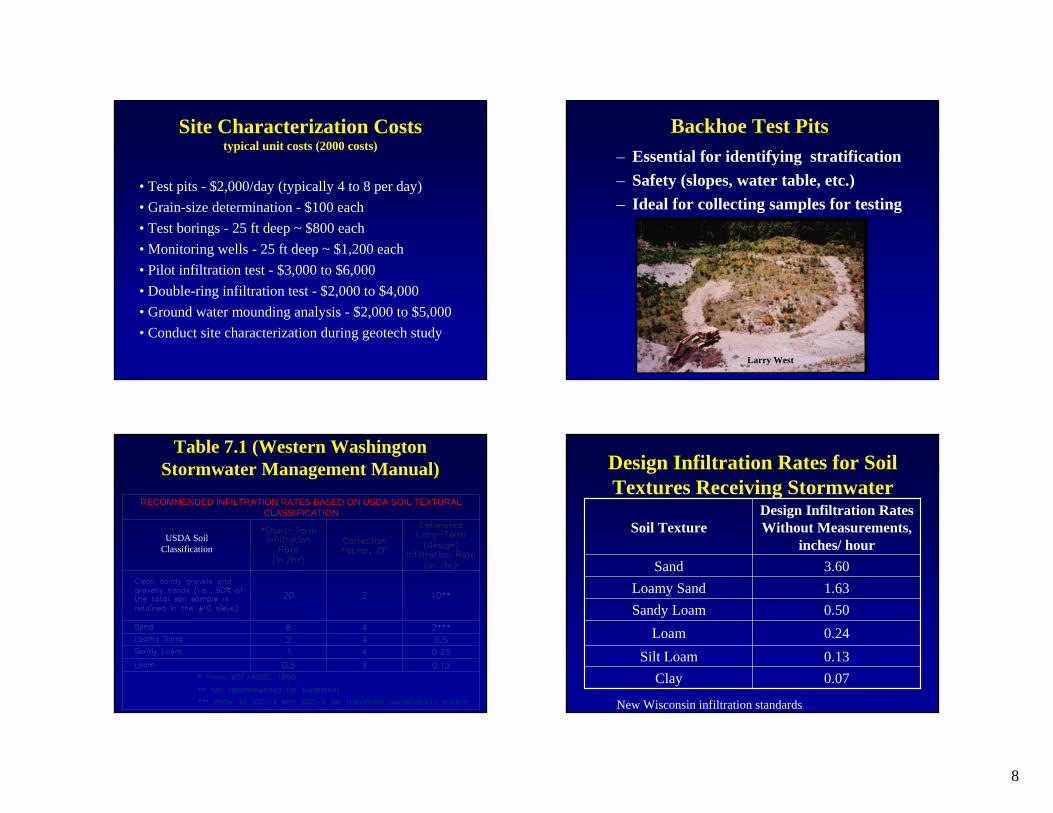
Site Characterization Coststypical unit costs (2000 costs)
• Test pits - $2,000/day (typically 4 to 8 per day)• Grain-size determination - $100 each• Test borings - 25 ft deep ~ $800 each• Monitoring wells - 25 ft deep ~ $1,200 each• Pilot infiltration test - $3,000 to $6,000• Double-ring infiltration test - $2,000 to $4,000• Ground water mounding analysis - $2,000 to $5,000• Conduct site characterization during geotech study
Backhoe Test Pits– Essential for identifying stratification– Safety (slopes, water table, etc.)– Ideal for collecting samples for testing
Larry West
Table 7.1 (Western Washington Stormwater Management Manual)
RECOMMENDED INFILTRATION RATES BASED ON USDA SOIL TEXTURAL CLASSIFICATION
USDA SoilClassification
Design Infiltration Rates for Soil Textures Receiving Stormwater
0.07Clay0.13Silt Loam0.24Loam0.50Sandy Loam1.63Loamy Sand3.60Sand
Design Infiltration Rates Without Measurements,
inches/ hourSoil Texture
New Wisconsin infiltration standards

9
Pilot Infiltration Test Pit (Backhoe Test Pit) This was a 24 hour test
Larry West
Design Infiltration RateCorrection Factors for In-situ Field Testing
• Correction factors are typically used to reduce the field measured infiltration values to values that should be considered for design, reflecting expected long-term performance.
• These reduced rates consider:– site variability – long-term sustainability (reduced future rates due to
clogging, mounding effects, etc.), – scaling issues when applying small scale test results to full-
scale designs.
Table 7.3 (Western Washington Stormwater Management Manual)
CORRECTION FACTORS TO BE USED WITH IN-SITU INFILTRATION MEASUREMENTS TO ESTIMATE LONG-TERM DESIGN INFILTRATION RATES
Issue Partial Correction Factor

10
Correction Factors for in-situ Infiltration Results for Long-Term Design Rates
125.5 - 18Total CorrectionFactor
2Excellent2 Ponds
2 - 6Pre-Treatment
6Buried Gallery2 - 6Maintenance
4Mixed AlluvialDeposits
1.5 - 6Site Variability# of Tests
ActualCorrection
Factor
ExampleCorrectionFactor
Issue
Therefore: Test Infiltration Rate = 48 inches/hourDesign Infiltration Rate = 48/12 = 4 inches/hour Larry West
Larry West
Ground Water Mounding“Rules of Thumb”
• Mounding reduces infiltration rate to saturated permeability of soil, often 2 to 3 orders of magnitude lower than infiltration rate.
• Long narrow system (i.e. trenches) don't mound as much as broad, square/round systems
Larry West

11
Soil Compaction and Recovery of Infiltration Rates
• Typical site development dramatically alters soil density.
• This significantly reduces infiltration rates, especially if clays are present.
• Also hinders plant growth by reducing root penetration
Long-Term Sustainable Average Infiltration Rates
0.290.015<0.001
1.5021.7031.911
HandStandardModified
Clay Loam
1.30.0270.0017
1.5041.5931.690
HandStandardModified
Silt Loam
3591.5
1.5951.6531.992
HandStandardModified
Sandy Loam
Long-term Average Infilt. Rate (in/hr)
Dry Bulk Density (g/cc)
Compaction Method
SoilTexture
Compaction, especially when a small amount of clay is present, causes a large loss in infiltration capacity.
Compaction Measurements Soil Density Measurements
12
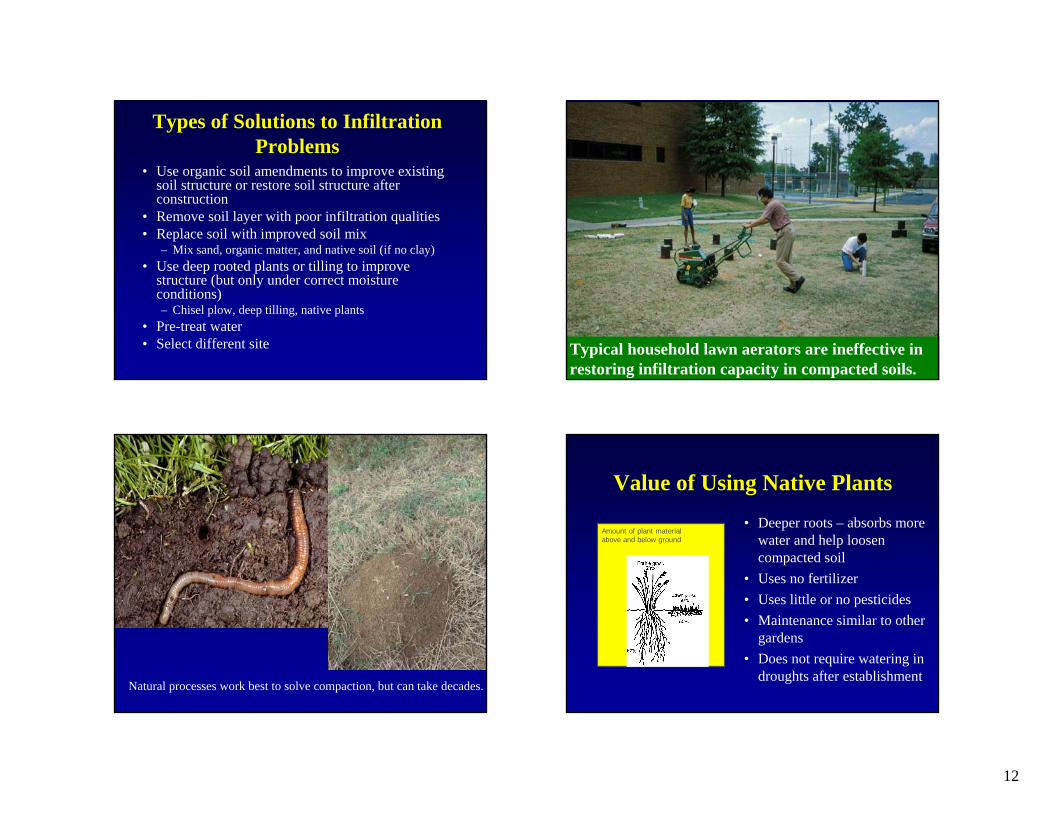
Types of Solutions to Infiltration Problems
• Use organic soil amendments to improve existing soil structure or restore soil structure after construction
• Remove soil layer with poor infiltration qualities• Replace soil with improved soil mix
– Mix sand, organic matter, and native soil (if no clay)• Use deep rooted plants or tilling to improve
structure (but only under correct moisture conditions)– Chisel plow, deep tilling, native plants
• Pre-treat water• Select different site Typical household lawn aerators are ineffective in
restoring infiltration capacity in compacted soils.
Natural processes work best to solve compaction, but can take decades.
Amount of plant material above and below ground
Value of Using Native Plants• Deeper roots – absorbs more
water and help loosen compacted soil
• Uses no fertilizer• Uses little or no pesticides• Maintenance similar to other
gardens• Does not require watering in
droughts after establishment

13
Deep Tilled to 18 inches and Planted Native Plants to Restore Infiltration
Infiltration Basin with Compacted Soils
Working Infiltration Basin (West Bend, WI)
Wisconsin Technical Standard 1003 - Incorporate 2 inches of compost into 2 inches of topsoil using a chisel plow capable of reaching 12 inches below existing surface
Conclusions• Many bioretention and infiltration types of controls
are available that can be used in a variety of applications.
• They must be designed to consider site soil and rainfall conditions.
• Intermediate-sized rains should be the focus of control programs, but these devices are generally limited to the lower range of these critical rains, unless large areas are dedicated to infiltration or have outstanding soils available.
• Infiltration controls work very well in conjunction with other types of complementary stormwater controls.

14
Robert PittDepartment of Civil, Construction, and Environmental
EngineeringUniversity of Alabama
Tuscaloosa, AL, USA 35487
Design/Construction/Maintenance Design/Construction/Maintenance Techniques for Successful Stormwater Techniques for Successful Stormwater
Bioretention and InfiltrationBioretention and InfiltrationSeminar #18 (Part 2)Part 2)
• Groundwater contamination potential
• Soil amendments• Design examples and performance
Groundwater Contamination Potential with Stormwater Infiltration
• Enhanced infiltration increases water movement to groundwater compared to conventional development.
• Care must also be taken to minimize groundwater contamination potential.
Groundwater Impacts Associated with Stormwater Infiltration
• Scattered information is available addressing groundwater impacts in urban areas. Major information sources include:
• Historically known high chlorides under northern cities• EPA 1983 NURP work on groundwater beneath Fresno
and Long Island infiltration basins • NRC 1994 report on groundwater recharge using
waters of impaired quality • USGS work on groundwater near stormwater
management devices in Florida and Long Island• A number of communities throughout the world
(including Portland, OR; Phoenix, AZ; Tokyo; plus areas in France, Denmark, Sweden, Switzerland, and Germany, etc.)

15
Minimal Pre-treatment before Infiltration Leads toGreater Groundwater Contamination Potential
(also, filter fabric liners are usually not recommended anymore as many have failed due to clogging from silts)
Potential Problem Pollutants were Identified by Pitt, et al. (1994 and
1996) Based on a Weak-Link Model Having the Following Components:
• Their abundance in stormwater,• Their mobility through the unsaturated
zone above the groundwater, and• Their treatability before discharge.
Moderate to High Contamination Potential
ChlorideChlorideChloride
Nickel, chromium, lead, zinc
Enteroviruses, some bacteria and protozoa
EnterovirusesEnteroviruses
1,3-dichlorobenzene, benzo (a) anthracene, bis (2-ethylhexl phthalate), fluoranthene, pentachlorophenol, phenanthrene, pyrene
Benzo (a) anthracene, bis (2-ethylhexl phthalate), fluoranthene, pentachlorophenol, phenanthrene, pyrene
Fluoranthene, pyrene
Lindane, chlordaneLindane, chlordane
Injection after Minimal Pretreatment (dry wells)
Surface Infiltration with minimal Pretreatment (biofiltration and some porous pavements)
Surface Infiltration after Sedimentation plus sorption/ion-exchange (MCTT then infiltration)
Stormwater Constituents that may Adversely Affect Infiltration Device Life
and Performance• Sediment (suspended solids) will clog device• Major cations (K+, Mg+2, Na+, Ca+2, plus various
heavy metals in high abundance, such as Al and Fe) will consume soil CEC (cation exchange capacity) in competition with stormwater pollutants.
• Soil CEC measurements are highly dependent on pH. If have low pH values in runoff, decreased available soil CEC will result.
• An excess of sodium, in relation to calcium and magnesium, can increase the soil’s SAR (sodium adsorption ratio), which decreases the soil’s infiltration rate and hydraulic conductivity.

16
Enhanced Infiltration and Groundwater Protection with Soil
Amendments
• Modifying soil in biofiltration and bioretention devices can improve their performance, while offering groundwater protection.
Many soil processes reduce the mobility of stormwater pollutants
• Ion exchange, sorption, precipitation, surface complex ion formation, chelation, volatilization, microbial processes, lattice penetration, etc.
• If soil is lacking in these properties, then soil amendments can be added to improve the soil characteristics.
• Cation exchange capacity (CEC) and sodium adsorption ratio (SAR) are two soil factors that can be directly measured and water characteristics compared. Other soil processes (especially in complex mixtures) need to be evaluated using controlled experiments.
Effects of Compost-Amendments on Runoff Properties
• Rob Harrison ,Univ. of Wash., and Bob Pitt, Univ. of Alabama examined the benefits of adding large amounts of compost to glacial till soils at the time of land development (4” of compost for 8” of soil)
17
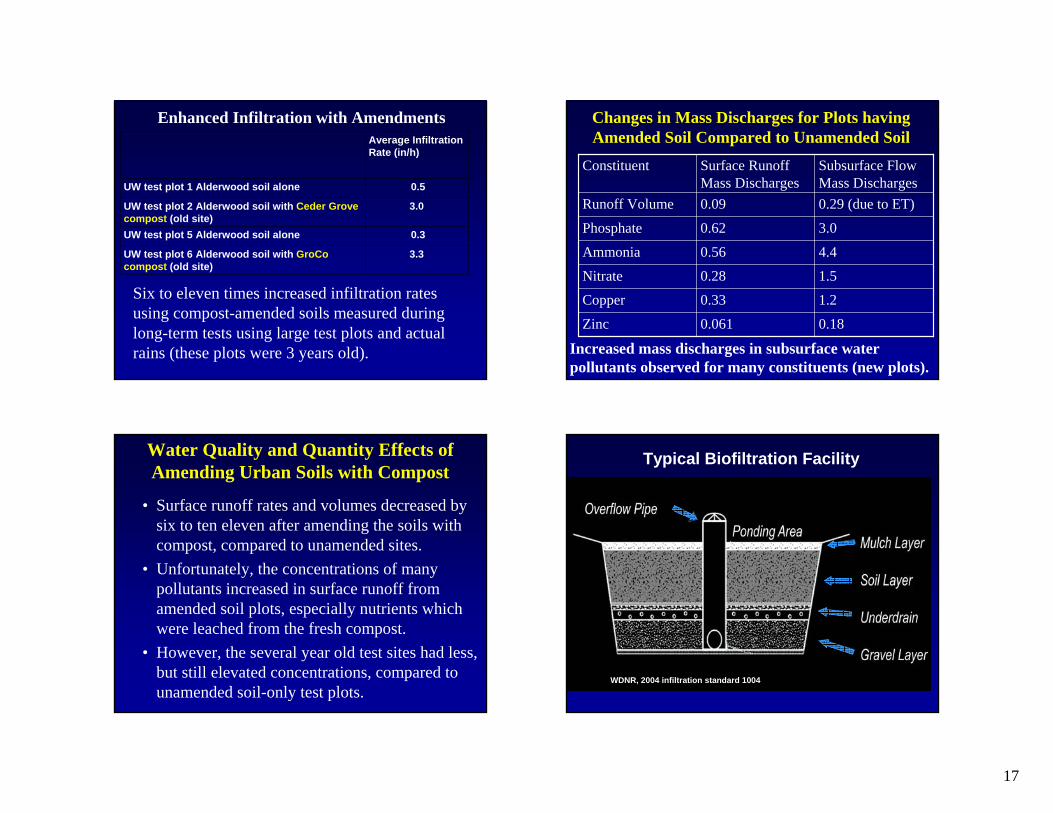
3.3UW test plot 6 Alderwood soil with GroCocompost (old site)
0.3UW test plot 5 Alderwood soil alone
3.0UW test plot 2 Alderwood soil with Ceder Grovecompost (old site)
0.5UW test plot 1 Alderwood soil alone
Average Infiltration Rate (in/h)
Enhanced Infiltration with Amendments
Six to eleven times increased infiltration rates using compost-amended soils measured during long-term tests using large test plots and actual rains (these plots were 3 years old).
Changes in Mass Discharges for Plots having Amended Soil Compared to Unamended Soil
0.180.061Zinc
1.20.33Copper
1.50.28Nitrate
4.40.56Ammonia
3.00.62Phosphate
0.29 (due to ET)0.09Runoff Volume
Subsurface Flow Mass Discharges
Surface Runoff Mass Discharges
Constituent
Increased mass discharges in subsurface water pollutants observed for many constituents (new plots).
Water Quality and Quantity Effects of Amending Urban Soils with Compost
• Surface runoff rates and volumes decreased by six to ten eleven after amending the soils with compost, compared to unamended sites.
• Unfortunately, the concentrations of many pollutants increased in surface runoff from amended soil plots, especially nutrients which were leached from the fresh compost.
• However, the several year old test sites had less, but still elevated concentrations, compared to unamended soil-only test plots.
WDNR, 2004 infiltration standard 1004
Typical Biofiltration Facility

18
Engineered Soil Mixture – WI Technical Standard 1004
• Mineral Sand (40%) – USDA Coarse Sand or ASTM C33 (Fine Aggregate Concrete Sand)
• Compost (30%) – Meet WDNR Spec. S100• Topsoil (30%) – Sandy loam or loamy sand
Unfortunately, most compost specifications are not very clear and also allow many components that are not desirable (such as not fully stabilized materials and even some animal wastes). Need a material that will not be a pollutant source, while adding desirable soil properties. Fully composted garden wastes and some stabilized agricultural products are usually best (about 15 meq/100g). Peat is one of the best soil amendments, as it has a much greater CEC than other organic materials (about 300 meq/100g).
Unfortunately, peat harvesting is a surface mining operation of a non-renewable resource.
Locally available organic wastes should be investigated as a preferable soil amendment.
Tests on Soil Amendments
• Many tests have been conducted to investigate filtration/ion exchange/sorption properties of materials that can be potentially used as a soil amendment. Some laboratory and
field pilot-scale test setups (EPA and WERF-supported research at Univ. of Alabama). Critical that tests use actual stormwater, not artificial mixtures.
19
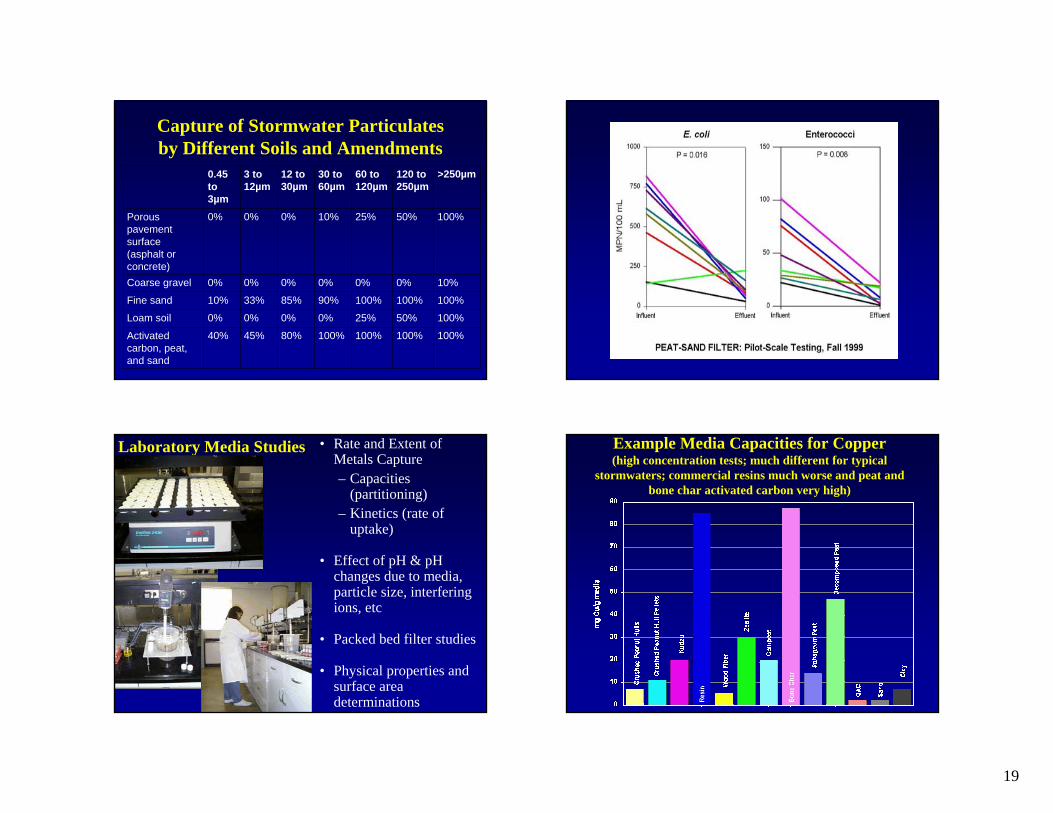
Capture of Stormwater Particulates by Different Soils and Amendments
100%100%100%100%80%45%40%Activated carbon, peat, and sand
100%50%25%0%0%0%0%Loam soil
100%100%100%90%85%33%10%Fine sand
10%0%0%0%0%0%0%Coarse gravel
100%50%25%10%0%0%0%Porous pavement surface (asphalt or concrete)
>250µm120 to 250µm
60 to 120µm
30 to 60µm
12 to 30µm
3 to 12µm
0.45 to 3µm
Laboratory Media Studies • Rate and Extent of Metals Capture– Capacities
(partitioning)– Kinetics (rate of
uptake)
• Effect of pH & pH changes due to media, particle size, interfering ions, etc
• Packed bed filter studies
• Physical properties and surface area determinations
Example Media Capacities for Copper(high concentration tests; much different for typical
stormwaters; commercial resins much worse and peat and bone char activated carbon very high)

20
Contaminant Losses during Anaerobic vs. Aerobic Conditions between Events
Sand had very little capacity for Cu
No significant stripping of copper during aerobic and anaerobic conditions
Peat had large capacity for Cu
Again, sand had very little capacity
Compost leached soluble P during all conditions, especially if anaerobic
Peat had greatest capacity for P
Cation Exchange Capacity (CEC)
Sands have low CEC values, typically ranging from about 1 to 3 meq/100g of material. As the organic content of the soil increases, so does its’ CEC. Compost, for example, can have a CEC of between 15 and 20 meq/100 grams, while clays can have CEC values of 5 and 60 meq/100 grams. Natural soils can therefore vary widely in the CEC depending on their components. Silt loam soils can have a CEC between 10 and 30 meq per 100 gram for example. Soil amendments (usually organic material, such as compost or especially peat) can greatly increase the CEC of a soil that is naturally low in organic material.
Example Site Designs and Evaluations Emphasizing Bioretention
• Bioretention can be most effectively used at new development sites; site surveys can identify the best soils, and lead to recommended amendments.
• Bioretention can be used in retrofitted applications, though more costly and not as effective.
• Bioretention and infiltration should be used in conjunction with other stormwater controls, especially sedimentation (such as wet ponds) and energy controlling practices (such as dry ponds).

21
Big box development stormwater management options (retrofit application).
Summary of Measured Areas• Totally connected impervious areas: 25.9 acres
– parking 15.3 acres– roofs (flat) 8.2 acres– streets (1.2 curb-miles and 33 ft wide) 2.4 acres
• Landscaped/open space 15.4 acres
• Total Area 41.3 acres
Stormwater Controls• Bioretention areas (parking lot islands)
– 52 units of 40 ft by 8 ft– Surface area: 320 ft2
– Bottom area: 300 ft2
– Depth: 1 ft – Vertical stand pipe: 0.5 ft. dia. 0.75 ft high– Broad-crested weir overflow: 8 ft long, 0.25 ft wide
and 0.9 ft high– Amended soil: sandy loam
• Also examined wet detention ponds
Modeled Runoff Volume Changes
41%n/a% reduction in volume
0.350.59Average Rv
1.672.85Runoff volume (106 ft3/yr)
With bioretention
Base conditions
22
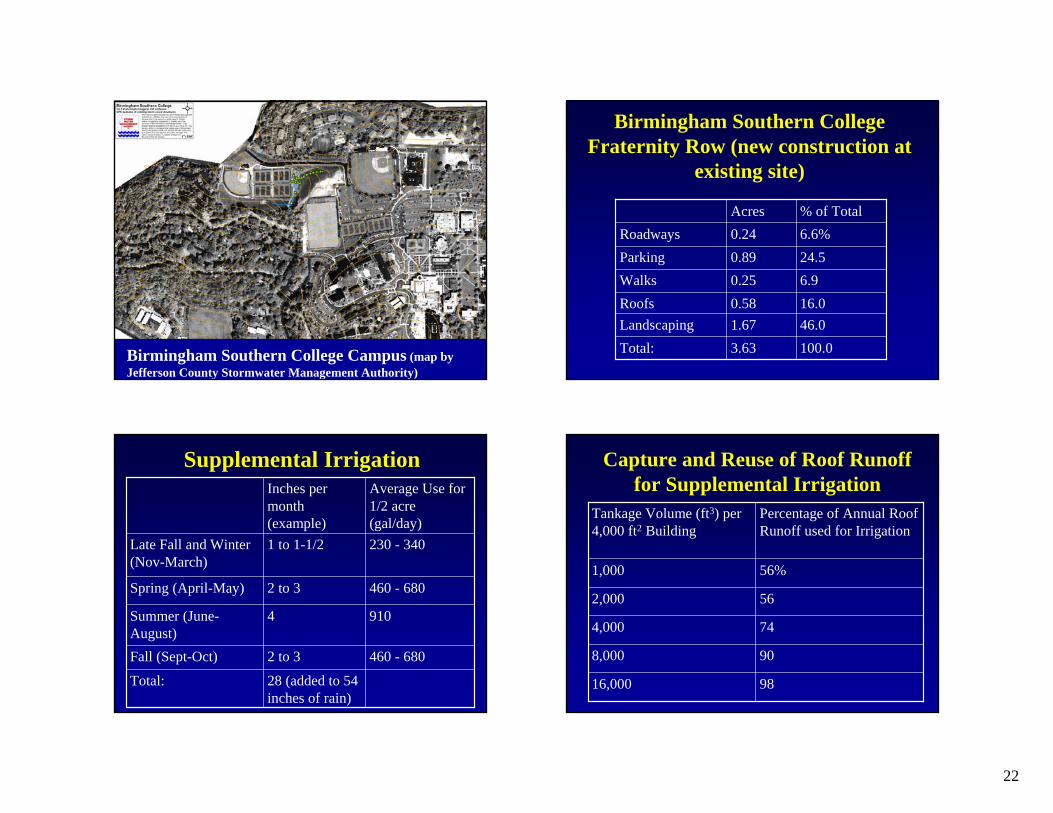
Birmingham Southern College Campus (map by Jefferson County Stormwater Management Authority)
Birmingham Southern College Fraternity Row (new construction at
existing site)
100.03.63Total:46.01.67Landscaping16.00.58Roofs6.90.25Walks24.50.89Parking6.6%0.24Roadways% of TotalAcres
Supplemental Irrigation
28 (added to 54 inches of rain)
Total:
460 - 6802 to 3Fall (Sept-Oct)
9104Summer (June-August)
460 - 6802 to 3Spring (April-May)
230 - 3401 to 1-1/2 Late Fall and Winter (Nov-March)
Average Use for 1/2 acre (gal/day)
Inches per month (example)
Capture and Reuse of Roof Runoff for Supplemental Irrigation
9816,000
908,000
744,000
562,000
56%1,000
Percentage of Annual Roof Runoff used for Irrigation
Tankage Volume (ft3) per 4,000 ft2 Building

23
Combinations of Controls to Reduce Runoff Volume
1.466,000Grass swales and walkway porous pavers, plus bioretention for roof and parking area runoff
3.7170,000Grass swales and walkway porous pavers, plus roof runoff disconnections
5.7260,000Grass swales and walkway porous pavers
8.3X380,000Conventional development
--46,000Undeveloped
Increase Compared to Undeveloped Conditions
Total Annual Runoff (ft3/year)
Elements of Conservation Design for Cedar Hills Development
(near Madison, WI, project conducted by Roger Bannerman, WI DNR and USGS)
• Grass Swales• Wet Detention Pond• Infiltration Basin/Wetland• Reduced Street Width
ExplanationWetpond Infiltrations BasinSwalesSidewalkDrivewayHousesLawnsRoadwayWoodlot
N
500 0 500 1000 Feet
Cedar Hill Site Design, Crossplains WI
WI DNR photos

24
Reductions in Runoff Volume for Cedar Hills (calculated using WinSLAMM
and verified by site monitoring)
78% decrease, compared to no
controls15% increase over pre-development
1.5Swales + Pond/wetland + Infiltration Basin
515% increase6.7No Controls
1.3Pre-development
Expected Change (being monitored)
Runoff Volume, inches
Type of Control
Conservation Design Elements for North Huntsville, AL, Industrial Park
• Grass filtering and swale drainages• Modified soils to protect groundwater• Wet detention ponds• Bioretention and site infiltration devices• Critical source area controls at loading docks, etc.• Pollution prevention through material selection
(no exposed galvanized metal, for example) and no exposure of materials and products.
A new industrial site in Huntsville, AL, has 52 two acre individual building sites. Each site will be served with a grass-lined bioretention channel that will carry site water to a larger swale system. The on-site swales will also have modified soils to increase the CEC and organic matter content to protect groundwater resources.
25
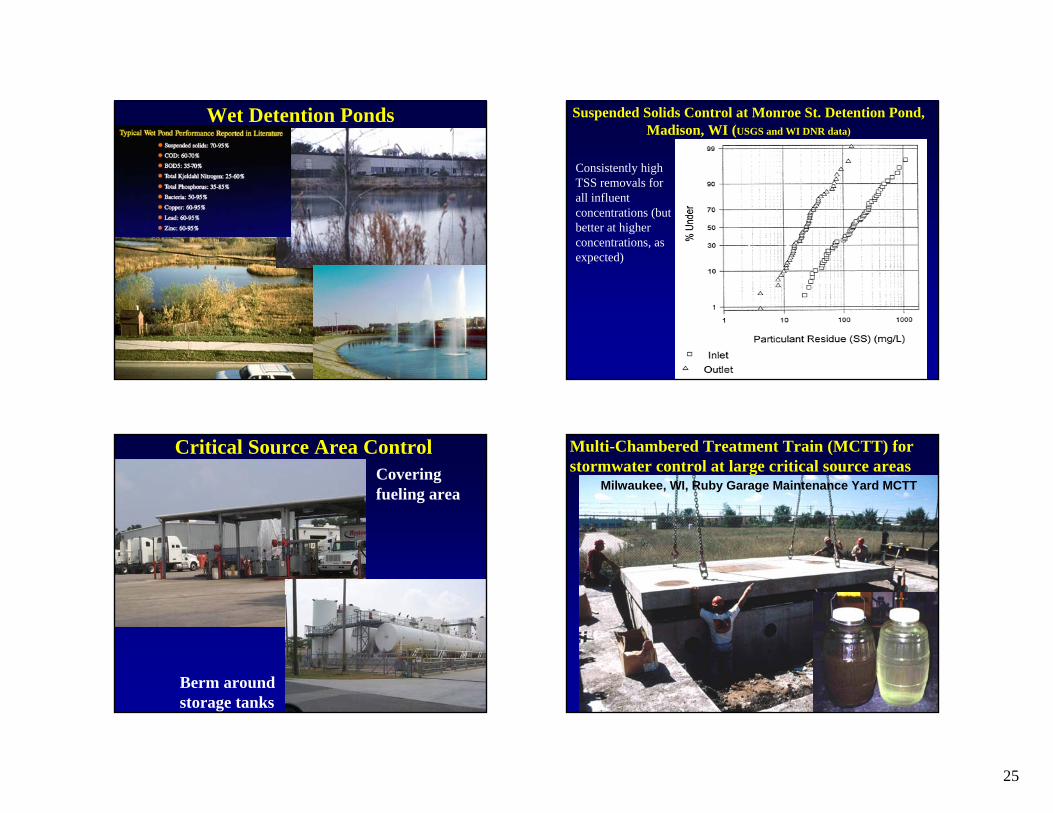
Wet Detention Ponds Suspended Solids Control at Monroe St. Detention Pond, Madison, WI (USGS and WI DNR data)
Consistently high TSS removals for all influent concentrations (but better at higher concentrations, as expected)
Critical Source Area ControlCovering fueling area
Berm around storage tanks
Multi-Chambered Treatment Train (MCTT) for stormwater control at large critical source areas
Milwaukee, WI, Ruby Garage Maintenance Yard MCTT
26
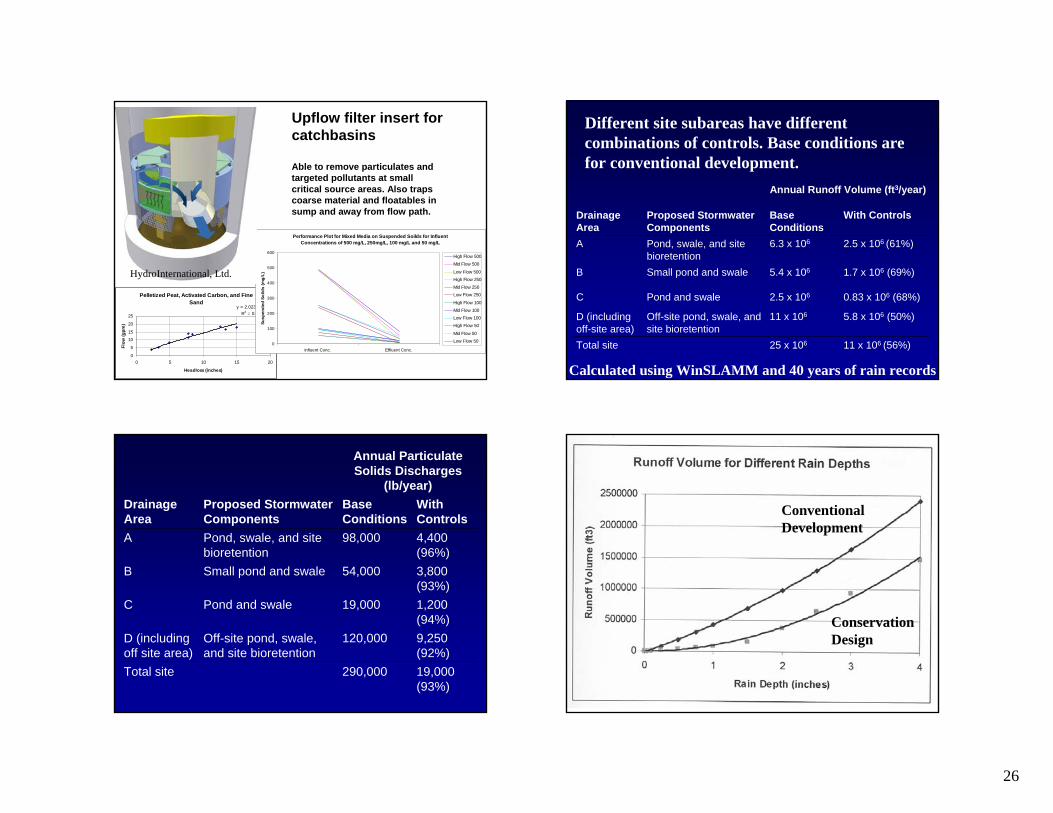
Upflow filter insert for catchbasins
Able to remove particulates and targeted pollutants at small critical source areas. Also traps coarse material and floatables in sump and away from flow path.
Pelletized Peat, Activated Carbon, and Fine Sand
y = 2.0238x0.8516
R2 = 0.9714
0
5
10
15
20
25
0 5 10 15 20
Headloss (inches)
Flow
(gpm
)
Performance Plot for Mixed Media on Suspended Soilds for Influent Concentrations of 500 mg/L, 250mg/L, 100 mg/L and 50 mg/L
0
100
200
300
400
500
600
Influent Conc. Effluent Conc.
Susp
ende
d So
ilds
(mg/
L)High Flow 500
Mid Flow 500
Low Flow 500High Flow 250
Mid Flow 250Low Flow 250
High Flow 100
Mid Flow 100Low Flow 100
High Flow 50
Mid Flow 50Low Flow 50
HydroInternational, Ltd.
11 x 106 (56%)25 x 106Total site
5.8 x 10⁶ (50%)11 x 106Off-site pond, swale, and site bioretention
D (including off-site area)
0.83 x 10⁶ (68%)2.5 x 10⁶Pond and swaleC
1.7 x 10⁶ (69%)5.4 x 10⁶Small pond and swaleB
2.5 x 10⁶ (61%)6.3 x 10⁶Pond, swale, and site bioretention
A
With ControlsBase Conditions
Proposed Stormwater Components
Drainage Area
Annual Runoff Volume (ft3/year)
Different site subareas have different combinations of controls. Base conditions are for conventional development.
Calculated using WinSLAMM and 40 years of rain records
19,000 (93%)
290,000Total site
9,250 (92%)
120,000Off-site pond, swale, and site bioretention
D (including off site area)
1,200 (94%)
19,000Pond and swaleC
3,800 (93%)
54,000Small pond and swaleB
4,400 (96%)
98,000Pond, swale, and site bioretention
A
With Controls
Base Conditions
Proposed Stormwater Components
Drainage Area
Annual Particulate Solids Discharges
(lb/year)
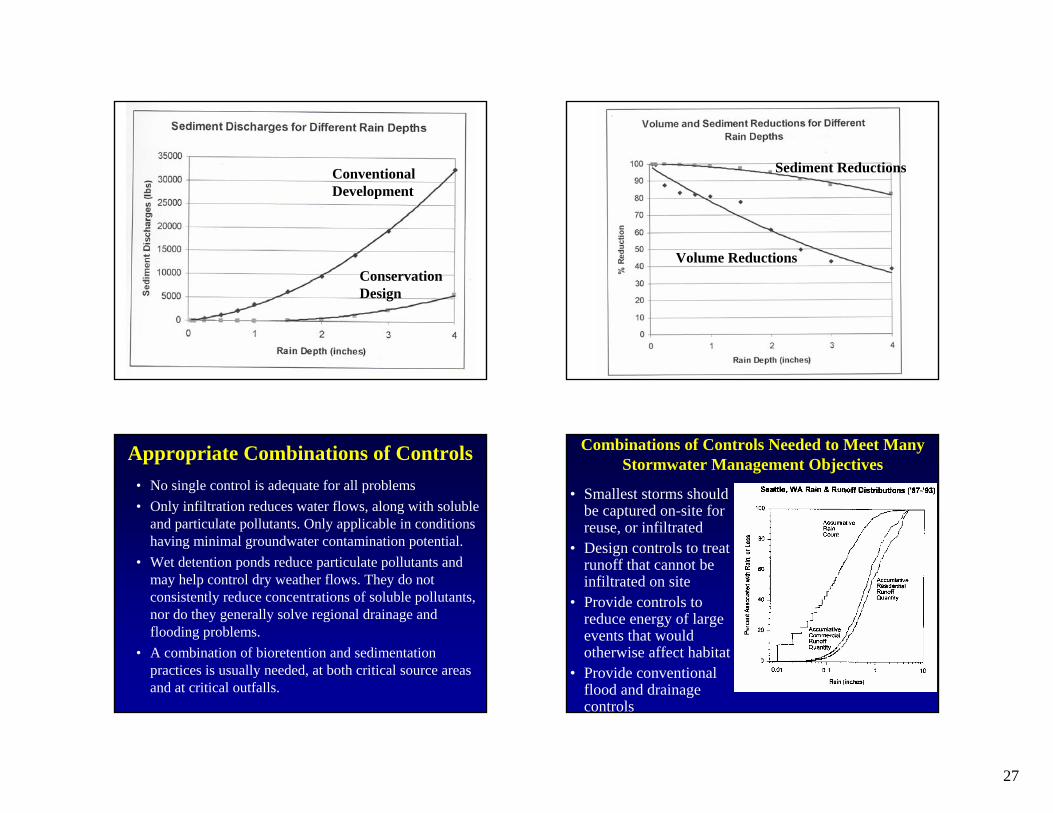
Conventional Development
Conservation Design
27
Conventional Development
Conservation Design
Sediment Reductions
Volume Reductions
Appropriate Combinations of Controls• No single control is adequate for all problems• Only infiltration reduces water flows, along with soluble
and particulate pollutants. Only applicable in conditions having minimal groundwater contamination potential.
• Wet detention ponds reduce particulate pollutants and may help control dry weather flows. They do not consistently reduce concentrations of soluble pollutants, nor do they generally solve regional drainage and flooding problems.
• A combination of bioretention and sedimentation practices is usually needed, at both critical source areas and at critical outfalls.
Pitt, et al. (2000)
• Smallest storms should be captured on-site for reuse, or infiltrated
• Design controls to treat runoff that cannot be infiltrated on site
• Provide controls to reduce energy of large events that would otherwise affect habitat
• Provide conventional flood and drainage controls
Combinations of Controls Needed to Meet Many Stormwater Management Objectives