Embed Size (px)
Citation preview
Design Design OptimizationOptimization
Cyril Cyril PernetPernet, PhD, PhDSBIRC/SINAPSE SBIRC/SINAPSE –– University of EdinburghUniversity of Edinburgh

Introduction:Introduction: fMRI noise
fMRI design types:fMRI design types: blocked designsevent-related designsmixed designadaptation designs
Efficiency:Efficiency: mathematical descriptionefficiency in practice
Statistical designs:Statistical designs: nb factors / nb of sessionswithin / between variance
fMRI designs: overviewfMRI designs: overview

IntroductionIntroduction

fMRI noisefMRI noiseIt exists different sources of noise which can interfere with thIt exists different sources of noise which can interfere with the e experiment (determines the SNR):experiment (determines the SNR):
⇒⇒ Thermal (intrinsic) noiseThermal (intrinsic) noise⇒⇒ System noise: static field System noise: static field inhomogeneitiesinhomogeneities (scanner drift = (scanner drift = ∆∆
resonance frequency Hresonance frequency H++), nonlinearities and instabilities on the ), nonlinearities and instabilities on the gradient fields, offgradient fields, off--resonance or loading effects in the resonance or loading effects in the radiofrequency transmitter and receiver coilsradiofrequency transmitter and receiver coils
⇒⇒ Physiological noise: cardiac / respiratory activity (aliasing Physiological noise: cardiac / respiratory activity (aliasing pblmpblm) / ) / motionmotion

fMRI noisefMRI noise
Thermal noise is produced due to the thermal motion of electrons inside the subject's body and in the large electronic circuits of the MRI scanner.
Thermal noiseThermal noise is produced due to the thermal motion of electrons is produced due to the thermal motion of electrons inside the subject's body and in the large electronic circuits oinside the subject's body and in the large electronic circuits of the MRI f the MRI scanner.scanner.
This type of intrinsic scanner noise is uncorrelated to the task and the hemodynamic signal, and therefore can be described as “white” noise. This type of noise increases with increased resolution, i.e. for smaller voxel size.

fMRI noisefMRI noiseN/2 Ghost: N/2 Ghost: EPI scans suffer from ghosting artefacts in the phase EPI scans suffer from ghosting artefacts in the phase encoding direction. During acquisition, kencoding direction. During acquisition, k--space data are sampled by space data are sampled by an alternating positive/negative read gradient. This results in an alternating positive/negative read gradient. This results in a a single ghost shifted by half a FOV.single ghost shifted by half a FOV.Susceptibility artefacts: Susceptibility artefacts: The EPI images are very sensitive to the The EPI images are very sensitive to the changes of the magnetic susceptibility, i.e. the signal from regchanges of the magnetic susceptibility, i.e. the signal from regions ions of different properties (brain/air) like regions close to the siof different properties (brain/air) like regions close to the sinuses nuses or the temporal pole may disappear. Artefacts can also be causedor the temporal pole may disappear. Artefacts can also be caused by by the presence of magnetic material in proximity of the gradients,the presence of magnetic material in proximity of the gradients, e.g. e.g. implants, braces, or even someone moving in the room.implants, braces, or even someone moving in the room.Scanner drift: Scanner drift: Drift is created most probably by the small Drift is created most probably by the small instability of scanner gradients. It can create slow changes in instability of scanner gradients. It can create slow changes in voxel voxel intensity over time (2 sessions = 2 mean intensities). intensity over time (2 sessions = 2 mean intensities).

fMRI noisefMRI noise
Cardiac and respiratory artefacts: Cardiac and respiratory artefacts: The pulsation of the blood and The pulsation of the blood and changes connected to breathing can change blood flow and changes connected to breathing can change blood flow and oxygenation. oxygenation.
These factors create high frequency signal artefacts, for examplThese factors create high frequency signal artefacts, for example, the e, the cardiac cycle is too fast (500 ms) to be sampled with a relativecardiac cycle is too fast (500 ms) to be sampled with a relatively ly average TR (2000 ms). However, when this is the case, the average TR (2000 ms). However, when this is the case, the variability become attributed to a lower frequency (variability become attributed to a lower frequency (aliasingaliasing), ), creating an even larger problem.creating an even larger problem.

fMRI noisefMRI noise
Respiratory-induced noise is dominant near the edges of the brain as well as near in the larger veins and in the ventricles (Lund et al., 2006)
fMRI noisefMRI noise
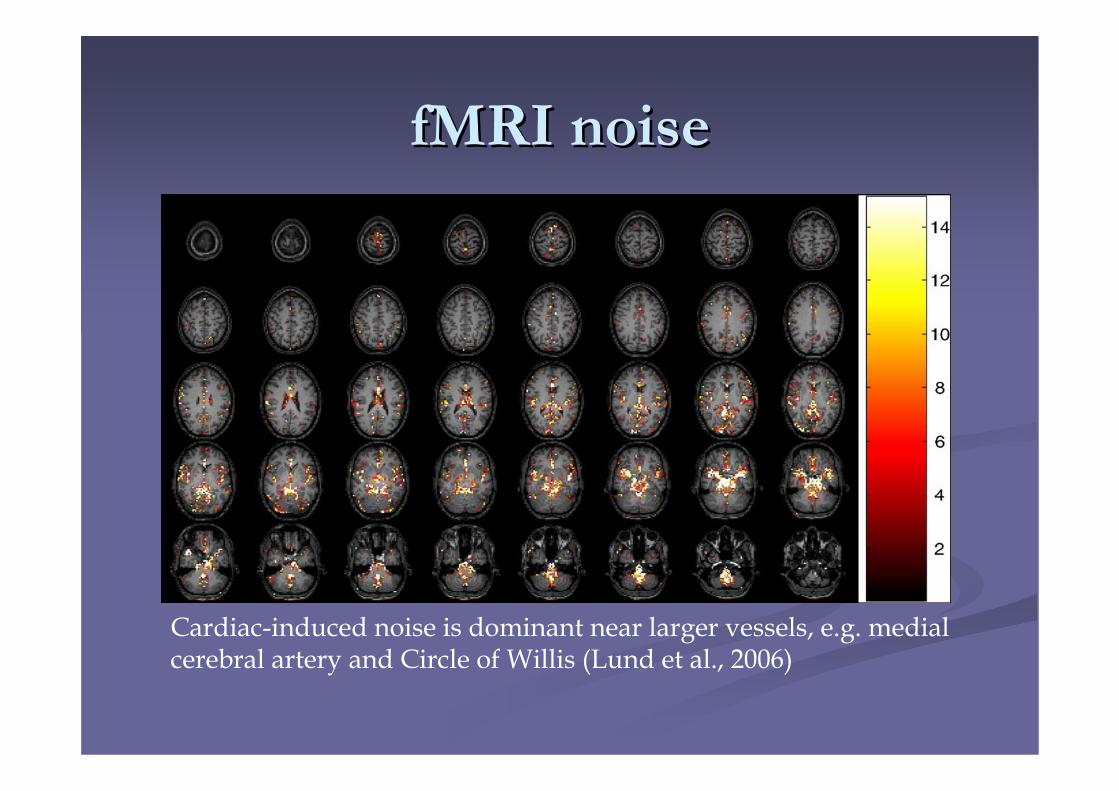
Cardiac-induced noise is dominant near larger vessels, e.g. medial cerebral artery and Circle of Willis (Lund et al., 2006)

fMRI noisefMRI noiseSubject motion is a common source of series artefacts. Even Subject motion is a common source of series artefacts. Even relatively small motion (of the range much smaller than a voxel relatively small motion (of the range much smaller than a voxel size size e.ge.g 1.61.6--3.2 mm) can create serious artefacts due to the partial 3.2 mm) can create serious artefacts due to the partial volume effects. Typically motion of about half a voxel in size wvolume effects. Typically motion of about half a voxel in size will ill render the data useless (thatrender the data useless (that’’s why there is a motion correction step s why there is a motion correction step in the analysis).in the analysis).
Lund et al. 2006
fMRI noisefMRI noise
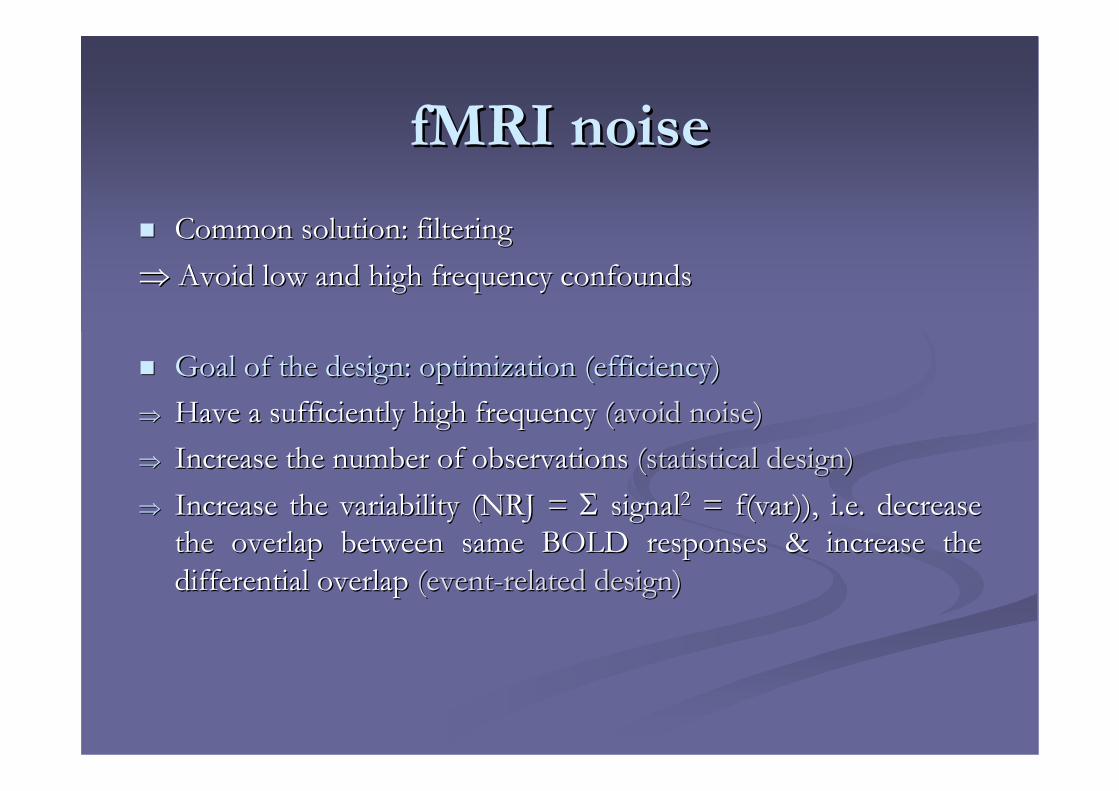
Common solution: filteringCommon solution: filtering⇒⇒ Avoid low and high frequency confoundsAvoid low and high frequency confounds
Goal of the design: optimization (efficiency)Goal of the design: optimization (efficiency)⇒⇒ Have a sufficiently high frequency Have a sufficiently high frequency (avoid noise)(avoid noise)⇒⇒ Increase the number of observations Increase the number of observations (statistical design)(statistical design)⇒⇒ Increase the variability (NRJ = Increase the variability (NRJ = ΣΣ signalsignal22 = = f(varf(var)), i.e. d)), i.e. decrease ecrease
the overlap between same BOLD responses & increase the the overlap between same BOLD responses & increase the differential overlap differential overlap (event(event--related design)related design)

Take Home message 1Take Home message 1
Avoid any ferromagnetic object in the scanner Avoid any ferromagnetic object in the scanner (susceptibility artefacts can be caused by a bra !!) (susceptibility artefacts can be caused by a bra !!) Scan as long as possible to avoid scanner/session effectScan as long as possible to avoid scanner/session effectAvoid low frequency in a designAvoid low frequency in a designMinimize biological artefacts (monitoring of cardiac Minimize biological artefacts (monitoring of cardiac and respiratory rhythms when possible and motion and respiratory rhythms when possible and motion correction both as precorrection both as pre--processing and as regressors for processing and as regressors for the residuals)the residuals)

fMRI design typesfMRI design types

Blocked designsBlocked designs
Powerful in terms of detection, i.e. to determine which voxels Powerful in terms of detection, i.e. to determine which voxels are activated. are activated. Poor estimation power, i.e. a weak ability to determine the timePoor estimation power, i.e. a weak ability to determine the timecourse of the response course of the response ⇒⇒ summation of hemodynamic summation of hemodynamic responsesresponses..
Ex: 1 stimulus every 1 sec / 3 sec / 5 sec TR: 2.5 sec Highpass filter: 128Hz
⊗
⊗
⊗
=

Blocked designsBlocked designs
The advantage of short ISI is that the The advantage of short ISI is that the response is greater than for long ISI response is greater than for long ISI because responses to different stimuli because responses to different stimuli summate thus increasing the response summate thus increasing the response amplitudeamplitude
The disadvantage of short ISI is that it exists an hemodynamic The disadvantage of short ISI is that it exists an hemodynamic refractoriness period, a neuronal refractoriness period, i.e. larefractoriness period, a neuronal refractoriness period, i.e. late te neuronal components may be interrupted by early components of neuronal components may be interrupted by early components of next stimulus. There is also a cost for task related performancenext stimulus. There is also a cost for task related performances s (particularly for patients), trade off rate/performance.(particularly for patients), trade off rate/performance.
1Hz 0.3Hz 0.2Hz
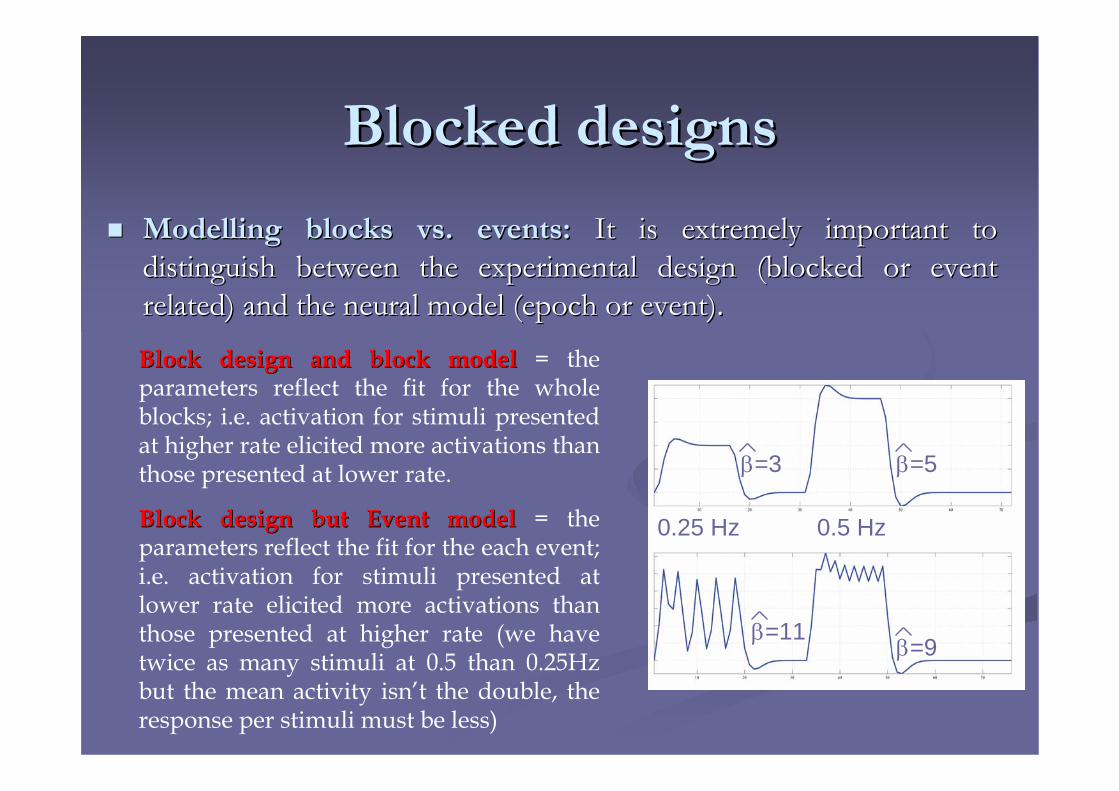
Modelling blocks vs. events:Modelling blocks vs. events: It is extremely important to It is extremely important to distinguish between the experimental design (blocked or event distinguish between the experimental design (blocked or event related) and the neural model (epoch or event).related) and the neural model (epoch or event).
Blocked designsBlocked designs
β=3 β=5
Block design and block modelBlock design and block model = the parameters reflect the fit for the whole blocks; i.e. activation for stimuli presented at higher rate elicited more activations than those presented at lower rate.
0.5 Hz0.25 HzBlock design but Event modelBlock design but Event model = the parameters reflect the fit for the each event; i.e. activation for stimuli presented at lower rate elicited more activations than those presented at higher rate (we have twice as many stimuli at 0.5 than 0.25Hz but the mean activity isn’t the double, the response per stimuli must be less)
β=11β=9
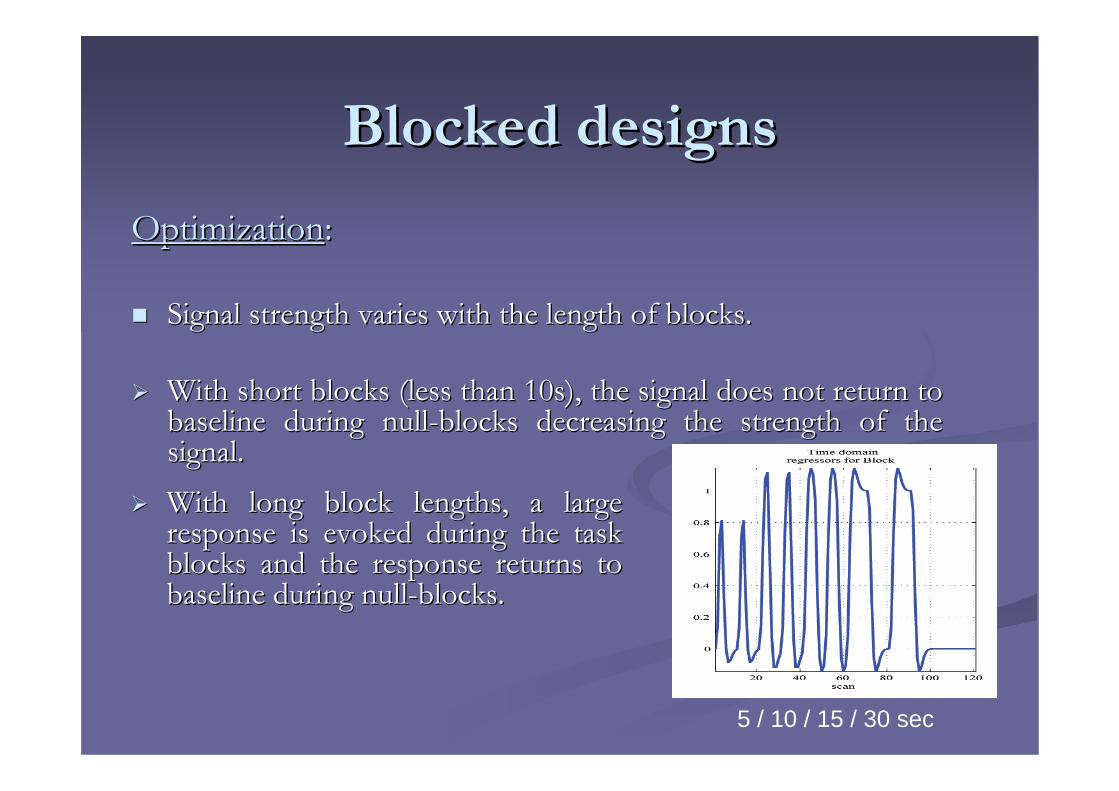
OptimizationOptimization::
Signal strength varies with the length of blocks. Signal strength varies with the length of blocks.
With short blocks (less than 10s), the signal does not return toWith short blocks (less than 10s), the signal does not return tobaseline during nullbaseline during null--blocks decreasing the strength of the blocks decreasing the strength of the signal. signal.
Blocked designsBlocked designs
With long block lengths, a large With long block lengths, a large response is evoked during the task response is evoked during the task blocks and the response returns to blocks and the response returns to baseline during nullbaseline during null--blocks. blocks.
5 / 10 / 15 / 30 sec

OptimizationOptimization::
So far we want short ISI and long blocksSo far we want short ISI and long blocks
However, the detection power increases with high frequency However, the detection power increases with high frequency alternation because i) it depends on the number of events/blocksalternation because i) it depends on the number of events/blocksand ii) the noise in the BOLD time course which occurs mainly and ii) the noise in the BOLD time course which occurs mainly at low frequencies.at low frequencies.
Blocks with durations longer than the hemodynamic Blocks with durations longer than the hemodynamic response reach a compromise between signal strength and response reach a compromise between signal strength and noise (optimal 16s)noise (optimal 16s)
Blocked designsBlocked designs

Blocked designsBlocked designs

♦ Example of a Periodic designsPeriodic designs
EventEvent--related designsrelated designs
Alternates two conditions A A B A B B A B every 20 sec

Estimation power of eventEstimation power of event--related design is often good as related design is often good as they allow to inquire the hemodynamic shape for each they allow to inquire the hemodynamic shape for each condition and compare parameters such as the amplitude condition and compare parameters such as the amplitude or the timing between conditions. or the timing between conditions.
By contrast, the detection power is relatively weak in By contrast, the detection power is relatively weak in comparison with blocked design. This is explained by the comparison with blocked design. This is explained by the simple fact that experimental power depends on the simple fact that experimental power depends on the number of events that are averaged.number of events that are averaged.
EventEvent--related designsrelated designs
EventEvent--related designsrelated designs
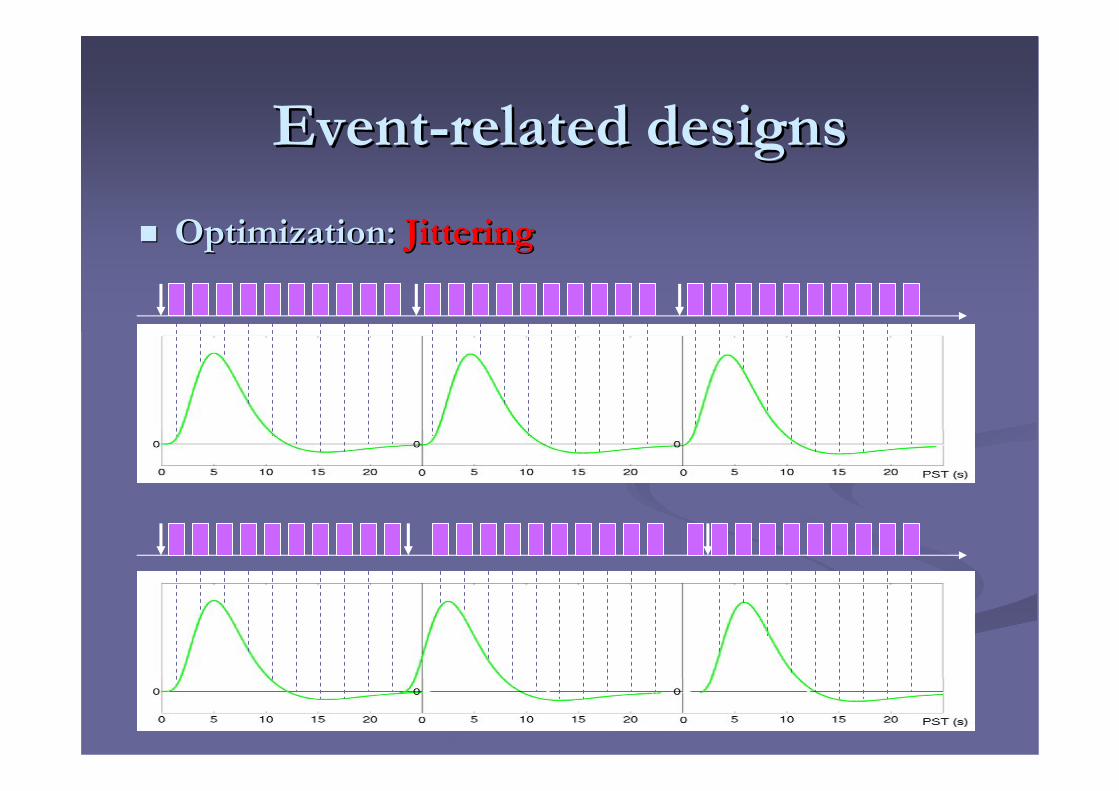
Optimization: Optimization: JitteringJittering
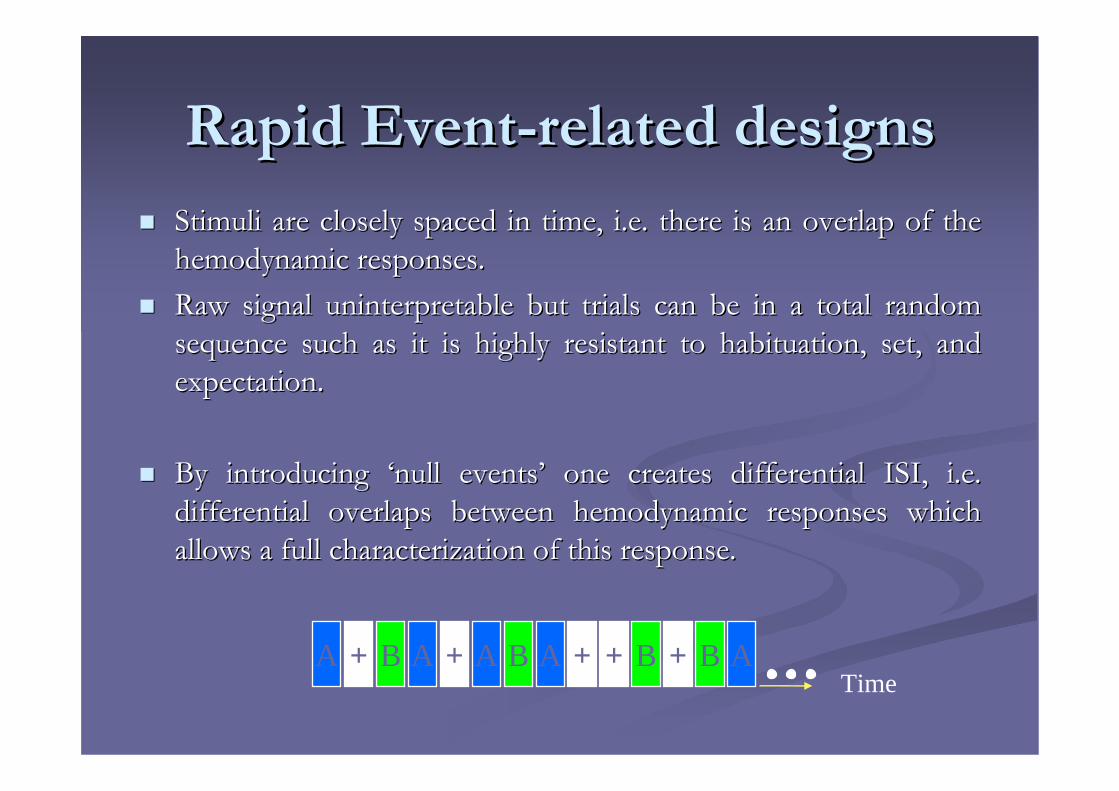
Stimuli are closely spaced in time, i.e. there is an overlap of Stimuli are closely spaced in time, i.e. there is an overlap of the the hemodynamic responses.hemodynamic responses.Raw signal Raw signal uninterpretableuninterpretable but trials can be in a total random but trials can be in a total random sequence such as it is highly resistant to habituation, set, andsequence such as it is highly resistant to habituation, set, andexpectation.expectation.
By introducing By introducing ‘‘null eventsnull events’’ one creates differential ISI, i.e. one creates differential ISI, i.e. differential overlaps between hemodynamic responses which differential overlaps between hemodynamic responses which allows a full characterization of this response.allows a full characterization of this response.
Rapid EventRapid Event--related designsrelated designs
A + B AAAA ++ + +BB BTime

Jittered designsJittered designs rely on the likelihood rely on the likelihood of a given ISI following each stimulus of a given ISI following each stimulus (stationary stochastic designs)(stationary stochastic designs)
Randomized designsRandomized designs rely on the rely on the likelihood of a stimulus being presented likelihood of a stimulus being presented at each time pointat each time point
SemirandonSemirandon designsdesigns, rely on the , rely on the systematic probability variation of systematic probability variation of stimuli over time (dynamic stochastic stimuli over time (dynamic stochastic designs)designs)
Rapid EventRapid Event--related designsrelated designs
OptimizationOptimization

Mixed designsMixed designs
Stimuli are displayed in discrete blocksStimuli are displayed in discrete blocks⇒⇒ investigate sustained processes and brain responses (stateinvestigate sustained processes and brain responses (state--related related
processes). This is different from processes). This is different from semirandomsemirandom designs where, designs where, whatever the stimulation rate, we assume that the process is whatever the stimulation rate, we assume that the process is always the same (looking for transient activity for each stimulualways the same (looking for transient activity for each stimulus).s).
Within each block multiple types of eventsWithin each block multiple types of events⇒⇒ because different types of stimuli, transient responses are likebecause different types of stimuli, transient responses are likely ly
to occurs. to occurs.
Mixed designs can investigate interaction between processes Mixed designs can investigate interaction between processes working at different timeworking at different time--scales.scales.

Example: Example: ChawlaChawla et al. 1999.et al. 1999.
Epochs of attention to motion or Epochs of attention to motion or color (same stimulus display, i.e. color (same stimulus display, i.e. moving green colored dots). During moving green colored dots). During each block, red moving dots appeared each block, red moving dots appeared and the subjects had to detect target and the subjects had to detect target stimuli (7% faster red dots or stimuli (7% faster red dots or brighter).brighter).
OptimizationOptimization
Randomized, some long Randomized, some long SOAsSOAs to to ‘‘dede--correlatecorrelate’’ epoch and eventepoch and event--related.related.
attention to motion
attention to color
Interaction between attention and stimulus motion change in V5
Mixed designsMixed designs
(from R. Hensonhttp://www.fil.ion.ucl.ac.uk/spm/course/slides05/ppt/event.ppt)

Adaptation designsAdaptation designs
fMRI adaptation designs (fMRI adaptation designs (afMRIafMRI) use the refractory period to ) use the refractory period to enquire functional differences enquire functional differences within a given voxel. within a given voxel.
The predicted hemodynamic response relies often on a linear The predicted hemodynamic response relies often on a linear prediction. This means that for an impulse (a shortprediction. This means that for an impulse (a short--duration duration stimulus), the hemodynamic system responds in the same manner. stimulus), the hemodynamic system responds in the same manner. The parameters of the hemodynamic response are then directly The parameters of the hemodynamic response are then directly interpreted as reflecting both the intensity and the duration ofinterpreted as reflecting both the intensity and the duration of the the neural response given the scaling (the magnitude of the system neural response given the scaling (the magnitude of the system output is proportional to the system input) and superposition (toutput is proportional to the system input) and superposition (the he total response to a set of inputs is the sum of individual inputtotal response to a set of inputs is the sum of individual inputs) s) properties of linear systems .properties of linear systems .

The hemodynamic response is linear The hemodynamic response is linear for ISI > 6s and nearly linear down for ISI > 6s and nearly linear down to ISI ~ 3s. If the ISI is short, the to ISI ~ 3s. If the ISI is short, the response to a subsequent stimuli is response to a subsequent stimuli is weaker than for a longer ISI (weaker than for a longer ISI (Boynton Boynton and al., 1996, J and al., 1996, J NeurosciNeurosci 16, 420716, 4207--4221; Dale & Buckner, 1997, Hum Br 4221; Dale & Buckner, 1997, Hum Br Map 5, 329Map 5, 329--340340). This phenomenon ). This phenomenon is known as the hemodynamic is known as the hemodynamic refractory period.refractory period.
1st:0.21 2nd:0.17 3rd:0.12
Adaptation designsAdaptation designs

Extension of adaptation: carry overExtension of adaptation: carry over
-Continuous carry-over can be used to estimate simultaneously the mean difference in neural activity between stimuli (for the purpose of distributed pattern analysis) as well as the effect of one stimulus upon another (carry-over effects ~ adaptation).
- Direct and carry-over effects are orthogonal when the order of presentation of stimuli is serially first-order balanced, i.e. each stimulus is preceded equally often by every other stimulus (including self-adjacencies).
Adaptation designsAdaptation designs

Extension of adaptation: carry overExtension of adaptation: carry over
Adaptation designsAdaptation designs
http://www.cfn.upenn.edu/aguirre/wiki/public:continuous_carry-over_for_bold_fmri

Extension of adaptation: carry overExtension of adaptation: carry over
Adaptation designsAdaptation designs
http://www.cfn.upenn.edu/aguirre/wiki/public:continuous_carry-over_for_bold_fmri

Take Home message 2Take Home message 2
Choose your design according to your topic:Choose your design according to your topic:
Detection (block designs), Estimation (eventDetection (block designs), Estimation (event--related related designs), Estimation of event during different designs), Estimation of event during different ‘‘statesstates’’( ( mixed designs), How works a region (mixed designs), How works a region (afMRIafMRI))Think frequency, Think frequency, decorrelationdecorrelation and sequence order and sequence order
http://www.cfn.upenn.edu/aguirre/wiki/public:continuous_carry-over_for_bold_fmri
Design EfficiencyDesign Efficiency

Y = Xβ+e (data=model*reg coef + error)β = (XT X)-1 XTY (we search β)
γ = Cβ (contrast = combination of β)t = γ / (std * sqrt(C (XT X)-1 CT) ) (usual t-test effect / error)
‘noise’ variance and design variance
Eff = 1 / trace (C (XTX)-1 CT) (you want the error to be small)
⇒⇒ Optimize the covariance matrix = increase the variabilityOptimize the covariance matrix = increase the variability
fMRI designs & efficiencyfMRI designs & efficiency
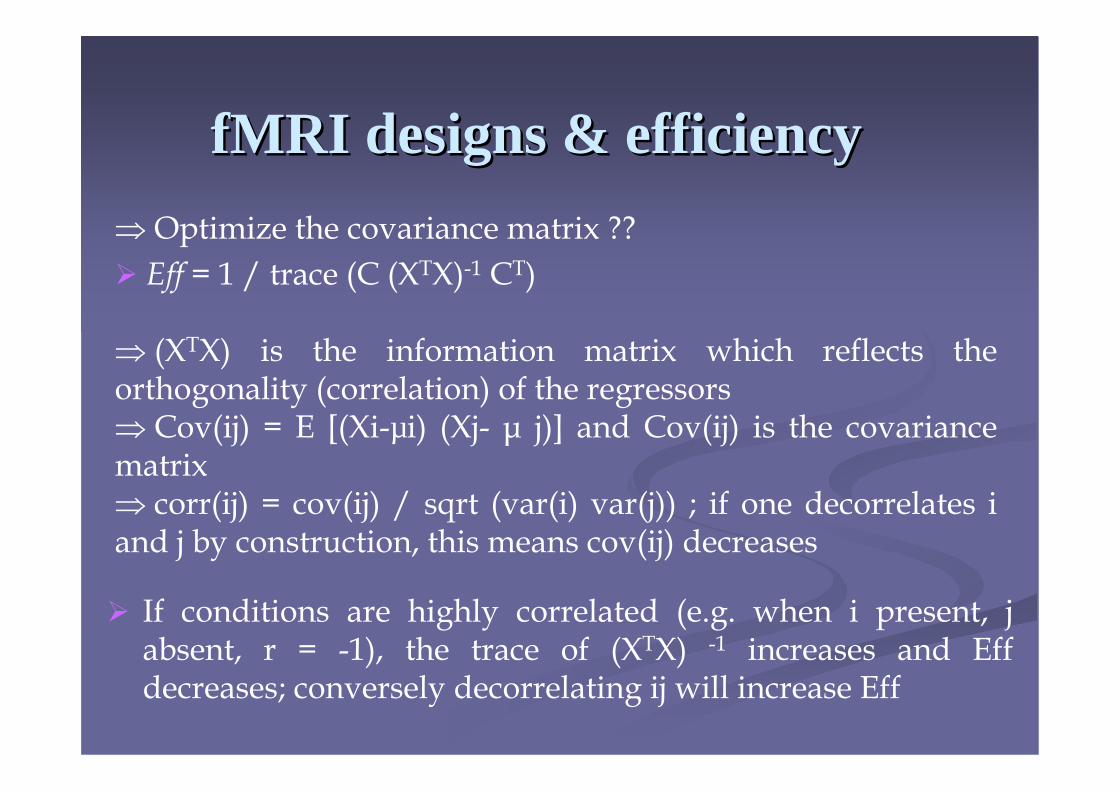
⇒ Optimize the covariance matrix ??Eff = 1 / trace (C (XTX)-1 CT)
⇒ (XTX) is the information matrix which reflects the orthogonality (correlation) of the regressors⇒ Cov(ij) = E [(Xi-µi) (Xj- µ j)] and Cov(ij) is the covariance matrix⇒ corr(ij) = cov(ij) / sqrt (var(i) var(j)) ; if one decorrelates i and j by construction, this means cov(ij) decreases
If conditions are highly correlated (e.g. when i present, j absent, r = -1), the trace of (XTX) -1 increases and Effdecreases; conversely decorrelating ij will increase Eff
fMRI designs & efficiencyfMRI designs & efficiency
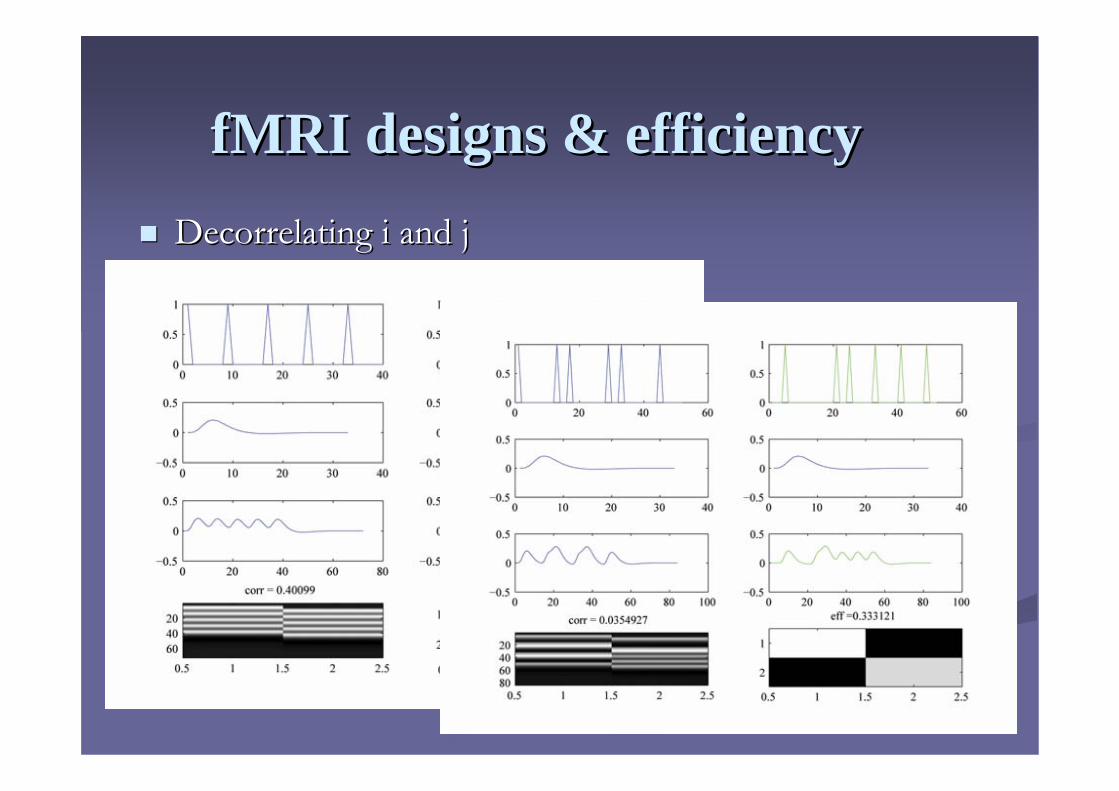
DecorrelatingDecorrelating i and ji and j
fMRI designs & efficiencyfMRI designs & efficiency

A convenient way to construct designs and A convenient way to construct designs and decorrelatedecorrelatecondition is to introduce nullcondition is to introduce null--eventsevents
⇒⇒ Think about the conditions + null events; create a Think about the conditions + null events; create a probability of occurrence (you can tprobability of occurrence (you can think in term of hink in term of transition matrices transition matrices -- A&B p=1; A, B, null (1/3) p<1)A&B p=1; A, B, null (1/3) p<1)
⇒⇒ + ISI + ISI ≠≠ TA or TR (interleaved acquisition)TA or TR (interleaved acquisition)⇒⇒ + no low frequency+ no low frequency
AA BBAA 0.50.5 0.50.5BB 0.50.5 0.50.5
AA BBAA 0.330.33 0.330.33BB 0.330.33 0.330.33
fMRI designs & efficiencyfMRI designs & efficiency
→

Useful Tools (FREE !!)Useful Tools (FREE !!)
http://surfer.nmr.mgh.harvard.edu/optseq/http://surfer.nmr.mgh.harvard.edu/optseq/
http://www.columbia.edu/cu/psychology/tor/sohttp://www.columbia.edu/cu/psychology/tor/software.htmftware.htm
http://jasonkao.myweb.uga.edu/research.htmhttp://jasonkao.myweb.uga.edu/research.htm
Statistical designsStatistical designs

NbNb of factorsof factors
1 factor (activation vs. rest) 1 factor (activation vs. rest) –– easy to interpreteasy to interpret2 factors & 2 levels (A1 A2 B1 B2) = increase the generality of 2 factors & 2 levels (A1 A2 B1 B2) = increase the generality of the experimentthe experiment
Effect ContrastSimple A / B1 [1 1 –2 0] & A /B2 [1 1 0 –2]
B / A1 [-2 0 1 1] & B / A2 [0 –2 1 1]Main A [1 1 -1 -1] B [-1 -1 1 1]Interaction A x B [1 -1 -1 1]
⇒ 2 steps procedure (hierarchical mixed model): for each subjects estimates the parameters (~ weighted mean) and then across subjects. A well designed study increases the efficiency at the 1st
level (i.e. for each subject)

Nb of sessionsNb of sessionsDuring an fMRI experiment, several sessions are performed = During an fMRI experiment, several sessions are performed = increases intraincreases intra--subject variability (scanner changes; motion; subject variability (scanner changes; motion; subject state)subject state)
t = Cβ / sqrt(C (X T X)-1 C T) then for C (1-1)t = (Mean A – Mean B) / sqrt(S²(1/ TA +1/ TB)) ~ (TA+TB –2) df
with T the values for A and B along the time series S² the common variance ((TA-1)S²A+(TB-1)S²B)/(TA+TB-2)
♦ This is for 1 session .. one additional session decreases the statistical power : t ~ (TA + TB -4 ) df
♦♦ Better to scan as long as possible ! (e.g. itBetter to scan as long as possible ! (e.g. it’’s better to get s better to get 400 volumes in 1 session than 2x200 volumes)400 volumes in 1 session than 2x200 volumes)

Within or between subjectsWithin or between subjects
Fixed and random effects analyses:Fixed and random effects analyses:
Fixed ⇒⇒ yi = Xβi + ei with i the subjectsyi = Cβ / (1/sqrt(nSCβ^ ) [sum of within subject variance]
Random ⇒⇒ yi = Cβ / (1/S²(between+ within) ) yi = Xβi + Zy + ei[ Z code the different subjects = between]
Better to have lot of subjects (of each experimental group) than lot of sessions per subjects !
Take Home message 3Take Home message 3
DecorrelatateDecorrelatate as much as possible the conditionsas much as possible the conditionsAvoid low frequency in the design to oppose Avoid low frequency in the design to oppose conditionsconditionsFactorial designs are quite powerfulFactorial designs are quite powerfulMore subjects is better than more scansMore subjects is better than more scansLong sessions are better than short ones (at least Long sessions are better than short ones (at least sessions that keep your subject awake or alive)sessions that keep your subject awake or alive)

EndEnd

ReferencesReferences

BirnBirn, RM., Cox, RW. , RM., Cox, RW. BandettiniBandettini, PA. (2002) , PA. (2002) Detection versus Detection versus Estimation in EventEstimation in Event--Related fMRI: Choosing the Optimal Related fMRI: Choosing the Optimal Stimulus Timing. Stimulus Timing. NeuroImageNeuroImage 1515, 252, 252--264264Boynton, GM., Engel, SA., Glover, GH., Boynton, GM., Engel, SA., Glover, GH., HeegerHeeger, DJ. (1996) , DJ. (1996) Linear Systems Analysis of Functional Magnetic Resonance Linear Systems Analysis of Functional Magnetic Resonance Imaging in Human V1.Imaging in Human V1. J J NeurosciNeurosci 1616, 4207, 4207--4221 4221 Dale, AM., Buckner, RL. (1997) Dale, AM., Buckner, RL. (1997) Selective averaging of rapidly Selective averaging of rapidly presented individual trials using fMRI. presented individual trials using fMRI. Hum Br Map 5Hum Br Map 5, 329, 329--340 340 FristonFriston, K., Josephs, O., , K., Josephs, O., ZarahnZarahn, E., , E., Henson, R.N. & Dale, A. Henson, R.N. & Dale, A. (1999) Stochastic designs in event(1999) Stochastic designs in event--related fMRI. related fMRI. NeuroImageNeuroImage, , 1010, 607, 607--619619

GrillGrill--SpectorSpector, K., , K., HensomHensom, R., Martin, A. (2003) Repetition and , R., Martin, A. (2003) Repetition and the brain: neural models of stimulusthe brain: neural models of stimulus--specific effects. specific effects. TICS, 10TICS, 10, , 1414--2323Henson R. (2007) Henson R. (2007) Efficient Experimental design for fMRI (pp 193Efficient Experimental design for fMRI (pp 193--210)210), In Statistical Parametric Mapping: The analysis of , In Statistical Parametric Mapping: The analysis of functional brain imaging data, Academic Pressfunctional brain imaging data, Academic PressLiu, TT., Frank, LR., Wong, EC., Buxton, RB. (2001) Liu, TT., Frank, LR., Wong, EC., Buxton, RB. (2001) Detection Detection Power, Estimation Efficiency, and Predictability in EventPower, Estimation Efficiency, and Predictability in Event--Related fMRI. Related fMRI. NeuroImageNeuroImage 13,13, 759759--773773Lund, TE., Madsen, KH., Lund, TE., Madsen, KH., SidarosSidaros, K., , K., LuoLuo, W, W--L., Nichols, T. L., Nichols, T. (2006) Non(2006) Non--white noise in fMRI: Does modelling have an white noise in fMRI: Does modelling have an impact? impact? NeuroImageNeuroImage, 29, 29, 54, 54--6666Savoy, R. (2005) Experimental design in brain activation MRI: Savoy, R. (2005) Experimental design in brain activation MRI: Cautionary tales. Cautionary tales. Br Res Br Res BulBul, 67,, 67, 361361--367367

websiteswebsitesHenson R. Henson R. –– design efficiencydesign efficiency::http://www.mrchttp://www.mrc--cbu.cam.ac.uk/Imaging/Common/fMRIcbu.cam.ac.uk/Imaging/Common/fMRI--efficiency.shtmlefficiency.shtmlPernetPernet C. C. –– general design considerationsgeneral design considerationshttp://http://www.sbirc.ed.ac.uk/cyril/cp_fmri.htmlwww.sbirc.ed.ac.uk/cyril/cp_fmri.htmlConvolutionConvolution: : http://http://mathworld.wolfram.com/Convolution.htmlmathworld.wolfram.com/Convolution.htmlCovariance matrix:Covariance matrix:http://http://en.wikipedia.org/wiki/Covariance_matrixen.wikipedia.org/wiki/Covariance_matrix