Embed Size (px)
Citation preview
▲485The Journal of The South African Institute of Mining and Metallurgy NOVEMBER/DECEMBER 2002
Introduction
In the assessment of the metallurgical balanceand for control around a metallurgical plant itis necessary to have unbiased measurementsof the metal contents of the main input andoutput and output streams and to know theconfidence that can be placed on the results.
The determination of content involvesmeasurement of the dry mass of the processstreams, the taking of accurate, or unbiasedsamples, and accurate analysis in thelaboratory of the samples that are taken. Themeasurement of dry mass is a subject on itsown and involves the maintenance andcalibration of belt mass-meters orweighbridges and procedures for determiningthe moisture content of ore feed and concen-trates. These aspects are not considered in thispresentation. Similarly, the obtaining ofaccurate chemical analyses of the samples isalso a subject on its own and this is also notconsidered.
This paper focuses on the sampling of theslurry feeds, tailings and concentrate from atypical flotation plant and describes:
➤ Work done mainly on platinum metalconcentrators but also on gold plants toobtain unbiased or accurate samples
➤ Statistical techniques that have beenapplied to sampling data to measure the
overall variance of sampling and toquantify the components of variance ofthe primary and secondary sampling,and of analysis that make up the overallvariance. Knowing where the majorvariances are enables one to optimizethe sampling frequency, the number ofsub-samples and assay aliquots that aretaken.
Basic requirements
The samples that are taken must beunbiased or accurate
It is vital that a clear distinction is madebetween the concepts of accuracy andprecision, terms that are very commonlyconfused. Accuracy implies an absence of bias.The meaning of bias is best illustrated by wayof an example. Assume that the gold contentof a sample is 6.00 g/t. This value is notknown but let us suppose that by repeatedanalytical determinations an average result of6.10 (plus/minus 0.02 g/t) is obtained. Thefigures within the brackets are those withintwo standard deviations of the mean. Withmore measurements these limits can bereduced but the mean result will be higherthan the unknown true value because thesample is biased.
The cause of bias in sampling can be froma number of reasons. For example, in flotationplants, samples of pulp feed, concentrate ortailings can often be biased because thesampler only takes part of the process stream.In the sampling of run-of-mine ore biases canoccur because the larger rocks are oftenrelatively barren and the samplers, because oftheir design, tend to miss these larger rocksand the samples are therefore biased high.
Design of primary samplers for slurriesin concentrators and statisticalmethods for measuring components ofvariance in samplingby H.E. Bartlett*
Synopsis
In the operation of some flotation plants treating platinum ores itwas found that there were imbalances between the inputs andoutputs. The inputs and outputs were sampled as slurries and itwas determined that the imbalances arose from biases in thesampling, despite the samplers having been designed according towell-established rules.
The launders feeding the sample cutters, and the sample cuttersthemselves were redesigned using finite element analysis to modelthe flows. A new set of design rules were formulated.
The application of a Components of Variance Analysis, todetermine the variance of primary and secondary sampling and ofanalysis in the lab for a concentrate is presented to illustrate theneed for frequent sampling of process streams.
* Hugh Bartlett Consulting CC, Florida, Gauteng,South Africa
© The South African Institute of Mining andMetallurgy, 2002. SA ISSN 0038–223X/3.00 +0.00. Paper received Feb. 2002; revised paperreceived Jul. 2002.
Design of primary samplers for slurries in concentrators and statistical methods
Biases cannot be eliminated by statistical methods. Theymust be minimized by good design of the samplers.
➤ Having designed accurate sampling systems, statisticaltests are needed to measure the precision of thesampling systems to optimize the number of samplesthat are taken, the frequency and size of the samples,the protocols to be followed for sample reduction andthe number of assays that are needed, within practicalconstraints.
Design of primary samplers for slurries
At a typical concentrator plant, run-of-mine ore is fedthrough a crushing plant and mills or to autogenous mills toproduce an ore feed slurry. It is generally accepted that thebest sample of the head grade is the sample of the ore feedslurry because the ore is well mixed and the particle size isreduced. Sampling of the run-of-mine ore or of a crushedproduct is used in some cases, for example if a gravityconcentrate is removed during milling or if ore from differentsources is to be separately evaluated.
In a typical plant, the slurry is treated by flotation andappropriate regrinds to produce a final concentrate and finaltailings. Numerous control samples would be taken but theonly samples required for metallurgical accounting are thefeed, final concentrate and tailings samples.
For these samples it is required that the samples areaccurate. Therefore, in accordance with sampling theory,every particle in the process stream must have an equalprobability of being included in the sample. This requirementprecludes the use of devices that do not sample the wholeprocess stream. Examples of such devices are popettesamplers that have a plunger used to insert an extractor cupthrough the side of a pipeline into the process stream, orvarious models of pipe samplers which have a fixed pipe orslot to extract a fraction from a process stream. Thesesamplers are cheap and are easy to install in existing plant.Often they give results that are in agreement with the resultsfrom a well-designed cross-stream sampler but on otheroccasions the results do not agree. And it is not possible topredict whether the sampler will be representative in anyparticular situation.
Rules for representative samples with cross-streamcutters
Rules for the design of cross-stream cutters are given byHolmes.1 The headings for these rules are:
➤ The sample cutter must be non-restrictive and self-cleaning , discharge completely each increment withoutany rebounding, overflowing or hang-up in the cutter
➤ The geometry of the cutter opening must be such thatthe cutting time at each point in the stream is equal.For linear-path cutters, the cutter edges (called lips)must be parallel, while for cutters travelling in an arc orcircle (e.g. Vezin samplers) the cutter lips must beradial
➤ No materials other than the sample must be introducedinto the cutter, e.g. dust or slurry must be preventedfrom accumulating in the cutter when in the parkedposition
➤ The cutter should intersect the stream in a plane
normal to the mean trajectory of the stream➤ The cutter must travel through the stream at a uniform
speed. Electric drives are best in this respect➤ The cutter aperture must be not less than three times
the nominal top size, with a minimum size of 10 mmfor slurries
➤ The cutter must have sufficient capacity toaccommodate the increment mass at the maximumflowrate of the stream
➤ For slurries, loss of sample material due to dribblesmust be avoided
➤ The maximum cutter speed should not exceed 0.6 m/s.This rule is taken from Gy2 who conductedexperiments to quantify the extent to which particles ofknown particle size bounce from the cutting edges of ahorizontal cutter, either into or out of, the cutter with ameasured gap and travelling at set speeds. Thesemeasurements do not necessarily apply to slurries.
Application of the rules to samplers for platinummetal concentrators
These rules were applied to the sampler designs for thesampling systems for feeds and tailings at concentrators ofRustenburg Platinum Mines3. The concentrates wereevaluated by weighing and sampling the filter cakes thatwere sent to the smelter. From the sampling and massmeasurement of the inputs and outputs for the concentrators,mass balances were constructed. Over a period of somemonths to allow for time lags and changes in thickenerstocks, there should have been a balance between input andoutput for the various metals. However, at a number ofconcentrators there were consistent imbalances.
After exhaustive investigation into the accuracy of massmeasurement and chemical analysis, it was reasoned that areason for these imbalances was bias in the sampling ofpulps, particularly of the feeds. These pulps have a range ofparticle sizes, with varying densities and grades of platinumand other elements in these different particle sizes and it waspostulated that in the sampling process segregation betweendifferent sizes and densities occurred. The segregation istheoretically not by itself sufficient to cause a sampling biasas long as the sample cutters are correct and there is nosplashing or differential behaviour of particles in theturbulence around the cutter.
The segregation was postulated to occur in two areas:➤ While the cutters were traversing the process stream.
This was investigated by finite element analysis withcutters of old designs where considerable turbulenceoccurred and with redesigned streamlined cutters.
➤ In the launders feeding the cutters. It was observedthat coarse particles, particularly chromite which occursin UG2 ores and which is low in platinum gradeaccumulates as a slow moving layer at the bottom ofthe launders. This was resolved by designing thelaunders to operate with a pulp depth of about 100 mmand having a slope of 8° to obtain a pulp velocity ofmore than 2 m/s to prevent sedimentation of largeparticles.
In addition to segregation, there was also a problem withthe secondary samplers used to reduce the bulk of theprimary sample only took one or two increments. This was
▲
486 NOVEMBER/DECEMBER 2002 The Journal of The South African Institute of Mining and Metallurgy
resolved by installing a hopper with a restrictor nozzlebetween the primary and secondary samplers.
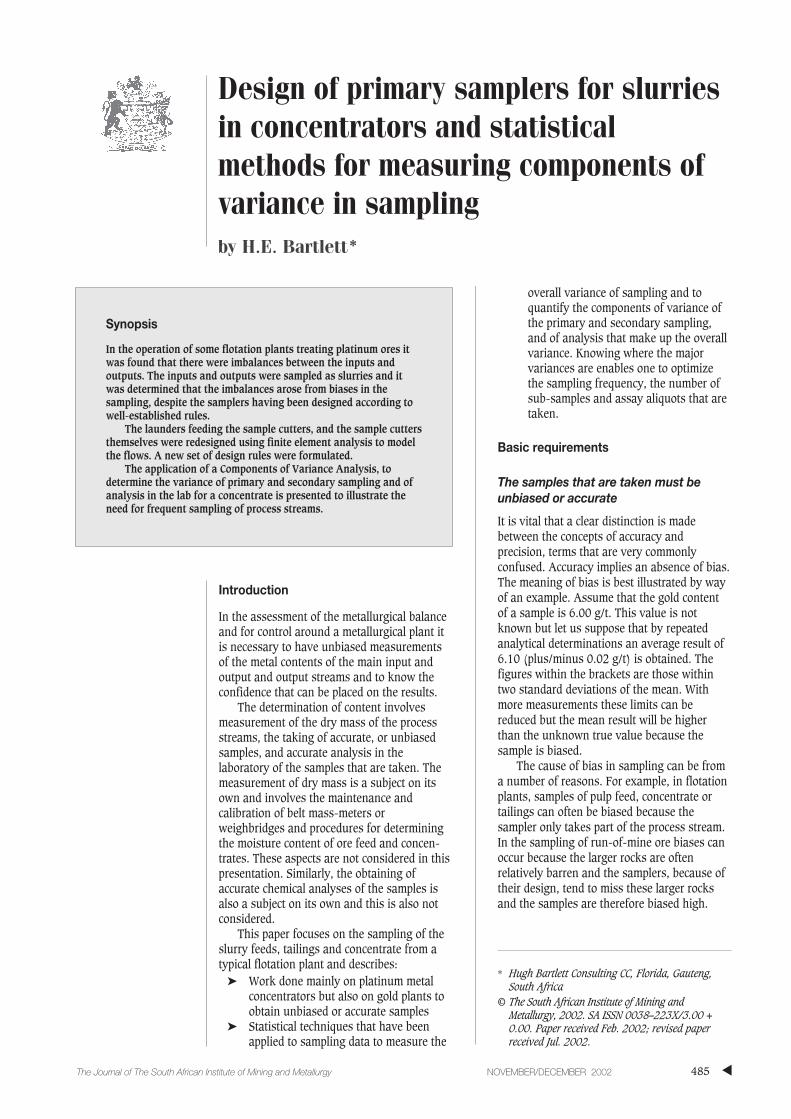
Finite element analysisFigure 1 gives the results of finite element analyses with theexisting and streamlined cutters, at cutter gaps of 10 mm, withpulp velocities of 1 m/sec and cutter speeds of 600 mm/sec.
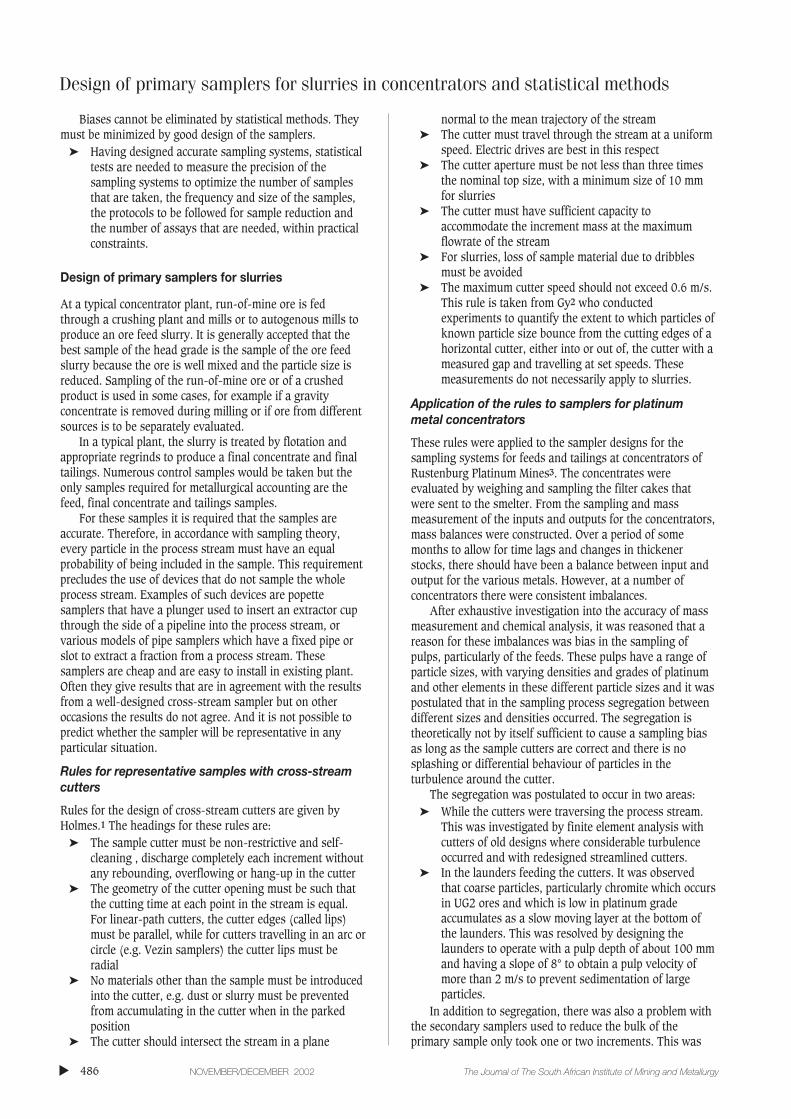
In Figure 2, a photo of the existing cutter traversing apulp stream is compared to the finite element analysis. Ahigh velocity tongue of pulp can be seen entering the cutter.This corresponds to the region of high velocity into the cuttergap that can be seen on the finite element analysis.
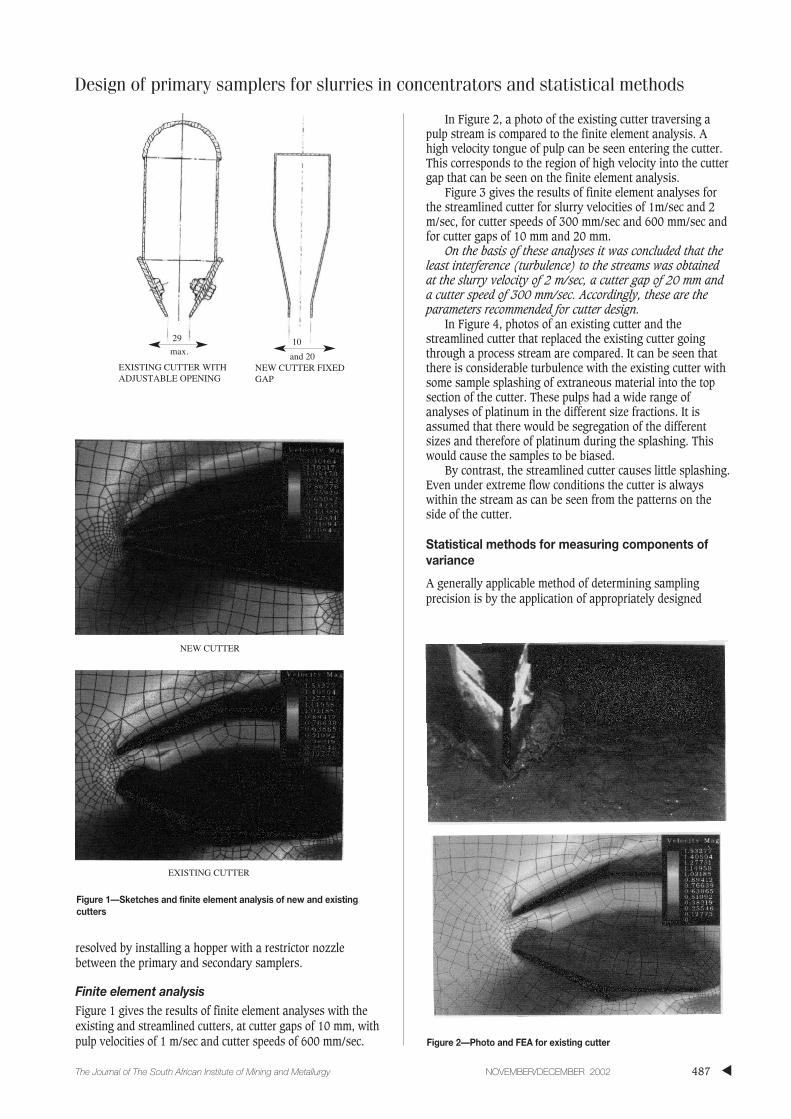
Figure 3 gives the results of finite element analyses forthe streamlined cutter for slurry velocities of 1m/sec and 2m/sec, for cutter speeds of 300 mm/sec and 600 mm/sec andfor cutter gaps of 10 mm and 20 mm.
On the basis of these analyses it was concluded that theleast interference (turbulence) to the streams was obtainedat the slurry velocity of 2 m/sec, a cutter gap of 20 mm anda cutter speed of 300 mm/sec. Accordingly, these are theparameters recommended for cutter design.
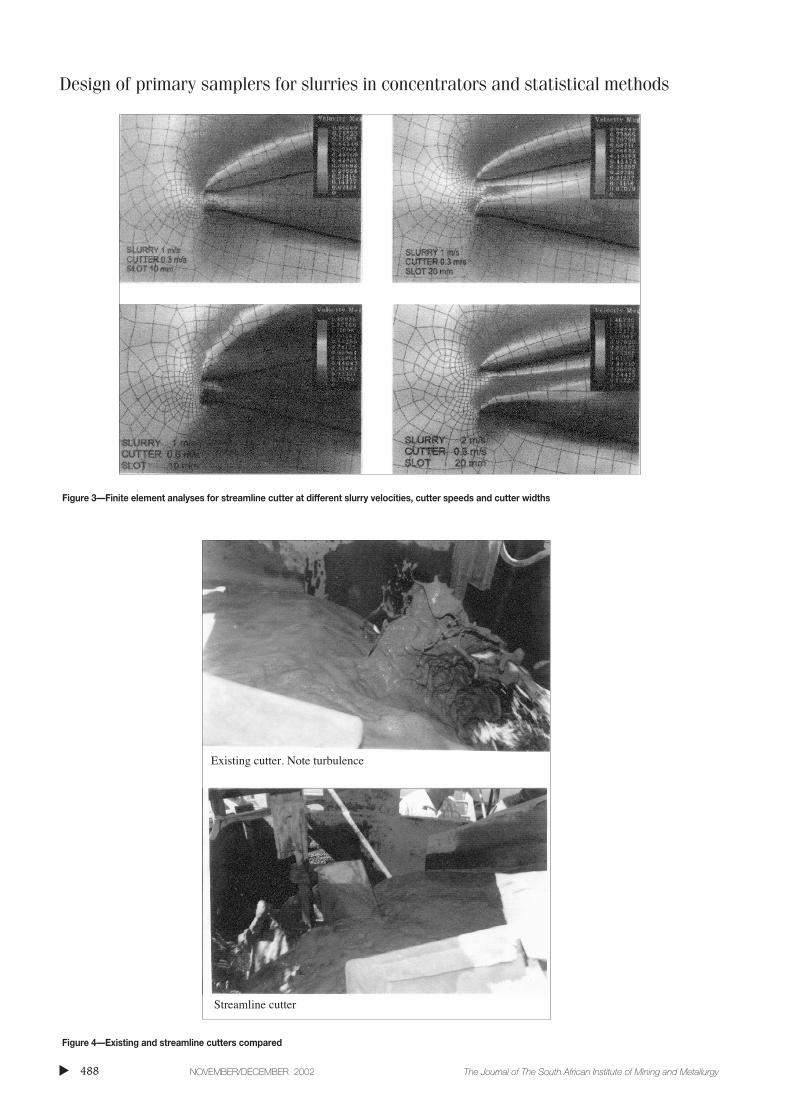
In Figure 4, photos of an existing cutter and thestreamlined cutter that replaced the existing cutter goingthrough a process stream are compared. It can be seen thatthere is considerable turbulence with the existing cutter withsome sample splashing of extraneous material into the topsection of the cutter. These pulps had a wide range ofanalyses of platinum in the different size fractions. It isassumed that there would be segregation of the differentsizes and therefore of platinum during the splashing. Thiswould cause the samples to be biased.
By contrast, the streamlined cutter causes little splashing.Even under extreme flow conditions the cutter is alwayswithin the stream as can be seen from the patterns on theside of the cutter.
Statistical methods for measuring components ofvariance
A generally applicable method of determining samplingprecision is by the application of appropriately designed
Design of primary samplers for slurries in concentrators and statistical methods
▲487The Journal of The South African Institute of Mining and Metallurgy NOVEMBER/DECEMBER 2002
EXISTING CUTTER WITHADJUSTABLE OPENING
NEW CUTTER FIXEDGAP
NEW CUTTER
EXISTING CUTTER
29
max.10
and 20
Figure 1—Sketches and finite element analysis of new and existingcutters
Figure 2—Photo and FEA for existing cutter
Design of primary samplers for slurries in concentrators and statistical methods
▲
488 NOVEMBER/DECEMBER 2002 The Journal of The South African Institute of Mining and Metallurgy
Figure 3—Finite element analyses for streamline cutter at different slurry velocities, cutter speeds and cutter widths
Figure 4—Existing and streamline cutters compared
Existing cutter. Note turbulence
Streamline cutter
statistical experiments to measure the variance withaccurately taken samples. The experimental design would beadapted to the particular sampling situation. For example, forsampling of run-of-mine ore, the design would involvedetermining the variance of the primary and secondarysampling and the effect of reducing the particle size and massof the ore from the primary belt samples down to theanalytical portion submitted to the lab. The methods areapplications of standard procedures for the statistical designof experiments and use standard statistical methods, such asAnalysis of Variance and Components of Variance Analysis4,5.
For all designs the precision of sampling is measured bydetermining the variance associated with each of thesampling stages. Variance is the square of standard deviationand has the property that variances are additive formeasurements that are not correlated.
The components of variance that need to be determinedfor the sampling of a slurry typically would be:
➤ Primary sampling—The variance of primary samplingis determined by taking twin interleaved shiftcomposite samples. The twin interleaved samples aretaken by having one 30-minute composite sample,composed by operating the sample cutter at apredetermined frequency, during a shift. The secondcomposite is taken for the next 30 minutes. The twobuckets collecting the samples are exchanged every 30minutes. It is important to determine the precision ofthis primary sampling, separated from the precisionintroduced by the sub-sampling and analysis.
➤ Secondary sampling stages—Typically, primarysamples are too large to be submitted to the lab andneed to be reduced in mass. Typically, the primarysamples are sub-divided using secondary Vezinsamplers. There is often another stage of samplereduction where the samples from the secondary Vezinsampler on the plant are filtered and dried and thensub-divided using a Carousel divider.
➤ Analytical variance—Analytical variance is measuredby analysis of replicate samples.
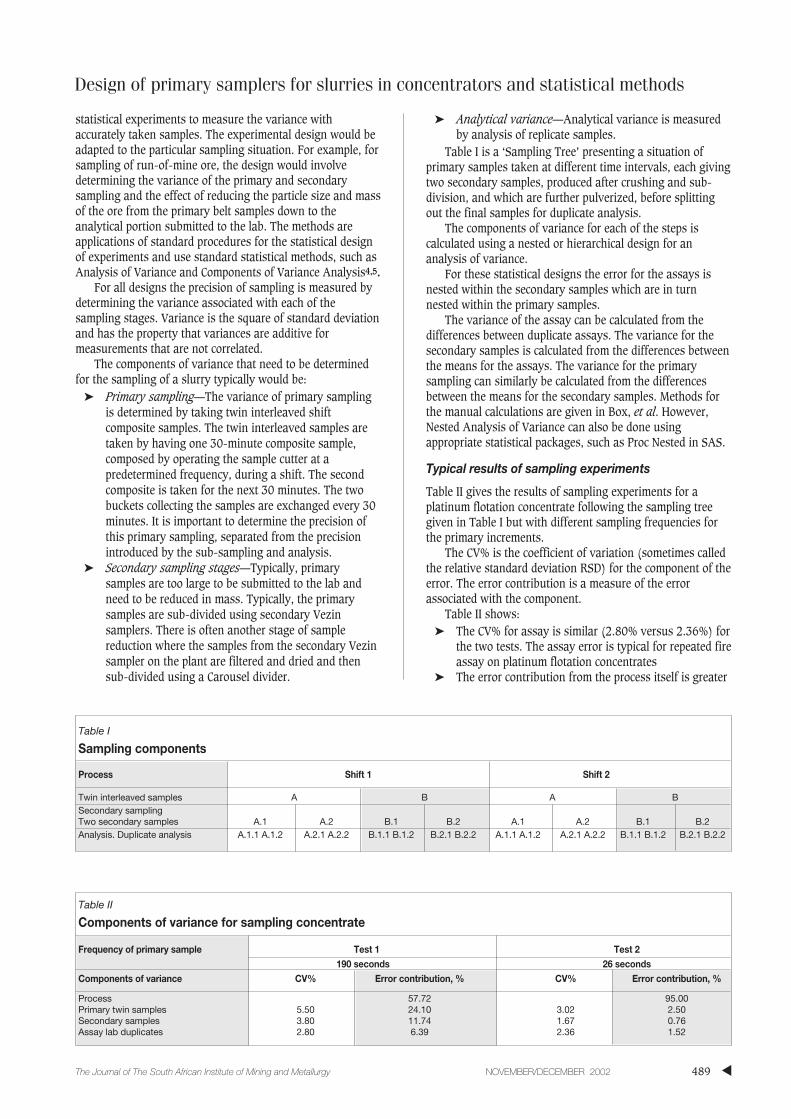
Table I is a ‘Sampling Tree’ presenting a situation ofprimary samples taken at different time intervals, each givingtwo secondary samples, produced after crushing and sub-division, and which are further pulverized, before splittingout the final samples for duplicate analysis.
The components of variance for each of the steps iscalculated using a nested or hierarchical design for ananalysis of variance.
For these statistical designs the error for the assays isnested within the secondary samples which are in turnnested within the primary samples.
The variance of the assay can be calculated from thedifferences between duplicate assays. The variance for thesecondary samples is calculated from the differences betweenthe means for the assays. The variance for the primarysampling can similarly be calculated from the differencesbetween the means for the secondary samples. Methods forthe manual calculations are given in Box, et al. However,Nested Analysis of Variance can also be done usingappropriate statistical packages, such as Proc Nested in SAS.
Typical results of sampling experiments
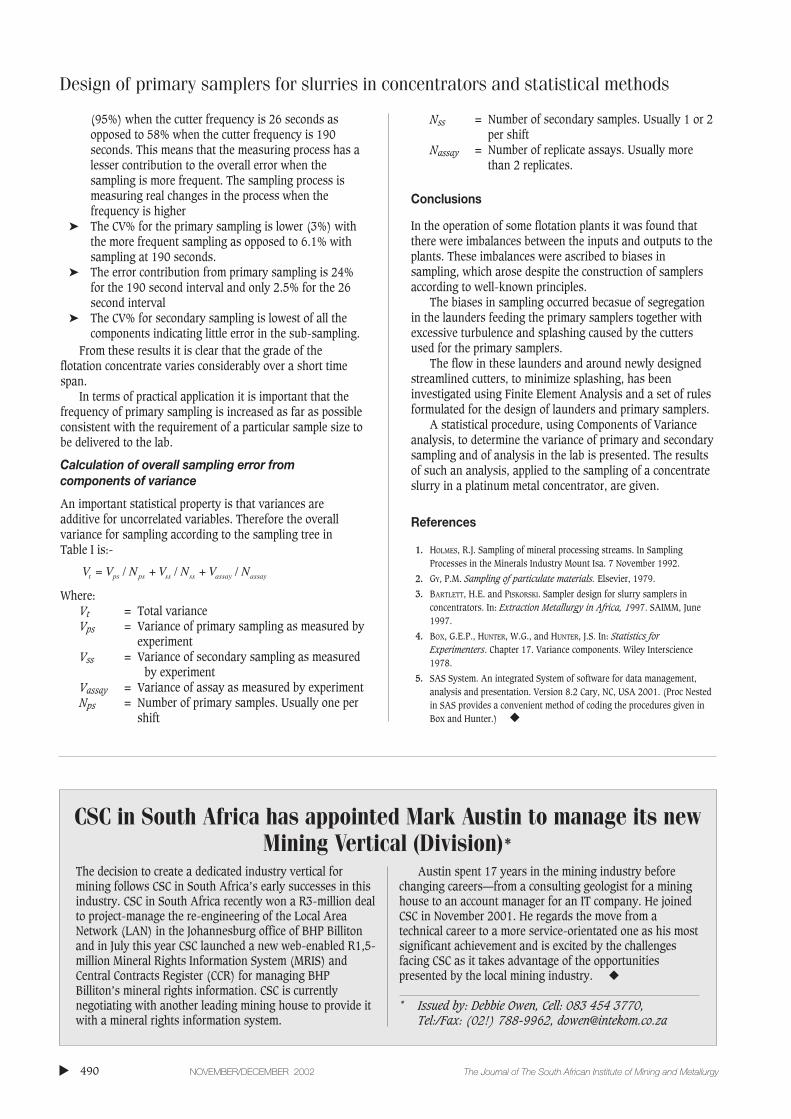
Table II gives the results of sampling experiments for aplatinum flotation concentrate following the sampling treegiven in Table I but with different sampling frequencies forthe primary increments.
The CV% is the coefficient of variation (sometimes calledthe relative standard deviation RSD) for the component of theerror. The error contribution is a measure of the errorassociated with the component.
Table II shows:➤ The CV% for assay is similar (2.80% versus 2.36%) for
the two tests. The assay error is typical for repeated fireassay on platinum flotation concentrates
➤ The error contribution from the process itself is greater
Design of primary samplers for slurries in concentrators and statistical methods
▲489The Journal of The South African Institute of Mining and Metallurgy NOVEMBER/DECEMBER 2002
Table I
Sampling components
Process Shift 1 Shift 2
Twin interleaved samples A B A BSecondary samplingTwo secondary samples A.1 A.2 B.1 B.2 A.1 A.2 B.1 B.2Analysis. Duplicate analysis A.1.1 A.1.2 A.2.1 A.2.2 B.1.1 B.1.2 B.2.1 B.2.2 A.1.1 A.1.2 A.2.1 A.2.2 B.1.1 B.1.2 B.2.1 B.2.2
Table II
Components of variance for sampling concentrate
Frequency of primary sample Test 1 Test 2190 seconds 26 seconds
Components of variance CV% Error contribution, % CV% Error contribution, %
Process 57.72 95.00Primary twin samples 5.50 24.10 3.02 2.50Secondary samples 3.80 11.74 1.67 0.76Assay lab duplicates 2.80 6.39 2.36 1.52
Design of primary samplers for slurries in concentrators and statistical methods
(95%) when the cutter frequency is 26 seconds asopposed to 58% when the cutter frequency is 190seconds. This means that the measuring process has alesser contribution to the overall error when thesampling is more frequent. The sampling process ismeasuring real changes in the process when thefrequency is higher
➤ The CV% for the primary sampling is lower (3%) withthe more frequent sampling as opposed to 6.1% withsampling at 190 seconds.
➤ The error contribution from primary sampling is 24%for the 190 second interval and only 2.5% for the 26second interval
➤ The CV% for secondary sampling is lowest of all thecomponents indicating little error in the sub-sampling.
From these results it is clear that the grade of theflotation concentrate varies considerably over a short timespan.
In terms of practical application it is important that thefrequency of primary sampling is increased as far as possibleconsistent with the requirement of a particular sample size tobe delivered to the lab.
Calculation of overall sampling error fromcomponents of variance
An important statistical property is that variances areadditive for uncorrelated variables. Therefore the overallvariance for sampling according to the sampling tree in Table I is:-
Where:Vt = Total varianceVps = Variance of primary sampling as measured by
experimentVss = Variance of secondary sampling as measured
by experimentVassay = Variance of assay as measured by experimentNps = Number of primary samples. Usually one per
shift
Nss = Number of secondary samples. Usually 1 or 2per shift
Nassay = Number of replicate assays. Usually morethan 2 replicates.
Conclusions
In the operation of some flotation plants it was found thatthere were imbalances between the inputs and outputs to theplants. These imbalances were ascribed to biases insampling, which arose despite the construction of samplersaccording to well-known principles.
The biases in sampling occurred becasue of segregationin the launders feeding the primary samplers together withexcessive turbulence and splashing caused by the cuttersused for the primary samplers.
The flow in these launders and around newly designedstreamlined cutters, to minimize splashing, has beeninvestigated using Finite Element Analysis and a set of rulesformulated for the design of launders and primary samplers.
A statistical procedure, using Components of Varianceanalysis, to determine the variance of primary and secondarysampling and of analysis in the lab is presented. The resultsof such an analysis, applied to the sampling of a concentrateslurry in a platinum metal concentrator, are given.
References
1. HOLMES, R.J. Sampling of mineral processing streams. In SamplingProcesses in the Minerals Industry Mount Isa. 7 November 1992.
2. GY, P.M. Sampling of particulate materials. Elsevier, 1979.
3. BARTLETT, H.E. and PISKORSKI. Sampler design for slurry samplers inconcentrators. In: Extraction Metallurgy in Africa, 1997. SAIMM, June1997.
4. BOX, G.E.P., HUNTER, W.G., and HUNTER, J.S. In: Statistics forExperimenters. Chapter 17. Variance components. Wiley Interscience1978.
5. SAS System. An integrated System of software for data management,analysis and presentation. Version 8.2 Cary, NC, USA 2001. (Proc Nestedin SAS provides a convenient method of coding the procedures given inBox and Hunter.) ◆
V V N V N V Nt ps ps ss ss assay assay= + +/ / /
▲
490 NOVEMBER/DECEMBER 2002 The Journal of The South African Institute of Mining and Metallurgy
The decision to create a dedicated industry vertical formining follows CSC in South Africa’s early successes in thisindustry. CSC in South Africa recently won a R3-million dealto project-manage the re-engineering of the Local AreaNetwork (LAN) in the Johannesburg office of BHP Billitonand in July this year CSC launched a new web-enabled R1,5-million Mineral Rights Information System (MRIS) andCentral Contracts Register (CCR) for managing BHPBilliton’s mineral rights information. CSC is currentlynegotiating with another leading mining house to provide itwith a mineral rights information system.
Austin spent 17 years in the mining industry beforechanging careers—from a consulting geologist for a mininghouse to an account manager for an IT company. He joinedCSC in November 2001. He regards the move from atechnical career to a more service-orientated one as his mostsignificant achievement and is excited by the challengesfacing CSC as it takes advantage of the opportunitiespresented by the local mining industry. ◆
* Issued by: Debbie Owen, Cell: 083 454 3770,Tel:/Fax: (02!) 788-9962, [email protected]
CSC in South Africa has appointed Mark Austin to manage its newMining Vertical (Division)*