Embed Size (px)
Citation preview

16
1⁄41⁄4
Forest Service Manual 7720.04a requires approval by
the regional engineer for designs of all “major and
complex” trail bridges. All FRP bridges are considered
to be complex. Each forest is responsible for its decision
to use FRP materials. The bridge must be designed by a
qualified engineer experienced in the design of trail
bridges and the use of FRP materials. Other jurisdictions
may have different requirements—know the requirements
you need to meet.
Design Specifications for FRP Pedestrian Bridges
By early 2006, no design specifications for FRP pedestrian
bridges had been approved in the United States. E.T.
Techtonics, Inc., has submitted Guide Specifications
for Design of FRP Pedestrian Bridges to the American
Association of State Highway Transportation Officials
(AASHTO) for approval. These guide specifications are
in appendix B. Other professional organizations are
addressing the recommended use and specifications of
FRP materials and products using them, including the
American Society of Civil Engineers (ASCE), the American
Society of Testing and Materials (ASTM), and the FHWA.
Design and material specifications are now available only
through manufacturers of FRP materials. In the absence
of standard material and design specifications, manufac-
turers’ specifications should be followed. There is no
way to validate the information manufacturers supply
Design of FRP Bridgesother than by performance history or testing. Errors may
exist. Different manufacturers use different resin-to-rein-
forcement formulas when constructing FRP members,
so material properties will differ. The designer should
be certain to use the manufacturer’s design manual and
specifications.
Design Concerns
With any new technology, methods must be developed
to predict long-term material properties and to predict
structural behavior based on those properties. This
information is incorporated in specifications for design
parameters, material composition and variance, size
tolerances, and connections. Methods for inspection
and repair also are derived from long-term testing and
observation.
Although specification development and further testing
is in progress, standard FHWA specifications and ASCE
Load Resistance Factor Design (LRFD) procedures won’t
be available for the next 5 to 6 years, as reported by Dan
Witcher of Strongwell and chairman of the Pultrusion
Industry Council’s Committee on LRFD Design Standards.
Two leading manufacturers of FRP structural products,
Strongwell, and Creative Pultrusions, Inc., have specifi-
cations and design safety factors listed on their design
manual CDs. Appendix G has contact information for
these manufacturers.

1⁄4
17
1⁄4
Design of FRP Bridges
The designer should be aware that shear stresses add
more deflection to loaded beams than the classic flexural
deflection. Temperatures above 80 degrees Fahrenheit
reduce allowable stresses and FRP materials may sag or
elongate under sustained loading (time-dependent effects,
called creep). A temperature of 125 degrees Fahrenheit
decreases FRP strength by 30 percent and stiffness by
10 percent (Creative Pultrusions, Inc. 2004; Strongwell
2002). The design needs to consider the service tempera-
ture range. FRP members must be designed for lower
allowable stresses (no more than 40 percent of the
ultimate allowable stress) to minimize creep.
Lateral stability needs to be addressed for different types
of bridge configurations. For spans of 30 feet or more,
side-truss FRP bridges should have outriggers at all panel
points (see figure 8) to provide lateral restraint for the
compression flanges. FRP bridges longer than 60 feet that
are used by pack trains should have a deck-truss design.
That design places the trusses under the deck, increasing
restraint on the compression flanges (see figure 7) and
increasing the frequency characteristics of the bridge,
an important consideration for the live loads generated
by pack trains.
Attention to details can help reduce performance prob-
lems with FRP bridges:
• Avoid hollow tubes with walls less than ¼ inch thick.
• Fill at least 12 inches of each end of hollow tubes with
solid material.
• Provide a drain hole at the bottom of the tube so
trapped water can drain.
Bridges made with FRP materials perform differently
than bridges made with steel, concrete, or wood. Take
these differences into account when designing bridges
with FRP materials.
Other Concerns
FRP bridges have many different design considerations.
Pack trains may produce vibrations that match the fun-
damental frequency of the bridge, which may cause the
bridge to fail. The natural frequency of the bridge and
live loads should be taken into account when ordering
the structure. Because of FRP’s typically low modulus of
elasticity, most designs will be controlled by deflection
limitations and not strength requirements. Although the
criterion for deflection is somewhat arbitrary, AASHTO
guidelines for pedestrian bridges recommend that the
deflection of members (in inches) be less than the length
of the supporting span divided by 500 (L/500). FRP
manufacturers and designers recommend L/400, which
would allow more deflection.

18
1⁄41⁄4
Many types of inspections can be used when rating
the condition of FRP pedestrian bridges. This
section describes nondestructive testing (NDT)
methods, required equipment, and general procedures
for conducting the inspections. The NDT methods are
listed in order of increasing complexity. The last six
require specialized experience or equipment and should
be performed by consultants under contract. This infor-
mation was gathered as part of a study by the Construc-
tion Technology Laboratories for inspection of FRP bridge
decks (National Cooperative Highway Research Program,
Project 10-64, Field Inspection of In-Service FRP Bridge
Decks). Inspections are required at least every 5 years
for Forest Service trail bridges.
Most routine FRP bridge inspections use the two primary
methods of visual and tap testing. More complex methods
should be adopted only if the primary methods are not
adequate to observe or assess unusual conditions. The
cost to inspect a bridge using some of the more complex
methods may be more than the cost of replacing the
bridge.
Visual Testing
Visual testing (VT) is the primary NDT inspection
method adopted by bridge inspectors, and is well suited
for assessing the condition of FRP pedestrian bridges.
The basic tools required are a flashlight, measuring tape,
straightedge, markers, binoculars, magnifying glass,
inspection mirrors, feeler gauges, and a geologist’s pick.
Visual inspection generally detects only surface defects,
such as cracking, scratches, discoloration, wrinkling,
fiber exposure, voids, and blistering.
To help detect defects or cracking that might go unno-
ticed with VT, a static or dynamic live load test can be
done. Loading the bridge with an all-terrain-vehicle or
any live load can help reveal hidden cracks and unde-
sirable movement.
Inspecting and Maintaining FRP BridgesTap Testing
Tap testing is the second most common type of NDT
performed on an FRP bridge. Tap testing is a fast, inex-
pensive, and effective method for inspecting composites
for delamination or debonding. The mechanics of the
test are analogous to “chain drag” delamination surveys
used to inspect reinforced concrete bridge decks, or for
inspections of wood timbers by sounding with a hammer.
The inspector taps the surface with a hammer or coin
and listens for a distinctive change in frequency, indi-
cating a void or delamination. A clear, sharp ringing
indicates a well bonded structure, whereas a dull sound
indicates a delamination or void. Geometric changes
within the structure also can produce a change in fre-
quency that may be interpreted erroneously as a defect.
The inspector must be familiar with the features of the
structure. Tap testing does not require NDT certification.
A bridge engineer or inspector can perform this NDT
method with very little training.
Thermal Testing
Thermography is effective for identifying discontinuities
close to the surface, such as delamination, debonding,
impact damage, moisture, and voids. Thermography uses
an ambient or artificial heat source and a heat-sensing
device, such as an infrared (IR) camera, to measure the
temperature variation within the sample. Heat can be
applied to the surface by natural sunlight or by a pulsed
light source. An IR camera measures the temperature
variation of the object. Subsurface variations such as
discontinuities or voids in the material will cause slight
changes in the wavelength of IR energy that radiates
from the object’s surface. These discontinuities in the
material or emissivity differences can be detected by
IR cameras.

1⁄4
19
1⁄4
Inspecting and Maintaining FRP Bridges
Acoustic Testing
Acoustic testing relies on changes in sound waves to
reveal defects under loading. A structure under certain
load levels produces acoustic sound (known as an
acoustic emission), usually between 20 kilohertz and 1
megahertz. The emission is from the stress waves gen-
erated because of deformation, crack initiation and
growth, crack opening and closure, fiber breakage, or
delamination. The waves come through the solid material
to the surface, where they can be recorded by one or
more sensors or transducers. Acoustic tests involve
listening for emissions from active defects and are very
sensitive when a structure is loaded.
Ultrasonic Testing
Ultrasonic testing uses high-frequency sound in the
range of 20 kilohertz to 25 megahertz to evaluate the
internal condition of the material. This method involves
applying a couplant (typically water, oil, or gel) to the
area to be inspected and scanning the area with a
transducer (or probe) attached to the ultrasonic testing
machine. The couplant serves as a uniform medium
between the surface of the area being scanned and the
transducer to ensure the transmission of sound waves.
Discontinuities that can be detected include delamina-
tion, debonding, resin variations, broken fibers, impact
damage, moisture, cracks, voids, and subsurface defects.
Unlike visual inspection, tap testing, or thermography,
ultrasonic testing requires a high level of expertise to
conduct the test properly and to interpret the data.
Radiography
Radiography uses a penetrating radiation source, such as
X-rays or gamma rays, and radiographic film to capture
images of defects. Differential absorption of the pene-
trating radiation by the object will produce clearly dis-
cernible differences on radiographic film. Radiography
requires access to both sides of the structure, with the
radiation source placed on one side and the film on the
other. Typical discontinuities that can be detected in-
clude some delaminations and some debonds (depending
on their orientation), voids, resin variations, broken
fibers, impact damage, and cracks. Radiography equip-
ment can be hazardous if not handled or stored properly.
This method requires a high level of skill to conduct the
test and to evaluate the images.
Modal Analysis
Modal analysis evaluates a structure’s condition based
on changes in the structure’s dynamic response. The
structure is instrumented with an array of accelerometers
and dynamic load tests are performed to extract modal
parameters with selected frequencies and mode shapes.
This method requires capital investment for sensors and
data acquisition equipment, staff training, and a relatively
high skill level to set up the equipment and to reduce
and interpret the data. This method should be used only
if other techniques are unable to address concerns about
hidden damage and the overall structural performance
of an FRP bridge.
Load Testing
During load testing, a bridge is instrumented with sensors
such as strain gauges, accelerometers, and displacement
sensors before being subjected to a known live load with
a specific loading pattern. The instruments can measure
the response of the structure during load tests and help
determine the bridge’s long-term structural health. Load
testing requires investing in sensors and data acquisition
equipment, and the development of the skills needed to
set up the equipment and to reduce and interpret the

20
1⁄41⁄4
data. This method is used only if other methods are
unable to address concerns about hidden damage and
the overall structural performance of an FRP Bridge.
Comparison of Inspection Methods
Visual testing is the simplest and most commonly used
method. It allows the inspector to rapidly detect gross
imperfections or defects such as cracks, delamination,
or damage from impacts. Visual testing often can help
detect imperfections, such as lack of adhesive, edge
voids, discoloration, and deformation. To a trained in-
spector, visual testing immediately identifies areas
needing more detailed examination. This technique
requires interpretation, so inspectors should be trained
to know what they are looking for and what any varia-
tion might mean to the strength and reliability of the
bridge component. Visual testing cannot:
• Quantify the extent of damage
• Inspect components that are not visible
Tap testing or sounding is another excellent and easy-to-
use method for inspecting FRP materials for delamination.
The inspector listens for any change in sounds while
tapping FRP surfaces. Although tap testing can be used
on pultruded sections, it is less effective in detecting
delaminations or debonds. Most common problems on
FRP bridges can be identified using a combination of tap
testing and visual testing.
Neither tap testing nor visual testing requires specialized
equipment. With some training, both methods are easy
to incorporate into an inspection program. Other testing
methods such as thermal testing, acoustic testing, ultra-
sonic testing, radiography, modal analysis, and load
testing are much more complex, expensive, and time-
consuming.
Inspecting and Maintaining FRP Bridges
Qualifications for Inspectors
The Forest Service inspector and team leader qualifica-
tions in the Forest Service Manual, section 7736.3,
Qualification of Personnel for Road Bridges, should be
used. FRP pedestrian bridges are considered complex
trail bridges. Inspectors also should have additional
qualifications and experience so they can identify the
need for advanced inspection methods, such as acoustic,
ultrasonic, or radiographic testing, and interpret the
test results. Specialized NDT engineers, employed by
consultants, may need to perform these inspections.
Visual Signs of Damage and Defects
Inspectors need to look at the structure as a whole as
well as at specific spots. Particular problems to look for
are discussed below.
Side Trusses
All trusses should be vertical and should not have any
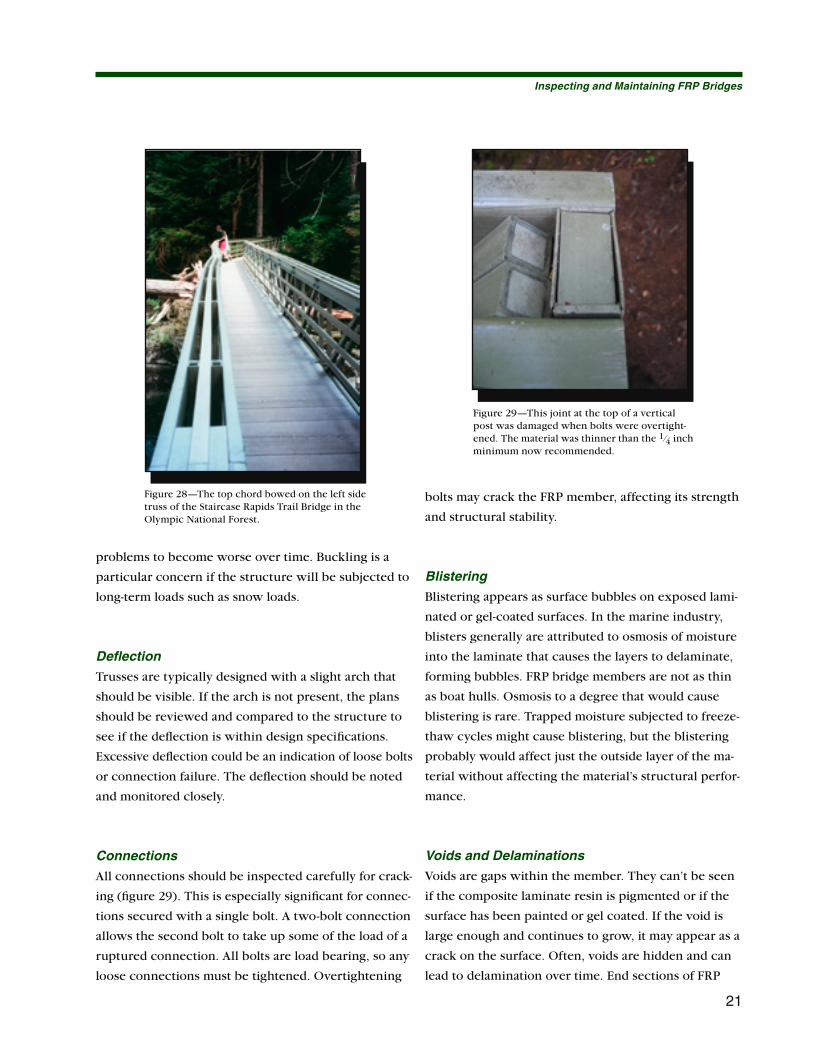
buckling (figure 27) or out-of-plane bowing (figure 28).
Either condition would be an indication of a buckling
failure. The nature of FRP materials will cause such
Figure 27—This FRP bridge in Redwood National Park began to fail when a loaded mule train was halfway across. No one was injured.
1⁄4
21
1⁄4
Inspecting and Maintaining FRP Bridges
problems to become worse over time. Buckling is a
particular concern if the structure will be subjected to
long-term loads such as snow loads.
Deflection
Trusses are typically designed with a slight arch that
should be visible. If the arch is not present, the plans
should be reviewed and compared to the structure to
see if the deflection is within design specifications.
Excessive deflection could be an indication of loose bolts
or connection failure. The deflection should be noted
and monitored closely.
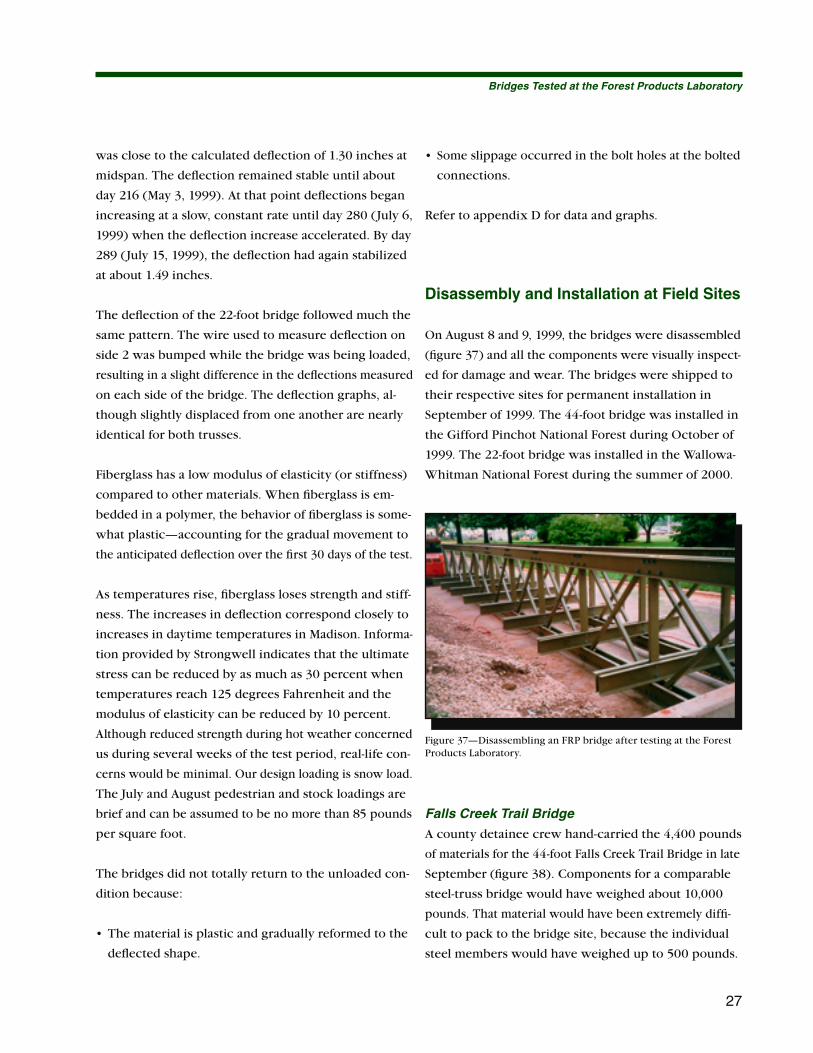
Connections
All connections should be inspected carefully for crack-
ing (figure 29). This is especially significant for connec-
tions secured with a single bolt. A two-bolt connection
allows the second bolt to take up some of the load of a
ruptured connection. All bolts are load bearing, so any
loose connections must be tightened. Overtightening
bolts may crack the FRP member, affecting its strength
and structural stability.
Blistering
Blistering appears as surface bubbles on exposed lami-
nated or gel-coated surfaces. In the marine industry,
blisters generally are attributed to osmosis of moisture
into the laminate that causes the layers to delaminate,
forming bubbles. FRP bridge members are not as thin
as boat hulls. Osmosis to a degree that would cause
blistering is rare. Trapped moisture subjected to freeze-
thaw cycles might cause blistering, but the blistering
probably would affect just the outside layer of the ma-
terial without affecting the material’s structural perfor-
mance.
Voids and Delaminations
Voids are gaps within the member. They can’t be seen
if the composite laminate resin is pigmented or if the
surface has been painted or gel coated. If the void is
large enough and continues to grow, it may appear as a
crack on the surface. Often, voids are hidden and can
lead to delamination over time. End sections of FRP
Figure 28—The top chord bowed on the left side truss of the Staircase Rapids Trail Bridge in the Olympic National Forest.
Figure 29—This joint at the top of a vertical post was damaged when bolts were overtight-ened. The material was thinner than the 1 ⁄4 inch minimum now recommended.

22
1⁄41⁄4
materials can delaminate during construction if con-
nections are overtightened, causing the laminations to
separate (see figure 29).
Discoloration
• Discoloration of the FRP material (figure 30) can be
caused by a number of factors, including:
Inspecting and Maintaining FRP Bridges
Figure 30—The lower section of this member of an FRP bridge is discolored because the coating that protected it from ultraviolet light wore off.
• Chemical reactions, surface deterioration because of
prolonged exposure to ultraviolet light or exposure
to intense heat or fire.
• Crazing and whitening from excessive strain, visible
mainly on clear resins.
• Subsurface voids that can be seen in clear resins be-
cause the material was not completely saturated with
resin during manufacture.
• Moisture that penetrates uncoated exposed resin,
causing freeze-thaw damage called fiber bloom.
• Changes in pigmentation by the manufacturer, although
this is not a structural problem.
Wrinkling
Fabric usually wrinkles because of excessive stretching
or shearing during wet out. Wrinkling is not a struc-
tural problem unless it interferes with the proper sur-
face contact at the connection or prevents the surface
veil from bonding to the internal material.
Fiber Exposure
Fiber may be exposed because of damage during trans-
portation or construction (figure 31). Left unattended,
the fibers would be susceptible to moisture and con-
tamination, leading to fiber bloom.
Figure 31—This truss was damaged by dragging or improper handling.
Cracks
The face of an FRP member may be cracked because
connections were overtightened (see figure 29) or the
members were damaged by overloading (figure 32) or
impact. Cracks caused by impact from vehicles, debris,
or stones typically damage at least one complete layer
of the laminated material.

1⁄4
23
1⁄4
Inspecting and Maintaining FRP Bridges
Figure 32—The bottom chord was damaged by dynamic loads from ATV traffic, by bolts that were overtightened, or by overloading.
Scratches
Surface veils can be abraded from improper handling
during transportation, storage, or construction. Scratches
are shallow grooves on the FRP surfaces. These are
usually just unsightly surface blemishes, but, if severe,
they can develop into full-depth cracks. Scratches (see
figure 31) are judged severe when they penetrate to
the reinforcing fibers, where they can cause structural
damage.
Repair and Maintenance
Damage found during inspections should be repaired.
Evaluate the damage and contact the FRP manufacturer
to discuss proper repair options. Some of the FRP man-
ufacturers have developed repair manuals. Strongwell
has published a Fabrication and Repair Manual that
covers minor nonstructural repairs. The manual covers
maintenance cleaning, sealing cuts and scratches with
resin, splicing cracks, filling chipped flanges with resin,
filling holes, and repairing cracks with glass material
impregnated with resin.
FRP bridges need to be maintained annually to ensure
that they remain in service. Cleaning decks, superstruc-
tures, and substructures helps to ensure a long life.
Resealing the surface veil with resin improves resistance
to ultraviolet radiation and helps prevent moisture from
penetrating and causing fiber bloom. Polyurethane or
epoxy paint can be applied to parts that will be exposed
over the long term. If cracks, scratches, and other abra-
sions are not repaired, the FRP member will be suscep-
tible to fiber bloom and deterioration.

24
1⁄41⁄4
In the fall of 1997, the FRP Trail Bridge Project Team
selected two sites for fiberglass trail bridges. The first
site was in the Gifford Pinchot National Forest north-
east of Portland, OR, 1½ miles from the Lower Falls Creek
Trailhead. A 44-foot-long by 3-foot-wide trail bridge (over-
all length is 45'6") was needed. This area has extreme
snow loads (250 pounds per square foot). This bridge
was funded by the FHWA and designed by their Eastern
Federal Lands Bridge Design Group in consultation with
E.T. Techtonics, Inc.
The second site was in the Wallowa-Whitman National
Forest near Enterprise, OR, at the Peavine Creek Trail-
head. A 22-foot-long by 6-foot-wide pack bridge was
needed to fit abandoned road bridge abutments. The snow
load at this site, 125 pounds per square foot, is more typi-
cal of Forest Service locations. This bridge was funded
by the Forest Service and designed by E.T. Techtonics, Inc.
The fiberglass channel and tube shapes for both bridges
were manufactured by Strongwell and supplied by E.T.
Techtonics, Inc.
Design Overview
The Falls Creek Trail Bridge was designed in accordance
with AASHTO’s Standard Specifications for Highway
Bridges and the Guide Specifications for Design of
Pedestrian Bridges.
Neither specification deals with FRP bridges, because
specifications have not yet been approved—a major
impediment for trail bridge designers. Additional guid-
ance and design techniques were developed from
sources in the FRP composite industry.
The Design Manual for EXTREN Fiberglass Structural
Shapes (2002), developed by Strongwell, is a good source
of information on the individual structural components.
Because the FRP composite sections were patterned
Bridges Tested at the Forest Products Laboratoryafter shapes used in the steel industry, some guidance
and design techniques were developed based on the
Manual of Steel Construction (1989) from the American
Institute of Steel Construction. In addition, E.T. Tech-
tonics, Inc., helped interpret and modify existing infor-
mation, provided test data on the strength of joints and
connections, suggested improvements (such as filling the
ends of hollow members), and reviewed the final design.
Each structural member of the bridge was designed with
respect to standard strength parameters, including allow-
able tension, compression, bending, and shear stresses,
as well as combined stresses due to axial forces and
moments acting together. Primary loads included dead,
snow, and wind loads. The design forces and moments
were the maximum values generated by analysis.
Allowable design stresses were determined by dividing
the ultimate strength of the FRP material (the strength
at which it would break based on the manufacturer’s
data) by the following safety factors:
Design stress Safety factor
Tension and bending . . . . . . .2.5
Compression . . . . . . . . . . . . .3.0
Bearing . . . . . . . . . . . . . . . . .4.0
To ensure that the bridge could support the anticipated
snow loads, the stresses during the test at the Forest
Products Laboratory were limited to no more than 30
percent of the ultimate bending and tensile strength. A
full description of the design process, member stresses,
and equations is in appendix H.
Materials
The structural sections making up the trusses for the two
trail bridges were manufactured by Strongwell, a major

1⁄4
25
1⁄4
Bridges Tested at the Forest Products Laboratory
manufacturer of fiberglass structural shapes, and came
from the company’s EXTREN line. EXTREN products
contain glass fibers embedded in an isophthalic polyester
resin (see glossary in appendix A). Each member also
included a surface veil layer of polyester nonwoven fabric
and resin for protection from ultraviolet exposure and
corrosion. The decking also was a Strongwell product.
It included a 6-millimeter (1⁄4-inch) EXTREN sheet with a
gritted surface on top of DURAGRID I-7000 25-millimeter
(1-inch) grating. The composition of the grating is similar
to that of the structural shapes except that the grating
contains a vinyl ester resin binder. All of the FRP com-
posite sections were manufactured using the pultrusion
process.
Only two other materials were used in the superstructure
of these bridges. The sections were connected with ASTM
A307 galvanized bolts. The superstructures were at-
tached to the foundations by ASTM A36 galvanized-steel
anchor bolt clip angles.
Simulated Design Live Load Testing
Fiber-reinforced composite materials have different
structural properties than conventional construction
materials, such as steel, concrete, and timber. To verify
the design of the 44-foot bridge, and to investigate the
behavior of both the 22- and 44-foot bridges under actual
use conditions, we tested both bridges under harsh
environmental conditions while they were subjected to
their full design loadings.
After the FHWA completed the design of the 44-foot
bridge in the spring of 1998, materials for both bridges
(figure 33) were shipped to the Forest Products Labora-
tory in Madison, WI, for full-scale testing. Weather
conditions in Madison are severe, ranging from –30 to
100 degrees Fahrenheit. Humidity is relatively high,
averaging about 65 percent.
The materials (figure 34) for the 22-foot bridge weighed
about 1,700 pounds. The materials for the 44-foot bridge
weighed about 4,400 pounds. A five-person crew (two
representatives from E.T. Techtonics, Inc., two engineers
from the FHWA, and one engineer from the Forest
Service) began constructing the 22-foot bridge on an FPL
parking lot at about 2 in the afternoon. Three hours later,
the bridge was completed. Construction of the 44-foot
bridge began at about 8 the next morning and the con-
struction was completed by early afternoon. A small
forklift set both bridges onto 10-foot-long concrete traffic
barriers, which served as bearing supports.
Figure 33—Two FRP bridges—one 22 feet long (left) and the other 44 feet long (right)—were tested at the Forest Products Laboratory in Madison, WI.
Figure 34—The materials for an FRP bridge after delivery to the Forest Products Laboratory.

26
1⁄41⁄4
The bridges were installed in a back parking lot and load-
ed to their full design loading (250 pounds per square
foot for the 44-foot bridge and 125 pounds per square
foot for the 22-foot bridge). Plywood boxes constructed
on each bridge deck and filled with landscaping rock
provided the load. Rock was 30 inches deep on the deck
of the 44-foot bridge and 15 inches deep on the deck of
the 22-foot bridge.
Deflection gauges (figure 35) were placed at the second
panel point (4/9ths of the span) and at middle of the span
of both trusses on the 44-foot bridge. Refer to appendix
Bridges Tested at the Forest Products Laboratory
Figure 35—The typical setup of a deflection gauge used to test bridges.
D for a drawing showing the location of the deflection
and strain gauges. Because the bridge has nine 5-foot
panels, the midspan deflection gauge is in the middle
of the center panel. The 22-foot bridge has four 5-foot,
6-inch panels so the deflection gauges were placed at
the center panel point of both trusses.
Deflection measurements were taken immediately after
loading and at several intervals during the first day. Read-
ings were taken daily at first, then weekly and monthly
after movement stabilized. Deflection measurement
continued for 7 days after the test loads were removed.
Neither of the bridges completely returned to the origi-
nal, unloaded deflection.
Figure 36—This tube cracked when bolts were overtightened on one of the bridges being tested at the Forest Products Laboratory.
Bridge deflections were monitored from October 1998
until August 1999. Refer to appendix D for data and
graphs. The bridges performed well under load. Actual
deflections closely matched the design deflections. When
the bridges were disassembled, they had only minor
problems.
One hole in a two-bolt connection between hollow
members elongated and cracked on the 22-foot bridge
(figure 36). The elongation was caused by slightly mis-
matched holes in the connecting members. Bolt holes
need to be very closely aligned when members are
fabricated. During testing, only one bolt was engaged
initially. That hole elongated and began to fail. When
the hole had elongated enough so that the second bolt
became engaged, the connection held, preventing
complete failure. The member was replaced with an
end-filled (solid) member with precisely drilled holes
before the bridge was placed at its final location.
Analysis of Test Data
The deflection of the 44-foot bridge increased gradually
at a decreasing rate for the first 30 days of loading, before
stabilizing at a deflection of about 1.25 inches at midspan
and 0.90 inch at the second panel point. This deflection
1⁄4
27
1⁄4
Bridges Tested at the Forest Products Laboratory
Figure 37—Disassembling an FRP bridge after testing at the Forest Products Laboratory.
was close to the calculated deflection of 1.30 inches at
midspan. The deflection remained stable until about
day 216 (May 3, 1999). At that point deflections began
increasing at a slow, constant rate until day 280 (July 6,
1999) when the deflection increase accelerated. By day
289 (July 15, 1999), the deflection had again stabilized
at about 1.49 inches.
The deflection of the 22-foot bridge followed much the
same pattern. The wire used to measure deflection on
side 2 was bumped while the bridge was being loaded,
resulting in a slight difference in the deflections measured
on each side of the bridge. The deflection graphs, al-
though slightly displaced from one another are nearly
identical for both trusses.
Fiberglass has a low modulus of elasticity (or stiffness)
compared to other materials. When fiberglass is em-
bedded in a polymer, the behavior of fiberglass is some-
what plastic—accounting for the gradual movement to
the anticipated deflection over the first 30 days of the test.
As temperatures rise, fiberglass loses strength and stiff-
ness. The increases in deflection correspond closely to
increases in daytime temperatures in Madison. Informa-
tion provided by Strongwell indicates that the ultimate
stress can be reduced by as much as 30 percent when
temperatures reach 125 degrees Fahrenheit and the
modulus of elasticity can be reduced by 10 percent.
Although reduced strength during hot weather concerned
us during several weeks of the test period, real-life con-
cerns would be minimal. Our design loading is snow load.
The July and August pedestrian and stock loadings are
brief and can be assumed to be no more than 85 pounds
per square foot.
The bridges did not totally return to the unloaded con-
dition because:
• The material is plastic and gradually reformed to the
deflected shape.
• Some slippage occurred in the bolt holes at the bolted
connections.
Refer to appendix D for data and graphs.
Disassembly and Installation at Field Sites
On August 8 and 9, 1999, the bridges were disassembled
(figure 37) and all the components were visually inspect-
ed for damage and wear. The bridges were shipped to
their respective sites for permanent installation in
September of 1999. The 44-foot bridge was installed in
the Gifford Pinchot National Forest during October of
1999. The 22-foot bridge was installed in the Wallowa-
Whitman National Forest during the summer of 2000.
Falls Creek Trail Bridge
A county detainee crew hand-carried the 4,400 pounds
of materials for the 44-foot Falls Creek Trail Bridge in late
September (figure 38). Components for a comparable
steel-truss bridge would have weighed about 10,000
pounds. That material would have been extremely diffi-
cult to pack to the bridge site, because the individual
steel members would have weighed up to 500 pounds.

28
1⁄41⁄4
Bridges Tested at the Forest Products Laboratory
Figure 38—Installing one of the tested FRP bridges at Falls Creek in the Gifford Pinchot National Forest.
Figure 39—The Falls Creek Trail Bridge provides access to this waterfall.
The heaviest fiberglass members weighed 180 pounds.
Even though these members were 45 feet long, they were
flexible enough that they could be bent around tight
corners of the trail.
The concrete abutments were
cast during the first week of
October 1999. An eight-person
crew began installing the
bridge the following week.
Installation was completed
shortly after noon of the
second day. The bridge spans
a very steep, sharply incised,
intermittent channel about 1⁄4 mile from a very popular
scenic falls (figure 39). The
Forest Service estimates peak
use of this trail to be as high
as 300 persons per day.
Peavine Creek Trail Bridge
The 22-foot-long bridge was installed on the former site
of a road bridge. The bridge was designed to be placed
directly on the existing abutments. The site was acces-
sible by a truck that delivered the materials and a small
backhoe.
The bridge was built on the approach roadway and lifted
in one piece onto the abutments. The bridge was con-
structed by the Wallowa-Whitman National Forest road
crew and set in place in 1 day. Because the road crew
was not familiar with FRP materials, they overtorqued
the bolts, cracking several of the hollow tubes. These
cracks, which have been monitored since installation,
have closed slightly because of bearing compression of
the FRP materials.
Reinspection
The bridges were reinspected during the fall of 2004.
The cracks at the connections had not changed signifi-
cantly and the members had a chalky appearance be-
cause the surface veil had developed fiber bloom. The
Falls Creek Bridge had developed cracks at top post and
at floor beam tie-down connections. Additional informa-
tion is in the Case Studies and Failures section.
![Evaluation of external FRP-concrete bond in repaired concrete bridge … · 2017-08-26 · [15]. CFRP strengthening increases the axial, flexural, shear, and impact resistance of](https://img.dokumen.tips/doc/110x75/5f8899759919501d6b6eafe7/evaluation-of-external-frp-concrete-bond-in-repaired-concrete-bridge-2017-08-26.jpg)


![Repair of bridges using Fiber Reinforcement Polymers (FRP) ria.pdf · PDF fileTable 7: Rebar Stresses from Static Tests (MPa) [46] ... Fiber reinforced polymer composites (FRP), developed](https://img.dokumen.tips/doc/110x75/5ab34df47f8b9ac66c8e30d4/repair-of-bridges-using-fiber-reinforcement-polymers-frp-7-rebar-stresses-from.jpg)


![LIFE CYCLE ASSESSMENT OF FRP SEISMIC … · LIFE CYCLE ASSESSMENT OF FRP SEISMIC RETROFITTING . ... 2,200 bridges that are in need of seismic retrofitting ... retrofit technique [2]](https://img.dokumen.tips/doc/110x75/5af03a847f8b9ad0618dca9e/life-cycle-assessment-of-frp-seismic-cycle-assessment-of-frp-seismic-retrofitting.jpg)


